uptake of gce a-level subjects in england 2001- · pdf fileuptake of gce a-level subjects in...
TRANSCRIPT

Uptake of GCE A-level subjects in England
2001-2005 Statistics Report Series No. 3
Carmen L. Vidal Rodeiro
September 2006
Research Division – Statistics Group Assessment Research and Development
Cambridge Assessment 1 Regent Street, Cambridge, CB2 1GG

Cambridge Assessment is the brand name of the University of Cambridge Local Examinations Syndicate, a department of the University of Cambridge.
Cambridge Assessment is a not-for-profit organisation.

This statistical report investigates the uptake of A-levels in England from 2001 to 2005. The
candidates used in these analyses were extracted from the 2001-2005 16+/18+ databases.
These databases contain all the candidates who had their eighteenth birthday in the relevant
school year. The databases are compiled for the DfES from data supplied by all the awarding
bodies in England.
More detailed analysis and interpretation of the figures presented here can be found in Bell et
al. (2003, 2005, 2006).
Table 1: Number of A-level results in 2001-2005 (% of A-level entry)
Number of A-levels 2001 2002 2003 2004 2005
1 9 10 10 11 10 2 12 14 15 16 15 3 43 48 49 47 48 4 33 25 24 24 24
5+ 3 3 2 2 2 No. of candidates 213,362 202,745 209,508 210,149 215,813
Table 2: Number of A-level results, excluding General Studies, in 2001-2005 (% of A-level entry)
Number of A-levels 2001 2002 2003 2004 2005
1 9 11 11 12 11 2 18 17 18 18 18 3 66 64 64 62 64 4 7 7 7 7 7
5+ * * * * * No. of candidates 210,652 201,345 208,468 208,964 214,734
* less than 0.5
In the following tables the uptake of some of the commonest A-levels is presented.
Candidates were classified by sex (Table 3) and by prior attainment at GCSE level (Table 4).
The GCSE grades for the candidates were converted into scores (A* - 8, A - 7, B - 6, etc.) and
a mean GCSE score was computed and used to divide the candidates into three attainment
groups: low, medium and high.

Table 3: Uptake of individual subjects by sex in 2001-2005 (% of A-level entry)
All
Subject 2001 2002 2003 2004 2005 General Studies 41 28 27 26 26 English Literature 21 21 20 20 20 Mathematics 24 19 19 20 18 Biology 19 19 18 18 18 History 15 17 16 16 18 Geography 15 15 14 14 12 Chemistry 16 14 13 14 14 Business Studies 14 13 13 12 12 Physics 13 13 12 10 10 Psychology 10 13 14 16 18 Sociology 9 9 9 10 10 Media/Film/TV. Stds. 6 8 8 8 8 Sport/P.E. Stds. 7 7 8 8 8 ICT 3 7 7 6 6 English Language 6 7 6 6 8 English 7 6 6 6 6 French 7 6 6 6 6 D & T design 2 6 - - - Economics 7 6 6 6 6 Art & Des. – Fine Art - 6 6 6 6 Drama 4 6 6 6 6 Art & Design 9 5 4 4 4 Com.Stds/Computing 5 4 4 2 2 Religious Stds. 3 4 5 6 6 Law 3 4 4 4 6 Politics 3 3 4 4 4 German 4 3 3 2 2 Music 2 3 3 2 2 Spanish 2 2 2 2 2 Maths (Further) 2 2 2 2 2 D&T Product Design - - 6 6 6
- not applicable

Male Subject 2001 2002 2003 2004 2005 General Studies 42 29 28 28 28 English Literature 13 14 12 12 14 Mathematics 32 26 26 26 26 Biology 16 16 15 14 16 History 15 17 17 18 18 Geography 18 17 17 16 14 Chemistry 18 15 14 14 16 Business Studies 16 17 16 16 14 Physics 22 21 20 18 18 Psychology 5 6 7 8 10 Sociology 4 4 4 4 4 Media/Film/TV. Stds. 5 7 7 8 8 Sport/P.E. Stds. 9 10 11 10 10 ICT 4 10 10 8 8 English Language 4 5 5 4 6 English 4 4 4 4 4 French 4 4 4 4 4 D & T design 4 9 - - - Economics 10 9 9 8 8 Art & Des. – Fine Art - 4 4 4 4 Drama 2 3 4 4 4 Art & Design 7 3 3 2 2 Com.Stds/Computing 9 8 7 6 4 Religious Stds. 2 2 3 4 4 Law 3 3 4 4 4 Politics 4 4 5 4 6 German 2 2 2 2 2 Music 2 2 2 2 2 Spanish 1 1 1 2 2 Maths (Further) 4 3 3 4 4 D&T Product Design - - 9 8 9
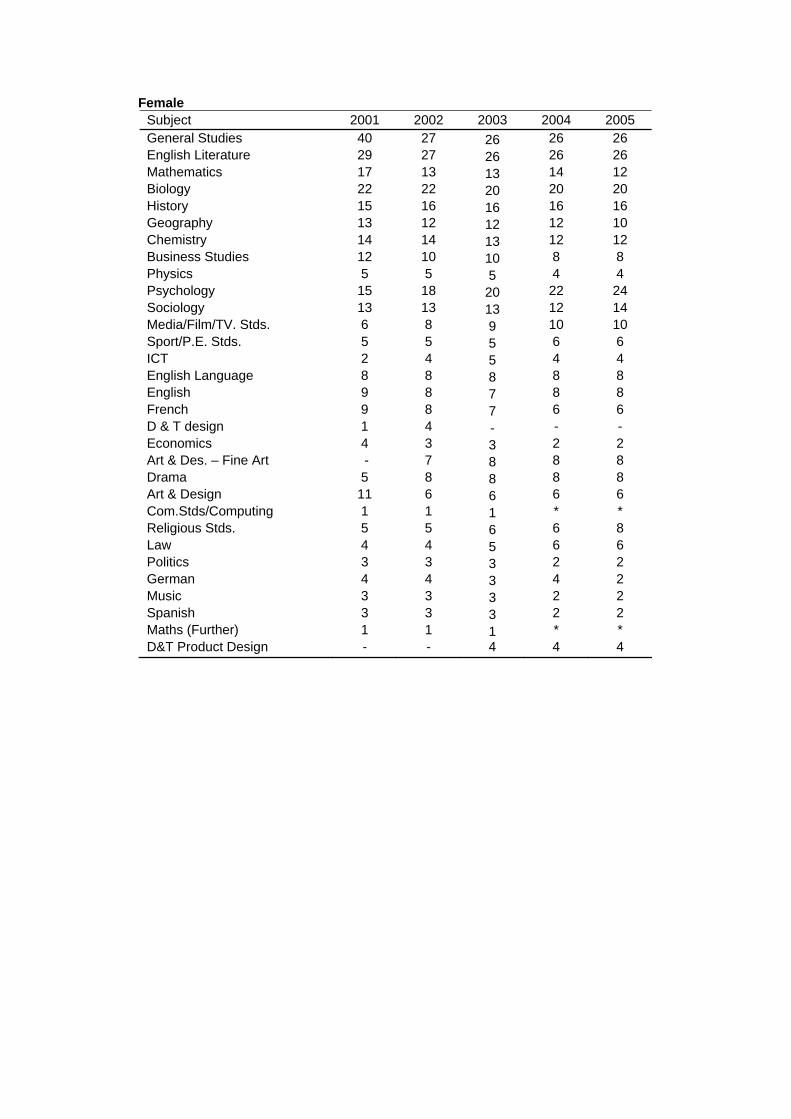
Female Subject 2001 2002 2003 2004 2005 General Studies 40 27 26 26 26 English Literature 29 27 26 26 26 Mathematics 17 13 13 14 12 Biology 22 22 20 20 20 History 15 16 16 16 16 Geography 13 12 12 12 10 Chemistry 14 14 13 12 12 Business Studies 12 10 10 8 8 Physics 5 5 5 4 4 Psychology 15 18 20 22 24 Sociology 13 13 13 12 14 Media/Film/TV. Stds. 6 8 9 10 10 Sport/P.E. Stds. 5 5 5 6 6 ICT 2 4 5 4 4 English Language 8 8 8 8 8 English 9 8 7 8 8 French 9 8 7 6 6 D & T design 1 4 - - - Economics 4 3 3 2 2 Art & Des. – Fine Art - 7 8 8 8 Drama 5 8 8 8 8 Art & Design 11 6 6 6 6 Com.Stds/Computing 1 1 1 * * Religious Stds. 5 5 6 6 8 Law 4 4 5 6 6 Politics 3 3 3 2 2 German 4 4 3 4 2 Music 3 3 3 2 2 Spanish 3 3 3 2 2 Maths (Further) 1 1 1 * * D&T Product Design - - 4 4 4

Table 4: Uptake of individual subjects by attainment in 2001-2005 (% of A-level entry)
Low
Subject 2001 2002 2003 2004 2005 General studies 34 21 19 18 18 Mathematics 8 4 4 6 6 English Literature 16 17 15 14 16 Biology 9 7 6 6 6 Chemistry 5 3 3 4 4 History 10 11 10 10 10 Geography 11 11 10 8 8 Business Studies 17 15 15 14 12 Physics 5 4 3 4 4 Psychology 11 12 13 14 14 Art & Design - Fine Art 10 6 6 6 6 Sociology 13 12 12 12 12 French 2 1 1 2 2 Sport/P.E. Stds. 10 10 11 10 10 Economics 4 3 2 2 2 English 8 7 6 6 6 English Language 7 7 7 6 8 Media/Film/TV. Stds. 9 12 13 14 14 Com.Stds/Computing 6 4 3 2 2 Drama 4 7 7 6 6 German 1 1 1 2 2 Religious Stds. 3 3 4 4 4 Politics 2 2 2 2 2 Law 5 5 5 6 6 ICT 4 9 10 8 8 D & T design 3 8 - - - Maths (Further) * * * * * Music 1 2 1 2 2 Spanish 1 1 1 * * Art & Design - 5 5 4 4 D&T Product Design - - 8 8 8

Medium Subject 2001 2002 2003 2004 2005 General studies 43 29 28 28 28 Mathematics 21 13 13 12 12 English Literature 23 21 20 20 20 Biology 19 17 16 14 14 Chemistry 12 10 8 8 8 History 16 16 16 16 16 Geography 18 16 16 14 14 Business Studies 17 16 16 14 14 Physics 11 10 9 8 8 Psychology 12 16 18 20 22 Art & Design - Fine Art 10 6 7 6 6 Sociology 10 11 11 12 12 French 6 4 4 4 4 Sport/P.E. Stds. 8 9 10 10 10 Economics 7 5 5 4 4 English 7 7 7 6 8 English Language 7 8 8 8 8 Media/Film/TV. Stds. 6 9 9 10 10 Com.Stds/Computing 6 5 4 4 2 Drama 4 7 7 6 8 German 3 2 2 2 2 Religious Stds. 4 4 5 6 6 Politics 3 3 3 4 4 Law 3 4 5 6 6 ICT 3 8 9 8 6 D & T design 3 7 - - - Maths (Further) 1 1 1 * * Music 2 2 2 2 2 Spanish 2 2 1 2 2 Art & Design - 5 5 4 4 D&T Product Design - - 8 8 8

High Subject 2001 2002 2003 2004 2005 General studies 47 33 32 32 32 Mathematics 42 35 34 34 32 English Literature 26 25 24 22 24 Biology 30 30 29 28 30 Chemistry 30 27 25 26 26 History 21 22 22 22 22 Geography 17 17 16 16 16 Business Studies 8 9 8 8 8 Physics 22 21 19 18 16 Psychology 7 11 13 14 14 Art & Design - Fine Art 8 5 6 6 6 Sociology 4 5 5 6 6 French 14 12 11 10 10 Sport/P.E. Stds. 3 4 5 4 6 Economics 9 9 9 8 8 English 5 6 5 4 4 English Language 4 5 5 6 6 Media/Film/TV. Stds. 2 3 4 4 4 Com.Stds/Computing 3 3 3 2 2 Drama 3 5 5 6 6 German 6 5 5 4 4 Religious Stds. 4 5 5 6 6 Politics 4 4 5 4 6 Law 2 2 3 4 4 ICT 1 4 4 4 2 D & T design 1 4 - - - Maths (Further) 6 4 4 4 4 Music 4 3 4 4 4 Spanish 4 4 4 4 4 Art & Design - 4 4 4 4 D&T Product Design - - 4 4 4

Table 5: Most common combinations of at least three A-level subjects in 2001-2005 excluding General Studies (% of candidates with at least three A-levels)
2001
Combination % Cum % Biology Chemistry Mathematics 4.2 4.2 Chemistry Physics Mathematics 2.9 7.1 Biology Chemistry Physics 1.6 8.7 Biology Chemistry Geography 1.0 9.7 Physics Mathematics Computing 0.9 10.6 Chemistry Physics Mathematics Further Mathematics 0.9 11.5 Physics Mathematics Geography 0.6 12.1 Biology Chemistry Physics Mathematics 0.6 12.7 History Sociology English Literature 0.6 13.3 History English Literature French 0.6 13.9 2002
Combination % Cum % Biology Chemistry Mathematics 2.7 2.7 Chemistry Physics Mathematics 1.9 4.6 Biology Chemistry Physics 1.4 6.1 Biology Chemistry Geography 1.0 7.1 Physics Mathematics Computing 0.7 7.9 Biology Chemistry Physics Mathematics 0.7 8.6 Biology Chemistry Psychology 0.7 9.3 Chemistry Physics Mathematics Further Mathematics 0.7 10.0 History Sociology English Literature 0.5 10.5 Physics Mathematics D&T Product Design 0.5 11.0
2003 Combination % Cum %
Biology Chemistry Mathematics 2.7 2.7 Chemistry Physics Mathematics 1.8 4.5 Biology Chemistry Physics 1.3 5.8 Biology Chemistry Geography 0.9 6.7 Biology Chemistry Psychology 0.8 7.5 Physics Mathematics Computing 0.7 8.2 Biology Chemistry Physics Mathematics 0.6 8.8 Chemistry Physics Mathematics Further Mathematics 0.6 9.4 History Psychology English Literature 0.6 9.9 Physics Mathematics Geography 0.5 10.4

2004 Combination % Cum %
Biology Chemistry Mathematics 2.9 2.9 Chemistry Physics Mathematics 1.6 4.5 Biology Chemistry Physics 1.1 5.6 Biology Chemistry Geography 0.9 6.5 Biology Chemistry Psychology 0.9 7.4 Biology Chemistry Physics Mathematics 0.8 8.2 Chemistry Physics Mathematics Further Mathematics 0.7 8.9 History Psychology English Literature 0.5 9.4 History Religious Studies English Literature 0.5 9.9 Physics Mathematics D&T Product Design 0.5 10.4
2005
Combination % Cum % Biology Chemistry Mathematics 2.9 2.9 Chemistry Physics Mathematics 1.5 4.4 Biology Chemistry Physics 1.1 5.6 Biology Chemistry Psychology 1.0 6.5 Biology Chemistry Geography 0.8 7.4 Biology Chemistry Physics Mathematics 0.7 8.1 Chemistry Physics Mathematics Further Mathematics 0.7 8.8 History Psychology English Literature 0.7 9.4 History Religious Studies English Literature 0.5 10.0 History Politics English Literature 0.5 10.5

In the following tables (Tables 6 and 7), the uptake of five subject areas at A-level and AS-
level is presented. The subjects were grouped into five areas: Science/Mathematics, English,
Languages, Social Science/Humanities and Arts. Grouping subjects is not a straightforward
task and the allocation of subject areas is always debatable. Details of the subject areas can
be found in the Appendix. This analysis is restricted to those candidates with at least three A-
level results. The number of low attaining candidates is reduced because they were less likely
to have taken three A-levels.
Table 6: Uptake of subject areas at A-level by sex and attainment (% of candidates with at least three A-levels) 2001 Subject Area F M Low Medium High All Science/Maths 46 65 38 51 67 55 English 51 26 44 41 35 39 Languages 18 10 6 11 22 15 Social Science/Humanities 70 67 77 74 60 69 Arts 33 26 40 32 21 29 Number of students 90,904 77,303 38,614 59,171 67,167 168,207 2002 Subject Area F M Low Medium High All Science/Maths 46 65 37 48 65 55 English 51 28 47 43 36 40 Languages 16 10 4 8 20 13 Social Science/Humanities 70 66 75 73 63 68 Arts 32 25 41 33 21 29 Number of students 79,411 65,607 21,928 50,567 70,377 145,018 2003 Subject Area F M Low Medium High All Science/Maths 48 67 42 51 66 57 English 50 26 46 42 35 39 Languages 15 9 4 7 19 13 Social Science/Humanities 71 67 74 74 64 69 Arts 33 26 42 35 23 30 Number of students 85,939 70,700 24,793 54,114 75,338 156,639
2004 Subject Area F M Low Medium High All Science/Maths 47 65 41 48 65 55 English 49 27 44 42 35 39 Languages 15 9 6 7 19 12 Social Science/Humanities 72 68 73 75 65 70 Arts 34 28 42 37 23 31 Number of students 84,802 69,037 25,281 54,670 73,888 153,839

2005 Subject Area F M Low Medium High All Science/Maths 46 64 40 48 64 54 English 51 28 45 43 36 40 Languages 14 9 5 7 18 12 Social Science/Humanities 73 68 74 75 66 71 Arts 34 28 42 37 24 31 Number of students 89,145 72,534 26,740 58,027 76,912 161,679
Table 7: Uptake of subject areas at A-level and AS-level by sex and attainment (% of candidates with at least three A-levels) 2001 Subject Area F M Low Medium High All Science/Maths 48 66 40 53 68 56 English 51 26 44 42 36 39 Languages 19 11 6 11 24 15 Social Science/Humanities 71 68 78 75 62 70 Arts 33 26 41 33 22 30 Number of students 90,904 77,303 38,614 59,171 67,167 168,207 2002 Subject Area F M Low Medium High All Science/Maths 56 74 47 56 67 64 English 58 32 51 49 43 46 Languages 23 14 6 13 28 19 Social Science/Humanities 78 74 81 80 72 76 Arts 37 30 45 38 27 34 Number of students 79,411 65,607 21,928 50,567 70,377 145,018 2003 Subject Area F M Low Medium High All Science/Maths 58 76 50 61 74 66 English 57 31 42 47 42 45 Languages 22 14 6 12 27 18 Social Science/Humanities 79 74 81 81 73 77 Arts 39 31 46 40 28 35 Number of students 85,939 70,700 24,793 54,114 75,338 156,639
2004 Subject Area F M Low Medium High All Science/Maths 55 73 62 63 66 63 English 55 30 43 43 42 43 Languages 19 11 13 15 21 15 Social Science/Humanities 79 75 77 76 77 77 Arts 41 36 36 40 40 39 Number of students 84,802 69,037 25,281 54,670 73,888 153,839

2005 Subject Area F M Low Medium High All Science/Maths 53 71 61 62 62 61 English 56 31 44 45 44 44 Languages 18 11 14 15 16 15 Social Science/Humanities 80 75 78 78 78 78 Arts 42 36 39 39 39 39 Number of students 89,145 72,534 26,740 58,027 76,912 161,679
For the purpose of these analyses, subjects were also grouped in three different domains
Science and Mathematics, Arts and Languages, Social Science and Humanities (Bell et al.
(2005)). Candidates who entered subjects at A-level or AS-level in only one domain have
been classified as specialists, and candidates that entered for two of the domains have been
classified as partly-mixed. The uptake of these domains is presented in Tables 8 and 9.
Table 8: Uptake of combinations of A-level subjects by sex and attainment in 2001-2005 (% of candidates with at least three A-levels – General Studies not included) 2001 Sci-Mat Arts SocHum Female Male Low Medium High All
Yes - - 16 25 11 14 29 20 - Yes - 6 2 6 5 3 5 - - Yes 28 19 28 26 20 23
Specialist 50 46 45 45 52 48 Yes Yes - 5 5 4 5 6 5 Yes - Yes 23 31 22 27 29 27
- Yes Yes 17 12 22 17 9 14 Partly mixed 45 48 48 49 44 46
Yes Yes Yes 4 6 6 6 4 5
2002 Sci-Mat Arts SocHum Female Male Low Medium High All
Yes - - 15 24 10 13 26 19 - Yes - 6 2 7 5 3 4 - - Yes 28 18 26 26 21 23
Specialist 49 44 43 44 50 46 Yes Yes - 7 7 7 7 7 7 Yes - Yes 24 32 23 26 30 28
- Yes Yes 14 10 19 15 8 12 Partly mixed 45 49 49 48 45 47
Yes Yes Yes 5 6 7 7 4 6

2003
Sci-Mat Arts SocHum Female Male Low Medium High All Yes - - 14 23 9 11 25 18
- Yes - 7 2 8 6 3 5 - - Yes 28 18 26 26 21 23
Specialist 49 43 43 43 49 46 Yes Yes - 7 7 7 7 7 7 Yes - Yes 24 32 23 26 30 28
- Yes Yes 15 10 19 16 8 13 Partly mixed 46 49 49 49 45 48
Yes Yes Yes 5 7 7 7 5 6
2004 Sci-Mat Arts SocHum Female Male Low Medium High All
Yes - - 13 21 9 11 23 17 - Yes - 7 3 9 6 3 5 - - Yes 28 19 27 27 21 24
Specialist 48 43 45 44 47 46 Yes Yes - 6 7 7 7 7 7 Yes - Yes 24 32 21 25 31 27
- Yes Yes 16 11 21 18 9 14 Partly mixed 46 50 49 50 47 48
Yes Yes Yes 5 7 6 7 5 6
2005 Sci-Mat Arts SocHum Female Male Low Medium High All
Yes - - 12 21 9 11 23 16 - Yes - 8 3 9 6 3 5 - - Yes 28 20 28 27 22 25
Specialist 48 44 46 44 48 46 Yes Yes - 6 7 7 7 7 7 Yes - Yes 23 31 20 24 30 27
- Yes Yes 16 12 21 18 9 14 Partly mixed 45 50 48 49 46 48
Yes Yes Yes 5 6 6 7 5 6

Table 9: Uptake of combinations of A-level and AS-level subjects by sex and attainment in 2001-2005 (% of candidates with at least three A-levels – General Studies not included) 2001 Sci-Mat Arts SocHum Female Male Low Medium High All
Yes - - 15 23 11 14 28 19 - Yes - 6 2 6 5 3 4 - - Yes 26 17 21 17 9 22
Specialist 47 42 38 36 40 45 Yes Yes - 6 6 5 5 5 6 Yes - Yes 24 33 25 28 30 28
- Yes Yes 17 12 21 17 9 14 Partly mixed 47 51 51 51 45 48
Yes Yes Yes 5 7 7 6 4 6
2002 Sci-Mat Arts SocHum Female Male Low Medium High All
Yes - - 9 16 8 10 18 13 - Yes - 4 1 5 3 2 3 - - Yes 21 12 18 18 14 16
Specialist 34 29 31 31 34 32 Yes Yes - 7 8 8 7 7 8 Yes - Yes 30 39 28 33 40 34
- Yes Yes 17 10 18 15 9 14 Partly mixed 54 57 54 55 56 56
Yes Yes Yes 11 13 13 14 10 12 2003
Sci-Mat Arts SocHum Female Male Low Medium High All Yes - - 7 15 8 9 17 12
- Yes - 5 2 5 3 2 3 - - Yes 21 12 19 18 15 17
Specialist 33 29 32 30 34 32 Yes Yes - 7 8 8 8 7 8 Yes - Yes 29 38 27 32 39 33
- Yes Yes 17 11 19 16 9 14 Partly mixed 53 57 54 56 55 55
Yes Yes Yes 12 14 13 14 10 13

2004 Sci-Mat Arts SocHum Female Male Low Medium High All
Yes - - 8 14 10 10 12 11 - Yes - 5 2 4 4 3 3 - - Yes 21 12 17 17 17 17
Specialist 34 28 32 31 32 31 Yes Yes - 7 8 8 8 7 7 Yes - Yes 29 37 32 33 35 33
- Yes Yes 18 12 16 16 14 15 Partly mixed 54 57 56 57 56 55
Yes Yes Yes 12 14 13 13 12 13
2005 Sci-Mat Arts SocHum Female Male Low Medium High All
Yes - - 8 14 11 11 10 11 - Yes - 5 2 4 3 3 3 - - Yes 19 13 18 17 18 18
Specialist 32 29 33 31 31 32 Yes Yes - 7 8 7 7 7 7 Yes - Yes 28 36 32 32 32 32
- Yes Yes 19 13 16 16 17 16 Partly mixed 54 57 55 55 56 55
Yes Yes Yes 12 14 12 13 13 12
The University of Cambridge identified some A-levels that provide a less effective preparation
for their courses (http://www.cam.ac.uk/admissions/undergraduate/requirements/). To be a
realistic applicant, a student will normally need to be offering two traditional academic
subjects (i.e. two subjects not on the list displayed in Table 10).
Table 10: Less effective preparation (LEP) A-level subjects for the University of Cambridge
• Accounting • Art and Design • Business Studies • Communication Studies • Dance • Design and Technology • Drama/Theatre Studies • Film Studies • Home Economics • Information and Communication
Technology
• Leisure Studies • Media Studies • Music Technology • Performance Studies • Performing Arts • Photography • Physical Education • Sports Studies • Travel and Tourism • Health and Social Care

In the following, we investigate the number of these A-levels taken by candidates with three or
more A-level results over period 2001-2005. The data is presented by sex (Table 11) and by
prior attainment (Table 12). More information about the uptake of these subjects can be found
in Bell et al. (2006).
Table 11: Number of less effective preparation A-levels by sex (% of candidates with at least three A-levels)
Number of LEP
studies Year Male Female All
0 2001 49 55 52 1 35 33 34 2 14 10 12
3+ 2 1 2 0 2002 45 51 48 1 35 34 35 2 16 13 14
3+ 3 2 3 0 2003 45 50 48 1 35 34 35 2 16 13 15
3+ 4 2 3 0 2004 46 50 48 1 35 34 35 2 16 13 14
3+ 4 3 3 0 2005 47 50 49 1 34 34 34 2 15 13 14
3+ 3 3 3
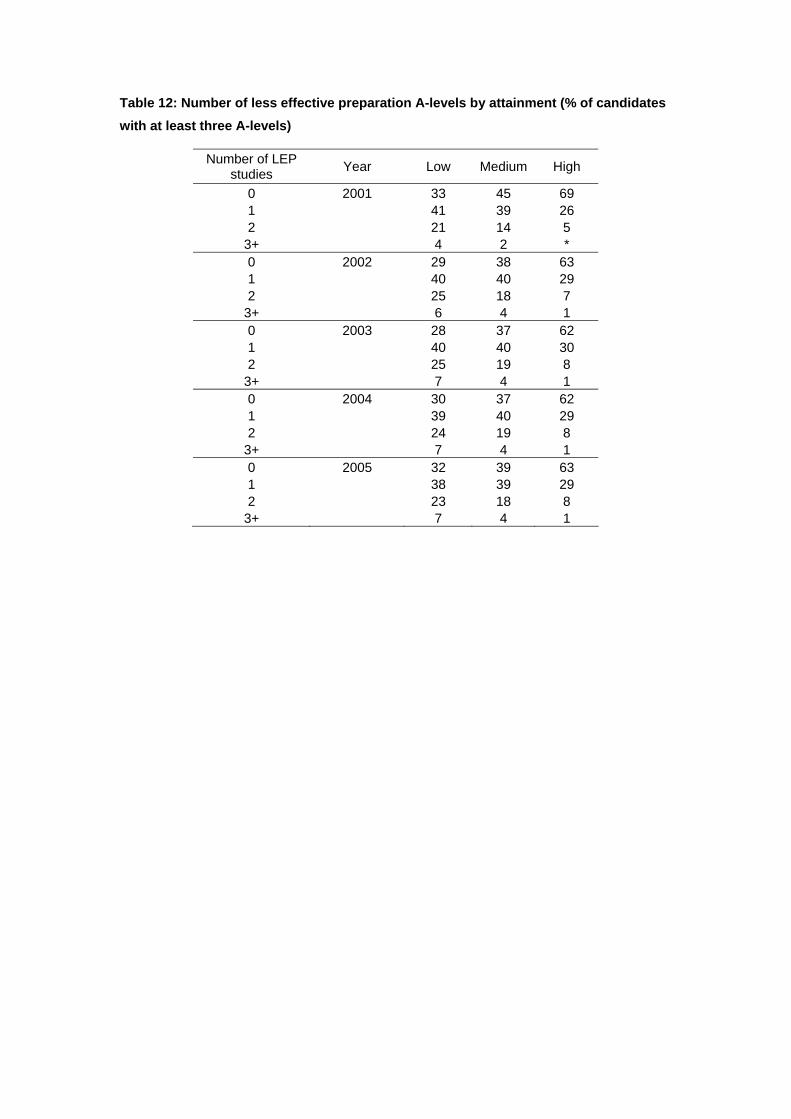
Table 12: Number of less effective preparation A-levels by attainment (% of candidates with at least three A-levels)
Number of LEP studies Year Low Medium High
0 2001 33 45 69 1 41 39 26 2 21 14 5
3+ 4 2 * 0 2002 29 38 63 1 40 40 29 2 25 18 7
3+ 6 4 1 0 2003 28 37 62 1 40 40 30 2 25 19 8
3+ 7 4 1 0 2004 30 37 62 1 39 40 29 2 24 19 8
3+ 7 4 1 0 2005 32 39 63 1 38 39 29 2 23 18 8
3+ 7 4 1

References Bell J.F., Malacova E. and Shannon M. (2003) The changing pattern of A-level/AS uptake in
England. Paper presented at the British Educational Research Association Annual
Conference, Edinburgh.
Bell J.F., Malacova E. and Shannon M. (2005) The changing pattern of A-level/AS uptake in
England. The Curriculum Journal, 16(3): 391-400.
Bell J.F., Malacova E., Vidal Rodeiro C.L. and Shannon M. (2006) A-level Uptake: “crunchier
subjects” and the “cracker effect”. Research Matters (in press).

Appendix – Subject Classifications Science/Maths Social Science/Humanities LEAP code Subject Title LEAP code Subject Title 1010A Biology 3210D Bus. Studs:Single 1030A Biology: Human 3230D Bus.Stds&Economics 1050A Biology: Social 3310D Home Economics 1110A Chemistry 3330D HE: Child Devt 1210A Physics 3390D HE: Home & Family 1310A Sci: Single Award 3910F Geography 1730A Sci: Electronics 4010G History 1750A Sci: Environmental 4410H Economics 1770A Science: Geology 4430H Economics&Business 1830A Psychology JMB/NEA 4610H Religious Studies 2030A Science: Other 4730H Archaeology 2210B Mathematics 4770H Law 2230B Mathematics (Pure) 4790H Logic / Philosophy 2240B Maths (Decision) 4830H Politics 2250B Mathematics(Appld) 4850H Psychology 2260B Mathematics (Statistics) 4890H Sociology 2510B Statistics 6510K Ancient History 2610C Com.Stds/Computing 6530K Class.Civilisation 2650C Information Tech 7410N Accounting/Finance 7810P General Studies 7830P Critical Thinking English LEAP code Subject Title 5010I English Arts 5030I English Language LEAP code Subject Title 5110I English Literature 3510E Art & Design 5210I Drama 3550E Art & Des(Graphcs) 5310I Communication Stds 3570E Art & Des(Photo.) 5330I Expressive Arts 3650E Art & Des(Textles) 3670E Art & Des(3D Stds) 3680E Art&Des(Crit.Stds) Languages 3690E Art&Des - Fine Art LEAP code Subject Title 3810E Art 5650K French 3830E History Of Art 5670K German 5350I Media/Film/TV Stds 5690K Italian 5360I Film Studies 5710K Modern Greek 5370I Theatre Studies 5730K Portuguese 7010L Music 5750K Spanish 7020L Music: Practical 6030K Modern Hebrew 7210M Sport/P.E. Studies 6050K Panjabi 7230M Dance 6070K Polish 7570N Photography 6090K Russian 6110K Turkish 6130K Urdu 6310K Other Languages 6550K Greek 6610K Latin 6650K Other Class. Langs