upps e a economia das favelas - centro de políticas sociais · upp effects on small business in...
TRANSCRIPT

UPPs e a Economia das Favelas
Marcelo Neri
Centro de Políticas Sociais
Fundação Getulio Vargas

0.00
0.50
1.00
1.50
2.00
2.50
4 7
10
13
16
19
22
25
28
31
34
37
40
43
46
49
52
55
58
61
64
67
70
73
76
79
Aglomerado Subnormal Não Especial
Age Structure
Favela is the place of Youth
SouceCPS/FGV processando os microdados da PNAD/IBGE
Youth Potential and Problems:Violence, Prisons, Drugs & Car Crashes

0- 7.927.92- 17.76617.766- 31.86531.865- 61.18761.187- 100
Guaratiba
Rocinha
Centro
Botafogo
Cidade de Deus
Fonte: CPS/IBRE/FGVa partirdos microdados Censodemográficode2000/IBGE
Taxa de Moradores em Aglomerados SubnormaisRegiões Admnis trativas - Rio de J aneiro
MaréComplexo do Alemão
J acarézinho
%
Population Share % Living in FavelasRio Neighborhoods

Idade
Fonte: CPS/FGV a partir dos microdados do Censo das Favelas
0
0,5
1
1,5
2
2,5
4 8 12 16 20 24 28 32 36 40 44 48 52 56 60 64 68 72 76 80 84
Rocinha Complexo do Alemão Manguinhos
Rocinha = Young Favela (or Rocinha = Youth2 = Rio-1
Fonte: CPS/FGV processando os microdados do Censo das Comunidades / Gov. Estado RJ
Age Structure in Main Rio Favelas
Rocinha Alemão
Youth %
16 to 33 years39,77% 32,75%

Rocinha Alemão
Work and Income Opportunities
At least Good 27,82% 8,19%
Excellent 1,88% 0,74%
WORK OPPORTUNITIES - QUALITY PERCEPTION
Fonte: CPS/FGV processando os microdados do Censo das Comunidades / Gov. Estado RJ
Rocinha X Complexo do Alemão ComparissonThe two biggest favelas in Rio. The before UPP Lessons:1) Alemão is Rio’s poorest administrative region. Rocinha is
richer and located in a richer area – best picture of Rio asa broken city (cidade partida) – but housing conditions are worst in Rocinha
2) Access to the State (security, public services, health, education etc) is worst in Rocinha. Lowest schoolattainment and profficiency in Rio. Private sector bias
3) Income and Job opportunities are much better in Rocinha.
4) Expectations and hope for State intervention were alsosmaller in Rocinha

Fonte: CPS/IBRE/FGV a partir dos microdados do Censo Demográfico/IBGE 2000
4.12 - 4.764.76 - 5.735.73 - 6.826.82 - 7.827.82 - 10.14
E d u c a ão M é d ia p o r S u b d i s t r i t o - M u n i c íp i o d o R i o d e J an e ir o
Mean Years of Schooling by Neighborhoods

SP - A Cidade Cercada

Rocinha Favela and Gávea an upscaleneighborhood in Rio, during the day...
.. And at night: favela more iluminated than luxury appartments during
Rio - A Cidade Partida

UPP IMPACTS: Electricity Effect
According to Light eletricity company:
• Before UPP 66% of energy supply was lost (didn’tknow were it went) and from the 34% remaining50% was not paid.
• Overall before UPP – 83% economic loss for Light
• After UPP this number went down to 15%
• Investment after UPP in infrastructure to supply andmonitor supply and also initiatives of trash recyclingprizes to lower energy bills

UPP EFFECTS on Small BusinessIn 2012 according to UPPs local sales entrepreneurs
(food items (groceries), construcion materials, etc)
• 23,4% increased flow of clients in their own business
• 34,1% perceived increased flow of clients in the UPP
Good but better for outsiders?
22,1% of micro entrepreneurs increased their flow of clients
against 33,8% for small entrepreneurs
Bigger businesses are doing better?Source: IBPS/ACRJ
Fonte: CPS/FGV a partir dos microdados da PME/IBGE
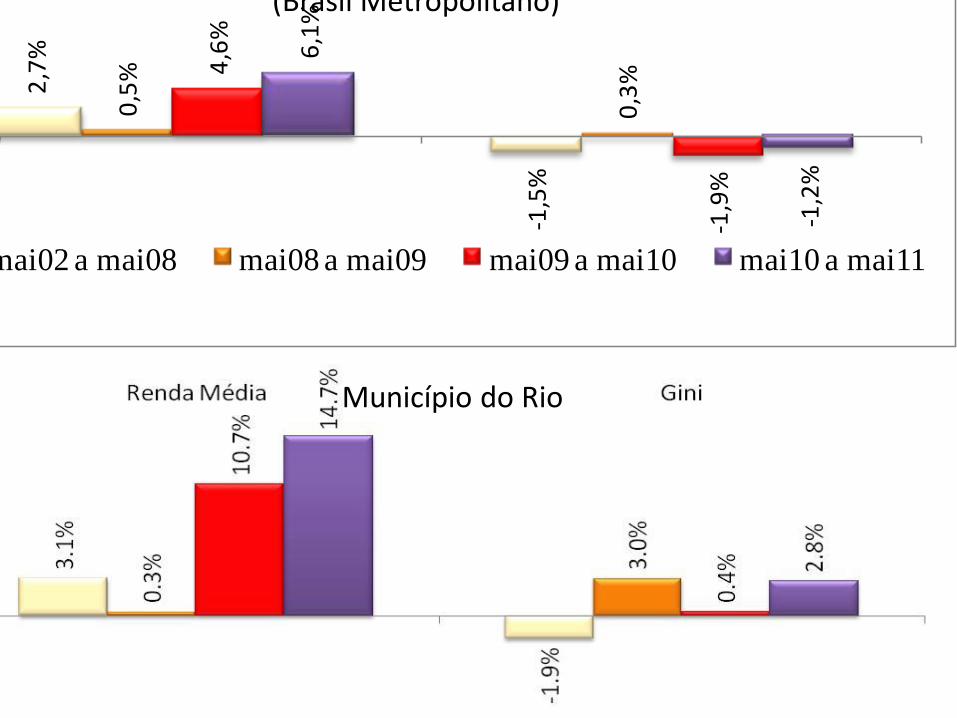
2,7
%
-1,5
%
0,5
%
0,3
%4,6
%
-1,9
%
6,1
%
-1,2
%
Renda Média Desigualdade (Gini)
mai02 a mai08 mai08 a mai09 mai09 a mai10 mai10 a mai11
www.fgv.br/cps/brics
Dinâmica Recente - Efeito-Olímpico?
(Brasil Metropolitano)
Município do Rio
Metro cities

g3 = (Treatment After Intervention – Treatment Before Intervention ) –(Control After Intervention – Control Before Intervention );
Methodology Diference in Diference
As variáveis utilizadas como controle das regressões são: Sexo, Cor, Idade, Educação, Migração (Nativo, Migrante), Unidades da Federação (27 UFs) Densidade Demográfica (Rural, Urbano e Metropolitano), Ano (2001 e 2009). Nesse caso, avaliaremos os impactos em indivíduoscom iguais características quanto ao sexo, raça, idade, educação e etc
Y = g0 + g1*dT + g2*dA + (D-D)*dT*dA + other controls
Diference in Diference

Effect on Rents (De Soto Effect) • Comparing houses with identical observable
characteristics (materials, number of rooms, bathrooms, access to public services etc):
• Favela Effect: Rents are 25% lower in favelas than the rest of the city
• UPP Effect: Rents rose 7,5% more after UPP in favelas (in general 2007 to 2009)
• Later Claudio Fristack showed similar effects onthe value of appartments in the surroundings ofUPPs. And also a sharp fall in crime statistics

Impacts of UPPs on Math Scores
Quarters After Police OcupationWork with Pedro Butelli e Rafael Borges

Quarters After Police Ocupation
Impacts of UPPs on Languaje Scores

Quarters After Police Ocupation
Impacts of UPPs on Science Scores

My UPP – Morro dos Cabritos

Few on going Lessons• Territorial not a general equilibrium approach
• Giving the State and Markets to Favelas
• Fear of white remotions (remoções brancas) of nativepopulation by the market
• Vertical growth of occupied favelas (Morar Carioca)
• What are the appropriate transition rules? It is likeopening the favela’s economy.
• UPP are necessary conditions UPP Social & State
• How can local small business compete (Sebrae)?
• Microcredit Services with private and public sector (Crediamigo 1st move outside Northeast to Rio Favelas)
• UPP2 = UPP * Unidades Produtivas Populares, orUPP3 = UPP * UPP Social * Unidades Produtivas Populares