upper yakima river tributaries temperature total maximum daily … · upper yakima river...
TRANSCRIPT

Upper Yakima River Tributaries Temperature Total Maximum Daily Load
Water Quality Improvement Report and Implementation Plan
Revised March 2016
Publication No. 14-10-037
Publication and Contact Information This report is available on the Department of Ecology’s web site at https://fortress.wa.gov/ecy/publications/SummaryPages/1410037.html For more information contact: Washington State Department of Ecology Central Region Water Quality Program 15 West Yakima Ave, Suite 200 Yakima, WA 98902-3452 Phone: 509-454-7888 Washington State Department of Ecology - www.ecy.wa.gov/ • Headquarters, Olympia 360-407-6000 • Northwest Regional Office, Bellevue 425-649-7000 • Southwest Regional Office, Olympia 360-407-6300 • Central Regional Office, Yakima 509-575-2490 • Eastern Regional Office, Spokane 509-329-3400
Cover photo: Taneum Creek in July 2005 (Ecology photo). Project Codes and 1996 303(d) Water-body ID Numbers Data for this project are available at Ecology’s Environmental Information Management (EIM) web site www.ecy.wa.gov/eim/index.htm. Search Study ID, ASTO0001.
Activity Tracker Code (Environmental Assessment Program) for this study is 09-187.
TMDL Study Code (Water Quality Program) is YakU39TM
Water-body Numbers: See Table 1
Any use of product or firm names in this publication is for descriptive purposes only and does not imply endorsement by the author or the Department of Ecology. To request ADA accommodation including materials in a format for the visually impaired, call Water Quality Reception at, 360-407-6600. Persons with impaired hearing may call Washington Relay Service at 711. Persons with speech disability may call TTY at 877-833-6341.
Upper Yakima Tributaries Temperature
Total Maximum Daily Load
Water Quality Improvement Report
and Implementation Plan
by
Jane Creech
Water Quality Program Central Regional Office
Yakima, WA
and
Tighe Stuart Environmental Assessment Program
Eastern Regional Office Spokane, WA

This page is purposely left blank
Upper Yakima River Tributaries Temperature TMDL: WQ Improvement Report and Implementation Plan Page iii
Table of Contents
Page
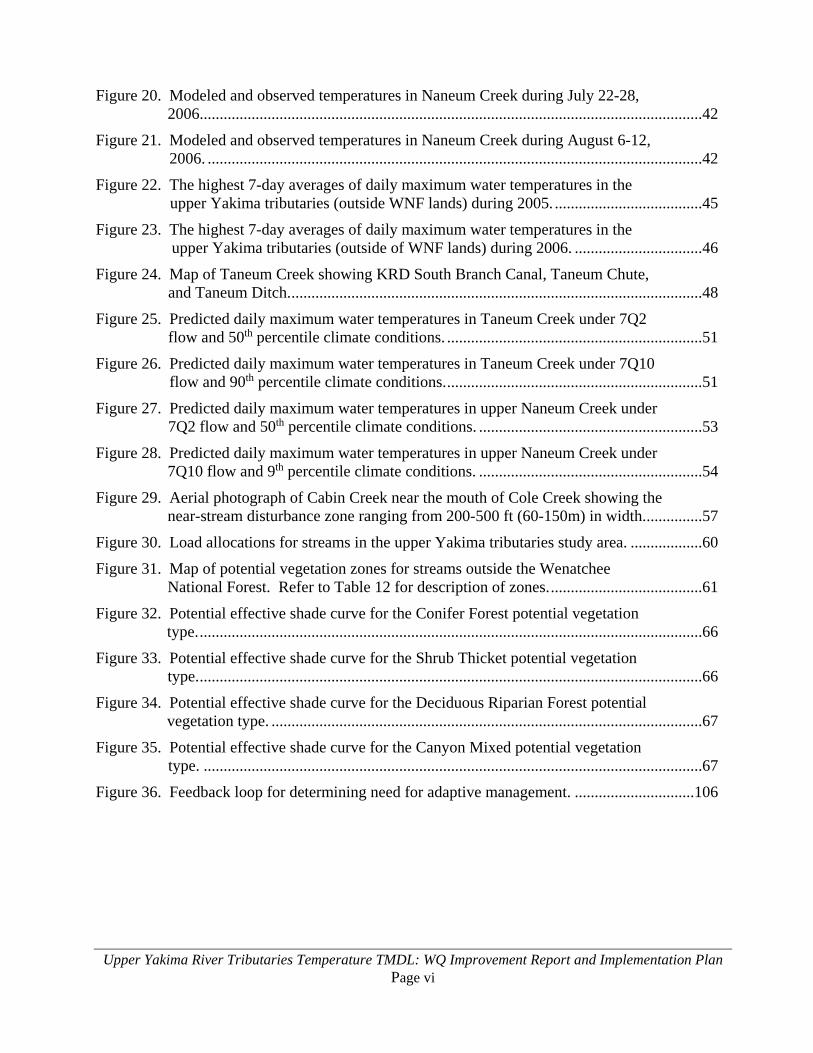
List of Figures ......................................................................................................................v
List of Tables .................................................................................................................... vii
Abstract…. ...................................................................................................................... viii
Acknowledgements ..............................................................................................................x
Executive Summary ........................................................................................................... xi Introduction .................................................................................................................. xi Watershed description ................................................................................................ xiii Goals and objectives .................................................................................................. xiv What needs to be done in this watershed .....................................................................xv Conclusions and recommendations ............................................................................ xix Why this matters ..........................................................................................................xx
What is a Total Maximum Daily Load (TMDL) .................................................................1 Federal Clean Water Act requirements ..........................................................................1 TMDL process overview ...............................................................................................2 Who should participate in this TMDL ...........................................................................2 Elements the Clean Water Act requires in a TMDL ......................................................4
Why Ecology Conducted TMDL Studies in this Watershed ...............................................5 Background ....................................................................................................................5 Impairments addressed by this TMDL ..........................................................................5
Water Quality Standards and Beneficial Uses .....................................................................9 Designated beneficial uses .............................................................................................9 Temperature criteria .....................................................................................................12
Watershed Description .......................................................................................................15 TMDL area ...................................................................................................................15 Natural hydrology ........................................................................................................16 Land use .......................................................................................................................20 Water resource issues ...................................................................................................22 Sources of pollution .....................................................................................................22
Upper Yakima Tributaries Temperature TMDL Study .....................................................25 Goals and objectives ....................................................................................................25 TMDL analyses ............................................................................................................26
Load and Wasteload Allocations .......................................................................................59 Load allocations ...........................................................................................................59 Wasteload allocations ..................................................................................................71 Seasonal variation ........................................................................................................72
Margin of Safety ................................................................................................................73 Implicit .........................................................................................................................73 Explicit .........................................................................................................................73

Upper Yakima River Tributaries Temperature TMDL: WQ Improvement Report and Implementation Plan Page iv
Reasonable Assurances ....................................................................................................745
Conclusions and Recommendations ..................................................................................81
Implementation Plan ..........................................................................................................83 Introduction ..................................................................................................................83 Who needs to participate in implementation? ..............................................................84 Pollution sources and organizational actions, goals, and schedules ............................90 What is the schedule for achieving water quality standards? ....................................102
Measuring Progress toward Goals ...................................................................................103 Performance measures and targets .............................................................................103 Effectiveness monitoring plan ...................................................................................104 Adaptive management ...............................................................................................105
Funding Opportunities .....................................................................................................107
Summary of Public Involvement Methods ......................................................................109
References…………… ....................................................................................................111
Appendices ……………………………………………………………………………..117 Appendix A. Glossary, acronyms, and abbreviations ...............................................119 Appendix B. Overview of stream heating processes ................................................125 Appendix C. Quantified shade load allocations for streams outside the Wenatchee
National Forest ....................................................................................143 Appendix D. Background information for load allocations in the Wenatchee
National Forest Temperature TMDL Technical Assessment ..............149 Appendix E. Record of public participation .............................................................155 Appendix F. Response to public comments ..............................................................156
Upper Yakima River Tributaries Temperature TMDL: WQ Improvement Report and Implementation Plan Page v
List of Figures Page
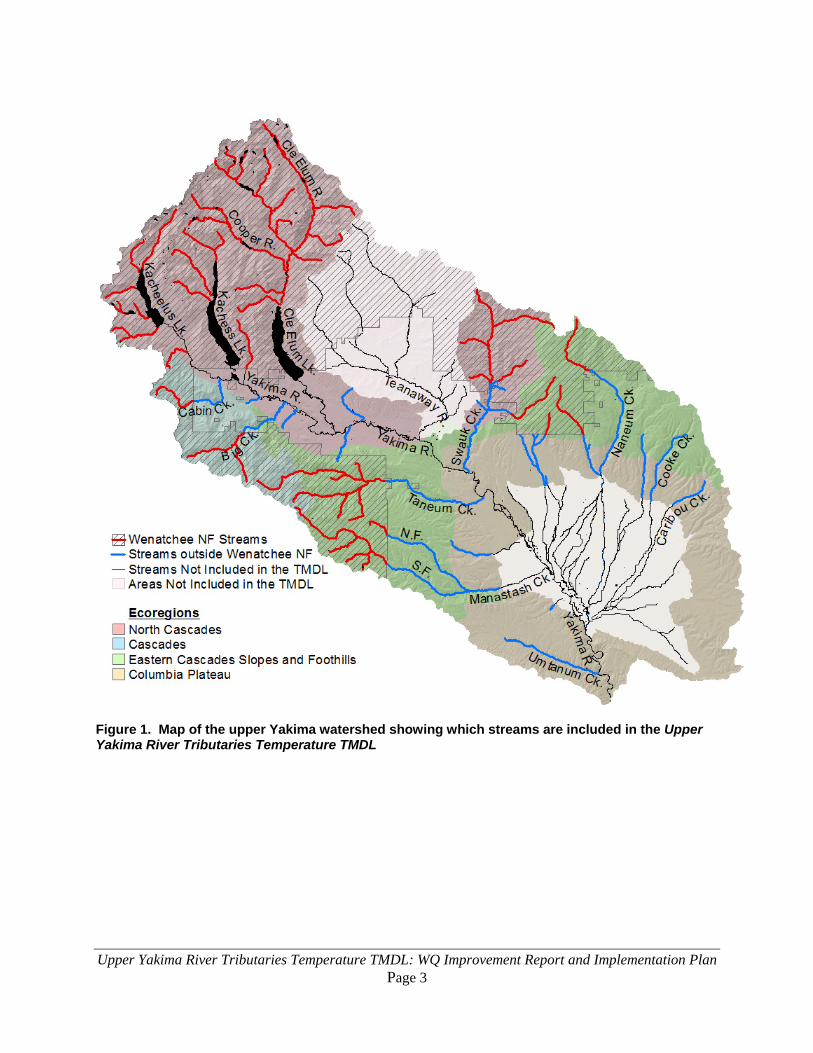
Figure 1. Map of the upper Yakima watershed showing which streams are included in the Upper Yakima River Tributaries Temperature TMDL ..............................................3
Figure 2. Applicable beneficial uses and temperature criteria for the upper Yakima watershed exclusive of subbasins downstream of Umtanum Creek..............................11
Figure 3. Hydrograph for Big Creek at mouth, 2005-2008. .........................................................17
Figure 4. Hydrograph for Swauk Creek at Lauderdale Jct., 2005-2008. ......................................18
Figure 5. Hydrograph for Taneum Creek at Brain Ranch, 2005-2008. ........................................18
Figure 6. Hydrograph for Manastash Creek at Manastash Rd., October 2005 - September 2006. ............................................................................................................19
Figure 7. General land use map of the upper Yakima basin. ........................................................21
Figure 8. Locations and station IDs of temperature monitoring stations in the upper Yakima tributaries during 2005. ....................................................................................27
Figure 9. Locations and station IDs of temperature monitoring stations in the upper Yakima tributaries during 2006. ....................................................................................28
Figure 10. Locations and station IDs of gaging stations and sites where instantaneous flow measurements were taken. ...................................................................................29
Figure 11. Example of a color digital orthophoto showing digitized riparian vegetation. ...........32
Figure 12. Effective shade from current and potential riparian vegetation on Taneum Creek. ...........................................................................................................................34
Figure 13. Effective shade from current and potential riparian vegetation on Naneum Creek. ...........................................................................................................................35
Figure 14. Effective shade on Umtanum Creek. ...........................................................................35
Figure 15. Locations of reaches modeled using QUAL2Kw. .......................................................37
Figure 16. Modeled and observed temperatures in Taneum Creek during July 11-17, 2005..............................................................................................................................40
Figure 17. Modeled and observed temperatures in Taneum Creek during August 5-11, 2005. ............................................................................................................................40
Figure 18. Modeled and observed temperatures in Taneum Creek during July 22-28, 2006..............................................................................................................................41
Figure 19. Modeled and observed temperatures in Naneum Creek during August 5-11, 2005. ............................................................................................................................41
Upper Yakima River Tributaries Temperature TMDL: WQ Improvement Report and Implementation Plan Page vi
Figure 20. Modeled and observed temperatures in Naneum Creek during July 22-28, 2006..............................................................................................................................42
Figure 21. Modeled and observed temperatures in Naneum Creek during August 6-12, 2006. ............................................................................................................................42
Figure 22. The highest 7-day averages of daily maximum water temperatures in the upper Yakima tributaries (outside WNF lands) during 2005. .....................................45
Figure 23. The highest 7-day averages of daily maximum water temperatures in the upper Yakima tributaries (outside of WNF lands) during 2006. ................................46
Figure 24. Map of Taneum Creek showing KRD South Branch Canal, Taneum Chute, and Taneum Ditch. .......................................................................................................48
Figure 25. Predicted daily maximum water temperatures in Taneum Creek under 7Q2 flow and 50th percentile climate conditions. ................................................................51
Figure 26. Predicted daily maximum water temperatures in Taneum Creek under 7Q10 flow and 90th percentile climate conditions. ................................................................51
Figure 27. Predicted daily maximum water temperatures in upper Naneum Creek under 7Q2 flow and 50th percentile climate conditions. ........................................................53
Figure 28. Predicted daily maximum water temperatures in upper Naneum Creek under 7Q10 flow and 9th percentile climate conditions. ........................................................54
Figure 29. Aerial photograph of Cabin Creek near the mouth of Cole Creek showing the near-stream disturbance zone ranging from 200-500 ft (60-150m) in width. ..............57
Figure 30. Load allocations for streams in the upper Yakima tributaries study area. ..................60
Figure 31. Map of potential vegetation zones for streams outside the Wenatchee National Forest. Refer to Table 12 for description of zones. ......................................61
Figure 32. Potential effective shade curve for the Conifer Forest potential vegetation type. ..............................................................................................................................66
Figure 33. Potential effective shade curve for the Shrub Thicket potential vegetation type. ..............................................................................................................................66
Figure 34. Potential effective shade curve for the Deciduous Riparian Forest potential vegetation type. ............................................................................................................67
Figure 35. Potential effective shade curve for the Canyon Mixed potential vegetation type. .............................................................................................................................67
Figure 36. Feedback loop for determining need for adaptive management. ..............................106
Upper Yakima River Tributaries Temperature TMDL: WQ Improvement Report and Implementation Plan Page vii
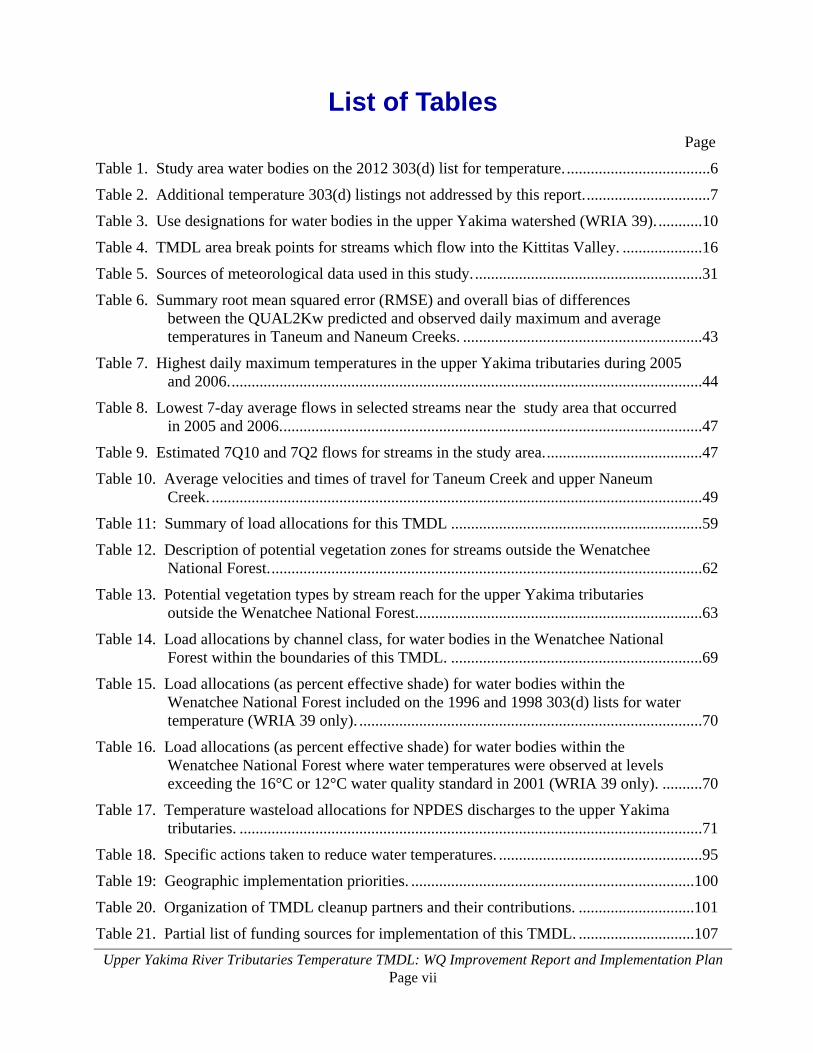
List of Tables Page
Table 1. Study area water bodies on the 2012 303(d) list for temperature. ....................................6
Table 2. Additional temperature 303(d) listings not addressed by this report. ...............................7
Table 3. Use designations for water bodies in the upper Yakima watershed (WRIA 39). ...........10
Table 4. TMDL area break points for streams which flow into the Kittitas Valley. ....................16
Table 5. Sources of meteorological data used in this study. .........................................................31
Table 6. Summary root mean squared error (RMSE) and overall bias of differences between the QUAL2Kw predicted and observed daily maximum and average temperatures in Taneum and Naneum Creeks. ............................................................43
Table 7. Highest daily maximum temperatures in the upper Yakima tributaries during 2005 and 2006. ......................................................................................................................44
Table 8. Lowest 7-day average flows in selected streams near the study area that occurred in 2005 and 2006. .........................................................................................................47
Table 9. Estimated 7Q10 and 7Q2 flows for streams in the study area. .......................................47
Table 10. Average velocities and times of travel for Taneum Creek and upper Naneum Creek. ...........................................................................................................................49
Table 11: Summary of load allocations for this TMDL ...............................................................59
Table 12. Description of potential vegetation zones for streams outside the Wenatchee National Forest. ............................................................................................................62
Table 13. Potential vegetation types by stream reach for the upper Yakima tributaries outside the Wenatchee National Forest. .......................................................................63
Table 14. Load allocations by channel class, for water bodies in the Wenatchee National Forest within the boundaries of this TMDL. ...............................................................69
Table 15. Load allocations (as percent effective shade) for water bodies within the Wenatchee National Forest included on the 1996 and 1998 303(d) lists for water temperature (WRIA 39 only). ......................................................................................70
Table 16. Load allocations (as percent effective shade) for water bodies within the Wenatchee National Forest where water temperatures were observed at levels exceeding the 16°C or 12°C water quality standard in 2001 (WRIA 39 only). ..........70
Table 17. Temperature wasteload allocations for NPDES discharges to the upper Yakima tributaries. ....................................................................................................................71
Table 18. Specific actions taken to reduce water temperatures. ...................................................95
Table 19: Geographic implementation priorities. .......................................................................100
Table 20. Organization of TMDL cleanup partners and their contributions. .............................101
Table 21. Partial list of funding sources for implementation of this TMDL. .............................107
Upper Yakima River Tributaries Temperature TMDL: WQ Improvement Report and Implementation Plan Page viii
Abstract Some tributaries to the upper Yakima River have high water temperatures that do not protect fish and other native species that depend on cool, clean water. This report documents this problem and outlines the solutions needed to improve stream temperatures. The project area for the Upper Yakima River Tributaries Temperature Total Maximum Daily Load (TMDL) includes (1) all perennial tributaries that enter the Yakima River upstream of and including Umtanum Creek (with certain exceptions noted later in this section), and (2) all perennial tributaries to the reservoirs in the upper Yakima watershed (Lake Cle Elum, Keechelus Lake, Kachess Lake). Streams that are listed for temperature on the 303(d) list and included in this TMDL include; Big Creek, Cabin Creek, Caribou Creek, Cooke Creek, Little Creek, Log Creek, South Fork Manastash Creek, Naneum Creek, Swauk Creek, Taneum Creek, Umtanum Creek, and Williams Creek. The mainstem Yakima River, lower Cle Elum River, lower Kachess River, Teanaway River, and the lower reaches of several lower Kittitas Valley creeks, are not included in this TMDL. While stream reaches located on U.S. Forest Service (USFS) lands are included in the TMDL, they are not included as part of the assessment report that appears in this document. As part of the upper Yakima tributaries TMDL study for temperature, the Washington State Department of Ecology (Ecology) conducted field work during 2005-2006. The Kittitas Reclamation District (KRD) assisted with the field work and collected data during the same period. Further data were obtained from the USFS. The technical assessment portion of this TMDL document presents the analysis performed by Ecology and establishes effective shade load allocations for the upper Yakima River study area outside of USFS lands and portions of the lower Kittitas Valley. The TMDL also incorporates the allocations developed for USFS lands in the Wenatchee National Forest Water Temperature TMDL Technical Report (Whiley and Cleland, 2003). Effective shade is used as a surrogate measure of heat flux to fulfill the requirements of Section 303(d) for a TMDL for temperature. Effective shade is defined as the fraction of solar short-wave radiation that is blocked by vegetation and topography from reaching the stream surface. In general, the effective shade produced by full potential riparian vegetation is needed to meet water quality standards in the upper Yakima tributaries. Many individuals and groups will be involved in implementing this TMDL project, including individual landowners; agricultural producers; local, state, and federal government organizations; non-governmental organizations; the Yakama Nation; and other groups offering financial and technical assistance.
Upper Yakima River Tributaries Temperature TMDL: WQ Improvement Report and Implementation Plan Page ix
Actions needed to reduce summer water temperatures include: protecting existing riparian vegetation, restoring or installing riparian vegetation, preventing uncontrolled riparian grazing, restoring the natural shape of the creek, upgrading irrigation methods and putting saved irrigation water in trust, and increasing public outreach within the TMDL area.

Upper Yakima River Tributaries Temperature TMDL: WQ Improvement Report and Implementation Plan Page x
Acknowledgements The authors of this report thank the following people for their contributions to this study:
• Kathleen Satnik and Roger Satnik of Kittitas Reclamation District for field work and data collection, and for an introduction to the Kittitas Valley’s irrigation systems.
• Bill Ehinger of the U.S. Forest Service, Cle Elum Ranger District, for providing additional water temperature datasets.
• Curtis DeGasperi of King County, for modeling advice.
• Laurie Mann and Martha Turvey of the U.S. Environmental Protection Agency for review and guidance.
• Washington State Department of Ecology staff:
o James Kardouni for fieldwork and help with dataset
o Anita Stohr for model guidance, technical review, and fieldwork
o Jim Carroll for model guidance
o Sara Livingston and Melanie Redding for assistance with fieldwork
o Christen Noble for data requisition and organization
o Ray Latham for assistance with industrial stormwater permittees
o Pam Perun for assistance with sand and gravel permittees
o Patricia Olson for assistance with content relating to Cabin Creek geology
o Jean Maust, Joan LeTourneau, and Cindy Cook for formatting and editing
Upper Yakima River Tributaries Temperature TMDL: WQ Improvement Report and Implementation Plan Page xi
Executive Summary
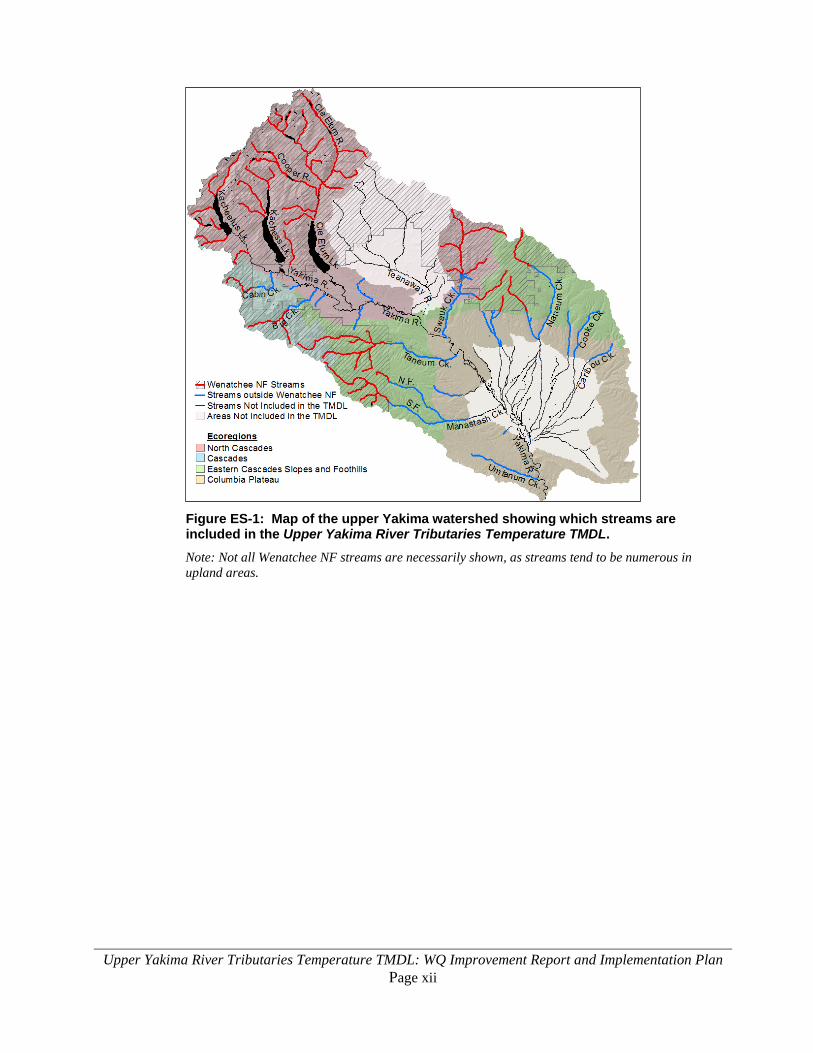
Introduction Starting in the early 1990s, data gathered by governmental, tribal, and private organizations showed that many tributaries of the upper Yakima River had summer water temperatures that exceeded Washington State’s (state’s) water quality standards. As a result, segments of thirteen creeks were included on the state’s list of impaired water bodies, the 303(d) list. In 2003, Ecology developed a TMDL technical report to address the 303(d) listings for stream water temperatures that lie within the boundaries of the Wenatchee National Forest (Whiley and Cleland, 2003), which includes the upper Yakima River watershed. Then, beginning in 2005, Ecology’s Environmental Assessment Program (EAP) conducted a second TMDL study to address the 303(d) listings for temperature in the upper Yakima River watershed outside of the Wenatchee National Forest (Figure ES-1 and Table ES-1). This report presents the findings of the EAP study, and then ties the two assessments together.
Upper Yakima River Tributaries Temperature TMDL: WQ Improvement Report and Implementation Plan Page xii
Figure ES-1: Map of the upper Yakima watershed showing which streams are included in the Upper Yakima River Tributaries Temperature TMDL. Note: Not all Wenatchee NF streams are necessarily shown, as streams tend to be numerous in upland areas.
Upper Yakima River Tributaries Temperature TMDL: WQ Improvement Report and Implementation Plan Page xiii
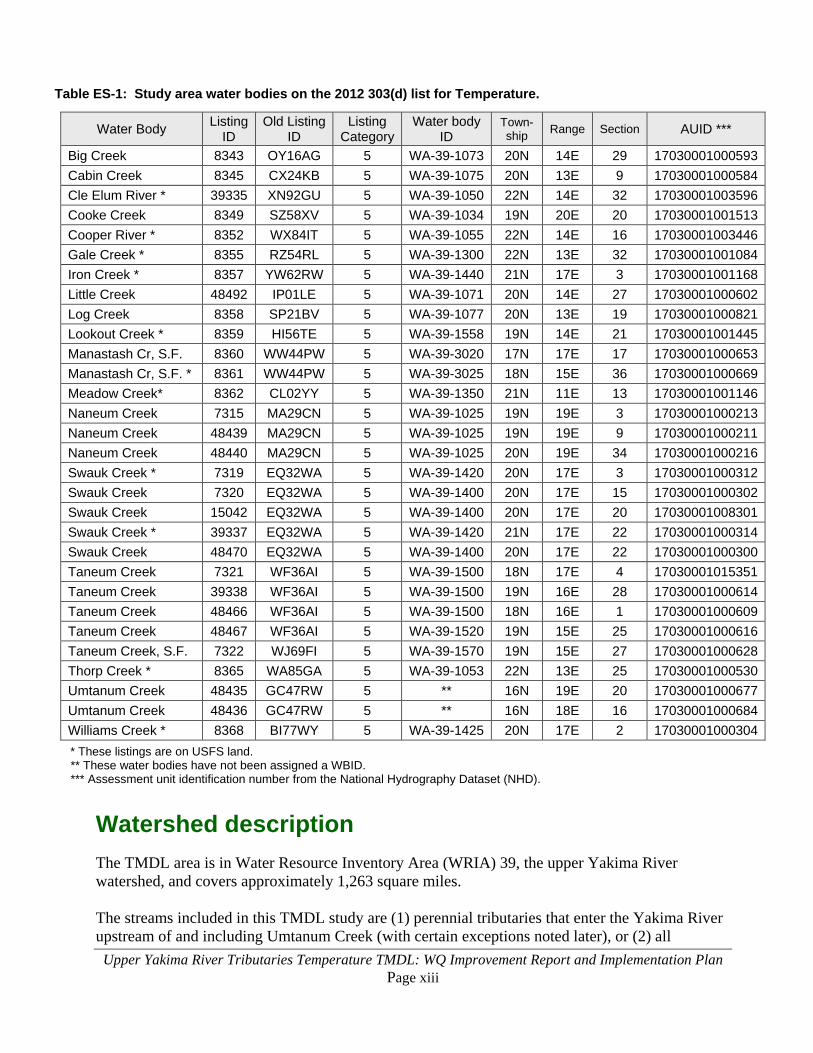
Table ES-1: Study area water bodies on the 2012 303(d) list for Temperature.
Water Body Listing ID
Old Listing ID
Listing Category
Water body ID
Town-ship Range Section AUID ***
Big Creek 8343 OY16AG 5 WA-39-1073 20N 14E 29 17030001000593 Cabin Creek 8345 CX24KB 5 WA-39-1075 20N 13E 9 17030001000584 Cle Elum River * 39335 XN92GU 5 WA-39-1050 22N 14E 32 17030001003596 Cooke Creek 8349 SZ58XV 5 WA-39-1034 19N 20E 20 17030001001513 Cooper River * 8352 WX84IT 5 WA-39-1055 22N 14E 16 17030001003446 Gale Creek * 8355 RZ54RL 5 WA-39-1300 22N 13E 32 17030001001084 Iron Creek * 8357 YW62RW 5 WA-39-1440 21N 17E 3 17030001001168 Little Creek 48492 IP01LE 5 WA-39-1071 20N 14E 27 17030001000602 Log Creek 8358 SP21BV 5 WA-39-1077 20N 13E 19 17030001000821 Lookout Creek * 8359 HI56TE 5 WA-39-1558 19N 14E 21 17030001001445 Manastash Cr, S.F. 8360 WW44PW 5 WA-39-3020 17N 17E 17 17030001000653 Manastash Cr, S.F. * 8361 WW44PW 5 WA-39-3025 18N 15E 36 17030001000669 Meadow Creek* 8362 CL02YY 5 WA-39-1350 21N 11E 13 17030001001146 Naneum Creek 7315 MA29CN 5 WA-39-1025 19N 19E 3 17030001000213 Naneum Creek 48439 MA29CN 5 WA-39-1025 19N 19E 9 17030001000211 Naneum Creek 48440 MA29CN 5 WA-39-1025 20N 19E 34 17030001000216 Swauk Creek * 7319 EQ32WA 5 WA-39-1420 20N 17E 3 17030001000312 Swauk Creek 7320 EQ32WA 5 WA-39-1400 20N 17E 15 17030001000302 Swauk Creek 15042 EQ32WA 5 WA-39-1400 20N 17E 20 17030001008301 Swauk Creek * 39337 EQ32WA 5 WA-39-1420 21N 17E 22 17030001000314 Swauk Creek 48470 EQ32WA 5 WA-39-1400 20N 17E 22 17030001000300 Taneum Creek 7321 WF36AI 5 WA-39-1500 18N 17E 4 17030001015351 Taneum Creek 39338 WF36AI 5 WA-39-1500 19N 16E 28 17030001000614 Taneum Creek 48466 WF36AI 5 WA-39-1500 18N 16E 1 17030001000609 Taneum Creek 48467 WF36AI 5 WA-39-1520 19N 15E 25 17030001000616 Taneum Creek, S.F. 7322 WJ69FI 5 WA-39-1570 19N 15E 27 17030001000628 Thorp Creek * 8365 WA85GA 5 WA-39-1053 22N 13E 25 17030001000530 Umtanum Creek 48435 GC47RW 5 ** 16N 19E 20 17030001000677 Umtanum Creek 48436 GC47RW 5 ** 16N 18E 16 17030001000684 Williams Creek * 8368 BI77WY 5 WA-39-1425 20N 17E 2 17030001000304
* These listings are on USFS land. ** These water bodies have not been assigned a WBID. *** Assessment unit identification number from the National Hydrography Dataset (NHD).
Watershed description The TMDL area is in Water Resource Inventory Area (WRIA) 39, the upper Yakima River watershed, and covers approximately 1,263 square miles. The streams included in this TMDL study are (1) perennial tributaries that enter the Yakima River upstream of and including Umtanum Creek (with certain exceptions noted later), or (2) all
Upper Yakima River Tributaries Temperature TMDL: WQ Improvement Report and Implementation Plan Page xiv
perennial tributaries to the three reservoirs in the upper Yakima watershed (Lake Cle Elum, Keechelus Lake, Kachess Lake). The TMDL area starts at the top of Snoqualmie Pass, and the southernmost tributary included in this study is Umtanum Creek. Over 400 miles of streams are included in this TMDL. The most important streams in terms of flow and drainage area are Taneum Creek, Swauk Creek, upper Manastash Creek, and upper Naneum Creek. The mainstem Yakima River, lower Kachess River, the lower Cle Elum River, and the lower reaches of several lower Kittitas Valley creeks are not included in this TMDL, as they will be addressed in later studies. The Teanaway River watershed is also not included in this TMDL, as temperature violations in the Teanaway watershed were addressed by a previous TMDL study (Stohr and Leskie, 2000; Irle, 2001; and Creech, 2003). Nearly all of the TMDL area is in Kittitas County, and about 70% of the TMDL area is forested. The upper Yakima River watershed also contains part of usual and accustomed fishing rights area of the Yakama Nation. About 62% of the TMDL area is under state or federal ownership; most of the headwater streams are located within the Wenatchee National Forest. The transport and distribution of water for agricultural irrigation is a complex and important factor affecting water temperatures in the upper Yakima watershed. Irrigation water is diverted from the Yakima River and delivered to farms and ranches via a network of irrigation canals and laterals. Water is also diverted from many creeks in the TMDL area for irrigation. After a field is irrigated, excess irrigation water may run off the field and enter other creeks, canals or laterals in the TMDL area. Both point sources and nonpoint sources of thermal pollution are present in the upper Yakima tributaries. Of the two, nonpoint sources are by far the most important and wide-reaching, with effects felt on streams throughout the TMDL area, particularly in the Kittitas Valley. Nonpoint sources of water temperature increases include: 1. Riparian vegetation disturbance and loss of shade. 2. Channel morphology impacts. 3. Hydrologic changes.
Point sources of water temperature increases include permitted discharges from stormwater from roadways owned and managed by the Washington State Department of Transportation.
Goals and objectives The goal of this water quality improvement project is to address temperature problems in upper Yakima River tributaries so that state water quality criteria are met and beneficial uses are restored.
Upper Yakima River Tributaries Temperature TMDL: WQ Improvement Report and Implementation Plan Page xv
The main objectives of this TMDL project are:
• Characterize stream temperatures during the “critical condition” period1 (June through September) in the upper Yakima River tributaries by compiling existing data and collecting additional data in cooperation with other organizations.
• Characterize vegetation, flow, channel characteristics, and related variables to support modeling of upper Naneum and Taneum Creeks.
• Develop a predictive computer temperature model using QUAL2Kw for Taneum Creek and upper Naneum Creek, focusing on the instream temperature regime at critical conditions.
• Apply model results from Taneum and upper Naneum Creeks, along with available data, to evaluate the ability of various watershed best management practices (BMPs) to reduce water temperature to meet water quality standards throughout the study area.
• Establish a TMDL for temperature in the many of the upper Yakima River tributaries.
• Work with stakeholders to implement all necessary BMPs.
What needs to be done in this watershed Load allocations (for nonpoint sources) and wasteload allocations (for point sources) are established to meet either (1) the numeric water quality criteria or (2) the allowance for human-caused warming if modeling predicts that portions of streams will be naturally warmer than those criteria. In general, the load allocations are based on the increases in effective shade necessary to achieve water quality standards. Nonpoint sources of water temperature increases within the TMDL area are located both within and outside of the Wenatchee National Forest.
Figure ES-2 shows the locations of the load allocations within the TMDL area but outside of the Wenatchee National Forest.
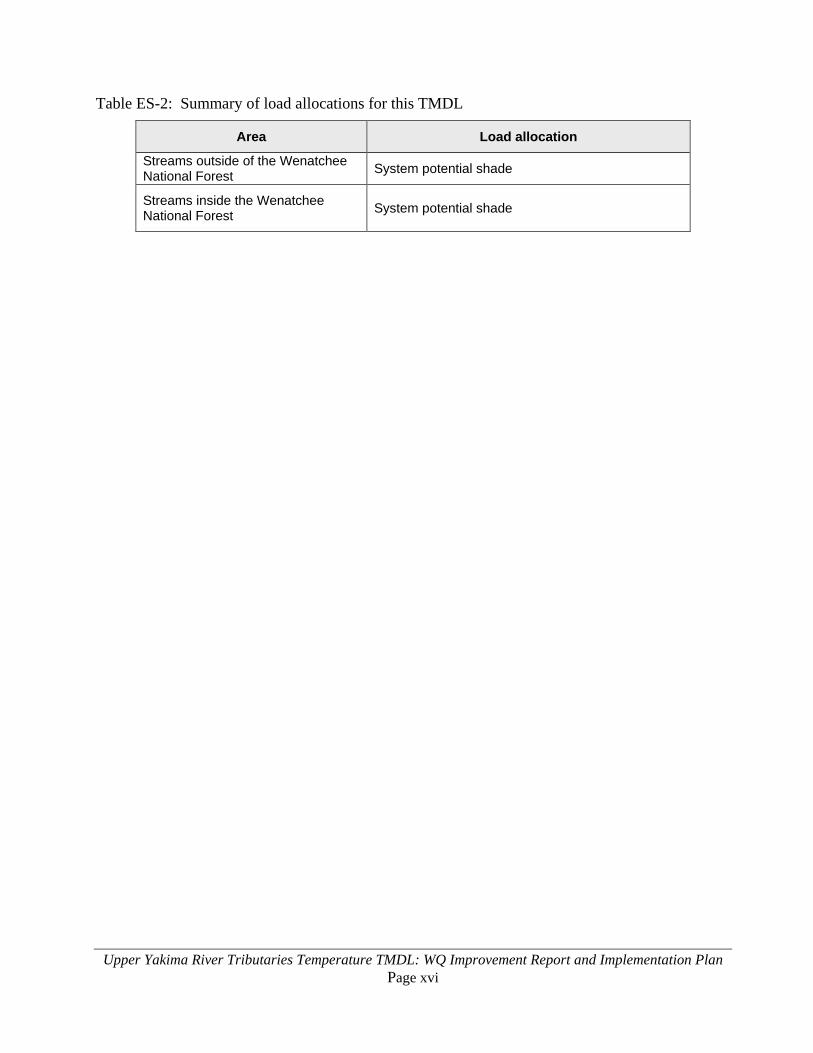
The load allocation for the TMDL-area tributaries within the Wenatchee National Forest is system potential shade. For the TMDL-area tributaries outside of the Wenatchee National Forest, the load allocation is also system potential shade. See Table ES-2.
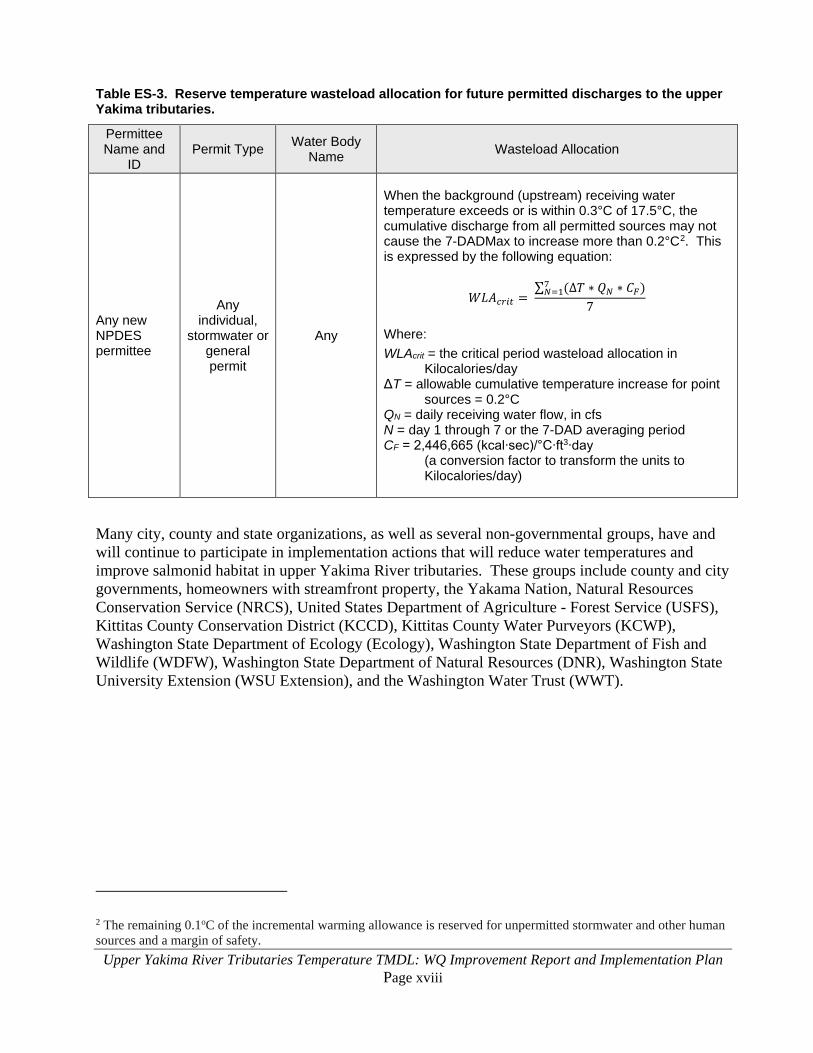
Table ES-3 shows the reserve temperature wasteload allocation for any future permitted discharges to the upper Yakima tributaries.
1 The “critical condition” period is the time of the year when the warmest stream temperatures typically occur. Several other TMDL studies have established June through September as a critical condition period for stream and river water temperatures in central Washington State.
Upper Yakima River Tributaries Temperature TMDL: WQ Improvement Report and Implementation Plan Page xvi
Table ES-2: Summary of load allocations for this TMDL
Area Load allocation
Streams outside of the Wenatchee National Forest System potential shade
Streams inside the Wenatchee National Forest System potential shade

Upper Yakima River Tributaries Temperature TMDL: WQ Improvement Report and Implementation Plan Page xvii
Figure ES-2: Load allocations for streams in the upper Yakima tributaries study area, outside of the Wenatchee National Forest.
There are no permitted National Pollutant Discharge Elimination System (NPDES) dischargers in the upper Yakima tributaries, and there are no assigned wasteload allocations (WLAs). Ecology has developed a reserve WLA to allow for future growth within the TMDL project area.
Upper Yakima River Tributaries Temperature TMDL: WQ Improvement Report and Implementation Plan Page xviii
Table ES-3. Reserve temperature wasteload allocation for future permitted discharges to the upper Yakima tributaries.
Permittee Name and
ID Permit Type Water Body
Name Wasteload Allocation
Any new NPDES permittee
Any individual,
stormwater or general permit
Any
When the background (upstream) receiving water temperature exceeds or is within 0.3°C of 17.5°C, the cumulative discharge from all permitted sources may not cause the 7-DADMax to increase more than 0.2°C2. This is expressed by the following equation:
𝑊𝑊𝑊𝑊𝑊𝑊𝑐𝑐𝑐𝑐𝑐𝑐𝑐𝑐 = ∑ (∆𝑇𝑇 ∗ 𝑄𝑄𝑁𝑁 ∗ 𝐶𝐶𝐹𝐹)7𝑁𝑁=1
7
Where: WLAcrit = the critical period wasteload allocation in
Kilocalories/day ΔT = allowable cumulative temperature increase for point
sources = 0.2°C QN = daily receiving water flow, in cfs N = day 1 through 7 or the 7-DAD averaging period CF = 2,446,665 (kcal∙sec)/°C∙ft3∙day
(a conversion factor to transform the units to Kilocalories/day)
Many city, county and state organizations, as well as several non-governmental groups, have and will continue to participate in implementation actions that will reduce water temperatures and improve salmonid habitat in upper Yakima River tributaries. These groups include county and city governments, homeowners with streamfront property, the Yakama Nation, Natural Resources Conservation Service (NRCS), United States Department of Agriculture - Forest Service (USFS), Kittitas County Conservation District (KCCD), Kittitas County Water Purveyors (KCWP), Washington State Department of Ecology (Ecology), Washington State Department of Fish and Wildlife (WDFW), Washington State Department of Natural Resources (DNR), Washington State University Extension (WSU Extension), and the Washington Water Trust (WWT).
2 The remaining 0.1oC of the incremental warming allowance is reserved for unpermitted stormwater and other human sources and a margin of safety.
Upper Yakima River Tributaries Temperature TMDL: WQ Improvement Report and Implementation Plan Page xix
In order to bring upper Yakima River tributaries into compliance with water temperature criteria, this document recommends several implementation actions, including:
• Restore, and/or install, riparian vegetation along the tributaries.
• Prevent removal of existing riparian vegetation from creek banks.
• Prevent uncontrolled riparian grazing.
• Remove dikes, where appropriate.
• Add stream sinuosity, where appropriate.
• Prevent erosion of earthen roads into streams via appropriate ditching, cambering, and so on. May include closing out unused roads.
• Upgrade irrigation methods to: o Use less water, and put saved water in trust. o Prevent warm or sediment-laden runoff from returning to creeks.
• Ensure that streambanks slope at angle of repose.
• Increase public outreach within TMDL area.
Conclusions and recommendations • With successful implementation of the TMDL tasks:
o Temperature reductions of up to 3.4°C are expected to occur on Taneum Creek. However, temperatures in Taneum Creek are not expected to meet the 16°C standard during critical conditions (June through September).
o Temperature reductions of up to 1.7°C are expected to occur on upper Naneum Creek. Temperatures in upper Naneum Creek are expected to meet the 17.5°C standard during most years, but not during critical (7Q10 flow and 90th percentile climate) conditions.
o Significant temperature reductions are expected for Swauk Creek, and small temperature reductions are expected for upper Manastash Creek. Temperatures are not expected to meet the 16°C standard in either of these streams during critical conditions.
o Small temperature reductions are expected for Big Creek and Little Creek. These temperature reductions may be sufficient to achieve the 16°C standard.
• System potential mature riparian vegetation is needed along all the upper Yakima tributaries to ensure that maximum stream temperatures stay below the temperature standard where possible, and that system potential temperatures are achieved when the numeric criteria cannot be.
• System potential temperatures cannot be calculated for lowland streams in the Kittitas Valley within the scope of this study, due to the complexity of channelization and irrigation water management. Irrigation water interactions may alter the ability of riparian shade to reduce stream temperatures. In addition to system potential mature riparian vegetation, these streams need habitat and channel restoration. These irrigation-affected areas will be addressed in a subsequent TMDL.
Upper Yakima River Tributaries Temperature TMDL: WQ Improvement Report and Implementation Plan Page xx
• Many streams in the Kittitas Valley have been straightened, channelized, and/or rerouted. Restoring channel complexity to these streams will improve riparian habitat and benefit stream temperatures.
• To increase the effectiveness of shade at reducing stream temperatures, irrigation practices should be managed so as to take into account and limit increases in stream temperatures.
• Temperatures in Cabin Creek can be expected to decrease as the Falls Hill landslide stabilizes, allowing the near-stream disturbance zone (NSDZ) in lower Cabin Creek to become narrower. A narrower NSDZ may allow temperatures in Cabin Creek to meet the 16°C standard. Forest practices should be carefully planned to avoid triggering future large-scale mass wasting events.
• System potential temperatures already exist in most of Umtanum Creek. No further temperature reductions are possible except in a few limited upstream areas. Existing riparian vegetation should be protected to ensure against temperature increases.
Why this matters In the upper Yakima River tributaries, two species of salmonids are listed as “threatened” by the federal Endangered Species Act: steelhead (Oncorhynchus mykiss) and bull trout (Salvelinus confluentus). Salmonids need cold water to stay healthy during key life stages. Cold water holds more oxygen than warm water. As water temperatures get warmer, the amount of oxygen in the water decreases, resulting in less oxygen for fish. Additionally, young salmonids swim slower in warm water, so they are less able to escape from predators. Salmonids also have less food in warm water, because many of the stream insects they need to eat cannot live in warm water. Salmonid body functions change as water temperatures increase, making them more likely to catch diseases and suffer damage from toxins. Finally, the lethal water temperature for many salmonids is 22°C (72°F).
Upper Yakima River Tributaries Temperature TMDL: WQ Improvement Report and Implementation Plan Page 1
What is a Total Maximum Daily Load (TMDL)
Federal Clean Water Act requirements The Clean Water Act (CWA) established a process to identify and clean up polluted waters. The CWA requires each state to have its own water quality standards designed to protect, restore, and preserve water quality. Water quality standards consist of (1) designated uses for protection, such as cold water biota and drinking water supply, and (2) criteria, usually numeric criteria, to achieve those uses.
The Water Quality Assessment and the 303(d) List Every two years, states are required to prepare a list of water bodies that do not meet water quality standards. This list is called the CWA 303(d) list. In Washington (state), this list is part of the Water Quality Assessment (WQA) process. To develop the WQA, the Washington State Department of Ecology (Ecology) compiles its own water quality data along with data from local, state, and federal governments, tribes, industries, and citizen monitoring groups. All data in this WQA are reviewed to ensure that they were collected using appropriate scientific methods before they are used to develop the assessment. The WQA divides water bodies into five categories. Those not meeting standards are given a Category 5 designation, which collectively becomes the 303(d) list.
Category 1 – Meets standards for parameter(s) for which it has been tested.
Category 2 – Waters of concern.
Category 3 – Waters with no data or insufficient data available.
Category 4 – Polluted waters that do not require a TMDL because they:
4a. – Have an approved TMDL being implemented.
4b. – Have a pollution control program in place that should solve the problem.
4c. – Are impaired by a non-pollutant such as low water flow, dams, or culverts. Category 5 – Polluted waters that require a TMDL – the 303(d) list. Further information is available at Ecology’s Water Quality Assessment web site. The CWA requires that a total maximum daily load (TMDL) be developed for each of the water bodies on the 303(d) list. A TMDL is a numerical value representing the highest pollutant load a surface water body can receive and still meet water quality standards. Any amount of pollution over the TMDL level needs to be reduced or eliminated to achieve clean water.
Upper Yakima River Tributaries Temperature TMDL: WQ Improvement Report and Implementation Plan Page 2
TMDL process overview Ecology uses the 303(d) list to prioritize and initiate TMDL studies across the state. The TMDL study identifies pollution problems in the watershed and specifies how much pollution needs to be reduced or eliminated to achieve clean water. Ecology, with the assistance of local governments, tribes, agencies, and the community, develops a plan to control and reduce pollution sources as well as a monitoring plan to assess effectiveness of the water quality improvement activities. This document contains both the water quality improvement report (WQIR) and implementation plan (IP). The IP section identifies specific tasks, responsible parties, and timelines for reducing or eliminating pollution sources and achieving clean water. After the public comment period Ecology addresses the comments as appropriate. Then, Ecology submits the WQIR/IP to the U.S. Environmental Protection Agency (EPA) for approval.
Who should participate in this TMDL Nonpoint source pollutant load targets have been set in this TMDL and described in the load allocations section of this document. Because nonpoint pollution comes from diffuse sources, all upstream watershed areas have the potential to affect downstream water quality. Therefore, all potential nonpoint sources in the watershed must use the appropriate best management practices to reduce impacts to water quality. The area subject to the TMDL is shown in Figure 1. Similarly, a future point source discharger in the watershed must also comply with the TMDL. Point source discharges are discussed in the Wasteload Allocations section of this report.
Upper Yakima River Tributaries Temperature TMDL: WQ Improvement Report and Implementation Plan Page 3
Figure 1. Map of the upper Yakima watershed showing which streams are included in the Upper Yakima River Tributaries Temperature TMDL

Upper Yakima River Tributaries Temperature TMDL: WQ Improvement Report and Implementation Plan Page 4
Elements the Clean Water Act requires in a TMDL Loading capacity, allocations, seasonal variation, margin of safety, and reserve capacity A water body’s loading capacity is the amount of a given pollutant that a water body can receive and still meet water quality standards. The loading capacity provides a reference for calculating the amount of pollution reduction needed to bring a water body into compliance with the standards. The portion of the receiving water’s loading capacity assigned to a particular source is a wasteload or load allocation. If the pollutant comes from a discrete (point) source subject to a National Pollutant Discharge Elimination System (NPDES) permit, such as a municipal or industrial facility’s discharge pipe, that facility’s share of the loading capacity is called a wasteload allocation. If the pollutant comes from diffuse (nonpoint) sources not subject to an NPDES permit, such as general urban, residential, or farm runoff, the cumulative share is called a load allocation. The TMDL must also consider seasonal variations and include a margin of safety that takes into account any lack of knowledge about the causes of the water quality problem or its loading capacity. A reserve capacity for future pollutant sources is sometimes included as well. Therefore, a TMDL is the sum of the wasteload and load allocations, any margin of safety, and any reserve capacity. The TMDL must be equal to or less than the loading capacity.
Surrogate measures To provide more meaningful and measurable pollutant-loading targets, a TMDL may also incorporate a surrogate measures. EPA regulations [40 CFR 130.2(i)] allow other appropriate measures in a TMDL. Heat loads to the stream are typically calculated in units of Kilocalories per day (Kcal/day) or watts per square meter (W/m2). See Appendices C and D to see load allocations expressed in W/m2. However, heat loads are of limited value in guiding management activities needed to solve identified water quality problems. The Upper Yakima River Tributaries Temperature TMDL uses effective shade as a surrogate measure for heat flux. Effective shade is defined as the fraction of shortwave radiation that is blocked by vegetation and topography before it reaches the stream surface.

Upper Yakima River Tributaries Temperature TMDL: WQ Improvement Report and Implementation Plan Page 5
Why Ecology Conducted TMDL Studies in this Watershed
Background Data gathered by governmental, tribal, and private organizations were the basis for placing segments of tributaries to the upper Yakima River on the 1996, 1998, and 2002/2004 303(d) lists for temperature. Segments of 24 streams were listed. In 2003, Ecology developed the Wenatchee National Forest Water Temperature TMDL Technical Report (Whiley and Cleland, 2003). Beginning in 2005, Ecology conducted a TMDL study in this watershed to address 303(d) listings for temperature in the rest of the upper Yakima River watershed.
Impairments addressed by this TMDL This TMDL addresses temperature impairments to many upper Yakima River watershed tributaries. Pollutant loading from heat sources must be decreased so that water temperature will comply with state water quality standards. Tables 1 and 2 show listings for temperature which violate these standards within the Yakima River watershed upstream of the confluence with Umtanum Creek. Load allocations are developed for all listings in Table 1, either in this document or in the Wenatchee National Forest Water Temperature TMDL Technical Report (Whiley and Cleland, 2003). Additionally, because temperature listings are spread throughout the study area, this TMDL project was developed to address water temperature in all perennial streams in the study area.

Upper Yakima River Tributaries Temperature TMDL: WQ Improvement Report and Implementation Plan Page 6
Table 1. Study area water bodies on the 2012 303(d) list for Temperature.
Water Body Listing ID
Old Listing
ID
Listing Category
Water body ID
Town-ship Range Section AUID ***
Big Creek 8343 OY16AG 5 WA-39-1073 20N 14E 29 17030001000593 Cabin Creek 8345 CX24KB 5 WA-39-1075 20N 13E 9 17030001000584 Cle Elum River * 39335 XN92GU 5 WA-39-1050 22N 14E 32 17030001003596 Cooke Creek 8349 SZ58XV 5 WA-39-1034 19N 20E 20 17030001001513 Cooper River* 8352 WX84IT 5 WA-39-1055 22N 14E 16 17030001003446 Gale Creek * 8355 RZ54RL 5 WA-39-1300 22N 13E 32 17030001001084 Iron Creek * 8357 YW62RW 5 WA-39-1440 21N 17E 3 17030001001168 Little Creek 48492 IP01LE 5 WA-39-1071 20N 14E 27 17030001000602 Log Creek 8358 SP21BV 5 WA-39-1077 20N 13E 19 17030001000821 Lookout Creek * 8359 HI56TE 5 WA-39-1558 19N 14E 21 17030001001445 Manastash Cr, S.F. 8360 WW44PW 5 WA-39-3020 17N 17E 17 17030001000653 Manastash Cr, S.F .* 8361 WW44PW 5 WA-39-3025 18N 15E 36 17030001000669 Meadow Creek* 8362 CL02YY 5 WA-39-1350 21N 11E 13 17030001001146
Naneum Creek 7315 MA29CN 5 WA-39-1025 19N 19E 3 17030001000213 Naneum Creek 48439 MA29CN 5 WA-39-1025 19N 19E 9 17030001000211 Naneum Creek 48440 MA29CN 5 WA-39-1025 20N 19E 34 17030001000216 Swauk Creek * 7319 EQ32WA 5 WA-39-1420 20N 17E 3 17030001000312 Swauk Creek 7320 EQ32WA 5 WA-39-1400 20N 17E 15 17030001000302 Swauk Creek 15042 EQ32WA 5 WA-39-1400 20N 17E 20 17030001008301 Swauk Creek * 39337 EQ32WA 5 WA-39-1420 21N 17E 22 17030001000314 Swauk Creek 48470 EQ32WA 5 WA-39-1400 20N 17E 22 17030001000300 Taneum Creek 7321 WF36AI 5 WA-39-1500 18N 17E 4 17030001015351 Taneum Creek 39338 WF36AI 5 WA-39-1500 19N 16E 28 17030001000614 Taneum Creek 48466 WF36AI 5 WA-39-1500 18N 16E 1 17030001000609 Taneum Creek 48467 WF36AI 5 WA-39-1520 19N 15E 25 17030001000616 Taneum Creek, S.F. 7322 WJ69FI 5 WA-39-1570 19N 15E 27 17030001000628 Thorp Creek * 8365 WA85GA 5 WA-39-1053 22N 13E 25 17030001000530 Umtanum Creek 48435 GC47RW 5 ** 16N 19E 20 17030001000677 Umtanum Creek 48436 GC47RW 5 ** 16N 18E 16 17030001000684 Williams Creek * 8368 BI77WY 5 WA-39-1425 20N 17E 2 17030001000304
* These listings are on USFS land. ** These water bodies have not been assigned a WBID. *** Assessment unit identification number from the National Hydrography Dataset (NHD).
Upper Yakima River Tributaries Temperature TMDL: WQ Improvement Report and Implementation Plan Page 7
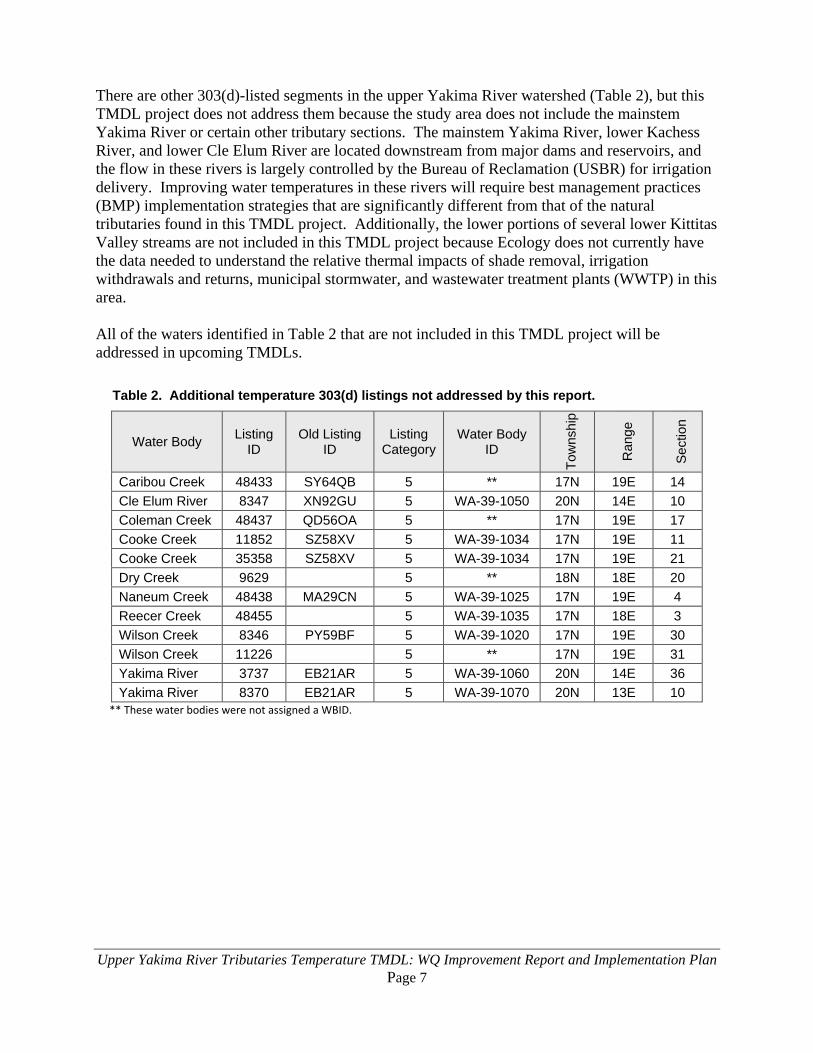
There are other 303(d)-listed segments in the upper Yakima River watershed (Table 2), but this TMDL project does not address them because the study area does not include the mainstem Yakima River or certain other tributary sections. The mainstem Yakima River, lower Kachess River, and lower Cle Elum River are located downstream from major dams and reservoirs, and the flow in these rivers is largely controlled by the Bureau of Reclamation (USBR) for irrigation delivery. Improving water temperatures in these rivers will require best management practices (BMP) implementation strategies that are significantly different from that of the natural tributaries found in this TMDL project. Additionally, the lower portions of several lower Kittitas Valley streams are not included in this TMDL project because Ecology does not currently have the data needed to understand the relative thermal impacts of shade removal, irrigation withdrawals and returns, municipal stormwater, and wastewater treatment plants (WWTP) in this area. All of the waters identified in Table 2 that are not included in this TMDL project will be addressed in upcoming TMDLs.
Table 2. Additional temperature 303(d) listings not addressed by this report.
Water Body Listing ID
Old Listing ID
Listing Category
Water Body ID
Tow
nshi
p
Ran
ge
Sect
ion
Caribou Creek 48433 SY64QB 5 ** 17N 19E 14 Cle Elum River 8347 XN92GU 5 WA-39-1050 20N 14E 10 Coleman Creek 48437 QD56OA 5 ** 17N 19E 17 Cooke Creek 11852 SZ58XV 5 WA-39-1034 17N 19E 11 Cooke Creek 35358 SZ58XV 5 WA-39-1034 17N 19E 21 Dry Creek 9629 5 ** 18N 18E 20 Naneum Creek 48438 MA29CN 5 WA-39-1025 17N 19E 4 Reecer Creek 48455 5 WA-39-1035 17N 18E 3 Wilson Creek 8346 PY59BF 5 WA-39-1020 17N 19E 30 Wilson Creek 11226 5 ** 17N 19E 31 Yakima River 3737 EB21AR 5 WA-39-1060 20N 14E 36 Yakima River 8370 EB21AR 5 WA-39-1070 20N 13E 10
** These water bodies were not assigned a WBID.

Upper Yakima River Tributaries Temperature TMDL: WQ Improvement Report and Implementation Plan Page 8
This page is purposely left blank.
Upper Yakima River Tributaries Temperature TMDL: WQ Improvement Report and Implementation Plan Page 9
Water Quality Standards and Beneficial Uses
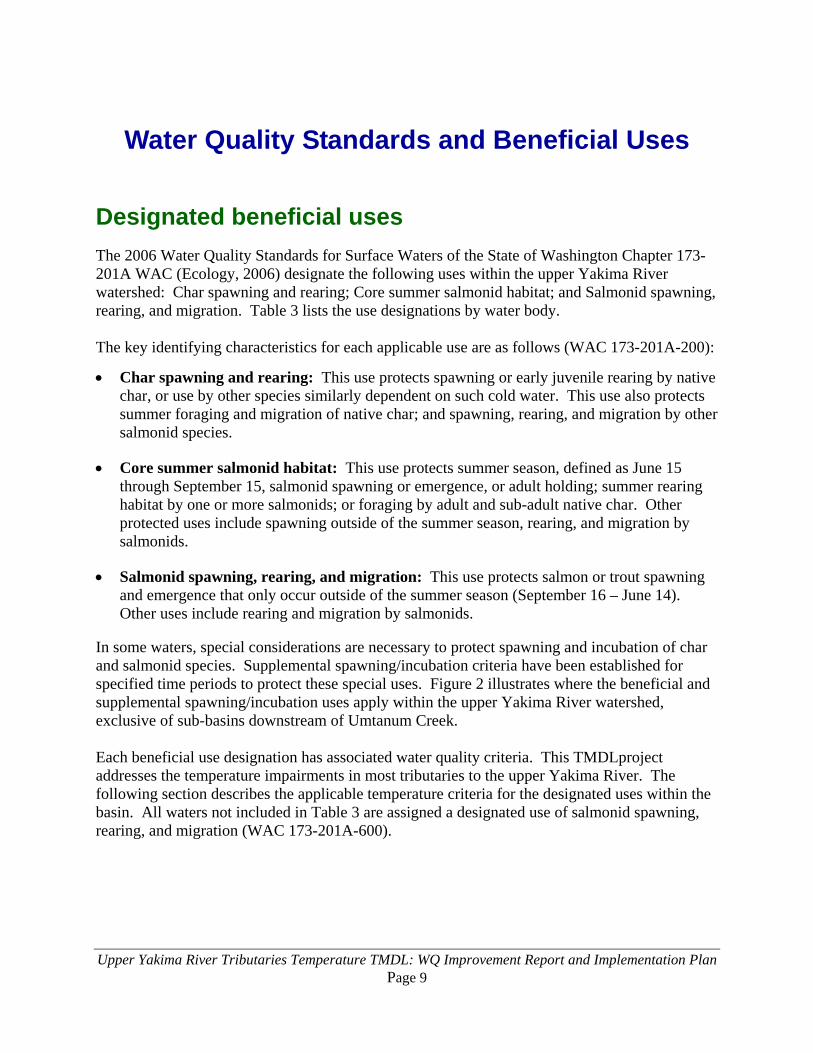
Designated beneficial uses The 2006 Water Quality Standards for Surface Waters of the State of Washington Chapter 173-201A WAC (Ecology, 2006) designate the following uses within the upper Yakima River watershed: Char spawning and rearing; Core summer salmonid habitat; and Salmonid spawning, rearing, and migration. Table 3 lists the use designations by water body. The key identifying characteristics for each applicable use are as follows (WAC 173-201A-200):
• Char spawning and rearing: This use protects spawning or early juvenile rearing by native char, or use by other species similarly dependent on such cold water. This use also protects summer foraging and migration of native char; and spawning, rearing, and migration by other salmonid species.
• Core summer salmonid habitat: This use protects summer season, defined as June 15 through September 15, salmonid spawning or emergence, or adult holding; summer rearing habitat by one or more salmonids; or foraging by adult and sub-adult native char. Other protected uses include spawning outside of the summer season, rearing, and migration by salmonids.
• Salmonid spawning, rearing, and migration: This use protects salmon or trout spawning and emergence that only occur outside of the summer season (September 16 – June 14). Other uses include rearing and migration by salmonids.
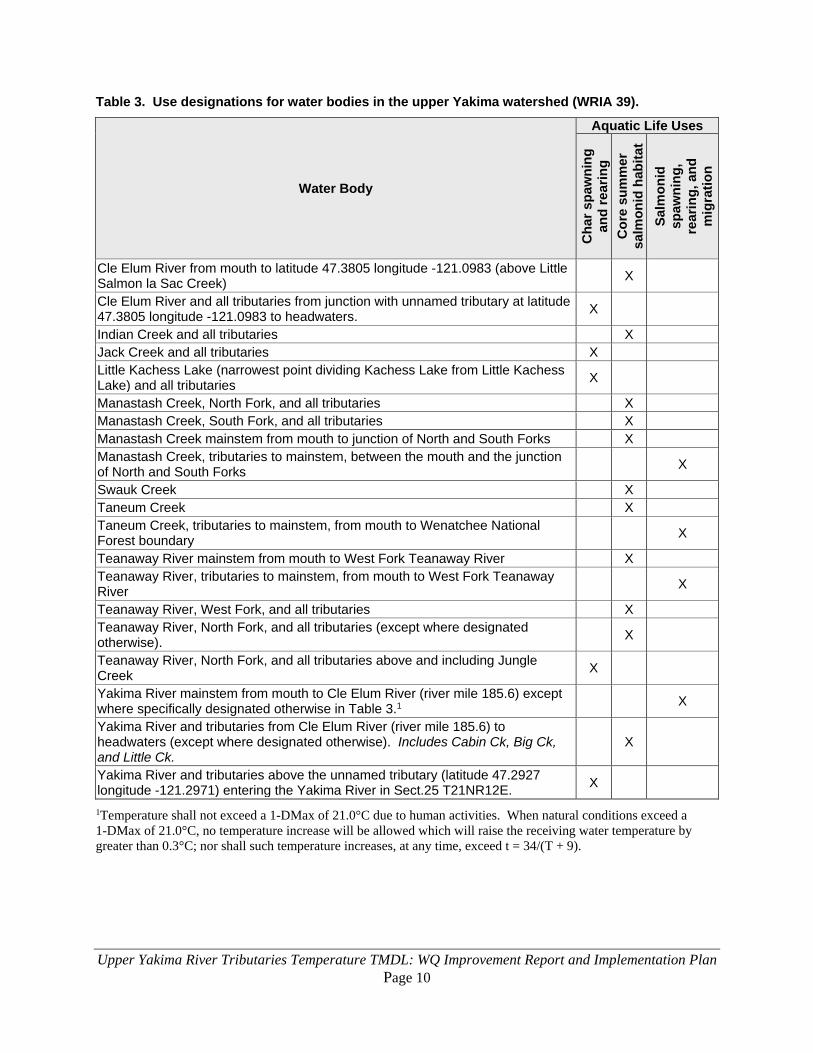
In some waters, special considerations are necessary to protect spawning and incubation of char and salmonid species. Supplemental spawning/incubation criteria have been established for specified time periods to protect these special uses. Figure 2 illustrates where the beneficial and supplemental spawning/incubation uses apply within the upper Yakima River watershed, exclusive of sub-basins downstream of Umtanum Creek. Each beneficial use designation has associated water quality criteria. This TMDLproject addresses the temperature impairments in most tributaries to the upper Yakima River. The following section describes the applicable temperature criteria for the designated uses within the basin. All waters not included in Table 3 are assigned a designated use of salmonid spawning, rearing, and migration (WAC 173-201A-600).
Upper Yakima River Tributaries Temperature TMDL: WQ Improvement Report and Implementation Plan Page 10
Table 3. Use designations for water bodies in the upper Yakima watershed (WRIA 39).
Water Body
Aquatic Life Uses
Cha
r spa
wni
ng
and
rear
ing
Cor
e su
mm
er
salm
onid
hab
itat
Salm
onid
sp
awni
ng,
rear
ing,
and
m
igra
tion
Cle Elum River from mouth to latitude 47.3805 longitude -121.0983 (above Little Salmon la Sac Creek) X
Cle Elum River and all tributaries from junction with unnamed tributary at latitude 47.3805 longitude -121.0983 to headwaters. X
Indian Creek and all tributaries X Jack Creek and all tributaries X Little Kachess Lake (narrowest point dividing Kachess Lake from Little Kachess Lake) and all tributaries X
Manastash Creek, North Fork, and all tributaries X Manastash Creek, South Fork, and all tributaries X Manastash Creek mainstem from mouth to junction of North and South Forks X Manastash Creek, tributaries to mainstem, between the mouth and the junction of North and South Forks X
Swauk Creek X Taneum Creek X Taneum Creek, tributaries to mainstem, from mouth to Wenatchee National Forest boundary X
Teanaway River mainstem from mouth to West Fork Teanaway River X Teanaway River, tributaries to mainstem, from mouth to West Fork Teanaway River X
Teanaway River, West Fork, and all tributaries X Teanaway River, North Fork, and all tributaries (except where designated otherwise). X
Teanaway River, North Fork, and all tributaries above and including Jungle Creek X
Yakima River mainstem from mouth to Cle Elum River (river mile 185.6) except where specifically designated otherwise in Table 3.1 X
Yakima River and tributaries from Cle Elum River (river mile 185.6) to headwaters (except where designated otherwise). Includes Cabin Ck, Big Ck, and Little Ck.
X
Yakima River and tributaries above the unnamed tributary (latitude 47.2927 longitude -121.2971) entering the Yakima River in Sect.25 T21NR12E. X
1Temperature shall not exceed a 1-DMax of 21.0°C due to human activities. When natural conditions exceed a 1-DMax of 21.0°C, no temperature increase will be allowed which will raise the receiving water temperature by greater than 0.3°C; nor shall such temperature increases, at any time, exceed t = 34/(T + 9).

Upper Yakima River Tributaries Temperature TMDL: WQ Improvement Report and Implementation Plan Page 11
Figure 2. Applicable beneficial uses and temperature criteria for the upper Yakima watershed exclusive of sub-basins downstream of Umtanum Creek. Lakes and ponds are shown in black.
Upper Yakima River Tributaries Temperature TMDL: WQ Improvement Report and Implementation Plan Page 12
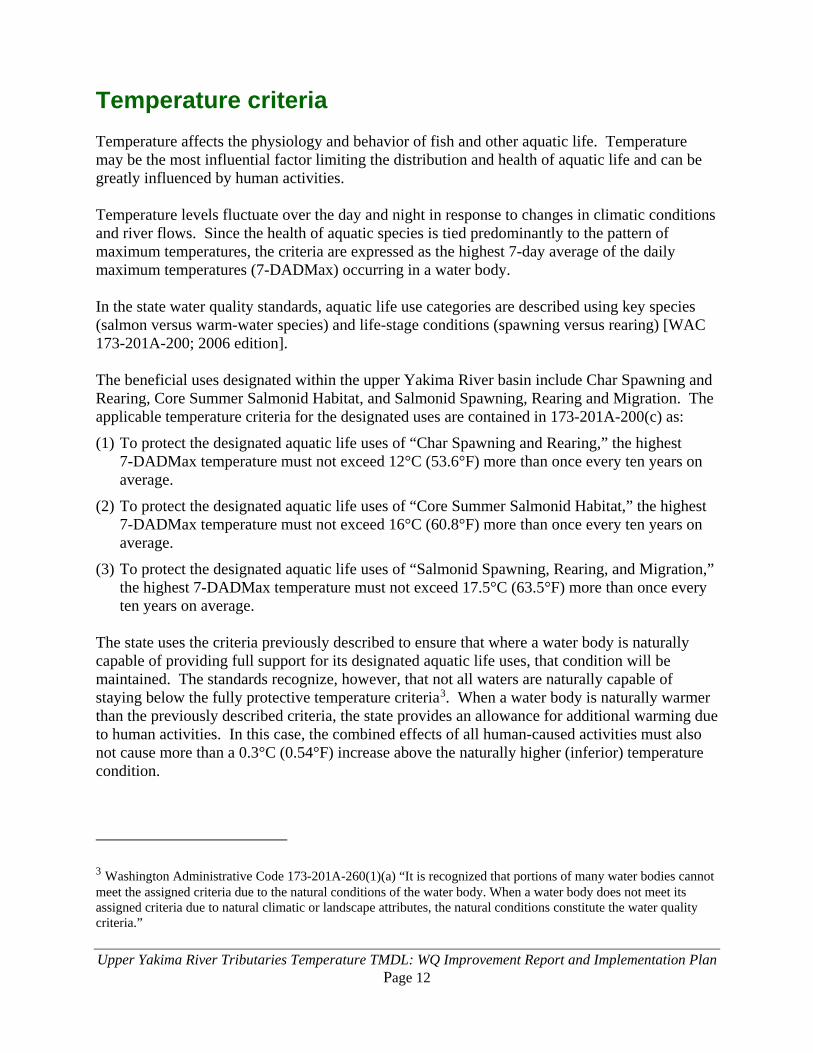
Temperature criteria Temperature affects the physiology and behavior of fish and other aquatic life. Temperature may be the most influential factor limiting the distribution and health of aquatic life and can be greatly influenced by human activities. Temperature levels fluctuate over the day and night in response to changes in climatic conditions and river flows. Since the health of aquatic species is tied predominantly to the pattern of maximum temperatures, the criteria are expressed as the highest 7-day average of the daily maximum temperatures (7-DADMax) occurring in a water body. In the state water quality standards, aquatic life use categories are described using key species (salmon versus warm-water species) and life-stage conditions (spawning versus rearing) [WAC 173-201A-200; 2006 edition]. The beneficial uses designated within the upper Yakima River basin include Char Spawning and Rearing, Core Summer Salmonid Habitat, and Salmonid Spawning, Rearing and Migration. The applicable temperature criteria for the designated uses are contained in 173-201A-200(c) as:
(1) To protect the designated aquatic life uses of “Char Spawning and Rearing,” the highest 7-DADMax temperature must not exceed 12°C (53.6°F) more than once every ten years on average.
(2) To protect the designated aquatic life uses of “Core Summer Salmonid Habitat,” the highest 7-DADMax temperature must not exceed 16°C (60.8°F) more than once every ten years on average.
(3) To protect the designated aquatic life uses of “Salmonid Spawning, Rearing, and Migration,” the highest 7-DADMax temperature must not exceed 17.5°C (63.5°F) more than once every ten years on average.
The state uses the criteria previously described to ensure that where a water body is naturally capable of providing full support for its designated aquatic life uses, that condition will be maintained. The standards recognize, however, that not all waters are naturally capable of staying below the fully protective temperature criteria3. When a water body is naturally warmer than the previously described criteria, the state provides an allowance for additional warming due to human activities. In this case, the combined effects of all human-caused activities must also not cause more than a 0.3°C (0.54°F) increase above the naturally higher (inferior) temperature condition.
3 Washington Administrative Code 173-201A-260(1)(a) “It is recognized that portions of many water bodies cannot meet the assigned criteria due to the natural conditions of the water body. When a water body does not meet its assigned criteria due to natural climatic or landscape attributes, the natural conditions constitute the water quality criteria.”
Upper Yakima River Tributaries Temperature TMDL: WQ Improvement Report and Implementation Plan Page 13
In addition to the maximum criteria previously noted, compliance must also be assessed against criteria that limit the incremental amount of warming of otherwise cool waters due to human activities. When water is cooler than the criteria noted previously, the allowable rate of warming up to, but not exceeding, the numeric criteria from human actions is restricted to: (1) incremental temperature increases resulting from individual point source activities must not, at any time, exceed 28/T+7 as measured at the edge of a mixing zone boundary (where “T” represents the background temperature as measured at a point or points unaffected by the discharge), and (2) incremental temperature increases resulting from the combined effect of all nonpoint source activities in the water body must not at any time exceed 2.8°C (5.04°F). Special consideration is also required to protect spawning and incubation of salmonid species. Where Ecology determines the temperature criteria established for a water body would likely not result in protective spawning and incubation temperatures, the following criteria apply: (1) Maximum 7-DADMax temperatures of 9°C (48.2°F) at the initiation of spawning and at fry emergence for char; and (2) Maximum 7-DADMax temperatures of 13°C (55.4°F) at the initiation of spawning for salmon and at fry emergence for salmon and trout. Figure 2 illustrates the applicable beneficial uses, supplemental spawning/incubation criteria, and associated temperature criteria for all water bodies within the upper Yakima River watershed, exclusive of sub-basins downstream of Umtanum Creek.
Global climate change Changes in climate are expected to affect both water quantity and quality in the Pacific Northwest (Casola et al., 2005). Summer streamflows depend on the snowpack stored during the wet season. Studies of the region’s hydrology indicate a declining tendency in snow water storage coupled with earlier spring snowmelt and earlier peak spring streamflows (Hamlet et al., 2005). Factors affecting these changes include climate influences at both annual and decadal scales, and air temperature increases. Increases in air temperatures result in more precipitation falling as rain rather than snow and earlier melting of the winter snowpack. Ten climate change models were used to predict the average rate of climatic warming in the Pacific Northwest (Mote et al., 2005). The average warming rate is expected to be in the range of 0.1-0.6°C (0.2-1.0°F) per decade, with a best estimate of 0.3°C (0.5°F) (Mote et al., 2005). Eight of the ten models predicted proportionately higher summer temperatures, with three indicating summer temperature increases at least two times higher than winter increases. Summer streamflows are also predicted to decrease as a consequence of global climate change (Hamlet and Lettenmaier, 1999). The expected changes coming to our region’s climate highlight the importance of protecting and restoring the mechanisms that help keep stream temperatures cool. Stream temperature improvements obtained by growing mature riparian vegetation corridors along stream banks, reducing channel widths, and enhancing summer baseflows may all help offset the changes expected from global climate change – keeping conditions from getting worse. It will take considerable time, however, to reverse those human actions that contribute to excess stream warming. The sooner such restoration actions begin and the more complete they are, the more effective we will be in offsetting some of the detrimental effects on our stream resources.

Upper Yakima River Tributaries Temperature TMDL: WQ Improvement Report and Implementation Plan Page 14
These efforts may not cause streams to meet the state’s numeric temperature criteria everywhere or in all years. However, they will maximize the extent and frequency of healthy temperature conditions, creating long-term and crucial benefits for fish and other aquatic species. As global climate change progresses, the thermal regime of the stream itself will change due to reduced summer streamflows and increased air temperatures. The state is writing this TMDL to meet the state’s water quality standards, which are based on current and historic patterns of climate. Changes in stream temperature associated with global climate change may require further modifications to the human-source allocations at some time in the future. However, the best way to preserve our aquatic resources and to minimize future disturbance to human industry would be to begin now to protect as much of the thermal health of our streams as possible. Citations related to climate change Casola, J.H., J.E. Kay, A.K. Snover, R.A. Norheim, L.C. Whitely Binder, and the Climate Impacts Group. Climate Impacts on Washington’s Hydropower, Water Supply, Forests, Fish, and Agriculture. A report prepared for King County (Washington) by the Climate Impacts Group (Center for Science in the Earth System, Joint Institute for the Study of the Atmosphere and Ocean, University of Washington, Seattle). Hamlet A.F. and D.P. Lettenmaier, 1999. Effects of climate change on hydrology and water resources in the Columbia River Basin. Journal of the American Water Resources Association, 35(6):1597- 1623. Hamlet, A.F., P.W. Mote, M. Clark, and D.P. Lettenmaier, 2005. Effects of temperature and precipitation variability on snowpack trends in the western U.S. Journal of Climate, 18 (21): 4545-4561. Mote, P.W., E. Salathé, and C. Peacock, 2005. Scenarios of future climate for the Pacific Northwest, Climate Impacts Group, University of Washington, Seattle, WA. 13 pp.
Upper Yakima River Tributaries Temperature TMDL: WQ Improvement Report and Implementation Plan Page 15
Watershed Description The upper Yakima River watershed (or basin) is located on the eastern flank of the Cascade Mountains in central to southern Washington. The upper Yakima Basin drains 1,662 mi2 (4,305 km2) from the headwaters to the downstream boundary at Umtanum Creek. Upper Yakima Basin streams fall within four ecoregions: North Cascades, Cascades, East Cascade Slopes and Foothills, and Columbia Plateau (Figure 1). The Yakima River and its upper tributaries have their headwaters at glaciers and snowfields near the 5,000 –7,000-foot crest of the Cascade Mountains (Pearson, 1985). The northern and western parts of the study area are covered in mountainous terrain. The northeastern and southwestern parts of the study area are dominated by mid-elevation foothills. Most of the population of the upper Yakima Basin lives in the Kittitas Valley, a broad lowland occupying the southeastern portion of the basin. The Kittitas Valley is dominated by agricultural, residential, and urban land uses. The climate of the upper Yakima basin varies greatly. Areas along the Cascade crest receive more than 100 inches of precipitation per year, while the eastern edge of the TMDL area receives less than 10 inches of precipitation per year. The TMDL study area falls into two main geological provinces: the Cascade Mountains in the northwestern part, and the Columbia Plateau in the southeastern part. The Cascade Mountains part is formed by sedimentary, volcanic, and metamorphic rocks. The Columbia Plateau part is formed by thick basalt lava flows, which have been folded into long anticlinal ridges and synclinal troughs. Many of the troughs are partly filled with younger sedimentary deposits (Kinnison and Sceva, 1963).
TMDL area The streams included in this TMDL project area are: (1) perennial tributaries to the upper Yakima River (with certain exceptions noted below) or: (2) perennial tributaries to the three reservoirs in the upper Yakima watershed (Lake Cle Elum, Keechelus Lake, Kachess Lake). (Figure 1 and Table 1). The southernmost tributary included in this TMDL is Umtanum Creek. The following waters are not included in this TMDL project area: the mainstem Yakima River, lower Kachess River, lower Cle Elum River, and the lower reaches of several creeks in the lower Kittitas Valley. Temperature violations in the Teanaway River were addressed by a previous TMDL study (Stohr and Leskie, 2000; Irle, 2001; and Creech, 2003) and are therefore also not included in this TMDL project area. In a number of streams that flow into the lower Kittitas Valley, the upstream portion of the stream is included in this TMDL project, but the downstream portion is not. System potential temperatures cannot be calculated for lowland streams in the Kittitas Valley within the scope of this study, due to the complexity of irrigation water management and the effects of
Upper Yakima River Tributaries Temperature TMDL: WQ Improvement Report and Implementation Plan Page 16
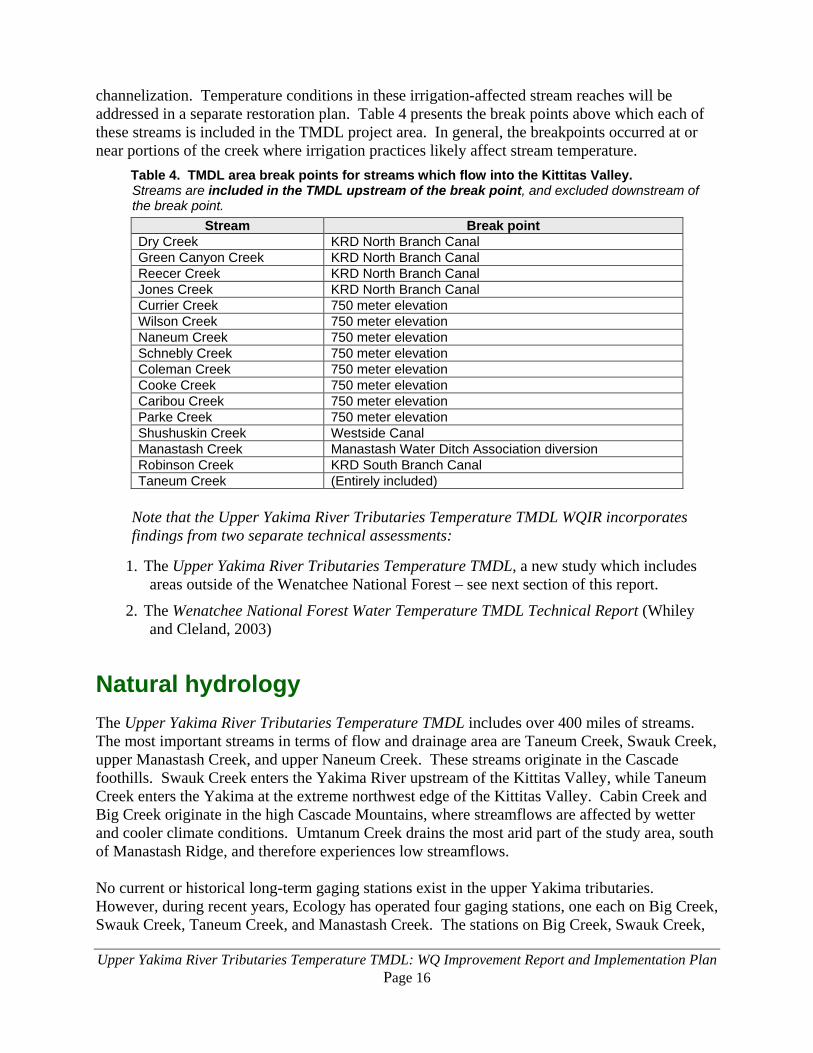
channelization. Temperature conditions in these irrigation-affected stream reaches will be addressed in a separate restoration plan. Table 4 presents the break points above which each of these streams is included in the TMDL project area. In general, the breakpoints occurred at or near portions of the creek where irrigation practices likely affect stream temperature.
Table 4. TMDL area break points for streams which flow into the Kittitas Valley. Streams are included in the TMDL upstream of the break point, and excluded downstream of the break point.
Stream Break point Dry Creek KRD North Branch Canal Green Canyon Creek KRD North Branch Canal Reecer Creek KRD North Branch Canal Jones Creek KRD North Branch Canal Currier Creek 750 meter elevation Wilson Creek 750 meter elevation Naneum Creek 750 meter elevation Schnebly Creek 750 meter elevation Coleman Creek 750 meter elevation Cooke Creek 750 meter elevation Caribou Creek 750 meter elevation Parke Creek 750 meter elevation Shushuskin Creek Westside Canal Manastash Creek Manastash Water Ditch Association diversion Robinson Creek KRD South Branch Canal Taneum Creek (Entirely included)
Note that the Upper Yakima River Tributaries Temperature TMDL WQIR incorporates findings from two separate technical assessments:
1. The Upper Yakima River Tributaries Temperature TMDL, a new study which includes areas outside of the Wenatchee National Forest – see next section of this report.
2. The Wenatchee National Forest Water Temperature TMDL Technical Report (Whiley and Cleland, 2003)
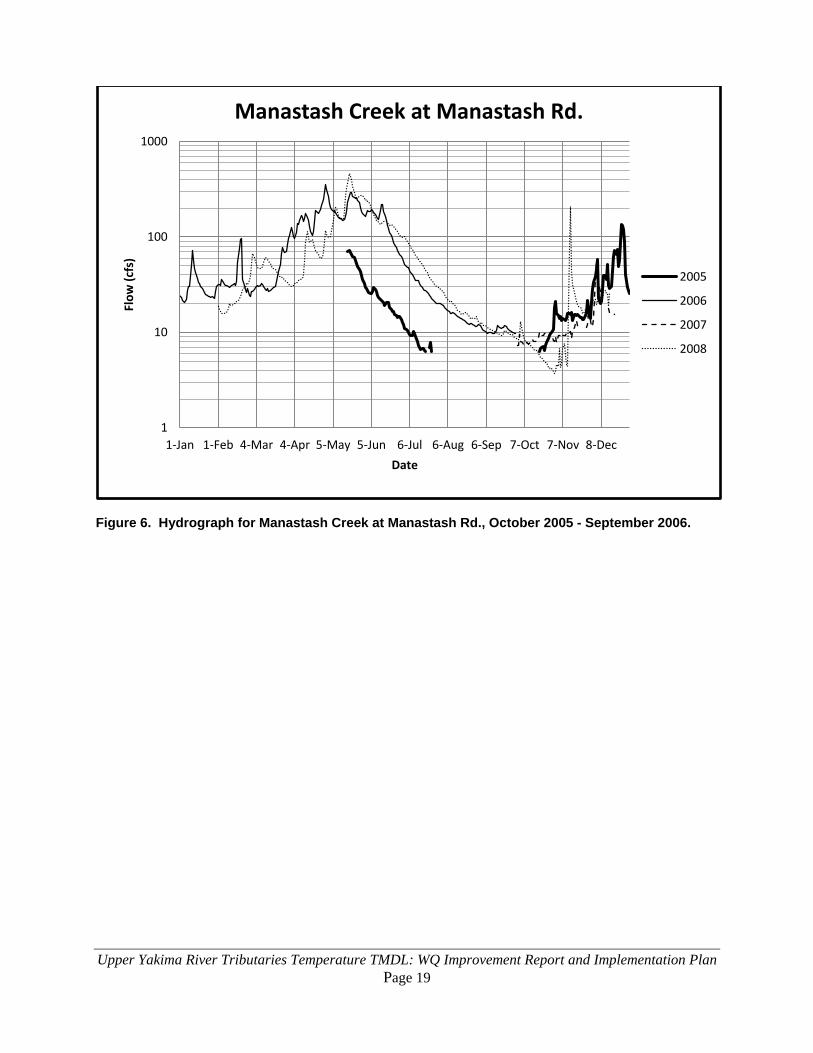
Natural hydrology The Upper Yakima River Tributaries Temperature TMDL includes over 400 miles of streams. The most important streams in terms of flow and drainage area are Taneum Creek, Swauk Creek, upper Manastash Creek, and upper Naneum Creek. These streams originate in the Cascade foothills. Swauk Creek enters the Yakima River upstream of the Kittitas Valley, while Taneum Creek enters the Yakima at the extreme northwest edge of the Kittitas Valley. Cabin Creek and Big Creek originate in the high Cascade Mountains, where streamflows are affected by wetter and cooler climate conditions. Umtanum Creek drains the most arid part of the study area, south of Manastash Ridge, and therefore experiences low streamflows. No current or historical long-term gaging stations exist in the upper Yakima tributaries. However, during recent years, Ecology has operated four gaging stations, one each on Big Creek, Swauk Creek, Taneum Creek, and Manastash Creek. The stations on Big Creek, Swauk Creek,
Upper Yakima River Tributaries Temperature TMDL: WQ Improvement Report and Implementation Plan Page 17
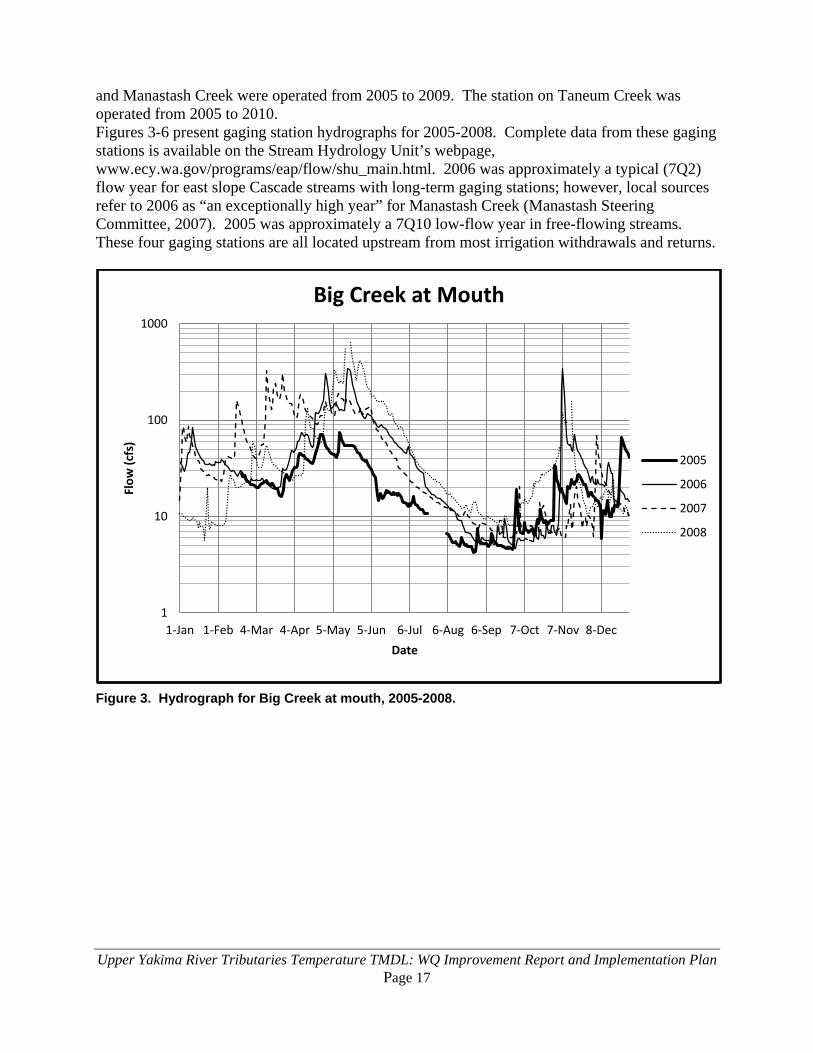
and Manastash Creek were operated from 2005 to 2009. The station on Taneum Creek was operated from 2005 to 2010. Figures 3-6 present gaging station hydrographs for 2005-2008. Complete data from these gaging stations is available on the Stream Hydrology Unit’s webpage, www.ecy.wa.gov/programs/eap/flow/shu_main.html. 2006 was approximately a typical (7Q2) flow year for east slope Cascade streams with long-term gaging stations; however, local sources refer to 2006 as “an exceptionally high year” for Manastash Creek (Manastash Steering Committee, 2007). 2005 was approximately a 7Q10 low-flow year in free-flowing streams. These four gaging stations are all located upstream from most irrigation withdrawals and returns.
Figure 3. Hydrograph for Big Creek at mouth, 2005-2008.
1
10
100
1000
1-Jan 1-Feb 4-Mar 4-Apr 5-May 5-Jun 6-Jul 6-Aug 6-Sep 7-Oct 7-Nov 8-Dec
Flow
(cfs
)
Date
Big Creek at Mouth
2005
2006
2007
2008

Upper Yakima River Tributaries Temperature TMDL: WQ Improvement Report and Implementation Plan Page 18
Figure 4. Hydrograph for Swauk Creek at Lauderdale Jct., 2005-2008.
Figure 5. Hydrograph for Taneum Creek at Brain Ranch, 2005-2008.
0.1
1
10
100
1000
1-Jan 1-Feb 4-Mar 4-Apr 5-May 5-Jun 6-Jul 6-Aug 6-Sep 7-Oct 7-Nov 8-Dec
Flow
(cfs
)
Date
Swauk Creek at Lauderdale Jct.
2005
2006
2007
2008
1
10
100
1000
1-Jan 1-Feb 4-Mar 4-Apr 5-May 5-Jun 6-Jul 6-Aug 6-Sep 7-Oct 7-Nov 8-Dec
Flow
(cfs
)
Date
Taneum Creek at Brain Ranch
2005
2006
2007
2008
Upper Yakima River Tributaries Temperature TMDL: WQ Improvement Report and Implementation Plan Page 19
Figure 6. Hydrograph for Manastash Creek at Manastash Rd., October 2005 - September 2006.
1
10
100
1000
1-Jan 1-Feb 4-Mar 4-Apr 5-May 5-Jun 6-Jul 6-Aug 6-Sep 7-Oct 7-Nov 8-Dec
Flow
(cfs
)
Date
Manastash Creek at Manastash Rd.
2005
2006
2007
2008
Upper Yakima River Tributaries Temperature TMDL: WQ Improvement Report and Implementation Plan Page 20
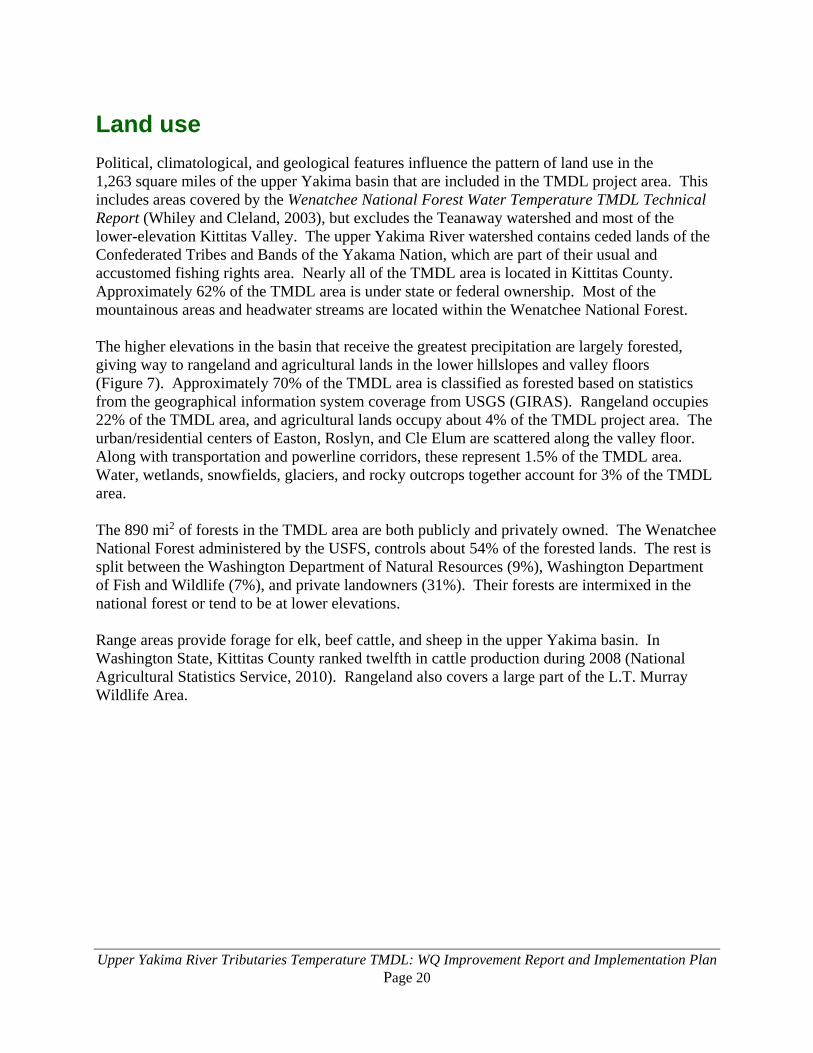
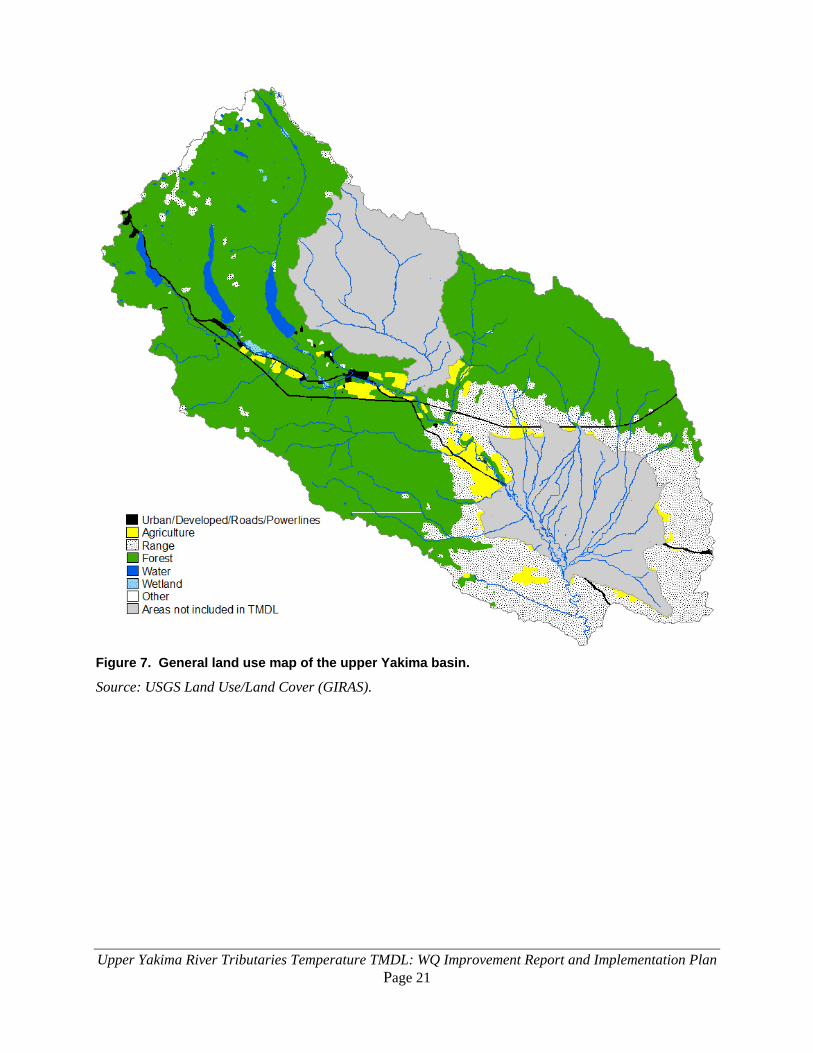
Land use Political, climatological, and geological features influence the pattern of land use in the 1,263 square miles of the upper Yakima basin that are included in the TMDL project area. This includes areas covered by the Wenatchee National Forest Water Temperature TMDL Technical Report (Whiley and Cleland, 2003), but excludes the Teanaway watershed and most of the lower-elevation Kittitas Valley. The upper Yakima River watershed contains ceded lands of the Confederated Tribes and Bands of the Yakama Nation, which are part of their usual and accustomed fishing rights area. Nearly all of the TMDL area is located in Kittitas County. Approximately 62% of the TMDL area is under state or federal ownership. Most of the mountainous areas and headwater streams are located within the Wenatchee National Forest. The higher elevations in the basin that receive the greatest precipitation are largely forested, giving way to rangeland and agricultural lands in the lower hillslopes and valley floors (Figure 7). Approximately 70% of the TMDL area is classified as forested based on statistics from the geographical information system coverage from USGS (GIRAS). Rangeland occupies 22% of the TMDL area, and agricultural lands occupy about 4% of the TMDL project area. The urban/residential centers of Easton, Roslyn, and Cle Elum are scattered along the valley floor. Along with transportation and powerline corridors, these represent 1.5% of the TMDL area. Water, wetlands, snowfields, glaciers, and rocky outcrops together account for 3% of the TMDL area. The 890 mi2 of forests in the TMDL area are both publicly and privately owned. The Wenatchee National Forest administered by the USFS, controls about 54% of the forested lands. The rest is split between the Washington Department of Natural Resources (9%), Washington Department of Fish and Wildlife (7%), and private landowners (31%). Their forests are intermixed in the national forest or tend to be at lower elevations. Range areas provide forage for elk, beef cattle, and sheep in the upper Yakima basin. In Washington State, Kittitas County ranked twelfth in cattle production during 2008 (National Agricultural Statistics Service, 2010). Rangeland also covers a large part of the L.T. Murray Wildlife Area.
Upper Yakima River Tributaries Temperature TMDL: WQ Improvement Report and Implementation Plan Page 21
Figure 7. General land use map of the upper Yakima basin.
Source: USGS Land Use/Land Cover (GIRAS).
Upper Yakima River Tributaries Temperature TMDL: WQ Improvement Report and Implementation Plan Page 22
Water resource issues The transport and distribution of water for agricultural irrigation is a complex and important factor affecting water temperatures in the upper Yakima watershed. Between 1903 and 1933, three major lakes: Kachess, Keechelus, and Cle Elum, were converted to reservoirs. They are managed by the USBR to store much of the mountain runoff for managed flood control and irrigation releases. A network of supply canals, diversions, and irrigation return drains are located all along the upper Yakima River watershed. In the Kittitas Valley, the hydrology of the lower reaches of many creeks is strongly affected by a complex system of irrigation and agricultural activities. Numerous adjudicated withdrawal rights exist throughout the valley, affecting all perennial streams. Conversely, irrigation activities can also augment streamflows, albeit usually with water that originated in the Yakima River. Irrigation canals often add water to creeks for delivery to downstream customers or through operational spills. Irrigation returns send excess water back to creeks. Irrigation activities can raise or lower water temperatures:
• Operational spills from canals often cool creek water as well as augmenting streamflow.
• Surface irrigation return flows can sometimes help lower water temperatures by augmenting streamflow. However, irrigation return flows typically raise water temperatures in receiving waters because returning water, after flowing across fields, is usually warmer than the water already in the creek.
• Irrigation may augment subsurface flow, which in turn may add cooling water to streams.
• Irrigation withdrawals do not cause an instant change to stream temperatures, but tend to result in warmer water further downstream because of reduced in-stream flows and the addition of irrigation return flows.
Wells for domestic, agricultural, and other uses also have the potential to impact stream temperatures by altering streamflows. This is true only in cases where wells tap aquifers that are hydraulically linked to streams. This report does not attempt to analyze this effect. The CWA does not authorize Ecology to require any changes to water resource use in a TMDL report. Nevertheless, water conveyance and application practices can have a substantial impact on stream temperatures.
Sources of pollution Both point sources and nonpoint sources of thermal pollution are present in the upper Yakima tributaries. Of the two, nonpoint sources are the most important and wide-reaching, impacting most streams throughout the TMDL area, particularly in the Kittitas Valley.

Upper Yakima River Tributaries Temperature TMDL: WQ Improvement Report and Implementation Plan Page 23
Nonpoint sources Nonpoint sources are pollutant loads that typically cannot be attributed to a single point of discharge, but they are the diffuse accumulation of pollutant loads over a given area. Contributing factors to stream heating loads include: 1. Riparian vegetation disturbance and loss of shade due to:
• Removal of trees and shrubs for pasture, crops, timber harvest, roads, or buildings. • Heavy grazing by livestock and wild animals. • Alteration of the local hydrograph4 to such an extent that riparian vegetation cannot
complete its life history requirements. 2. Channel morphology5 impacts resulting from:
• Increased sediment loading from agriculture and roads, resulting in increased width:depth ratios in creeks.
• Channel constraint/diking for agriculture, flood control, and roads. • Bank instability/erosion and sedimentation from removal of established riparian
vegetation, and high stream velocities from past channel straightening projects and other land-use practices in the watershed.
• Altered sediment/energy regimes that result in channel incision or aggradation. 3. Hydrologic changes influenced by:
• Extraction and return of groundwater or surface water. • Altered streamflow patterns resulting from timber harvest, agriculture, and other
activities, which cause increased spring runoff and decreased summer baseflows. • Global climate change and its regional effects on overall water quantity (snow pack) as
well as the timing and magnitude of the spring freshet. • Altered sediment/energy regimes that result in channel incision or aggradation.
The role of riparian vegetation in maintaining a healthy stream condition and water quality is well documented and accepted in the scientific literature. Summer stream temperature increases due to the removal of riparian vegetation are well documented (for example, Holtby, 1988; Lynch et al., 1984, 1985; Rishel et al., 1982; Patric, 1980; Swift and Messer, 1971; Brown et al., 1971; Levno and Rothacher, 1967; and Hewlett and Fortson, 1983). These studies generally support the findings of Brown and Krygier (1970) that loss of riparian vegetation results in larger daily temperature variations and elevated monthly and annual temperatures. Adams and Sullivan (1989) also concluded that daily maximum temperatures are strongly influenced by the removal of riparian vegetation because of the effect of diurnal fluctuation in solar heat flux.
4 A hydrograph is a graph showing the rate of stream flow versus time, as it flows past a specific point in the stream. 5 In this case, channel morphology refers to the shape and dimensions of the cross-section of a stream channel.
Upper Yakima River Tributaries Temperature TMDL: WQ Improvement Report and Implementation Plan Page 24
The warming of water temperatures as a stream flows downstream can be a natural process. However, the rates of heating can be dramatically reduced when high levels of shade exist and heat flux from solar radiation is minimized. Riparian vegetation restoration was identified as one of the most important management steps that may improve stream temperatures (Johnson and Jones, 2000; Blann et al., 2002). The overriding justification for increases in shade from riparian vegetation is to minimize the contribution of solar heat flux in stream heating. There is a natural maximum level of shade that a given stream is capable of attaining, and the importance of shade decreases as the width of a stream increases. Riparian vegetation may act as an efficient insulating barrier, where the vegetation influences heat exchange rates with the atmosphere and the surrounding environment. Riparian vegetation may also cause changes in microclimatic conditions by decreasing air temperature, ground temperatures, and wind speeds and by increasing relative humidity. It also plays an important role in bank stability and channel morphology. As the river enlarges and widens, riparian vegetation’s influence on stream temperatures lessens (Poole and Berman, 2000). The distinction between reduced heating of streams and actual cooling is important. Shade can significantly reduce the amount of heat flux that enters a stream. Whether there is a reduction in the amount of warming of the stream, maintenance of inflowing temperatures, or cooling of a stream as it flows downstream, depends on the balance of all of the heat exchange and mass transfer processes in the stream.
Point sources There are currently no point source dischargers in the upper Yakima tributaries, and there are no specifically assigned wasteload allocations (WLAs). Ecology has developed a reserve WLA to allow for future growth within the TMDL project area.
Upper Yakima River Tributaries Temperature TMDL: WQ Improvement Report and Implementation Plan Page 25
Upper Yakima Tributaries Temperature TMDL Study
Beginning in 2005, the Environmental Assessment Program (EAP) of Ecology conducted a TMDL technical assessment study to address the 303(d) listings for temperature in the upper Yakima River watershed outside of the Wenatchee National Forest. This section describes the EAP study and presents its findings. Although the study included some data collection in the lower Kittitas Valley, those data are not presented here, because that area is not included in the Upper Yakima River Tributaries Temperature TMDL. All data collected during the 2005-2006 EAP study, including the lower Kittitas Valley, are collected in a data summary which can be downloaded separately. The data summary also includes a quality assurance evaluation of all data collected during the study.
Goals and objectives Project goals The goal of this study is to address temperature problems in the upper Yakima River tributaries so that state water quality standards are met and beneficial uses restored. Rather than completing an exhaustive data collection and modeling exercise for all streams in the study area, this TMDL focuses principally on Taneum and Naneum Creeks. We then judiciously apply the study results from Taneum and Naneum Creeks to other streams in the study area, while accounting for the unique characteristics of each stream.
Study objectives Objectives of the study were as follows:
• Characterize June-September stream temperatures in the upper Yakima River tributaries by compiling existing data and collecting additional data in cooperation with other organizations. Collect temperature data at a high density of sites along Taneum and Naneum Creeks. Collect temperature at a few sites each on other important study area streams.
• Characterize vegetation, flow, channel characteristics, and related variables to support modeling of Naneum and Taneum Creeks.
• Develop a predictive computer temperature model using QUAL2Kw for Taneum Creek and Naneum Creek, focusing on the instream temperature regime at critical conditions.
• Apply model results from Taneum and Naneum Creeks, along with available data, to evaluate the ability of various watershed best management practices (BMPs) to reduce water temperature to meet state water quality standards throughout the entire TMDL study area.
• Establish a TMDL for temperature in the upper Yakima River tributaries.

Upper Yakima River Tributaries Temperature TMDL: WQ Improvement Report and Implementation Plan Page 26
• For ease of implementation, report load allocations in terms of surrogates for solar radiation such as shade, size of tree necessary in the riparian zone to produce adequate shade, channel width, or miles of active eroding streambanks.
• Address all tributary water bodies to the Yakima River, from and including the confluence with Umtanum Creek to the headwaters, excluding the Teanaway watershed and the lower reaches of the lower Kittitas Valley creeks.
TMDL analyses Study methods Water temperature data A network of continuous temperature data loggers was installed in the tributary streams of the upper Yakima River by Ecology as described by Bilhimer and Stohr (2009). A complementary network of data loggers was installed primarily in the irrigated portions of the Kittitas Valley by the Kittitas Reclamation District. Further data were obtained from data loggers installed by the USFS (Figures 8 and 9).
Streamflow data Ecology’s Stream Hydrology Unit operated four continuous flow measurement stations in the study area during 2005 and 2006. The Ecology stations on Swauk and Big Creeks recorded stage height continuously from February 2005 through the end of the study period. Those on Manastash and Taneum Creeks did so from May 2005 through the end of the study period. Instantaneous flow measurements were taken monthly, (1) throughout the study period at continuous flow measurement stations and, (2) from June-October 2005, and June-August 2006, at Ecology temperature monitoring stations. Instantaneous flow measurements were also taken along the length of Naneum and Taneum Creeks during three synoptic flow surveys (described in the following groundwater section). Locations where flow measurements were taken are shown in Figure 10. The U.S. Geological Survey (USGS) does not currently operate any flow monitoring stations in the study area. The USGS historically gaged two locations, Naneum Creek near Ellensburg (12483800), and Wilson Creek near Ellensburg (12483600). These sites are located about 10 miles north of Ellensburg, near the bottom of Naneum Canyon. Additional sites were gaged for only a few years each, near the beginning of the 20th century. The Kittitas Reclamation District (www.fairpoint.net/~krd/images/gage_stations.gif) collects flow data in the basin, primarily in irrigation works. The USBR (www.usbr.gov/pn/hydromet/yakima/yaktea.html) and the USGS collect flow data at several points along the mainstem Yakima River, the Kachess River, the Cle Elum River, and the Teanaway River.

Upper Yakima River Tributaries Temperature TMDL: WQ Improvement Report and Implementation Plan Page 27
Figure 8. Locations and station IDs of temperature monitoring stations in the upper Yakima tributaries during 2005.
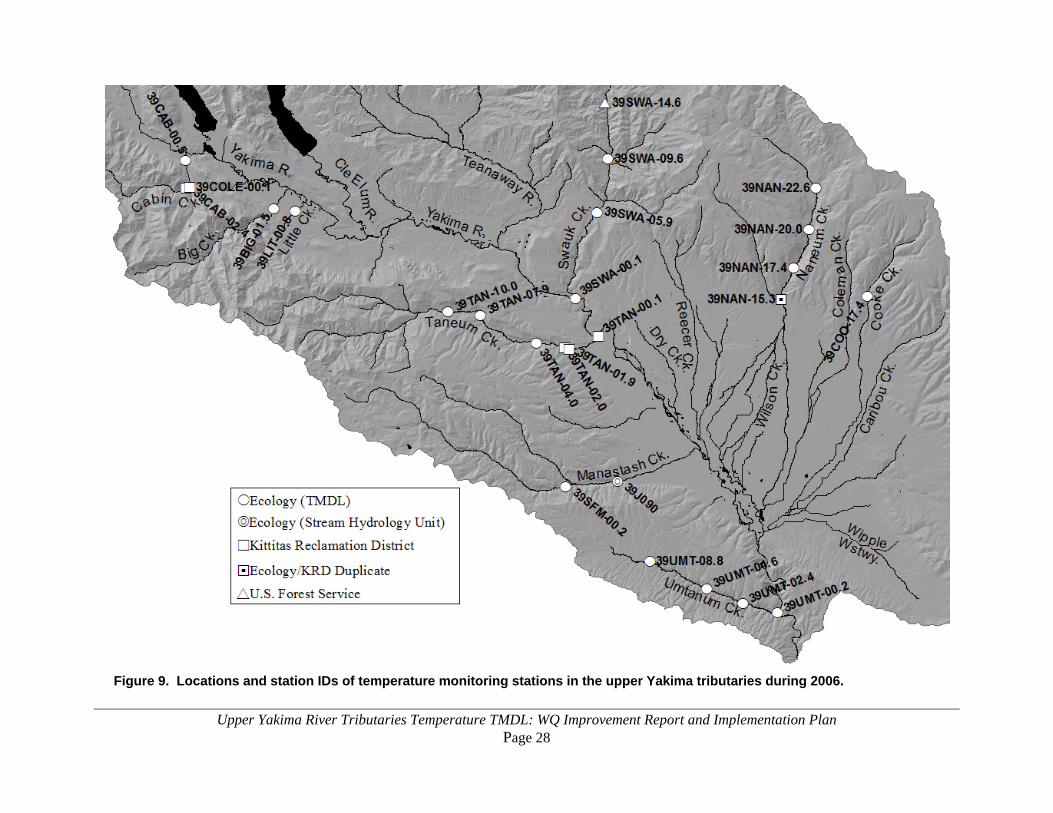
Upper Yakima River Tributaries Temperature TMDL: WQ Improvement Report and Implementation Plan Page 28
Figure 9. Locations and station IDs of temperature monitoring stations in the upper Yakima tributaries during 2006.

Upper Yakima River Tributaries Temperature TMDL: WQ Improvement Report and Implementation Plan Page 29
Figure 10. Locations and station IDs of gaging stations and sites where instantaneous flow measurements were taken.
Upper Yakima River Tributaries Temperature TMDL: WQ Improvement Report and Implementation Plan Page 30
Groundwater data Synoptic flow surveys (seepage runs) were performed on July 12-14, 2005, August 2-4, 2005, and July 24-27, 2006, to assist in determining the influence of groundwater in the basin and developing water balance for the low flow season. These surveys consisted of measuring instantaneous flow along the length of Naneum and Taneum Creeks. Flows were measured at a variety of other locations as well during the July 2005 and July 2006 surveys. In addition, a network of instream piezometers was operated during 2005 and 2006. Vertical hydraulic gradients at each piezometer were measured monthly from June through October both years. Because of the extreme complexity of irrigation withdrawals and returns operating in the upper Yakima basin, it was not always possible to determine reaches that gain and lose groundwater. Where possible, flow and groundwater data were used together to make this determination. Groundwater temperatures were determined by a network of temperature thermistors installed inside piezometers. Piezometers that had a positive vertical hydraulic gradient were used to represent groundwater. A positive hydraulic gradient means that in these locations the stream was gaining flow from groundwater. The temperature recorded by the bottom thermistor (located between 2 and 4.5 feet below the streambed) in these piezometers was used as a measurement of groundwater temperature.
Hydraulic geometry The channel width, depth, and velocity, have an important influence on the sensitivity of water temperature to the flux of heat. Stream surveys were completed at all temperature monitoring and synoptic flow locations on Naneum and Taneum Creeks during the low flow period in 2005. At Naneum Creek sites upstream of the end of Naneum Road and at all Taneum Creek sites, ten cross sections were established, beginning at the monitoring station and then moving upstream at 100-foot intervals. At sites on Naneum Creek downstream of the end of Naneum Road, only one cross section was completed at each monitoring station because of a lack of access to private property. At each cross section, the wetted width, bankfull width, width of the near-stream disturbance zone, channel incision, and bankfull depth, were recorded. Time-of-travel studies using rhodamine, a fluorescent, non-toxic dye, were conducted on Naneum and Taneum Creeks twice each during 2005, once during July 12-15, and once during August 2-5. Each stream was broken into reaches of 2-4 miles, typically between temperature monitoring stations. At the upper end of each stream, a slug of dye was added. A Hydrolab® Datasonde® equipped with a rhodamine sensor was deployed at the lower end of each reach. The travel time of each reach was calculated as the time required for the peak dye concentration to travel from the upstream end to the downstream end of that reach. The average velocity of the reach was calculated as the length of the reach divided by the travel time.
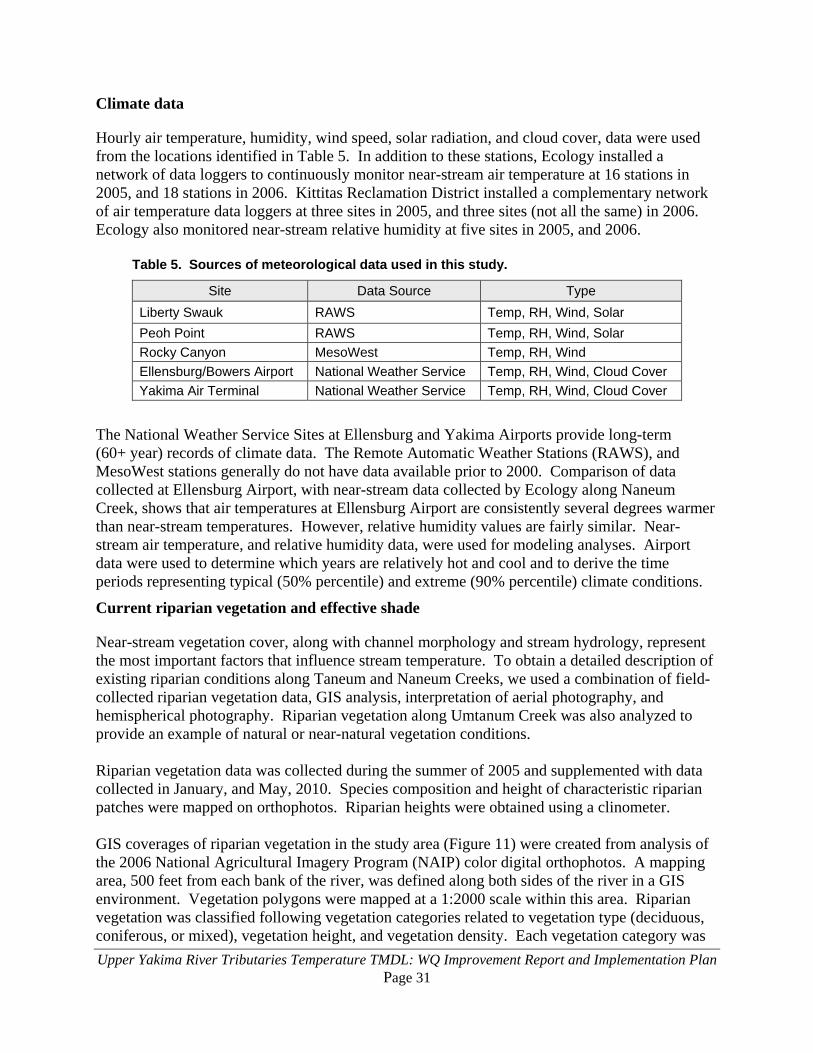
Upper Yakima River Tributaries Temperature TMDL: WQ Improvement Report and Implementation Plan Page 31
Climate data
Hourly air temperature, humidity, wind speed, solar radiation, and cloud cover, data were used from the locations identified in Table 5. In addition to these stations, Ecology installed a network of data loggers to continuously monitor near-stream air temperature at 16 stations in 2005, and 18 stations in 2006. Kittitas Reclamation District installed a complementary network of air temperature data loggers at three sites in 2005, and three sites (not all the same) in 2006. Ecology also monitored near-stream relative humidity at five sites in 2005, and 2006.
Table 5. Sources of meteorological data used in this study.
Site Data Source Type Liberty Swauk RAWS Temp, RH, Wind, Solar Peoh Point RAWS Temp, RH, Wind, Solar Rocky Canyon MesoWest Temp, RH, Wind Ellensburg/Bowers Airport National Weather Service Temp, RH, Wind, Cloud Cover Yakima Air Terminal National Weather Service Temp, RH, Wind, Cloud Cover
The National Weather Service Sites at Ellensburg and Yakima Airports provide long-term (60+ year) records of climate data. The Remote Automatic Weather Stations (RAWS), and MesoWest stations generally do not have data available prior to 2000. Comparison of data collected at Ellensburg Airport, with near-stream data collected by Ecology along Naneum Creek, shows that air temperatures at Ellensburg Airport are consistently several degrees warmer than near-stream temperatures. However, relative humidity values are fairly similar. Near-stream air temperature, and relative humidity data, were used for modeling analyses. Airport data were used to determine which years are relatively hot and cool and to derive the time periods representing typical (50% percentile) and extreme (90% percentile) climate conditions.
Current riparian vegetation and effective shade
Near-stream vegetation cover, along with channel morphology and stream hydrology, represent the most important factors that influence stream temperature. To obtain a detailed description of existing riparian conditions along Taneum and Naneum Creeks, we used a combination of field-collected riparian vegetation data, GIS analysis, interpretation of aerial photography, and hemispherical photography. Riparian vegetation along Umtanum Creek was also analyzed to provide an example of natural or near-natural vegetation conditions. Riparian vegetation data was collected during the summer of 2005 and supplemented with data collected in January, and May, 2010. Species composition and height of characteristic riparian patches were mapped on orthophotos. Riparian heights were obtained using a clinometer. GIS coverages of riparian vegetation in the study area (Figure 11) were created from analysis of the 2006 National Agricultural Imagery Program (NAIP) color digital orthophotos. A mapping area, 500 feet from each bank of the river, was defined along both sides of the river in a GIS environment. Vegetation polygons were mapped at a 1:2000 scale within this area. Riparian vegetation was classified following vegetation categories related to vegetation type (deciduous, coniferous, or mixed), vegetation height, and vegetation density. Each vegetation category was
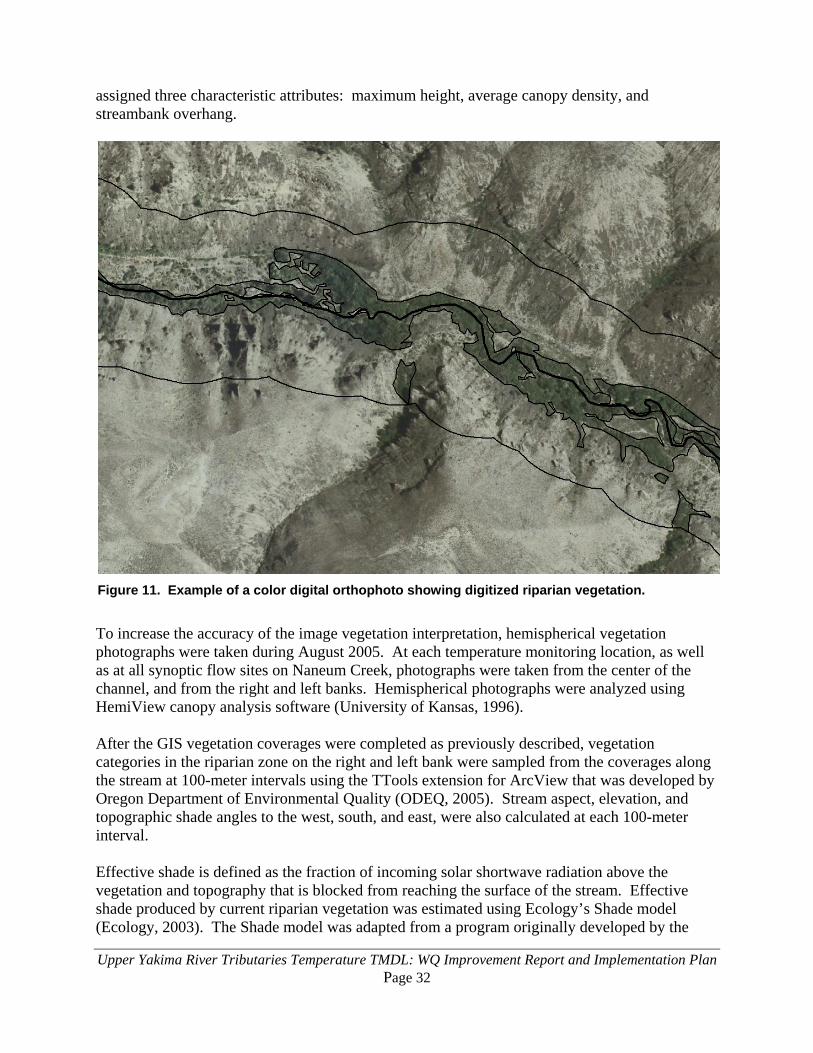
Upper Yakima River Tributaries Temperature TMDL: WQ Improvement Report and Implementation Plan Page 32
assigned three characteristic attributes: maximum height, average canopy density, and streambank overhang.
Figure 11. Example of a color digital orthophoto showing digitized riparian vegetation.
To increase the accuracy of the image vegetation interpretation, hemispherical vegetation photographs were taken during August 2005. At each temperature monitoring location, as well as at all synoptic flow sites on Naneum Creek, photographs were taken from the center of the channel, and from the right and left banks. Hemispherical photographs were analyzed using HemiView canopy analysis software (University of Kansas, 1996). After the GIS vegetation coverages were completed as previously described, vegetation categories in the riparian zone on the right and left bank were sampled from the coverages along the stream at 100-meter intervals using the TTools extension for ArcView that was developed by Oregon Department of Environmental Quality (ODEQ, 2005). Stream aspect, elevation, and topographic shade angles to the west, south, and east, were also calculated at each 100-meter interval. Effective shade is defined as the fraction of incoming solar shortwave radiation above the vegetation and topography that is blocked from reaching the surface of the stream. Effective shade produced by current riparian vegetation was estimated using Ecology’s Shade model (Ecology, 2003). The Shade model was adapted from a program originally developed by the

Upper Yakima River Tributaries Temperature TMDL: WQ Improvement Report and Implementation Plan Page 33
ODEQ as part of the HeatSource model. Effective shade estimated by the Shade model was compared to that measured by hemispherical photos to confirm model accuracy (Figures 12-14).
Potential riparian vegetation and effective shade
Maximum potential riparian vegetation was determined for all streams in the study area. A soils-based approach similar to that used by Sullivan (2000) and Gilmore (2005) was used. First, a GIS coverage of the Kittitas County produced by the USDA/NRCS soil survey was obtained. Because riparian and upland vegetation characteristics differ within a single soil type, the potential vegetation for each soil type was defined separately for riparian areas (defined as areas within 100 feet6 of a perennial stream, pond, slough, or lake) and upland areas. Potential vegetation was defined for each soil type based on a weight of evidence from the following sources:
• USDA Ecological Site/Plant Association data – For each soil type in the USDA/NRCS soil survey, a site association has been defined, along with characteristic forest and/or rangeland plant coverage.
• DNR Soils Site Index – For forested lands, the DNR has assigned a site index for each soil type, which is defined as the height of mature trees on that soil type. For lands east of the Cascade mountain crest, the site index value is a height at age 100 years.
• Sullivan Thesis – Allen Sullivan’s 2000 doctoral thesis provides an analysis of expected native vegetation in irrigated portions of the Kittitas Valley.
• General Land Office (GLO) surveys – The General Land Office surveyed all township and section lines during the late 1800s. Surveyors often made notes of vegetation present along streams.
• Remnant Vegetation Patches – Existing patches of riparian vegetation corresponding to various soil types were identified using a GIS map. Each patch was then visited, and vegetation characteristics, such as height and height-dominant species, were recorded. For purposes of this analysis, introduced species such as crack willow (Salix fragilis) were ignored.
• Wenatchee National Forest Water Temperature TMDL analysis – riparian canopy density and vegetation height was estimated for upper Yakima tributary areas based on data gathered by the Wenatchee National Forest (Whiley and Cleland, 2003).
The soil type potential vegetation definitions resulted in a map of potential near-stream land cover in the upper Yakima tributaries (Figure 31 in the Load Allocations section of this report). Potential vegetation zones are described in Table 11 in the Load Allocations section. Effective shade calculations were made for maximum potential riparian vegetation on Taneum and Naneum Creeks (Figures 12 and 13). No such calculation was made for Umtanum Creek, because Umtanum Creek already possesses maximum potential riparian vegetation for nearly all of its length (Figure 14).
6 Under natural conditions, areas within about 100 ft of a perennial stream would be expected to support riparian, as opposed to upland, vegetation types. This is not necessarily the same as the buffer width that will be needed to achieve target shade values. Buffer widths are discussed in the implementation plan.
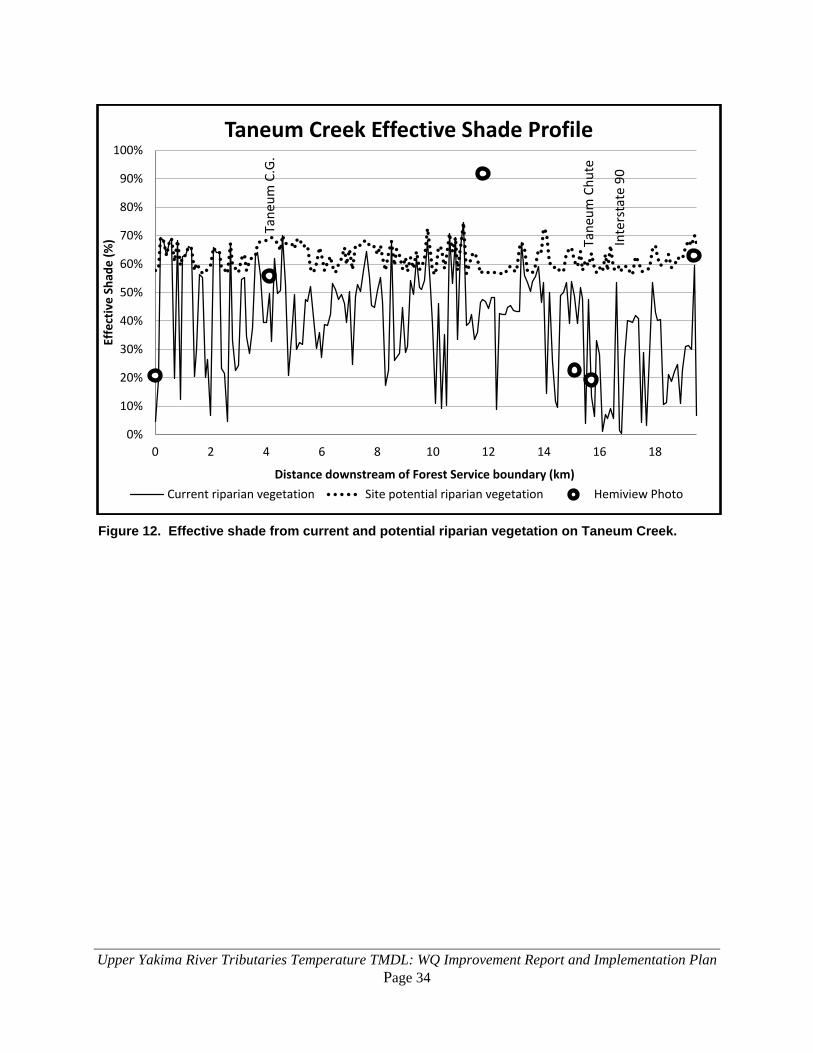
Upper Yakima River Tributaries Temperature TMDL: WQ Improvement Report and Implementation Plan Page 34
Figure 12. Effective shade from current and potential riparian vegetation on Taneum Creek.
0%
10%
20%
30%
40%
50%
60%
70%
80%
90%
100%
0 2 4 6 8 10 12 14 16 18
Effe
ctiv
e Sh
ade
(%)
Distance downstream of Forest Service boundary (km)
Taneum Creek Effective Shade Profile
Current riparian vegetation Site potential riparian vegetation Hemiview Photo
Tane
um C
.G.
Tane
um C
hute
Inte
rsta
te 9
0
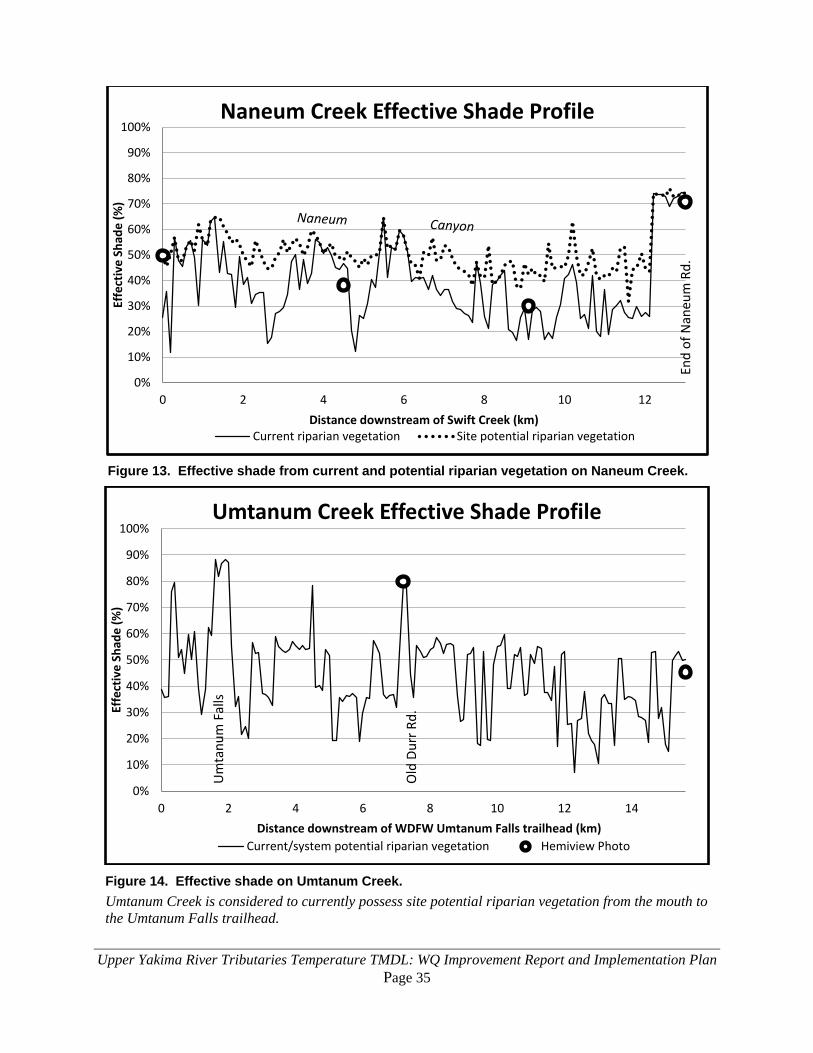
Upper Yakima River Tributaries Temperature TMDL: WQ Improvement Report and Implementation Plan Page 35
Figure 13. Effective shade from current and potential riparian vegetation on Naneum Creek.
Figure 14. Effective shade on Umtanum Creek. Umtanum Creek is considered to currently possess site potential riparian vegetation from the mouth to the Umtanum Falls trailhead.
0%
10%
20%
30%
40%
50%
60%
70%
80%
90%
100%
0 2 4 6 8 10 12
Effe
ctiv
e Sh
ade
(%)
Distance downstream of Swift Creek (km)
Naneum Creek Effective Shade Profile
Current riparian vegetation Site potential riparian vegetation
End
of N
aneu
m R
d.
0%
10%
20%
30%
40%
50%
60%
70%
80%
90%
100%
0 2 4 6 8 10 12 14
Effe
ctiv
e Sh
ade
(%)
Distance downstream of WDFW Umtanum Falls trailhead (km)
Umtanum Creek Effective Shade Profile
Current/system potential riparian vegetation Hemiview Photo
Old
Dur
r Rd.
Um
tanu
m F
alls

Upper Yakima River Tributaries Temperature TMDL: WQ Improvement Report and Implementation Plan Page 36
Analytical framework Data collected during this TMDL effort have been used to simulate temperatures continuously along Taneum Creek and upper Naneum Creek, using a methodology that is both spatially continuous and spans full-day timeframes (Figure 15). The GIS and modeling analysis was conducted using these four specialized software tools:
• ODEQ’s TTools extension for ArcView (ODEQ, 2005) was used to sample and process GIS data for input to the QUAL2Kw model.
• Ecology’s Shade model (Ecology, 2003) was used to estimate effective shade along Taneum, Naneum, and Umtanum Creeks. Effective shade was calculated at 100-meter intervals along the streams and then averaged over 500-meter intervals for input to the QUAL2Kw model.
• The QUAL2Kw model (Chapra, 2001; Chapra and Pelletier, 2003; and Pelletier and Chapra, 2003) was used to calculate the components of the heat budget and simulate water temperatures. QUAL2Kw simulates diurnal variations in stream temperature for a steady flow condition. QUAL2Kw was applied by assuming that flow remains constant for a given condition, such as a 7-day or 1-day period, but key variables are allowed to vary with time over the course of a day. For temperature simulation the solar radiation, air temperature, relative humidity, headwater temperature, and tributary water temperatures, were specified or simulated as diurnally varying functions.
QUAL2Kw uses the kinetic formulations for the components of the surface water heat budget that are shown in Figure B-2 (in Appendix B and described in Chapra (1997). Water temperatures are simulated using a finite difference numerical method. Complete model documentation and software can be found at www.ecy.wa.gov/programs/eap/models/index.html. Diurnally varying water temperatures were simulated at 500-meter intervals along Taneum Creek and upper Naneum Creek. The water temperature model was calibrated and confirmed to instream data.
• All input data for the Shade and QUAL2Kw models are longitudinally referenced, allowing spatial and/or continuous inputs to apply to certain zones or specific river segments.

Upper Yakima River Tributaries Temperature TMDL: WQ Improvement Report and Implementation Plan Page 37
Figure 15. Locations of reaches modeled using QUAL2Kw.
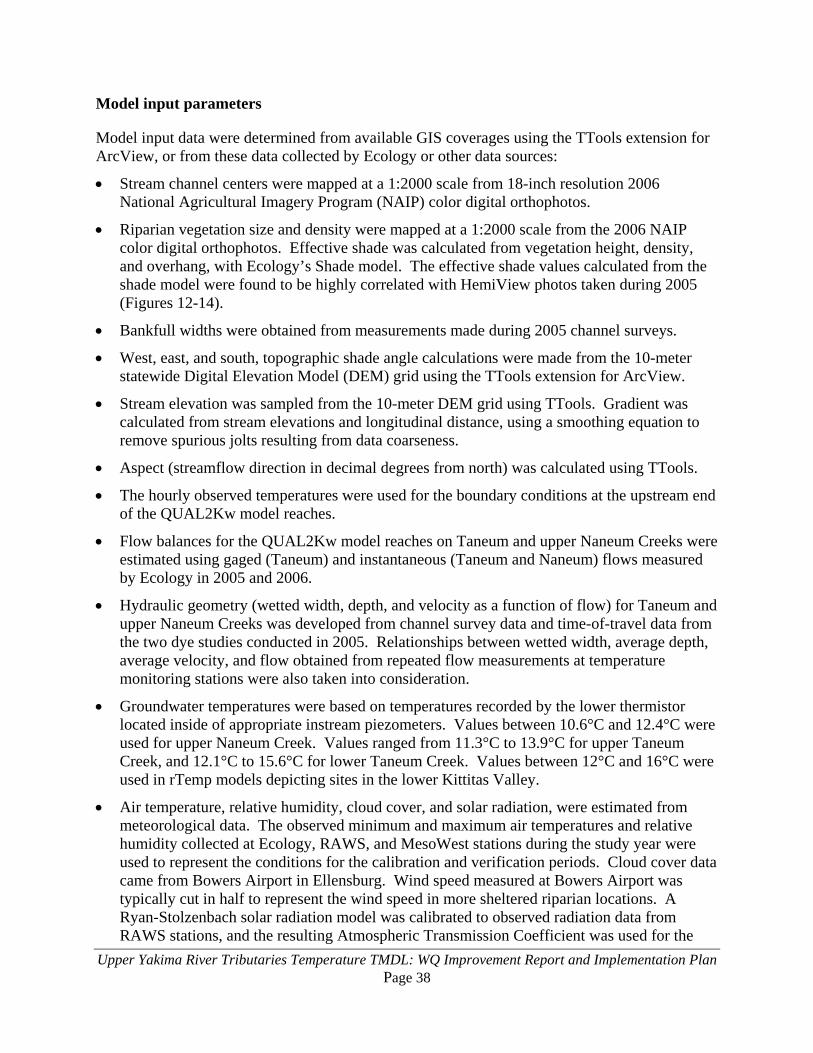
Upper Yakima River Tributaries Temperature TMDL: WQ Improvement Report and Implementation Plan Page 38
Model input parameters
Model input data were determined from available GIS coverages using the TTools extension for ArcView, or from these data collected by Ecology or other data sources:
• Stream channel centers were mapped at a 1:2000 scale from 18-inch resolution 2006 National Agricultural Imagery Program (NAIP) color digital orthophotos.
• Riparian vegetation size and density were mapped at a 1:2000 scale from the 2006 NAIP color digital orthophotos. Effective shade was calculated from vegetation height, density, and overhang, with Ecology’s Shade model. The effective shade values calculated from the shade model were found to be highly correlated with HemiView photos taken during 2005 (Figures 12-14).
• Bankfull widths were obtained from measurements made during 2005 channel surveys.
• West, east, and south, topographic shade angle calculations were made from the 10-meter statewide Digital Elevation Model (DEM) grid using the TTools extension for ArcView.
• Stream elevation was sampled from the 10-meter DEM grid using TTools. Gradient was calculated from stream elevations and longitudinal distance, using a smoothing equation to remove spurious jolts resulting from data coarseness.
• Aspect (streamflow direction in decimal degrees from north) was calculated using TTools.
• The hourly observed temperatures were used for the boundary conditions at the upstream end of the QUAL2Kw model reaches.
• Flow balances for the QUAL2Kw model reaches on Taneum and upper Naneum Creeks were estimated using gaged (Taneum) and instantaneous (Taneum and Naneum) flows measured by Ecology in 2005 and 2006.
• Hydraulic geometry (wetted width, depth, and velocity as a function of flow) for Taneum and upper Naneum Creeks was developed from channel survey data and time-of-travel data from the two dye studies conducted in 2005. Relationships between wetted width, average depth, average velocity, and flow obtained from repeated flow measurements at temperature monitoring stations were also taken into consideration.
• Groundwater temperatures were based on temperatures recorded by the lower thermistor located inside of appropriate instream piezometers. Values between 10.6°C and 12.4°C were used for upper Naneum Creek. Values ranged from 11.3°C to 13.9°C for upper Taneum Creek, and 12.1°C to 15.6°C for lower Taneum Creek. Values between 12°C and 16°C were used in rTemp models depicting sites in the lower Kittitas Valley.
• Air temperature, relative humidity, cloud cover, and solar radiation, were estimated from meteorological data. The observed minimum and maximum air temperatures and relative humidity collected at Ecology, RAWS, and MesoWest stations during the study year were used to represent the conditions for the calibration and verification periods. Cloud cover data came from Bowers Airport in Ellensburg. Wind speed measured at Bowers Airport was typically cut in half to represent the wind speed in more sheltered riparian locations. A Ryan-Stolzenbach solar radiation model was calibrated to observed radiation data from RAWS stations, and the resulting Atmospheric Transmission Coefficient was used for the
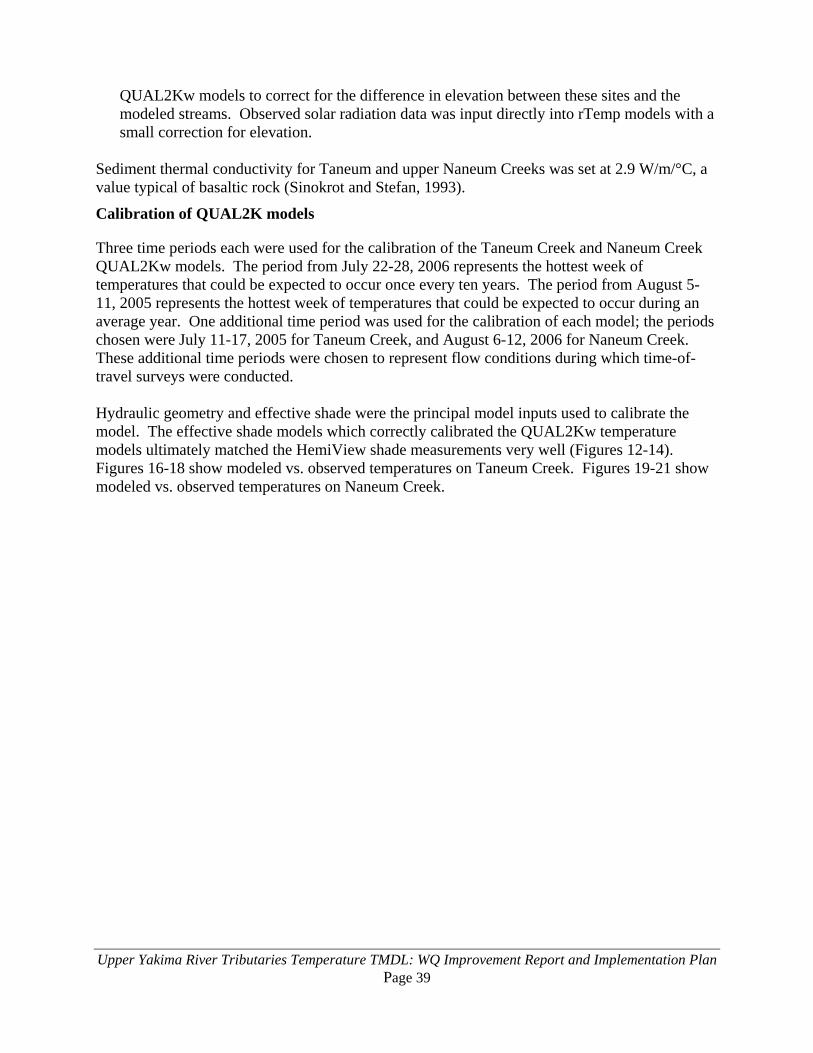
Upper Yakima River Tributaries Temperature TMDL: WQ Improvement Report and Implementation Plan Page 39
QUAL2Kw models to correct for the difference in elevation between these sites and the modeled streams. Observed solar radiation data was input directly into rTemp models with a small correction for elevation.
Sediment thermal conductivity for Taneum and upper Naneum Creeks was set at 2.9 W/m/°C, a value typical of basaltic rock (Sinokrot and Stefan, 1993).
Calibration of QUAL2K models
Three time periods each were used for the calibration of the Taneum Creek and Naneum Creek QUAL2Kw models. The period from July 22-28, 2006 represents the hottest week of temperatures that could be expected to occur once every ten years. The period from August 5-11, 2005 represents the hottest week of temperatures that could be expected to occur during an average year. One additional time period was used for the calibration of each model; the periods chosen were July 11-17, 2005 for Taneum Creek, and August 6-12, 2006 for Naneum Creek. These additional time periods were chosen to represent flow conditions during which time-of-travel surveys were conducted. Hydraulic geometry and effective shade were the principal model inputs used to calibrate the model. The effective shade models which correctly calibrated the QUAL2Kw temperature models ultimately matched the HemiView shade measurements very well (Figures 12-14). Figures 16-18 show modeled vs. observed temperatures on Taneum Creek. Figures 19-21 show modeled vs. observed temperatures on Naneum Creek.

Upper Yakima River Tributaries Temperature TMDL: WQ Improvement Report and Implementation Plan Page 40
Figure 16. Modeled and observed temperatures in Taneum Creek during July 11-17, 2005.
Figure 17. Modeled and observed temperatures in Taneum Creek during August 5-11, 2005.
0
5
10
15
20
25
024681012141618
tem
pera
ture
(deg
C)
distance upstream (Km)
Taneum Creek (7/14/2005)
Average (model) Maximum (model) Minimum (model)Average (observed) Maximum (observed) Minimum (observed)
0
5
10
15
20
25
024681012141618
tem
pera
ture
(deg
C)
distance upstream (Km)
Taneum Creek (8/8/2005)
Average (model) Maximum (model) Minimum (model)Average (observed) Maximum (observed) Minimum (observed)
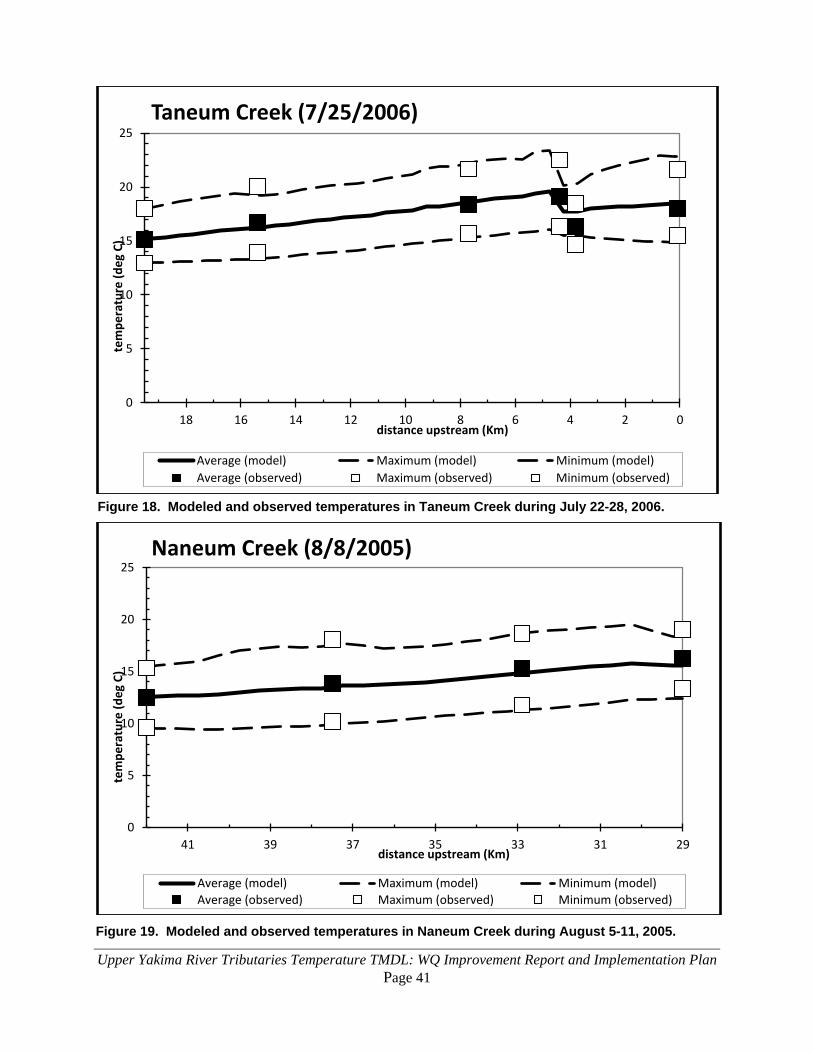
Upper Yakima River Tributaries Temperature TMDL: WQ Improvement Report and Implementation Plan Page 41
Figure 18. Modeled and observed temperatures in Taneum Creek during July 22-28, 2006.
Figure 19. Modeled and observed temperatures in Naneum Creek during August 5-11, 2005.
0
5
10
15
20
25
024681012141618
tem
pera
ture
(deg
C)
distance upstream (Km)
Taneum Creek (7/25/2006)
Average (model) Maximum (model) Minimum (model)Average (observed) Maximum (observed) Minimum (observed)
0
5
10
15
20
25
29313335373941
tem
pera
ture
(deg
C)
distance upstream (Km)
Naneum Creek (8/8/2005)
Average (model) Maximum (model) Minimum (model)Average (observed) Maximum (observed) Minimum (observed)
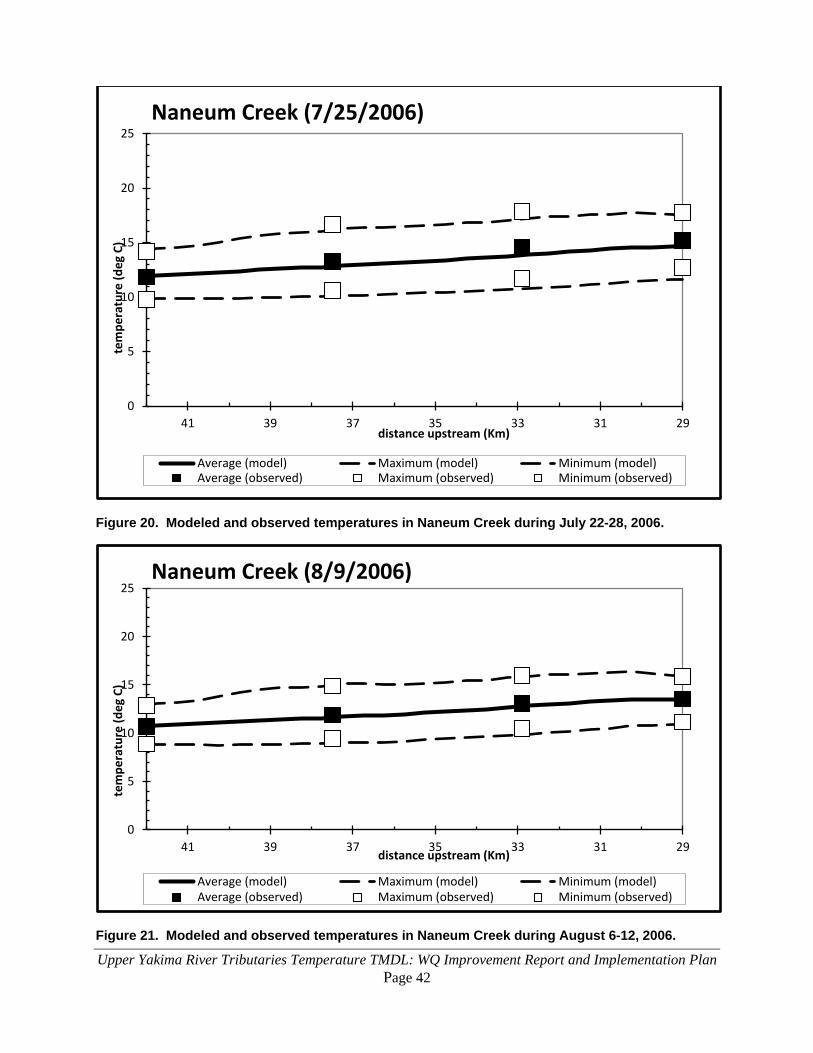
Upper Yakima River Tributaries Temperature TMDL: WQ Improvement Report and Implementation Plan Page 42
Figure 20. Modeled and observed temperatures in Naneum Creek during July 22-28, 2006.
Figure 21. Modeled and observed temperatures in Naneum Creek during August 6-12, 2006.
0
5
10
15
20
25
29313335373941
tem
pera
ture
(deg
C)
distance upstream (Km)
Naneum Creek (7/25/2006)
Average (model) Maximum (model) Minimum (model)Average (observed) Maximum (observed) Minimum (observed)
0
5
10
15
20
25
29313335373941
tem
pera
ture
(deg
C)
distance upstream (Km)
Naneum Creek (8/9/2006)
Average (model) Maximum (model) Minimum (model)Average (observed) Maximum (observed) Minimum (observed)

Upper Yakima River Tributaries Temperature TMDL: WQ Improvement Report and Implementation Plan Page 43
The goodness-of-fit for the QUAL2Kw models was summarized using the root mean squared error (RMSE) and overall bias as measures of the deviation of model-predicted stream temperature from the observed values. The RMSE and bias were calculated as:
nTT
RMSE measuredpredicted2)( −Σ
= n
TTBias
measuredpredicted∑ −=
)(
For the calibration time periods, the results of the goodness-of-fit analysis are shown in Table 6. The model goodness-of-fit is comparable to other similar studies (Brock 2008, Stohr et al. 2007) and adequate for purposes of TMDL analysis. Model error and bias were taken into account when applying model results.
Table 6. Summary root mean squared error (RMSE) and overall bias of differences between the QUAL2Kw predicted and observed daily maximum and average temperatures in Taneum and Naneum Creeks.
Watercourse Statistic Model Date
7/22-28/2006 8/5-11/2005 7/11-17/2005 8/6-12/2006 Root Mean Squared Error (RMSE) ºC
Taneum Creek Maximum 1.13 (0.64)1 0.50 0.26 Average 0.73 (0.38)1 0.30 0.09
Naneum Creek Maximum 0.52 0.53 0.05 Average 0.59 0.51 0.21
Overall Bias ºC
Taneum Creek Maximum +0.72 (+0.20)1 +0.40 +0.21 Average +0.42 (+0.08)1 +0.07 +0.07
Naneum Creek Maximum -0.48 -0.39 -0.02 Average -0.58 -0.50 -0.17
1Loading analysis shows that for 2006, temperature data either from the Taneum Chute or from 39TAN-01.9 is in error. Temperature patterns in the model suggest the problem is with Taneum Chute data. This results in a poorer model fit for the 7/22-28/2006 Taneum model. The RMSE and bias values in parentheses were calculated ignoring sites downstream of Taneum Chute.
Results and discussion Water temperature data Data from 2005 and 2006 show that water temperatures in excess of the applicable 17.5°C and 16.0°C water quality standards are common throughout the study area (Table 7, and Figures 22 and 23). Tributary streams generally exhibited a warming trend as they progressed from their higher-elevation sources toward their mouths along the Yakima River. Water temperatures in excess of 20.0°C were observed in most streams in the low-elevation parts of the study area.
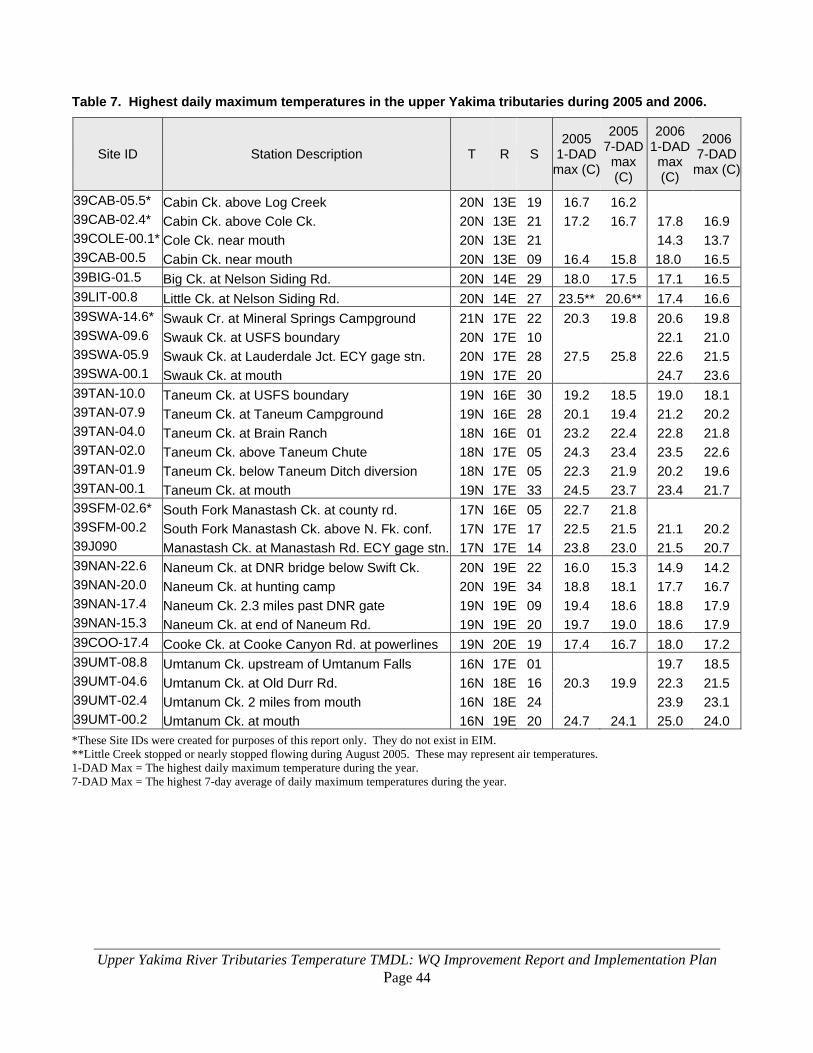
Upper Yakima River Tributaries Temperature TMDL: WQ Improvement Report and Implementation Plan Page 44
Table 7. Highest daily maximum temperatures in the upper Yakima tributaries during 2005 and 2006.
Site ID Station Description T R S 2005
1-DAD max (C)
2005 7-DAD
max (C)
2006 1-DAD
max (C)
2006 7-DAD max (C)
39CAB-05.5* Cabin Ck. above Log Creek 20N 13E 19 16.7 16.2 39CAB-02.4* Cabin Ck. above Cole Ck. 20N 13E 21 17.2 16.7 17.8 16.9 39COLE-00.1* Cole Ck. near mouth 20N 13E 21 14.3 13.7 39CAB-00.5 Cabin Ck. near mouth 20N 13E 09 16.4 15.8 18.0 16.5 39BIG-01.5 Big Ck. at Nelson Siding Rd. 20N 14E 29 18.0 17.5 17.1 16.5 39LIT-00.8 Little Ck. at Nelson Siding Rd. 20N 14E 27 23.5** 20.6** 17.4 16.6 39SWA-14.6* Swauk Cr. at Mineral Springs Campground 21N 17E 22 20.3 19.8 20.6 19.8 39SWA-09.6 Swauk Ck. at USFS boundary 20N 17E 10 22.1 21.0 39SWA-05.9 Swauk Ck. at Lauderdale Jct. ECY gage stn. 20N 17E 28 27.5 25.8 22.6 21.5 39SWA-00.1 Swauk Ck. at mouth 19N 17E 20 24.7 23.6 39TAN-10.0 Taneum Ck. at USFS boundary 19N 16E 30 19.2 18.5 19.0 18.1 39TAN-07.9 Taneum Ck. at Taneum Campground 19N 16E 28 20.1 19.4 21.2 20.2 39TAN-04.0 Taneum Ck. at Brain Ranch 18N 16E 01 23.2 22.4 22.8 21.8 39TAN-02.0 Taneum Ck. above Taneum Chute 18N 17E 05 24.3 23.4 23.5 22.6 39TAN-01.9 Taneum Ck. below Taneum Ditch diversion 18N 17E 05 22.3 21.9 20.2 19.6 39TAN-00.1 Taneum Ck. at mouth 19N 17E 33 24.5 23.7 23.4 21.7 39SFM-02.6* South Fork Manastash Ck. at county rd. 17N 16E 05 22.7 21.8 39SFM-00.2 South Fork Manastash Ck. above N. Fk. conf. 17N 17E 17 22.5 21.5 21.1 20.2 39J090 Manastash Ck. at Manastash Rd. ECY gage stn. 17N 17E 14 23.8 23.0 21.5 20.7 39NAN-22.6 Naneum Ck. at DNR bridge below Swift Ck. 20N 19E 22 16.0 15.3 14.9 14.2 39NAN-20.0 Naneum Ck. at hunting camp 20N 19E 34 18.8 18.1 17.7 16.7 39NAN-17.4 Naneum Ck. 2.3 miles past DNR gate 19N 19E 09 19.4 18.6 18.8 17.9 39NAN-15.3 Naneum Ck. at end of Naneum Rd. 19N 19E 20 19.7 19.0 18.6 17.9 39COO-17.4 Cooke Ck. at Cooke Canyon Rd. at powerlines 19N 20E 19 17.4 16.7 18.0 17.2 39UMT-08.8 Umtanum Ck. upstream of Umtanum Falls 16N 17E 01 19.7 18.5 39UMT-04.6 Umtanum Ck. at Old Durr Rd. 16N 18E 16 20.3 19.9 22.3 21.5 39UMT-02.4 Umtanum Ck. 2 miles from mouth 16N 18E 24 23.9 23.1 39UMT-00.2 Umtanum Ck. at mouth 16N 19E 20 24.7 24.1 25.0 24.0 *These Site IDs were created for purposes of this report only. They do not exist in EIM. **Little Creek stopped or nearly stopped flowing during August 2005. These may represent air temperatures. 1-DAD Max = The highest daily maximum temperature during the year. 7-DAD Max = The highest 7-day average of daily maximum temperatures during the year.
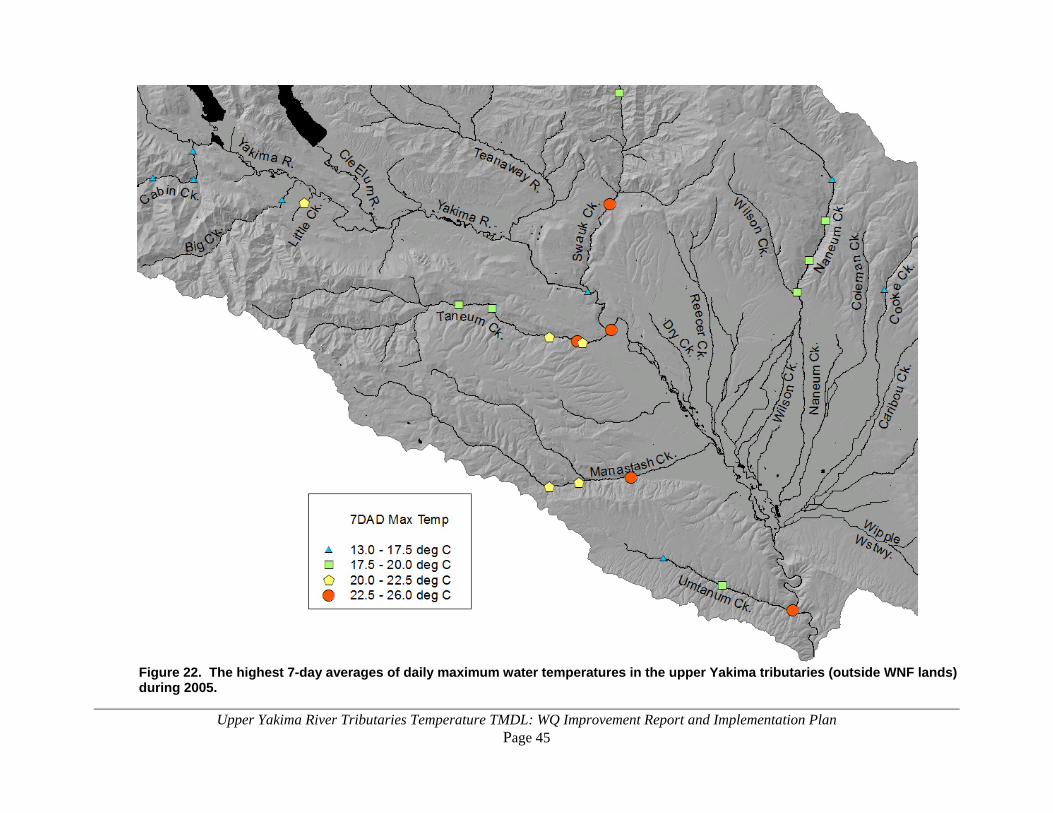
Upper Yakima River Tributaries Temperature TMDL: WQ Improvement Report and Implementation Plan Page 45
Figure 22. The highest 7-day averages of daily maximum water temperatures in the upper Yakima tributaries (outside WNF lands) during 2005.

Upper Yakima River Tributaries Temperature TMDL: WQ Improvement Report and Implementation Plan Page 46
Figure 23. The highest 7-day averages of daily maximum water temperatures in the upper Yakima tributaries (outside of WNF lands) during 2006.
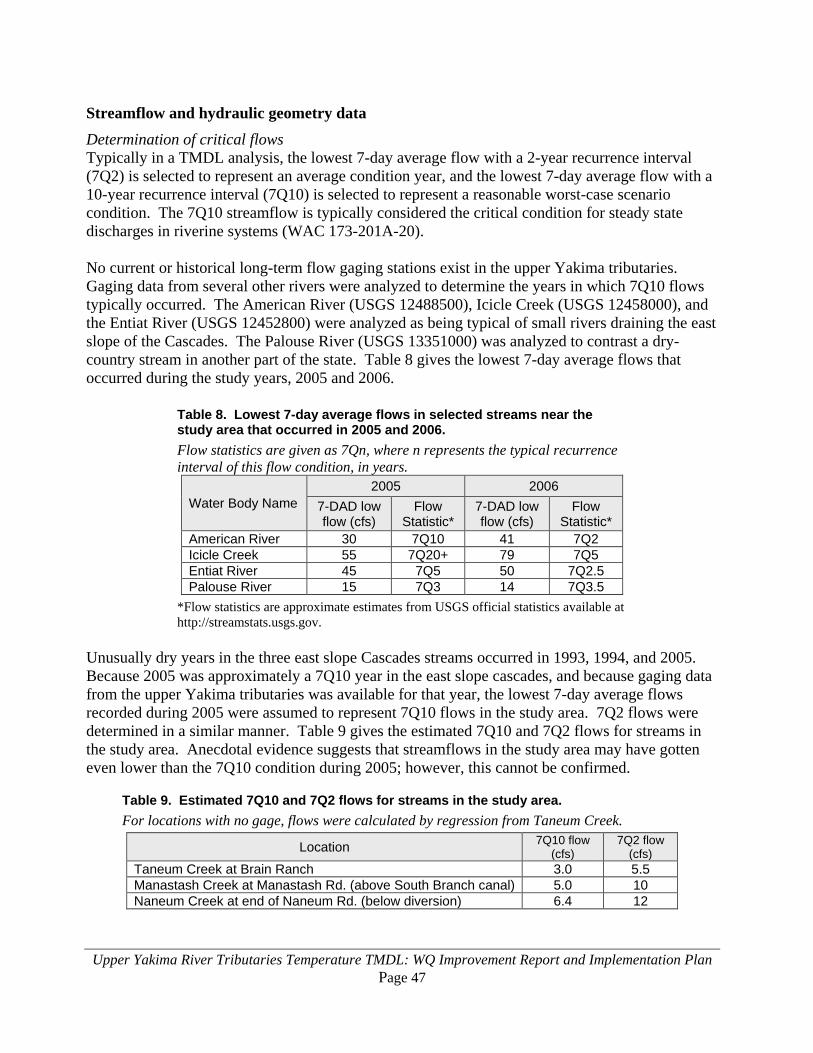
Upper Yakima River Tributaries Temperature TMDL: WQ Improvement Report and Implementation Plan Page 47
Streamflow and hydraulic geometry data Determination of critical flows Typically in a TMDL analysis, the lowest 7-day average flow with a 2-year recurrence interval (7Q2) is selected to represent an average condition year, and the lowest 7-day average flow with a 10-year recurrence interval (7Q10) is selected to represent a reasonable worst-case scenario condition. The 7Q10 streamflow is typically considered the critical condition for steady state discharges in riverine systems (WAC 173-201A-20). No current or historical long-term flow gaging stations exist in the upper Yakima tributaries. Gaging data from several other rivers were analyzed to determine the years in which 7Q10 flows typically occurred. The American River (USGS 12488500), Icicle Creek (USGS 12458000), and the Entiat River (USGS 12452800) were analyzed as being typical of small rivers draining the east slope of the Cascades. The Palouse River (USGS 13351000) was analyzed to contrast a dry-country stream in another part of the state. Table 8 gives the lowest 7-day average flows that occurred during the study years, 2005 and 2006.
Table 8. Lowest 7-day average flows in selected streams near the study area that occurred in 2005 and 2006. Flow statistics are given as 7Qn, where n represents the typical recurrence interval of this flow condition, in years.
Water Body Name 2005 2006
7-DAD low flow (cfs)
Flow Statistic*
7-DAD low flow (cfs)
Flow Statistic*
American River 30 7Q10 41 7Q2 Icicle Creek 55 7Q20+ 79 7Q5 Entiat River 45 7Q5 50 7Q2.5 Palouse River 15 7Q3 14 7Q3.5
*Flow statistics are approximate estimates from USGS official statistics available at http://streamstats.usgs.gov.
Unusually dry years in the three east slope Cascades streams occurred in 1993, 1994, and 2005. Because 2005 was approximately a 7Q10 year in the east slope cascades, and because gaging data from the upper Yakima tributaries was available for that year, the lowest 7-day average flows recorded during 2005 were assumed to represent 7Q10 flows in the study area. 7Q2 flows were determined in a similar manner. Table 9 gives the estimated 7Q10 and 7Q2 flows for streams in the study area. Anecdotal evidence suggests that streamflows in the study area may have gotten even lower than the 7Q10 condition during 2005; however, this cannot be confirmed.
Table 9. Estimated 7Q10 and 7Q2 flows for streams in the study area. For locations with no gage, flows were calculated by regression from Taneum Creek.
Location 7Q10 flow (cfs)
7Q2 flow (cfs)
Taneum Creek at Brain Ranch 3.0 5.5 Manastash Creek at Manastash Rd. (above South Branch canal) 5.0 10 Naneum Creek at end of Naneum Rd. (below diversion) 6.4 12
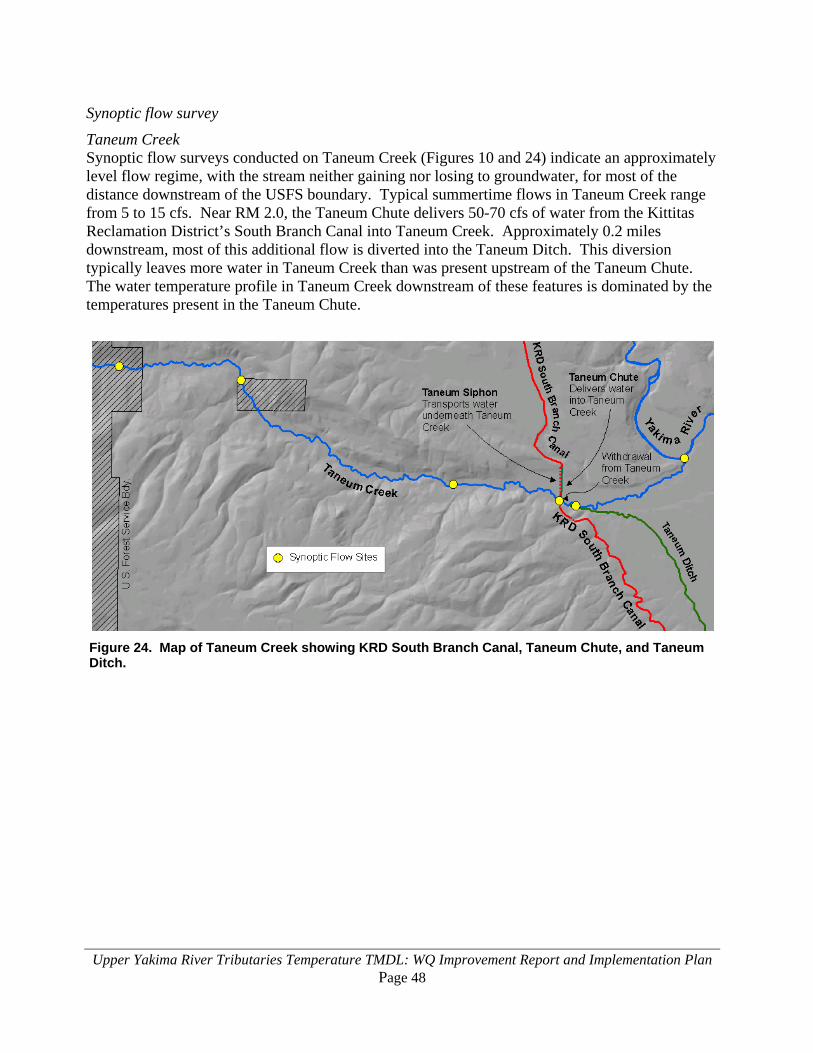
Upper Yakima River Tributaries Temperature TMDL: WQ Improvement Report and Implementation Plan Page 48
Synoptic flow survey Taneum Creek Synoptic flow surveys conducted on Taneum Creek (Figures 10 and 24) indicate an approximately level flow regime, with the stream neither gaining nor losing to groundwater, for most of the distance downstream of the USFS boundary. Typical summertime flows in Taneum Creek range from 5 to 15 cfs. Near RM 2.0, the Taneum Chute delivers 50-70 cfs of water from the Kittitas Reclamation District’s South Branch Canal into Taneum Creek. Approximately 0.2 miles downstream, most of this additional flow is diverted into the Taneum Ditch. This diversion typically leaves more water in Taneum Creek than was present upstream of the Taneum Chute. The water temperature profile in Taneum Creek downstream of these features is dominated by the temperatures present in the Taneum Chute.
Figure 24. Map of Taneum Creek showing KRD South Branch Canal, Taneum Chute, and Taneum Ditch.
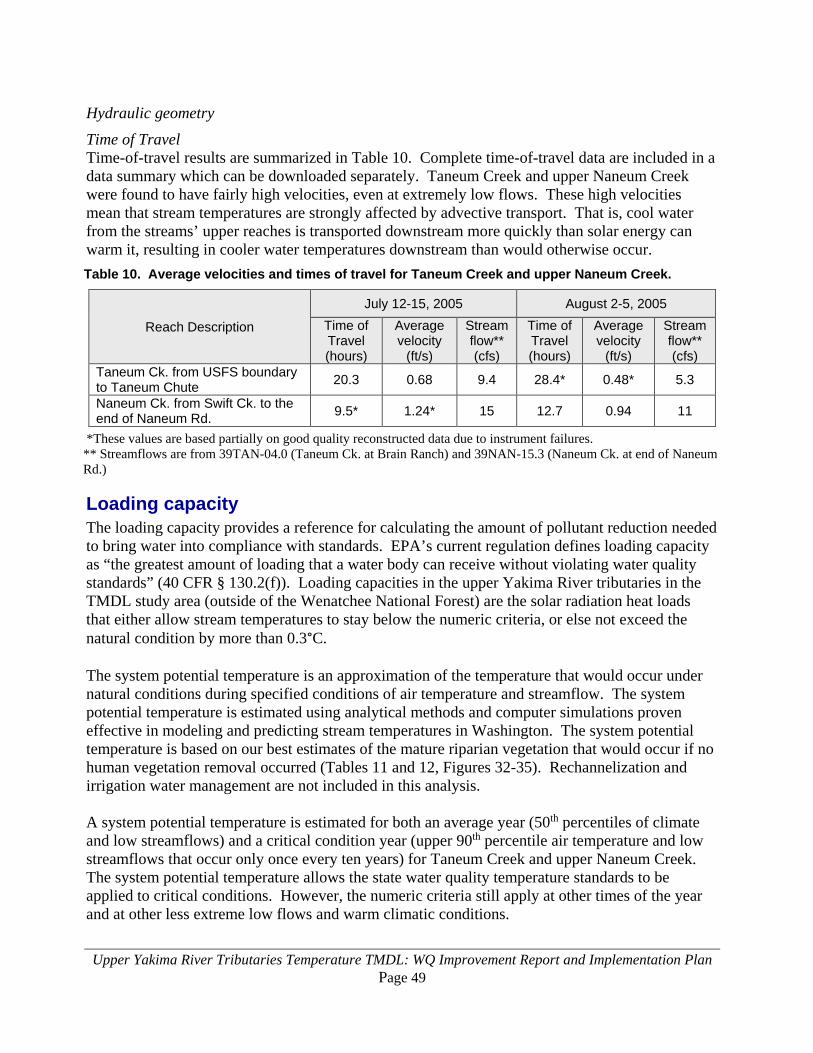
Upper Yakima River Tributaries Temperature TMDL: WQ Improvement Report and Implementation Plan Page 49
Hydraulic geometry Time of Travel Time-of-travel results are summarized in Table 10. Complete time-of-travel data are included in a data summary which can be downloaded separately. Taneum Creek and upper Naneum Creek were found to have fairly high velocities, even at extremely low flows. These high velocities mean that stream temperatures are strongly affected by advective transport. That is, cool water from the streams’ upper reaches is transported downstream more quickly than solar energy can warm it, resulting in cooler water temperatures downstream than would otherwise occur. Table 10. Average velocities and times of travel for Taneum Creek and upper Naneum Creek.
Reach Description
July 12-15, 2005 August 2-5, 2005 Time of Travel (hours)
Average velocity
(ft/s)
Stream flow** (cfs)
Time of Travel (hours)
Average velocity
(ft/s)
Stream flow** (cfs)
Taneum Ck. from USFS boundary to Taneum Chute 20.3 0.68 9.4 28.4* 0.48* 5.3
Naneum Ck. from Swift Ck. to the end of Naneum Rd. 9.5* 1.24* 15 12.7 0.94 11
*These values are based partially on good quality reconstructed data due to instrument failures. ** Streamflows are from 39TAN-04.0 (Taneum Ck. at Brain Ranch) and 39NAN-15.3 (Naneum Ck. at end of Naneum Rd.)
Loading capacity The loading capacity provides a reference for calculating the amount of pollutant reduction needed to bring water into compliance with standards. EPA’s current regulation defines loading capacity as “the greatest amount of loading that a water body can receive without violating water quality standards” (40 CFR § 130.2(f)). Loading capacities in the upper Yakima River tributaries in the TMDL study area (outside of the Wenatchee National Forest) are the solar radiation heat loads that either allow stream temperatures to stay below the numeric criteria, or else not exceed the natural condition by more than 0.3°C. The system potential temperature is an approximation of the temperature that would occur under natural conditions during specified conditions of air temperature and streamflow. The system potential temperature is estimated using analytical methods and computer simulations proven effective in modeling and predicting stream temperatures in Washington. The system potential temperature is based on our best estimates of the mature riparian vegetation that would occur if no human vegetation removal occurred (Tables 11 and 12, Figures 32-35). Rechannelization and irrigation water management are not included in this analysis. A system potential temperature is estimated for both an average year (50th percentiles of climate and low streamflows) and a critical condition year (upper 90th percentile air temperature and low streamflows that occur only once every ten years) for Taneum Creek and upper Naneum Creek. The system potential temperature allows the state water quality temperature standards to be applied to critical conditions. However, the numeric criteria still apply at other times of the year and at other less extreme low flows and warm climatic conditions.
Upper Yakima River Tributaries Temperature TMDL: WQ Improvement Report and Implementation Plan Page 50
The calibrated QUAL2Kw model was used to determine the loading capacity for effective shade for Taneum Creek and upper Naneum Creek. Loading capacity was determined based on prediction of water temperatures under critical conditions combined with a range of effective shade conditions.
Taneum Creek The results of model runs for current and system potential vegetation are presented in Figure 25 for 7Q2 conditions, and in Figure 26 for 7Q10 conditions. Water temperatures in Taneum Creek are expected to exceed the 16ºC standard under both current, and system potential conditions. Under current riparian conditions, portions of the creek are known to experience 7-day maximum temperatures warmer than the approximate lethality threshold of 22ºC for salmonids. Water temperatures in Taneum Creek are expected to exceed 22ºC for much of the stream under 7Q10 conditions, and may exceed 22ºC in places under 7Q2 conditions. The lethality limit or threshold is discussed in the following excerpt from an Ecology study (Hicks, 2002) that evaluates lethal temperatures for coldwater fish: “For evaluating the effects of discrete human actions, a 7-day average of the daily maximum temperatures greater than 22°C or a 1-day maximum greater than 23°C should be considered lethal to cold water fish species such as salmonids. Barriers to migration should be assumed to exist anytime daily maximum water temperatures are greater than 22°C and the adjacent down-stream water temperatures are 3°C or more cooler.” Significant reductions in water temperature are expected in Taneum Creek with the establishment of mature riparian vegetation. The largest reductions are expected just upstream of the Taneum Chute, where reductions of 3.4ºC are expected to occur. System potential temperatures in Taneum Creek are not expected to exceed 22ºC under 7Q2 conditions, but may still do so under 7Q10 conditions. A supplemental spawning criterion of 13ºC applies from September 15 to June 15 to the part of Taneum Creek approximately from Highway Interstate-90 to the mouth. Temperatures in this reach are currently warmer than 13ºC during early June and late September. System potential temperatures were not calculated for these time periods, but system potential shade should reduce temperatures during the fall and spring “shoulder seasons” as well.
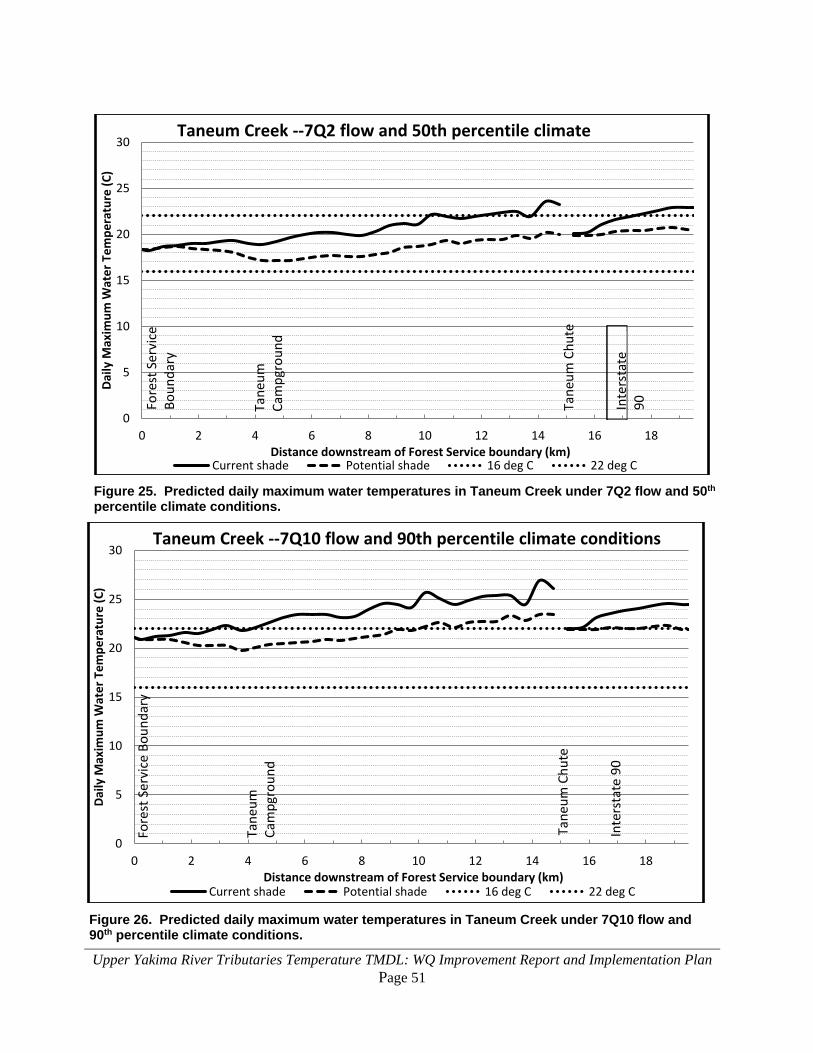
Upper Yakima River Tributaries Temperature TMDL: WQ Improvement Report and Implementation Plan Page 51
Figure 25. Predicted daily maximum water temperatures in Taneum Creek under 7Q2 flow and 50th percentile climate conditions.
Figure 26. Predicted daily maximum water temperatures in Taneum Creek under 7Q10 flow and 90th percentile climate conditions.
0
5
10
15
20
25
30
0 2 4 6 8 10 12 14 16 18
Daily
Max
imum
Wat
er T
empe
ratu
re (C
)
Distance downstream of Forest Service boundary (km)Current shade Potential shade 16 deg C 22 deg C
Tane
um
Cam
pgro
und
Fore
st S
ervi
ce
Boun
dary
Tane
um C
hute
Inte
rsta
te90
Taneum Creek --7Q2 flow and 50th percentile climate
0
5
10
15
20
25
30
0 2 4 6 8 10 12 14 16 18
Daily
Max
imum
Wat
er T
empe
ratu
re (C
)
Distance downstream of Forest Service boundary (km)Current shade Potential shade 16 deg C 22 deg C
Fore
st S
ervi
ce B
ound
ary
Tane
um
Cam
pgro
und
Tane
um C
hute
Inte
rsta
te90
Taneum Creek --7Q10 flow and 90th percentile climate conditions

Upper Yakima River Tributaries Temperature TMDL: WQ Improvement Report and Implementation Plan Page 52
Upper Naneum Creek (Naneum Canyon) Before the 2014 Snag Canyon Fire, the upper portion of Naneum Creek, in Naneum Canyon downstream to the end of Naneum Rd., had already achieved near-system potential vegetation, with current shade typically about 12% less than potential shade. The results of model runs for current and system potential vegetation are presented in Figure 27 for 7Q2 conditions and in Figure 28 for 7Q10 conditions. Replanting in the riparian zone, especially in the burned-over areas, should allow at least these shade levels to be achieved again. Water temperatures in upper Naneum Creek are known to exceed the 17.5ºC standard under current conditions. Under current riparian conditions, portions of the upper creek were expected to experience 7-day maximum temperatures warmer than the approximate lethality threshold of 22ºC for salmonids. This is only expected to occur during extreme conditions (i.e. 7Q10 flows and 90th percentile climate). Reductions in water temperature are expected in upper Naneum Creek with the establishment of system potential riparian vegetation. The largest reductions are expected about 1 km upstream of the end of Naneum Rd., where reductions of 1.7ºC are expected to occur. System potential temperatures in upper Naneum Creek are not expected to exceed 17.5ºC under 7Q2 conditions. System potential temperatures are still expected to exceed 17.5ºC under 7Q10 conditions but are not expected to exceed 22ºC. 7
7 In September and October of 2012, and in August 2014, two wildfires (the Table Mountain Fire and the Snag Canyon Fire, respectively) burned a portion of upper Naneum Canyon. It is possible that the effects of fire could result in warmer temperatures in Naneum Creek, due to more solar heating and transport of warmer water downstream from areas and that were burned. Rapid implementation of the best management practices (BMPs) that apply to the upper Naneum watershed should reduce water temperatures in upper Naneum Creek.

Upper Yakima River Tributaries Temperature TMDL: WQ Improvement Report and Implementation Plan Page 53
Figure 27. Predicted daily maximum water temperatures in upper Naneum Creek under 7Q2 flow and 50th percentile climate conditions.
0
5
10
15
20
25
0 2 4 6 8 10 12
Daily
Max
imum
Wat
er T
empe
ratu
re (C
)
Distance downstream of Swift Creek (km)Current shade Potential shade 17.5 deg C 22 deg C
Naneum Creek — 7Q2 flow and 50th percentile climate conditions
DNR
Brid
ge b
elow
Swift
Ck.
End
of N
aneu
m R
d.
Mid
dle
DNR
brid
ge (s
ide
rd.)
Hunt
ing
cam
p
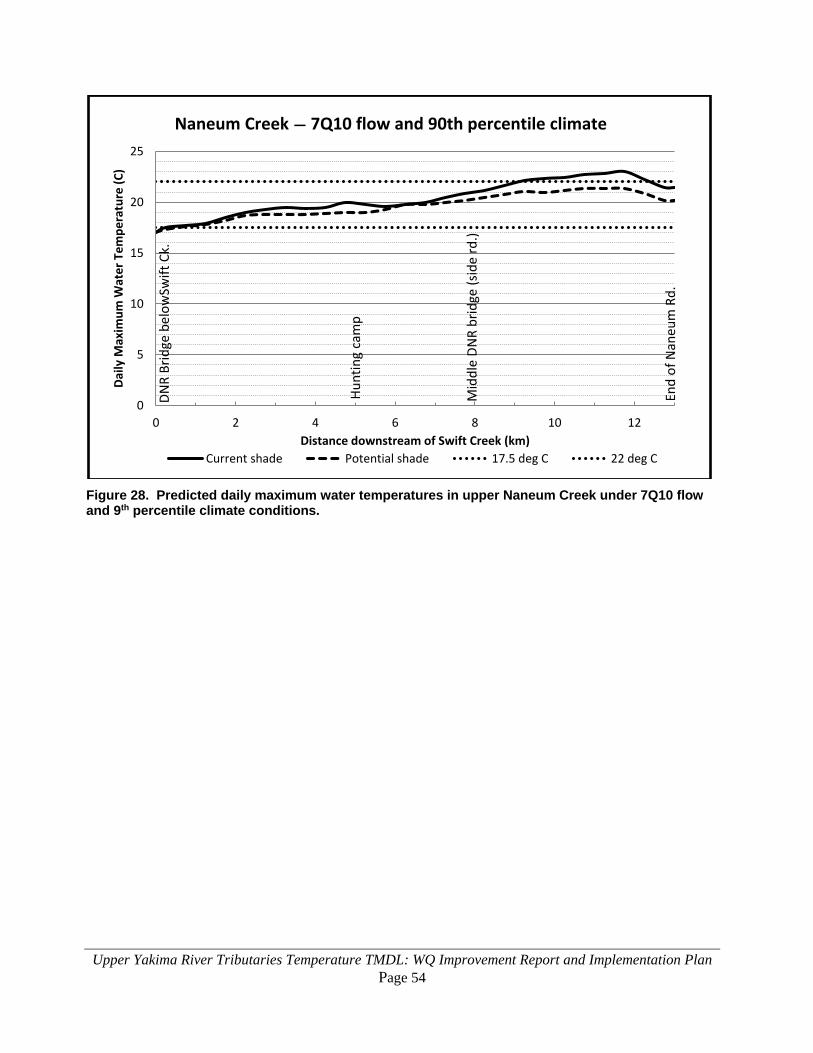
Upper Yakima River Tributaries Temperature TMDL: WQ Improvement Report and Implementation Plan Page 54
Figure 28. Predicted daily maximum water temperatures in upper Naneum Creek under 7Q10 flow and 9th percentile climate conditions.
0
5
10
15
20
25
0 2 4 6 8 10 12
Daily
Max
imum
Wat
er T
empe
ratu
re (C
)
Distance downstream of Swift Creek (km)Current shade Potential shade 17.5 deg C 22 deg C
Naneum Creek — 7Q10 flow and 90th percentile climate
DNR
Brid
ge b
elow
Swift
Ck.
End
of N
aneu
m R
d.
Mid
dle
DNR
brid
ge (s
ide
rd.)
Hunt
ing
cam
p
Upper Yakima River Tributaries Temperature TMDL: WQ Improvement Report and Implementation Plan Page 55
Umtanum Creek Water temperatures in Umtanum Creek are known to commonly exceed 17.5ºC. The 7-day maximum temperatures in the approximately three miles nearest the mouth also exceed the 22ºC lethality limit for salmonids. The entirety of Umtanum Creek downstream of the Umtanum Falls trailhead (39UMT-08.8) currently possesses system potential vegetation. Some areas upstream of the Umtanum Falls trailhead appear to possess less than full potential vegetation. The establishment of system potential riparian vegetation in those areas is expected to result in localized temperature improvements. A supplemental spawning criterion of 13ºC applies from February 15 to June 15 to the portion of Umtanum Creek within 1.7 miles of the mouth. Temperatures in early June exceed 13ºC by several degrees. No temperature improvements are possible in this reach, as it is located over 6 miles downstream of the area where riparian improvements are possible, and summertime stream velocities are too slow to effectively transport cooler water that distance downstream.
Swauk Creek Water temperatures in Swauk Creek exceed both the 16ºC standard and the 22ºC salmonid lethality limit. Swauk Creek was not modeled, for reasons discussed under “Goals and Objectives.” However, it possesses similar physical characteristics to Taneum and upper Naneum Creeks, and is expected to respond similarly to riparian shade. It is expected that the establishment of system potential riparian vegetation will significantly reduce temperature. This is particularly true in the Lauderdale Junction/Hidden Valley area downstream of First Creek, where natural riparian vegetation has largely been removed. However, it is probable that even with full system potential vegetation, temperatures will still exceed 16ºC. A supplemental spawning criterion of 13ºC applies from February 15 through June 15 to most of Swauk Creek, including the entirety of Swauk Creek downstream of the USFS boundary. Temperatures in early June exceed this criterion. It is expected that the establishment of system potential riparian vegetation will reduce water temperatures during early June, but it is unknown whether temperatures will meet the 13ºC criteria.
Upper Manastash Creek Water temperatures in upper Manastash Creek exceed the 16ºC standard. 7-day maximum temperatures in upper Manastash Creek exceeded the 22ºC lethality limit for salmonids during 2005, but not during 2006. This suggests that 7-day maximum temperatures exceeding 22ºC are likely to occur during critical flow conditions (7Q10) but not during an average year (7Q2). Manastash Creek was not modeled, for reasons discussed under “Goals and Objectives.” Like Swauk Creek, upper Manastash Creek possesses similar physical characteristics to Taneum and upper Naneum Creeks, and is expected to respond similarly to riparian shade. For the portion of Manastash Creek upstream of the KRD South Branch Canal, it is expected that the establishment of system potential riparian vegetation will slightly reduce temperature. This is because upper Manastash Creek is already near to having system potential riparian vegetation. Riparian vegetation has been removed or reduced in certain places. However, these impairments tend to be specific and localized rather than widespread. It is expected that even with full system potential vegetation, water temperatures will still exceed 16ºC.
Upper Yakima River Tributaries Temperature TMDL: WQ Improvement Report and Implementation Plan Page 56
Cabin Creek Water temperatures in Cabin Creek exceed the 16ºC standard, albeit only by a small amount. Groundwater cooling may be responsible for the fact that temperatures are not any warmer than this; the lower reaches of Cabin Creek receive very little shade. Cabin Creek possesses a wide near-stream disturbance zone (NSDZ) in the lower portion of the watershed (Figure 29). This is mainly the result of aggradation of sediment eroded from the toe of a very large deep-seated landslide in T20N R13E S.20. This landslide, known as the Falls Hill landslide, is a natural feature which has been active primarily since the 1970s. Benda (1997) surmises that landslide activity may have been triggered by construction of the road on the north side of the valley. This displaced the stream channel southward on to an unarmored section of valley floor, which initiated incision at the toe of the landslide, resulting in increased landsliding. Removal of log jams is also mentioned as a possible trigger of incision. Cabin Creek’s watershed has been subject to intensive timber management. Forest practices, including road building and timber harvest, are capable of accelerating natural mass-wasting processes (Powell, 2005). If human activities have contributed to additional sediment loads, altered the natural hydrograph, increased the frequency of disturbance, and/or reduced the ability of riparian vegetation to grow and survive along the stream channel, then evaluation of shading with a narrower NSDZ is appropriate. O’Connor (1997) found that the average NSDZ width in Cabin Creek downstream of Cole Creek (presented as the sum of active channel width and unvegetated terraces) increased from 52 m in 1955, to 140 m in 1993. Examination of recent orthophotos suggests that the NSDZ width has not changed much between early 1990s and 2009 imagery. With a current NSDZ width of 140 m, Cabin Creek is expected to receive 20% effective shade. With a restored NSDZ width of 52 m, this would increase to 47% shade (Table C-3, Appendix C). This is a large enough difference to have a considerable impact on stream temperatures. It is probable that with a restored NSDZ width, temperatures in Cabin Creek would not exceed 16ºC. This will not occur until the Falls Hill landslide stabilizes, and downstream sediment delivery decreases significantly. At that time it is predicted that the channel of lower Cabin Creek will stabilize, and riparian forests will regrow (O’Connor, 1997). The riparian forests behind the NSDZ are mostly intact along the mainstem of Cabin Creek, though there are some impacts associated with timber harvest. Riparian forests along tributary streams, particularly Log Creek, are more heavily impacted by timber harvest which occurred before buffers were required to be left along streams. Regeneration coupled with improved forest practices should result in reduced water temperatures over time.
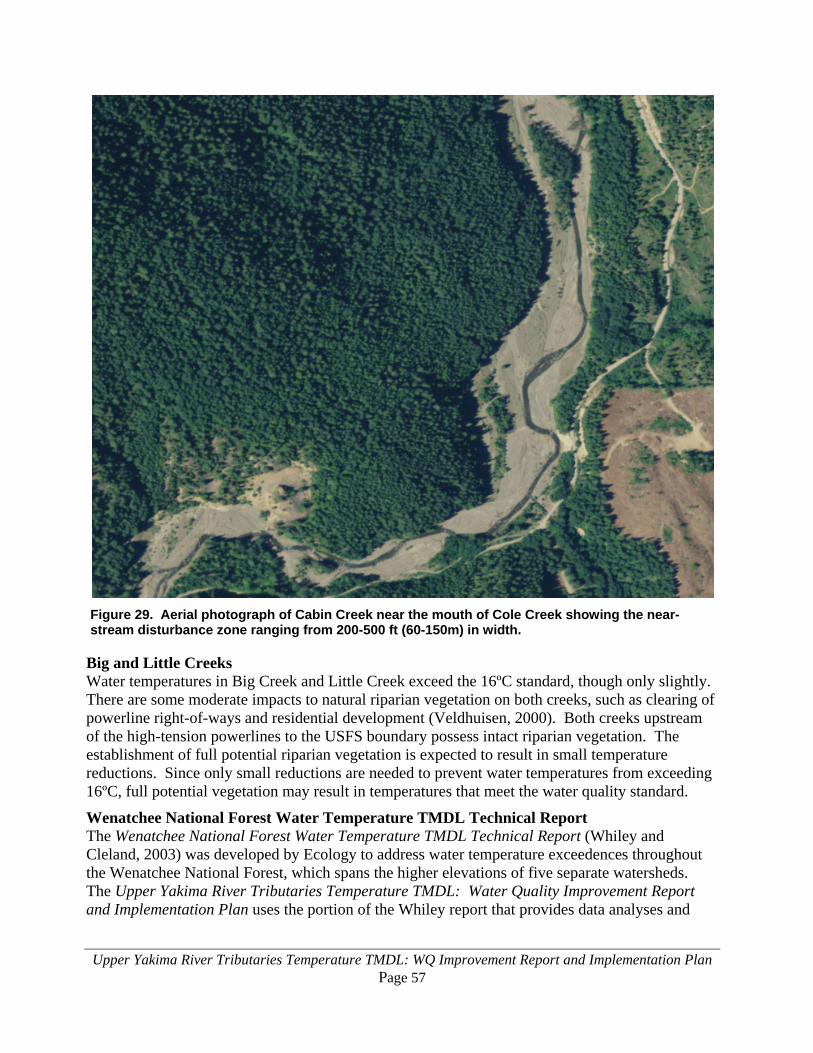
Upper Yakima River Tributaries Temperature TMDL: WQ Improvement Report and Implementation Plan Page 57
Figure 29. Aerial photograph of Cabin Creek near the mouth of Cole Creek showing the near-stream disturbance zone ranging from 200-500 ft (60-150m) in width.
Big and Little Creeks Water temperatures in Big Creek and Little Creek exceed the 16ºC standard, though only slightly. There are some moderate impacts to natural riparian vegetation on both creeks, such as clearing of powerline right-of-ways and residential development (Veldhuisen, 2000). Both creeks upstream of the high-tension powerlines to the USFS boundary possess intact riparian vegetation. The establishment of full potential riparian vegetation is expected to result in small temperature reductions. Since only small reductions are needed to prevent water temperatures from exceeding 16ºC, full potential vegetation may result in temperatures that meet the water quality standard.
Wenatchee National Forest Water Temperature TMDL Technical Report The Wenatchee National Forest Water Temperature TMDL Technical Report (Whiley and Cleland, 2003) was developed by Ecology to address water temperature exceedences throughout the Wenatchee National Forest, which spans the higher elevations of five separate watersheds. The Upper Yakima River Tributaries Temperature TMDL: Water Quality Improvement Report and Implementation Plan uses the portion of the Whiley report that provides data analyses and
Upper Yakima River Tributaries Temperature TMDL: WQ Improvement Report and Implementation Plan Page 58
load allocations for temperature-impaired streams located in the upper Yakima watershed and within the Wenatchee National Forest boundaries. In the Whiley report, identification of loading capacity targets utilized the landscape stratification system developed specifically for that TMDL analysis. The loading capacities reflected the range of variation in geologic setting and associated physical processes that occurred across the Wenatchee National Forest. Channel classes were based on three attributes, which included:
• Subsection Mapping Units (SMU) that reflect the geologic setting. • Watershed size. • Channel morphology.
Existing data collected by the USFS was used in a heat budget analysis to determine loading capacity targets. More information regarding the analysis and the loading capacity targets by landscape stratification is available in the Wenatchee National Forest Water Temperature TMDL Technical Report (Whiley and Cleland, 2003). Load allocations for the temperature-impaired streams identified in the Wenatchee National Forest Water Temperature TMDL Technical Report (Whiley and Cleland, 2003) are included in the next section of this document. Additionally, Appendix D of this document provides additional information related to the Whiley report.
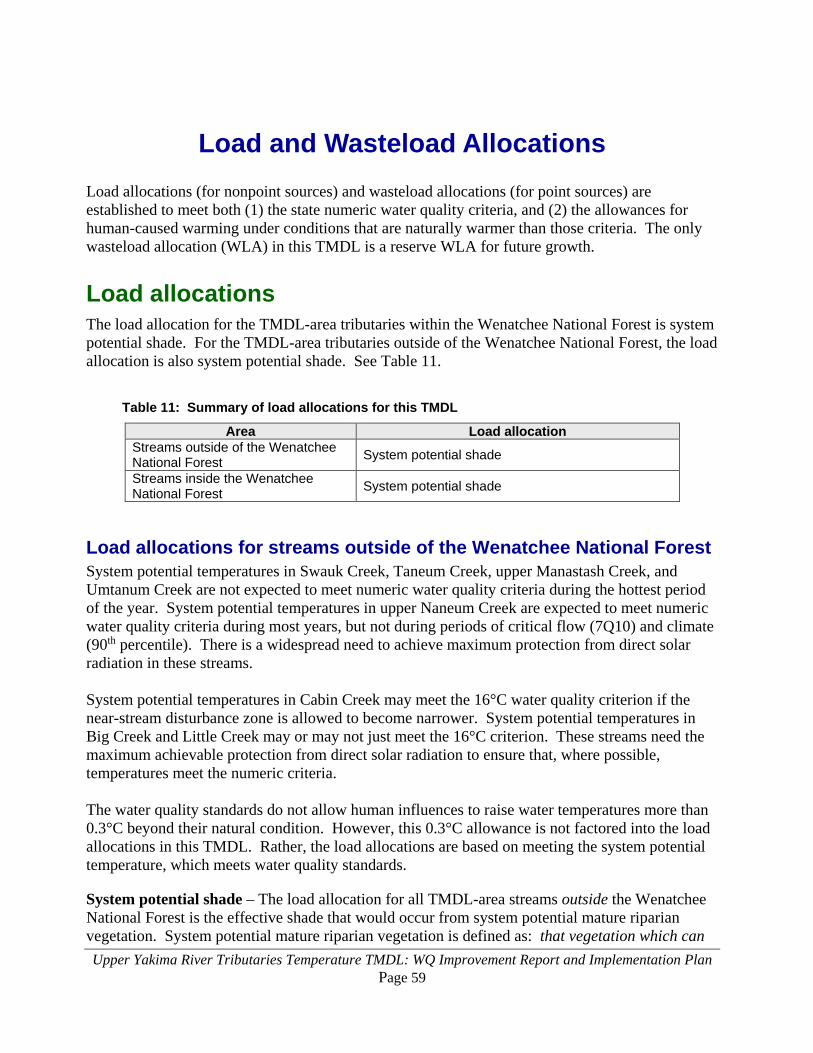
Upper Yakima River Tributaries Temperature TMDL: WQ Improvement Report and Implementation Plan Page 59
Load and Wasteload Allocations Load allocations (for nonpoint sources) and wasteload allocations (for point sources) are established to meet both (1) the state numeric water quality criteria, and (2) the allowances for human-caused warming under conditions that are naturally warmer than those criteria. The only wasteload allocation (WLA) in this TMDL is a reserve WLA for future growth.
Load allocations The load allocation for the TMDL-area tributaries within the Wenatchee National Forest is system potential shade. For the TMDL-area tributaries outside of the Wenatchee National Forest, the load allocation is also system potential shade. See Table 11.
Table 11: Summary of load allocations for this TMDL
Area Load allocation Streams outside of the Wenatchee National Forest System potential shade
Streams inside the Wenatchee National Forest System potential shade
Load allocations for streams outside of the Wenatchee National Forest System potential temperatures in Swauk Creek, Taneum Creek, upper Manastash Creek, and Umtanum Creek are not expected to meet numeric water quality criteria during the hottest period of the year. System potential temperatures in upper Naneum Creek are expected to meet numeric water quality criteria during most years, but not during periods of critical flow (7Q10) and climate (90th percentile). There is a widespread need to achieve maximum protection from direct solar radiation in these streams. System potential temperatures in Cabin Creek may meet the 16°C water quality criterion if the near-stream disturbance zone is allowed to become narrower. System potential temperatures in Big Creek and Little Creek may or may not just meet the 16°C criterion. These streams need the maximum achievable protection from direct solar radiation to ensure that, where possible, temperatures meet the numeric criteria. The water quality standards do not allow human influences to raise water temperatures more than 0.3°C beyond their natural condition. However, this 0.3°C allowance is not factored into the load allocations in this TMDL. Rather, the load allocations are based on meeting the system potential temperature, which meets water quality standards.
System potential shade – The load allocation for all TMDL-area streams outside the Wenatchee National Forest is the effective shade that would occur from system potential mature riparian vegetation. System potential mature riparian vegetation is defined as: that vegetation which can
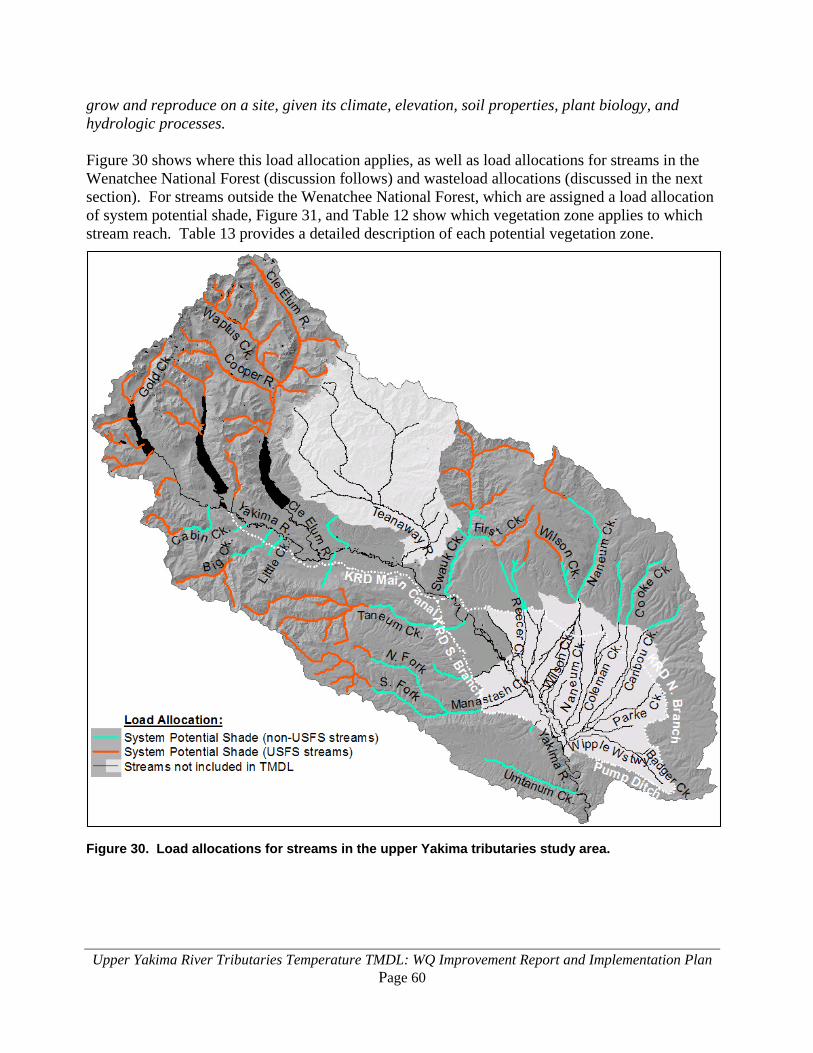
Upper Yakima River Tributaries Temperature TMDL: WQ Improvement Report and Implementation Plan Page 60
grow and reproduce on a site, given its climate, elevation, soil properties, plant biology, and hydrologic processes. Figure 30 shows where this load allocation applies, as well as load allocations for streams in the Wenatchee National Forest (discussion follows) and wasteload allocations (discussed in the next section). For streams outside the Wenatchee National Forest, which are assigned a load allocation of system potential shade, Figure 31, and Table 12 show which vegetation zone applies to which stream reach. Table 13 provides a detailed description of each potential vegetation zone.
Figure 30. Load allocations for streams in the upper Yakima tributaries study area.
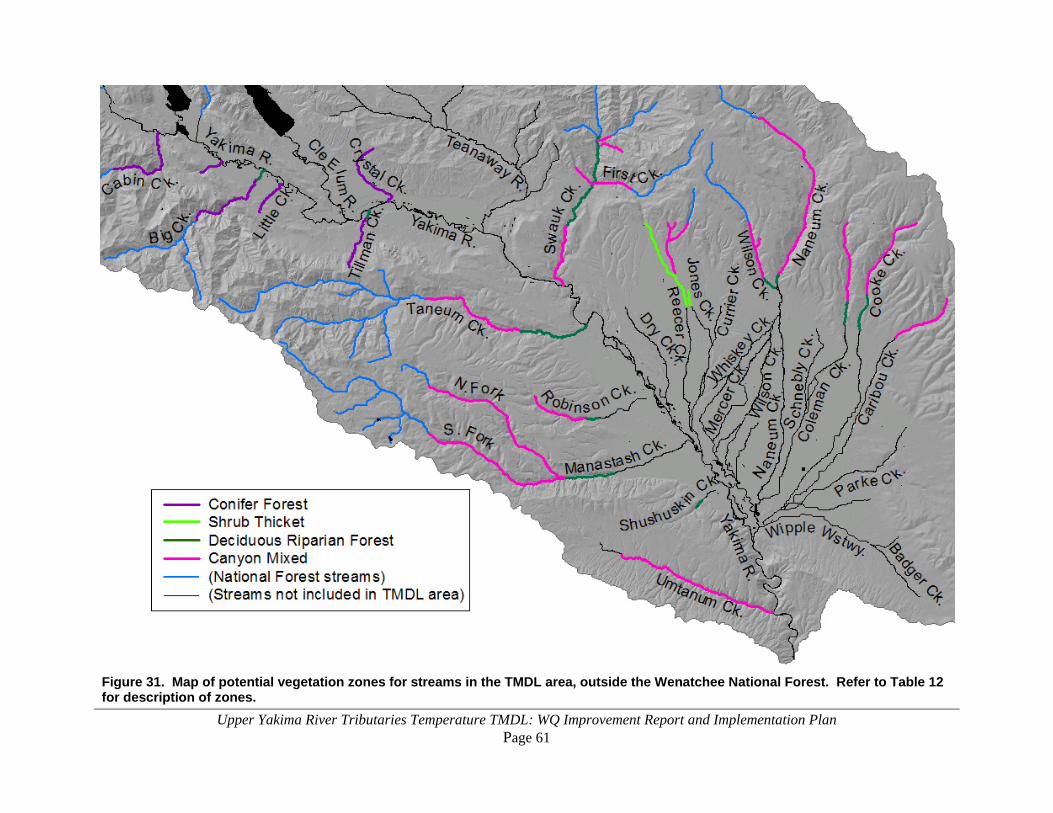
Upper Yakima River Tributaries Temperature TMDL: WQ Improvement Report and Implementation Plan Page 61
Figure 31. Map of potential vegetation zones for streams in the TMDL area, outside the Wenatchee National Forest. Refer to Table 12 for description of zones.
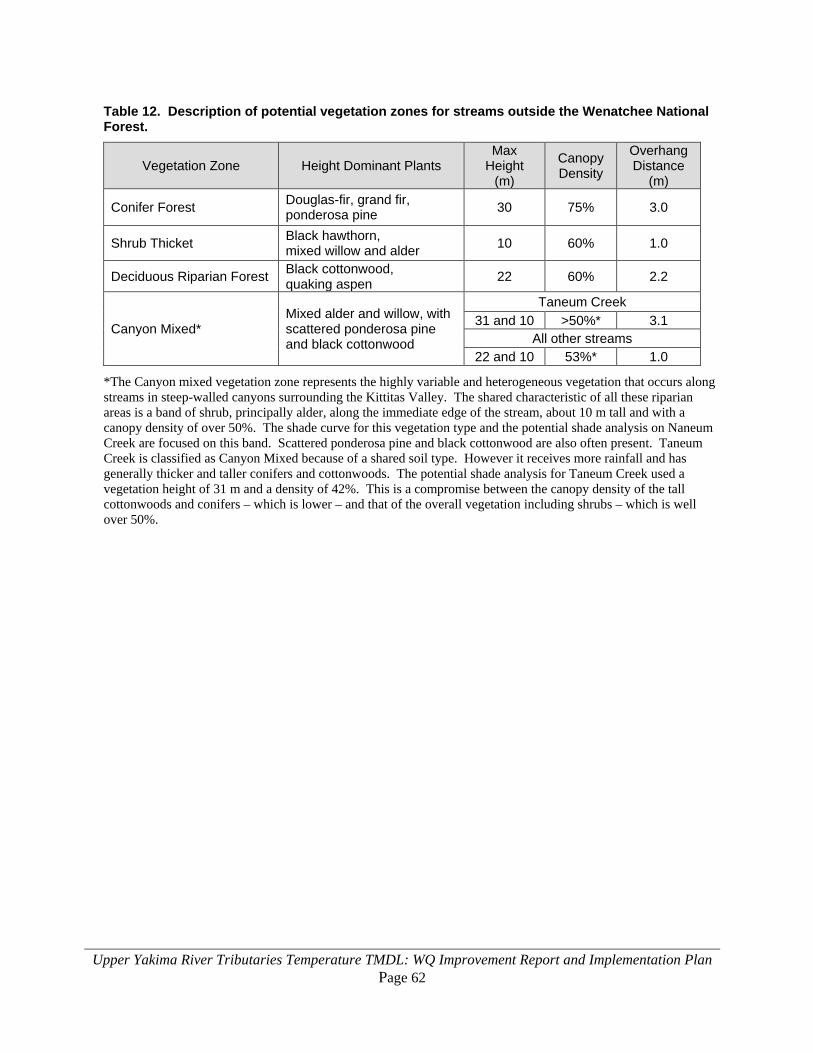
Upper Yakima River Tributaries Temperature TMDL: WQ Improvement Report and Implementation Plan Page 62
Table 12. Description of potential vegetation zones for streams outside the Wenatchee National Forest.
Vegetation Zone Height Dominant Plants Max
Height (m)
Canopy Density
Overhang Distance
(m)
Conifer Forest Douglas-fir, grand fir, ponderosa pine 30 75% 3.0
Shrub Thicket Black hawthorn, mixed willow and alder 10 60% 1.0
Deciduous Riparian Forest Black cottonwood, quaking aspen 22 60% 2.2
Canyon Mixed* Mixed alder and willow, with scattered ponderosa pine and black cottonwood
Taneum Creek 31 and 10 >50%* 3.1
All other streams 22 and 10 53%* 1.0
*The Canyon mixed vegetation zone represents the highly variable and heterogeneous vegetation that occurs along streams in steep-walled canyons surrounding the Kittitas Valley. The shared characteristic of all these riparian areas is a band of shrub, principally alder, along the immediate edge of the stream, about 10 m tall and with a canopy density of over 50%. The shade curve for this vegetation type and the potential shade analysis on Naneum Creek are focused on this band. Scattered ponderosa pine and black cottonwood are also often present. Taneum Creek is classified as Canyon Mixed because of a shared soil type. However it receives more rainfall and has generally thicker and taller conifers and cottonwoods. The potential shade analysis for Taneum Creek used a vegetation height of 31 m and a density of 42%. This is a compromise between the canopy density of the tall cottonwoods and conifers – which is lower – and that of the overall vegetation including shrubs – which is well over 50%.
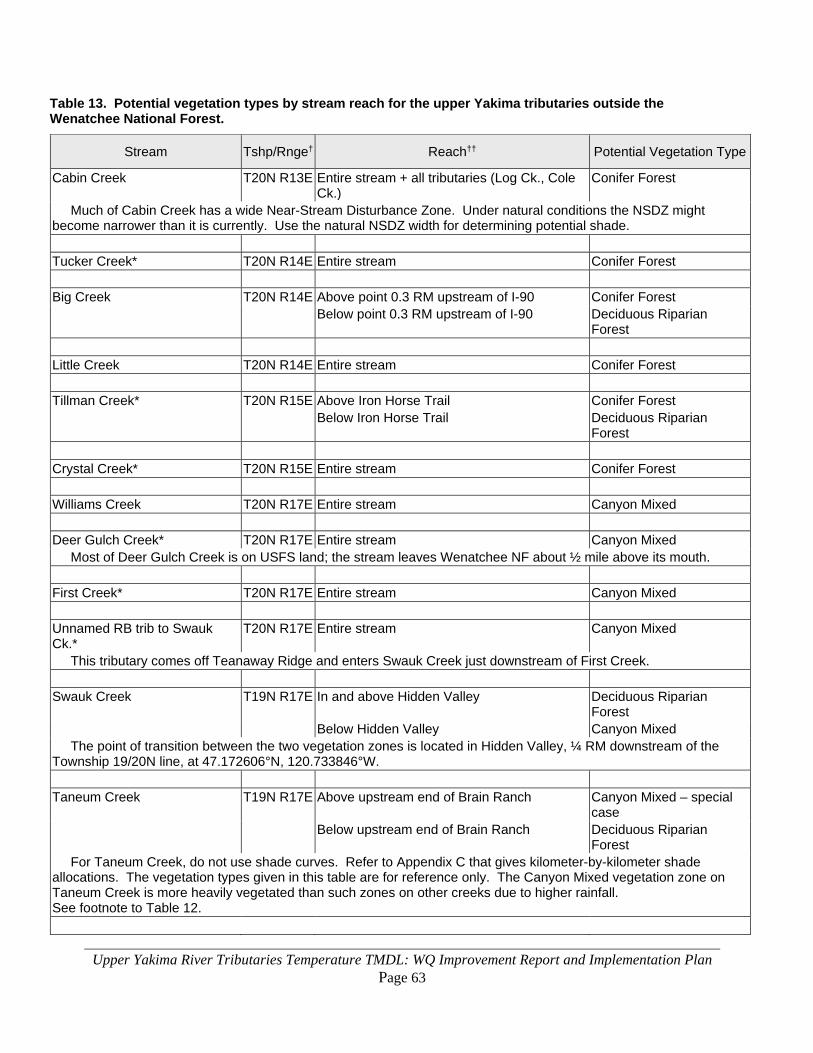
Upper Yakima River Tributaries Temperature TMDL: WQ Improvement Report and Implementation Plan Page 63
Table 13. Potential vegetation types by stream reach for the upper Yakima tributaries outside the Wenatchee National Forest.
Stream Tshp/Rnge† Reach†† Potential Vegetation Type
Cabin Creek T20N R13E Entire stream + all tributaries (Log Ck., Cole Ck.)
Conifer Forest
Much of Cabin Creek has a wide Near-Stream Disturbance Zone. Under natural conditions the NSDZ might become narrower than it is currently. Use the natural NSDZ width for determining potential shade. Tucker Creek* T20N R14E Entire stream Conifer Forest Big Creek T20N R14E Above point 0.3 RM upstream of I-90 Conifer Forest Below point 0.3 RM upstream of I-90 Deciduous Riparian
Forest Little Creek T20N R14E Entire stream Conifer Forest Tillman Creek* T20N R15E Above Iron Horse Trail Conifer Forest Below Iron Horse Trail Deciduous Riparian
Forest Crystal Creek* T20N R15E Entire stream Conifer Forest Williams Creek T20N R17E Entire stream Canyon Mixed Deer Gulch Creek* T20N R17E Entire stream Canyon Mixed Most of Deer Gulch Creek is on USFS land; the stream leaves Wenatchee NF about ½ mile above its mouth. First Creek* T20N R17E Entire stream Canyon Mixed Unnamed RB trib to Swauk Ck.*
T20N R17E Entire stream Canyon Mixed
This tributary comes off Teanaway Ridge and enters Swauk Creek just downstream of First Creek. Swauk Creek T19N R17E In and above Hidden Valley Deciduous Riparian
Forest Below Hidden Valley Canyon Mixed The point of transition between the two vegetation zones is located in Hidden Valley, ¼ RM downstream of the Township 19/20N line, at 47.172606°N, 120.733846°W. Taneum Creek T19N R17E Above upstream end of Brain Ranch Canyon Mixed – special
case Below upstream end of Brain Ranch Deciduous Riparian
Forest For Taneum Creek, do not use shade curves. Refer to Appendix C that gives kilometer-by-kilometer shade allocations. The vegetation types given in this table are for reference only. The Canyon Mixed vegetation zone on Taneum Creek is more heavily vegetated than such zones on other creeks due to higher rainfall. See footnote to Table 12.

Upper Yakima River Tributaries Temperature TMDL: WQ Improvement Report and Implementation Plan Page 64
Stream Tshp/Rnge† Reach†† Potential Vegetation Type
Robinson Creek** T18N R18E Above WDFW gate (T18N R17E, sec. 28-27 line)
Canyon Mixed
Below WDFW gate (T18N R17E, sec. 28-27 line)
Deciduous Riparian Forest
Manastash Creek T17N R18E North Fork Manastash Creek Canyon Mixed South Fork Manastash Creek Canyon Mixed Below N/S Fork confluence Deciduous Riparian
Forest Johnson Canyon Creek** T19N R18E Entire stream Canyon Mixed Green Canyon Creek** T19N R18E Entire stream Shrub Thicket Jones Creek** T18N R18E Portion of stream in TMDL area Shrub Thicket Currier Creek** T18N R18E Portion of stream in TMDL area Shrub Thicket Reecer Creek T17N R18E Above Green Canyon Creek Canyon Mixed From Green Canyon Creek to KRD Canal Shrub Thicket Shushuskin Creek* T17N R18E Portion of stream in TMDL area Deciduous Riparian
Forest Bear Creek* T19N R19E Entire stream Canyon Mixed Bear Creek is a tributary to the upper (Table Mtn.) Wilson Creek. The confluence is located in T19N R19E s. 7. Wilson Creek (upper)* T19N R19E Above point 1 RM upstream of Naneum
Creek Canyon Mixed
Below point 1 RM upstream of Naneum Creek
Deciduous Riparian Forest
This is the Wilson Creek which originates on Table Mountain and empties into Naneum Creek near the north end of Naneum Road. The point of transition between vegetation zones is located at the end of a driveway ~14372 Wilson Creek Rd., at 47.129279°N, 120.495170°W. Wilson Creek (lower) T17N R19E Portion of stream in TMDL area Deciduous Riparian
Forest This is the Wilson Creek which flows through Ellensburg, and empties into the Yakima River. Includes E and W branches through Ellensburg. Whiskey Creek** T17N R18E Portion of stream in TMDL area Deciduous Riparian
Forest Mercer Creek** T17N R18E Portion of stream in TMDL area Deciduous Riparian
Forest
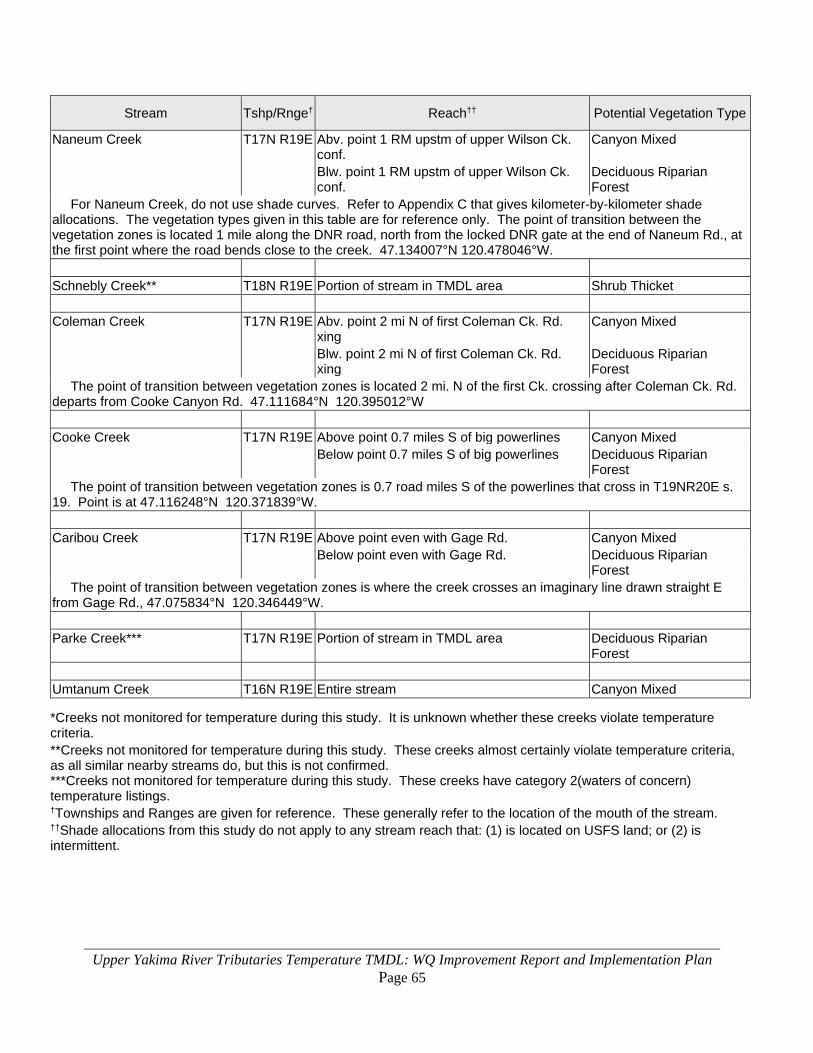
Upper Yakima River Tributaries Temperature TMDL: WQ Improvement Report and Implementation Plan Page 65
Stream Tshp/Rnge† Reach†† Potential Vegetation Type
Naneum Creek T17N R19E Abv. point 1 RM upstm of upper Wilson Ck. conf.
Canyon Mixed
Blw. point 1 RM upstm of upper Wilson Ck. conf.
Deciduous Riparian Forest
For Naneum Creek, do not use shade curves. Refer to Appendix C that gives kilometer-by-kilometer shade allocations. The vegetation types given in this table are for reference only. The point of transition between the vegetation zones is located 1 mile along the DNR road, north from the locked DNR gate at the end of Naneum Rd., at the first point where the road bends close to the creek. 47.134007°N 120.478046°W. Schnebly Creek** T18N R19E Portion of stream in TMDL area Shrub Thicket Coleman Creek T17N R19E Abv. point 2 mi N of first Coleman Ck. Rd.
xing Canyon Mixed
Blw. point 2 mi N of first Coleman Ck. Rd. xing
Deciduous Riparian Forest
The point of transition between vegetation zones is located 2 mi. N of the first Ck. crossing after Coleman Ck. Rd. departs from Cooke Canyon Rd. 47.111684°N 120.395012°W Cooke Creek T17N R19E Above point 0.7 miles S of big powerlines Canyon Mixed Below point 0.7 miles S of big powerlines Deciduous Riparian
Forest The point of transition between vegetation zones is 0.7 road miles S of the powerlines that cross in T19NR20E s. 19. Point is at 47.116248°N 120.371839°W. Caribou Creek T17N R19E Above point even with Gage Rd. Canyon Mixed Below point even with Gage Rd. Deciduous Riparian
Forest The point of transition between vegetation zones is where the creek crosses an imaginary line drawn straight E from Gage Rd., 47.075834°N 120.346449°W. Parke Creek*** T17N R19E Portion of stream in TMDL area Deciduous Riparian
Forest Umtanum Creek T16N R19E Entire stream Canyon Mixed
*Creeks not monitored for temperature during this study. It is unknown whether these creeks violate temperature criteria. **Creeks not monitored for temperature during this study. These creeks almost certainly violate temperature criteria, as all similar nearby streams do, but this is not confirmed. ***Creeks not monitored for temperature during this study. These creeks have category 2(waters of concern) temperature listings. †Townships and Ranges are given for reference. These generally refer to the location of the mouth of the stream. ††Shade allocations from this study do not apply to any stream reach that: (1) is located on USFS land; or (2) is intermittent.
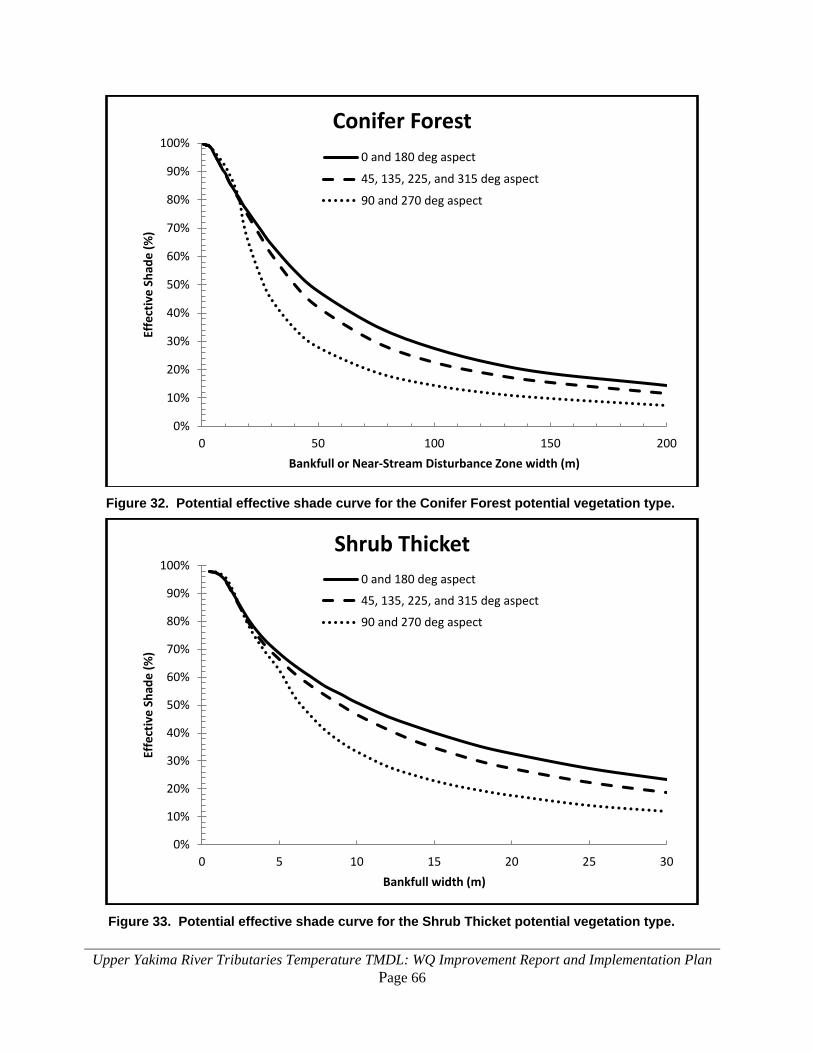
Upper Yakima River Tributaries Temperature TMDL: WQ Improvement Report and Implementation Plan Page 66
Figure 32. Potential effective shade curve for the Conifer Forest potential vegetation type.
Figure 33. Potential effective shade curve for the Shrub Thicket potential vegetation type.
0%
10%
20%
30%
40%
50%
60%
70%
80%
90%
100%
0 50 100 150 200
Effe
ctiv
e Sh
ade
(%)
Bankfull or Near-Stream Disturbance Zone width (m)
Conifer Forest0 and 180 deg aspect
45, 135, 225, and 315 deg aspect
90 and 270 deg aspect
0%
10%
20%
30%
40%
50%
60%
70%
80%
90%
100%
0 5 10 15 20 25 30
Effe
ctiv
e Sh
ade
(%)
Bankfull width (m)
Shrub Thicket0 and 180 deg aspect
45, 135, 225, and 315 deg aspect
90 and 270 deg aspect
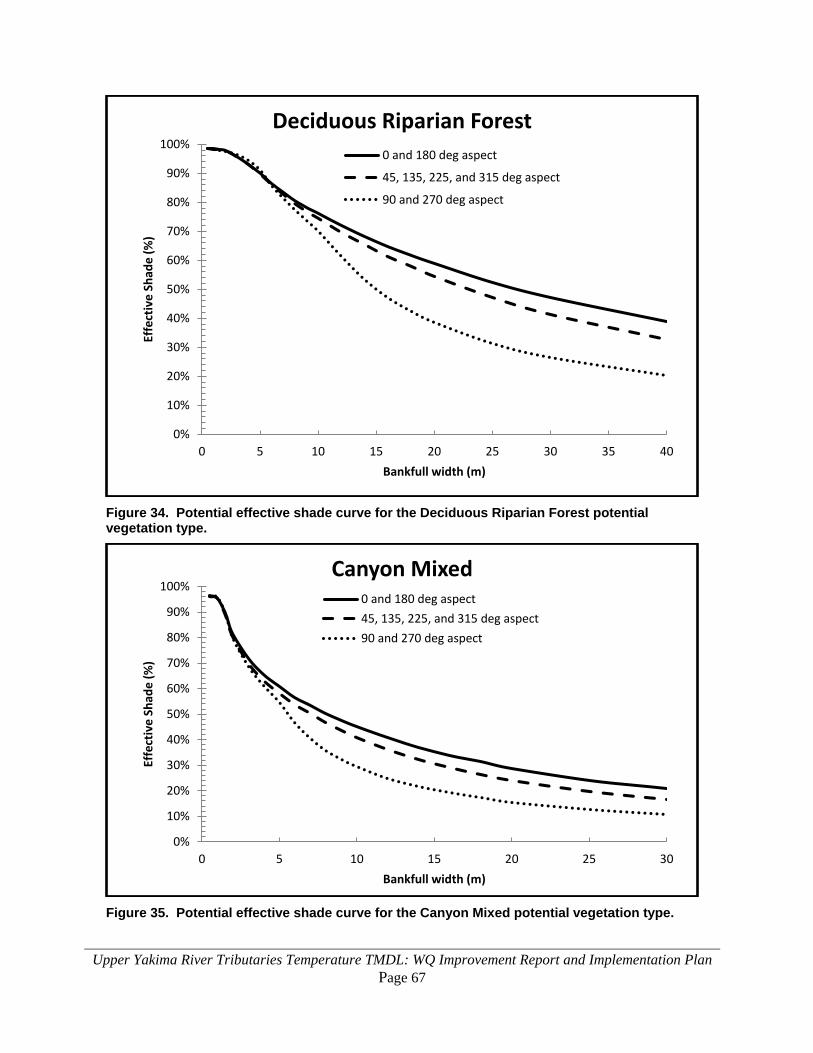
Upper Yakima River Tributaries Temperature TMDL: WQ Improvement Report and Implementation Plan Page 67
Figure 34. Potential effective shade curve for the Deciduous Riparian Forest potential vegetation type.
Figure 35. Potential effective shade curve for the Canyon Mixed potential vegetation type.
0%
10%
20%
30%
40%
50%
60%
70%
80%
90%
100%
0 5 10 15 20 25 30 35 40
Effe
ctiv
e Sh
ade
(%)
Bankfull width (m)
Deciduous Riparian Forest0 and 180 deg aspect
45, 135, 225, and 315 deg aspect
90 and 270 deg aspect
0%
10%
20%
30%
40%
50%
60%
70%
80%
90%
100%
0 5 10 15 20 25 30
Effe
ctiv
e Sh
ade
(%)
Bankfull width (m)
Canyon Mixed0 and 180 deg aspect45, 135, 225, and 315 deg aspect90 and 270 deg aspect

Upper Yakima River Tributaries Temperature TMDL: WQ Improvement Report and Implementation Plan Page 68
Streams within the Wenatchee National Forest The load allocation for all TMDL-area streams inside the Wenatchee National Forest is system potential shade, which is the effective shade that would occur from system potential mature riparian vegetation. System potential mature riparian vegetation is defined as: that vegetation which can grow and reproduce on a site, given its climate, elevation, soil properties, plant biology, and hydrologic processes. For streams in the Wenatchee National Forest, a channel classification system was used to determine site potential effective shade targets (Whiley and Cleland, 2003). The channel classification system reflects the range of variation in geologic settings and associated physical processes that occur across the Wenatchee National Forest (see Appendix D). The Wenatchee National Forest Water Temperature TMDL Technical Report (Whiley and Cleland, 2003) uses percent effective shade as a surrogate measure of heat flux. Table 14 outlines the effective shade levels required to meet the state numeric temperature criteria, and the effective shade level provided by site potential vegetation. Refer to Appendix D for further information on using these tables.

Upper Yakima River Tributaries Temperature TMDL: WQ Improvement Report and Implementation Plan Page 69
Table 14. Load allocations by channel class, for water bodies in the Wenatchee National Forest within the boundaries of this TMDL.
Classifi-cation
Flow (cfs)
W:D (wetted)
Effective Shade needed to meet 16°C numeric temp. criteria (%) *
System Potential Effective Shade (%) ** Load Allocation
(% Effective Shade)
Group a Group b Group c M242Ca Wenatchee Highlands
System potential
effective shade ***
Ca-3C 4 30 65 46 58 67 Ca-4C 8 35 60 43 55 63 Ca-5C 16 40 55 39 51 58 Ca-6C 32 45 50 33 44 51
M242Cd Cle Elum / Lake Wenatchee Mountain Valleys Cd-1A 1 10 70 48 61 70 Cd-2B 2 15 70 47 61 69 Cd-5C 16 40 55 39 51 58 Cd-6C 32 15 50 33 44 51
M242Cn Upper Yakima / Swauk Sandstone Hills Cn-1A 1 10 70 48 61 70 Cn-2B 2 15 70 47 61 69 Cn-4C 8 30 60 43 55 63
M242Co Upper Yakima Basin Co-2B 2 15 70 47 61 69 Co-3C 4 30 65 46 58 67 Co-4C 8 35 60 43 55 63 Co-5C 16 40 55 39 51 58
M242Cp Naches Mountains Cp-1A 1 10 70 48 61 70 Cp-1B 1 15 70 48 61 70 Cp-2B 2 15 70 47 61 69 Cp-2C 2 25 70 47 61 69 Cp-3B 4 20 60 46 58 67 Cp-3C 4 30 65 46 58 67 Cp-4C 8 35 60 43 55 63
*This column was titled “TMDL Allocation Effective Shade” in the Wenatchee National Forest Water Temperature TMDL Technical Report (Whiley and Cleland, 2003). Change made here for clarity.
** Group-a comprises ponderosa pine and Douglas fir. Group-b is the Douglas fir/grand fir vegetative group. Group-c includes other vegetative groups such as grand fir/western hemlock, western hemlock, Pacific silver fir/mountain hemlock, and sub-alpine fir.
*** Where “system potential effective shade” is greater than “effective shade needed to meet 16°C numeric temp. criteria,” the difference is included in the margin of safety for the TMDL.
Based on the classification scheme presented in Table 14, along with associated load allocations, the percent effective shade applicable for streams throughout the forest can be extrapolated. Direct application of Table 14 to the listed and impaired streams is provided in Tables 15 and 16.
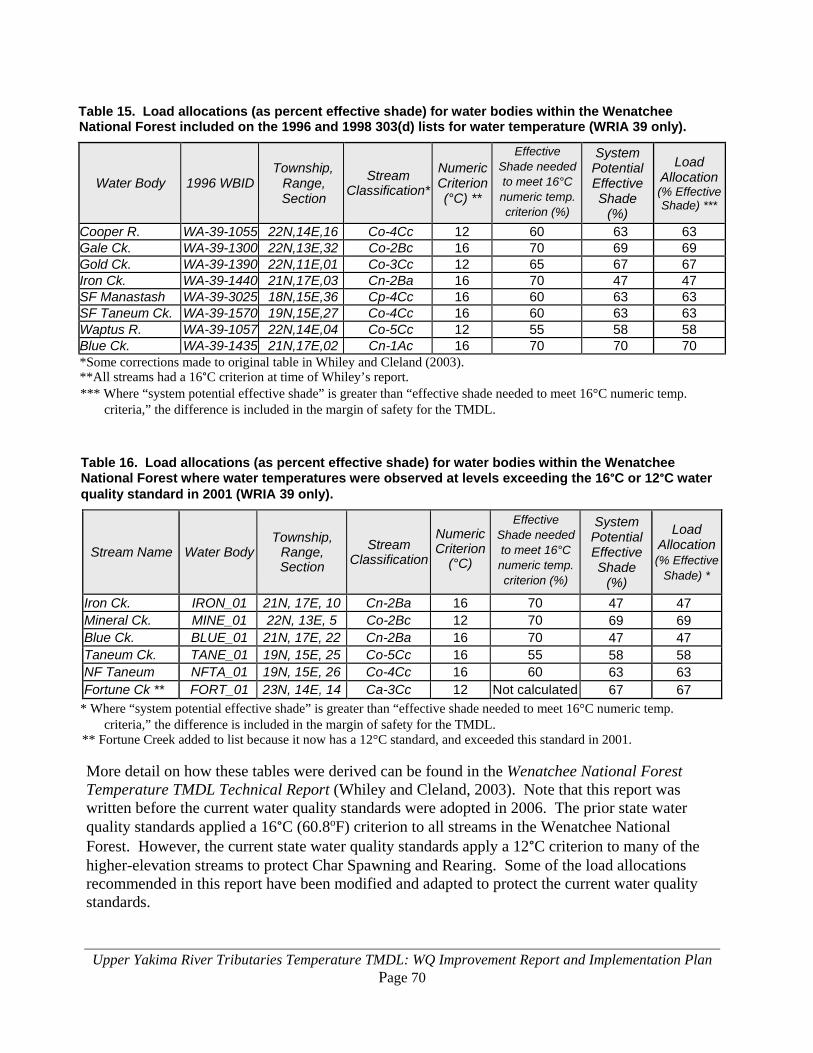
Upper Yakima River Tributaries Temperature TMDL: WQ Improvement Report and Implementation Plan Page 70
Table 15. Load allocations (as percent effective shade) for water bodies within the Wenatchee National Forest included on the 1996 and 1998 303(d) lists for water temperature (WRIA 39 only).
Water Body 1996 WBID Township,
Range, Section
Stream Classification*
Numeric Criterion (°C) **
Effective Shade needed to meet 16°C numeric temp. criterion (%)
System Potential Effective Shade
(%)
Load Allocation (% Effective Shade) ***
Cooper R. WA-39-1055 22N,14E,16 Co-4Cc 12 60 63 63 Gale Ck. WA-39-1300 22N,13E,32 Co-2Bc 16 70 69 69 Gold Ck. WA-39-1390 22N,11E,01 Co-3Cc 12 65 67 67 Iron Ck. WA-39-1440 21N,17E,03 Cn-2Ba 16 70 47 47 SF Manastash
WA-39-3025 18N,15E,36 Cp-4Cc 16 60 63 63
SF Taneum Ck. WA-39-1570 19N,15E,27 Co-4Cc 16 60 63 63 Waptus R. WA-39-1057 22N,14E,04 Co-5Cc 12 55 58 58 Blue Ck. WA-39-1435 21N,17E,02 Cn-1Ac 16 70 70 70 *Some corrections made to original table in Whiley and Cleland (2003). **All streams had a 16°C criterion at time of Whiley’s report. *** Where “system potential effective shade” is greater than “effective shade needed to meet 16°C numeric temp.
criteria,” the difference is included in the margin of safety for the TMDL.
Table 16. Load allocations (as percent effective shade) for water bodies within the Wenatchee National Forest where water temperatures were observed at levels exceeding the 16°C or 12°C water quality standard in 2001 (WRIA 39 only).
Stream Name Water Body Township,
Range, Section
Stream Classification
Numeric Criterion
(°C)
Effective Shade needed to meet 16°C numeric temp. criterion (%)
System Potential Effective Shade
(%)
Load Allocation (% Effective
Shade) *
Iron Ck. IRON_01 21N, 17E, 10 Cn-2Ba 16 70 47 47 Mineral Ck. MINE_01 22N, 13E, 5 Co-2Bc 12 70 69 69 Blue Ck. BLUE_01 21N, 17E, 22 Cn-2Ba 16 70 47 47 Taneum Ck. TANE_01 19N, 15E, 25 Co-5Cc 16 55 58 58 NF Taneum
NFTA_01 19N, 15E, 26 Co-4Cc 16 60 63 63
Fortune Ck ** FORT_01 23N, 14E, 14 Ca-3Cc 12 Not calculated 67 67 * Where “system potential effective shade” is greater than “effective shade needed to meet 16°C numeric temp.
criteria,” the difference is included in the margin of safety for the TMDL. ** Fortune Creek added to list because it now has a 12°C standard, and exceeded this standard in 2001. More detail on how these tables were derived can be found in the Wenatchee National Forest Temperature TMDL Technical Report (Whiley and Cleland, 2003). Note that this report was written before the current water quality standards were adopted in 2006. The prior state water quality standards applied a 16°C (60.8oF) criterion to all streams in the Wenatchee National Forest. However, the current state water quality standards apply a 12°C criterion to many of the higher-elevation streams to protect Char Spawning and Rearing. Some of the load allocations recommended in this report have been modified and adapted to protect the current water quality standards.
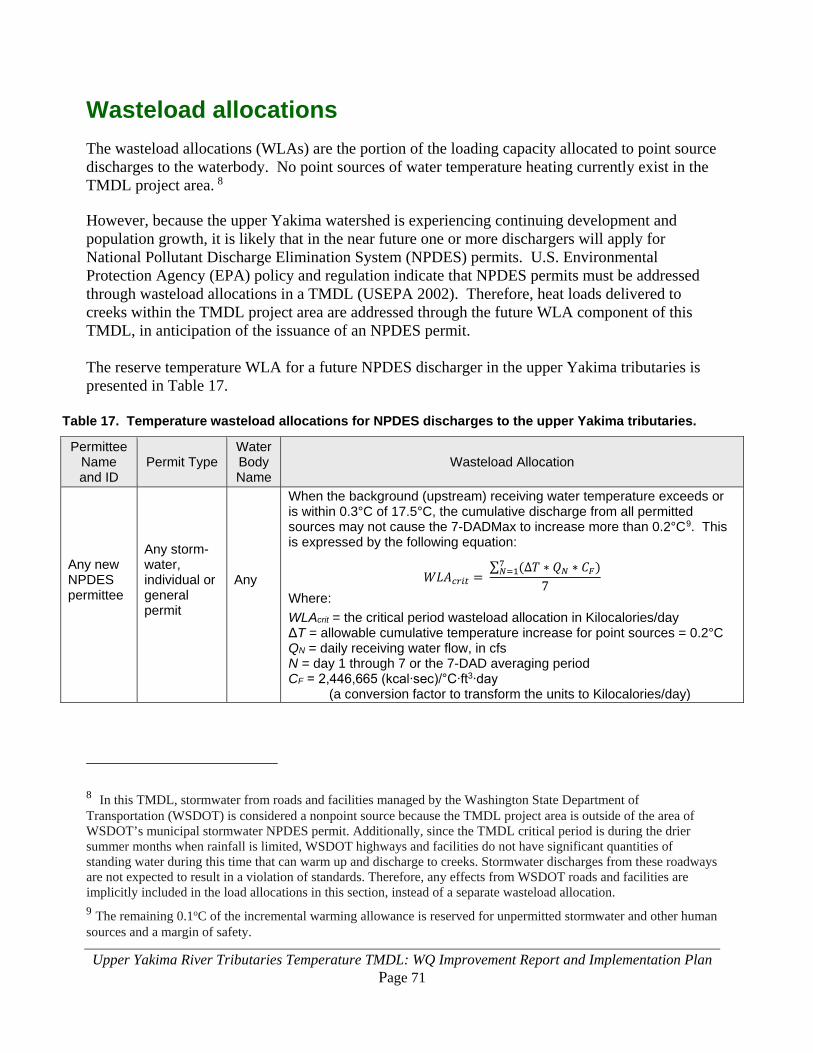
Upper Yakima River Tributaries Temperature TMDL: WQ Improvement Report and Implementation Plan Page 71
Wasteload allocations The wasteload allocations (WLAs) are the portion of the loading capacity allocated to point source discharges to the waterbody. No point sources of water temperature heating currently exist in the TMDL project area. 8 However, because the upper Yakima watershed is experiencing continuing development and population growth, it is likely that in the near future one or more dischargers will apply for National Pollutant Discharge Elimination System (NPDES) permits. U.S. Environmental Protection Agency (EPA) policy and regulation indicate that NPDES permits must be addressed through wasteload allocations in a TMDL (USEPA 2002). Therefore, heat loads delivered to creeks within the TMDL project area are addressed through the future WLA component of this TMDL, in anticipation of the issuance of an NPDES permit. The reserve temperature WLA for a future NPDES discharger in the upper Yakima tributaries is presented in Table 17.
Table 17. Temperature wasteload allocations for NPDES discharges to the upper Yakima tributaries.
Permittee Name and ID
Permit Type Water Body Name
Wasteload Allocation
Any new NPDES permittee
Any storm-water, individual or general permit
Any
When the background (upstream) receiving water temperature exceeds or is within 0.3°C of 17.5°C, the cumulative discharge from all permitted sources may not cause the 7-DADMax to increase more than 0.2°C9. This is expressed by the following equation:
𝑊𝑊𝑊𝑊𝑊𝑊𝑐𝑐𝑐𝑐𝑐𝑐𝑐𝑐 = ∑ (∆𝑇𝑇 ∗ 𝑄𝑄𝑁𝑁 ∗ 𝐶𝐶𝐹𝐹)7𝑁𝑁=1
7
Where: WLAcrit = the critical period wasteload allocation in Kilocalories/day ΔT = allowable cumulative temperature increase for point sources = 0.2°C QN = daily receiving water flow, in cfs N = day 1 through 7 or the 7-DAD averaging period CF = 2,446,665 (kcal∙sec)/°C∙ft3∙day
(a conversion factor to transform the units to Kilocalories/day)
8 In this TMDL, stormwater from roads and facilities managed by the Washington State Department of Transportation (WSDOT) is considered a nonpoint source because the TMDL project area is outside of the area of WSDOT’s municipal stormwater NPDES permit. Additionally, since the TMDL critical period is during the drier summer months when rainfall is limited, WSDOT highways and facilities do not have significant quantities of standing water during this time that can warm up and discharge to creeks. Stormwater discharges from these roadways are not expected to result in a violation of standards. Therefore, any effects from WSDOT roads and facilities are implicitly included in the load allocations in this section, instead of a separate wasteload allocation.
9 The remaining 0.1oC of the incremental warming allowance is reserved for unpermitted stormwater and other human sources and a margin of safety.
Upper Yakima River Tributaries Temperature TMDL: WQ Improvement Report and Implementation Plan Page 72
Seasonal variation Clean Water Act (CWA) Section 303(d)(1) requires that TMDLs “be established at the level necessary to implement the applicable water quality standards with seasonal variations.” The current regulation also states that determination of “TMDLs shall take into account critical conditions for streamflow, loading, and water quality parameters” [40 CFR 130.7(c)(1)]. Finally, Section 303(d)(1)(D) suggests consideration of normal conditions, flows, and dissipative capacity. Existing conditions for water temperatures in the upper Yakima River tributaries reflect seasonal variation. Cooler temperatures occur in the winter, while warmer temperatures are observed in the summer. Table 7, Figures 22 and 23, summarize the highest daily maximum and the highest seven-day average maximum water temperatures for 2005 and 2006. The highest temperatures typically occur during July and August. This timeframe is used as the critical condition period for development of the Upper Yakima River Tributaries Temperature TMDL. Seasonal estimates for streamflow, solar flux, and climatic variables for the TMDL are taken into account to develop critical conditions for the TMDL model. The critical period for evaluation of solar flux and effective shade was represented by conditions occurring on July 25. This date represented critical meteorological conditions in 2006 (see data summary), and is near the mid-point of the period when water temperatures are typically at their seasonal peak. The time period from July 22-28, 2006 was chosen to represent extreme 90th percentile climatic conditions, or approximately the week of highest solar radiation that could be expected to occur once every 10 years. The time period from August 5-11, 2005 was chosen to represent a less extreme 50th percentile critical condition, or approximately the week of highest solar radiation that could be expected to occur during a typical year. Critical streamflows for the TMDL were evaluated as the lowest 7-day average flows with a 2-year recurrence interval (7Q2), and 10-year recurrence interval (7Q10). The 7Q2 streamflow was assumed to represent conditions that would occur during a typical climatic year, and the 7Q10 streamflow was assumed to represent a reasonable worst-case climatic year.

Upper Yakima River Tributaries Temperature TMDL: WQ Improvement Report and Implementation Plan Page 73
Margin of Safety The margin of safety (MOS) accounts for uncertainty about the pollutant loading and water-body response in a way that is protective of water quality. In this TMDL, the MOS is addressed in two ways.
Implicit In this TMDL an implicit MOS is being applied by using conservative modeling assumptions:
• Streams outside of Wenatchee National Forest
o A reasonable worst-case period for prediction of water temperatures in the upper Yakima tributaries was represented by the time when the 90th percentile of the highest 7-day averages of daily maximum air temperatures for each year of record at the Yakima airport occurred. Typical conditions were represented by the time period when the 50th percentile of the highest 7-day averages of daily maximum temperatures occurred. Air temperature is used as a general measure surrogate of solar radiation.
o For stream segments evaluated using the QUAL2K model, reasonable worst-case conditions were evaluated using the lowest 7-day average flows with a recurrence interval of 10 years (7Q10). Typical conditions were evaluated using the lowest 7-day average flows with recurrence intervals of 2 years (7Q2).
• Streams within Wenatchee National Forest
o Much of the data used in this analysis is based on the monitoring data collected by the USFS during the summer of 2001. Physical conditions represented by both air temperature and stream flow indicate that 2001 was unusual: air temperatures were at historic highs and stream flows at historic lows. These conditions, along with other factors, provided for warmer water temperatures, particularly for those water bodies with low effective shade levels. Because of these critical conditions, the analysis results based on the 2001 data provides a high MOS.
Explicit An explicit MOS is being applied with load allocations set to the effective shade provided by full mature riparian vegetation, which meets water quality standards. If the reserve wasteload allocation for future growth is ever utilized, then in the areas affected 0.2°C out of the 0.3°C allowance that could be applied to human impacts will be applied to that WLA, leaving only 0.1°C as an MOS. Additionally, this TMDL sets all load allocations in the Wenatchee National Forest to be system potential effective shade. Where system potential effective shade is greater than “effective shade needed to meet 16°C numeric temperature criteria,” the difference is applied to the explicit MOS.

Upper Yakima River Tributaries Temperature TMDL: WQ Improvement Report and Implementation Plan Page 74
This page is purposely left blank.
Upper Yakima River Tributaries Temperature TMDL: WQ Improvement Report and Implementation Plan Page 75
Reasonable Assurances
The ultimate goals of this TMDL project are to meet the TMDL targets for water temperature. Maintaining the TMDL goals will be required once compliance has been achieved. Ecology offers reasonable assurance that the TMDL goals will be met, due to the following: When establishing a TMDL, reductions of a particular pollutant are allocated among the pollutant sources (both point and nonpoint sources) in the water body. For the Upper Yakima River Tributaries Temperature TMDL both point and nonpoint sources exist. TMDLs (and related action plans) must show “reasonable assurance” that these sources will be reduced to their allocated amount. System potential effective shade is expected to result in water temperatures that are equivalent to the temperatures that would occur under natural conditions. Therefore, setting load allocations to potential effective shade would be the fullest possible shade restoration implementation to help water temperatures meet the water quality standard. Riparian restoration is also expected to help address any degradation of channel structure, which will in turn help the stream achieve standards. Modifications of basin hydrology and management of water rights are beyond the scope of this project. However, if potential effects on stream temperature are taken into account, managing these factors as part of the overall watershed and salmonid habitat restoration and water management programs should benefit stream temperatures and support uses protected by the standards. Mature riparian vegetation also improves microclimate conditions near the stream. This has the potential to further reduce stream temperatures. A strategy is recommended to address other influences on stream temperature such as sediment loading, channel sinuosity, groundwater inflows, and hyporheic exchange. Especially in the case of Cabin Creek, strategies to address the wide area of channel disturbance in the lower portion of the stream would allow shading to be more effective.
Load allocations are included in this TMDL for non-federal forest lands, in accordance with Section M-2 of the Forests and Fish Report (www.dnr.wa.gov/Publications/fp_rules_forestsandfish.pdf). Expectations for TMDL implementation on non-federal forest lands are discussed in the TMDL Implementation Plan, later in this document. There is considerable interest and local involvement toward resolving the water quality problems in the upper Yakima River watershed. Education, outreach, technical and financial assistance, permit administration, and enforcement, will all be used to ensure that the goals of this water cleanup plan are met. Numerous organizations and agencies are already engaged in stream restoration and source correction actions that will help resolve the temperature problem. Past and
Upper Yakima River Tributaries Temperature TMDL: WQ Improvement Report and Implementation Plan Page 76
ongoing activities by the Kittitas County Conservation District (KCCD, the city of Ellensburg, the Washington Department of Fish and Wildlife, Natural Resources Conservation Service (NRCS), Ecology, the Yakama Nation, and landowners, already support the goals of this TMDL. Ecology believes that the following activities already support this TMDL project and add to the assurance that water temperatures in the upper Yakima River watershed will meet the criteria established in the state water quality standards. This assumes that the following activities are continued and maintained.
Ongoing riparian restoration projects Natural Resources Conservation Service Programs The NRCS promotes and administers the Environmental Quality Improvement Plan (EQIP), and the Continuous Conservation Reserve Program (CCRP). These programs are available to landowners for incentive to protect and enhance riparian zones.
US Forest Service (USFS) – Cle Elum Ranger District Activities The Cle Elum Ranger District regularly works to protect and enhance riparian habitat, as well as improve current forest roads and close out less-used forest roads to prevent erosion. Additionally, since the USFS is the major landowner in this TMDL project area and its lands are at the heads of many upper Yakima River tributaries, active participation by the USFS is critical to the success of this TMDL project.
The Yakima Tributary Access and Habitat Program (YTAHP) YTAHP is a partnership between the South Central Washington Resource Conservation & Development Council (RC&D), Kittitas County Conservation District (KCCD), North Yakima Conservation District, Washington Department of Fish and Wildlife (WDFW), Yakama Nation, Kittitas Conservation Trust, Mid-Columbia Regional Fisheries Enhancement Group, Benton Conservation District, the Yakima Basin Fish & Wildlife Recovery Board, Yakima Basin Joint Board, and Ecology. YTAHP was formed to provide voluntary assistance to landowners with water rights from tributaries in Yakima and Kittitas Counties in dealing with unscreened diversions and barriers to fish passage.
YTAHP’s goals are: (1) to restore access to the Yakima River tributaries that historically supported anadromous salmonids, but are currently blocked due to fish passage barriers, and: (2) to improve habitat as possible. The objective is to identify the barriers, diversions, and degraded habitat, and prioritize those identified for correction.
The Washington State Conservation Commission (SCC) The SCC is the agency responsible for implementing the Conservation Reserve Enhancement Program (CREP). The CREP program is used to assist private landowners with the establishment of riparian vegetation buffers on streams with Endangered Species Act (ESA)-listed anadromous fish.
Formation of citizens Technical Advisory Workgroup In 2005, a Technical Advisory Workgroup (TAW) was formed to direct and support development of this TMDL project. In such capacity, the TAW has made many suggestions for modifications
Upper Yakima River Tributaries Temperature TMDL: WQ Improvement Report and Implementation Plan Page 77
to the TMDL report. The majority of members of the TAW are key community members with interests in compliance, and who promote the success of implementation.
Supporting regulations and land management plans Kittitas County Shoreline Master Program, and Critical Areas Ordinances Kittitas County administers its Critical Areas Ordinances and Shoreline Master Program. In general, these laws require that riparian areas must be protected from erosion and general destabilization, and development along shorelines must be controlled. Enforcement of these laws helps to ensure that streambank erosion in much of the project area can be reduced, directly supporting this TMDL project. Violation of the Critical Areas Ordinance can be prosecuted by Kittitas County. Kittitas County is currently revising both its Critical Areas Ordinances, and its Shoreline Master Plan, which will greatly increase riparian protection in the county. Under the Shoreline Management Act (SMA), local governments have the primary responsibility for initiating the planning programs and administering the regulatory requirements in support of the SMA, with Ecology serving in a supportive and review capacity. Kittitas County and Ecology share the responsibility for permit review and enforcement, as described in Chapter 173-27 WAC. Under the SMA,"shorelands" or "shoreland areas" means “those lands extending landward for two hundred feet in all directions as measured on a horizontal plane from the ordinary high water mark; floodways and contiguous floodplain areas landward two hundred feet from such floodways; and all wetlands and river deltas associated with the streams[and] lakes ….” (RCW 90.58.030(2)(d)). “Shorelines” means “all of the water areas of the state, including reservoirs, and their associated shorelands, together with the lands underlying them; except (i) shorelines of statewide significance10; (ii) shorelines on segments of streams upstream of a point where the mean annual flow is twenty cubic feet per second or less and the wetlands associated with such upstream segments; and (iii) shorelines on lakes less than twenty acres in size and wetlands associated with such small lakes” (RCW 90.58.030(2)(e)).
Memorandum of Agreement with U.S. Forest Service (USFS) In 2000, the USFS – Region 6 and Ecology signed a Memorandum of Agreement (MOA) addressing protection of water quality on federal forestlands in Washington State. As part of the required actions under this MOA, the USFS is actively working to maintain and improve roads that may cause the entry of sediment into area waterways. The USFS also developed several programs to restore damaged riparian areas and to educate the public regarding respect for rivers and riparian areas. All of these efforts will directly support the Upper Yakima River Tributaries Temperature TMDL project and help to ensure its success.
10 “Shorelines of statewide significance” are a special sub-category of the state’s shorelines, and they receive special protection under the SMA. There are no shorelines of statewide significance in this TMDL.
Upper Yakima River Tributaries Temperature TMDL: WQ Improvement Report and Implementation Plan Page 78
Forests and fish rules The state's forest practices regulations will be relied upon to bring waters into compliance with the load allocations established in this TMDL on private and state forest lands. This strategy, referred to as the Clean Water Act Assurances, was established as a formal agreement to the 1999 Forests and Fish Report (www.dnr.wa.gov/Publications/fp_rules_forestsandfish.pdf). The state’s forest practices rules were developed with the expectation that the stream buffers and harvest management prescriptions were stringent enough to meet state water quality standards for temperature and turbidity, and provide protection equal to what would be required under a TMDL. As part of the 1999 agreement, new forest practices rules for roads were also established. These new road construction and maintenance standards are intended to provide better control of road-related sediments, provide better stream bank stability protection, and meet current best management practices. To ensure the rules are as effective as assumed, a formal adaptive management program was established to assess and revise the forest practices rules, as needed. The agreement to rely on the forest practices rules in lieu of developing separate TMDL load allocations or implementation requirements for forestry is conditioned on maintaining an effective adaptive management program. Consistent with the directives of the 1999 Forests and Fish agreement, Ecology conducted a formal 10-year review of the forest practices and adaptive management programs in 2009: www.ecy.wa.gov/programs/wq/nonpoint/ForestPractices/CWAassurances-FinalRevPaper071509-W97.pdf Ecology noted numerous areas where improvements were needed, but also recognized the state’s forest practices program provides a substantial framework for bringing the forest practices rules and activities into full compliance with the water quality standards. Therefore, Ecology decided to conditionally extend the CWA assurances with the intent to stimulate the needed improvements. Ecology, in consultation with key stakeholders, established specific milestones for program accomplishment and improvement. These milestones were designed to provide Ecology, and the public, with confidence that forest practices in the state will be conducted in a manner that does not cause or contribute to a violation of the state water quality standards. The success of this TMDL project will be assessed using monitoring data from streams in the watershed.
Water withdrawals managed by the Washington Water Code The Washington Water Code is based on the doctrine of prior appropriation. In times of water shortages, junior water right holders may be required to reduce or shut off, ensuring senior right holders full use of entitled water. In 2005, the Yakima Superior Court issued an order requiring all surface water users to meter, record, and submit annual water use records to Ecology. In 2007,
Upper Yakima River Tributaries Temperature TMDL: WQ Improvement Report and Implementation Plan Page 79
the draft final decree was issued for the Yakima River Surface Water Adjudication.11 Until the adjudication is final, any new surface water appropriations in the Yakima River Basin are unavailable. After the adjudication is final, any new water right applications requesting to appropriate waters in the Yakima River Basin must include mitigation water of high priority to offset any new use.
Water quality protected by state water quality laws State water quality laws and regulations also support implementation of this TMDL project. The state water pollution control law (RCW 90.48.010) states that, “It is declared to be the policy of the state of Washington to maintain the highest possible standards to insure the purity of all waters of the state consistent with public health and public enjoyment thereof, the propagation and protection of wildlife, birds, game, fish and other aquatic life…” In this chapter of state law, “pollution” is defined to mean “such contamination, or other alteration of the physical, chemical or biological properties, of any waters of the state, including change in temperature, taste, color, turbidity, or odor of the waters, or such discharge of any … substance into any waters of the state as will or is likely to create a nuisance or render such waters harmful, detrimental or injurious to the public health, safety or welfare, or to domestic, commercial, industrial, agricultural, recreational, or other legitimate beneficial uses, or to livestock, wild animals, birds, fish or other aquatic life.” While Ecology is authorized under Chapter 90.48 RCW to impose strict requirements or issue enforcement actions to achieve compliance with state water quality standards, it is the goal of all participants in the Upper Yakima River Tributaries Temperature TMDL process to achieve clean, cool water through voluntary control actions. However, when applicable BMPs are not being implemented and Ecology has reason to believe that individual sites or facilities are causing pollution in violation of RCW 90.48.080, Ecology may seek enforcement to gain compliance with the state’s water quality standards. Ecology will consider and issue notices of noncompliance, in accordance with the Regulatory Reform Act, in situations where the cause or contribution to the cause of noncompliance with load allocations can be established.
SEPA/Planning Local governments should consider TMDLs during State Environmental Policy Act (SEPA) and other local land use planning reviews. If the land use action under review is known to potentially impact temperature and dissolved oxygen as addressed by this TMDL, then the project may have a significant adverse environmental impact. SEPA lead agencies and reviewers are required to look at potentially significant environmental impacts and alternatives and to document that the necessary environmental analyses have been made. Land-use planners and project managers
11 An adjudication can settle the rights of two water right holders with respect to one another or it can settle all the rights to water within a particular water system. An adjudication that settles all the rights within a particular water system is called a general adjudication. A general adjudication is a legal process conducted through a superior court to determine the extent and validity of existing water rights. An adjudication can determine rights to surface water, ground water, or both. An adjudication does not create new water rights, it only confirms existing rights.

Upper Yakima River Tributaries Temperature TMDL: WQ Improvement Report and Implementation Plan Page 80
should consider findings and actions in this TMDL to help prevent new land uses from violating water quality standards. Ecology recently published a focus sheet on how TMDLs play a role in SEPA impact analysis, threshold determinations, and mitigation (https://fortress.wa.gov/ecy/publications/SummaryPages/0806008.html). Additionally, the TMDL should be considered in the issuance of land use permits by local authorities.
Upper Yakima River Tributaries Temperature TMDL: WQ Improvement Report and Implementation Plan Page 81
Conclusions and Recommendations
o With successful implementation of the Upper Yakima River Tributaries Temperature TMDL:
o Temperature reductions of up to 3.4°C are expected to occur on Taneum Creek. However, temperatures in Taneum Creek are not expected to meet the 16°C criterion during critical conditions.
o Temperature reductions of up to 1.7°C are expected to occur on upper Naneum Creek. Temperatures in upper Naneum Creek are expected to meet the 17.5°C criterion during most years, but not during critical (7Q10 flow and 90th percentile climate) conditions.
o Significant temperature reductions are expected for Swauk Creek, and small temperature reductions are expected for upper Manastash Creek. Temperatures are not expected to meet the 16°C criterion in either of these streams during critical conditions.
o Small temperature reductions are expected for Big Creek and Little Creek. These temperature reductions may be sufficient to achieve the 16°C criterion.
• System potential mature riparian vegetation is needed along all the upper Yakima tributaries to ensure that maximum stream temperatures stay below the temperature standard where possible, and that system potential temperatures are achieved when the numeric criteria cannot be met.
• Many streams in the Kittitas Valley have been straightened, channelized, and/or rerouted. Restoring channel complexity to these streams will improve riparian habitat, and may also benefit stream temperatures.
• To increase the effectiveness of shade at reducing stream temperatures, irrigation practices should be managed so as to take into account and limit increases in stream temperatures.
• Temperatures in Cabin Creek can be expected to decrease as the Falls Hill landslide stabilizes, allowing the near-stream disturbance zone (NSDZ) in lower Cabin Creek to become narrower. A narrower NSDZ may allow temperatures in Cabin Creek to meet the 16°C criterion. Forest practices should be carefully planned to avoid triggering future large-scale mass wasting events.
• System potential vegetation already exists in most of Umtanum Creek. Modeling predicts that no further temperature reductions will be possible except in a few limited upstream areas. Existing riparian vegetation should be protected to ensure against temperature increases.
• Point source discharges need permit limits and appropriate best management practices to avoid creating or contributing to temperature impairments.

Upper Yakima River Tributaries Temperature TMDL: WQ Improvement Report and Implementation Plan Page 82
This page is purposely left blank.
Upper Yakima River Tributaries Temperature TMDL: WQ Improvement Report and Implementation Plan Page 83
Implementation Plan
Introduction The goal of a TMDL project is to ensure that an impaired water body attains water quality standards within a reasonable time. This implementation plan was developed jointly by Ecology and interested and responsible parties. It describes what will be done to improve water quality. It explains the roles and authorities of cleanup partners (those organizations with jurisdiction, authority, or direct responsibility for cleanup), along with the programs or other means through which they will address these water quality issues. It prioritizes specific actions planned to improve water quality and achieve compliance with state water quality temperature criteria. It expands on the recommendations made in the technical analysis section of this report. Typically, Ecology produces an implementation strategy, which is submitted with the technical analysis to the U.S. Environmental Protection Agency (EPA) for approval of the TMDL. Then, following EPA’s approval, Ecology and interested and responsible parties develop a water quality implementation plan. However, this section of this water quality improvement report will serve as both the implementation strategy and the implementation plan. In general, this is a plan to protect and restore riparian areas, rehabilitate waterways, reduce sediment input to streams, and improve stream flow levels. It is based in large measure on existing laws, regulations, and the voluntary actions of property owners with lands adjacent to streams. Implementation of this TMDL relies on the continuation of the many existing voluntary efforts to reduce stream temperature and protect riparian areas throughout the watershed. Additional non-point source pollution prevention activities will be encouraged by Ecology with voluntary and incentive-based processes, in order to pursue the goals outlined in this report. This implementation plan describes how stream temperatures will be reduced to meet water quality standards. These temperature reductions should be achieved by 2094. Ecology and the U.S. Forest Service (USFS) will work together to implement projects that reduce temperatures in the upper Yakima River watershed streams and rivers within national forest boundaries. Ecology works with the Washington State Department of Natural Resources (DNR), which implements the state forest practices rules, to encourage forest practices that prevent input of pollutants to water bodies, provide stream shade, and implement water quality requirements for timber harvesting activities on state-owned and private lands. Ecology is committed to assist DNR in identifying and improving site-specific situations where reduction of shade has the potential for causing damage to public resources. New rules for roads also apply. These include new road construction standards, as well as a schedule for upgrading existing roads. Under the

Upper Yakima River Tributaries Temperature TMDL: WQ Improvement Report and Implementation Plan Page 84
new rules, roads must provide for better control of road-related sediments, provide better stream-bank stability protection, and meet current best management practices (BMPs). DNR is responsible for oversight of these activities. There are challenges in the watershed that may limit potential improvements in some areas. These possible limitations are associated with human habitation, existing development, roads, and railroads. These physical and socio-economic challenges will be considered as implementation actions are developed.
Who needs to participate in implementation? There are numerous opportunities to coordinate actions to reduce stream temperature with other planning efforts. This should help to achieve water quality improvements more efficiently and effectively. Ecology will continue to work closely with these groups to improve water quality in the basin.
County and city governments Local regulatory programs involving land-use planning and permitting are expected to help reduce water temperatures in the upper Yakima watershed. Shorelines of streams with mean annual flows greater than 20 cubic feet per second (cfs) are protected under the Shoreline Management Act (SMA). The county and cities develop and manage plans for streams protected by the SMA. In addition, land management practices next to streams are limited by Kittitas County through their critical areas ordinances. These ordinances prescribe buffer widths for streams or wetlands. Kittitas County protects these buffer requirements while permitting certain activities. Kittitas County is in the process of updating their Shoreline Management Plans and critical areas ordinances. The cities of Roslyn, Cle Elum, and South Cle Elum will continue to protect and enhance the riparian areas of the streams that flow within their boundaries.
Homeowners with streamfront property Landowners with property immediately adjacent to creeks will follow all appropriate local, county, and state laws related to riparian protection and enhancement. Mature native vegetation within the riparian area must be kept intact and healthy in order to prevent heating from solar radiation, and to maximize bank stabilization.
Yakama Nation The Confederated Tribes of the Yakama Nation (Yakama Nation) have a hand in restoration of fish habitat throughout their historic fishing grounds, which includes the upper Yakima River watershed. The Yakama Nation expressed interest in the upper Yakima watershed TMDLs, as they are concerned with salmon and steelhead production in the upper Yakima River basin. The Yakama

Upper Yakima River Tributaries Temperature TMDL: WQ Improvement Report and Implementation Plan Page 85
Nation is also a partner in the Yakima Tributary Access and Habitat Program (YTAHP), which continues to restore riparian areas in the upper Yakima River watershed.
Natural Resources Conservation Service The United States Department of Agriculture (USDA) Natural Resources Conservation Service (NRCS) offers technical and financial assistance to landowners for water quality-related projects through a variety of programs. One program seeks the input of a local work group to help NRCS establish priority conservation practices for Environmental Quality Improvement Program (EQIP) funding. For more information on the funding available through NRCS and other USDA programs, please see the Funding section of this report.
USDA - Forest Service The USDA – Forest Service (USFS) participated and contributed to the development of the Wenatchee National Forest Temperature Technical Assessment, which provides load allocations for waters on national forest lands. In general, documentation of water quality conditions and management practices has been successful in demonstrating commitment to improving water quality. Any actions the USFS takes to maintain or enhance riparian areas and control erosion will help provide cleaner water downstream.
Kittitas Conservation Trust The mission of the Kittitas Conservation Trust is to protect a legacy of fish and wildlife habitat, open space, and aquatic resources in the Upper Yakima River Basin, and help restore natural habitat. The Trust identifies land and water rights that have high conservation value, and then works with willing landowners to acquire land, conservation easements, or water rights that will increase instream flows. Funding for acquisition and restoration projects comes from a variety of public and private sources. For more information visit http://kittitasconservationtrust.org/.
Kittitas County Conservation District Conservation Districts have authority under Chapter 89.08 RCW to develop farm plans that protect water quality. Conservation Districts also provide information, education, and technical assistance to residents on a voluntary basis. The Kittitas County Conservation District (KCCD) has been active in installing riparian buffers along watershed streams. The KCCD also provides technical and financial assistance for:
• Irrigation efficiency projects. • Fish passage barrier removal. • Fish screen design and installation. • Metering of pumps for surface and shallow groundwater withdrawals. • Sediment reduction. • Livestock-influenced water quality improvement projects. • Stream restoration projects. • Irrigation efficiency projects.
Upper Yakima River Tributaries Temperature TMDL: WQ Improvement Report and Implementation Plan Page 86
• Irrigation diversion screens and metering. • Upland sediment reduction projects. • Livestock best management practice (BMP) projects to improve water quality. In addition, the KCCD participates in educational programs. The KCCD also applied for and received a grant to expand their riparian buffer program to urban areas in the watershed. The KCCD offers a variety of technical and financial assistance programs to private landowners to address water quality and quantity issues within the Yakima River watershed. The KCCD has also collected temperature data in the upper Yakima River watershed. The KCCD is also a partner in the Yakima Tributary Access and Habitat Program (YTAHP), which continues to restore riparian areas in the upper Yakima watershed. For more information about the KCCD, visit http://kccd.net/.
Kittitas County Water Purveyors The Kittitas County Water Purveyors (KCWP) is a voluntary effort by area irrigation water providers to address issues affecting irrigated agriculture and to participate in water quality and endangered species efforts in Kittitas County. Members of the KCWP include the Kittitas Reclamation District, Cascade Irrigation District, Ellensburg Water Company, West Side Irrigating Company, other irrigation entities, and private water rights holders who collectively serve more than 91,000 acres of irrigated farmland in Kittitas County. The KCWP monitors irrigation and stream water quality, with the goal of maintaining local control over sampling regimes and laboratory analysis of the samples. The KCWP also provides educational outreach in numerous ways to a wide variety of audiences. The KCWP have participated in numerous planning and implementation activities in the Yakima River Basin including watershed planning; water quality TMDL processes for turbidity, temperature, and bacteria; and habitat enhancement through fish passage projects, water storage discussions, and other water-related efforts. Most of the irrigated farmlands are not part of the current TMDL project, but will be addressed in a future TMDL project. For more information visit http://kcwp.org/.
The Nature Conservancy The Nature Conservancy (TNC) is a global nonprofit organization, whose mission is to conserve the lands and waters on which all life depends. In 2014, TNC purchased all of the forest lands formerly owned by Plum Creek Timber Company in the TMDL project area. The purchased lands cover about 75 square miles and include sensitive headwaters of many important creeks and rivers. TNC has teams of foresters, restoration experts, and other scientists that will actively manage the land and waters. TNC will also work with adjacent federal and state land owners, like the U.S. Forest Service and Department of Natural Resources, on management strategies.

Upper Yakima River Tributaries Temperature TMDL: WQ Improvement Report and Implementation Plan Page 87
Trout Unlimited Trout Unlimited (TU) is a nonprofit organization that strives to “keep our country's coldwater fisheries and their watersheds safe from environmental threats for this and for future generations of anglers to enjoy”. In 1998, TU started a program called the Western Water Project (WWP) which has helped to restore healthy stream flows and habitat in several western states. The WWP works to increase streamflows in Western rivers by working with irrigators, conservation districts, state agencies, and others. The WWP partnered with ranchers, landowners, and agencies on scores of on-the-ground projects to restore and reconnect fragmented river systems. The WWP also promotes creative water law reform by demonstrating through on-the-ground examples and state-level reforms that leaving water in streams benefits fisheries, farmers and ranchers, and watershed health. TU is an active partner in numerous stream restoration projects in this TMDL project area. For more information about TU’s Western Water Project, visit www.tu.org/tu-programs/western-water.
Mid-Columbia Fisheries Enhancement Group Mid-Columbia Fisheries Enhancement Group (MCFEG) is a non-profit, community-based group dedicated to restoring self-sustaining populations of salmon and steelhead. MCFEG works with landowners and community partners to protect and restore fish habitat. The Mid-Columbia region includes the Yakima Basin, the Klickitat, White Salmon, and Wind rivers, and numerous smaller tributaries in Skamania, Klickitat, Benton, Yakima, Kittitas, and Franklin Counties. MCFEG is one of 14 Regional Fisheries Enhancement Groups in Washington State. In 1990, the Washington State Legislature created the Regional Fisheries Enhancement Group (RFEG) program to involve local communities, citizen volunteers, and landowners in the state’s salmon recovery efforts. Each RFEG works within a specific geographic region based on watershed boundaries. Every group is a separate, nonprofit organization led by their own board of directors and supported by their members. Partial funding for the RFEG program comes from a portion of commercial and recreational fishing license fees administered by the Washington Department of Fish and Wildlife. The RFEGs also obtain many individual grants from government and private entities. Individual donations and in-kind contributions from local community members and businesses are also essential to the success of each RFEG. MCFEG is an active partner in numerous stream restoration projects in this TMDL project area. For more information about MCFEG, visit http://midcolumbiarfeg.com/about/.
Washington State Department of Ecology Ecology has been delegated authority under the federal Clean Water Act by the U.S. EPA to:
• Establish water quality standards.

Upper Yakima River Tributaries Temperature TMDL: WQ Improvement Report and Implementation Plan Page 88
• Administer the National Pollutant Discharge Elimination System (NPDES) wastewater permitting program.
Ecology has independent state authority to:
• Enforce water quality regulations under Chapter 90.48 RCW. Ecology responds to complaints, conducts inspections, and issues NPDES and State Waste Discharge permits as part of its responsibilities under state and federal laws and regulations. Ecology developed a stormwater management manual for eastern Washington. It is designed to guide local authorities on how to meet new stormwater discharge regulations. In cooperation with conservation districts and other local organizations, Ecology will pursue implementation of BMPs for agricultural and other land uses. Ecology provides technical and financial assistance to people interested in installing BMPs. Ecology has a competitive grant and loan process for local governments and non-profit organizations. Grant money can be used to plan and install BMPs, and loans can be used to purchase direct seed equipment or improve wastewater treatment facilities. The agency’s Environmental Assessment Program conducts effectiveness monitoring to determine if water quality is improving. Ecology is authorized under Chapter 90.48 RCW to initiate enforcement actions if voluntary compliance with state water quality standards is unsuccessful. However, it is the goal of all participants the Upper Yakima River Tributaries Temperature TMDL process to achieve clean water through voluntary control actions.
Washington State Department of Fish and Wildlife The Washington State Department of Fish and Wildlife (WDFW) is actively involved with habitat improvement, hatchery production, technical assistance, and assessments in the watershed. Habitat improvement activities include dam removal and fish passage projects, identifying areas in need of fish screens and installing them, and assisting with Habitat Conservation Plans. WDFW’s hatchery production activities include releasing trout and steelhead, evaluating hatchery fish success, and performing habitat surveys. WDFW is also a partner in the YTAHP, which continues to restore riparian areas in the upper Yakima watershed. WDFW provides technical assistance on habitat improvement projects beginning with project identification and design through the permit process. WDFW also gives technical assistance to regional planning efforts. WDFW has an extensive assessment role in the watershed, including spawning surveys, monitoring species distribution, measuring stream flows, conducting instream flow studies, and monitoring stream temperature. WDFW staff also works to obtain funding for habitat improvement projects, and offers financial assistance to landowners for similar projects. WDFW will need to make sure permits issued for habitat projects do not affect water quality. In addition, as WDFW acquires new land they should maintain the same BMPs necessary for healthy riparian corridors.
Upper Yakima River Tributaries Temperature TMDL: WQ Improvement Report and Implementation Plan Page 89
Washington State Department of Natural Resources The Washington State Department of Natural Resources (DNR) has primary administrative and enforcement responsibilities for the Forest Practices Act (Ch. 76.09 RCW), which includes implementation of the 1999 "Forests and Fish Report.” The Forests and Fish Report (ESHB 2091) was adopted by the state legislature to protect salmon listed under the federal Endangered Species Act, other aquatic species, and clean water, while keeping the timber industry economically viable. DNR is encouraged to condition forest practices to prohibit any further reduction of stream shade and not waive or modify any shade requirements for timber harvesting activities on state and private lands. DNR is also responsible for oversight of activities on forest roads. New forest practices rules also apply for roads, including standards for new road construction and upgrading existing roads. Under the new rules, roads must provide for better control of road-related sediments, provide better streambank stability protection, and meet current BMPs.
Washington State Department of Transportation The Washington State Department of Transportation (WSDOT) stormwater runoff is regulated under NDPES Phase I and Phase II permits that are administered by Ecology. However, the area of the TMDL is outside of the area of WSDOT’s permit coverage. WSDOT is encouraged to participate in programs directed under this TMDL project for removing direct discharges to streams. To stay in compliance with the TMDL, riparian and stormwater management activities outlined in WSDOT's Highway Runoff Manual must be implemented in the project area. When planning upgrades or new construction, WSDOT should seek opportunities to increase stream shading in areas where their road right-of-way borders Upper Yakima River tributaries. Planning for stormwater systems and construction projects within the project area should include designs and methods to increase stormwater infiltration rather than runoff to ditches and streams. If WSDOT is found to be a source of heating to the Upper Yakima River tributaries, wasteload allocations and implementation actions will be developed for inclusion in WSDOT's stormwater permit.
Washington State University Extension WSU Extension offers educational opportunities on a wide range of topics about water quality. Many of the educational materials offered by WSU Extension are located on the internet at http://wawater.wsu.edu/. WSU Extension has an ongoing commitment to develop educational publications on emerging issues. Notices about these publications and funding opportunities are also posted on the web site. WSU Extension staff members are willing to help inform watershed residents about the Upper Yakima River Tributaries Temperature TMDL implementation plan and BMPs that may be applied to improve water quality.
Upper Yakima River Tributaries Temperature TMDL: WQ Improvement Report and Implementation Plan Page 90
Washington Water Trust Washington Water Trust (WWT) is a private, nonprofit organization whose mission is to restore instream flows to benefit water quality, fisheries, and recreation in the state’s rivers and streams. WWT cooperates with landowners, tribes and local organizations to obtain existing water rights from people willing to sell, lease, or donate their water right. The group’s focus is on small streams with endangered or threatened fish stocks. WWT believes that focusing their efforts on smaller streams will result in significant environmental benefits. For more information visit: www.thewatertrust.org.
Yakima Basin Fish and Wildlife Recovery Board The Yakima Basin Fish and Wildlife Recovery Board (YBFWRB) was created by 21 county and city governments and the Yakama Nation to promote the recovery of at-risk fish and wildlife species in the Yakima Basin. One of their primary goals is to support, both financially and technically, recovery of steelhead and bull trout, so that these species can be removed from the federal ESA threatened species list. The YBFWRB worked with local, state and federal partners to write the Yakima Steelhead Recovery Plan, which NOAA incorporated in whole into its ESA-mandated Middle Columbia Steelhead Recovery Plan. The YBFWRB worked with the USFWS and other partners to develop the Yakima Bull Trout Action Plan, which identifies priority actions to recover bull trout in our basin. For more information visit www.ybfwrb.org/.
Yakima Basin Joint Board The Yakima Basin Joint Board (YBJB) represents various irrigation and domestic use entities dependent on water from the reservoirs and rivers in the Yakima River Basin. As such, the YBJB operations are linked with the survival of Yakima Basin salmonids. The YBJB is very interested in supporting realistic measures that may increase the survival and ensure the conservation of those resources. The YBJB works closely with the KCWP on water quality considerations within the TMDL project area. Tables 18 and 20 list entities that should take actions to reduce water temperature (See Appendix A for a glossary and list of acronyms).
Pollution sources and organizational actions, goals, and schedules
Pollution sources In this TMDL, the pollutant is warm summer water temperature in area water bodies. Several factors can result in increased summer stream temperatures. This effect is particularly pronounced when two or more factors are combined in a given reach. Following are examples of factors that can cause stream heating.
Solar radiation Sunlight striking the surface of a stream increases the water temperature, sometimes significantly. Lack of stream-side shade allows more solar heating.
Upper Yakima River Tributaries Temperature TMDL: WQ Improvement Report and Implementation Plan Page 91
Lack of connectivity with hyporheic zones Cool subsurface flows, from the hyporheic zone into the stream, can help reduce stream temperatures. Human-caused changes to streams can block these hyporheic flows, preventing entry of this cooling influence.
Erosion While some erosion and sediment movement in streams is a natural process, excessive human-caused sediment entering streams can add to stream heating. Sediment often enters streams from erosion of farm fields and earthen roads, collapse of too-steep streambanks, and so on. Sediment entering a stream can increase stream temperatures by increasing the stream’s width to depth ratio. When the width-to-depth ratio of a stream is increased, the result is a wider, shallower stream that heats more quickly in the summer sun. Additionally, increasing the width of a stream can prevent riparian vegetation from being able to adequately shade the whole stream and prevent solar heating.
Warm return flows As noted earlier, warm return flows from irrigated farm fields will increase the temperature of the receiving water.
Decreased stream flows A small volume of water heats more quickly than a large volume of water. When water is removed from a stream to serve other purposes, the remaining reduced amount of water in the stream is more prone to warming from solar radiation, especially during the critical period.
What needs to be done Water temperature targets are set by the TMDL for the upper Yakima River tributaries. The principal focus of the TMDL project will be to continue implementation of BMPs to reduce water temperatures in project area water bodies, as well as improve salmonid habitat in some locations. Education and outreach about this TMDL project are also key to its success, especially regarding the importance of healthy riparian areas, cool water temperatures, and good salmonid habit. Several major land-use groups will continue to implement BMPs to reduce water temperatures in upper Yakima River tributaries. These groups include the timber industry; irrigated agriculture; ranchers; state, county, and municipal governments; and homeowners with waterfront property.
Reduce water temperatures Actions that can help cool water temperature fall into five major categories:
1. Protection and restoration of mature riparian vegetation 2. Re-shaping the stream channel 3. Increasing summer stream flows 4. Allowing streams access to floodplains 5. Public education about the importance of healthy riparian areas
Protect and restore riparian vegetation A mature stand of native riparian vegetation helps prevent sunlight from reaching the stream, in turn reducing the heating from solar radiation. A full mature vegetative canopy is key to keeping a
Upper Yakima River Tributaries Temperature TMDL: WQ Improvement Report and Implementation Plan Page 92
stream cool. Riparian vegetation can also help stabilize the streambank, which has added benefits for the stream channel. To promote healthy riparian areas, and to let riparian vegetation grow to maturity, such areas must be protected from harm. Some actions that accomplish this goal are fencing livestock away from riparian areas and limiting recreational camping next to streams. Damaged riparian areas should also be blocked off to prevent further damage and allow vegetation to re-grow. Common methods of blocking off a riparian area include fencing it completely, or using large objects like boulders to prevent vehicle traffic from entering the riparian area. Livestock managers should continue to implement appropriate BMPs for grazing and pasture operations. These practices will help reduce livestock contact with water bodies, which will in turn allow riparian areas to revegetate and increase riparian shade. Resources agencies, such as the WSU Extension Service, NRCS, and KCCD, will provide technical assistance to livestock managers to ensure correct implementation and application of these BMPs.
Homeowners that have waterfront property should protect existing streamside vegetation, and should consider planting native plants to enhance their riparian areas. Gold miners working in creeks or along creek banks should avoid removing riparian vegetation or adding sediment to streams. The owners of the largest tracts of public forested land in the upper Yakima River watershed are the USFS and DNR. The largest private timber owners are the Nature Conservancy and Western Pacific Timber. Much timber acreage is also held in small tracts by numerous private landowners. All of these groups are participating in activities that will reduce water temperatures in the upper Yakima River watershed. The private and state landowners are implementing improvements required by the state forest practices rules.
Reconfigure the stream channel Several hydrologic features of streams and rivers are associated with cooler water. These features include increased sinuosity (where appropriate), minimal width-to-depth ratio, stable streambanks, use of side channels, and instream elements such as large woody debris and boulders.
Reduce width-to-depth ratio Excessively wide, shallow streams heat much more quickly in the summer sun. To reduce the width-to-depth ratio (make stream deeper and more narrow), sediment input to the stream must be reduced as well. Sediment input to a stream or river generally comes from two sources: bank erosion and overland flows of sediment-laden runoff. While some bank erosion is normal, excessive bank erosion can add excess sediment to a stream. Bank stabilization is an effective method of slowing or stopping streambank erosion. Healthy, thriving riparian vegetation can help hold a bank in place. In addition, installation of bank structures, such as whole-tree revetments, can redirect stream flow and reduce erosion. Many of the actions to protect, restore, and replant the riparian areas will also help reduce excessive bank erosion.

Upper Yakima River Tributaries Temperature TMDL: WQ Improvement Report and Implementation Plan Page 93
Attention should be paid to upland sediment sources as well. Erosion of poorly maintained forest roads, for instance, can contribute large volumes of sediment to small sensitive tributaries. Increased road maintenance and proper closure of unnecessary roads can help eliminate this problem. In addition, working with agricultural irrigators to help reduce field erosion can also reduce sediment input to streams. Eroding roads and roadside ditches can be sources of suspended sediment in area waterways, which can in turn increase stream temperatures. The road maintenance departments of Kittitas County and Washington State have made both verbal and budgetary commitments to continue to maintain their roads in such a manner as to minimize erosion. The state forest practices rules require that private timber companies must regularly maintain existing roads. The timber companies must also create a list of which of their roads need to be improved in order to avoid erosion that could impair waterways, and this list must be prioritized in order of which roads could cause the most pollution. Over time, the timber companies must complete all improvements on the list. These actions should reduce the sediment input from logging roads.
Reshape the stream channel Stream channels that have more sinuosity and connected side channels often tend to be cooler streams. This is because the added sinuosity actually increases stream length, decreases stream slope, allows a stream to dissipate energy during high flows, and gives more stream area to recharge the hyporheic zone. Adding sinuosity or reconnecting side channels is generally achieved one of two ways, either naturally or by human engineering. Natural stream shaping can be achieved by adding instream structures such as large woody debris (LWD) or boulders. These structures intercept and redirect the central flow of the stream, which can change the stream’s patterns of erosion and deposition. Over time, this can add sinuosity. Frequently, stream shaping and side channel connections are created by engineering designs and executed by careful construction with heavy equipment. This type of work is often done in conjunction with the placement of stream structures (LWD, boulders, or other) and riparian plantings. Note that changing channel configuration should be carefully considered on a site-by-site basis.
Increase summer stream flows Higher stream flows result in a larger volume of water in the stream. A greater volume of water retains its (cool) temperature longer and heats more slowly in the summer sun. Therefore, one useful tool to keeping summer water temperatures cooler is to keep more water in the stream. Several actions can accomplish this goal: • Dedicate (some) water that would otherwise be diverted from the stream into a water trust.
This allows the landowner with legal water rights to protect his water rights while helping to improve water quality by leaving water in the stream.
Upper Yakima River Tributaries Temperature TMDL: WQ Improvement Report and Implementation Plan Page 94
• Ensure that water that is removed from the stream for irrigation is applied to crops in the most efficient manner possible. More efficient irrigation (such as sprinklers or drip lines) can satisfy all irrigation needs while using much less water. Additionally, sprinklers and drip lines usually don’t have return flows to creeks; warm return flows can add to stream heating during the critical period. Where possible, install pipelines for more efficient (less water loss) conveyance and delivery of irrigation water.
• Ensure that no water is illegally withdrawn from area waterways. Only holders of legal water rights are allowed to withdraw water from streams and rivers.
Allow streams to access floodplains Flooding of a river or stream’s floodplain during spring snowmelt recharges the adjacent hyporheic zone. This in turn promotes the consistent entry of cool water into the stream during the dry season. Stream hydrologists recommend that streams be allowed to access their floodplains at least every two years for maximum stream health.
Permitted facilities comply with new permit restrictions There are no permitted NPDES dischargers in the upper Yakima tributaries, and there are no specifically-assigned wasteload allocations (WLAs). Ecology developed a reserve WLA to allow for future growth within the TMDL project area. Any new permittees will fully comply with permit restrictions.
Educate people about the importance of healthy riparian areas Public education is a critical element of any successful water quality improvement plan. Several groups are currently involved with outreach and education, mainly concerning the importance of healthy riparian areas and prevention of streambank erosion. Local agricultural advisory groups (KCCD, NRCS, and others) will continue to promote outreach and education regarding water quality and riparian restoration, and continue to offer technical assistance to irrigators, ranchers, and other rural residents. Kittitas County and Ecology will work together to develop public-education programs to promote riparian restoration. The USFS – Cle Elum Ranger District has a long and successful history of public outreach, especially concerning stream and riparian protection, and they will continue these efforts.
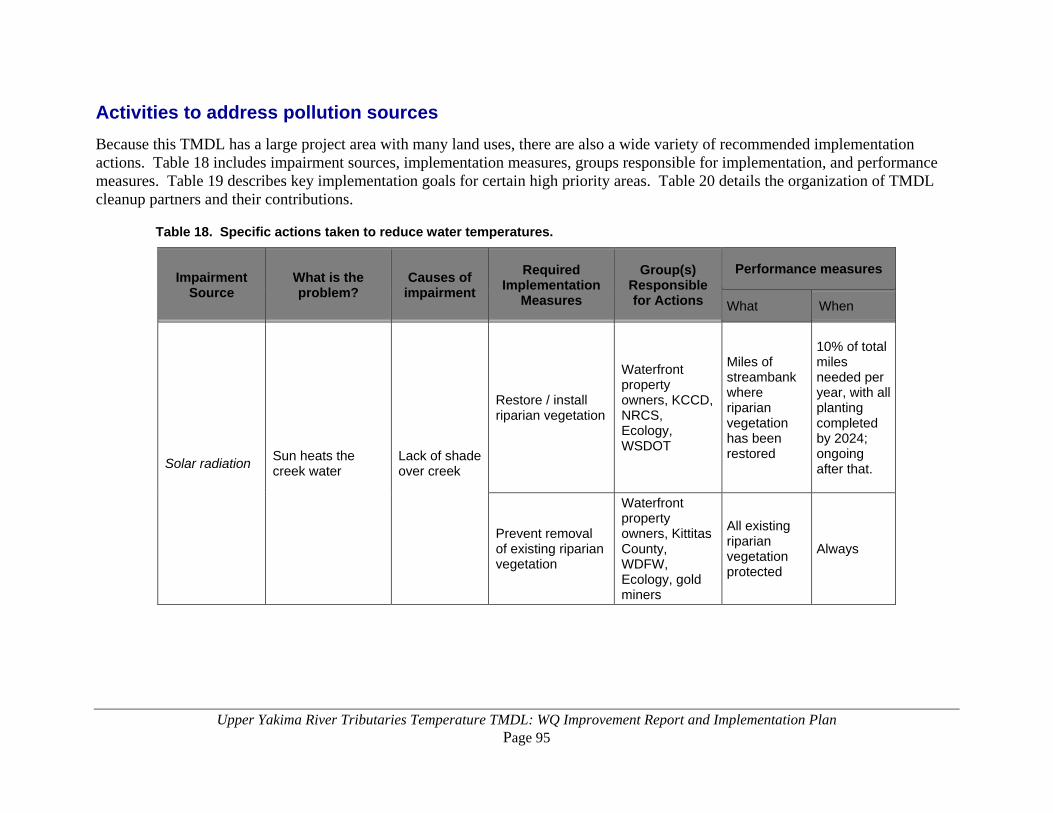
Upper Yakima River Tributaries Temperature TMDL: WQ Improvement Report and Implementation Plan Page 95
Activities to address pollution sources Because this TMDL has a large project area with many land uses, there are also a wide variety of recommended implementation actions. Table 18 includes impairment sources, implementation measures, groups responsible for implementation, and performance measures. Table 19 describes key implementation goals for certain high priority areas. Table 20 details the organization of TMDL cleanup partners and their contributions.
Table 18. Specific actions taken to reduce water temperatures.
Impairment Source
What is the problem?
Causes of impairment
Required Implementation
Measures
Group(s) Responsible for Actions
Performance measures
What When
Solar radiation Sun heats the creek water
Lack of shade over creek
Restore / install riparian vegetation
Waterfront property owners, KCCD, NRCS, Ecology, WSDOT
Miles of streambank where riparian vegetation has been restored
10% of total miles needed per year, with all planting completed by 2024; ongoing after that.
Prevent removal of existing riparian vegetation
Waterfront property owners, Kittitas County, WDFW, Ecology, gold miners
All existing riparian vegetation protected
Always
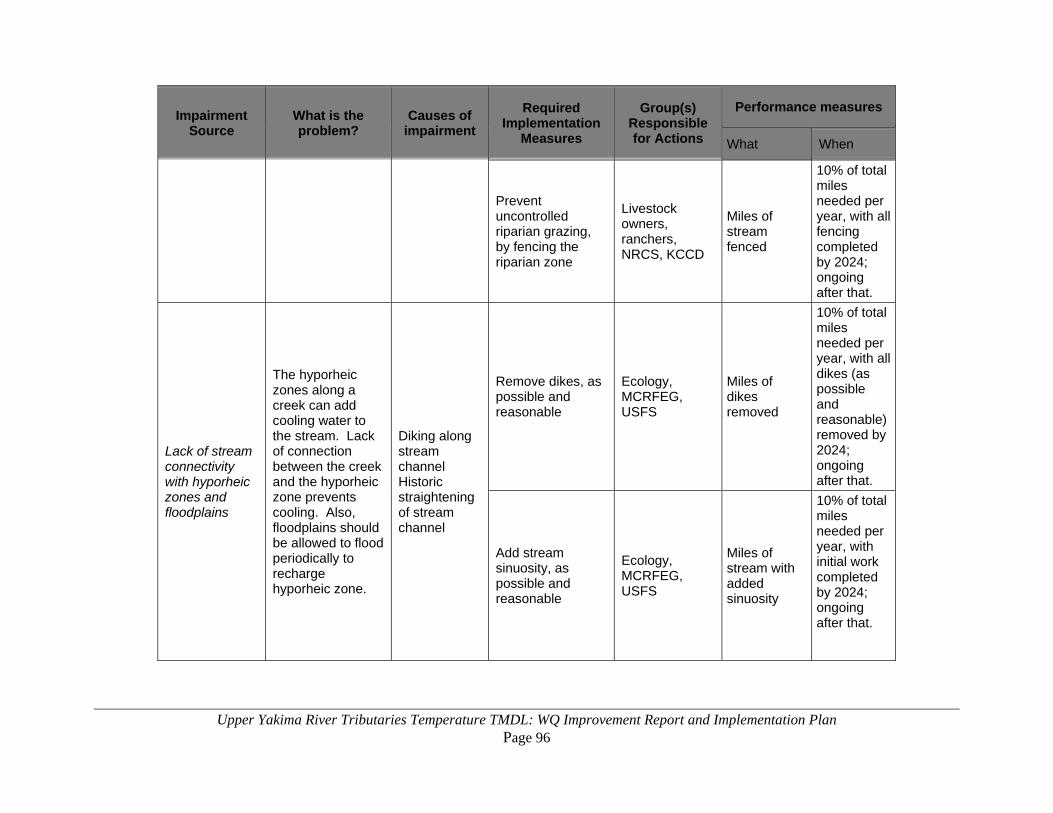
Upper Yakima River Tributaries Temperature TMDL: WQ Improvement Report and Implementation Plan Page 96
Impairment Source
What is the problem?
Causes of impairment
Required Implementation
Measures
Group(s) Responsible for Actions
Performance measures
What When
Prevent uncontrolled riparian grazing, by fencing the riparian zone
Livestock owners, ranchers, NRCS, KCCD
Miles of stream fenced
10% of total miles needed per year, with all fencing completed by 2024; ongoing after that.
Lack of stream connectivity with hyporheic zones and floodplains
The hyporheic zones along a creek can add cooling water to the stream. Lack of connection between the creek and the hyporheic zone prevents cooling. Also, floodplains should be allowed to flood periodically to recharge hyporheic zone.
Diking along stream channel Historic straightening of stream channel
Remove dikes, as possible and reasonable
Ecology, MCRFEG, USFS
Miles of dikes removed
10% of total miles needed per year, with all dikes (as possible and reasonable) removed by 2024; ongoing after that.
Add stream sinuosity, as possible and reasonable
Ecology, MCRFEG, USFS
Miles of stream with added sinuosity
10% of total miles needed per year, with initial work completed by 2024; ongoing after that.
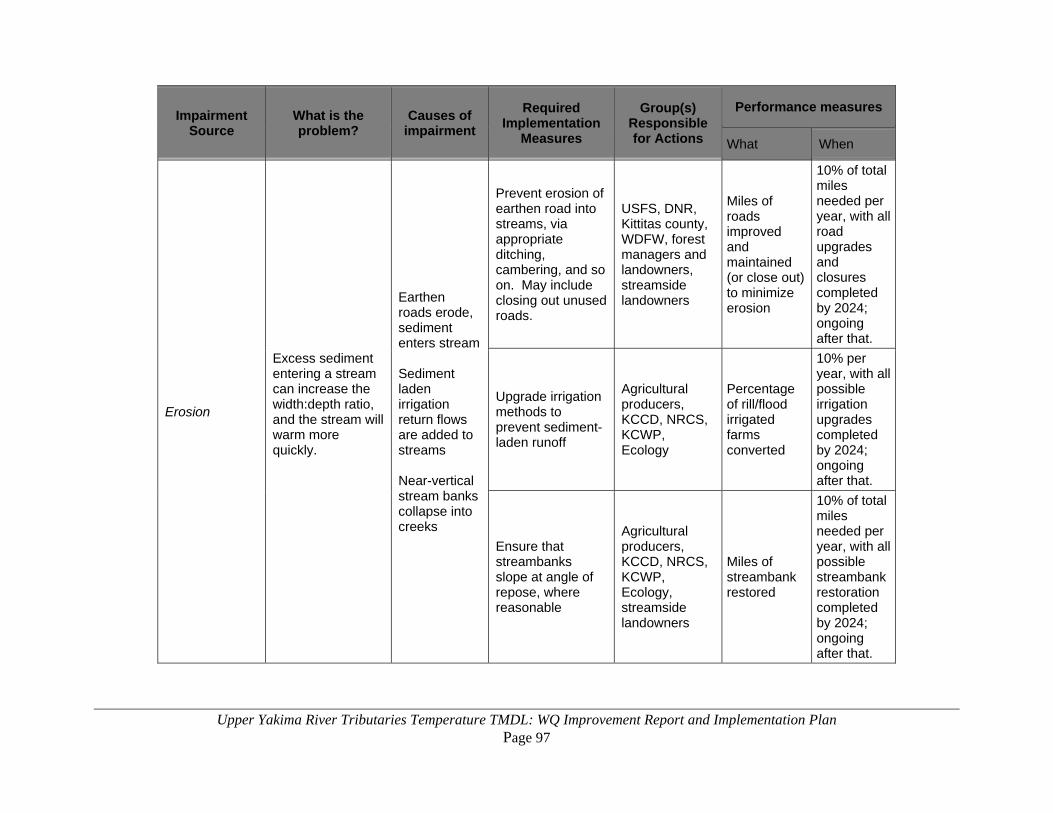
Upper Yakima River Tributaries Temperature TMDL: WQ Improvement Report and Implementation Plan Page 97
Impairment Source
What is the problem?
Causes of impairment
Required Implementation
Measures
Group(s) Responsible for Actions
Performance measures
What When
Erosion
Excess sediment entering a stream can increase the width:depth ratio, and the stream will warm more quickly.
Earthen roads erode, sediment enters stream Sediment laden irrigation return flows are added to streams Near-vertical stream banks collapse into creeks
Prevent erosion of earthen road into streams, via appropriate ditching, cambering, and so on. May include closing out unused roads.
USFS, DNR, Kittitas county, WDFW, forest managers and landowners, streamside landowners
Miles of roads improved and maintained (or close out) to minimize erosion
10% of total miles needed per year, with all road upgrades and closures completed by 2024; ongoing after that.
Upgrade irrigation methods to prevent sediment-laden runoff
Agricultural producers, KCCD, NRCS, KCWP, Ecology
Percentage of rill/flood irrigated farms converted
10% per year, with all possible irrigation upgrades completed by 2024; ongoing after that.
Ensure that streambanks slope at angle of repose, where reasonable
Agricultural producers, KCCD, NRCS, KCWP, Ecology, streamside landowners
Miles of streambank restored
10% of total miles needed per year, with all possible streambank restoration completed by 2024; ongoing after that.
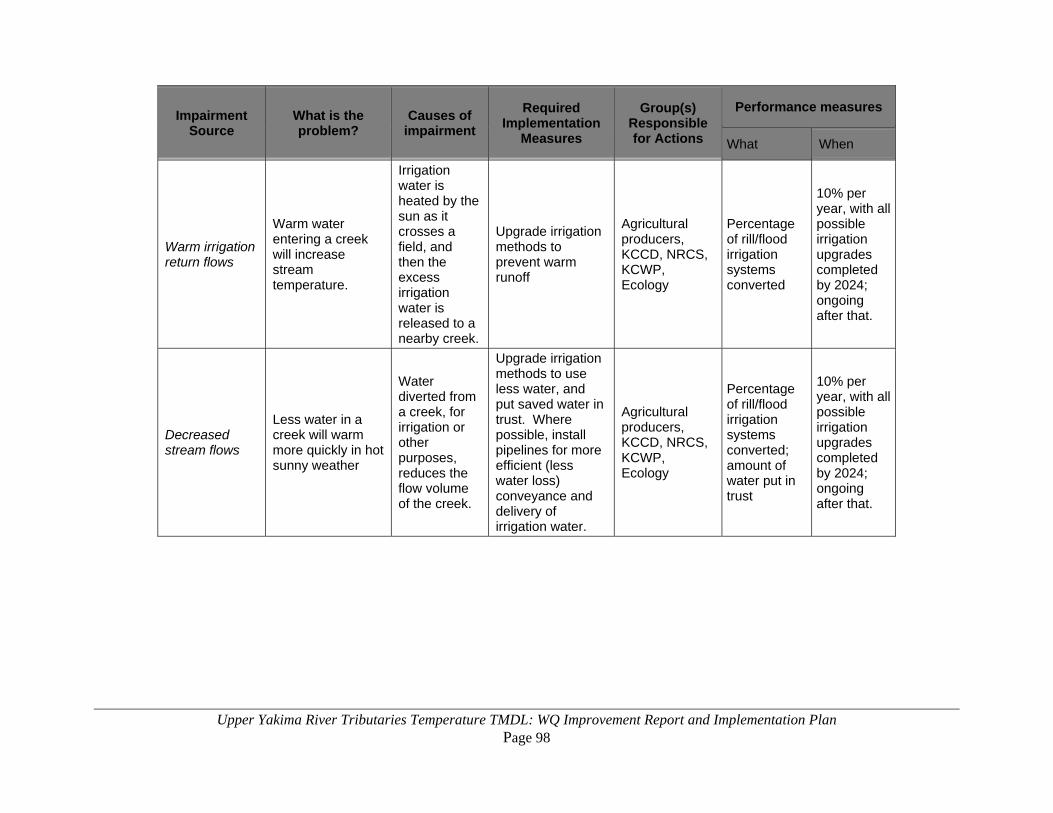
Upper Yakima River Tributaries Temperature TMDL: WQ Improvement Report and Implementation Plan Page 98
Impairment Source
What is the problem?
Causes of impairment
Required Implementation
Measures
Group(s) Responsible for Actions
Performance measures
What When
Warm irrigation return flows
Warm water entering a creek will increase stream temperature.
Irrigation water is heated by the sun as it crosses a field, and then the excess irrigation water is released to a nearby creek.
Upgrade irrigation methods to prevent warm runoff
Agricultural producers, KCCD, NRCS, KCWP, Ecology
Percentage of rill/flood irrigation systems converted
10% per year, with all possible irrigation upgrades completed by 2024; ongoing after that.
Decreased stream flows
Less water in a creek will warm more quickly in hot sunny weather
Water diverted from a creek, for irrigation or other purposes, reduces the flow volume of the creek.
Upgrade irrigation methods to use less water, and put saved water in trust. Where possible, install pipelines for more efficient (less water loss) conveyance and delivery of irrigation water.
Agricultural producers, KCCD, NRCS, KCWP, Ecology
Percentage of rill/flood irrigation systems converted; amount of water put in trust
10% per year, with all possible irrigation upgrades completed by 2024; ongoing after that.
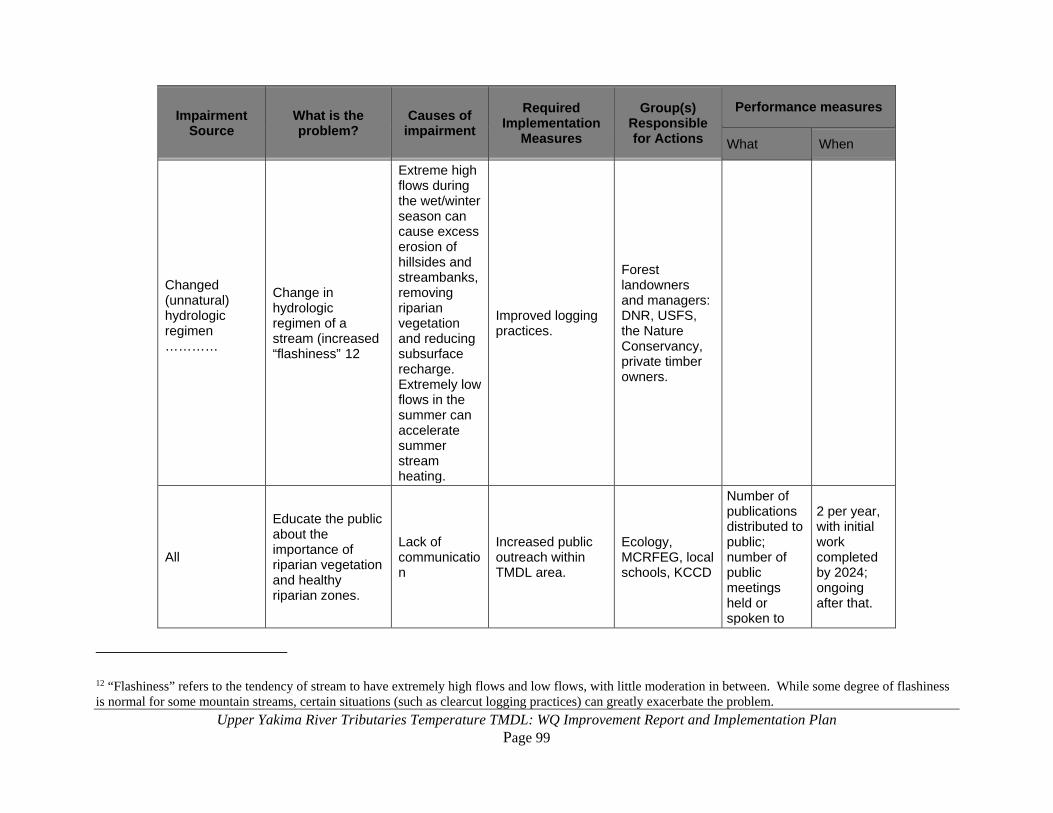
Upper Yakima River Tributaries Temperature TMDL: WQ Improvement Report and Implementation Plan Page 99
Impairment Source
What is the problem?
Causes of impairment
Required Implementation
Measures
Group(s) Responsible for Actions
Performance measures
What When
Changed (unnatural) hydrologic regimen …………
Change in hydrologic regimen of a stream (increased “flashiness” 12
Extreme high flows during the wet/winter season can cause excess erosion of hillsides and streambanks, removing riparian vegetation and reducing subsurface recharge. Extremely low flows in the summer can accelerate summer stream heating.
Improved logging practices.
Forest landowners and managers: DNR, USFS, the Nature Conservancy, private timber owners.
All
Educate the public about the importance of riparian vegetation and healthy riparian zones.
Lack of communication
Increased public outreach within TMDL area.
Ecology, MCRFEG, local schools, KCCD
Number of publications distributed to public; number of public meetings held or spoken to
2 per year, with initial work completed by 2024; ongoing after that.
12 “Flashiness” refers to the tendency of stream to have extremely high flows and low flows, with little moderation in between. While some degree of flashiness is normal for some mountain streams, certain situations (such as clearcut logging practices) can greatly exacerbate the problem.
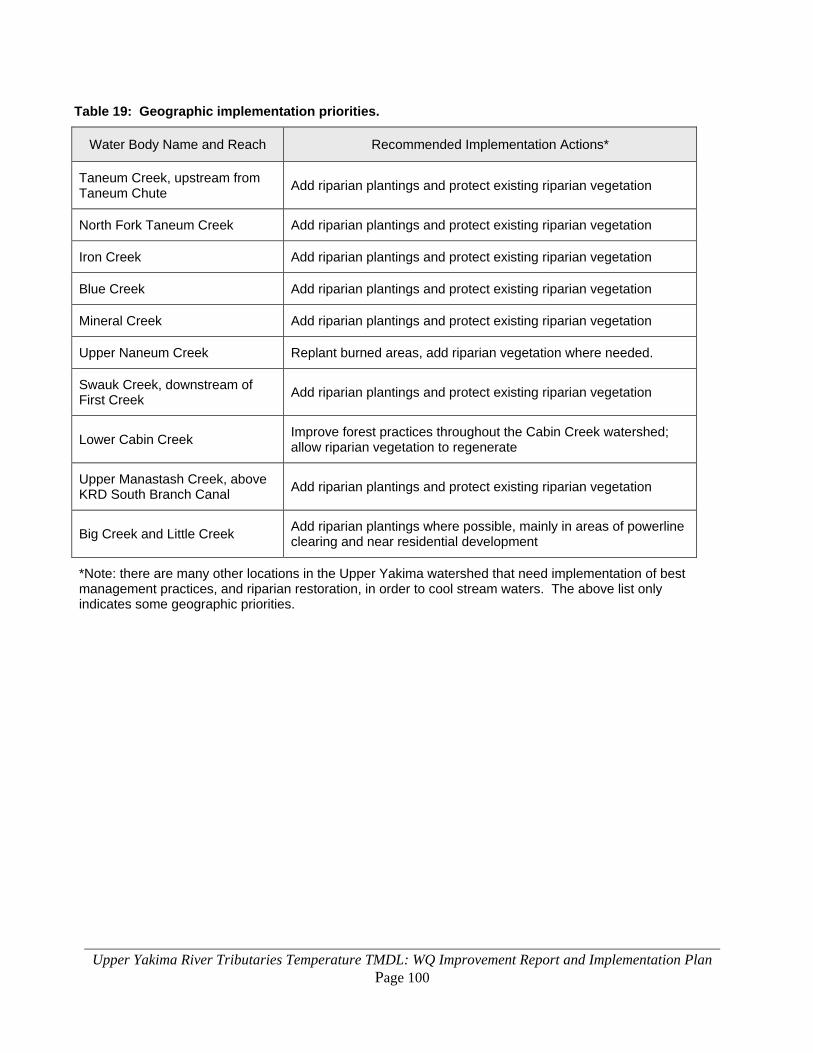
Upper Yakima River Tributaries Temperature TMDL: WQ Improvement Report and Implementation Plan Page 100
Table 19: Geographic implementation priorities.
Water Body Name and Reach Recommended Implementation Actions*
Taneum Creek, upstream from Taneum Chute Add riparian plantings and protect existing riparian vegetation
North Fork Taneum Creek Add riparian plantings and protect existing riparian vegetation
Iron Creek Add riparian plantings and protect existing riparian vegetation
Blue Creek Add riparian plantings and protect existing riparian vegetation
Mineral Creek Add riparian plantings and protect existing riparian vegetation
Upper Naneum Creek Replant burned areas, add riparian vegetation where needed.
Swauk Creek, downstream of First Creek Add riparian plantings and protect existing riparian vegetation
Lower Cabin Creek Improve forest practices throughout the Cabin Creek watershed; allow riparian vegetation to regenerate
Upper Manastash Creek, above KRD South Branch Canal Add riparian plantings and protect existing riparian vegetation
Big Creek and Little Creek Add riparian plantings where possible, mainly in areas of powerline clearing and near residential development
*Note: there are many other locations in the Upper Yakima watershed that need implementation of best management practices, and riparian restoration, in order to cool stream waters. The above list only indicates some geographic priorities.
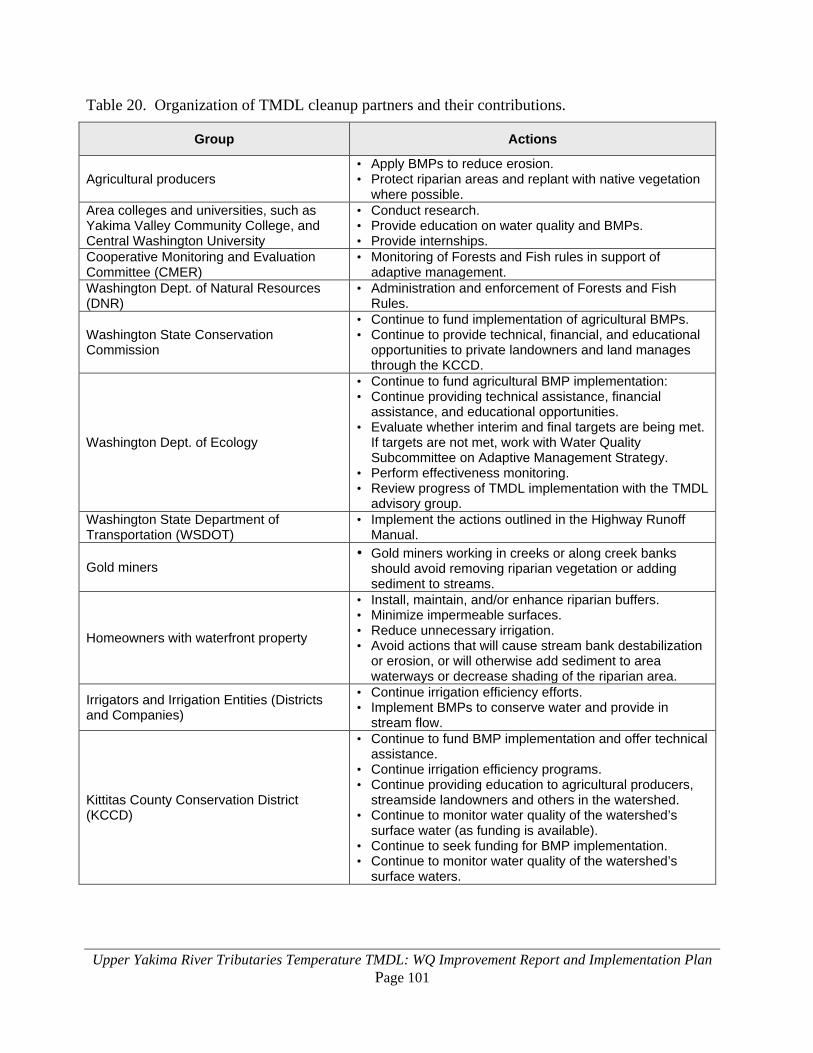
Upper Yakima River Tributaries Temperature TMDL: WQ Improvement Report and Implementation Plan Page 101
Table 20. Organization of TMDL cleanup partners and their contributions.
Group Actions
Agricultural producers • Apply BMPs to reduce erosion. • Protect riparian areas and replant with native vegetation
where possible. Area colleges and universities, such as Yakima Valley Community College, and Central Washington University
• Conduct research. • Provide education on water quality and BMPs. • Provide internships.
Cooperative Monitoring and Evaluation Committee (CMER)
• Monitoring of Forests and Fish rules in support of adaptive management.
Washington Dept. of Natural Resources (DNR)
• Administration and enforcement of Forests and Fish Rules.
Washington State Conservation Commission
• Continue to fund implementation of agricultural BMPs. • Continue to provide technical, financial, and educational
opportunities to private landowners and land manages through the KCCD.
Washington Dept. of Ecology
• Continue to fund agricultural BMP implementation: • Continue providing technical assistance, financial
assistance, and educational opportunities. • Evaluate whether interim and final targets are being met.
If targets are not met, work with Water Quality Subcommittee on Adaptive Management Strategy.
• Perform effectiveness monitoring. • Review progress of TMDL implementation with the TMDL
advisory group. Washington State Department of Transportation (WSDOT)
• Implement the actions outlined in the Highway Runoff Manual.
Gold miners • Gold miners working in creeks or along creek banks
should avoid removing riparian vegetation or adding sediment to streams.
Homeowners with waterfront property
• Install, maintain, and/or enhance riparian buffers. • Minimize impermeable surfaces. • Reduce unnecessary irrigation. • Avoid actions that will cause stream bank destabilization
or erosion, or will otherwise add sediment to area waterways or decrease shading of the riparian area.
Irrigators and Irrigation Entities (Districts and Companies)
• Continue irrigation efficiency efforts. • Implement BMPs to conserve water and provide in
stream flow.
Kittitas County Conservation District (KCCD)
• Continue to fund BMP implementation and offer technical assistance.
• Continue irrigation efficiency programs. • Continue providing education to agricultural producers,
streamside landowners and others in the watershed. • Continue to monitor water quality of the watershed’s
surface water (as funding is available). • Continue to seek funding for BMP implementation. • Continue to monitor water quality of the watershed’s
surface waters.

Upper Yakima River Tributaries Temperature TMDL: WQ Improvement Report and Implementation Plan Page 102
Group Actions
Kittitas County Water Purveyors (KCWP)
• Support implementation of the KCWP’s water quality policy.
• Work with irrigators to reduce polluted runoff from fields. • Encourage landowners to restore riparian areas, within
TMDL area.
KCCD, NRCS • Extend outreach efforts and technical assistance to all
agricultural producers (irrigators, livestock managers, others) in the watershed.
Natural Resources Conservation Service (NRCS)
• Continue educational efforts to area residents, especially streamside landowners.
• Continue to fund BMP implementation, and offer technical assistance.
Private and state timber owners • Implement forest management practices that lead to
achieving the load allocations of this TMDL as required by Forests and Fish rules.
Ranchers
• Maintain vegetation in riparian pastures. • Implement livestock management BMPs to prevent
streambank erosion. • Implement livestock management BMPs to prevent
damage to riparian areas.
Washington State University Cooperative Extension
• Continue educational efforts to area residents, especially streamside landowners.
• Continue to fund BMP implementation, and offer technical assistance.
Kittitas County • Administration of Critical Area Ordinances and Shoreline Master Programs.
Kittitas County, City of Ellensburg, WSDOT • Implement stormwater BMPs. Yakima Tributary Access and Habitat Program (YTAHP)
• Continue riparian restoration efforts.
What is the schedule for achieving water quality standards? The goal of the Upper Yakima River Tributaries Temperature TMDL project is to reduce water temperature and achieve state water quality standards, primarily by increasing system potential shade. The intent of this water quality improvement project is to install all measures that benefit water quality within a ten-year timetable. We recognize that even after measures are implemented, there will be a lag-time before water quality standards are met. Streambank planting projects, for example, will take time for vegetation to mature before maximum water quality benefit will be realized. Mature vegetation resulting in effective shade should be achieved throughout the upper Yakima River tributaries by 2094. Based upon work already underway and completed, many areas in the watershed will achieve cooler temperatures sooner than 2094.
Upper Yakima River Tributaries Temperature TMDL: WQ Improvement Report and Implementation Plan Page 103
Measuring Progress toward Goals The goals of the Upper Yakima River Tributaries Temperature TMDL are to reduce water temperatures to meet TMDL targets and, in some locations, also improve salmonid habitat. Progress toward many of the goals can be measured using the performance measures identified in Table 18. All implementation measures should be in place by 2024, although many of these measures (e.g., riparian plantings) will need protection and maintenance until the measures are self-sustaining. Other implementation measures (e.g., riparian fencing) will need annual maintenance. The ultimate goal of the TMDL is to meet targets by 2094, when all new riparian vegetation has reached mature height.
Performance measures and targets Assessing progress in meeting the goals of this implementation plan requires water quality monitoring at key locations in the creek basins. Ecology recommends that local resource agencies make it a priority to find resources to continue water quality monitoring of the creeks in this report. Ecology conducts effectiveness monitoring. However, because of the time involved in getting riparian planting projects underway and achieving some height of the vegetation for effective shading, Ecology does not expect to schedule effectiveness monitoring in the near future. Implementation review will include periodic assessment of riparian vegetation along the creeks and salmonid habitat in areas where that is a priority. Monitoring and assessment are considered critical to generating understanding and support for improving creek health among landowners living in each creek basin. The plan may consider a variety of monitoring approaches and assessment methods, because some provide better feedback and will generate more interest among the public. River and creek health can be defined in a variety of ways, and could include measurements of:
• Stream width-to-depth ratios taken and compared to the data collected in 2005-2006 for this TMDL.
• Vegetation height and survival rates can be assessed in newly established riparian areas.
• Sediment on the stream bottom (bed load and/or embeddedness) can be taken before and after projects.
• Riparian photo points can be established and aerial photos can be taken. Ecology recommends photo points because they show changes over time.

Upper Yakima River Tributaries Temperature TMDL: WQ Improvement Report and Implementation Plan Page 104
• Stream temperature can also be used to show progress. This would generally be done much later in the process after widespread implementation has been achieved and restored vegetation has had a good length of time to grow, because large increases in shade, along with other improvements, will be necessary before stream temperatures reductions will be large enough to detect.
• Increase in the number of steelhead and bull trout in a given stream reach. This could also be a redd count.
Compliance monitoring will be needed when water quality standards are believed to be achieved. Entities with enforcement authority are responsible for following up on any enforcement actions. Stormwater permittees are responsible for meeting the requirements of their permits. Those conducting restoration projects, or installing best management practices (BMPs), are responsible for monitoring plant survival rates and maintenance of improvements, structures, and fencing.
Effectiveness monitoring plan Effectiveness monitoring determines if the interim targets and water quality standards have been met after the measures described in the water quality implementation plan are functioning (i.e. the in-stream water quality monitoring). This plan includes monitoring that will be done by other entities if there is any planned. Effectiveness monitoring is an element of adaptive management. It provides a real-time feedback process to determine cleanup effectiveness and support adaptive management. Recommended elements in effectiveness monitoring plan: • Water quality program staff will keep track of implementation as it happens, which will
require close coordination with the KCCD and other organizations. Implementation tracking may include restoration of riparian vegetation, irrigation improvements, channel complexity projects, and so on. This may include a GIS layer of implementation projects.
• Riparian vegetation will be assessed at 5-10 year intervals. As riparian revegetation projects
are installed, track the established vegetation height (measured with clinometers if necessary) and effective shade (hemiview photo). Compare vegetation height to expected mature height, and measure effective shade to the shade curve to see how things are progressing. Important sites to evaluate during this step include:
o 39SWA-05.9 o 39TAN-02.0 o Reecer Ck at Dry Ck. connection o Taneum Ck. at Thorp Cemetery Rd.
Upper Yakima River Tributaries Temperature TMDL: WQ Improvement Report and Implementation Plan Page 105
• After about 10 to 20 years, after (1) significant riparian revegetation has occurred and (2) the hemiview photos show that there have been some noticeable increases in shade, then it will be appropriate to monitor water temperature again. At this time, also monitor air temperature and relative humidity, to allow future use of rTemp as a modeling tool. Suggested sites for the temperature monitoring step include:
o 39CAB-00.5 o 39SWA-09.6 or 39SWA-05.9 o 39SWA-00.1 o 39TAN-10.0 o 39TAN-02.0 o 39TAN-00.1 o 39NAN-15.3
Entities with enforcement authority will be responsible for following up on any enforcement actions. Stormwater permittees will be responsible for meeting the requirements of their permits. Those conducting restoration projects or installing BMPs will be responsible for monitoring plant survival rates and maintenance of improvements, structures, and fencing.
Adaptive management Natural systems are complex and dynamic. The way a system will respond to human management activities is often unknown and can only be described as probabilities or possibilities. Adaptive management involves testing, monitoring, evaluating applied strategies, and incorporating new knowledge into management approaches that are based on scientific findings. In the case of TMDLs, Ecology uses adaptive management to assess whether the actions identified as necessary to solve the identified pollution problems are the correct ones and whether they are working. As we implement these actions, the system will respond, and it will also change. Adaptive management allows us to fine-tune our actions to make them more effective, and to try new strategies if we have evidence that a new approach could help us to achieve compliance. TMDL reductions should be achieved by 2094. Interim success may be measured in several ways, such as miles of streambank revegetated or miles of riparian vegetation protected (e.g., livestock fenced away from riparian area). Final success will be measured in two ways: (1) by comparing percent shade to system potential shade, and (2) collecting water temperature data, and comparing it to temperature criteria. Ecology will use adaptive management when water monitoring data show that the TMDL targets are not being met or implementation activities are not producing the desired result. A feedback loop (Figure 36) consisting of the following steps will be implemented:
Step 1. The activities in the water quality implementation plan are put into practice.
Step 2. Programs and BMPs are evaluated for technical adequacy of design and installation.
Step 3. The effectiveness of the activities is evaluated by assessing new monitoring data and comparing it to the data used to set the TMDL targets.
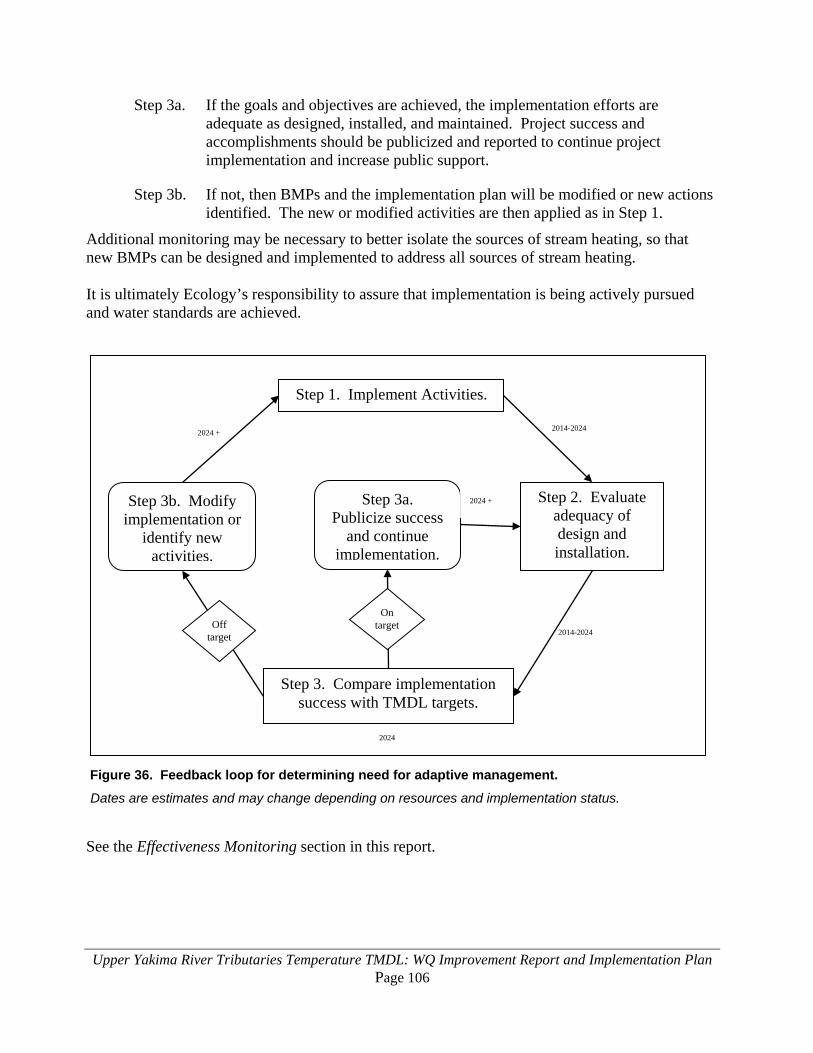
Upper Yakima River Tributaries Temperature TMDL: WQ Improvement Report and Implementation Plan Page 106
Step 3a. If the goals and objectives are achieved, the implementation efforts are adequate as designed, installed, and maintained. Project success and accomplishments should be publicized and reported to continue project implementation and increase public support.
Step 3b. If not, then BMPs and the implementation plan will be modified or new actions identified. The new or modified activities are then applied as in Step 1.
Additional monitoring may be necessary to better isolate the sources of stream heating, so that new BMPs can be designed and implemented to address all sources of stream heating. It is ultimately Ecology’s responsibility to assure that implementation is being actively pursued and water standards are achieved.
Figure 36. Feedback loop for determining need for adaptive management.
Dates are estimates and may change depending on resources and implementation status.
See the Effectiveness Monitoring section in this report.
2024 +
2014-2024
2014-2024
Step 1. Implement Activities.
Step 2. Evaluate adequacy of design and installation.
Step 3. Compare implementation success with TMDL targets.
Step 3a. Publicize success
and continue implementation.
Step 3b. Modify implementation or
identify new activities.
On target Off
target
2024 +
2024
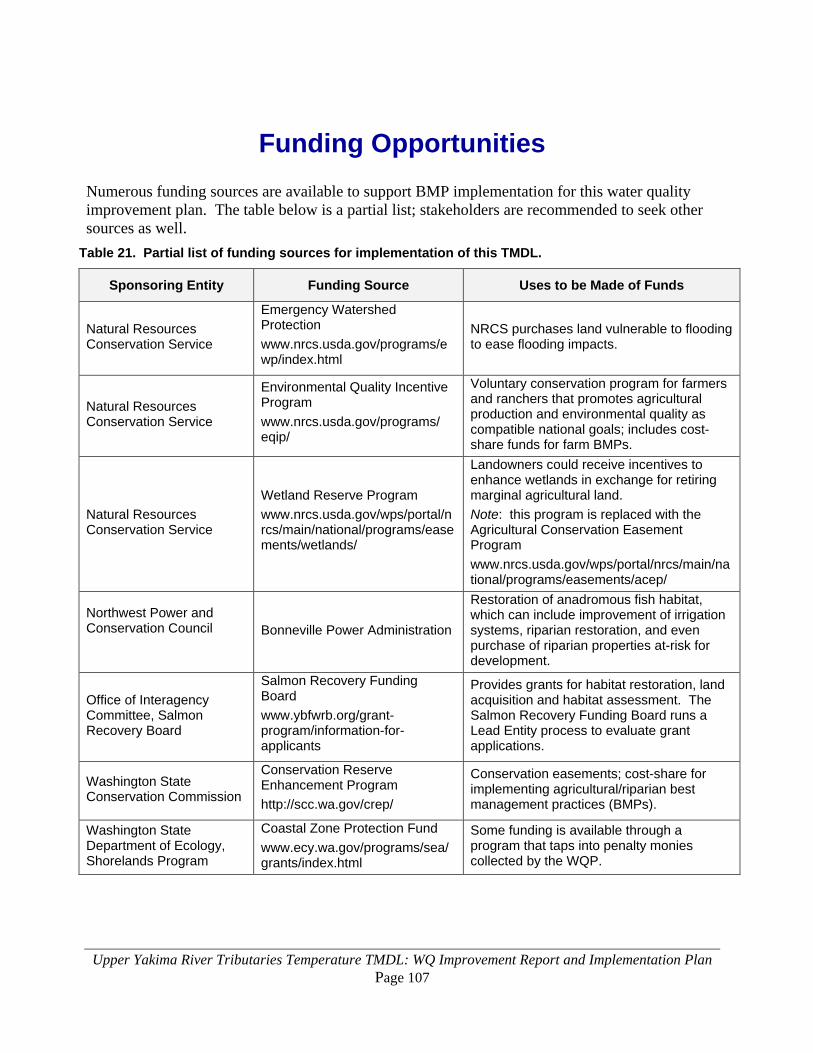
Upper Yakima River Tributaries Temperature TMDL: WQ Improvement Report and Implementation Plan Page 107
Funding Opportunities Numerous funding sources are available to support BMP implementation for this water quality improvement plan. The table below is a partial list; stakeholders are recommended to seek other sources as well.
Table 21. Partial list of funding sources for implementation of this TMDL.
Sponsoring Entity Funding Source Uses to be Made of Funds
Natural Resources Conservation Service
Emergency Watershed Protection www.nrcs.usda.gov/programs/ewp/index.html
NRCS purchases land vulnerable to flooding to ease flooding impacts.
Natural Resources Conservation Service
Environmental Quality Incentive Program www.nrcs.usda.gov/programs/ eqip/
Voluntary conservation program for farmers and ranchers that promotes agricultural production and environmental quality as compatible national goals; includes cost-share funds for farm BMPs.
Natural Resources Conservation Service
Wetland Reserve Program www.nrcs.usda.gov/wps/portal/nrcs/main/national/programs/easements/wetlands/
Landowners could receive incentives to enhance wetlands in exchange for retiring marginal agricultural land. Note: this program is replaced with the Agricultural Conservation Easement Program www.nrcs.usda.gov/wps/portal/nrcs/main/national/programs/easements/acep/
Northwest Power and Conservation Council
Bonneville Power Administration
Restoration of anadromous fish habitat, which can include improvement of irrigation systems, riparian restoration, and even purchase of riparian properties at-risk for development.
Office of Interagency Committee, Salmon Recovery Board
Salmon Recovery Funding Board www.ybfwrb.org/grant-program/information-for-applicants
Provides grants for habitat restoration, land acquisition and habitat assessment. The Salmon Recovery Funding Board runs a Lead Entity process to evaluate grant applications.
Washington State Conservation Commission
Conservation Reserve Enhancement Program http://scc.wa.gov/crep/
Conservation easements; cost-share for implementing agricultural/riparian best management practices (BMPs).
Washington State Department of Ecology, Shorelands Program
Coastal Zone Protection Fund www.ecy.wa.gov/programs/sea/grants/index.html
Some funding is available through a program that taps into penalty monies collected by the WQP.

Upper Yakima River Tributaries Temperature TMDL: WQ Improvement Report and Implementation Plan Page 108
Sponsoring Entity Funding Source Uses to be Made of Funds
Washington State Department of Ecology, Water Quality Program
Centennial Clean Water Fund, Section 319, and State Revolving Fund www.ecy.wa.gov/programs/wq/funding/funding.html
Facilities and water pollution control-related activities; implementation, design, acquisition, construction, and improvement of water pollution control.
Priorities include: implementing water cleanup plans; keeping pollution out of streams and aquifers; modernizing aging wastewater treatment facilities; reclaiming and reusing wastewater.

Upper Yakima River Tributaries Temperature TMDL: WQ Improvement Report and Implementation Plan Page 109
Summary of Public Involvement Methods
Stakeholder involvement Prior to starting this TMDL study, Ecology reached out to several stakeholder organizations to get their input on what needed to be done to cool the tributaries to the upper Yakima River. In 2005, an advisory workgroup was formed - approximately 35 stakeholders attended the first workgroup meeting. Members of the workgroup advised Ecology on TMDL development and assisted with TMDL outreach. From 2006-2014, Ecology regularly met with a variety of stakeholder groups to explain the progress of the TMDL. In addition to the public and stakeholder meetings previously mentioned, a public workshop was held in Ellensburg on September 10, 2014.
Outreach and publications Staff presented information about this TMDL project at the Yakima Watershed Science and Management Conference; the Ellensburg e3 (environment/education/economy)Winter Fair; the annual Kittitas County Salmon Days; and to elementary classrooms. A focus sheet was created during the development of the TMDL and was updated as needed. The focus sheet was distributed at several external stakeholder meetings and other outreach activities. This focus sheet was again revised immediately before the public comment period. Information about this TMDL has been available on the Upper Yakima River Area – Water Quality Improvement Project Website since the start of project: www.ecy.wa.gov/programs/wq/tmdl/yakima_wq/UpperYakTMDL.html
Public comment period A 38-day public comment period for this TMDL report was held from August 15 through September 22, 2014. Then, in response to stakeholder requests, the public comment period was extended for an additional 30 days, until October 22, 2014. A series of news releases were sent to all local media in the greater Yakima River watershed area. Based on the news releases, several newspapers wrote separate news stories about the TMDL and the comment period. Additionally, advertisements in the Daily Record (Ellensburg) and North Kittitas County Tribune (Cle Elum) newspapers announced the public comment period. Nine sets of comments were received. Ecology’s response to these comments and any resulting changes in the TMDL are described in Appendix F.

Upper Yakima River Tributaries Temperature TMDL: WQ Improvement Report and Implementation Plan Page 110
This page is purposely left blank

Upper Yakima River Tributaries Temperature TMDL: WQ Improvement Report and Implementation Plan Page 111
References Adams, T.N. and K. Sullivan, 1989. The physics of forest stream heating: a simple model. Timber, Fish, and Wildlife, Report No. TFW-WQ3-90-007. Washington State Department of Natural Resources, Olympia, WA. Bilhimer, D. and A. Stohr, 2009. Standard Operating Procedures for continuous temperature monitoring of fresh water rivers and streams conducted in a Total Maximum Daily Load (TMDL) project for stream temperature, Version 2.3. Washington State Department of Ecology, Olympia, WA. SOP Number EAP044. www.ecy.wa.gov/programs/eap/quality.html Benda, L., 1997. Mass Wasting Assessment. In Plum Creek Timber Company, Cabin Creek watershed analysis; review draft. Plum Creek Timber Company, Seattle, WA. Brock, S., 2008. Upper Naches River Temperature Total Maximum Daily Load: Volume 1, Water Quality Study Findings. Washington State Department of Ecology, Olympia, WA. Publication No. 08-03-036. https://fortress.wa.gov/ecy/publications/SummaryPages/0803036.html Brown, G.W. and J.T. Krygier, 1970. Effects of clear-cutting on stream temperature. Water Resources Research 6(4):1133-1140. Brown, GW., G.W. Swank, and J. Rothacher, 1971. Water temperature in the Steamboat drainage. U.S. Department of Agriculture, Research Paper PNW-119, Portland, OR. 17 pg. Butkus, S., 2005. Quality Assurance Monitoring Plan: Streamflow Gaging Network. Washington State Department of Ecology, Olympia, WA. Publication No. 05-03-204. https://fortress.wa.gov/ecy/publications/SummaryPages/0503204.html Chapra, S.C. and G.J. Pelletier, 2003. QUAL2K: A Modeling Framework for Simulating River and Stream Water Quality: Documentation and Users Manual. Civil and Environmental Engineering Dept., Tufts University, Medford, MA. [email protected] www.epa.gov/athens/wwqtsc/html/qual2k.htm Chapra, S.C., 1997. Surface Water-Quality Modeling. McGraw-Hill Companies, Inc. Chapra, S.C., 2001. Water-Quality Modeling Workshop for TMDLs. Washington State Department of Ecology, Olympia, WA. June 25-28, 2001. Climate Impacts Group, 2009. The Washington Climate Change Impacts Assessment. M. McGuire Elsner, J. Littell, and L. Whitely Binder (eds). Center for Science in the Earth System, Joint Institute for the Study of the Atmosphere and Oceans, University of Washington, Seattle, WA.
Upper Yakima River Tributaries Temperature TMDL: WQ Improvement Report and Implementation Plan Page 112
Conley, A., J. Freudenthal, D. Lind, P. Mees, and R. Visser, 2009. Yakima Steelhead Recovery Plan. Yakima Basin Fish and Wildlife Recovery Board. www.ybfwrb.org/Recovery.html Creech, J., 2003. Teanaway Temperature Total Maximum Daily Load: Detailed Implementation Plan. Washington State Department of Ecology, Olympia, WA. Publication No. 03-10-025. https://fortress.wa.gov/ecy/publications/SummaryPages/0310025.html Ecology, 2003. Shade.xls – A tool for estimating shade from riparian vegetation. Washington State Department of Ecology, Olympia, WA. www.ecy.wa.gov/programs/eap/models Ecology, 2006. Water Quality Standards for the Surface Waters of the State of Washington, Chapter 173-201A WAC. Washington State Department of Ecology, Olympia, WA. https://fortress.wa.gov/ecy/publications/SummaryPages/0610091.html Ecology, 2010. Water Quality Program Guidance Manual: Procedures to Implement the State’s Temperature Standards through NPDES Permits. Washington State Department of Ecology, Olympia, WA. Publication No. 06-10-100. https://fortress.wa.gov/ecy/publications/SummaryPages/0610100.html Freudenthal, J., D. Lind, R. Visser, and P. Mees, 2005. Yakima Subbasin Salmon Recovery Plan. Draft. Yakima Subbasin Fish and Wildlife Planning Board. www.ybfwrb.org/RecoveryPlan/2005_Recovery_Plan_Draft.pdf Gilmore, S., 2005. System Potential Vegetation in the South Fork Palouse Subbasin. Resource Planning Unlimited, Inc. Moscow, ID. 44 pg. Haring, D., 2001. Habitat Limiting Factors, Yakima River Watershed, Water Resource Inventory Areas 37-39. Washington State Conservation Commission. www.scc.wa.gov/index.php/122-Commission-Plans-Projects-and-Reports/View-category.html Hicks, M., 2002. Evaluating Standards for Protecting Aquatic Life in Washington’s Surface Water Quality Standards – Temperature Criteria – Draft Discussion Paper and Literature Summary. Washington State Department of Ecology, Olympia, WA. Publication No. 00-10-070. https://fortress.wa.gov/ecy/publications/SummaryPages/0010070.html Irle, 2001. Teanaway Temperature Total Maximum Daily Load: Submittal Report. Washington State Department of Ecology, Olympia, WA. Publication No. 01-10-019. https://fortress.wa.gov/ecy/publications/SummaryPages/0110019.html Joy, J., 1988. Kittitas Wastewater Treatment Plant Receiving Water Survey and Abbreviated Class II Inspection: August 1987. Washington State Department of Ecology, Olympia, WA. Publication No. 88-e20. https://fortress.wa.gov/ecy/publications/SummaryPages/biblio/88e20.html Joy, J., 2002. Upper Yakima River Basin Suspended Sediment and Organochlorine Pesticide Total Maximum Daily Load Evaluation. Washington State Department of Ecology, Olympia,
Upper Yakima River Tributaries Temperature TMDL: WQ Improvement Report and Implementation Plan Page 113
WA. Publication No. 02-03-012. https://fortress.wa.gov/ecy/publications/SummaryPages/0203012.html Kardouni, J. and A. Stohr, 2005. Quality Assurance Project Plan: Upper Yakima Basin Temperature Total Maximum Daily Load Study. Washington State Department of Ecology, Olympia, WA. Publication No. 05-03-111. https://fortress.wa.gov/ecy/publications/SummaryPages/0503111.html Kinnison, H.B. and J.E. Sceva, 1963. Effects of Hydraulic and Geological Factors on Streamflow of the Yakima River Basin, Washington. U.S. Geological Survey Water-Supply Paper 1595. http://pubs.usgs.gov/wsp/1595/report.pdf Kittitas County Water Purveyors, 2010. Map, Kittitas Valley irrigation canal systems. www.kcwp.org/maps.html Latham, Ray. Personal Communication, October 18, 2011. Industrial stormwater general permit manager. Washington State Department of Ecology, Central Regional Office, Yakima, WA. Lynch, J.A., G.B. Rishel, and E.S. Corbett, 1984. Thermal alterations of streams draining clearcut watersheds: quantification and biological implications. Hydrobiologia 111:161-169. Manastash Steering Committee, 2007. Manastash Creek Restoration Project Instream Flow Enhancement Implementation Plan. Available through Kittitas County Conservation District. www.kccd.net/manastash.htm
Morrow, J., 2011. City of Ellensburg Stormwater Management Plan Update. City of Ellensburg, Ellensburg, WA. www.ci.ellensburg.wa.us/index.aspx?nid=252 National Agricultural Statistics Service, 2010. United States Department of Agriculture. www.nass.usda.gov/ NOAA, 2007. Adaptive Management for ESA-Listed Salmon and Steelhead Recovery: Decision Framework and Monitoring Guidance. National Oceanic and Atmospheric Administration’s National Marine Fisheries Service. O’Connor, M., 1997. Stream Channel Assessment. In Plum Creek Timber Company, Cabin Creek watershed analysis; review draft. Plum Creek Timber Company, Seattle, WA. ODEQ, 2005. TTools 7.0 User Manual. Oregon Department of Environmental Quality. Portland, OR. www.deq.state.or.us/WQ/TMDLs/tools.htm Pearson, H.E., 1985. Hydrology of the Upper Yakima River Basin, Washington. Washington State Department of Ecology and U.S. Geological Survey. Water-Supply Bulletin 52. Olympia, WA. 46 pg.
Upper Yakima River Tributaries Temperature TMDL: WQ Improvement Report and Implementation Plan Page 114
Pelletier, G.J. and S.C. Chapra, 2003. QUAL2Kw: Documentation and User Manual for a Modeling Framework to Simulate River and Stream Water Quality. Draft Publication. Washington State Department of Ecology, Olympia, WA. www.ecy.wa.gov/programs/eap/models Pelletier, G.J., 2004. Response Temperature (rTemp): A Simple Model of Water Temperature. Washington State Department of Ecology, Olympia, WA. www.ecy.wa.gov/programs/eap/models Poole, G.C. and C.H. Berman, 2000. Pathways of Human Influence on Water Temperature Dynamics in Stream Channels. U.S. Environmental Protection Agency, Region 10, Seattle, WA. 20 pg. www.krisweb.com/biblio/gen_usepa_pooleetal_2000_pathways.pdf. Powell, L., 2005. Mass Wasting Assessment: Landslide Hazard Inventory Project. Cabin Creek Watershed, Kittitas County, Washington. Washington State Department of Natural Resources, Olympia, WA. www.dnr.wa.gov/BusinessPermits/Topics/LandslideHazardZonation/Pages/fp_lhz_completed.aspx Sinokrot, B.A., and H.G. Stefan, 1993. Stream temperature dynamics: measurements and modeling. Water Resources Research. Vol. 29, No. 7, pg. 2299-2312. Stohr, A. and S. Leskie, 2000. Teanaway River Basin Temperature Pilot Technical Assessment. Washington State Department of Ecology, Olympia, WA. Publication No. 00-03-015. https://fortress.wa.gov/ecy/publications/SummaryPages/0003015.html Stohr, A., M. LeMoine, and G. Pelletier, 2007. Walla Walla Tributaries Temperature Total Maximum Daily Load Study. Washington State Department of Ecology, Olympia, WA. Publication No. 07-03-014. https://fortress.wa.gov/ecy/publications/SummaryPages/0703014.html Sullivan, A.E., 2000. The Expected Potential Native Vegetation of the Kittitas Valley, Central Washington: A Soils Based Approach to the Reconstruction of Vegetation Landscapes. Doctoral thesis. Oregon State University, Corvallis, OR. 267 pg. Swift, L.W. and J.B. Messer, 1971. Forest cuttings raise water temperatures of a small stream in the southern Appalachians. Journal of Soil and Water Conservation 26:11-15. University of Kansas, 1996. HemiView User Manual. Delta-T Devices Ltd. ftp://ftp.dynamax.com/Manuals/HemiView_Manual.pdf Veldhuisen, C., 2000. Riparian function assessment of the Big Creek watershed, Kittitas County, Washington. Appendix D in J. Light (ed.), 2000. Big Creek Watershed Analysis. Plum Creek Timber Company, Seattle, WA. Whiley, A. and B. Cleland, 2003. Wenatchee National Forest Water Temperature Total Maximum Daily Load: Technical Report. Washington State Department of Ecology, Water Quality Program, Olympia, WA. Publication No. 03-10-063. https://fortress.wa.gov/ecy/publications/SummaryPages/0310063.html. USEPA. 2002. Establishing Total Maximum Daily Load (TMDL) Wasteload Allocations (WLAs) for Storm Water Sources and NPDES Permit Requirements Based on Those WLAs. Memorandum
Upper Yakima River Tributaries Temperature TMDL: WQ Improvement Report and Implementation Plan Page 115
from Robert H. Wayland, III, Director, Office of Wetlands, Oceans and Watersheds, and James A. Hanlon, Director, Office of Wastewater Management, U.S. Environmental Protection Agency, Washington, DC.

Upper Yakima River Tributaries Temperature TMDL: WQ Improvement Report and Implementation Plan Page 116
This page is purposely left blank
Upper Yakima River Tributaries Temperature TMDL: WQ Improvement Report and Implementation Plan Page 117
Appendices

Upper Yakima River Tributaries Temperature TMDL: WQ Improvement Report and Implementation Plan Page 118
This page is purposely left blank
Upper Yakima River Tributaries Temperature TMDL: WQ Improvement Report and Implementation Plan Page A-119
Appendix A. Glossary, acronyms, and abbreviations
Glossary Angular canopy density (ACD): The percentage of time that a given point on a stream will be shaded from direct beam solar radiation between 10 AM to 2 PM local solar time. For example, if a point on a stream is always shaded from 10 AM to 2 PM in August, then August ACD at that point is 100%. If that point is never shaded between 10 AM to 2 PM, then ACD at that point is zero. Average ACD of a stream reach is estimated by sampling it over the width and length of the reach. Typical values of the ACD for old-growth stands in western Oregon have been reported to range from 80% to 90%.
Basin: Watershed or drainage area in which all land and water areas drain or flow toward a central collector such as a stream, river, or lake at a lower elevation.
Best management practices (BMPs): Physical, structural, and/or operational practices that, when used singularly or in combination, prevent or reduce pollutant discharges.
Channel morphology: The shape and dimensions of the cross-section of a channel of water, such as a stream channel.
Clean Water Act: A federal act passed in 1972 that contains provisions to restore and maintain the quality of the nation’s waters. Section 303(d) of the Clean Water Act establishes the TMDL program.
Critical condition: When the physical, chemical, and biological characteristics of the receiving water environment interact with the effluent to produce the greatest potential adverse impact on aquatic biota and existing or designated water uses. For steady-state discharges to riverine systems, the critical condition may be assumed to be equal to the 7Q10 flow event unless determined otherwise by the department.
Critical period: The time period or season during which a water quality parameter is most likely to be in violation of the numeric criteria. For temperature, the critical period occurs during the summer months.
Designated uses: Those uses specified in Chapter 173-201A WAC (Water Quality Standards for Surface Waters of the State of Washington) for each water body or segment, regardless of whether or not the uses are currently attained.
Diel: Of, or pertaining to, a 24-hour period.
Dilution factor: The relative proportion of effluent to stream (receiving water) flows occurring at the edge of a mixing zone during critical discharge conditions as authorized in accordance with the state’s mixing zone regulations at WAC 173-201A-100. http://apps.leg.wa.gov/WAC/default.aspx?cite=173-201A-020
Upper Yakima River Tributaries Temperature TMDL: WQ Improvement Report and Implementation Plan Page A-120
Diurnal: Of, or pertaining to, a day or each day; daily. (1) Occurring during the daytime only, as different from nocturnal or crepuscular, or (2) Daily; related to actions which are completed in the course of a calendar day, and which typically recur every calendar day (e.g., diurnal temperature rises during the day, and falls during the night).
Effective shade: The fraction of incoming solar shortwave radiation that is blocked from reaching the surface of a stream or other defined area.
Hyporheic: The area under and along the river channel where surface water and groundwater meet.
Load allocation: The portion of a receiving waters’ loading capacity attributed to one or more of its existing or future sources of nonpoint pollution or to natural background sources.
Loading capacity: The greatest amount of a substance that a water body can receive and still meet water quality standards.
Margin of safety: Required component of TMDLs that accounts for uncertainty about the relationship between pollutant loads and quality of the receiving water body.
National Pollutant Discharge Elimination System (NPDES): National program for issuing and revising permits, as well as imposing and enforcing pretreatment requirements, under the Clean Water Act. The NPDES permit program regulates discharges from wastewater treatment plants, large factories, and other facilities that use, process, and discharge water back into lakes, streams, rivers, bays, and oceans.
Near-stream disturbance zone (NSDZ): The active channel area without riparian vegetation that includes features such as gravel bars.
Nonpoint source: Pollution that enters any waters of the state from any dispersed land-based or water-based activities, including but not limited to atmospheric deposition, surface water runoff from agricultural lands, urban areas, or forest lands, subsurface or underground sources, or discharges from boats or marine vessels not otherwise regulated under the National Pollutant Discharge Elimination System Program. Generally, any unconfined and diffuse source of contamination. Legally, any source of water pollution that does not meet the legal definition of “point source” in section 502(14) of the Clean Water Act.
Point source: Sources of pollution that discharge at a specific location from pipes, outfalls, and conveyance channels to a surface water. Examples of point source discharges include municipal wastewater treatment plants, municipal stormwater systems, industrial waste treatment facilities, and construction sites that clear more than five acres of land.
Pollution: Contamination, or other alteration of the physical, chemical, or biological properties, of any waters of the state. This includes change in temperature, taste, color, turbidity, or odor of the waters. It also includes discharge of any liquid, gaseous, solid, radioactive, or other substance into any waters of the state. This definition assumes that these changes will, or are likely to, create a nuisance or render such waters harmful, detrimental, or injurious to (1) public health, safety, or welfare, or (2) domestic, commercial, industrial, agricultural, recreational, or other legitimate beneficial uses, or (3) livestock, wild animals, birds, fish, or other aquatic life.
Upper Yakima River Tributaries Temperature TMDL: WQ Improvement Report and Implementation Plan Page A-121
Riparian: Relating to the banks along a natural course of water.
Salmonid: Fish that belong to the family Salmonidae. Basically, any species of salmon, trout, or char. www.fws.gov/le/ImpExp/FactSheetSalmonids.htm
Surface waters of the state: Lakes, rivers, ponds, streams, inland waters, salt waters, wetlands and all other surface waters and water courses within the jurisdiction of Washington State.
System potential: The design condition used for TMDL analysis.
System potential mature riparian vegetation: Vegetation which can grow and reproduce on a site, given climate, elevation, soil properties, plant biology, and hydrologic processes.
System potential temperature: An approximation of the temperatures that would occur under natural conditions. System potential is our best understanding of natural conditions that can be supported by available analytical methods. The simulation of the system potential condition uses best estimates of mature riparian vegetation, system potential channel morphology, and system potential riparian microclimate that would occur absent any human alteration.
Total maximum daily load (TMDL): A distribution of a substance in a water body designed to protect it from exceeding water quality standards. A TMDL is equal to the sum of all of the following: (1) individual wasteload allocations for point sources, (2) the load allocations for nonpoint sources, (3) the contribution of natural sources, and (4) a margin of Safety to allow for uncertainty in the wasteload determination. A reserve for future growth is also generally provided.
Wasteload allocation: The portion of a receiving water’s loading capacity allocated to existing or future point sources of pollution. Wasteload allocations constitute one type of water quality-based effluent limitation.
Watershed: A drainage area or basin in which all land and water areas drain or flow toward a central collector such as a stream, river, or lake at a lower elevation.
1-DMax or 1-day maximum temperature: The highest water temperature reached on any given day. This measure can be obtained using calibrated maximum/minimum thermometers or continuous monitoring probes having sampling intervals of thirty minutes or less.
303(d) List: Section 303(d) of the federal Clean Water Act requires Washington State periodically to prepare a list of all surface waters in the state for which beneficial uses of the water – such as for drinking, recreation, aquatic habitat, and industrial use – are impaired by pollutants. These are water quality-limited water bodies (ocean waters, estuaries, lakes, and streams) that fall short of state surface water quality standards and are not expected to improve within the next two years.
7-DADMax or 7-day average of the daily maximum temperatures: The arithmetic average of seven consecutive measures of daily maximum temperatures. The 7-DADMax for any individual day is calculated by averaging that day’s daily maximum temperature with the daily maximum temperatures of the three days prior and the three days after that date.
Upper Yakima River Tributaries Temperature TMDL: WQ Improvement Report and Implementation Plan Page A-122
7Q2 flow: A typical low-flow condition. The 7Q2 is a statistical estimate of the lowest 7-day average flow that can be expected to occur once every other year on average. The 7Q2 flow is commonly used to represent the average low-flow condition in a water body and is typically calculated from long-term flow data collected in each basin. For temperature TMDL work, the 7Q2 is usually calculated for the months of July and August as these typically represent the critical months for temperature in our state.
7Q10 flow: A critical low-flow condition. The 7Q10 is a statistical estimate of the lowest 7-day average flow that can be expected to occur once every ten years on average. The 7Q10 flow is commonly used to represent the critical flow condition in a water body and is typically calculated from long-term flow data collected in each basin. For temperature TMDL work, the 7Q10 is usually calculated for the months of July and August as these typically represent the critical months for temperature in our state.
90th percentile: A statistical number obtained from a distribution of a data set, above which 10% of the data exists and below which 90% of the data exists.
Acronyms and Abbreviations ACD Angular Canopy Density BLM U.S. Bureau of Land Management BMP Best management practices CWA Clean Water Act DEM Digital Elevation Model DMR Discharge Monitoring Report DNR Washington State Department of Natural Resources Ecology Washington State Department of Ecology ECY Washington State Department of Ecology EIM Environmental Information Management database EPA U.S. Environmental Protection Agency EWC Ellensburg Water Company GIRAS Geographic Information and Analysis System GIS Geographic Information System software GLO General Land Office KCCD Kittitas County Conservation District KCWP Kittitas County Water Purveyors KRD Kittitas Reclamation District NAIP National Agricultural Imagery Program NIST National Institute of Standards and Technology NOAA National Oceanic and Atmospheric Administration NPDES (See Glossary above) NRCS Natural Resources Conservation Service NSDZ Near-stream disturbance zones ODEQ Oregon Department of Environmental Quality RAWS Remote Automated Weather Stations
Upper Yakima River Tributaries Temperature TMDL: WQ Improvement Report and Implementation Plan Page A-123
RM River mile RMSE Root Mean Squared Error RPD Relative percent difference SOP Standard operating procedures TMDL Total Maximum Daily Load (and see Glossary above) USBR U.S Bureau of Reclamation USFS U.S. Forest Service, U.S. Department of Agriculture USGS U.S. Geological Survey WAC Washington Administrative Code WBID Water Body ID WDFW Washington Department of Fish and Wildlife WLA Wasteload Allocation WQIR Water Quality Improvement Report WRIA Water Resource Inventory Area WSDOT Washington State Department of Transportation WWTP Wastewater treatment plant YBFWRB Yakima Basin Fish and Wildlife Recovery Board Units of Measurement °C degrees centigrade cfs cubic feet per second ft feet km kilometer, a unit of length equal to 1,000 meters. M meter um micrometer

Upper Yakima River Tributaries Temperature TMDL: WQ Improvement Report and Implementation Plan Page A-124
This page is purposely left blank.
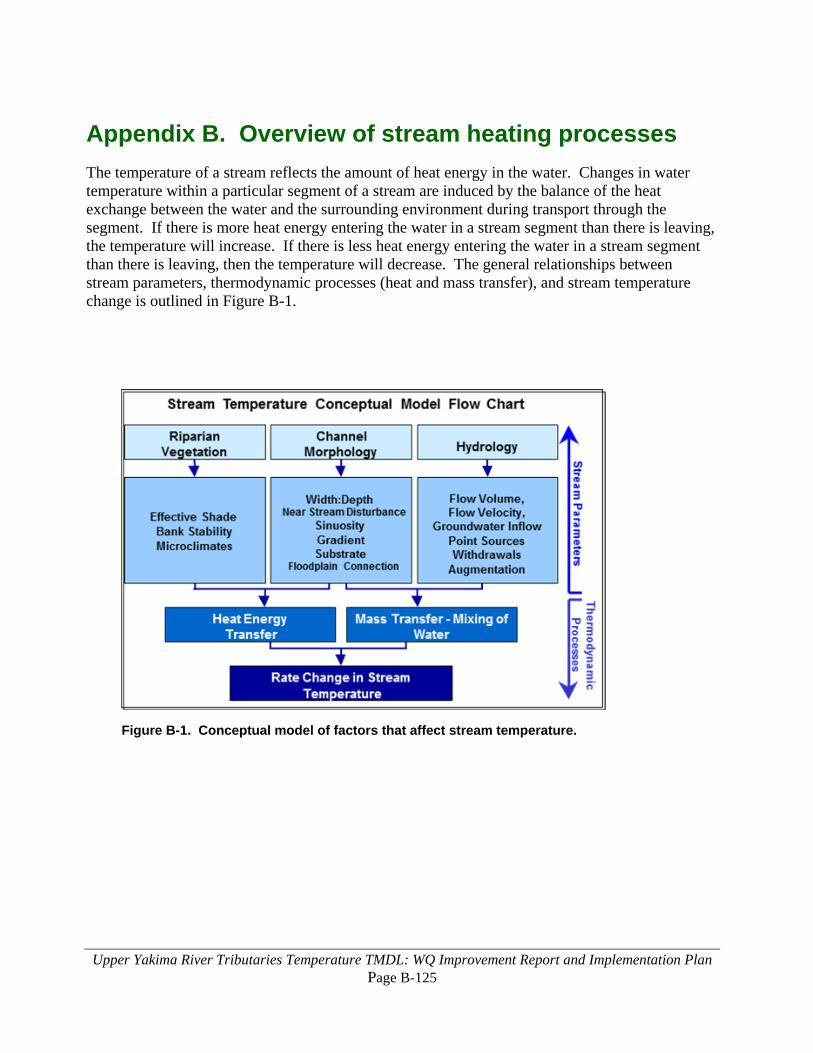
Upper Yakima River Tributaries Temperature TMDL: WQ Improvement Report and Implementation Plan Page B-125
Appendix B. Overview of stream heating processes The temperature of a stream reflects the amount of heat energy in the water. Changes in water temperature within a particular segment of a stream are induced by the balance of the heat exchange between the water and the surrounding environment during transport through the segment. If there is more heat energy entering the water in a stream segment than there is leaving, the temperature will increase. If there is less heat energy entering the water in a stream segment than there is leaving, then the temperature will decrease. The general relationships between stream parameters, thermodynamic processes (heat and mass transfer), and stream temperature change is outlined in Figure B-1.
Figure B-1. Conceptual model of factors that affect stream temperature.
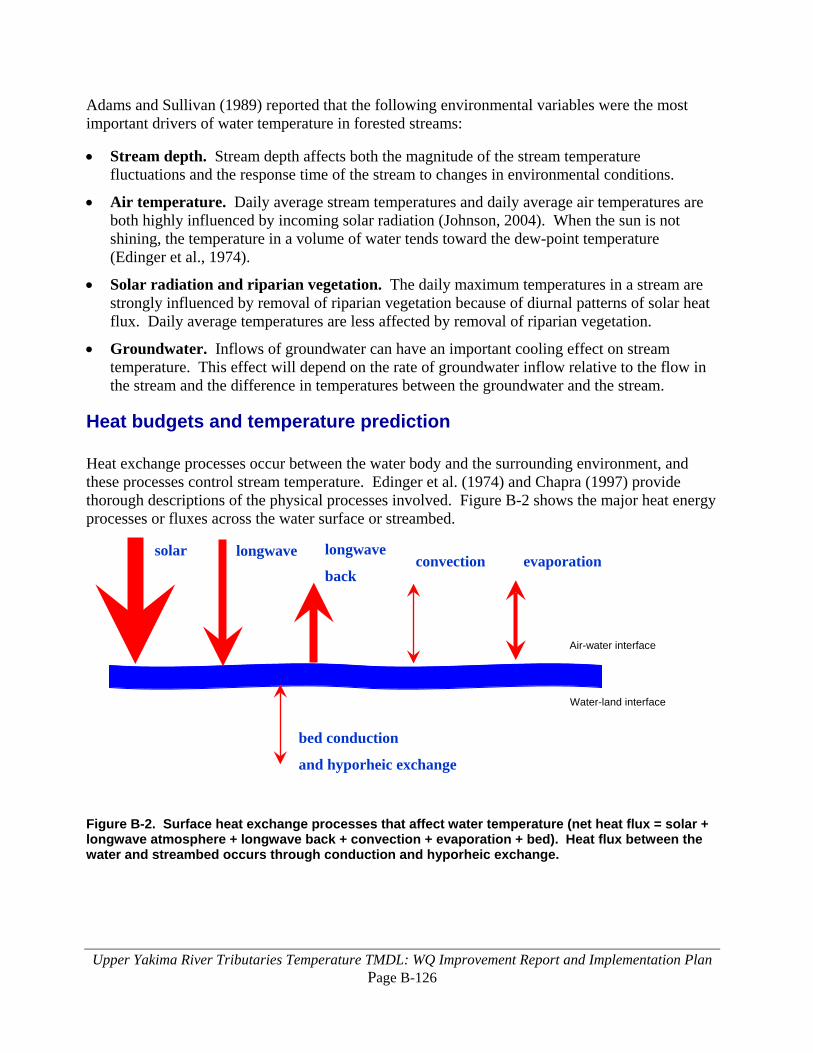
Upper Yakima River Tributaries Temperature TMDL: WQ Improvement Report and Implementation Plan Page B-126
Adams and Sullivan (1989) reported that the following environmental variables were the most important drivers of water temperature in forested streams:
• Stream depth. Stream depth affects both the magnitude of the stream temperature fluctuations and the response time of the stream to changes in environmental conditions.
• Air temperature. Daily average stream temperatures and daily average air temperatures are both highly influenced by incoming solar radiation (Johnson, 2004). When the sun is not shining, the temperature in a volume of water tends toward the dew-point temperature (Edinger et al., 1974).
• Solar radiation and riparian vegetation. The daily maximum temperatures in a stream are strongly influenced by removal of riparian vegetation because of diurnal patterns of solar heat flux. Daily average temperatures are less affected by removal of riparian vegetation.
• Groundwater. Inflows of groundwater can have an important cooling effect on stream temperature. This effect will depend on the rate of groundwater inflow relative to the flow in the stream and the difference in temperatures between the groundwater and the stream.
Heat budgets and temperature prediction Heat exchange processes occur between the water body and the surrounding environment, and these processes control stream temperature. Edinger et al. (1974) and Chapra (1997) provide thorough descriptions of the physical processes involved. Figure B-2 shows the major heat energy processes or fluxes across the water surface or streambed.
Figure B-2. Surface heat exchange processes that affect water temperature (net heat flux = solar + longwave atmosphere + longwave back + convection + evaporation + bed). Heat flux between the water and streambed occurs through conduction and hyporheic exchange.
bed conduction
and hyporheic exchange
Air-water interface
solar longwave longwave
back convection evaporation
Water-land interface

Upper Yakima River Tributaries Temperature TMDL: WQ Improvement Report and Implementation Plan Page B-127
The heat exchange processes with the greatest magnitude are as follows (Edinger et al., 1974):
• Shortwave solar radiation. Shortwave solar radiation is the radiant energy which passes directly from the sun to the earth. Shortwave solar radiation is contained in a wavelength range between 0.14 um and about 4 um. At MesoWest’s Liberty weather station on Swauk Creek, the daily average global shortwave solar radiation for July-August 2005 was 318 W/m2. The peak values during daylight hours are typically about 3 times higher than the daily average. Shortwave solar radiation constitutes the major thermal input to an unshaded body of water during the day when the sky is clear. Solar exposure was identified as the most influential factor in stream heating processes (Sinokrot and Stefan, 1993; Johnson and Jones; 2000; Danehy et al., 2005).
• Longwave atmospheric radiation. The longwave radiation from the atmosphere ranges in wavelength from about 4 to 120 um. Longwave atmospheric radiation depends primarily on air temperature and humidity, and increases as both of those increase. It constitutes the major thermal input to a body of water at night and on warm cloudy days. The daily average heat flux from longwave atmospheric radiation typically ranges from about 300 to 450 W/m2 at mid latitudes (Edinger et al., 1974).
• Longwave back radiation from the water to the atmosphere. Water sends heat energy back to the atmosphere in the form of longwave radiation in the wavelength range from about 4 to 120 um. Back radiation accounts for a major portion of the heat loss from a body of water. Back radiation increases as water temperature increases. The daily average heat flux out of the water from longwave back radiation typically ranges from about 300 to 500 W/m2
(Edinger et al., 1974).
The remaining heat exchange processes generally have less magnitude and are as follows:
• Evaporation flux at the air-water interface is influenced mostly by wind speed and the vapor pressure gradient between the water surface and the air. When the air is saturated, the evaporation stops. When the gradient is negative (vapor pressure at the water surface is less than the vapor pressure of the air), condensation, the reversal of evaporation takes place; this term then becomes a gain component in the heat balance.
• Convection flux at the air-water interface is driven by the temperature difference between water and air and by wind speed. Heat is transferred in the direction of decreasing temperature.
• Streambed conduction flux and hyporheic exchange component of the heat budget represents the heat exchange through conduction between the bed and the water body and the influence of hyporheic exchange. The magnitude of streambed conduction is driven by the size and conductance properties of the substrate. The heat transfer through conduction is more pronounced when thermal differences between the substrate and water column are higher. This heat transfer usually affects the temperature diel profile, rather than the magnitude of the maximum daily water temperature.
Hyporheic exchange recently received increased attention as a possible important mechanism for stream cooling (Johnson and Jones, 2000, Poole and Berman, 2000, Johnson, 2004). The hyporheic zone is defined as the region located beneath the channel characterized by complex
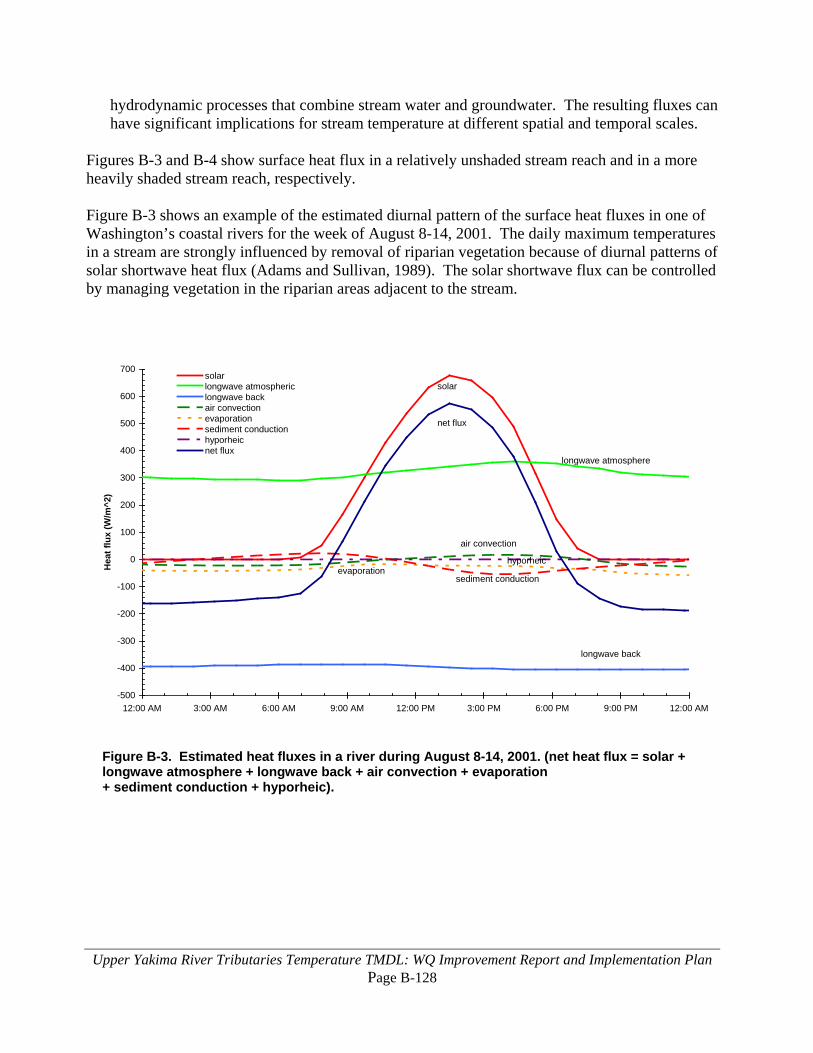
Upper Yakima River Tributaries Temperature TMDL: WQ Improvement Report and Implementation Plan Page B-128
hydrodynamic processes that combine stream water and groundwater. The resulting fluxes can have significant implications for stream temperature at different spatial and temporal scales.
Figures B-3 and B-4 show surface heat flux in a relatively unshaded stream reach and in a more heavily shaded stream reach, respectively. Figure B-3 shows an example of the estimated diurnal pattern of the surface heat fluxes in one of Washington’s coastal rivers for the week of August 8-14, 2001. The daily maximum temperatures in a stream are strongly influenced by removal of riparian vegetation because of diurnal patterns of solar shortwave heat flux (Adams and Sullivan, 1989). The solar shortwave flux can be controlled by managing vegetation in the riparian areas adjacent to the stream.
Figure B-3. Estimated heat fluxes in a river during August 8-14, 2001. (net heat flux = solar + longwave atmosphere + longwave back + air convection + evaporation + sediment conduction + hyporheic).
-500
-400
-300
-200
-100
0
100
200
300
400
500
600
700
12:00 AM 3:00 AM 6:00 AM 9:00 AM 12:00 PM 3:00 PM 6:00 PM 9:00 PM 12:00 AM
Hea
t flu
x (W
/m^2
)
solarlongwave atmosphericlongwave backair convectionevaporationsediment conductionhyporheicnet flux
longwave atmosphere
solar
net flux
longwave back
sediment conduction
air convection
evaporationhyporheic

Upper Yakima River Tributaries Temperature TMDL: WQ Improvement Report and Implementation Plan Page B-129
Figure B-4 shows an example of the estimated diurnal pattern of the surface heat fluxes in a more heavily shaded location in the same river. Shade that is produced by riparian vegetation or topography can reduce the solar shortwave flux. Other processes – such as longwave radiation, convection, evaporation, bed conduction, or hyporheic exchange – also influence the net heat flux into or out of a stream.
Figure B-4. Estimated heat fluxes in a more shaded section of a river during August 8-14, 2001. (net heat flux = solar + longwave atmosphere + longwave back + air convection + evaporation + sediment conduction + hyporheic).
Heat exchange between the stream and the streambed has an important influence on water temperature. The temperature of the streambed is typically warmer than the overlying water at night and cooler than the water during the daylight (Figure B-5). Heat is typically transferred from the water into the streambed during the day, then back into the stream during the night (Adams and Sullivan, 1989). This has the effect of dampening the diurnal range of stream temperature variations without affecting the daily average stream temperature.
-500
-400
-300
-200
-100
0
100
200
300
400
500
600
700
12:00 AM 3:00 AM 6:00 AM 9:00 AM 12:00 PM 3:00 PM 6:00 PM 9:00 PM 12:00 AM
Hea
t flu
x (W
/m^2
)
solarlongwave atmosphericlongwave backair convectionevaporationsediment conductionhyporheicnet flux
longwave atmosphere
solar
net flux
longwave back
sediment conduction
air convection
evaporationhyporheic
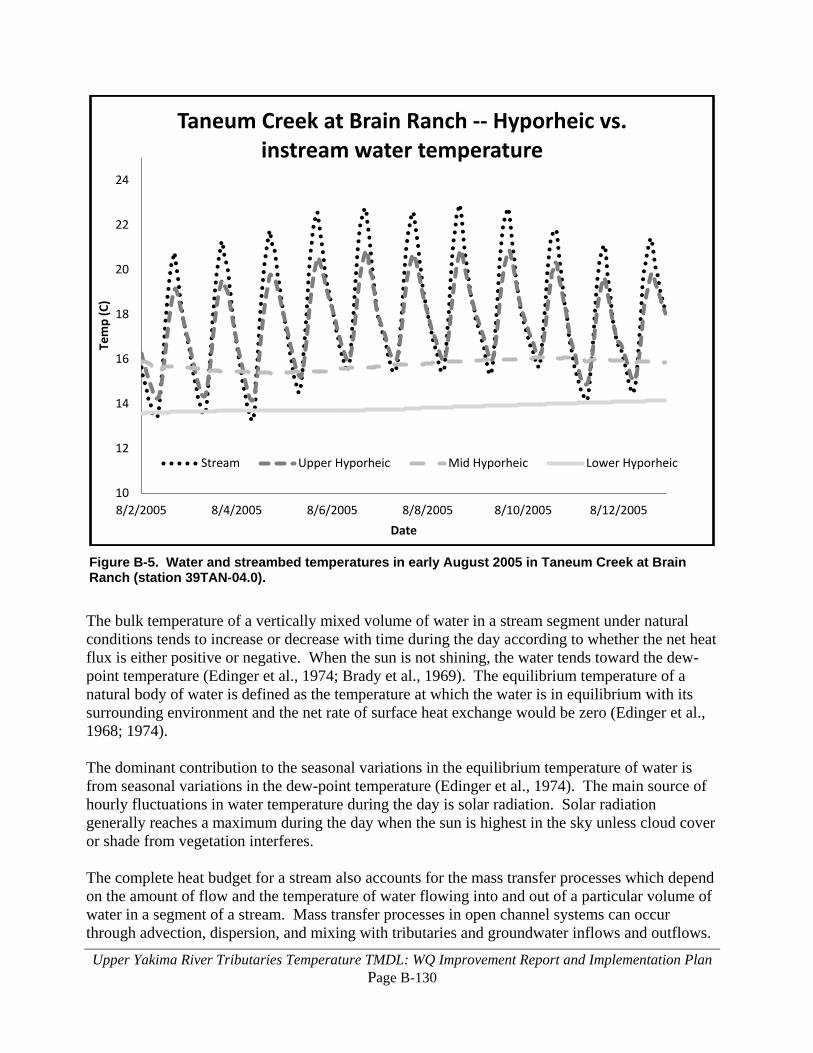
Upper Yakima River Tributaries Temperature TMDL: WQ Improvement Report and Implementation Plan Page B-130
Figure B-5. Water and streambed temperatures in early August 2005 in Taneum Creek at Brain Ranch (station 39TAN-04.0).
The bulk temperature of a vertically mixed volume of water in a stream segment under natural conditions tends to increase or decrease with time during the day according to whether the net heat flux is either positive or negative. When the sun is not shining, the water tends toward the dew-point temperature (Edinger et al., 1974; Brady et al., 1969). The equilibrium temperature of a natural body of water is defined as the temperature at which the water is in equilibrium with its surrounding environment and the net rate of surface heat exchange would be zero (Edinger et al., 1968; 1974). The dominant contribution to the seasonal variations in the equilibrium temperature of water is from seasonal variations in the dew-point temperature (Edinger et al., 1974). The main source of hourly fluctuations in water temperature during the day is solar radiation. Solar radiation generally reaches a maximum during the day when the sun is highest in the sky unless cloud cover or shade from vegetation interferes. The complete heat budget for a stream also accounts for the mass transfer processes which depend on the amount of flow and the temperature of water flowing into and out of a particular volume of water in a segment of a stream. Mass transfer processes in open channel systems can occur through advection, dispersion, and mixing with tributaries and groundwater inflows and outflows.
10
12
14
16
18
20
22
24
8/2/2005 8/4/2005 8/6/2005 8/8/2005 8/10/2005 8/12/2005
Tem
p (C
)
Date
Taneum Creek at Brain Ranch -- Hyporheic vs. instream water temperature
Stream Upper Hyporheic Mid Hyporheic Lower Hyporheic
Upper Yakima River Tributaries Temperature TMDL: WQ Improvement Report and Implementation Plan Page B-131
Mass transfer relates to transport of flow volume downstream, instream mixing, and the introduction or removal of water from a stream. For instance, flow from a tributary will cause a temperature change if the temperature is different from the receiving water.
Thermal role of riparian vegetation The role of riparian vegetation in maintaining a healthy stream condition and water quality is well documented and accepted in the scientific literature. Summer stream temperature increases due to the removal of riparian vegetation are well documented (e.g., Holtby, 1988; Lynch et al., 1984; Rishel et al., 1982; Patrick, 1980; Swift and Messer, 1971; Brown et al., 1971; and Levno and Rothacher, 1967). These studies generally support the findings of Brown and Krygier (1970) that loss of riparian vegetation results in larger daily temperature variations and elevated monthly and annual temperatures. Adams and Sullivan (1989) also concluded that daily maximum temperatures are strongly influenced by the removal of riparian vegetation because of the effect of diurnal fluctuations in solar heat flux. Summaries of the scientific literature on the thermal role of riparian vegetation in forested and agricultural areas are provided by Belt et al., 1992; Beschta et al., 1987; Bolton and Monahan, 2001; Castelle and Johnson, 2000; CH2M Hill, 2000; GEI, 2002; Ice, 2001; and Wenger, 1999. All of these summaries recognize that the scientific literature indicates that riparian vegetation plays an important role in controlling stream temperature. Important benefits that riparian vegetation has upon the stream temperature include:
• Near-stream vegetation height, width, and density combine to produce shadows that can reduce solar heat flux to the surface of the water.
• Riparian vegetation creates a thermal microclimate that generally maintains cooler air temperatures, higher relative humidity, lower wind speeds, and cooler ground temperatures along stream corridors.
• Bank stability is largely a function of near-stream vegetation. Specifically, channel morphology is often highly influenced by land-cover type and condition by affecting flood plain and instream roughness, contributing coarse woody debris, and influencing sedimentation, stream substrate compositions, and streambank stability.
The warming of water temperatures as a stream flows downstream is a natural process. However, the rates of heating can be dramatically reduced when high levels of shade exist and heat flux from solar radiation is minimized. The overriding justification for increases in shade from riparian vegetation is to minimize the contribution of solar heat flux in stream heating. There is a natural maximum level of shade that a given stream is capable of attaining, and the importance of shade decreases as the width of a stream increases. The distinction between reduced heating of streams and actual cooling is important. Shade can significantly reduce the amount of heat flux that enters a stream. Whether there is a reduction in the amount of warming of the stream, maintenance of inflowing temperatures, or cooling of a stream as it flows downstream depends on the balance of all of the heat exchange and mass transfer processes in the stream.
Upper Yakima River Tributaries Temperature TMDL: WQ Improvement Report and Implementation Plan Page B-132
Effective shade Shade is an important parameter that controls the stream heating derived from solar radiation. Solar radiation has the potential to be one of the largest heat-transfer mechanisms in a stream system. Human activities can degrade near-stream vegetation and/or channel morphology and, in turn, decrease shade. Reductions in stream surface shade have the potential to cause significant increases in heat delivery to a stream system. Stream shade is an important factor in describing the heat budget for the present analysis. Stream shade may be measured or calculated using a variety of methods (Chen, 1996; Chen et al., 1998; Ice, 2001; OWEB, 1999; Teti, 2001; Teti and Pike, 2005). Shade is the amount of solar energy that is obscured or reflected by vegetation or topography above a stream. Effective shade is defined as the fraction or percentage of the total possible solar radiation heat energy that is prevented from reaching the surface of the water: effective shade = (J1 – J2)/J1 where J1 is the potential solar heat flux above the influence of riparian vegetation and topography, and J2 is the solar heat flux at the stream surface. Canopy cover is the percent of sky covered by vegetation and topography at a given point. Shade is influenced by cover but changes throughout each day, as the position of sun changes spatially and temporally with respect to the canopy cover (Kelley and Krueger, 2005). In the Northern Hemisphere, the earth tilts on its axis toward the sun during the summer, allowing longer day length and higher solar altitude. Both are functions of solar declination, a measure of the earth’s tilt toward the sun (Figure B-6). Latitude and longitude positions fix the stream to a position on the globe, while aspect provides the direction of streamflow. Near-stream vegetation height, width, and density describe the physical barriers between the stream and sun that can attenuate and scatter incoming solar radiation, producing shade (Table B-1). The solar position has a vertical component – solar altitude – and a horizontal component – solar azimuth – that are both functions of time, date, and the earth’s rotation. While the interaction of these shade variables may seem complex, the mathematics that describes them is relatively straightforward geometry. Using solar tables or mathematical simulations, the potential daily solar load can be quantified. The shade from riparian vegetation can be measured with a variety of methods, including (Ice, 2001; OWEB, 1999; Boyd, 1996; Teti, 2001; Teti and Pike, 2005):
• Hemispherical photography • Angular canopy densiometer • Solar pathfinder
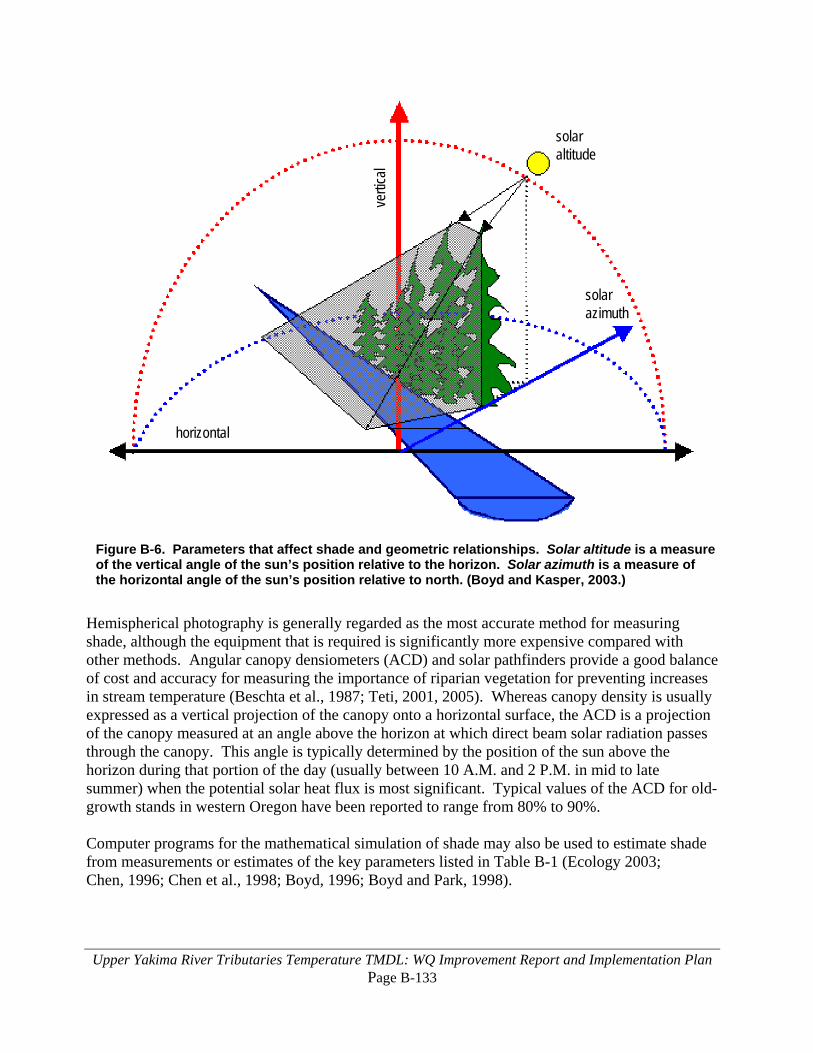
Upper Yakima River Tributaries Temperature TMDL: WQ Improvement Report and Implementation Plan Page B-133
Figure B-6. Parameters that affect shade and geometric relationships. Solar altitude is a measure of the vertical angle of the sun’s position relative to the horizon. Solar azimuth is a measure of the horizontal angle of the sun’s position relative to north. (Boyd and Kasper, 2003.)
Hemispherical photography is generally regarded as the most accurate method for measuring shade, although the equipment that is required is significantly more expensive compared with other methods. Angular canopy densiometers (ACD) and solar pathfinders provide a good balance of cost and accuracy for measuring the importance of riparian vegetation for preventing increases in stream temperature (Beschta et al., 1987; Teti, 2001, 2005). Whereas canopy density is usually expressed as a vertical projection of the canopy onto a horizontal surface, the ACD is a projection of the canopy measured at an angle above the horizon at which direct beam solar radiation passes through the canopy. This angle is typically determined by the position of the sun above the horizon during that portion of the day (usually between 10 A.M. and 2 P.M. in mid to late summer) when the potential solar heat flux is most significant. Typical values of the ACD for old-growth stands in western Oregon have been reported to range from 80% to 90%. Computer programs for the mathematical simulation of shade may also be used to estimate shade from measurements or estimates of the key parameters listed in Table B-1 (Ecology 2003; Chen, 1996; Chen et al., 1998; Boyd, 1996; Boyd and Park, 1998).
vertic
al
horizontal
solarazimuth
solaraltitude
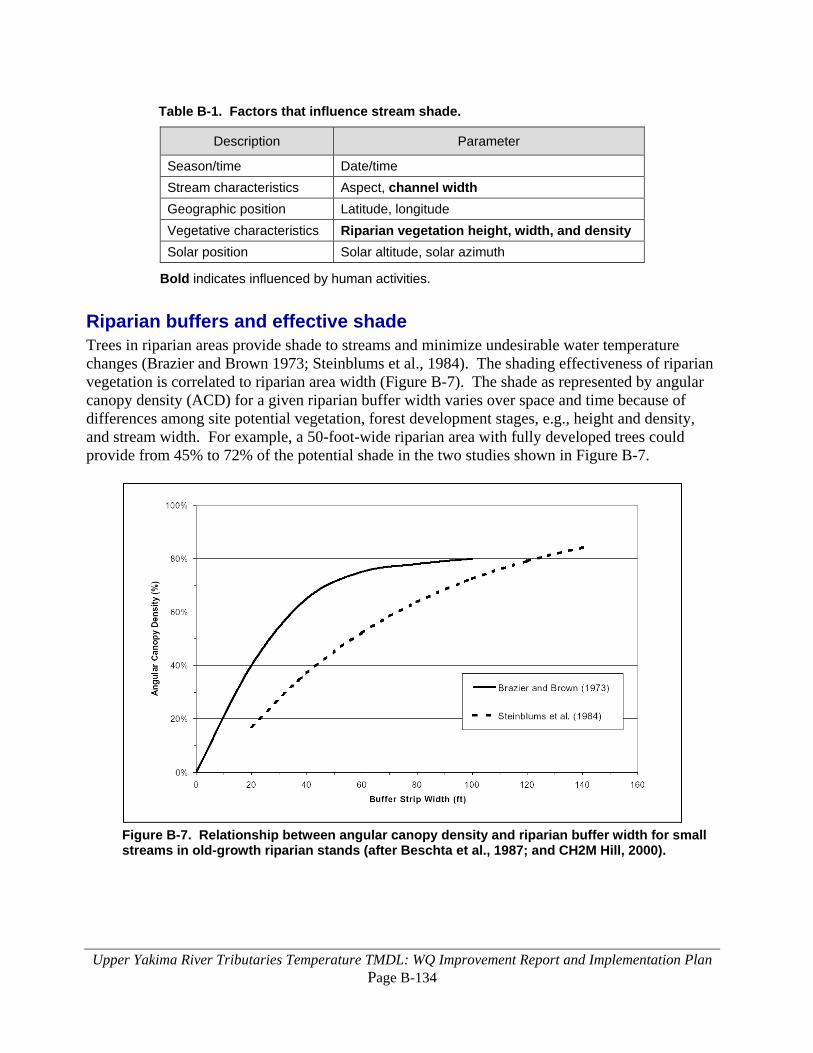
Upper Yakima River Tributaries Temperature TMDL: WQ Improvement Report and Implementation Plan Page B-134
Table B-1. Factors that influence stream shade.
Description Parameter
Season/time Date/time Stream characteristics Aspect, channel width Geographic position Latitude, longitude Vegetative characteristics Riparian vegetation height, width, and density Solar position Solar altitude, solar azimuth
Bold indicates influenced by human activities.
Riparian buffers and effective shade Trees in riparian areas provide shade to streams and minimize undesirable water temperature changes (Brazier and Brown 1973; Steinblums et al., 1984). The shading effectiveness of riparian vegetation is correlated to riparian area width (Figure B-7). The shade as represented by angular canopy density (ACD) for a given riparian buffer width varies over space and time because of differences among site potential vegetation, forest development stages, e.g., height and density, and stream width. For example, a 50-foot-wide riparian area with fully developed trees could provide from 45% to 72% of the potential shade in the two studies shown in Figure B-7.
Figure B-7. Relationship between angular canopy density and riparian buffer width for small streams in old-growth riparian stands (after Beschta et al., 1987; and CH2M Hill, 2000).
Upper Yakima River Tributaries Temperature TMDL: WQ Improvement Report and Implementation Plan Page B-135
The Brazier and Brown (1973) shade data show a stronger relationship between ACD and buffer strip width than the Steinblums et al. (1984) data: the r2 correlation for ACD and buffer width was 0.87 and 0.61 in Brazier and Brown (1973) and Steinblums et al. (1984), respectively. This difference supports the use of the Brazier and Brown curve as a base for measuring shade effectiveness under various riparian buffer proposals. These results reflect the natural variation among old-growth sites studied, and show a possible range of potential shade. Several studies of stream shading report that most of the potential shade comes from the riparian area within about 75 feet (23 m) of the channel (CH2M Hill, 2000; Castelle and Johnson, 2000):
• Beschta et al. (1987) report that a 98-foot-wide (30-m) buffer provides the same level of shading as that of an old-growth stand.
• Brazier and Brown (1973) found that a 79-foot (24-m) buffer provides maximum shade to streams.
• Steinblums et al. (1984) concluded that a 56-foot (17-m) buffer provides 90% of the maximum ACD.
• Corbett and Lynch (1985) concluded that a 39-foot (12-m) buffer should adequately protect small streams from large temperature changes following logging.
• Broderson (1973) reported that a 49-foot-wide (15-m) buffer provides 85% of the maximum shade for small streams.
• Lynch et al. (1984) found that a 98-foot-wide (30-m) buffer maintains water temperatures within 2°F (1°C) of their former average temperature in small streams (channel width less than 3 m).
GEI (2002) reviewed the scientific literature related to the effectiveness of buffers for shade protection in agricultural areas in Washington and concluded that buffer widths of 10 m (33 feet) provide nearly 80% of the maximum potential shade in agricultural areas. Wenger (1999) concluded that a minimum continuous buffer width of 10-30 m should be preserved or restored along each side of all streams on a municipal or county-wide scale to provide stream temperature control and maintain aquatic habitat. GEI (2002) considered the recommendations of Wenger (1999) to be relevant for agricultural areas in Washington. Steinblums et al. (1984) concluded that shade could be delivered to forest streams from beyond 75 feet (22 m) and potentially out to 140 feet (43 m). In some site-specific cases, forest practices between 75 and 140 feet from the channel have the potential to reduce shade delivery by up to 25% of maximum. However, any reduction in shade beyond 75 feet would probably be relatively low on the horizon, and the impact on stream heating would be relatively low because the potential solar radiation decreases significantly as solar elevation decreases.

Upper Yakima River Tributaries Temperature TMDL: WQ Improvement Report and Implementation Plan Page B-136
Microclimate – surrounding thermal environment A secondary consequence of near-stream vegetation is its effect on the riparian microclimate. Riparian corridors often produce a microclimate that surrounds the stream where cooler air temperatures, higher relative humidity, and lower wind speeds are characteristic. Riparian microclimates tend to moderate daily air temperatures. Evapotranspiration by riparian plant communities increases relative humidity. Physical blockage by riparian vegetation reduces wind speed. Riparian buffers commonly occur on both sides of the stream, compounding the edge influence on the microclimate. Brosofske et al. (1997) reported that a buffer width of at least 150 feet (45 m) on each side of the stream was required to maintain a natural riparian microclimate environment in small forest streams (channel width less than 4 m) in the foothills of the western slope of the Cascade Mountains in Western Washington with predominantly Douglas-fir and western hemlock. Bartholow (2000) provided a thorough summary of literature of documented changes to the environment of streams and watersheds associated with extensive forest clearing. Changes summarized by Bartholow (2000) are representative of hot summer days and indicate the mean daily effect unless otherwise indicated:
• Air temperature. Edgerton and McConnell (1976) showed that removing all or a portion of the tree canopy resulted in cooler terrestrial air temperatures at night and warmer temperatures during the day, enough to influence thermal cover sought by elk (Cervus canadensis) on their eastern Oregon summer range. Increases in maximum air temperature varied from 5 to 7°C for the hottest days (estimate). However, the mean daily air temperature did not appear to have changed substantially since the maximum temperatures were offset by almost equal changes to the minima.
Similar temperatures have been commonly reported (Childs and Flint, 1987; Fowler et al., 1987), even with extensive clearcuts (Holtby, 1988). In an evaluation of buffer strip width, Brosofske et al. (1997) found that air temperatures immediately adjacent to the ground increased 4.5°C during the day and about 0.5°C at night (estimate). Fowler and Anderson (1987) measured a 0.9°C air temperature increase in clearcut areas, but temperatures were also 3°C higher in the adjacent forest. Chen et al. (1993) found similar (2.1°C) increases.
All measurements reported here were made over land instead of water, but in aggregate support about a 2°C increase in ambient mean daily air temperature resulting from extensive clearcutting.
• Relative humidity. Brosofske et al. (1997) examined changes in relative humidity within 17 to 72 m buffer strips. The focus of their study was to document changes along the gradient from forested to clearcut areas, so they did not explicitly report pre- to post-harvest changes at the stream. However, there appeared to be a reduction in relative humidity at the stream, estimated at 7% during the day and 6% at night. Relative humidity at stream sites increased
Upper Yakima River Tributaries Temperature TMDL: WQ Improvement Report and Implementation Plan Page B-137
exponentially with buffer width. Similarly, a study by Chen et al. (1993) showed a decrease of about 11% in mean daily relative humidity on clear days at the edges of clearcuts.
• Wind speed. Brosofske et al. (1997) reported almost no change in wind speed at stream locations within buffer strips adjacent to clearcuts. Speeds quickly approached upland conditions toward the edges of the buffers, with an indication that wind actually increased substantially at distances of about 15 m from the edge of the strip, and then declined farther upslope to pre-harvest conditions. Chen et al. (1993) documented increases in both peak and steady winds in clearcut areas; increments ranged from an estimated 0.7 to 1.2 meters per second.
Thermal role of channel morphology Changes in channel morphology impact stream temperatures. As a stream widens, the surface area exposed to heat flux increases, resulting in increased energy exchange between a stream and its environment (Chapra, 1997). Further, wide channels are likely to have decreased levels of shade due to the increased distance created between vegetation and the wetted channel and the decreased fraction of the stream width that could potentially be covered by shadows from riparian vegetation. Conversely, narrow channels are more likely to experience higher levels of shade. Channel widening is often related to degraded riparian conditions that allow increased streambank erosion and sedimentation of the streambed, both of which correlate strongly with riparian vegetation type and condition (Rosgen, 1996). Channel morphology is not solely dependent on riparian conditions. Sedimentation can deposit material in the channel, fill pools, and aggrade the streambed, reducing channel depth and increasing channel width. Channel straightening can increase flow velocities and lead to deeply incised streambanks and washout of gravel and cobble substrate. Channel modification usually occurs during high-flow events. Land uses that affect the magnitude and timing of high-flow events may negatively impact channel width and depth. Riparian vegetation conditions will affect the resilience of the streambanks/flood plain during periods of sediment introduction and high flow. Disturbance processes may have differing results depending on the ability of riparian vegetation to shape and protect channels. Channel morphology is related to riparian vegetation composition and condition by:
• Building streambanks. Traps suspended sediments, encourages deposition of sediment in the flood plain, and reduces incoming sources of sediment.
• Maintaining stable streambanks. High rooting strength and high streambank and flood plain roughness prevent streambank erosion.
• Reducing flow velocity (erosive kinetic energy). Supplies large woody debris to the active channel, provides a high pool to riffle ratio, and adds channel complexity that reduces shear stress exposure to streambank soil particles.
Upper Yakima River Tributaries Temperature TMDL: WQ Improvement Report and Implementation Plan Page B-138
References for Appendix B Adams, T.N., and K. Sullivan, 1989. The physics of forest stream heating: a simple model. Timber, Fish, and Wildlife, Report No. TFW-WQ3-90-007. Washington State Department of Natural Resources, Olympia, WA. Bartholow, J.M., 2000. Estimating cumulative effects of clearcutting on stream temperatures, Rivers, 7(4), 284-297. Belt, G.H., J. O’Laughlin, and W.T. Merrill, 1992. Design of Forest Riparian Buffer Strips for the Protection of Water Quality: Analysis of Scientific Literature. Report No. 8. Idaho Forest, Wildlife, and Range Policy Analysis Group, University of Idaho, Moscow, ID. Beschta, R.L., R.E. Bilby, G.W. Brown, L.B. Holtby, and T.D. Hofstra, 1987. Stream temperature and aquatic habitat: fisheries and forestry interactions. In: Streamside management: forestry and fisher interactions, E.O. Salo and T.W. Cundy, editors, pp 192-232. Proceedings of a conference sponsored by the College of Forest Resources, University of Washington, Seattle, WA. Contribution No. 57 – 1987. Blann, K., J.F. Nerbonne, and Vondracek, B., 2002. Relationship of riparian buffer type to water temperature in the driftless area ecoregion of Minnesota. North American Journal of Fisheries Management 22:441-451. Bolton, S. and C. Monohan, 2001. A review of the literature and assessment of research needs in agricultural streams in the Pacific Northwest as it pertains to freshwater habitat for salmonids. Prepared for: Snohomish County, King County, Skagit County, and Whatcom County. Prepared by: Center for Streamside Studies, University of Washington, Seattle, WA. Boyd, M.S., 1996. Heat source: stream, river, and open channel temperature prediction. Oregon State University. M.S. Thesis. October 1996. Boyd, M., and C. Park, 1998. Sucker-Grayback Total Daily Maximum Load. Oregon Department of Environmental Quality and U.S. Forest Service. Boyd, M., and B. Kasper, 2003. Analytical methods for dynamic open channel heat and mass transfer: Methodology for heat source model Version 7.0. www.deq.state.or.us/wq/TMDLs/tools.htm Brady, D.K., W.L. Graves, and J.C. Geyer, 1969. Surface heat exchange at power plant cooling lakes. Cooling water discharge project report No. 5. Edison Electric Institute, New York, NY. Publication No. 69-901. Brazier, J.R., and G.W. Brown, 1973. Buffer strips for stream temperature control. Res. Pap. 15. Forest Research Laboratory, Oregon State University. 9 p.
Upper Yakima River Tributaries Temperature TMDL: WQ Improvement Report and Implementation Plan Page B-139
Broderson, J.M., 1973. Sizing buffer strips to maintain water quality. M.S. Thesis, University of Washington, Seattle, WA. Brosofske, K.D., J. Chen, R.J. Naiman, and J.F. Franklin, 1997. Harvesting effects on microclimate gradients from small streams to uplands in western Washington. Ecological Applications 7(4): 1188-1200. Brown, G.W., and J.T. Krygier, 1970. Effects of clear-cutting on stream temperature. Water Resources Research 6(4):1133-1140. Brown, G.W., G.W. Swank, and J. Rothacher, 1971. Water temperature in the Steamboat drainage. U.S. Department of Agriculture Forest Service, Research Paper PNW-119, Portland, OR. 17 p. Castelle, A.J., and A.W. Johnson, 2000. Riparian vegetation effectiveness. Technical Bulletin No. 799. National Council for Air and Stream Improvement, Research Triangle Park, NC. February 2000. CH2M Hill, 2000. Review of the scientific foundations of the forests and fish plan. Prepared for the Washington Forest Protection Association. www.wfpa.org/ Chapra, S.C., 1997. Surface water quality modeling. McGraw-Hill Companies, Inc. Chen, J., J.F. Franklin, and T.A. Spies, 1993. Contrasting microclimates among clearcut, edge, and interior of old-growth Douglas-fir forest. Agricultural and Forest Meteorology 63, 219-237. Chen, Y.D., 1996. Hydrologic and water quality modeling for aquatic ecosystem protection and restoration in forest watersheds: a case study of stream temperature in the Upper Grande Ronde River, Oregon. PhD dissertation. University of Georgia, Athens, GA. Chen, Y.D., R.F. Carsel, S.C. McCutcheon, and W.L Nutter, 1998. Stream temperature simulation of forested riparian areas: I. watershed-scale model development; II. Model application. Journal of Environmental Engineering. April 1998. Pp 304-328. Childs, S.W. and L.E. Flint, 1987. Effect of shadecards, shelterwoods, and clearcuts on temperature and moisture environments. Forest Ecology and Management, 18, 205-217. Corbett, E.S. and J.A. Lynch, 1985. Management of streamside zones on municipal watersheds. P. 187-190. In: R.R. Johnson, C.D. Ziebell, D.R. Patton, P.F. Folliott, and R.H. Hamre (eds.). Riparian ecosystems and their management: reconciling conflicting uses. First North American Riparian Conference, April 16-18, 1985. Tucson, AZ. Danehy, R.J., C.G. Colson, K.B. Parrett, and S.D. Duke, 2005. Patterns and sources of thermal heterogeneity in small mountain streams within a forested setting. Forest Ecology and Management, 2005. 208(1-3): p. 287-302.

Upper Yakima River Tributaries Temperature TMDL: WQ Improvement Report and Implementation Plan Page B-140
Ecology, 2003. Shade.xls – a tool for estimating shade from riparian vegetation. Washington State Department of Ecology, Olympia, WA. www.ecy.wa.gov/programs/eap/models/ Edgerton, P.J. and B.R. McConnell, 1976. Diurnal temperature regimes of logged and unlogged mixed conifer stands on elk summer range. Station Research Note PNW-277. Portland, OR. U.S. Department of Agriculture, Forest Service, Pacific Northwest Research Station. 6 pp. Edinger, J.E., D.W. Duttweiler, and J.C. Geyer, 1968. The response of water temperatures to meteorological conditions. Water Resources Research, Vol. 4, No. 5. Edinger, J.E., D.K. Brady, and J.C. Geyer, 1974. Heat exchange and transport in the environment. EPRI Publication No. 74-049-00-3, Electric Power Research Institute, Palo Alto, CA. Fowler, W.B., and T.D. Anderson, 1987. Illustrating harvest effects on site microclimate in a high-elevation forest stand. Research Note PNW-RN-466. Portland, OR. U.S. Department of Agriculture, Forest Service, Pacific Northwest Research Station. 10 pp. Fowler, W.B., J.D. Helvey, and E.N. Felix, 1987. Hydrologic and climatic changes in three small watersheds after timber harvest. Res. Pap. PNW-RP-379. Portland, OR: U.S. Department of Agriculture, Forest Service, Pacific Northwest Research Station. 13 pp. GEI, 2002. Efficacy and economics of riparian buffers on agricultural lands, State of Washington. Prepared for the Washington Hop Growers Association. Prepared by GEI Consultants, Englewood, CO. Holtby, L.B., 1988. Effects of logging on stream temperatures in Carnation Creek, B.C., and associated impacts on the coho salmon. Canadian Journal of Fisheries and Aquatic Sciences 45:502-515. Ice, G., 2001. How direct solar radiation and shade influences temperatures in forest streams and relaxation of changes in stream temperature. In: Cooperative Monitoring, Evaluation, and Research (CMER) workshop: heat transfer processes in forested watershed and their effects on surface water temperature, Lacey, WA. February 2001. Johnson, S.L., 2004. Factors influencing stream temperatures in small streams: substrate effects and a shading experiment. Canadian Journal of Fisheries and Aquatic Sciences 61:913-923. Johnson, S.L and J.A. Jones, 2000. Stream temperature responses to forest harvest and debris flows in western Cascades, Oregon. Canadian Journal of Fisheries and Aquatic Sciences. Vol. 57 (2): 30-39. Kelley, C.E., Krueger, 2005. Canopy Cover and Shade Determinations in Riparian Zones. Journal of the American Water Resources Association, 41 (1): 37-46.

Upper Yakima River Tributaries Temperature TMDL: WQ Improvement Report and Implementation Plan Page B-141
Levno, A. and J. Rothacher, 1967. Increases in maximum stream temperatures after logging in old growth Douglas-fir watersheds. U.S. Department of Agriculture, Forest Service PNW-65, Portland, OR. 12 p. Lynch, J.A., G.B. Rishel, and E.S. Corbett, 1984. Thermal alterations of streams draining clearcut watersheds: quantification and biological implications. Hydrobiologia 111:161-169. OWEB, 1999. Water quality monitoring technical guidebook: chapter 14, stream shade and canopy cover monitoring methods. Oregon Watershed Enhancement Board. Patrick, J.H., 1980. Effects of wood products harvest on forest soil and water relations. Journal of Environmental Quality 9(1):73-79. Poole, G.C. and C.H. Berman, 2000. Pathways of Human Influence on Water Temperature Dynamics in Stream Channels. U.S. Environmental Protection Agency, Region 10, Seattle, WA. 20 pp. www.krisweb.com/biblio/gen_usepa_pooleetal_2000_pathways.pdf. Rishel, G.B., J.A. Lynch, and E.S. Corbett, 1982. Seasonal stream temperature changes following forest harvesting. Journal of Environmental Quality 11(1):112-116. Rosgen, D., 1996. Applied river morphology. Wildland Hydrology publishers. Pagosa Springs, CO. Sinokrot, B.A. and H.G. Stefan, 1993. Stream temperature dynamics: measurements and modeling. Water Resources Research. Vol. 29, No. 7, pp. 2299-2312. Steinblums, I., H. Froehlich, and J. Lyons, 1984. Designing stable buffer strips for stream protection. Journal of Forestry 821(1): 49-52. Swift, L.W. and J.B. Messer, 1971. Forest cuttings raise water temperatures of a small stream in the southern Appalachians. Journal of Soil and Water Conservation 26:11-15. Teti, P.A., 2001. A new instrument for measuring shade provided by overhead vegetation. Cariboo Forest Region Research Section, British Columbia Ministry of Forests, Extension note No. 34. Teti, P.A. and R.G. Pike, 2005. Selecting and testing an instrument for surveying stream shade. BC Journal of Ecosystems and Management 6(2):1-16. URL: www.forrex.org/jem/2005/vol6_no2_art1.pdf Wenger, S., 1999. A review of the scientific literature on riparian buffer width, extent, and vegetation. Office of Public Service and Outreach, Institute of Ecology, University of Georgia, Athens, GA.

Upper Yakima River Tributaries Temperature TMDL: WQ Improvement Report and Implementation Plan Page B-142
This page is purposely left blank.
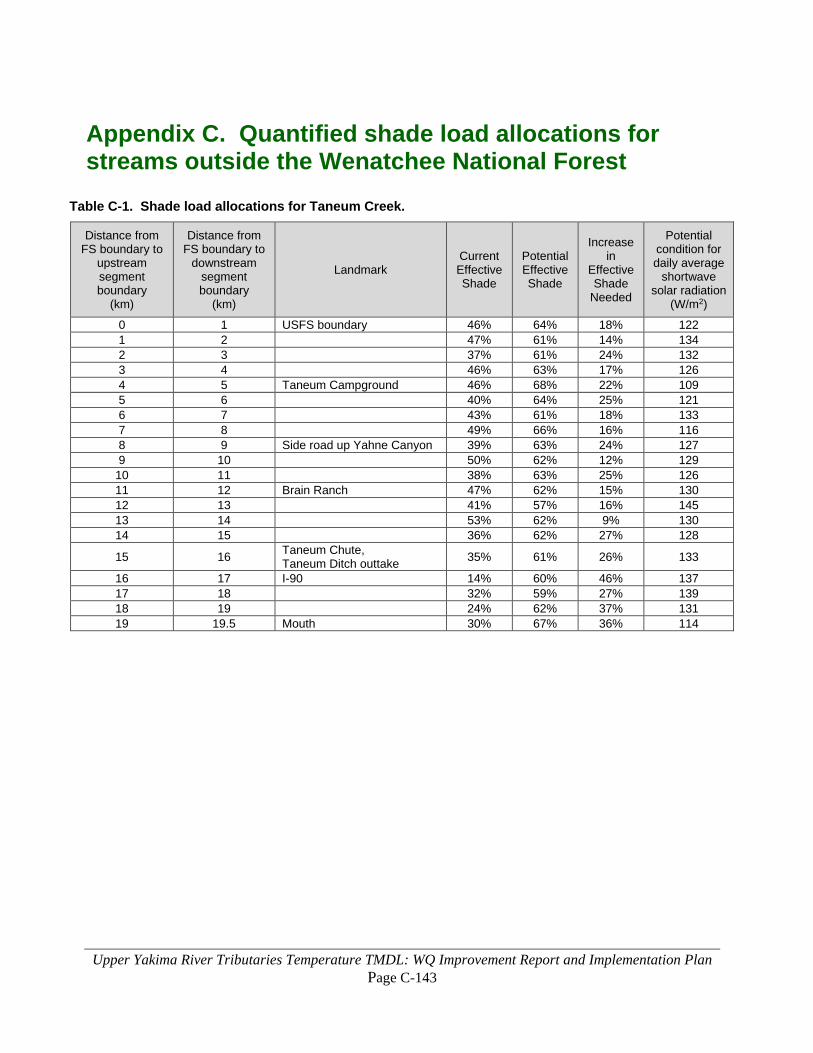
Upper Yakima River Tributaries Temperature TMDL: WQ Improvement Report and Implementation Plan Page C-143
Appendix C. Quantified shade load allocations for streams outside the Wenatchee National Forest
Table C-1. Shade load allocations for Taneum Creek.
Distance from FS boundary to
upstream segment boundary
(km)
Distance from FS boundary to
downstream segment boundary
(km)
Landmark Current Effective Shade
Potential Effective Shade
Increase in
Effective Shade
Needed
Potential condition for daily average
shortwave solar radiation
(W/m2)
0 1 USFS boundary 46% 64% 18% 122 1 2 47% 61% 14% 134 2 3 37% 61% 24% 132 3 4 46% 63% 17% 126 4 5 Taneum Campground 46% 68% 22% 109 5 6 40% 64% 25% 121 6 7 43% 61% 18% 133 7 8 49% 66% 16% 116 8 9 Side road up Yahne Canyon 39% 63% 24% 127 9 10 50% 62% 12% 129
10 11 38% 63% 25% 126 11 12 Brain Ranch 47% 62% 15% 130 12 13 41% 57% 16% 145 13 14 53% 62% 9% 130 14 15 36% 62% 27% 128
15 16 Taneum Chute, Taneum Ditch outtake 35% 61% 26% 133
16 17 I-90 14% 60% 46% 137 17 18 32% 59% 27% 139 18 19 24% 62% 37% 131 19 19.5 Mouth 30% 67% 36% 114
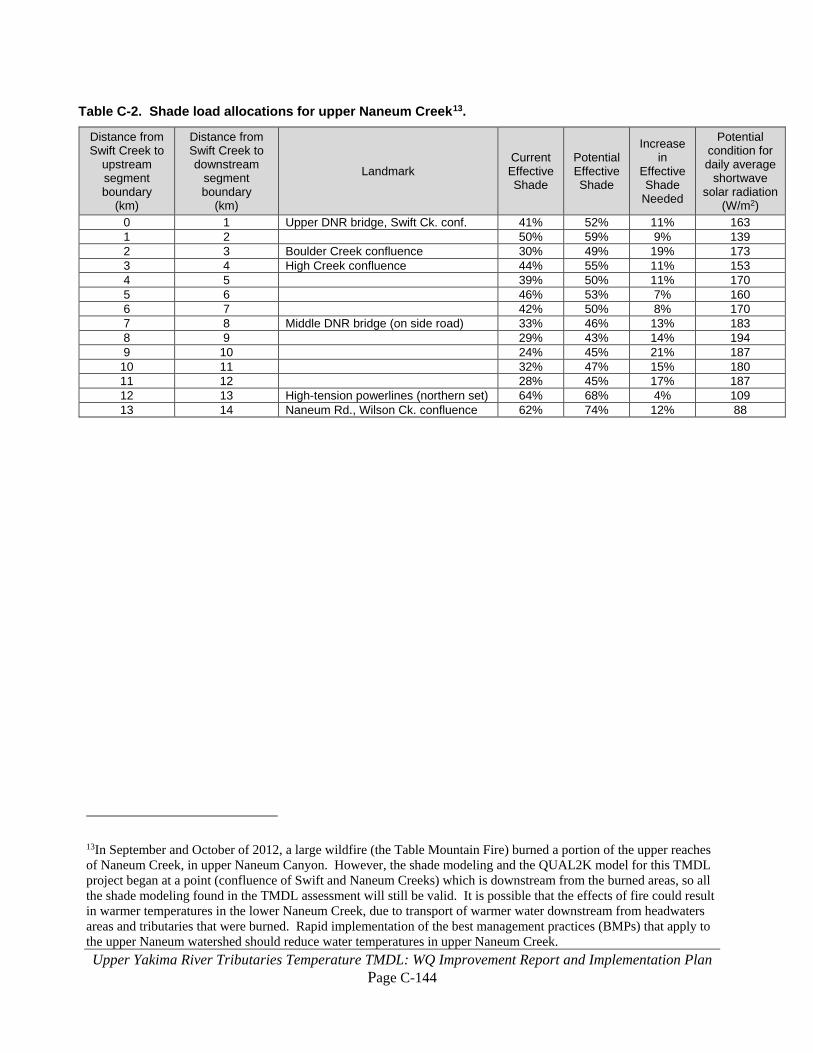
Upper Yakima River Tributaries Temperature TMDL: WQ Improvement Report and Implementation Plan Page C-144
Table C-2. Shade load allocations for upper Naneum Creek13.
Distance from Swift Creek to
upstream segment boundary
(km)
Distance from Swift Creek to downstream
segment boundary
(km)
Landmark Current Effective Shade
Potential Effective Shade
Increase in
Effective Shade
Needed
Potential condition for daily average
shortwave solar radiation
(W/m2) 0 1 Upper DNR bridge, Swift Ck. conf. 41% 52% 11% 163 1 2 50% 59% 9% 139 2 3 Boulder Creek confluence 30% 49% 19% 173 3 4 High Creek confluence 44% 55% 11% 153 4 5 39% 50% 11% 170 5 6 46% 53% 7% 160 6 7 42% 50% 8% 170 7 8 Middle DNR bridge (on side road) 33% 46% 13% 183 8 9 29% 43% 14% 194 9 10 24% 45% 21% 187
10 11 32% 47% 15% 180 11 12 28% 45% 17% 187 12 13 High-tension powerlines (northern set) 64% 68% 4% 109 13 14 Naneum Rd., Wilson Ck. confluence 62% 74% 12% 88
13In September and October of 2012, a large wildfire (the Table Mountain Fire) burned a portion of the upper reaches of Naneum Creek, in upper Naneum Canyon. However, the shade modeling and the QUAL2K model for this TMDL project began at a point (confluence of Swift and Naneum Creeks) which is downstream from the burned areas, so all the shade modeling found in the TMDL assessment will still be valid. It is possible that the effects of fire could result in warmer temperatures in the lower Naneum Creek, due to transport of warmer water downstream from headwaters areas and tributaries that were burned. Rapid implementation of the best management practices (BMPs) that apply to the upper Naneum watershed should reduce water temperatures in upper Naneum Creek.

Upper Yakima River Tributaries Temperature TMDL: WQ Improvement Report and Implementation Plan Page C-145
Table C-3. Shade load allocations for perennial streams in the conifer forest potential vegetation type, based on bankfull or NSDZ* width and stream aspect.
Bankfull or
NSDZ* width (m)
Effective shade from vegetation (%) at the stream center at various stream aspects
(degrees from N)
Daily average global solar shortwave radiation (W/m2) at the stream center at various stream
aspects (degrees from N)
0 and 180 deg aspect
45, 135, 225, and 315
deg aspect
90 and 270 deg aspect
0 and 180 deg aspect
45, 135, 225, and 315
deg aspect
90 and 270 deg aspect
1 99% 100% 100% 2 2 1 2 99% 99% 99% 2 2 2 4 98% 98% 99% 7 7 5 6 95% 95% 97% 17 16 12 8 92% 92% 94% 27 27 19
10 89% 89% 92% 37 37 28 12 86% 86% 89% 47 48 38 14 83% 83% 85% 57 58 51 16 81% 80% 80% 66 68 69 18 78% 77% 72% 75 78 96 20 75% 74% 65% 83 88 119 25 69% 67% 53% 104 112 160 30 64% 61% 45% 122 133 187 40 55% 50% 34% 153 170 223 50 48% 42% 28% 178 197 245 75 35% 29% 19% 220 240 275
100 27% 23% 14% 247 263 291 125 22% 18% 12% 264 278 300 150 19% 15% 10% 276 288 307 200 14% 12% 7% 291 301 315
*Certain conifer-zone streams (mainly Cabin Creek) have a very wide Near-Stream Disturbance Zone (NSDZ). For these cases, measure the entire width of the NSDZ rather than stream bankfull width.
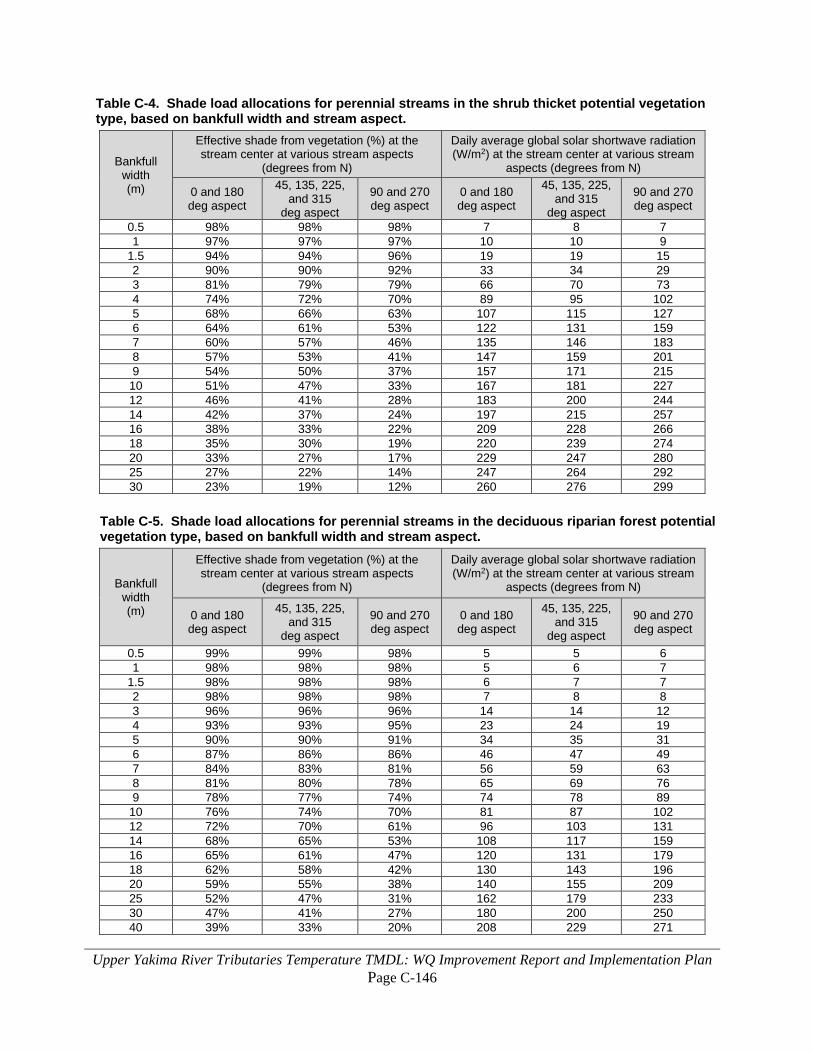
Upper Yakima River Tributaries Temperature TMDL: WQ Improvement Report and Implementation Plan Page C-146
Table C-4. Shade load allocations for perennial streams in the shrub thicket potential vegetation type, based on bankfull width and stream aspect.
Bankfull width (m)
Effective shade from vegetation (%) at the stream center at various stream aspects
(degrees from N)
Daily average global solar shortwave radiation (W/m2) at the stream center at various stream
aspects (degrees from N)
0 and 180 deg aspect
45, 135, 225, and 315
deg aspect
90 and 270 deg aspect
0 and 180 deg aspect
45, 135, 225, and 315
deg aspect
90 and 270 deg aspect
0.5 98% 98% 98% 7 8 7 1 97% 97% 97% 10 10 9
1.5 94% 94% 96% 19 19 15 2 90% 90% 92% 33 34 29 3 81% 79% 79% 66 70 73 4 74% 72% 70% 89 95 102 5 68% 66% 63% 107 115 127 6 64% 61% 53% 122 131 159 7 60% 57% 46% 135 146 183 8 57% 53% 41% 147 159 201 9 54% 50% 37% 157 171 215
10 51% 47% 33% 167 181 227 12 46% 41% 28% 183 200 244 14 42% 37% 24% 197 215 257 16 38% 33% 22% 209 228 266 18 35% 30% 19% 220 239 274 20 33% 27% 17% 229 247 280 25 27% 22% 14% 247 264 292 30 23% 19% 12% 260 276 299
Table C-5. Shade load allocations for perennial streams in the deciduous riparian forest potential vegetation type, based on bankfull width and stream aspect.
Bankfull width (m)
Effective shade from vegetation (%) at the stream center at various stream aspects
(degrees from N)
Daily average global solar shortwave radiation (W/m2) at the stream center at various stream
aspects (degrees from N)
0 and 180 deg aspect
45, 135, 225, and 315
deg aspect
90 and 270 deg aspect
0 and 180 deg aspect
45, 135, 225, and 315
deg aspect
90 and 270 deg aspect
0.5 99% 99% 98% 5 5 6 1 98% 98% 98% 5 6 7
1.5 98% 98% 98% 6 7 7 2 98% 98% 98% 7 8 8 3 96% 96% 96% 14 14 12 4 93% 93% 95% 23 24 19 5 90% 90% 91% 34 35 31 6 87% 86% 86% 46 47 49 7 84% 83% 81% 56 59 63 8 81% 80% 78% 65 69 76 9 78% 77% 74% 74 78 89
10 76% 74% 70% 81 87 102 12 72% 70% 61% 96 103 131 14 68% 65% 53% 108 117 159 16 65% 61% 47% 120 131 179 18 62% 58% 42% 130 143 196 20 59% 55% 38% 140 155 209 25 52% 47% 31% 162 179 233 30 47% 41% 27% 180 200 250 40 39% 33% 20% 208 229 271
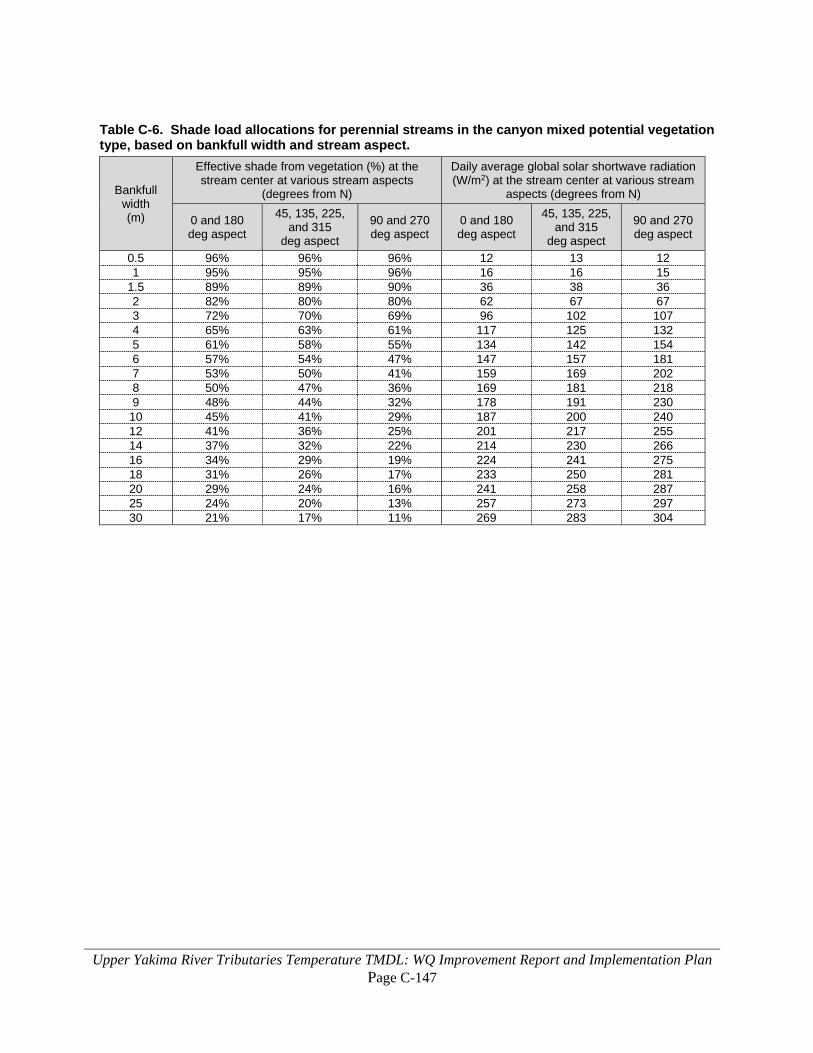
Upper Yakima River Tributaries Temperature TMDL: WQ Improvement Report and Implementation Plan Page C-147
Table C-6. Shade load allocations for perennial streams in the canyon mixed potential vegetation type, based on bankfull width and stream aspect.
Bankfull width (m)
Effective shade from vegetation (%) at the stream center at various stream aspects
(degrees from N)
Daily average global solar shortwave radiation (W/m2) at the stream center at various stream
aspects (degrees from N)
0 and 180 deg aspect
45, 135, 225, and 315
deg aspect
90 and 270 deg aspect
0 and 180 deg aspect
45, 135, 225, and 315
deg aspect
90 and 270 deg aspect
0.5 96% 96% 96% 12 13 12 1 95% 95% 96% 16 16 15
1.5 89% 89% 90% 36 38 36 2 82% 80% 80% 62 67 67 3 72% 70% 69% 96 102 107 4 65% 63% 61% 117 125 132 5 61% 58% 55% 134 142 154 6 57% 54% 47% 147 157 181 7 53% 50% 41% 159 169 202 8 50% 47% 36% 169 181 218 9 48% 44% 32% 178 191 230
10 45% 41% 29% 187 200 240 12 41% 36% 25% 201 217 255 14 37% 32% 22% 214 230 266 16 34% 29% 19% 224 241 275 18 31% 26% 17% 233 250 281 20 29% 24% 16% 241 258 287 25 24% 20% 13% 257 273 297 30 21% 17% 11% 269 283 304

Upper Yakima River Tributaries Temperature TMDL: WQ Improvement Report and Implementation Plan Page C-148
This page is purposely left blank
Upper Yakima River Tributaries Temperature TMDL: WQ Improvement Report and Implementation Plan Page D-149
Appendix D. Background information for load allocations in the Wenatchee National Forest Temperature TMDL Technical Assessment The following information was selectively copied from the Wenatchee National Forest Water Temperature TMDL Technical Report (Whiley and Cleland, 2003), and may be useful in understanding the findings of Whiley’s report. Note that this report was completed in 2003, before the new temperature criteria went into effect. While pertinent results from Whiley’s report have been updated earlier in this document to adapt to new criteria, the tables below were copied directly from Whiley’s report. Additionally, some of the tables in this appendix have been slightly modified, to show that the Upper Yakima River Tributaries Temperature TMDL sets the load allocation to be site potential shade, for all water bodies in the Wenatchee National Forest within the TMDL project area.
Applicable criteria
The state water quality standards describe criteria for temperature for the protection of characteristic uses. Streams in the Wenatchee National Forest are designated as Class AA (waters of extraordinary quality).
The temperature criteria for Class AA waters are as follows:
"Temperature shall not exceed 16.0°C…due to human activities. When natural conditions exceed 16.0°C…, no temperature increases will be allowed which will raise the receiving water temperature by greater than 0.3°C."
During critical periods, natural conditions may exceed the numeric temperature criteria mandated by the water quality standards. In these cases, the anti-degradation provisions of those standards apply.
"Whenever the natural conditions of said waters are of a lower quality than the criteria assigned, the natural conditions shall constitute the water quality criteria."
Water Quality and resource impairments Water bodies located within the Wenatchee National Forest that are included on Washington State’s most current (1998) 303(d) list for temperature are included in Table D-1. In this table, the water segments are located by township/range/section and by Ecology’s water resource inventory area (WRIA) and the agency’s 1996 and 1998 303(d) water body identification numbering system (WBID). The water temperature of many of these 18 streams was monitored in 2001 as part of a USFS
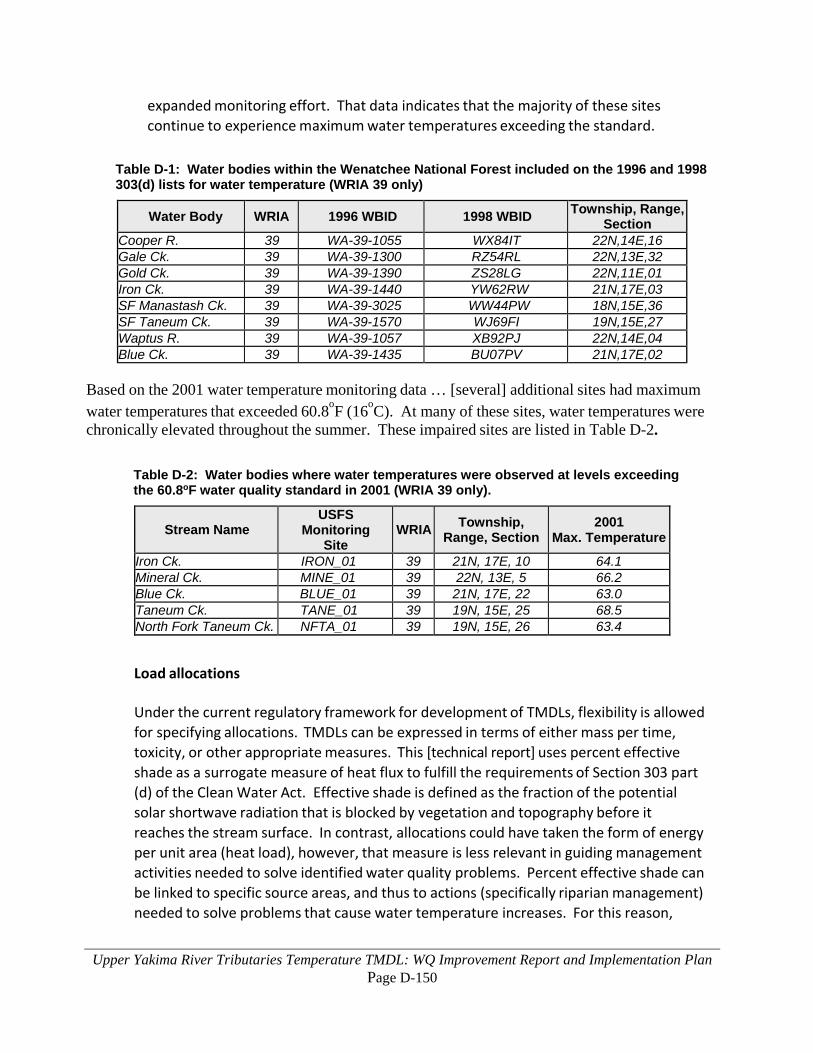
Upper Yakima River Tributaries Temperature TMDL: WQ Improvement Report and Implementation Plan Page D-150
expanded monitoring effort. That data indicates that the majority of these sites continue to experience maximum water temperatures exceeding the standard.
Table D-1: Water bodies within the Wenatchee National Forest included on the 1996 and 1998 303(d) lists for water temperature (WRIA 39 only)
Water Body WRIA 1996 WBID 1998 WBID Township, Range, Section
Cooper R. 39 WA-39-1055 WX84IT 22N,14E,16 Gale Ck. 39 WA-39-1300 RZ54RL 22N,13E,32 Gold Ck. 39 WA-39-1390 ZS28LG 22N,11E,01 Iron Ck. 39 WA-39-1440 YW62RW 21N,17E,03 SF Manastash Ck. 39 WA-39-3025 WW44PW 18N,15E,36 SF Taneum Ck. 39 WA-39-1570 WJ69FI 19N,15E,27 Waptus R. 39 WA-39-1057 XB92PJ 22N,14E,04 Blue Ck. 39 WA-39-1435 BU07PV 21N,17E,02
Based on the 2001 water temperature monitoring data … [several] additional sites had maximum water temperatures that exceeded 60.8oF (16oC). At many of these sites, water temperatures were chronically elevated throughout the summer. These impaired sites are listed in Table D-2.
Table D-2: Water bodies where water temperatures were observed at levels exceeding the 60.8oF water quality standard in 2001 (WRIA 39 only).
Stream Name USFS
Monitoring Site
WRIA Township, Range, Section
2001 Max. Temperature
Iron Ck. IRON_01 39 21N, 17E, 10 64.1 Mineral Ck. MINE_01 39 22N, 13E, 5 66.2 Blue Ck. BLUE_01 39 21N, 17E, 22 63.0 Taneum Ck. TANE_01 39 19N, 15E, 25 68.5 North Fork Taneum Ck. NFTA_01 39 19N, 15E, 26 63.4
Load allocations Under the current regulatory framework for development of TMDLs, flexibility is allowed for specifying allocations. TMDLs can be expressed in terms of either mass per time, toxicity, or other appropriate measures. This [technical report] uses percent effective shade as a surrogate measure of heat flux to fulfill the requirements of Section 303 part (d) of the Clean Water Act. Effective shade is defined as the fraction of the potential solar shortwave radiation that is blocked by vegetation and topography before it reaches the stream surface. In contrast, allocations could have taken the form of energy per unit area (heat load), however, that measure is less relevant in guiding management activities needed to solve identified water quality problems. Percent effective shade can be linked to specific source areas, and thus to actions (specifically riparian management) needed to solve problems that cause water temperature increases. For this reason,
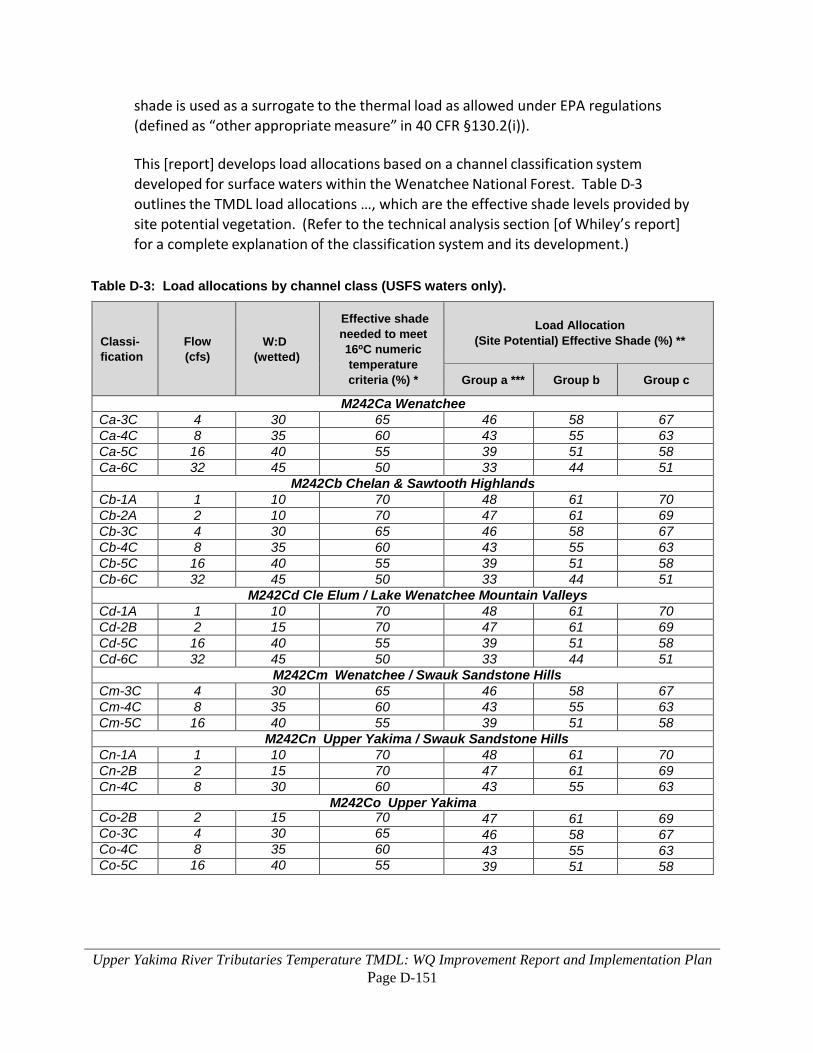
Upper Yakima River Tributaries Temperature TMDL: WQ Improvement Report and Implementation Plan Page D-151
shade is used as a surrogate to the thermal load as allowed under EPA regulations (defined as “other appropriate measure” in 40 CFR §130.2(i)). This [report] develops load allocations based on a channel classification system developed for surface waters within the Wenatchee National Forest. Table D-3 outlines the TMDL load allocations …, which are the effective shade levels provided by site potential vegetation. (Refer to the technical analysis section [of Whiley’s report] for a complete explanation of the classification system and its development.)
Table D-3: Load allocations by channel class (USFS waters only).
Classi-fication
Flow (cfs)
W:D (wetted)
Effective shade needed to meet 16oC numeric temperature criteria (%) *
Load Allocation (Site Potential) Effective Shade (%) **
Group a *** Group b Group c
M242Ca Wenatchee Ca-3C 4 30 65 46 58 67
Ca-4C 8 35 60 43 55 63 Ca-5C 16 40 55 39 51 58 Ca-6C 32 45 50 33 44 51
M242Cb Chelan & Sawtooth Highlands Cb-1A 1 10 70 48 61 70 Cb-2A 2 10 70 47 61 69 Cb-3C 4 30 65 46 58 67 Cb-4C 8 35 60 43 55 63 Cb-5C 16 40 55 39 51 58 Cb-6C 32 45 50 33 44 51
M242Cd Cle Elum / Lake Wenatchee Mountain Valleys Cd-1A 1 10 70 48 61 70 Cd-2B 2 15 70 47 61 69 Cd-5C 16 40 55 39 51 58 Cd-6C 32 45 50 33 44 51
M242Cm Wenatchee / Swauk Sandstone Hills Cm-3C 4 30 65 46 58 67 Cm-4C 8 35 60 43 55 63 Cm-5C 16 40 55 39 51 58
M242Cn Upper Yakima / Swauk Sandstone Hills Cn-1A 1 10 70 48 61 70 Cn-2B 2 15 70 47 61 69 Cn-4C 8 30 60 43 55 63
M242Co Upper Yakima Co-2B 2 15 70 47 61 69
Co-3C 4 30 65 46 58 67 Co-4C 8 35 60 43 55 63 Co-5C 16 40 55 39 51 58
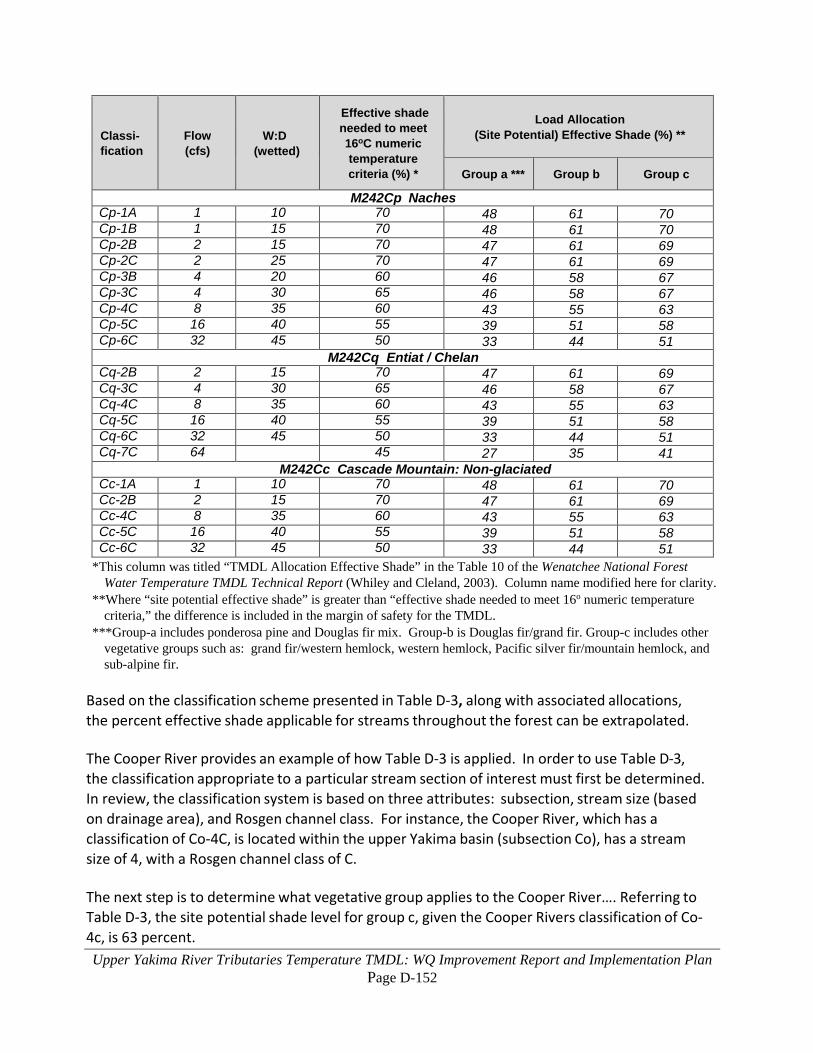
Upper Yakima River Tributaries Temperature TMDL: WQ Improvement Report and Implementation Plan Page D-152
Classi-fication
Flow (cfs)
W:D (wetted)
Effective shade needed to meet 16oC numeric temperature criteria (%) *
Load Allocation (Site Potential) Effective Shade (%) **
Group a *** Group b Group c
M242Cp Naches Cp-1A 1 10 70 48 61 70
Cp-1B 1 15 70 48 61 70 Cp-2B 2 15 70 47 61 69 Cp-2C 2 25 70 47 61 69 Cp-3B 4 20 60 46 58 67 Cp-3C 4 30 65 46 58 67 Cp-4C 8 35 60 43 55 63 Cp-5C 16 40 55 39 51 58 Cp-6C 32 45 50 33 44 51
M242Cq Entiat / Chelan Cq-2B 2 15 70 47 61 69
Cq-3C 4 30 65 46 58 67 Cq-4C 8 35 60 43 55 63 Cq-5C 16 40 55 39 51 58 Cq-6C 32 45 50 33 44 51 Cq-7C 64 45 27 35 41
M242Cc Cascade Mountain: Non-glaciated Cc-1A 1 10 70 48 61 70 Cc-2B 2 15 70 47 61 69 Cc-4C 8 35 60 43 55 63 Cc-5C 16 40 55 39 51 58 Cc-6C 32 45 50 33 44 51
*This column was titled “TMDL Allocation Effective Shade” in the Table 10 of the Wenatchee National Forest Water Temperature TMDL Technical Report (Whiley and Cleland, 2003). Column name modified here for clarity.
**Where “site potential effective shade” is greater than “effective shade needed to meet 16o numeric temperature criteria,” the difference is included in the margin of safety for the TMDL.
***Group-a includes ponderosa pine and Douglas fir mix. Group-b is Douglas fir/grand fir. Group-c includes other vegetative groups such as: grand fir/western hemlock, western hemlock, Pacific silver fir/mountain hemlock, and sub-alpine fir.
Based on the classification scheme presented in Table D-3, along with associated allocations, the percent effective shade applicable for streams throughout the forest can be extrapolated. The Cooper River provides an example of how Table D-3 is applied. In order to use Table D-3, the classification appropriate to a particular stream section of interest must first be determined. In review, the classification system is based on three attributes: subsection, stream size (based on drainage area), and Rosgen channel class. For instance, the Cooper River, which has a classification of Co-4C, is located within the upper Yakima basin (subsection Co), has a stream size of 4, with a Rosgen channel class of C. The next step is to determine what vegetative group applies to the Cooper River…. Referring to Table D-3, the site potential shade level for group c, given the Cooper Rivers classification of Co-4c, is 63 percent.
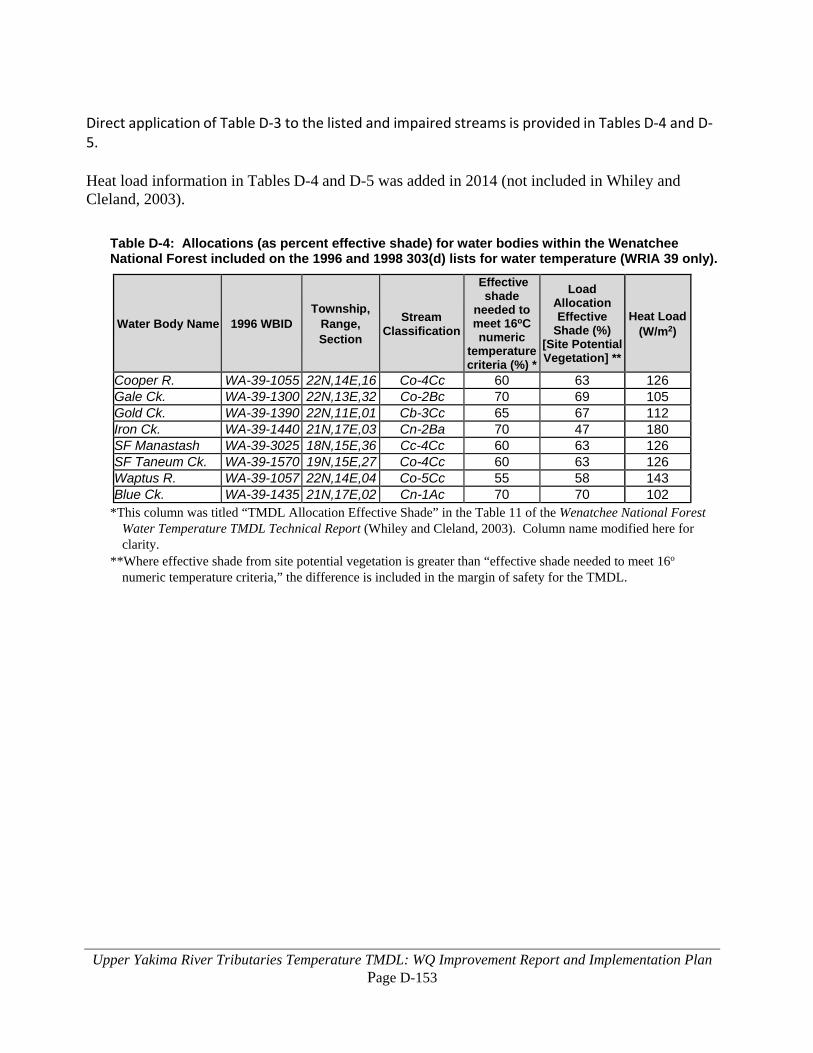
Upper Yakima River Tributaries Temperature TMDL: WQ Improvement Report and Implementation Plan Page D-153
Direct application of Table D-3 to the listed and impaired streams is provided in Tables D-4 and D-5. Heat load information in Tables D-4 and D-5 was added in 2014 (not included in Whiley and Cleland, 2003).
Table D-4: Allocations (as percent effective shade) for water bodies within the Wenatchee National Forest included on the 1996 and 1998 303(d) lists for water temperature (WRIA 39 only).
Water Body Name 1996 WBID Township,
Range, Section
Stream Classification
Effective shade
needed to meet 16oC numeric
temperature criteria (%) *
Load Allocation Effective
Shade (%) [Site Potential Vegetation] **
Heat Load (W/m2)
Cooper R. WA-39-1055 22N,14E,16 Co-4Cc 60 63 126 Gale Ck. WA-39-1300 22N,13E,32 Co-2Bc 70 69 105 Gold Ck. WA-39-1390 22N,11E,01 Cb-3Cc 65 67 112 Iron Ck. WA-39-1440 21N,17E,03 Cn-2Ba 70 47 180 SF Manastash
WA-39-3025 18N,15E,36 Cc-4Cc 60 63 126
SF Taneum Ck. WA-39-1570 19N,15E,27 Co-4Cc 60 63 126 Waptus R. WA-39-1057 22N,14E,04 Co-5Cc 55 58 143 Blue Ck. WA-39-1435 21N,17E,02 Cn-1Ac 70 70 102
*This column was titled “TMDL Allocation Effective Shade” in the Table 11 of the Wenatchee National Forest Water Temperature TMDL Technical Report (Whiley and Cleland, 2003). Column name modified here for clarity.
**Where effective shade from site potential vegetation is greater than “effective shade needed to meet 16o numeric temperature criteria,” the difference is included in the margin of safety for the TMDL.
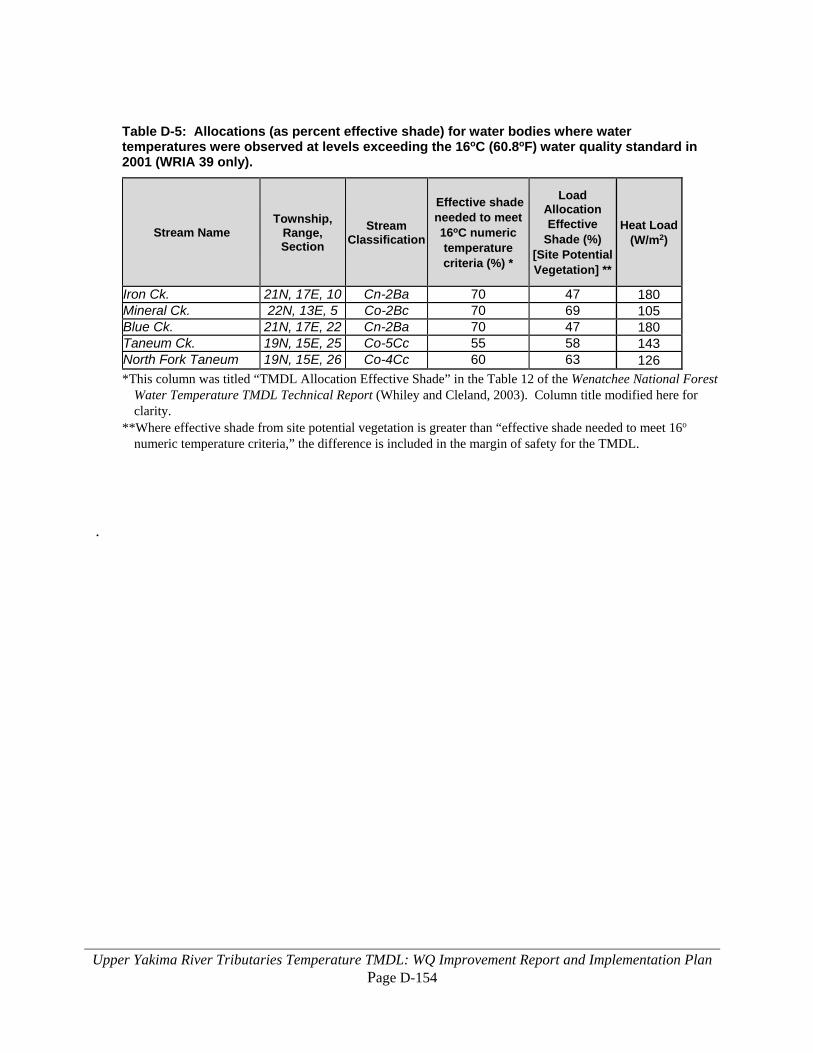
Upper Yakima River Tributaries Temperature TMDL: WQ Improvement Report and Implementation Plan Page D-154
Table D-5: Allocations (as percent effective shade) for water bodies where water temperatures were observed at levels exceeding the 16oC (60.8oF) water quality standard in 2001 (WRIA 39 only).
Stream Name Township,
Range, Section
Stream Classification
Effective shade needed to meet 16oC numeric temperature criteria (%) *
Load Allocation Effective
Shade (%) [Site Potential Vegetation] **
Heat Load (W/m2)
Iron Ck. 21N, 17E, 10 Cn-2Ba 70 47 180 Mineral Ck. 22N, 13E, 5 Co-2Bc 70 69 105 Blue Ck. 21N, 17E, 22 Cn-2Ba 70 47 180 Taneum Ck. 19N, 15E, 25 Co-5Cc 55 58 143 North Fork Taneum
19N, 15E, 26 Co-4Cc 60 63 126
*This column was titled “TMDL Allocation Effective Shade” in the Table 12 of the Wenatchee National Forest Water Temperature TMDL Technical Report (Whiley and Cleland, 2003). Column title modified here for clarity.
**Where effective shade from site potential vegetation is greater than “effective shade needed to meet 16o numeric temperature criteria,” the difference is included in the margin of safety for the TMDL.
.
Upper Yakima River Tributaries Temperature TMDL: WQIR and IP Page E-155
Appendix E. Record of public participation
Introduction Prior to starting this TMDL study, Ecology reached out to several local organizations, to get their input on what needed to be done to cool the tributaries to the upper Yakima River. In 2005, a stakeholder workgroup was formed; members of the workgroup advised Ecology on TMDL development and assisted with TMDL project outreach. From 2006-2014, Ecology regularly met with a variety of stakeholder groups to explain the progress of the TMDL project.
Summary of comments and responses See Appendix F.
List of public meetings In addition to the public and stakeholder meetings mentioned above, a public workshop was held on September 10, 2014.
Outreach and announcements A 38-day public comment period for this TMDL report was held from August 15 through September 22, 2014. Then, in response to stakeholder requests, the public comment period was extended for an additional 30 days, until October 22, 2014. A series of news releases were sent to all local media in the greater Yakima River watershed area. Based on the news releases, several newspapers wrote separate news stories about the TMDL and the comment period. Advertisements were placed in the following publications:
• Daily Record (Ellensburg)
• North Kittitas County Tribune (Cle Elum)
Upper Yakima River Tributaries Temperature TMDL: WQIR and IP Page F-156
Appendix F. Response to public comments Ecology thanks all groups and individuals who submitted comments during the public comment period for the draft Upper Yakima River Tributaries Temperature TMDL water quality improvement project and implementation plan. Your input has made this a better document and a better public plan. Wherever possible, certain types of comments have been directly incorporated into the text of the final report, and do not appear in this section:
• Comments regarding factual inaccuracies and typographic errors • Recommendations for improved wording, without changing report meaning • Letters clarifying policy positions by other organizations
All other comments are included below, followed by responses from Ecology staff. Comments from Alex Conley, Yakima Basin Fish and Wildlife Recovery Board This draft TMDL plan makes a significant contribution towards identifying and proposing solutions to elevated temperatures in many priority streams in the Yakima Basin. It supports many of actions identified in our recovery plans. However we believe that this TMDL plan would be stronger if the implementation and monitoring plans were more specific. We recommend that Ecology …. Develop geographically specific implementation goals. At this time [the table describing “Specific actions taken to reduce water temperatures and improve salmonid habitat”] identifies what form performance measures might take, but does not set any. Setting actual performance measures for priority tributaries (and specific priority reaches within them) would help partners prioritize projects and contribute to much-improved implementation and effectiveness monitoring.
Ecology’s response: Thank you for your comments. We have added more detail to the implementation plan, to help focus efforts on the areas that need the most work. Due to the large size of the TMDL project area and the ambitious actions currently proposed by the Yakima Basin Integrated Plan (YBIP), we plan to add more detail in the near future. Ecology will develop an addendum to the TMDL that will include the additional actions needed to the reduce water temperatures in these critical creeks.
[We recommend that Ecology …. develop] an effective implementation tracking system. A robust implementation tracking system would allow Ecology and partners to understand the cumulative impacts of projects implemented over time, by multiple sponsors, with diverse funding sources. Currently, no effective tracking system exists across funding sources. The Board is committed to working to better track progress towards recovery plan goals, which closely mirror the TMDL goals in many areas. We look forward to working with Ecology to identify how to
Upper Yakima River Tributaries Temperature TMDL: WQIR and IP Page F-157
improve implementation tracking. An effective system will need to specify the types of projects to be tracked, the metrics to track, how data should flow from sponsors and funders into a coordinated tracking system, and the roles and responsibilities of participants.
Ecology’s response: We agree that watershed restoration groups working in the Yakima River watershed could benefit greatly from an improved implementation tracking program; Ecology is working on enhancing its internal program, and we look forward to working with the Yakima Basin Fish and Wildlife Recovery Board and others to promote a basin-wide database.
[We recommend that Ecology …. develop] a more detailed effectiveness monitoring plan. We believe that there is great value in collecting ongoing baseline data in priority tributaries. [The sections “Performance measures and goals” and “Effectiveness monitoring plan”] describe many of the elements of a long-term stream status monitoring program, but do not lay out a specific plan for implementing them. We encourage Ecology to work with partners, including the Board, to develop a detailed monitoring plan that would track these parameters at priority sites on an annual basis. We believe that a modest investment could put in place a monitoring program that would allow long-term tracking of water quality and fish habitat conditions. Partners could play a key role in tracking trends in water temperature over time. Continuous annual temperature data will be far more valuable than an isolated set of annual samples in 10-20 years. Additionally, by combining strategic restoration projects and comprehensive monitoring, implementation goals may be tracked relative to established index sites. The Effectiveness Monitoring plan could be improved by outlining data sources and how the information will be used to track trends as part of the Adaptive Management Framework.
Ecology’s response: The details of the effectiveness monitoring plan will be enhanced when we get closer to starting the monitoring projects. Because increased streamside shade is a critical tool in stream temperature reduction, and because it can take many years to grow trees tall enough to block solar heating, Ecology will not monitor water temperatures throughout the project area on an annual basis. However, Ecology plans to evaluate changes in vegetation growth and shade cover at least every five to ten years.
[The TMDL document] implies that all stream bank erosion is problematic, and that slope-backs should be used wherever possible. Stream bank erosion is a natural process, essential to formation of meandering channels and point bar development. While there are area (sic) where bank stabilization is appropriate, the Plan should recognize not every eroding bank needs to be stabilized, and that some bank erosion is a part of natural stream channel function.
[The TMDL] also identifies meandering streams as inevitably cooler. In reality, stream channel forms vary greatly depending on geomorphic setting. While many meandering stream forms with strong groundwater interactions are indeed cooler, meandering a straight stream will increase the surface area exposed to solar radiation, reduce gradient and reduce flow velocities. When combined with reductions in riparian cover associated with intensive construction activities, this can lead to stream warming, which may or may not be offset by increased hyporheic exchange and future increases in shading. Channel reconfiguration should be carefully considered on a site by site basis, and not assumed to be a generic response to stream warming.
Upper Yakima River Tributaries Temperature TMDL: WQIR and IP Page F-158
Ecology’s response: The text of the TMDL has been edited to clarify meaning, as related to comment above.
Comments from Sean Gross, National Atmospheric and Oceanic Administration (NOAA) Fisheries [Regarding the table showing TMDL break points], parts of Taneum and Manastash are included in this TMDL downstream of the KRD South Branch canal. Potentially an action to cool these streams would be spilling water from the KRD canal into the streams if the canal water is cooler. Actions by BOR and KRD could probably make a significant difference here. Data shows that the Taneum shoot (sic) cools water in the Taneum, so potentially discharging more water from the chute to be retained in Taneum would lead to lower temperatures, or at least a larger volume of cooler water below the TCC that would be slower to warm up as it went downstream.
Ecology’s response: Thank you for your comments. The KRD South Branch canal currently spills to Taneum Creek, just above the Taneum Canal diversion. The water in the South Branch is often cooler than Taneum Creek, so spilling this water likely cools the creek during parts of the critical period. However, in Manastash Creek, the stream reach at and below the KRD South Branch canal is not part of the TMDL area (the TMDL boundary is just upstream from where the South Branch crosses Manastash Creek).
Seems like Umptanum Creek would have had less heating historically because better hydrological connection would have resulted in a wider band of mature vegetation. The present vegetation does include mature trees, but generally in a very narrow band along the stream. The historical vegetation (pre-incision) should have provided a more buffered riparian microclimate and better hyporheic connection, both of which would have increased the stream’s resistance to heating. This also means that floodplain reconnection type projects may result in cooler waters in lower Umptanum, which contradicts the conclusion [in the discussion of Umtanum Creek in the “Loading Capacity” section].
Ecology’s response: The commenter makes an interesting point about the incision in lower Umtanum Creek. However, other hydrogeologists feel that the stream geometry of the creek is fairly natural, and that the creek’s riparian vegetation currently provides adequate shade. One would need to determine why stream incision originally occurred in lower Umtanum Creek in order to change the stream geometry, if that is determined to be necessary.
[The section “Who needs to participate in implementation”] mentions that local jurisdictions help protect near-stream vegetation via GMA and Shorelines. However, Kittitas County does not have a grading/clearing code, so many activities carried out by homeowners or other private property owners that reduce shade to streams can proceed without pause. I believe this is true in the cities as well.
Upper Yakima River Tributaries Temperature TMDL: WQIR and IP Page F-159
Ecology’s Response: Kittitas County has Critical Areas Ordinances (CAOs) that protect streamside vegetation in many areas. The CAOs are currently being revised, and are enforced by Kittitas County.
Figure 2, which documents designated aquatic beneficial uses of streams in the TNDL (sic) area, does not appear adequately protective based on the latest information (since 2009) about use of the watershed by federally threatened steelhead. Based on two recent radio-telemetry studies and some PIT-tag and spawning survey data, we now know that steelhead spawn in the Yakima River from Roza Dam upstream to at least Easton Dam, in the lower ends of the north Kittitas Valley tributaries, far upstream into the Taneum watershed and into the West and Middle Forks of the Teanaway upstream of the supplemental spawning designated reaches mapped in Figure 11. In addition, steelhead have been observed at least upstream to Reed Diversion Dam in the Manastash, and after that dam is removed in the near future, steelhead can be expected to spawn and incubate in spring and summer well upstream into the Manastash watershed. Beneficial use and supplemental spawning designations should be changed to reflect this new information.
Ecology’s Response: We appreciate your input, and have passed your information along to Ecology’s water standards staff. Additionally, please visit this website for information on the plan to update water quality standards criteria, including spawning criteria: http://www.ecy.wa.gov/programs/wq/swqs/TriennialRevComm/5YRtrireviewPlanfinal082011.pdf.
Comments from Kim McDonald, Fish Not Gold We applaud WADOE in recognizing that the significant riparian damage to shade bearing vegetation causes detrimental increases in water temperature to small headwater streams. And while the draft report outlines a number of causes of the increased temperatures, one significant cause was clearly not even addressed, that are the impacts of small scale mining along each water way mentioned in the report. As you know, significant mining activity occurs along the Swauk/Teanaway and the upper arches of the Cle Elum, most of it small scale placer mining. In order to access those streams, the mining community often remove brush, woody debris, and other significant riparian vegetation that assists in reducing temperatures in the streams, particularly during low flows. Evidence of this vegetation removal can be found throughout the upper Yakima system, but is particularly noticeable, even as you drive, through the Swauk system. Additionally, the small scale mining community is using increased technology to find small flakes of gold. These technologies include suction dredges (in stream shop vacs) and high bankers. Both of these motorized forms of small scale mining for hobby miners, significantly increase the sediment loads in stream during and after operation (Harvey and Lisle, 1998). Not only is this form of mining detrimental to fish, but the cumulative impacts of constant mining not only during the so-called work windows permitted in Washington Department of Fish and Wildlife’s Gold and Fish pamphlet, but also extended beyond those windows through the liberal HPA permitting process. Another important impact is the increased toxins in these streams caused by the motorized mining. Minerals such as mercury were used by the miners in the early 20th century to amalgamate gold flakes. This mercury has long settled into streams such as the Swauk, causing
Upper Yakima River Tributaries Temperature TMDL: WQIR and IP Page F-160
little damage. However, the very act of dredging releases the mercury, which is extremely harmful to fish and other wildlife. Given the emphasis by WADOE and other state and federal agencies in this critical watershed for steelhead and Bull trout, as well as important contributions from members of the Kittitas and Yakima county communities, we believe including the impacts of these mechanized forms of placer mining in the vulnerable streams is also vital to understanding the sources of increased temperatures, sediment loads, and other toxins in these vital water ways.
Ecology’s Response: Thank you for your comments. We have added the need for improved gold mining practices and increased mining oversight to the TMDL implementation plan.
Comments from Jon Culp, Washington State Conservation Commission Comments on the following paragraph (from “Abstract”):
Actions needed to reduce summer water temperatures include: protecting existing1 riparian vegetation, restoring or installing riparian vegetation, 2preventing uncontrolled riparian grazing, 3improving stream structure, 4upgrading irrigation methods and putting unused irrigation water in trust, and 5increasing public outreach within the TMDL area.
1. Not all existing vegetation may be beneficial. Eradication of noxious weeds would enhance
existing and installed beneficial riparian plantings.
Ecology’s response: Thank you for your comments. We agree that noxious weeds should be removed, to enhance current and future native vegetation, as you mention. However, some non-native species (such as crack willow) should be removed with care and with a plan to replant native trees (such as cottonwoods) in their place. While crack willows may not be native, they are currently providing important shade to the streams, and it will be important to remove them and replant in stages, over time.
2. Exclusionary fencing with a grazing management plan could promote beneficial planting
health.
Ecology’s response: We agree, exclusionary fencing and grazing management plans can be a excellent tools to protect plants in riparian areas. Thank you for the suggestion.
3. Interested citizens may not know what this means. Is this hydrogeomorphology or hydrology
or some other factor?
Ecology’s response: Thanks for pointing this out; we have added to the text to better explain this concept.
4. Seems pretty vague, though this is the abstract. . . upgrading methods could include
management of existing systems which may or may not generate “saved water”. The word “saved” is a more pointed term than “unused”. Any farmer will argue that they will use all of
Upper Yakima River Tributaries Temperature TMDL: WQIR and IP Page F-161
their water regardless of the efficiency of the system. Also, does everyone know that “the trust” is the Trust Water Rights Program? It is the water rights associated with the saved water that would be managed in the Trust as instream flows. Diversion reduction agreements is another method for ensuring the saved water does not get diverted (but of course Ecology can’t protect it from downstream users).
Ecology’s response: Since, as you note, this language is from the Abstract, some descriptions in this part of the report are more generalized. These concepts are better explained later in the document. We will use the term “saved water” instead of “unused water” wherever possible.
5. Of course, the use of incentive based conservation programs is a proven method for educating
the public and accomplishing natural resource protection.
Ecology’s response: We agree, incentive-based conservation programs have had good success with both restoration and education.
Comments on the following text (from “What needs to be done in this watershed” section):
In order to bring upper Yakima River tributaries into compliance with water temperature criteria, this document recommends several implementation actions, including:
• Upgrade irrigation methods to: o Use less water, and put unused water in trust. o Prevent warm or sediment-laden runoff from returning to creeks.
Upgrading methods could be misinterpreted. Increasing efficiency is what you are after –installing newer technology than presently exists that uses less water for a variety of reasons. Again, saved water is more accurate than unused water. The saved water was used by the old system in order to deliver the consumptive water to the crop. The more efficient system requires less water in order to deliver the consumptive water to the crop and hence it would be saved. The farmer could easily, albeit illegally, put it to other uses. . . .
Ecology’s response: We will use the term “saved water” rather than “unused water” wherever possible. And yes, we hope that irrigators will use less water (by becoming more efficient) in order to leave more water in creeks.
Comments on the following text (from “Conclusions and Recommendations” section):
To increase the effectiveness of shade at reducing stream temperatures, irrigation practices should be managed so as to take into account and limit increases in stream temperatures.
What does this mean exactly? Are the irrigation practices on-farm? Delivery systems? Or the capture and reuse of return flows? Or return flows dumped back into creeks downstream of leaving the field? Or don’t let over-sprayed irrigation water rain down on the creek? Or use the irrigation system to irrigate riparian shade vegetation?
Upper Yakima River Tributaries Temperature TMDL: WQIR and IP Page F-162
Ecology’s response: The statement “irrigation practices should be managed so as to take into account and limit increases in stream temperatures” is a general statement that refers to all aspects of irrigation. The examples in the paragraph above are a good place to start. The point is that when working with irrigation situations and equipment, consider if there are some ways to reduce water temperatures in nearby creeks and streams.
Comments on the following text (from “Water Resource Issues” section):
Irrigation activities can raise or lower water temperatures: • Operational spills from canals often cool creek water as well as augmenting streamflow. Is this statement backed up by data? Operational spills typically are diverted into a ditch and then spilled out. This statement would assume that the faster moving water in the creek would warm faster than the slower moving water in a ditch. Is this physically possible? I suppose if the amount of water diverted was far greater than the amount remaining in the creek or if the creek pooled prior to the operational spill.
Ecology’s response: Within the TMDL project area, canal operational spills frequently discharge to natural creeks, and they are often cooler than the receiving water in the creek during the warmest time of the year (the “critical condition”). Kittitas Reclamation District staff verified this statement.
Comments on the following text (from “Increase summer stream flows” section):
Ensure that water that is removed from the stream for irrigation is applied to crops in the most efficient manner possible. More efficient irrigation (such as sprinklers or drip lines) can satisfy all irrigation needs while using much less water. Additionally, sprinklers and drip lines usually don’t have return flows to creeks; warm return flows can add to stream heating during the critical period.
This statement should also include water delivery or conveyance. Unlined/unpiped irrigation ditches waste far more water per diversion than the application of irrigation water on fields, typically. The diverted water needs to be delivered in the most efficient manner possible as long as we are looking at reducing diverted amounts through efficient practices. Also, pipelines don’t require operational spills and therefore have zero spill back to the creek. Unlike a ditch that must remain “charged” even when no water is being applied to the crop, a pipe when not delivering crop water is shut off and all water remains in the creek/trib.
Ecology’s response: We agree, piping water delivery and conveyance structures can save significant amounts of water, in all the ways you mention above. The saved water that is left instream will help the stream stay cooler. These concepts have been added to the text of the document.

Upper Yakima River Tributaries Temperature TMDL: WQIR and IP Page F-163
Comments from Mark A. Chmelewski Thank you for your efforts to protect the fish populations in the Upper Yakima River tributaries. I support the Department's draft plan to reduce temperatures in those waters to protect migrating and spawning salmon, bull trout, and steelhead.
Ecology’s response: Thank you for your comments. We appreciate your support. Comments from Richard Luchsinger The Yakima River is overused by all groups. Fishermen and tubers have a heavy use on the river, with little or few restroom facilities. Guess here (sic) all this goes? This is really true west of Ellensburg. We are overbuilding in areas that flood, or too close to the river and streams. The Teanaway River is also seeing overbuilding, big new homes built too close to the river. And the upper Teanaway River there are a number of illegal septics next to the river. It seems like many people know about this, but nothing is being done. All this empties into the Yakima River. Other streams where houses are being built in the flood plain is Reecer Creek, Naneum, etc., which also flow into the Yakima. We know this is a problem because it has already happened in other parts of the states: Ocean Shores, Hoods (sic) Canal, Lake Stevens, and other areas. There are small lots on Reecer Creek that flood almost yearly. Bacteria from these septics create algae and more warm water temperatures along with removing oxygen from the water. Case in point: Red's Fly Shop. It is right on the river, and yet the County continues to allow growth and development by Red's, fully knowing that the river can flood annually. Small lots along rivers and creeks have always been a problem state wide. Clearing land and brush for these homes are part of the problem because all runoff goes into the rivers. Many of our roads seem to be built along creeks and rivers. The use of motorized vehicles using these roads creates more runoff with hazardous waste. There is also hazardous waste runoff from the hard- surface camping areas. Allowing motor boats, jet skis on the river, plus ATV, trucks and cars crossing rivers where there aren't any bridges all create a problem. I think all these things add to problems in rivers and lakes and cause them to die.
Ecology’s response: Thank you for your comments. Yes, there is a direct connection between zoning laws and preventing stream pollution. Throughout Washington State, counties, and municipalities must make tough decisions about how they want to protect waters in their jurisdictions.
Upper Yakima River Tributaries Temperature TMDL: WQIR and IP Page F-164
Comments from “A Stakeholder” I appreciate the hard work by the Dept of Ecology. I support the proposed Implementation Plan for the Upper Yakima River Tributaries TMDL. I would like to catch fish there someday.
Ecology’s response: Thank you for your comments. We appreciate your support. Comments from Kenneth Stone, Washington State Department of Transportation As a general comment, we request Ecology assign WSDOT a load allocation rather than a wasteload allocation. The draft water quality improvement report [under “Elements the Clean Water Act requires in a TMDL”] states that load allocations are assigned to non-permitted, nonpoint sources, and wasteload allocations to permitted point sources. We believe that a load allocation is more appropriate given: 1) runoff from state highways is not considered a significant source of heating in the watershed, as stated [under “Wasteload Allocations”]; and 2) WSDOT's NPDES Municipal Stormwater Permit (permit) coverage coincides with Phase I and II permit coverage areas, which are not present within this TMDL boundary. As a result, WSDOT's nonpoint source (stormwater) discharges are not regulated by the permit. This change is supported by Ecology management and was done previously in the Palouse River Temperature TMDL (July 2013, Publication No. 13-10-020). The change would not affect WSDOT's commitment to implement the Highway Runoff Manual (HRM), our proposed assigned action in the TMDL (see comment #3 below). The 2014 Implementing Agreement Between Washington State Department of Ecology and Washington State Department of Transportation Regarding Application of the Highway Runoff Manual requires statewide implementation of the HRM. For clari ty, we request that text be removed from the document that refers to WSDOT as a point source or permittee in the watershed.
Ecology’s response: Thank you for your comments. Following discussions with WSDOT, Ecology has made the above changes in the text of the report. Ecology has also amended additional report text for further clarification.
Comments from Scott Revell, Yakima Basin Joint Board We understand that a task force will be formed in the future, with stakeholders, for a separate effort to work on the lower Kittitas Valley stream temperature reduction action plan, and we request that the Yakima Basin Joint Board have a designated representative on that task force.
Ecology’s response: Thank you for offering to place a representative on our Lower Kittitas Valley Temperature Reduction Task Force. We look forward to your input and support in this challenging endeavor.
Upper Yakima River Tributaries Temperature TMDL: WQIR and IP Page F-165
The temperature impairment in the Upper Yakima River tributaries has five sources according to your report: solar radiation, lack of stream connectivity with hyporheic zones and floodplains, erosion, warm irrigation return flows, and decreased stream flows. We understand that Ecology is proposing increased shade to cool the stream water temperatures. A direct quote from the report reads, "[s]ystem potential effective shade is expected to result in water temperatures that are equivalent to the temperatures that would occur under natural conditions." We believe that cool water will remain cool with shade, but warm water will not be cooled down with shade. Many of the prescriptions for riparian shading may not reach the intended goals for cooling water. In addition, "shade" infers buffers which not only interfere with the proper maintenance of irrigation canals and ditches but also can often result in the removal of productive farmland and thus will not be supported by the agricultural community.
Ecology’s response: We agree that shade helps keep cool water cool, but in some circumstances, adding shade can also help to cool warm water. In order to support all designated uses of a water body, landowners are required by state law (Washington Administrative Code 173-201A-510(3)) to implement best management practices to ensure that water quality is protected.
Here are some specific critiques for the report from irrigation district/interest's perspective. • [A]ll, or nearly all, of the streams in the report should fall under the Category 4c
"impaired by a non-pollutant such as low water flows..." • [F]or the fish use designation by water bodies table, there is no current data
suggesting that char, in this case bull trout, currently inhabit the Cle Elum River from latitude 47.3805 longitude -121.0983 to the headwaters.
• The fish uses have one specific date range for all creeks, streams and rivers. These dates should be more specific to a watershed and be reflective of the watershed's timing of fish migration, rearing and spawning needs. More fish biologists will need to be engaged in ensuring fish uses are accurate.
Ecology’s response: To change the classification of a water body or change the State’s water quality standards in other ways, a qualified party must submit data demonstrating the reason for the change. Please visit this website for information on the plan to update water quality standards criteria, including spawning criteria: http://www.ecy.wa.gov/programs/wq/swqs/TriennialRevComm/5YRtrireviewPlanfinal082011.pdf.
• [In the “Use designations for waterbodies …” table], for Manastash Creek a full
fish passage barrier to anadromous salmonids is in place at a diversion before the canyon, at stream mile 4, but is planned for correction.
Ecology’s response: We realize that several of the creeks included in the TMDL project area have migration barriers that currently prevent the return of anadromous fish. Thanks to dedicated work by the KCCD, MCFEG, YBFWRB, and others, more of these migration barriers are being removed every year.

Upper Yakima River Tributaries Temperature TMDL: WQIR and IP Page F-166
• The report cites that the critical temperature periods begin July 25 each year. RSBOJC water temperature data in the lower Yakima basin shows non-compliant temperatures for the Yakima River beginning in May.
Ecology’s response: Thank you for this information. The Upper Yakima River Tributaries Temperature TMDL is only evaluating tributary creeks in the upper Yakima watershed, so the critical period was based on stream flows and temperatures in the upper watershed only.
• In the report it is apparent that stream buffers will be put into place in forested areas.
Buffer areas around irrigation facilities are a safety hazard for irrigation employees. The districts maintain the facilities, roads, canals, laterals, and drains to be clear of trees, shrubs, and aquatic weeds. Heavy construction equipment is required to maintain the flow of irrigation water, and the road system needs to be clear for the movement of heavy construction equipment. Cleared canal and ditch roads are a safety requirement.
Ecology’s response: Protecting and installing riparian vegetation on the banks of natural creek and streams is a priority of this TMDL project. Adding shade to irrigation structures (diversions, canals, laterals, and so on) should be considered where it is appropriate and feasible, and does not interfere with irrigation operations.
• [In the section on “Supporting Regulations and Land Management Plans], the term
'reservoirs' is used as a shoreline definition. Irrigation districts often construct re-regulation reservoirs to effectively, and efficiently conserve water. The "shoreline" of the reservoir is fenced and has no riparian growth. Please know for future efforts that no planting or shading is warranted, nor will it be allowed at re-regulation sites.
Ecology’s response: Thank you for this information.
• [In the “Conclusions and Recommendations” section] it reads "[t]o increase the
effectiveness of shade at reducing stream temperatures, irrigation practices should be managed so as to take into account and limit increases in stream temperatures". This is a broad and vague statement. Irrigation districts currently deliver water to the landowner. Best irrigation management practices and a modification of those are beyond the scope of this study, and are outside the jurisdiction of the Department of Ecology.
Ecology’s response: Individual irrigators, who interact with natural creeks and streams by diverting water from a creek and/or adding return flows to a creek, should use irrigation practices that will avoid warming the water in the creek. In order to support all designated uses of a water body, landowners are required by state law Washington Administrative Code (WAC) 173-201A-510(3) to implement best management practices to ensure that water quality is protected.
• [In the Introduction to the “Implementation Plan”], it reads that the "[i]mplementation
plan is to protect and restore riparian areas, rehabilitate waterways, reduce sediment input to streams and improve stream flow levels.” The improvement report is both a strategy and an implementation plan. There are three short paragraphs on the Kittitas County Water
Upper Yakima River Tributaries Temperature TMDL: WQIR and IP Page F-167
Purveyors (KCWP), representing 91,000 irrigated acres. A strategy and an implementation plan were not put forth by Ecology. The report lists those programs that the KCWP performs. The paper does not indicate the requirements for irrigation districts, or the expectations of Ecology. Irrigation districts convey water; however it is the landowner, who puts the water to beneficial use.
Ecology’s response: Most of the 91,000 acres that are represented by the KCWP are outside of the TMDL project area. The main focus of this TMDL project is to cool the water in natural creeks and streams, not irrigation conveyances. However, since (as noted in later comments) irrigation district drains often discharge to natural creeks, it will help cool the creeks if the districts can reduce water temperatures in drains.
• [In the “Pollution sources and organizational actions …” section], you can consider
adding "Encourage use of flood irrigation to promote health of hyporheic zone" based on KCWP data provided.
• [In the same section], emphasize the promulgation of flood irrigation to mimic natural flooding processes, recharging cool groundwater, and maintaining connectivity with hyporheic zones, based on KCWP data provided.
Ecology’s response: We thank the KCWP for water temperature data that they have submitted to Ecology in the past. Ecology has not yet received data from the KCWP that clearly depicts all the effects of flood irrigation on stream water temperatures, especially in the TMDL project area. In addition to collecting data on subsurface flows related to flood irrigation, the KCWP should also consider collecting temperature data from surface irrigation return flows resulting from flood/rill irrigation. Other studies have shown the surface return flows can often be much warmer than the natural stream temperatures.
• [In the “Activities to address pollution sources” section], if warm irrigation return flows
are the impairment source; please know that irrigation return flow is generally released to a drain, not a creek, as stated. On-farm runoff return is an allowable method under the Clean Water Act (CWA). The drains contain surface flow water, and ground water from irrigation return flow. In many cases, there would be no ground water flow without the applied irrigation. In most cases, the ground water flow is cool and within standards. Must drains be enclosed or piped to be within standards?
Ecology’s response: Field observations show that irrigation return flows are released to both drains and creeks in the project area of this TMDL. Waters that enter a natural creek should not pollute the creek – this includes discharge from (1) on-farm runoff from a single farm and (2) drains that collect runoff from many farms. There are many ways to prevent water pollution in a drain; the commenter’s suggestion to enclose or pipe a drain could be one of those solutions.
• [In the “Activities to address pollution sources” section], if erosion is the problem, the
table identifies "Sediment laden irrigation return flows are added to streams" as the cause of impairment. Ecology's required implementation measure is to upgrade irrigation methods to prevent sediment-laden runoff. The table wants a 10% per year conversion of

Upper Yakima River Tributaries Temperature TMDL: WQIR and IP Page F-168
rill/flood irrigation per year until all runoff is gone. Will money be available for low interest loans for the grower/landowners to make these improvements?
Ecology’s response: Low-interest loans are an excellent approach to funding irrigation upgrades. For example, over ten million dollars has been loaned to irrigators in the lower Yakima Valley, via the Roza-Sunnyside Board of Joint Control. A sponsoring organization can apply to Ecology for a low-interest loan package during the annual water quality grant funding cycles (www.ecy.wa.gov/programs/wq/funding/Cycles/FCmain.html). Additionally, there are several sources of grant funds to help growers and landowners upgrade irrigation systems. Contact the KCCD or the Kittitas County NRCS office for the latest information on these funding sources.
• [In the “Activities to address pollution sources” section], you may consider adding that
"Increased conversion to sprinklers" as a cause of impairment, as the KCWP has submitted data to Ecology in the past demonstrating subsurface return flows from flood-irrigated lands are decreasing water temperatures in contiguous streams. This data is not recognized in the TMDL.
Ecology’s response: We thank the KCWP for submitting temperature data in the past. Ecology has not received the results of studies from the KCWP that show that “conversion to sprinklers” has caused increased stream heating in specific stream reaches, adjacent to specific land parcels.
• The KCWP believes that streams provided with drainage water from applied irrigation,
cool the nearby streams. As mentioned, data suggests that the more water used for irrigation, the stronger the cooling effect on the streams. Decreasing water used for agriculture could be detrimental for expressed goals to cool water temperatures.
Ecology’s response: In the project area of this TMDL, much/most of the irrigation water is diverted from creeks. Removing water form a creek immediately reduces the volume of water in the creek and allows the remaining creek water to heat more quickly. While returning water to the creek after irrigation (whether via surface runoff or subsurface flows) may cool the creek somewhat, this practice still results in a net heat gain to the creek. Additionally, while “drainage water from applied irrigation” may add volume to stream, it also brings with it warm often-polluted water. Of course, one must take care to look at each situation separately … but in general, leaving more water in a creek and shading the creek is a better way to cool a stream than adding agricultural return flows. Leaving water in the creek also preserves the stream habitat for fish and other aquatic species.
• Irrigation districts, as a clean-up partner, are to contribute continued irrigation
efficiency efforts and implement BMPs to conserve water and provide in-stream flow, according to [the table titled “Organization of TMDL cleanup partners and their contributions”]. All of the efficiency efforts and BMPs will cost either the district or the landowner. The study provides no explanation as to how that is going to be paid for, nor an analysis of the cost.
Upper Yakima River Tributaries Temperature TMDL: WQIR and IP Page F-169
Ecology’s response: The referenced language states that “Irrigators and Irrigation Entities (Districts and Companies)” are responsible for the actions described above. Much of the time, the individual irrigator (rather than the irrigation district or company) will be the main party responsible for implementing these practices. The Kittitas County Conservation District (KCCD) may be able to provide funding from Ecology’s Irrigation Efficiencies Program, as well as other funding sources, to help pay for irrigation upgrades. The NRCS’s EQIP program may also fund irrigation upgrades. We have not provided a cost estimate for this work in the TMDL as there are so many variables involved (size of field, source of irrigation water, slope of field, distance to electrical power, and so on). The KCCD or NRCS will be much better sources of cost estimates.
• Livestock BMPs to improve erosion and thereby water quality, such as fencing out of
riparian areas, will require funding.
Ecology’s response: Grant funding to fence riparian areas is available annually, on a competitive basis. Please see Ecology’s website (www.ecy.wa.gov) for more information on applying for grants and loans to improve water quality. Fencing projects are often managed by local conservation districts.
• This TMDL will be implemented on a 10 year timetable (see [“What is the schedule for
achieving water quality standards”]) and results should be seen by 2094. This timing seems fast for the changes and slow in the results. Few individuals who start this project will live to see its end.
Ecology response: Yes, trees grow slowly and live much longer than people. This TMDL uses a standard 80-year timeline for tree maturity. Since it will take a long time to grow the trees, that is more reason to get the trees planted as soon as possible. As they say, “the best time to plant a tree was twenty years ago, but the next best time is right now.”
• How will climate change affect the TMDL? What will be written into the TMDL
document to accommodate the increase or decrease in climate or an erratic nature of climate?
Ecology’s response: There is a section in the TMDL titled “Global climate change” that discusses climate change, and its potential effect on waters within the TMDL area.
• The upper Yakima River tributaries do not have as much industry, or cities as the lower
Yakima River tributaries. Within two years the Department of Ecology has stated they will begin the temperature TMDL on the lower Yakima River, so many of the RSBOJC comments need to be considered. While the RSBOJC irrigation districts, wasteways and drains are cooler in the summer and warmer in the winter than the Yakima River, they are not in state temperature compliance, nor is much of the Yakima River Basin.
Ecology’s response: Thank you for these comments. As the commenter noted, temperature regimens in the upper and lower Yakima watersheds are much different from each other.
Upper Yakima River Tributaries Temperature TMDL: WQIR and IP Page F-170
• Temperature compliance appears to be problematic for the Yakima River Basin in its
whole, and the standards may need to be adjusted for eastern Washington. Upon review of expectations presented [in the “Conclusions and Recommendations” section] of this report; even after actions are implemented, streams will not meet the temperature criterion. [In the Introduction to the “Implementation Plan” section], the statement that "stream temperatures will be reduced to meet water quality standards," is in direct disagreement with the conclusions and recommendations listed [in the “Conclusions and Recommendations” section]. It appears that many of the water temperature standards are not achievable, not now, or by "2094," as stated in the report.
Ecology’s response: In addition to numeric temperature criteria, Washington State’s water quality standards also allow for “natural conditions” in areas where the numeric criteria cannot be met. According to Washington State’s water quality standards, “It is recognized that portions of many water bodies cannot meet the assigned criteria due to the natural conditions of the water body. When a water body does not meet its assigned criteria due to natural climatic or landscape attributes, the natural conditions constitute the water quality criteria.” (Washington Administrative Code 172-201A-260(1)(a)) Therefore, using the natural conditions approach, this TMDL sets water temperature goals to be “system potential mature riparian vegetation” for most creeks in the TMDL project area. Because both numeric criteria and natural conditions assessments are part of the water quality standards, the statements referenced by the commenter are not in disagreement with each other.
• The report should also state that irrigation districts, and irrigation interests are not the
only entities who should be working to resolve this water temperature issue.
Ecology’s response: This TMDL document directs several other entities besides irrigators to take action to reduce stream temperatures – other non-irrigation entities include forest managers, ranchers and other livestock owners, road managers, gold miners, and so on.