upm the biofore company...3 | © upm –the biofore company global businesses –local presence 54...
TRANSCRIPT

Investor Presentation
July 2018
UPMThe Biofore Company

| © UPM – The Biofore Company2
Competitive businesses with strong market positions
UPM
BIOREFINING
Pulp
Biofuels
Timber
UPM
ENERGY
Electricity
generation
and trading
UPM
RAFLATAC
Label
materials for
product and
information
labelling
UPM
SPECIALTY
PAPERS
Label papers,
release liners,
office papers
and flexible
packaging
UPM
COMMUNICA-
TION PAPERS
Magazine
papers,
newsprint and
fine papers
UPM
PLYWOOD
Plywood
and veneer
products
BIOCHEMICALS
BIOCOMPOSITES
WOOD SOURCING
AND FORESTRY

| © UPM – The Biofore Company3
Global businesses – local presence
54production plants
in 12 countries
19,100employees
in 46 countries
12,000customers
in 120 countries
90,000shareholders
in 35 countries
25,000b-to-b suppliers
in 75 countries
UPM’s sales by market 2017
EUR 10,010 million
13%North America
62%Europe
5%Rest of the world
20%Asia

| © UPM – The Biofore Company4
Operating on healthily growing markets
UPM PLYWOOD
Plywood, veneer ~3%
UPM COMMUNICATION PAPERS
Graphic papers ~ –4%
UPM SPECIALTY PAPERS
Label papers ~4%
High-end office papers ~4%
UPM RAFLATAC
Self-adhesive labels ~4%UPM ENERGY
Electricity ~1%
UPM BIOREFINING
Pulp ~3%
Biofuels strong
Timber ~2%
Demand trend growth, % pa
Comparable EBIT by
business area 2017
EUR 1,292m

| © UPM – The Biofore Company5 | © UPM
Sustainableand safe products for everyday use
LABEL MATERIALS
for food packaging,
drinks bottles and
for communicating
information
SPECIALTY
PAPERS
for food packaging
WOOD
MATERIALS
for construction
and design
features
ELECTRICITY
everywhere
PULP-BASED
MATERIALS
for packaging,
transport,
storage and
hygiene products
PUBLICATION
PAPERS
for reading and
advertising
OFFICE PAPERS
for printing
WOOD MATERIALS
for furniture and the home
LABELS
for food products

| © UPM – The Biofore Company6 | © UPM – The Biofore Company
Responsible
operations and
value chainCircular economy
Sustainable and
safe solutions for global
consumer demand
High
performing
people
Sustainable
forestry
2020
2030
Innovation
We create value by seizing the limitless potential of bioeconomy

| © UPM – The Biofore Company
UPM strategic focus areas
> Continuous
improvement
We create value by seizing… …the limitless potential of bioeconomy
> Earnings growth > Growth and
competitiveness
> Continuous
improvement
Portfolio
> Develop businesses with strong long-term fundamentals and sustainable competitive advantage
Performance Growth Innovation Responsibility
7 | © UPM – The Biofore Company

| © UPM – The Biofore Company
How to achieve the shareholder returns
8 | © UPM – The Biofore Company
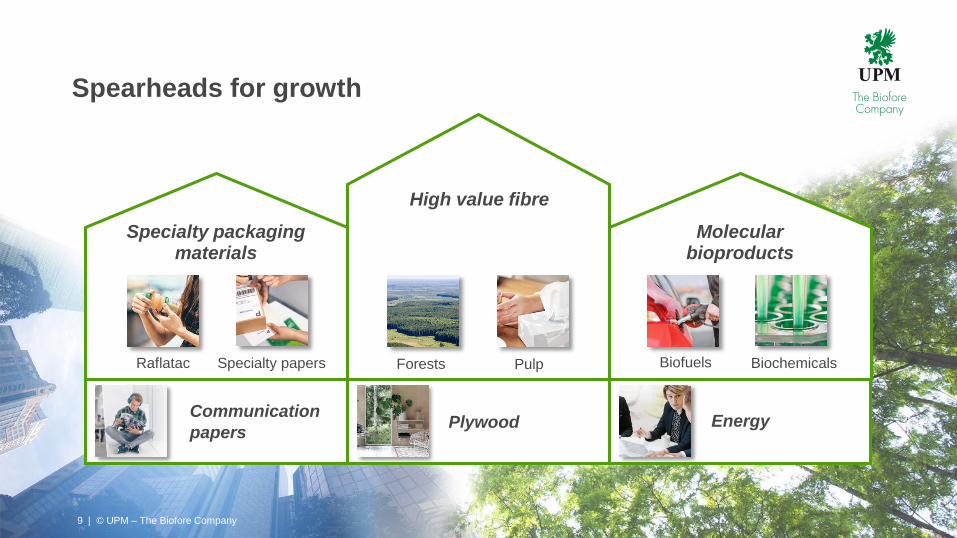
Spearheads for growth
9 | © UPM – The Biofore Company
High value fibre
Specialty packaging materials
Raflatac Specialty papers
Communication
papersEnergy
Biofuels Biochemicals
Molecular bioproducts
Plywood
PulpForests

| © UPM – The Biofore Company
0 %
20 %
40 %
60 %
80 %
100 %
Paper
Plywood
Raflatac
Sawmilling
UPM in transformation
10
*) excluding special items for 2008, comparable figures for 2017
Sales
EBIT *)
ROE *)
Net debt
Market cap
EUR 9.5bn
EUR 513m
3.5%
EUR 4.3bn
EUR 4.7bn
2008vertically integrated
paper company
2017six separate
businesses
Business portfolio
Increasing share of businesses with
strong long-term fundamentals for
profitability and growth
Sales
Business performance
Continuous improvement in financial,
social and environmental performance
0 %
20 %
40 %
60 %
80 %
100 %
Paper ENA
Plywood
Energy
Specialty Papers
Raflatac
Biorefining
Others
Operating model
Promotes value creation
EUR 10.0bn
EUR 1,292m
11.9%
EUR 0.2bn
EUR 13.8bnDisciplined capital allocation
Driving value creation
Communication Papers

| © UPM – The Biofore Company11
UPM current investment portfolio for earnings growth
Focused growth projects
• Raflatac speciality label expansion, in Q4 2018, Finland
• Chudovo plywood mill expansion, +45k m3 in Q3 2019, Russia
• Jämsänkoski release liner expansion, +40kt in Q4 2018, Finland
• Nordland PM2 conversion to release
liner, +110kt in Q4 2019, Germany
• Changshu release liner expansion, +40kt in Q1 2020, China
Transformative prospects
• Possible new 2mt pulp mill, Uruguay
–Second preparation phase:
The permitting processes for the mill,
rail and port, as well as rail tendering are
proceeding as agreed
• Molecular bioproducts, possible biorefineries
–Basic engineering work regarding a potential
150kt biochemicals refinery, Germany
–Exploring next steps in biofuels, environmental
impact study for a potential 500kt biorefinery,
Finland

| © UPM – The Biofore Company
0
2
4
6
8
10
12
14
16
18
20
22
24
26
28
30ROCE %
Business area long-term return targets apply over investment and business cycles
12
0
2
4
6
8
10
12
14
16
18
20
22
24
26
28
30ROCE % *)
0
2
4
6
8
10
12
14
16
18
20
22
24
26
28
30ROCE %
0
2
4
6
8
10
12
14
16
18
20
22
24
26
28
30
0
2
4
6
8
10
12
14
16
18
20
22
24
26
28
30ROCE %
0
2
4
6
8
10
12
14
16
18
20
22
24
26
28
30ROCE %
*) shareholdings in UPM Energy
valued at fair valueLong-term return target
UPM
Specialty Papers
UPM
Communication Papers
UPM
PlywoodUPM
Raflatac
UPM
Energy
UPM
Biorefining
FCF/
CE %

| © UPM – The Biofore Company
0,0
0,5
1,0
1,5
2,0
2,5
3,0
0
750
1 500
2 250
3 000
3 750
4 500
2013 2014 2015 2016 2017 Q2/18
Net debtEURm
Net debt/EBITDA
(x)
Net debt and leverage
Policy: ≤ 2x
13
Group financial targets and leverage policy
0
200
400
600
800
1 000
1 200
1 400
1 600
2013 2014 2015 2016 2017 LTM
EURm
Comparable figures for 2014 – 2018,
excluding special items for earlier years
Comparable EBIT
0
2
4
6
8
10
12
14
2013 2014 2015 2016 2017 LTM
% Comparable ROE
Target: 10%Target: EBIT growth
LTM

| © UPM – The Biofore Company14
5-year cumulative cash flow (2013–2017)– disciplined capital allocation in action
Industry-leading
balance sheet
Net debt /EBITDA
~ 0x
EUR 6.4bn
Deleveraging
Strong operating cash flow
Attractive dividend
Focused investments
EUR 1.9bn
EUR 2.6bn
EUR 1.9bn

| © UPM – The Biofore Company15
Illustrative capital allocation*) for next 5 years,assuming the Uruguay pulp mill investment
Industry-leading
balance sheet
Net debt /EBITDA
< 2x
Attractive dividend
EUR ~3–4bnPerformance focus
Strong cash flow
High return
investments
EUR ~3–4bn
Maintain headroom
*) This is not a forecast

| © UPM – The Biofore Company
0
10
20
30
40
50
60
70
0,00
0,20
0,40
0,60
0,80
1,00
1,20
1,40
2012 2013 2014 2015 2016 2017
16
Dividend
EUR
per share
Dividend policy
• UPM aims to pay an attractive dividend,
30–40% of operating cash flow per share
Dividend for 2017
• EUR 1.15 (0.95) per share, totalling
EUR 613m
• 39% of 2017 operating cash flow
% of operating
cash flow per share

| © UPM – The Biofore Company
Low investment needs in existing assets allow growth projects with modest total capex
0
200
400
600
800
1 000
1 200
2009 2010 2011 2012 2013 2014 2015 2016 20172018E
Depreciation
EURm
Operational investments
Capital expenditure
Strategic investments
Uruguay
acquisition
Estimate
303
Myllykoski
acquisition
17
350
486
Focused growth investments
High returns and fast payback
Low implementation risk
Financed from operating cash flow
Modest total capex and
attractive returns
Low replacement investments
Asset quality in all businesses,
e.g. large competitive pulp mills
UPM Communication Papers

| © UPM – The Biofore Company
Value from responsibility
• Renewable and
biodegradable raw
materials and
recyclable products
• Product stewardship
• Open and transparent
product
communications
Renewable, recyclable
and safe products
• Material efficiency and
circular economy
thinking
• Climate solutions and
working towards carbon
neutrality
• Responsible water use
• Sustainable land use
• Respecting human
rights
• Value-based and inspiring
leadership
• Safe and healthy working
environment and wellbeing
of employees
• Diversity and inclusion
• High performance and
continuous professional
development of employees
• Local commitment
Responsible operations
and value chain
Value based leadership Compliance
• Decision making,
management and
operations guided by
our values and UPM
Code of Conduct
• Responsible business
practises
• Reliable, credible and
transparent reporting
18
We create value by seizing… …the limitless potential of bioeconomy
| © UPM – The Biofore Company
| © UPM – The Biofore Company
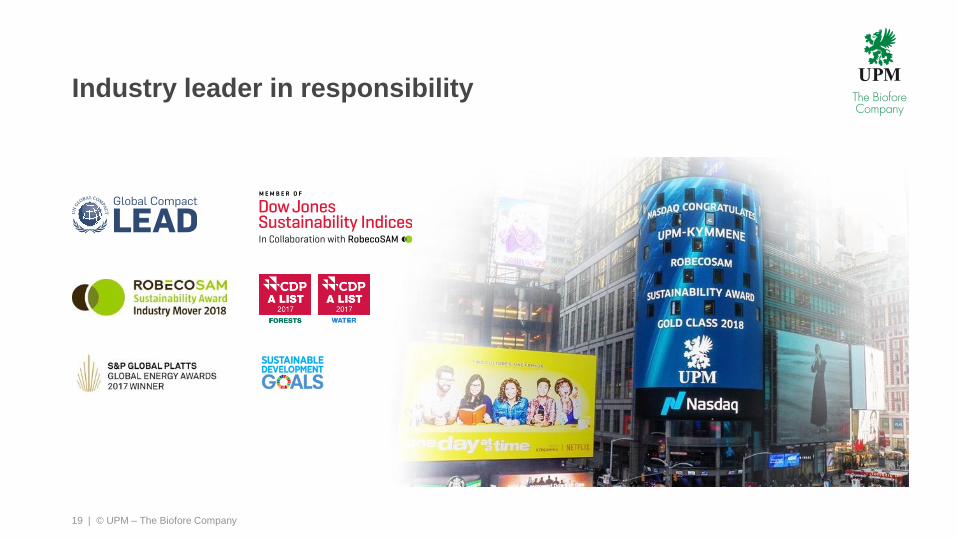
Industry leader in responsibility
19

| © UPM – The Biofore Company20
Q2 2018: Commercial success drives growth in sales and earnings – strong outlook for H2 2018
• Sales grew by 5% to EUR 2,589m
(2,464m in Q2 2017)
• Comparable EBIT increased by 24% to
EUR 334m (270m)
• Sales margins improved, as prices increased
in all business areas, outweighing the impact
of higher input costs
• Q2 performance was held back by several
significant scheduled maintenance shutdowns
• Operating cash flow was EUR 329m (269m)0
50
100
150
200
250
300
350
400
EURm
Comparable EBIT
334
270
| © UPM – The Biofore Company21
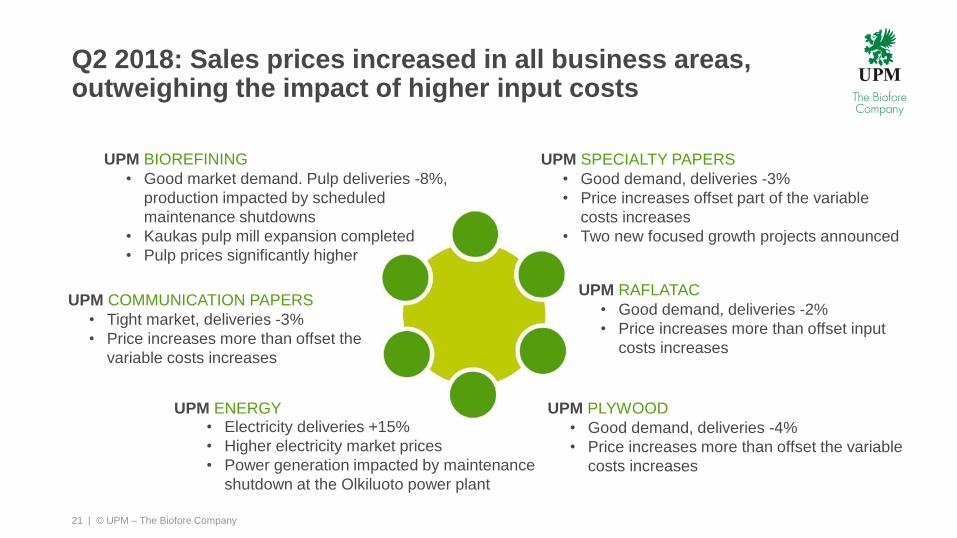
Q2 2018: Sales prices increased in all business areas, outweighing the impact of higher input costs
UPM PLYWOOD
• Good demand, deliveries -4%
• Price increases more than offset the variable
costs increases
UPM COMMUNICATION PAPERS
• Tight market, deliveries -3%
• Price increases more than offset the
variable costs increases
UPM RAFLATAC
• Good demand, deliveries -2%
• Price increases more than offset input
costs increases
UPM ENERGY• Electricity deliveries +15%
• Higher electricity market prices
• Power generation impacted by maintenance
shutdown at the Olkiluoto power plant
UPM BIOREFINING
• Good market demand. Pulp deliveries -8%,
production impacted by scheduled
maintenance shutdowns
• Kaukas pulp mill expansion completed
• Pulp prices significantly higher
UPM SPECIALTY PAPERS
• Good demand, deliveries -3%
• Price increases offset part of the variable
costs increases
• Two new focused growth projects announced
| © UPM – The Biofore Company
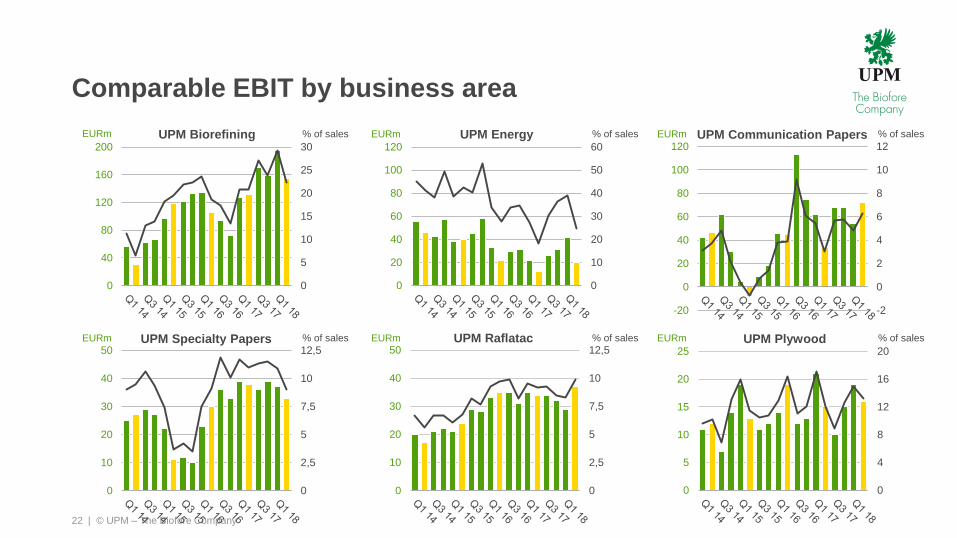
Comparable EBIT by business area
22
0
2,5
5
7,5
10
12,5
0
10
20
30
40
50
0
5
10
15
20
25
30
0
40
80
120
160
200
0
10
20
30
40
50
60
0
20
40
60
80
100
120
0
2,5
5
7,5
10
12,5
0
10
20
30
40
50
-2
0
2
4
6
8
10
12
-20
0
20
40
60
80
100
120
0
4
8
12
16
20
0
5
10
15
20
25
EURm % of salesUPM Specialty Papers EURm % of sales
UPM Communication Papers
EURm % of salesUPM Plywood
EURm % of sales
UPM Raflatac
EURm % of salesUPM EnergyEURm % of salesUPM Biorefining

| © UPM – The Biofore Company
0
100
200
300
400
500
600
Q2/17 Q2/18
Comparable EBIT in Q2 2018 vs. Q2 2017
Raflatac
Specialty
PapersOther
operations
and
eliminations
Energy
Biorefining
Communication
Papers
Plywood
EURm
23
27011.0%
33412.9%
Improvement in Biorefining, Energy, Raflatac,
Communication Papers and Plywood
Increased prices in all businesses, higher input costs
Fixed costs higher and production lower mainly
due to several scheduled maintenance shutdowns
0
100
200
300
400
500
600
Q2/17 Q2/18
EURm
Prices
Variable
costs
Fixed
costs
Deliveries
27011.0%
33412.9%
Currency,
net
impact
Depr.,
forests,plantations

| © UPM – The Biofore Company24
Outlook for 2018
• UPM’s comparable EBIT is expected to continue growing in 2018 compared with
2017. H2 2018 comparable EBIT is expected to be significantly higher compared
with H1 2018.
• The fundamentals for UPM businesses in 2018 are favourable. Sales price
increases in 2018 are expected to outweigh the increase in variable cost,
compared with 2017.
• H1 2018 results were impacted by four significant maintenance shutdows and
weather-related wood harvesting limitations. H2 2018 is scheduled to have one
significant maintenance shutdown.

| © UPM – The Biofore Company2008 2017
Developing our forest assets
25
Uruguay
Finland
US
90% 59%
33%
8%8%
2008
1,012
4.3
2.2
9%
1,270
2017
970
8.6
4.7
17%
2,149
UPM forests and plantations
Forest and plantation land (own and rented) (1,000 ha)
Forest growth (million m3)
Wood sourced from UPM forests and plantations (million m3)
% of UPM wood sourcing
Value of forests and plantations, including land (EURm)
Area distribution
• Investing in strategic forest assets, e.g. in Uruguay
• Releasing capital from forests far from our mills
• Productivity with active management and nurseries
• Strong commitment to sustainability

| © UPM – The Biofore Company
Market pulp consumed in growing end-uses –supply of alternative white fibres declines
26
UPM Biorefining
Market pulp consumption
in growing end-uses
Stressed supply
of white recycled fibre
Specialty
Tissue
and
fluff
Cartonboard
Graphic papers
Containerboard Growing demand
absorbing recycled fibre
from all sources
Global paper and board production

| © UPM – The Biofore Company
Demand-supply drivers of pulp market
27
UPM Biorefining
Short term Long term
Demand
Supply
Re- and
destocking of
inventories
New mill
starts
Debottleneck
investments
Maintenance
stoppages
Production
issues
Population growth
Urbanisation
Middle class expansion
Aging demography
E-commerce
Availability of
competitive
mill locations
Plantations, sustainable
wood raw material
Water availability
Infrastructure
Decline of
graphic paper
production and
scarcity
of recycled fibre
Capacity
closures
Conversions
End use
demand
Sustainable,
renewable and
recyclable
Food product safety
Replacing plastics
Regulation
and product
standards
e.g. RCP
Consolidation
| © UPM – The Biofore Company
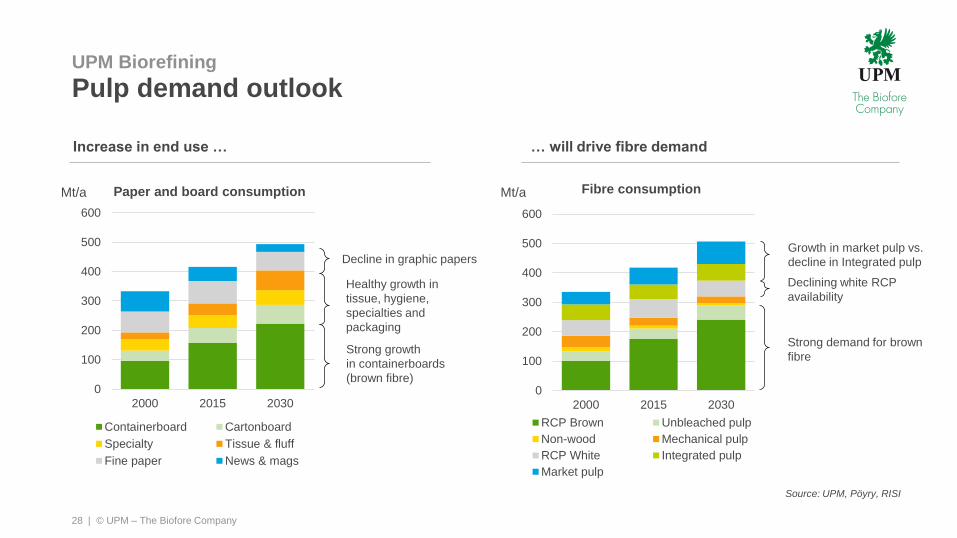
Pulp demand outlook
28
UPM Biorefining
Source: UPM, Pöyry, RISI
Increase in end use … … will drive fibre demand
0
100
200
300
400
500
600
2000 2015 2030
Paper and board consumption
Containerboard Cartonboard
Specialty Tissue & fluff
Fine paper News & mags
0
100
200
300
400
500
600
2000 2015 2030
Fibre consumption
RCP Brown Unbleached pulp
Non-wood Mechanical pulp
RCP White Integrated pulp
Market pulp
Mt/a Mt/a
Healthy growth in
tissue, hygiene,
specialties and
packaging
Strong growth
in containerboards
(brown fibre)
Decline in graphic papers Growth in market pulp vs.
decline in Integrated pulp
Strong demand for brown
fibre
Declining white RCP
availability

| © UPM – The Biofore Company
Few decided projects coming on stream in the short-term
29
UPM Biorefining
Source: UPM, Pöyry
-4 000
-3 000
-2 000
-1 000
0
1 000
2 000
3 000
4 000
5 000
6 000
7 000
2010 2011 2012 2013 2014 2015 2016 2017 2018 2019 2020
Entry of market bleached pulp capacity
Exits New mill/line Other expansion Shipment increase
5-year-average
exit rate
Decided projectsCompleted projects
Lack of decided
pulp projects
Exits take place
’000
t/a
Min. construction
time span
Note: including BHKP, BSKP, PG-sulfites and non-wood grades, excluding fluff and dissolving
? ? ?

| © UPM – The Biofore Company
Current operations Uruguay prospect
• Plantation base
in West Uruguay
• Fray Bentos pulp mill
1.3 million tonnes
• ~100 km of river barging
for outbound logistics
• Sea port in Nueva Palmira
loading half vessels
• Ocean vessels to pulp markets
• Plantation base in Central
and North Eastern Uruguay
• Potential new pulp mill about
2 million tonnes, on-site
investment estimate EUR 2bn
• Railway with high technical
standards
• Deep sea port in Montevideo
loading full vessels
• Ocean vessels to pulp markets
30
Establishing a competitive operating platform in Uruguay – we are now in preparation phase II
UPM Biorefining

| © UPM – The Biofore Company
Second preparation phase for the potential new pulp mill in Uruguay proceeding
31
UPM Biorefining
• Labour protocols, regulation
• Investment regimes
• Regional planning and development
• Energy and complementary items
• Mill permitting, pre-engineering
• Rail permitting, tendering, start construction
• Port permitting, tendering, concession
• Roads
Phase ICompleted in Q4/17
Phase IIExpected to take 1.5-2 years
Phase III
Discussions with the
Government of Uruguay
Prerequisites for a possible
pulp mill investment
Investment project
Development of
infrastructure
Main items in preparation phase II:
Investment agreement signed in
Q4/17
Permitting
Pre-engineering
Development of
infrastructure
Necessary conditions
Potential UPM
investment decision

| © UPM – The Biofore Company
300
400
500
600
700
800
900
1000
1100
1200
1300
USD/tonne
BHKP, Europe NBSK, Europe
BHKP, China NBSK, China
Chemical pulp market prices
32
UPM Biorefining
300
400
500
600
700
800
900
1000
1100
EUR/tonne
BHKP, Europe, EUR NBSK, Europe, EUR
BHKP, China, EUR NBSK, China, EUR
Pulp market prices, USDPulp market prices, EUR
Sources: FOEX Indexes Ltd, ECB

| © UPM – The Biofore Company
UPM’s power generation – competitivein all market conditions
UPM Energy
Hydro
Nuclear
Condensing
UPM’s power generation assets
UPM # 2
Others
UPM in Finland
UPM
Others
UPM in Nordics
33 | © UPM – The Biofore Company
| © UPM – The Biofore Company
UPM Energy
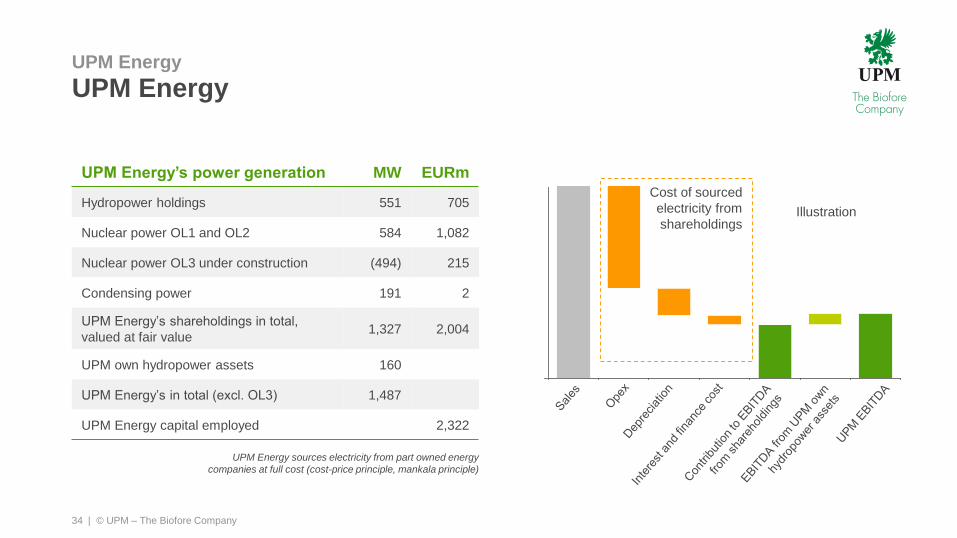
34
UPM Energy
UPM Energy sources electricity from part owned energy
companies at full cost (cost-price principle, mankala principle)
UPM Energy’s power generation MW EURm
Hydropower holdings 551 705
Nuclear power OL1 and OL2 584 1,082
Nuclear power OL3 under construction (494) 215
Condensing power 191 2
UPM Energy’s shareholdings in total,
valued at fair value1,327 2,004
UPM own hydropower assets 160
UPM Energy’s in total (excl. OL3) 1,487
UPM Energy capital employed 2,322
Sales Opex Depreciation Interest and
finance costs
Contribution to
EBITDA from
shareholdings
EBITDA from
UPM ow n
hydropow er
assets
UPM EBITDA
Illustration
Cost of sourced
electricity from
shareholdings

| © UPM – The Biofore Company35
UPM Energy
profitability2013 2014 2015 2016 2017 H1/18
Comparable EBIT,
EURm186 202 181 116 91 63
% of sales 39.9 43.5 43.6 32.7 28.8 32.8
0
10
20
30
40
50
2013 2014 2015 2016 2017 2018
MWh Market electricity prices vs UPM sales price
Helsinki Front Year System Front Year UPM average sales price
UPM Energy
Cost efficient generation enables robust profitability in challenging market environment

| © UPM – The Biofore Company
• In UPM balance sheet, UPM Energy
shareholdings are valued at fair value
• Energy market transformation is ongoing
• UPM Energy assets are competitive
UPM Energy ROCE
0
5
10
15
20
2016 2017
UPM Energy ROCE vs. Nordic peers
5% 4%
UPM Energy comparable ROCE:
shareholdings at fair value
UPM Energy ROCE if calculated
based on acquisition cost
Fortum
Vattenfall
Statkraft
15%
11%
%
Source: Companies’ financial reports, UPM
36
UPM Energy

| © UPM – The Biofore Company
Self-adhesive labels in end-use
37
PHARMACEUTICALSWINE, SPIRITS & CRAFT
BEVERAGE FOOD
A4 & CUT-SIZERETAIL, OIL & INDUSTRIALSECURITY & BRAND
PROTECTIONTYRE
HOME & PERSONAL CARE DURABLES
TRANSPORT & LOGISTICS
UPM Raflatac

| © UPM – The Biofore Company
The self-adhesive labelstock market
• >EUR 8bn global market
• ~4% p.a. growth
• Private consumption driven
• Largest of the labelling technologies
• ~1/5 of total self adhesive materials markets
38
UPM Raflatac
All labelling technologiesSelf-adhesive
labelstock market
Other producers
UPM Raflatac
Other
producers
Other
labelling
technologies
All self adhesive materials
Other producers
Other self
adhesive
materials
UPM Raflatac UPM Raflatac
Self adhesive
labelstock
Self adhesive
labelstock
| © UPM – The Biofore Company
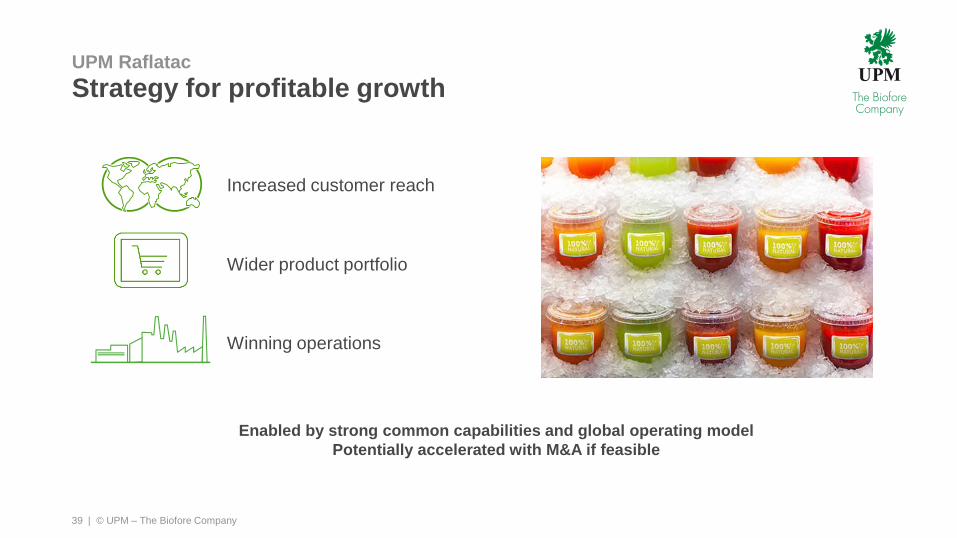
Strategy for profitable growth
39
UPM Raflatac
Increased customer reach
Wider product portfolio
Winning operations
Enabled by strong common capabilities and global operating model
Potentially accelerated with M&A if feasible

| © UPM – The Biofore Company40
UPM Specialty Papers
Focus on global Labelling materials, Packaging in Europe and Office paper in APAC
OFFICE PAPER APACLABELLING MATERIAL PACKAGING
| © UPM – The Biofore Company
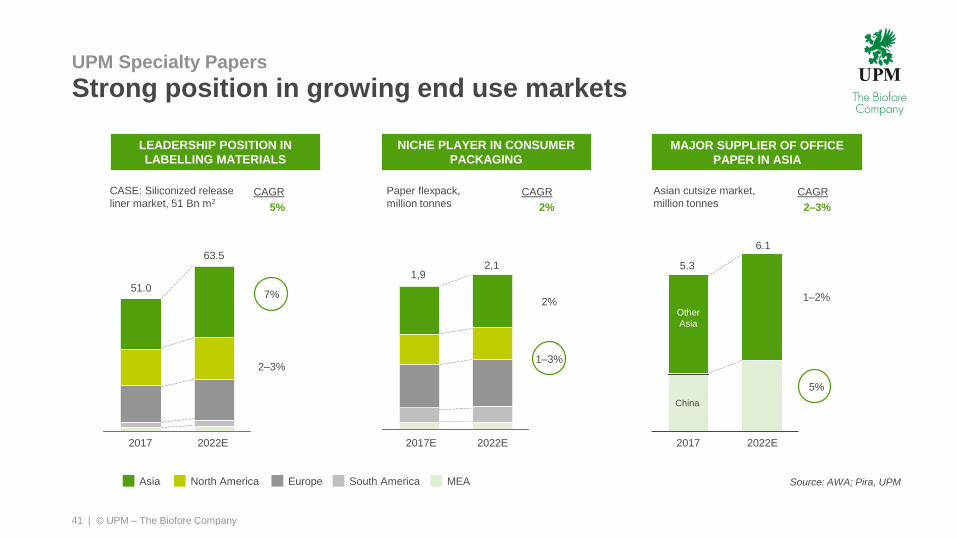
Strong position in growing end use markets
41
UPM Specialty Papers
Source: AWA; Pira, UPM
Paper flexpack,
million tonnes
CASE: Siliconized release
liner market, 51 Bn m2
CAGR
5%
CAGR
2%
South AmericaEurope MEANorth AmericaAsia
51.0
2017
63.5
2022E
7%
2–3%
1,9
2017E
2,1
2022E
2%
1–3%
Asian cutsize market,
million tonnesCAGR
2–3%
2022E2017
1–2%
5%
China
Other
Asia
5.3
6.1
MAJOR SUPPLIER OF OFFICE
PAPER IN ASIA
NICHE PLAYER IN CONSUMER
PACKAGING
LEADERSHIP POSITION IN
LABELLING MATERIALS

| © UPM – The Biofore Company
Release liner opportunities in labelstock& other applications
42
UPM Specialty Papers
Source: AWA
Labelstock50 %
Tapes13 %
Industrial11 %
Hygiene8 %
Food & bakery5 %
Graphic film5 %
Medical3 %
Envelope3 %
Others2 %
Product functions:Release liner carries the adhesive and face material:
• Prevents the adhesive from sticking permanently
• Important and often critical feature of a layered
construction
Globally
48.7 Bn m2
42 | © UPM – The Biofore Company

| © UPM – The Biofore Company
Growth strategy
43
UPM Specialty Papers
Release liner
base paper
Face paper
LABELLING FINE PAPERS
Office papers
Publication
papers
PACKAGING
Packaging papers
• Growth in high quality
label papers
• Innovations in other
applications
• Capacity investments
• Growth
• Capacity
investment
• Responsible Fibre &
Nordic Origin
• Cost competitiveness
• Growth
• Growth
• Innovations
| © UPM – The Biofore Company
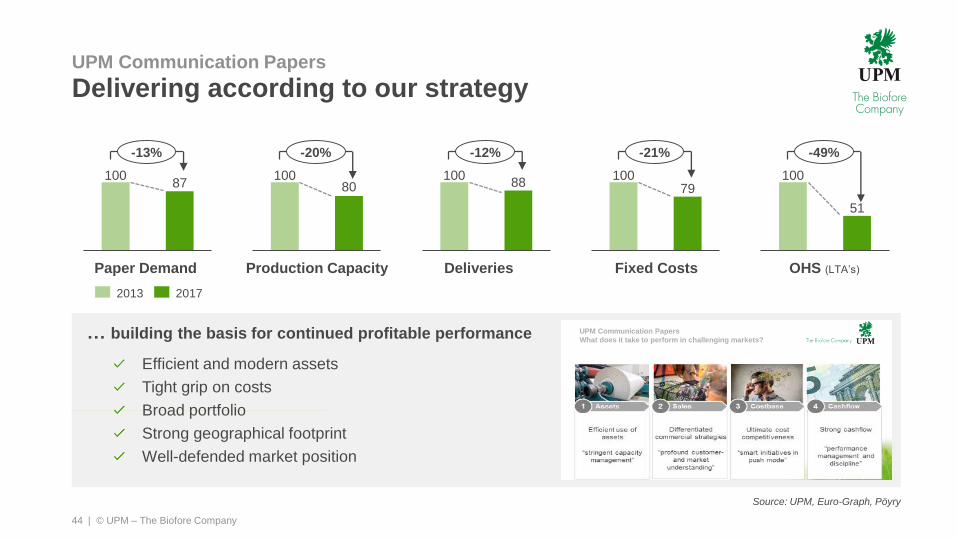
10080
… building the basis for continued profitable performance
Delivering according to our strategy
44
UPM Communication Papers
Source: UPM, Euro-Graph, Pöyry
Production CapacityPaper Demand Deliveries OHS (LTA’s)
2013 2017
Fixed Costs
Efficient and modern assets
Tight grip on costs
Broad portfolio
Strong geographical footprint
Well-defended market position
10087
-13% -20%
10088
-12%
10079
-21%
100
51
-49%
UPM Communication Papers
What does it take to perform in challenging markets?

| © UPM – The Biofore Company
We expect a predictable market development in an economically stable environment
We do not anticipate disruptive changes, but accept market reality:
• Direct Marketing continues to develop with variations from market to market,
e.g. increasing in Germany while dropping in the UK
• Catalogues remain a means of consumer activation, cases of pure online-retailers
and specialist stores investing in printed catalogues increase
• Magazine publishers continue to build on printed editions, decreasing circulations
are partly offset by a continuous flow of new titles in niche segments
• Newspaper circulation is declining fast in main markets, with Germany being relatively resilient
• Fine papers continue playing an important role in private and office uses resulting
in a relatively slow decline, regulatory changes remain a risk-factor.
45
UPM Communication Papers

| © UPM – The Biofore Company
Our focus: Strengthen industry leadership role
46
UPM Communication Papers
1 Uncompromising
performance
Continued focus on stringent
capacity management and
performance improvement.
Zero accidents
3 Commercial
excellence
Optimize and evolve commercial
interface and supporting processes
to ensure supply security and
customer value add.
2 Targeted
innovation
Targeted investments in innovation
to drive performance, increase
efficiencies and extend our position
in the market.
Focused on sustainabilityLeadership

| © UPM – The Biofore Company47
UPM Communication Papers
Paper price vs. cash cost of marginal cost producer
2004 2005 2006 2007 2008 2009 2010 2011 2012 2013 2014 2015 2016 2017 2018
EUR/t
Cash cost of a marginal producer
Price
Sources: PPI, RISI, Pöyry
| © UPM – The Biofore Company
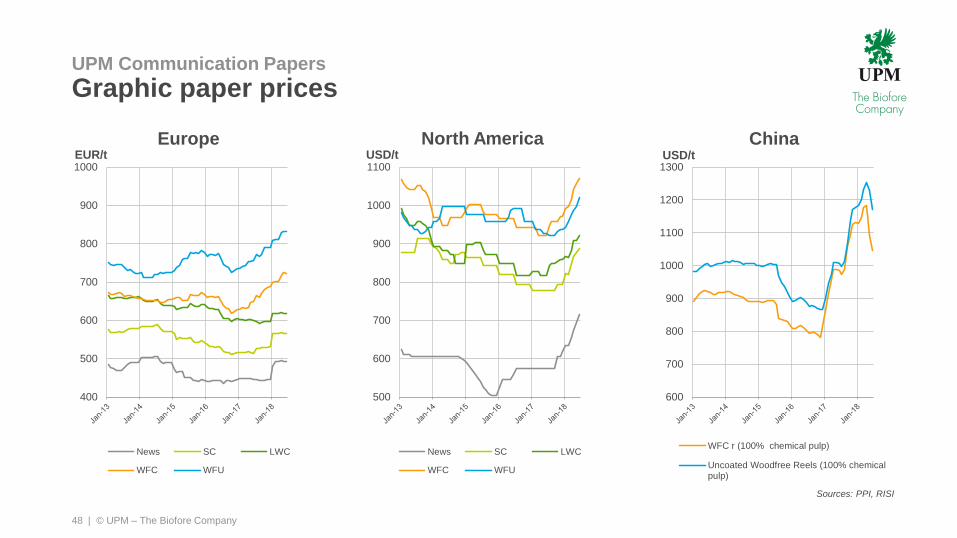
400
500
600
700
800
900
1000
News SC LWC
WFC WFU
48
UPM Communication Papers
Graphic paper prices
EUR/t
EuropeUSD/t USD/t
ChinaNorth America
600
700
800
900
1000
1100
1200
1300
WFC r (100% chemical pulp)
Uncoated Woodfree Reels (100% chemicalpulp)
500
600
700
800
900
1000
1100
News SC LWC
WFC WFU
Sources: PPI, RISI

| © UPM – The Biofore Company
UPM Plywood focuses on three end use segments
49
UPM Plywood
Construction Vehicle flooring LNG shipbuilding
UPM’s position and direction
• Leading position in high and medium
range standard products in Europe
through well established distribution
network providing easy access to
WISA® plywood
• Uncompromised sustainability, certified
products and operations
• New growth sought by strengthening
position in selected emerging markets
UPM’s position and direction
• Leading position in Europe
• Competitive edge built on smoothly
running operations and needs-based
product design creating value to both
vehicle manufacturers and operators
• Growth sought by expanding to new
markets and related end use segments
UPM’s position and direction
• Global leader in LNG plywood
• Competitive edge based on right quality
and accurate on-time deliveries
• Long term commitment and benchmark
service level
• Focus to secure leading position in LNG
carriers and to extend offering into
related applications using the same
technologies (e.g. land storage tanks)

| © UPM – The Biofore Company
UPM’s key markets are in the high and mid segments primarily in EMEA region
50
UPM Plywood
Strategic choices
1. Demanding industrial
applications
2. High and medium range
standard products
3. Selected customers
4. EMEA region and
LNG business globally
Low-end
market
Non-footprint
market
Global plywood
market ~90Mm3
EMEA plywood
market ~12Mm3
UPM Plywood
sales ~811tm3
Relevant market
~5.1Mm3
EMEA market
~12Mm3
Sales
by category
90120.8
Industrial
applications
Construction /
Panel Trading
| © UPM – The Biofore Company
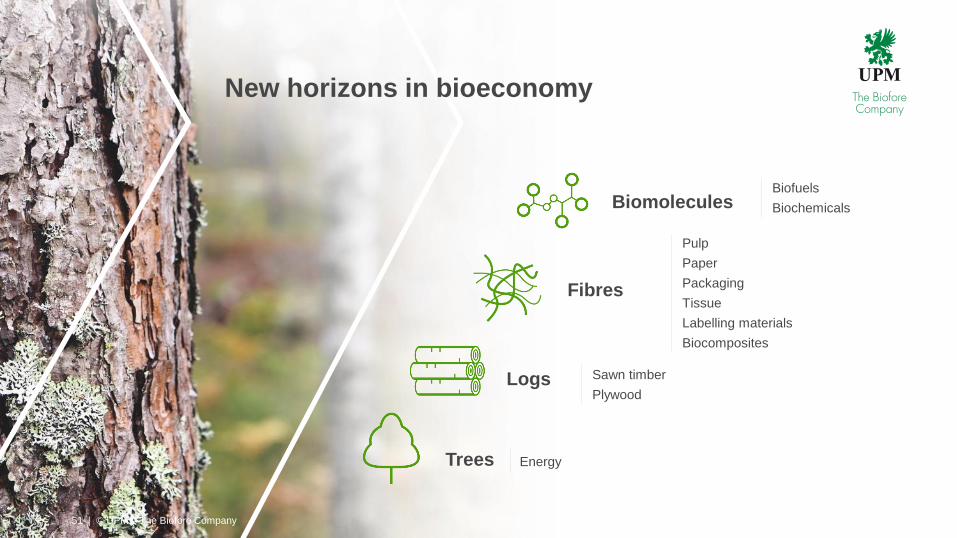
Biomolecules
Fibres
Logs
Trees
Biofuels
Biochemicals
Pulp
Paper
Packaging
Tissue
Labelling materials
Biocomposites
Sawn timber
Plywood
Energy
51
New horizons in bioeconomy
| © UPM – The Biofore Company
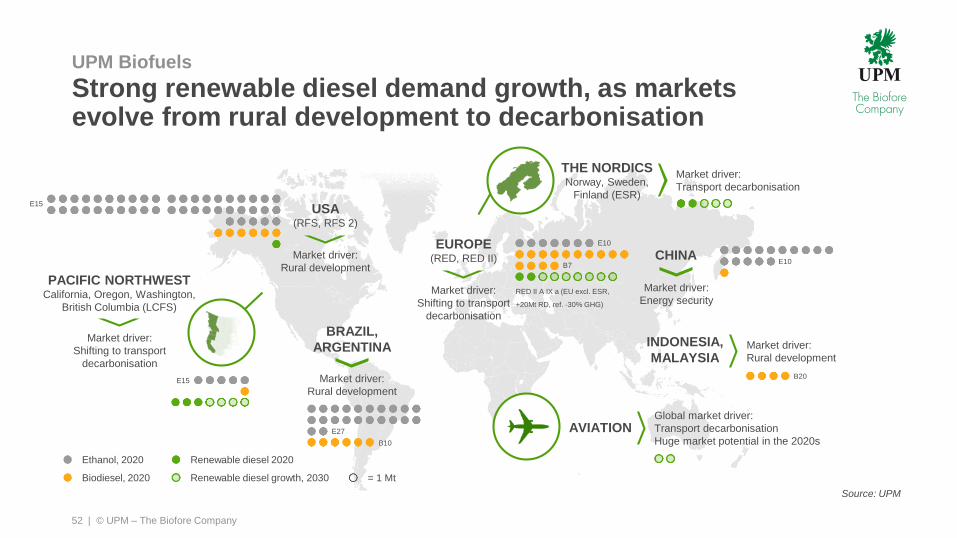
| © UPM – The Biofore Company
Strong renewable diesel demand growth, as markets evolve from rural development to decarbonisation
52
Source: UPM
UPM Biofuels
USA(RFS, RFS 2)
Market driver:
Rural development
EUROPE(RED, RED II)
Market driver:
Shifting to transport
decarbonisation
BRAZIL,
ARGENTINA
Market driver:
Rural development
PACIFIC NORTHWESTCalifornia, Oregon, Washington,
British Columbia (LCFS)
Market driver:
Shifting to transport
decarbonisation
THE NORDICSNorway, Sweden,
Finland (ESR)
Market driver:
Transport decarbonisation
CHINA
Market driver:
Energy security
INDONESIA,
MALAYSIAMarket driver:
Rural development
Ethanol, 2020
Biodiesel, 2020
Renewable diesel 2020
Renewable diesel growth, 2030 = 1 Mt
AVIATIONGlobal market driver:
Transport decarbonisation
Huge market potential in the 2020s E27
B10
E15
E10
B7
RED II A IX a (EU excl. ESR,
+20Mt RD, ref. -30% GHG)
E15
E10
B20

| © UPM – The Biofore Company
The possible Kotka Biorefinery: an innovative and robust concept to scale up the business
UPM Biofuels
Lappeenranta Biorefinery
100kt
Potential Kotka Biorefinery
500kt
Residual
oils
Carbon farming
(Carinata oil)
UPM renewable fuels UPM feedstocks
Residues,
saw dust, bark
Competitive and
sustainable feedstocks
World-scale biorefinery leveraging UPM ecosystem
Significant efficiency gains enabled by economy of
scale and synergies with Lappeenranta
Low-carbon fuels for
road, aviation, shipping
and petrochemicals
53

| © UPM – The Biofore Company
Biochemicals products are sustainable and competitive alternatives to replace fossil materials
54
UPM Biochemicals
40% Cellulose
30%Hemi-
cellulose
25%Lignin
2
%
STEP 1: SUGAR PULPINGDisintegrating wood into sugars,
lignin and green energy
STEP 2: CHEMICAL CONVERSIONConversion of sugars into targeted
biochemicals
GREEN
ENERGY
SUGARS
Lignin
BIOMASS
Biochemical A
.
.
.
Biochemical N
BIOREFINERY PROCESS
FIXED TECHNOLOGY PLATFORM VARIABLE FOR EACH BIOREFINERY
54 | © UPM – The Biofore Company

| © UPM – The Biofore Company
UPM Biochemicals
Biochemicals biorefinery targeting to produce
bio-MEG, bio-MPG and lignin from hardwood
55
Monopropylene glycol
Biorefinery ligninMonoethylene glycol
Textiles
Monopropylene glycol
Composites Wood resins
Existing fossil-based market
Market demand > 26 m tonnes
CAGR > 3%
Application examples:
Existing fossil-based market
Market demand > 2 m tonnes
CAGR > 5%
Application examples:
Bottles & packaging
Deicing fluids
Pharma & cosmetics
Detergents
Plastics
Foams & coatings
Performance chemical
Application driven
Strong IP position
Application examples:
| © UPM – The Biofore Company
bMPGbMEG Lignin
