upham beach stabilization project structural alternatives ... · coastal planning &...
TRANSCRIPT

UPHAM BEACH STABILIZATION PROJECT
STRUCTURAL ALTERNATIVES DEVELOPMENT AND ANALYSIS REPORT
Prepared for:
Pinellas County Department of Environmental Management
Prepared by:
Coastal Planning & Engineering, Inc.
January 2010

COASTAL PLANNING & ENGINEERING, INC.i
UPHAM BEACH STABILIZATION PROJECT
STRUCTURAL ALTERNATIVES DEVELOPMENT AND ANALYSIS REPORT
Table of Contents
I. Introduction ............................................................................................................................1II. Objectives ................................................................................................................................1III. Project Area Description .........................................................................................................2IV. Project Area History ...............................................................................................................3V. Blind Pass Inlet Management Plan ........................................................................................4VI. Experimental Groin Field Assessment ...................................................................................5VII. Stakeholder Meetings ..............................................................................................................7VIII. Structural Alternatives Development .......................................................................................8IX. Numerical Modeling Evaluation ..............................................................................................17X. Study Findings ........................................................................................................................25XI. Recommendations....................................................................................................................27XII. References ...............................................................................................................................27
List of Figures
Figure No.
1 Upham Beach, Florida ....................................................................................................2 2 January 2008 aerial photographs of Upham Beach ........................................................5 3 Experimental geotube T-groins in February 2009 ..........................................................9 4 Damaged northernmost T-groin in October 2009 .........................................................10 5 Wide public beach in T-groin field in October 2009 ....................................................10 6 Existing T-groin design.................................................................................................11 7 Alternative 1 schematic .................................................................................................12 8 Alternative 2 schematic .................................................................................................13 9 Alternative 3 schematic .................................................................................................14 10 Alternative 4 schematic .................................................................................................15 11 2009 bathymetry for numerical model ..........................................................................19 12 Comparison of simulated and observed breaking wave conditions ..............................20 13 Observed wave refraction from structures represented in model results ......................21 14 Comparisons of the 2004 vs. 2006 bathymetry and breaking wave locations ..............21 15 Model input bathymetry for alternatives analysis .........................................................22 16 Example breaking wave results from model alternatives analysis ...............................23
List of Tables Table No.
1 Upham Beach Nourishment History .................................................................................3 2 Wave cases for BOUSS2D modeling ...............................................................................18 3 Alternative Comparison Matrix ........................................................................................24

COASTAL PLANNING & ENGINEERING, INC.ii
UPHAM BEACH STABILIZATION PROJECT
STRUCTURAL ALTERNATIVES DEVELOPMENT AND ANALYSIS REPORT
Table of Contents (cont'd)
List of Appendices
Appendix No.
A Modeling Report B Model Results C City of St. Pete Beach Recommendation

COASTAL PLANNING & ENGINEERING, INC.iii
UPHAM BEACH STABILIZATION PROJECT
STRUCTURAL ALTERNATIVES DEVELOPMENT AND ANALYSIS REPORT
EXECUTIVE SUMMARY
Upham Beach is located on the west coast of Florida in Pinellas County at the northern end of the Long Key Gulf coastline. This area of shoreline is downdrift of Blind Pass and has a history of being highly erosional (CPE, 1992). In an effort to reduce the severity of erosion and stabilize the beach in this area, a temporary geotube T-head groin field was installed following the recommendation for structural stabilization in the 1992 Blind Pass Inlet Management Plan (CPE, 1992).
Since the geotube installation in 2005, the performance of the groins has been monitored and has proven to be effective in reducing erosion rates in the local area without negatively impacting downdrift beaches (Wang & Roberts, 2009). The County is seeking a cost-effective solution that maintains the storm protection and stabilization attributes of the initial geotube T-groin design, while minimizing impacts to beach user groups and to provide an interval between nourishments similar to the other beaches of Pinellas County to align costs.
Four alternatives were evaluated, each comprised of permanent rock structures to be implemented in conjunction with nourishment of Upham Beach. Each alternative was developed with the goal of stabilizing the beach for storm protection without downdrift erosion, thus allowing Upham Beach to continue to act as a feeder beach. Consideration was also given to the concerns of community interests, particularly surfing. The following four alternatives were developed:
1. Removing the T-head portions of the existing groins combined with a jetty extension 2. Modifying groins T1 and T2 with removal of T3 and relocation of T4 3. Curving the head portions of the T-groins with installation of an artificial reef 4. Modifying groins T1 and T2 to increase beach width fronting the northernmost seawalls
A numerical modeling analysis was conducted utilizing a Boussinesq-type wave model, BOUSS-2D (Nwogu and Demirbilek, 2001). Model simulations of existing conditions and the four alternatives with the most recent bathymetry (2009) included cold front and hurricane conditions.
The model simulations showed that the existing geotube design is effective for storm protection, but impacts preferred surfing areas. The model also indicated that the ebb shoal developed offshore of Blind Pass affects the wave energy and surfing conditions at Upham Beach. Modifying the groin field and/or installing an artificial reef would provide the desired storm protection for Upham Beach, and would alter the surfing conditions to varying degrees. Groins T1 and T2 can be modified slightly to improve performance at north end. Safety issues are inherent with all structures and should be addressed regardless of the selected option.

COASTAL PLANNING & ENGINEERING, INC.iv
The alternatives were ranked based on the following criteria:
1. Storm Protection to Upland Properties 2. Limit Erosion to Downdrift Beaches 3. Reduce Nourishment Needs 4. Minimize/Mitigate Impacts to Surfers 5. Maximize Public Beach Width 6. Minimize Permitting Effort 7. Cost Estimate
Based on the results, it is recommended that the County pursue a permit application for permanent structures based on Alternative 2. Design refinements may occur as a result of the permitting process. It is also recommended that the existing geotubes be repaired in conjunction with upcoming nourishment project to retain sand until the permanent structures can be installed.

COASTAL PLANNING & ENGINEERING, INC.1
UPHAM BEACH STABILIZATION PROJECT
STRUCTURAL ALTERNATIVES DEVELOPMENT AND ANALYSIS REPORT
I. INTRODUCTION
Upham Beach is located on the west coast of Florida in Pinellas County at the northern end of the Long Key Gulf coastline. This area of shoreline is downdrift of Blind Pass and has a history of being highly erosional (CPE, 1992). In an effort to reduce the severity of erosion and stabilize the beach in this area, a temporary geotube T-head groin field was installed following the recommendation for structural stabilization in the 1992 Blind Pass Inlet Management Plan (CPE, 1992). Since the geotube installation in 2005, the groins have been monitored for performance by the University of South Florida and have been shown to be performing as designed.
The T-head groin field has proven to be effective in reducing erosion rates in the local area without negatively impacting downdrift beaches (Wang & Roberts, 2009). Based on the measured performance of the temporary geotubes, Pinellas County is planning to install permanent rock structures in their place. However, the geotube groins have raised concerns with some beach goers and surfers, and have also sustained damage and deterioration since their installation. The County is seeking a cost-effective solution that maintains the storm protection and stabilization attributes of the initial geotube T-groin design, while minimizing impacts to beach user groups and to provide an interval between nourishments similar to the other beaches of Pinellas County to align costs.
II. OBJECTIVES
This report presents the development of alternatives and modeling analysis performed to evaluate options for permanent structures at Upham Beach. The University of South Florida monitoring study, Performance of Upham Beach T-Groin Project and its Impact to the Downdrift Beach(USF, 2009) has been reviewed, which details the 31-month monitoring of the T-head groin field. Additionally, the Blind Pass Inlet Management Plan has been reviewed within the context of this report in order to maintain the objectives of the original plan.
According to the 1992 Inlet Management Plan, the primary goal of installing structures at Upham Beach was to achieve a reduction in the beach nourishment needs and cost of maintaining the storm protection qualities of the ongoing federal program. Studies have shown that the temporary structures have been effective in holding sediment at this highly erosive beach. Therefore, the conceptual design goals of this study were to maintain these benefits, with the added objective of minimizing impacts to beach users, primarily surfers.
At the request of the County, Coastal Planning & Engineering, Inc. (CPE) developed the study described herein to evaluate potential modifications to the experimental groin field that would maintain the storm protection qualities of the existing design, and minimize impacts identified by the beach goers and surfers. The study aimed to identify the most cost-effective solution to meet the objectives as defined below:

COASTAL PLANNING & ENGINEERING, INC.2
� Maintain a minimum 40-ft wide beach for storm protection � Provide structural stabilization to slow local erosion without downdrift impacts � Reduce frequency and/or volume of nourishment events � Minimize/mitigate impacts to surfers and beach goers � Minimize permitting effort by considering tested configuration
Four alternatives were developed as part of this study and tested with a numerical model against the existing conditions for permanent installation. The model was primarily used to evaluate potential changes to wave breaking, wave energy focusing locations, and surface currents. Each alternative includes a groin field configuration similar to the experimental geotube field, with modifications to address the concerns of beach users and local surfers.
III. PROJECT AREA DESCRIPTION
The project area of Upham Beach is located on the west coast of Florida in southern Pinellas County (Figure 1). It is located at the north end of the barrier island of Long Key, which includes the municipality of St. Pete Beach and is bordered to the north by Blind Pass. The net littoral drift is from north to south in this area, which is interrupted by Blind Pass (CPE, 1992).
Upham Beach is immediately downdrift of the inlet and is starved of sediment due to the combined effect of sediment trapping by the Blind Pass jetties, a growing ebb shoal, and periodic dredging of the inlet (Elko and Mann, 2007). According to Davis (1989) and CPE (1992), sediment bypassing around Blind Pass to Upham Beach has been largely eliminated, making beach nourishment the only sediment supply to Upham Beach. Without beach nourishment, the downdrift shoreline becomes destabilized, which threatens development and public infrastructure.
Figure 1. Upham Beach, Florida (Modified from Elko and Mann, 2007).

COASTAL PLANNING & ENGINEERING, INC.3
IV. PROJECT AREA HISTORY
The City of St. Petersburg Beach first nourished a 2,500 foot stretch of Upham Beach in 1975 with 75,000 cubic yards of dredged material from Blind Pass. In total, there have been eight beach nourishments along the Upham Beach segment of Long Key. The history of fill placement events on Upham Beach are shown in Table 1 with the source of fill material identified.
Table 1. Upham Beach Nourishment History.
� Project� Year� Length�(ft)� Volume�(cy)
Sand�Source�
� City�of�St.�Pete�Nourishment� 1975� 2,500� 75,000� Blind�Pass�
� Initial�Upham�Beach�Construction� 1980� 2,600� 254,000� Blind�Pass�
� First�Beach�Renourishment� 1986� 2,400� 98,000� Pass�A�Grille�Channel�
� Second�Beach�Renourishment� 1991� 2,400� 230,000� Blind�Pass�
� Third�Beach�Renourishment� 1996� 2,400� 253,000� Egmont�Shoal�
� Fourth�Beach�Renourishment�� 2000� 2,700� 281,000� Blind�Pass�
� Fifth�Beach�Renourishment� 2004� 3,600� 408,000� Pass�a�Grille�Channel�and�Ebb�Shoal�
� 2006�Corps�Storm�Repair� 2006� 2,000� 90,000� Egmont�Shoal�
� Sources:�CPE�1992,�ASBPA�2009,�www.pinellascounty.org�
The Beach Erosion Control (BEC) Project for Pinellas County was authorized by Public Law 89-789 on November 7, 1966. The Long Key segment of the project consists of periodic nourishment of 5,600 feet of the shoreline and 600 feet of revetment on Long Key. The authorized project for the Long Key segment of the Pinellas County BEC consists of a berm 40 feet wide, at an elevation of +6 feet Mean Low Water (MLW) with slopes of 1V:20H above MLW and 1H:20V from MLW to the existing bottom. The criteria for maintaining a minimum 40-ft wide beach is within the range of other nourished mean beach widths in the County found in Horwitz & Wang (2009). As shown in Table 1, the initial placement of beach fill along northern Long Key was completed in March 1980. The total volume placed since 1975 is approximately 1.7 million cubic yards.
A rubble-mound breakwater was also constructed at the northern end of Long Key in October 1986. The structure is 315 feet long, and was initially comprised of two segments separated by a 65-foot gap. The breakwater was tied into the existing south jetty at Blind Pass. The purpose of the structure was to protect the beach fill area from tidal currents through Blind Pass and to shelter the limited reach of shoreline from wave attack. The breakwater was constructed in combination with the PL84-99 restoration from Pass-A-Grille Beach and the first renourishment
COASTAL PLANNING & ENGINEERING, INC.4
of northern Long Key. The gap in the structure was filled in 2005 with additional rock during construction of the Upham Beach Geotextile T-head Groin project.
Following the 2005 hurricane season, Pinellas County requested emergency federal assistance from the U.S. Army Corps of Engineers to repair storm damage to Treasure Island and Long Key (St. Pete Beach) under Public Law 84-99, Flood Control and Coastal Emergencies (FCCE). The project placed 270,000 cubic yards of sand along three beach fill areas: 1) Sunshine Beach, 2) Sunset Beach, and 3) Upham Beach. Sand was dredged from Egmont Shoals, just offshore of the entrance to Tampa Bay and north of Egmont Key. The $6 million rehabilitation project was funded at 100% federal cost-sharing. (Source: http://www.pinellascounty.org)
V. BLIND PASS INLET MANAGEMENT PLAN
The Blind Pass Inlet Management Plan (CPE, 1992) was required and cost-shared by the FDEP and set out to determine the extent of beach erosion caused by the inlet. The plan addresses the severity of impact by the inlet on the surrounding area of influence and provides recommendations for mitigation based on effectiveness, cost, and impact to natural resources, navigation, and recreation. The study concludes that sediment deposited in the inlet must be dredged and placed on downdrift beaches to maintain safe navigation in the inlet and compensate for lack of sediment on the beach. The quantity of sand placed should be equal to the natural net annual longshore transport and can be obtained from an alternate source of the same quality if necessary. The resulting plan was developed with the following goals:
1. Complete bypass of sand captured by Blind Pass 2. Maintain Upham Beach 3. Maintain navigation for recreational boating through Blind Pass
The Inlet Management Plan considered the following alternatives to achieve stated goals:
I. Close the Inlet 1. No Action 2. Remove Jetties/fill channels 3. Nourish Upham Beach from an Offshore Sand Source
II. Sand Bypassing Methods 1. Dredge Blind Pass/Nourish Upham Beach every 6 years 2. Groin field at Upham Beach, dredge Blind Pass/Nourish Upham Beach every 6
years 3. Dredge Blind Pass and deposition Basin/Nourish Upham Beach every 4 years 4. Purchase and Operate a Dedicated Dredge 5. Crane Mounted Jet Pump on Treasure Island Beach 6. Jet Pump/fluidizer system in the inlet 7. Dredge Blind Pass every 6 years/nourish Upham Beach every 3 years 8. Detached breakwaters at Upham Beach, dredge Blind Pass and nourish Upham
Beach every 6 years
COASTAL PLANNING & ENGINEERING, INC.5
These alternatives were evaluated based upon technical feasibility, maintenance dredge interval, permitability, initial construction cost, annualized project cost, annual bypassing rate, and the ability to meet plan goals. It was determined that closing the inlet would not satisfy the objectives of the study and the alternatives analysis was focused on methods of sand bypassing.
Based the analysis, the Blind Pass Inlet Management Plan identified two feasible options for implementation at Upham beach: (Option 2) Construction of a groin field at Upham Beach, dredging Blind Pass/Nourish Upham Beach Every 6 Years, and (Option 7) Dredge Blind Pass every 6 years/nourish Upham Beach every 3 years. Both selected plans meet the three goals set out for the inlet management program; however, Option 2 was recommended over Option 7 due to annual cost considerations. Due to initial permitting difficulties with the concept of installing structures at Upham Beach, Option 7 was generally implemented by default. The installation of the temporary geotubes was the first step in implementing Option 2, which served as a test of the effectiveness and potential impacts of structural stabilization.
VI. EXPERIMENTAL GROIN FIELD ASSESSMENT
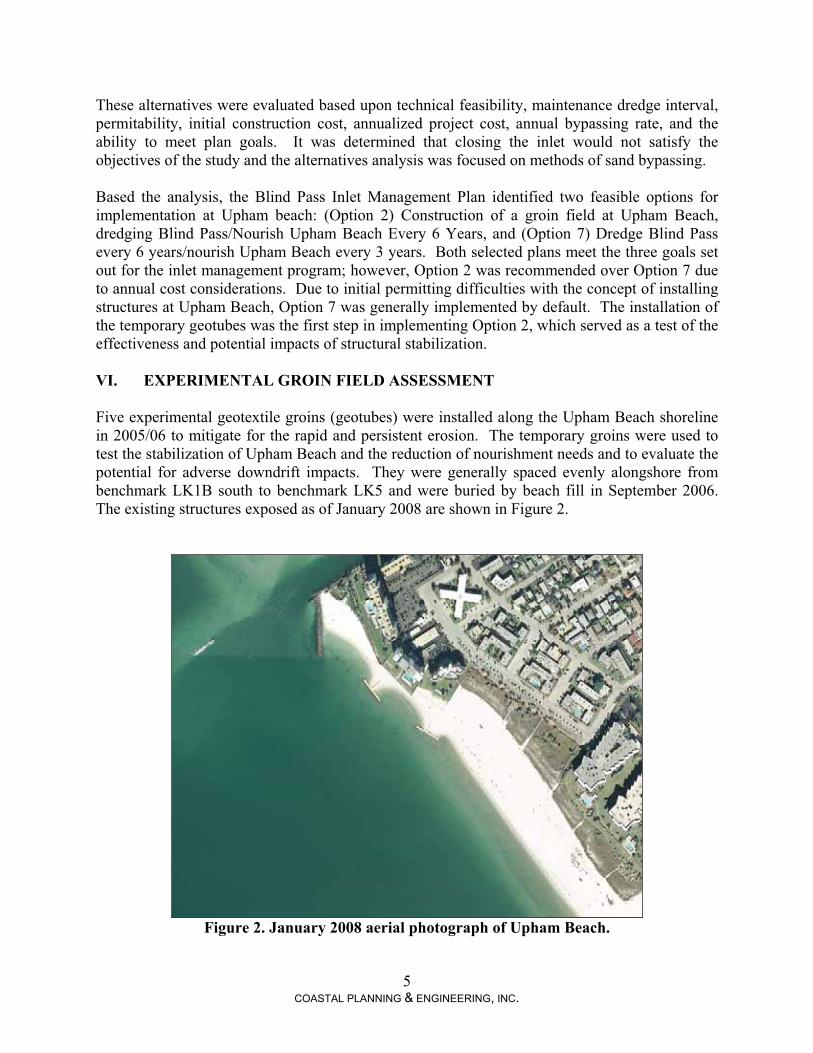
Five experimental geotextile groins (geotubes) were installed along the Upham Beach shoreline in 2005/06 to mitigate for the rapid and persistent erosion. The temporary groins were used to test the stabilization of Upham Beach and the reduction of nourishment needs and to evaluate the potential for adverse downdrift impacts. They were generally spaced evenly alongshore from benchmark LK1B south to benchmark LK5 and were buried by beach fill in September 2006. The existing structures exposed as of January 2008 are shown in Figure 2.
Figure 2. January 2008 aerial photograph of Upham Beach.
COASTAL PLANNING & ENGINEERING, INC.6
Geotube Construction
Construction of the geotube T-groins began shortly after the completion of the 2004 nourishment project and lasted for nearly 1.5 years until completion in May 2006. The intent was to have the T-groins initially buried within the nourishment project, and were constructed from north to south. The T-groin field was designed to become effective as the shoreline retreats and the structures are exposed. Substantial beach erosion, especially at the northern portion of the project, occurred during the prolonged construction. At the completion of the southernmost T-groin installation, the northern 3 structures were already exposed (Wang & Roberts, 2009). The storm repair renourishment in September 2006 (Table 1) widened the beach and reburied all the structures (Wang and Roberts, 2009).
USF Monitoring Results
The monitoring program conducted by the University of South Florida (USF) was designed and implemented to evaluate the performance of the T-head groins and their potential impact to the adjacent beaches. The most recent progress report (Wang and Roberts, 2009) includes a summary of the six previous monitoring periods, since September 2006. Monthly beach profile surveys of 27 beach profile lines were conducted within the groin field along the adjacent downdrift beach, in addition to 28 profiles along the entire length of Long Key. Each T-groin structure was monitored with six survey lines: three lines that intersect the structure and three lines in the adjacent sandy “compartments.” The monitoring results are summarized below.
During the initial 3 months after the September 2006 nourishment, rapid beach erosion at the north segment, typical of Upham Beach, was measured. Since all of the T-head groin fields structures were buried, this rapid erosion was not attributed to the groin field. Downdrift of the groin field, the dry beach remained stable to slightly accretional, likely due to the longshore transport of the material to the south. No direct impacts of the structures to the downdrift beach were measured during the initial 3 months (Wang & Roberts, 2008).
The northernmost groin became exposed just prior to the December 2006 survey. The second T-groin became exposed during the month of January 2007. During the 4-month period between December 2006 and April 2007, erosion was measured between each of the groins with the most erosion occurring between the northern groins and the least erosion occurring between the southern groins. There was a complementary volumetric gain measured along the downdrift beach (Wang & Roberts, 2008).
The third monitoring period, from April 2007 to October 2007, represented a mild summer season, and the overall shoreline and volume losses within the groin field were smaller than experienced in the previous monitoring periods. Volumetric and shoreline gains were again measured in the downdrift area. During this period, the third T-groin became exposed in May 2007 (Wang & Roberts, 2008).
During the fourth monitoring period, from October 2007 to April 2008, beach erosion was measured at all of the T-groin profiles and along the immediate downdrift area. The fourth T-groin became exposed at the shoreline in February 2008. The monitoring indicated that the

COASTAL PLANNING & ENGINEERING, INC.7
erosion along the downdrift beach was likely related to the typical long-term trends, and there was no evidence that the downdrift erosion has been accelerated by the T-groin structures (Wang & Roberts, 2008 and 2009).
During the fifth monitoring period between April and October 2008, there was significant erosion within the study area. This level of erosion was likely due to the active storm season, including the influence of two hurricanes. The monitoring report concluded that this erosion was not related to the groins (Wang & Roberts, 2008 and 2009).
During the sixth monitoring period between October 2008 and April 2009, the project area and downdrift beach suffered substantial losses due to an active winter season. Extensive loss was seen in the intertidal and subaqueous zones, which lowered 0.5 m over a large portion of the sub-tidal profile. Downdrift profiles experienced typical winter erosion rates for Upham Beach, which were generally smaller than losses in the T-groin area (Wang & Roberts, 2009).
Based on the 31 months of monthly monitoring, no clear negative impact from the T-groin field to the downdrift shoreline was identified by USF. The 2-year sand losses from four of the five T-groin compartments were considerably less than the losses identified in the 2000-2002 Upham Beach nourishment project. Damages to T1 and T2 contributed to the exposure of the seawall and riprap north of T2, causing erosion rates to significantly increase in the northern two compartments.
The 2009 monitoring report concluded that the T-groins have reduced the rate of beach erosion at Upham Beach (Wang & Roberts, 2009). Overall, during the 2006-2008 nourishment monitoring period, the beach from T2 though T5 retained 38% more sand with the structures as compared to the 2000-2002 nourishment monitoring period without structures. In addition, downdrift impacts to adjacent beaches were not observed.
VII. STAKEHOLDER MEETINGS
As part of the project assessment and alternatives development, two meetings with local stakeholders were conducted. The goal of these meetings was to develop an understanding of the concerns of the upland owners and local beach users with regard to the existing geotube groin field. In particular, the local surfing community was invited to participate in order to gain a better understanding of the location and extent of the local surf break. Potential design modifications were discussed in such a manner as to promote a balance between the project design intent and minimizing impacts to the local surfing community and other beach users. The meetings were held in St. Pete Beach on February 17, 2009 and June 1, 2009. Informal site visits were also conducted by CPE in conjunction with each of the meetings.
The intent of the first stakeholder meeting was to describe the study plan and solicit feedback from the local stakeholders. Example wave model test runs were presented to illustrate the capabilities of the model. Comments were collected from the public and were considered during the alternatives development phase. The preliminary model results were presented at the second stakeholder meeting to demonstrate the capabilities of the model in simulating observed conditions. Conceptual alternative layouts were also presented to generate feedback prior to

COASTAL PLANNING & ENGINEERING, INC.8
evaluation with the wave model. In general, the model results and conceptual alternatives presented at the second stakeholder meeting received a positive response from the community.
VIII. STRUCTURAL ALTERNATIVES DEVELOPMENT
The primary objective of the stabilization project is to reduce the nourishment frequency of Upham Beach to 6 years similar to other County beaches, such that sediment from Blind Pass maintenance dredging is the sole sand source for the project area. In doing so, the County will avoid the need to nourish Upham Beach at higher frequencies with more distant sand sources. The long term cost benefit of increasing the interval between nourishment events and using a local sand source is significant (Elko, June 2009). The conservation of offshore sediment resources combined with the beneficial use of Blind Pass maintenance dredging sand is also a high priority state-wide.
The installation of the experimental geotube T-head groins tested the effectiveness of the groin field and showed that the structures slowed erosion at Upham Beach without negatively impacting the downdrift beach. Performance monitoring by USF concluded that the structures have been effective and noted that the northernmost seawalls only became exposed after damage to geotubes was sustained. Based on this information and the recommendations in the Blind Pass Inlet Management Plan (CPE, 1992), and with the support of the City of St. Pete Beach in July 2008, Pinellas County chose to move forward with the installation of permanent structures.
Some members of the local community who frequent Upham Beach raised concerns about the geotube T-groins upon their installation. Beach goers cited safety, aesthetics, and durability as the major points of concern. Effects on recreation were also identified by local surfers who reported that the geotube structures negatively impacted wave quality and surf breaking due to the physical location of the structures and wave reflection. As a result of these comments, the County offered to develop a modeling study to evaluate structural alternatives that would maintain storm protection and minimize negative impacts to recreational beach users.
Four structural alternatives to the existing design have been developed and evaluated in this study. All alternatives include permanent rock structures to be constructed in conjunction with renourishment of Upham Beach. Each option was developed with the goal of stabilizing the beach for storm protection without downdrift impacts, thus allowing Upham Beach to continue to act as a feeder beach. Particular consideration was also given to the concerns of community interests, predominantly surfing. The following four alternatives were developed:
1. Removing the T-head portions of the existing groins combined with a jetty extension 2. Modifying groins T1 and T2 with removal of T3 and relocation of T4 3. Curving the head portions of the T-groins with installation of an artificial reef 4. Modifying groins T1 and T2 to increase beach width fronting the northernmost seawalls
Since all structures are intended to be completely buried periodically by beach fill, each alternative was designed for the equilibrium condition of the beach expected to exist immediately prior to each nourishment event. The Mepbay software was employed to calculate the equilibrated planform shapes of the shoreline, which uses a parabolic model (Hsu and Evans,

COASTAL PLANNING & ENGINEERING, INC.9
1989; Hsu et. al., 2008) as a series of headland beaches between structures. Through this analysis, the preliminary concepts have been refined targeting a minimum 40-ft wide beach fronting the upland development. The existing groin layout and 2008 aerial photography were utilized to verify the estimated shoreline response of the alternative layouts based on the methodology described by Bodge (1998). Opportunities for surfing were also considered with each alternative, as well as reducing the potential for wave reflection off the structures.
Existing Design
Performance monitoring by USF and observations of local upland property owners concur that the temporary structures have been beneficial to slowing erosion and maintaining a wide beach. A photograph of the beach taken in February 2009 is shown in Figure 3 looking south from atop of the Starlight Tower condominium near the north end of the project area. The photograph illustrates the local shoreline response between the structures and shows the lack of downdrift erosion, which evidenced by the straight shoreline of the beaches to the south.
Figure 3. Experimental geotube T-groins in February 2009.
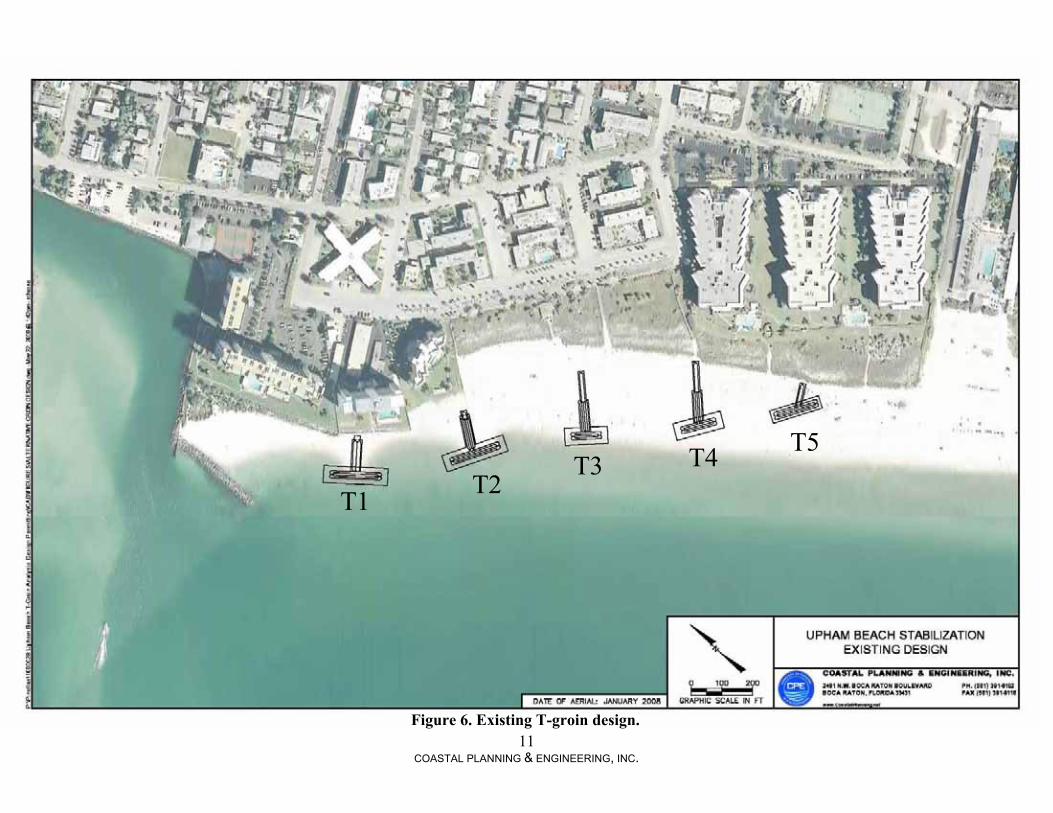
The northernmost T-groin has sustained significant damage since its installation due to vandalism and/or natural forces and is not longer holding sand as originally designed (Figure 4). However, in areas where the experimental geotubes remain intact, the beach is wide and stable as shown in Figure 5. The stability of the beach is further evidenced by the growth of pioneer vegetation that would not have occurred without installation of the structures. The existing experimental design is shown in Figure 6, with the groins labeled T1 through T5 for reference. The alternatives developed for the study are shown in Figures 7-10 and are described below.

COASTAL PLANNING & ENGINEERING, INC.10
Figure 4. Damaged northernmost T-groin in October 2009.
Figure 5. Wide public beach in T-groin field in October 2009.
COASTAL PLANNING & ENGINEERING, INC.11
T1 T2T3 T4 T5
Figure 6. Existing T-groin design.

COASTAL PLANNING & ENGINEERING, INC.12
Figure 7. Alternative 1 schematic.

COASTAL PLANNING & ENGINEERING, INC.13
Figure 8. Alternative 2 schematic.

COASTAL PLANNING & ENGINEERING, INC.14
Figure 9. Alternative 3 schematic.

COASTAL PLANNING & ENGINEERING, INC.15
Figure 10. Alternative 4 schematic.

COASTAL PLANNING & ENGINEERING, INC.16
Alternative 1
Alternative 1 consists of straight groins combined with a reorientation and extension of the Blind Pass south jetty. The alternative was based on the concept that removing the T-head portions of the four northern groins (T1-T4) would increase the surfing opportunities adjacent to the structures and eliminate wave reflection. In order to provide similar beach widths to the existing T-groins, the straight groins were doubled in length, which also increases the shoreline offset that can benefit surfing. The jetty extension was included in this alternative to test the concept as discussed with local surfers at the stakeholder meetings. The jetty modification was oriented to extend further offshore without inferring with the inlet channel for boating concerns.
The conceptual layout of Alternative 1 is illustrated in Figure 7 along with the estimated equilibrium shoreline response.
Alternative 2
Alternative 2 consists of a modified T-head design with one less structure fronting the public beach. The specific modifications to the existing design include shifting the head of T1 offshore by approximately 50 ft, altering the angle of the head of T2, removal of T3 and a relocation of T4 by approximately 100 ft to the north. No changes were made to T5. The extension of T1 was implemented to increase the beach width fronting the northern seawalls. The head adjustment to T2 was designed to improve beach width and compartmentalize the north side, while reducing wave reflection and providing an improved surfing area on the south side. The removal of T3 opens a larger area for surfing opportunities than the current design and provides a longer bay-shaped frontage for recreation at the public beach. To compensate for the removal of T3, the T4 structure was shifted north in order to preserve the public beach width. This alternative addresses surfing concerns and adds protection for the condominiums at the north end of the project area.
The conceptual layout of Alternative 2 is illustrated in Figure 8 along with the estimated equilibrium shoreline response.
Alternative 3
Alternative 3 consists of a curved T-head design with a small straight groin and artificial reef at the public beach. The intent of the curved T-head portions of the existing structures is to reduce backwash/reflection off the front of the structures. The option of installing a submerged artificial reef in this case was intended for the dual purpose of stabilizing the beach and to provide a surfing amenity at the public access location. The artificial surfing reef would provide similar shoreline protection as a submerged breakwater by reducing the wave energy in a localized area. The added benefit of an artificial reef compared with a standard rubble mound submerged breakwater is that wave breaking processes (including the shape, peel velocity, peel angle, etc.) is designed for surfing purposes. Although the reef is only included in Alternative 3 for this study, the concept could be implemented with any of the alternatives. Lastly, T3 is modified in this alternative, but may be removed depending on the shoreline response leeward of the artificial reef.

COASTAL PLANNING & ENGINEERING, INC.17
The conceptual layout of Alternative 3 is illustrated in Figure 9 along with the estimated equilibrium shoreline response.
Alternative 4
Alternative 4 is the same as the existing design with minor modifications to T1 and T2. The objective of Alternative 4 is to match the tested configuration, while refining the design to improve the beach width fronting the northern seawalls. The modifications to T1 and T2 in this alternative are the same as described in Alternative 2. While, this alternative does not directly address surfing concerns, it is expected to provide a wide beach similar to the existing design with additional protection for the condominiums at the north end of the project area.
The conceptual layout of Alternative 4 is illustrated in Figure 10 along with the estimated equilibrium shoreline response.
IX. NUMERICAL MODELING EVALUATION
In order to evaluate each of the alternatives compared to existing conditions at Upham Beach, a numerical modeling study focusing on breaking waves and surface currents was performed. The analysis was conducted utilizing a numerical Boussinesq-type wave model, BOUSS-2D, developed by the U.S. Army Corps of Engineers (Nwogu and Demirbilek, 2001) and utilized through the Surface Water Modeling System (SMS) interface (Aquaveo, 2008). The model was primarily utilized as a tool to investigate the effects on wave energy for storm protection and wave breaking for surfing considerations. The details of the modeling effort are provided in the appendices to this report and are summarized below.
BOUSS-2D Wave Model
BOUSS-2D is a phase-resolving model that can simulate the shoaling, refraction, diffraction, reflection, bottom damping, and breaking of nonlinear waves. BOUSS-2D analyzes wave behavior in the time domain, generating water-surface elevations and horizontal velocities over the wave’s period as an output. This approach is highly detailed and results in graphic animations of wave propagation and interaction with structures.
The model was first set up to simulate the historic wave breaking conditions for surfing at the project area. The domain of the wave model included the nearshore area extending from the Blind Pass south jetty through the existing groin field. Bathymetric survey data were provided by Pinellas County for input in the model and for verification of the model’s ability to replicate the observed surfing conditions.
A total of seven (7) model configurations were developed for investigation with the model. The first two set-ups simulated the 2004 and 2006 conditions to compare surfing before and after the installation of the structures. These model configurations were used primarily to verify that the model correctly replicates observed conditions, when the waves were considered good for surfing (2004) and when the waves were reported to have been impacted by the structures (2006). The remaining five set-ups were used to simulate the existing (2009) conditions and the four structural alternatives as they relate to storm protection and potential surfing impacts.

COASTAL PLANNING & ENGINEERING, INC.18
Wave Data
Measured directional wave data were collected by the University of South Florida (USF, Ping Wang) from December 2003 to February 2005, which was obtained for this study. The data were collected with a PUV directional wave gauge deployed about 600 m offshore of the center of Upham Beach in approximately 4 m of water. Wave conditions were sampled at 2 Hz for 512 samples (or 256 s) every 90 minutes. Tidal water levels were measured every 15 minutes. There was 240 days of data collected, which include hurricanes Frances and Ivan (long period swell), typical west-Florida wave conditions, and several cold fronts. Data from an offshore NOAA-NBDC buoy (#42036, West of Tampa, 54 m of water depth) were also used to evaluate representative conditions.
The measured wave data were analyzed to determine appropriate wave cases for the model. The locally measured wave heights and periods provided by USF in directional sectors known to provide good surfing at the site were used; i.e. the W-NW quadrants. Wave cases were defined based on available wave data that corresponded to known wave events for verification purposes. The “typical conditions” indicated very small waves (less than 1 ft) and would not have been very informative from a storm impact or surfing point of view and were therefore not included in the model. The waves cases used in the model are shown in Table 2 and described as follows:
1. Cold Front “A” with long period waves 2. Cold Front “A” with a higher wave angle, referred to as Cold Front A(b)3. Cold Front “B” with short period waves 4. Hurricane Ivan
Table 2. Wave cases for BOUSS2D modeling.
EVENT Hs (ft)
Tp (s)
Angle(degrees)
Cold Front A 2.5 9.2 270
Cold Front A(b) 2.5 9.2 290
Cold Front B 3.0 6.5 282
Hurricane Ivan 3.3 11.8 250 Note: Wave height at breaking is larger due to wave shoaling.
Tides and Currents
Tides generate currents within the restricted channel of Blind Pass. The tidal currents at Blind Pass are approximately 0.6 ft/s on the flood tide and 0.4 ft/s on the ebb tide at the north end of the channel (CPE, 1992). These currents increase with proximity to the mouth of the pass and with any restriction to the flow such as sand shoals and physical narrowing of the channel between structures. The mean diurnal tide range of the ocean at Blind Pass is 1.8 feet MLW and the mean spring tide is estimated at 2.3 feet (USACE, 1985; CPE, 1992). Although the BOUSS-2D model does not include tides, wave generated currents are simulated.

COASTAL PLANNING & ENGINEERING, INC.19
Bathymetric Data
Various sources of bathymetric data were compiled for use in the model. For the verification analysis, the USACE 2004 LIDAR data were used to represent the pre-project condition. The Post-Wilma 2006 LIDAR data were used to represent the conditions after installation of the geotube groins. For production runs, bathymetries were complied by merging different data sets to create “Existing Conditions” bathymetry. The goal was to obtain recent conditions that represent 2008/2009 bathymetric features. The final bathymetry was composed from 2009 USF profiles, USACE October 2008 data sets, supplemented with the 2006 Post Wilma LIDAR data. The data sets were merged in chronological order and priority. Figure 11 shows the final bathymetry in the project area. Additional details on the bathymetric data can be found in Appendix B.
Figure 11. 2009 bathymetry for numerical model.
Model Validation
The BOUSS-2D model does not have a formal verification procedure. However, the preliminary results were validated with observations to provide assurance that the model accurately simulated reported conditions. In order to do so, two sets of bathymetry were modeled for each wave case representing the ‘good old days’ (2004) and the post-project (2006) conditions.
The results showed that the model closely simulated the observed breaking wave patterns and features. Model results compared to conditions observed in an October 2003 aerial are shown in Figure 12. In addition, the 2006 condition after installation of the geotubes was also well

COASTAL PLANNING & ENGINEERING, INC.20
represented and reproduced the reported effects of the structures, such as wave reflection shown in Figure 13. Further discussion on the verification is provided in the appendices to this report.
In comparing the 2004 and 2006 bathymetries, the ebb shoal development was shown to affect wave quality at Upham Beach. In 2004, waves were able to propagate to the beach without breaking due to the lack of a developed ebb shoal. With the re-growth of the shoal by 2006, waves were found to be influenced to the point of breaking further offshore than the preferred surfing location shown in Figure 12. The comparisons of the 2004 vs. 2006 bathymetry and breaking wave conditions are shown in Figure 14.
Figure 12. Comparison of simulated and observed breaking wave conditions.
Model Simulation
October 2003

COASTAL PLANNING & ENGINEERING, INC.21
Figure 13. Observed wave refection from structures represented in model results.
Figure 14. Comparisons of the 2004 vs. 2006 bathymetry and breaking wave locations.
2004 Bathymetry 2006 Bathymetry
2004 Breaking Wave Locations 2006 Breaking Wave Locations

COASTAL PLANNING & ENGINEERING, INC.22
Alternatives Analysis
The alternatives were evaluated against the existing conditions primarily in terms of storm protection and surfing aspects. Production runs were performed with the validated model to provide basis for alternative evaluation and development of recommendations. The initial model results were used to confirm that the experimental geotube structures are effective in reducing wave energy impacting the beach, but can also have negative impacts on local surfing conditions due to their physical location and resulting wave reflection. The existing conditions assessment and four alternatives were then implemented in the model incorporating the most recent bathymetric data set collected in 2009 by USF. The model input bathymetries for each of the four alternatives are shown in Figure 15.
Figure 15. Model input bathymetry for alternatives analysis.
The alternatives analysis was conducted to evaluate how modifications to the existing design could affect performance and surfing impacts. In general, the results showed that T1 and T2 can be modified slightly to increase beach width at north end and that modifying groin field and/or installing an artificial reef would alter the surfing conditions. The result could be positive or negative to surfing depending on the actual modification and various opinions of local surfers. An example of the model results illustrating breaking waves and surface currents from wave case Cold Front A(b) are shown for each alternative in Figure 16. The details of each modeling run are described in the appendices to this report.
Alt. 1
Alt. 2
Alt. 3
Alt. 4

COASTAL PLANNING & ENGINEERING, INC.23
Figure 16. Example breaking wave results from model alternatives analysis.
In order to provide a comparison of the project alternatives, the results were evaluated based on the project objectives. An alternative comparison matrix is shown in Table 3, which compares each alternative to how well it is expected to meet each specific objective. Estimated project costs are also provided in Table 3 for comparison purposes only. The estimates assume approximately $1 million per structure and are expected to vary based on the alternative selected and other factors such as market variability, contractor availability and price of construction materials (i.e. price per ton of rock). It is also noted that safety issues will remain regardless of the alternative selected, which should be addressed though signage and some form of public information or oversight.
The matrix is an informative way to provide a qualitative review of each alternative utilizing the existing design as a baseline for comparison. A three star rating system was developed, whereby one star indicates the alternative minimally meets the objective, two stars indicate the alternative moderately meets the objective, and three stars indicate the alternative highly meets the objective. The existing design was determined to highly meet all objectives except for (1) storm protection to upland properties since some improvement may be achieved though modification of T1 and T2; and (2) minimizing surfing impacts since that is one of the main objectives of modifying the design. The permitting effort of the existing design is expected to be relatively straightforward since the layout has been tested and monitored with positive results.
Alt. 2
Alt. 3
Alt. 4
Alt. 1

COASTAL PLANNING & ENGINEERING, INC.24
Table 3. Alternative Comparison Matrix.
Objective Existing Design
Straight GroinsALT 1
Modified T-Heads
ALT 2
Curved Heads w/
ReefALT 3
Modified Existing DesignALT 4
Storm Protection to Upland Properties ** * *** ** ***Limit Erosion to Downdrift Beaches *** ** *** *** ***Reduce Nourishment Needs *** ** *** *** ***Minimize/Mitigate Impacts to Surfers * *** ** *** *Maximize Public Beach Width *** ** ** ** ***Minimize Permitting Effort *** ** ** * ***Cost Estimate $5M $6M $4M $8M $5M
Note: * = minimally meets objective; ** = moderately meets objective; *** = highly meets objective.
Alternative 1 demonstrated an improvement in minimizing surfing impacts by utilizing straight groins that would allow for surfing areas adjacent to the structures and eliminate wave refection through removal of the T-heads. However, the lack of T-heads would result in less sand retention at the northern seawalls and therefore not fully achieve the storm protection objective. The permitting effort of Alternative 1 is expected to require slightly more effort than the existing design due to the change from T-heads to straight groins and jetty extension. The construction cost would also be higher due to the additional rock required.
Alternative 2 was shown to improve storm protection for the northern upland properties by increasing the equilibrium beach width through modifications to T1 and T2. The removal of T3 would result in a wide bay-shaped shoreline at the pubic beach providing an open unstructured area for recreation and surfing. In addition, the angled orientation of the T-head of structure T2 is expected to reduce wave reflection during predominate northerly wave events and provide a focus point to initiate wave breaking. However, the removal of T3 will also result in a reduced equilibrium width of the public beach, although the resulting average beach width meets the design criterion and is within the range of other beaches in the County. The permitting effort of Alternative 2 is expected to require slightly more effort than the existing design due to the minor modifications and removal of one structure. However, Alternative 2 will result in the lowest construction cost and reduced safety hazards due to the installation of one less structure compared to other alternatives.
Alternative 3 investigated the concept of curved T-heads and installing an artificial surfing reef at the public beach. Structure T3 was shortened and straightened in this alternative based on some anticipated benefits of the reef, but may be modified or removed depending on the shoreline response leeward of artificial reef. The notable changes when compared to the existing

COASTAL PLANNING & ENGINEERING, INC.25
design are primarily related to an improvement in surfing conditions due to wave breaking over the artificial reef. It is important to note that the reef will not generate new waves, but rather influence the wave breaking during primarily large swells from cold fronts or tropical storms. The reef is not expected to have much effect on the typical daily (average annual) wave conditions. Lastly, the permitting effort is expected to be the greatest with Alternative 3 because it is the least similar to the existing design and artificial reefs of this nature are fairly new to the state of Florida and have never been permitted before.
Alternative 4 represents the existing (tested) configuration with refinements to improve the beach width fronting the northern seawalls. The modifications to T1 and T2 in this alternative are the same as described in Alternative 2. The results show that storm protection for the northern properties would be improved due to the increased beach width fronting the seawalls. However, similar to the existing design, surfing concerns would not be addressed by Alternative 4.
X. STUDY FINDINGS
Based on a review of previous studies, input from stakeholders and the modeling analysis conducted as part of in this study, several findings have been identified. The detailed model results can be found in the appendices to this report for reference. The overall study findings are summarized as follows:
1. Upham Beach is downdrift of Blind Pass and has a history of being highly erosional. Without structures, periodic beach fill is needed on a more frequent basis than maintenance dredging of the inlet can provide, which has required that more distant sand sources be used for supplemental fill projects. The cost of installing permanent structures would be less than the cost of one nourishment event from a distant sand source and would allow Upham to be maintained with sand from Blind Pass as recommended in the Inlet Management Plan.
2. The ebb shoal offshore of Blind Pass affects wave energy and surfing conditions at Upham Beach. Wave height and surface elevation simulations from the numerical model show that wave breaking and refraction occurs in response to the shoal. Bathymetric surveys show that shoal has been reforming since at least 2006, which has resulted in reduced wave energy and less organized waves reaching the beach. It is also evident from the model that waves reaching the nearshore surfzone are further affected by the presence of the existing geotubes.
3. The existing geotube groin field has shown to be effective in maintaining a wide beach without causing negative downdrift impacts. These findings are further supported by the observation that the southernmost groin (T5) is currently still buried after more than 3 years since construction of the last beach project. Minor modifications through adjustment and extension of the two northernmost T-heads can improve the storm protection qualities of the project in that area. The T1 and T2 refinements shown in Alternatives 2 and 4 would better compartmentalize the area and retain more sand in front of the seawalls.

COASTAL PLANNING & ENGINEERING, INC.26
4. The existing T-groin design impacts surfing areas due to wave breaking on or in close proximity to the geotube structures. The numerical model correctly replicates reported and observed conditions of wave breaking and reflection off the structures. Model simulations of the alternatives developed as part of this study show that the groin field can be modified to reduce impacts to surfing, while still stabilizing the shoreline. To fully restore the pre-2004 surfing conditions, the ebb shoal would need to be dredged and beach allowed to erode to the seawalls and beyond at the public beach.
5. Model simulations show that modifying the groin field and/or installing an artificial surfing reef alters waves in the project area. Straight groins would create perturbations in the coastline and cause wave breaking in a peeling fashion favorable to surfing, but would not likely maintain the design beach width for storm protection. Altering the angle of the T-heads would reduce wave reflection off the structures during north swells from passing cold fronts. Removal of one structure at the public beach would provide an open area for surfing and other recreational opportunities. Installation of an artificial reef would have the dual benefit as a surfing resource during moderate swell events and toreduce wave energy reaching the shoreline.
6. Alternative 2 appears to be the best opportunity for balancing the storm protection attributes of the existing design with reducing surfing and beach user impacts due to the removal of one structure. The modified T-head configuration of T2 and removal T3 is expected to reduce effects on wave breaking, but will require the public beach to absorb some erosion within acceptable limits. The construction cost of implementing Alternative 2 would also be the lowest due to the installation of one less structure. This option would represent a minimization effort by the County in favor of addressing the concerns of the surfing community and other recreational beach users.
7. The permitting process is not predictable, but is expected to be lengthy and complex for any option selected. If recreational beach users and costs were not considerations, Alternative 4 would be the best option since it is represents a minor refinement to the tested design and provides the widest beach that is most similar to the permitted configuration. However, since Alternative 2 is also similar to the tested configuration and represents a minimization of the structural design to address stakeholder concerns, the permitting process should not be significantly impacted and the design would result in a beach width similar to other Pinellas County beaches.
8. Safety issues with the structures remain and should be addressed regardless of the option selected. Although Alternative 2 reduces the number of T-groins from five to four, and similarly reduces the risk for all beach visitors, inherent safety concerns will still exist. Some form of public education, oversight and signage to inform beach goers of the location and hazards associated with coastal structures should be implemented.

COASTAL PLANNING & ENGINEERING, INC.27
XI. RECOMMENDATIONS
Based on the results of the study and the findings discussed above, it is recommended that the County pursue installation of permanent structures at Upham Beach based on the conceptual layout of Alternative 2. Compared to the other options developed and evaluated in this study, Alternative 2 best meets the objectives as determined by the ranking criteria and should be the basis for the final design. This recommendation considers that Alternative 2 results in improved storm protection for upland development, maintains an average beach width consistent with other beaches in the County, addresses some concerns of the surfing community and recreational beach users, results in a lower risk to beach goers and has the lowest cost. In addition, the City of St. Pete Beach supported this recommendation in a memorandum dated November 12, 2009 (Appendix C).
The other alternatives developed as part of this analysis meet the study objectives to varying degrees and can be implemented if selected by the County. For example, if Alternative 2 does not result in a positive outcome with local stakeholders, Alternative 4 may be sought to provide a wider public beach. Likewise, an artificial reef could be implemented with any of the alternatives to provide a surfing amenity and additional coastal protection.
Upon selection of an alternative for implementation, a pre-application meeting with the Florida Department of Environmental Protection should be held. This meeting is a necessary component of the permitting process to provide preliminary information to the FDEP and solicit feedback on what may be requested to complete the application. The results of this report and the proposed project should be presented for FDEP comment and consideration. Additional modification of the conceptual design may occur as a result of the permitting process.
It is also recommended that the existing geotubes be repaired in conjunction with the upcoming nourishment project to retain sand until the permanent structures can be installed. In doing so, the County may wish to modify the existing permit to test a new configuration as part of the selected alternative. Currently, T1 and T2 are damaged and could be repaired with the modifications developed for Alternative 2. Including all the changes of Alternative 2 would require complete removal of T3 and T4 with the re-installation of one structure in the modified location, which has additional cost implications associated with moving/replacing the geotubes.
XII. REFERENCES
Aquaveo. Surface Water Modeling System. www.ems-i.com. 2008.
ASBPA 2009, The History of Pinellas County’s Federal Shore Protection Project, Field Trip Guidebook for the American Shore and Beach Preservation Association 2009 National Coastal Conference, St. Pete Beach, FL, October 2009.
Bodge, K. R., 1998. “Beach Fill Stabilization with Tuned Structures: Experience in the southeastern U.S.A. and Caribbean.” In: Coastlines, Structures and Breakwaters, N. W. H. Allsop, Ed. Thomas Teford Publishing, 1 Heron Quay, London, c. 1998 (ISBN 0-7177-2668-4); pp. 82-93.

COASTAL PLANNING & ENGINEERING, INC.28
Coastal Planning & Engineering, Inc., Pinellas County, Florida, Blind Pass Inlet Management Plan, June 1992.
Davis, R. A., Jr. (1989) Morphodynamics of the west-central Florida barrier system: the delicate balance between wave- and tide-domination. Coastal Lowlands, Geology and Geotechnology. Dordrecht, The Netherlands: Kluwer, 225-235.
Elko, N.A., Pinellas County Department of Environmental Management, Upham Beach Stabilization Project, Stakeholder Meeting #2 PowerPoint Presentation, June 1, 2009.
Elko, N.A. and D.W Mann. Implementation of Geotextile T-groins in Pinellas County, Florida, Shore and Beach, 75 (2), 2-10, 2007.
Environmental Management. http://www.pinellascounty.org/Environment/pagesHTML/coastal Mngmt/cm2200.html
Horwitz, M. and P. Wang (2009). Summary of Pinellas County Shoreline Survey Data. Coastal Research Lab, University of South Florida.
Hsu, J.R.C. and C. Evans. 1989. Parabolic Bay Shapes and Applications, Proceedings of Institution of Civil Engineers, Part 2, Thomas Telford, London, 87, 557-570.
Hsu, J.R.C.; Benedet, L.; Klein, A.H.F.; Raabe, A.L.A.; Tsai, C.-P., and Hsu, T.W., 2008. Appreciation of static bay beach concept for coastal management and protection. Journal of Coastal Research, 24(1), 198–215. West Palm Beach (Florida), ISSN 0749-0208.
NOAA, 2004. Tides Online, National Oceanic and Atmospheric Administration, National Ocean Service (NOS). http://tidesonline.nos.noaa.gov/.
Pinellas County, Blind Pass Coastal Management History. www.pinellascounty.org.
U.S. Army Corps of Engineers (1985). Pinellas County, Florida, Beach Erosion Control Project Long Key Nourishment and Breakwater General and Detail Design Memorandum.
Wang, P. and T. M. Roberts. University of South Florida, Performance of Upham Beach T-Groin Project and Its Impact to the Downdrift Beach, November 2008.
Wang, P. and T. M. Roberts. University of South Florida, Performance of Upham Beach T-Groin Project and Its Impact to the Downdrift Beach, May 2009.
P:\Pinellas\1000028 Upham Beach T-Groin Analysis Design Permitting\Report and Presentation\Upham Beach Engineering Report - FINAL_Jan10.docx