upgrades to the iss water recovery system
TRANSCRIPT

46th International Conference on Environmental Systems ICES-2016-16 10-14 July 2016, Vienna, Austria
Upgrades to the ISS Water Recovery System
Matthew J. Kayatin,1 Donald L. Carter,2 Richard G. Schunk,3 and Jennifer M. Pruitt4
NASA George C. Marshall Space Flight Center, Huntsville, Alabama 35812, USA
The International Space Station Water Recovery System (WRS) is comprised of the Water
Processor Assembly (WPA) and the Urine Processor Assembly (UPA). The WRS produces
potable water from a combination of crew urine (first processed through the UPA), crew
latent, and Sabatier product water. Though the WRS has performed well since operations
began in November 2008, several modifications have been identified to improve the overall
system performance. These modifications can reduce resupply and improve overall system
reliability, which is beneficial for the ongoing ISS mission as well as for future NASA manned
missions. The following paper details efforts to reduce the resupply mass of the WPA
Multifiltration Bed, develop improved catalyst for the WPA Catalytic Reactor, evaluate
optimum operation of UPA through parametric testing, and improve reliability of the UPA
fluids pump and Distillation Assembly.
Nomenclature
ARFTA = advanced recycle filter tank assembly
°C = degrees Celsius
CCAA = common cabin air assembly
cm = centimeter
CWO = catalytic wet oxidation
d = bed internal diameter
DA = distillation assembly
DMSD = dimethylsilanediol
FCPA = fluids control and pump assembly
h = hour
ISS = international space station
L = liter
lbm = pound, mass
µ = micro
MSFC = marshall space flight center
MTBF = mean time between failures
MF = multifiltration
mg = milligram
mhos = conductivity, siemens
η = single pass adsorption efficiency
OGS = oxygen generation system
ORU = orbital replacement unit
ppm = parts per million, mass basis
PCPA = pressure control and pump assembly
R&R = remove and replace operation
TIC = total inorganic carbon
TOC = total organic carbon
1 Aerospace Engineer, ECLS Systems, Space Systems Dept., NASA Marshall Space Flight Center/ES62 2 ISS Water Subsystem Manager, ECLS Systems, Space Systems Dept., NASA Marshall Space Flight Center/ES62 3 Team Lead, Thermal Analysis and Control Branch, NASA Marshall Space Flight Center/EV34 4 ISS UPA Design Lead, ECLS Systems, Space Systems Dept., NASA Marshall Space Flight Center/ES62

International Conference on Environmental Systems
2
TOCA = total organic carbon analyzer, located on ISS
UPA = urine processor assembly
UTAS = United Technology Aerospace Systems
VCD = vapor compression distillation
VOC = volatile organic compounds
WRS = water recovery system
WPA = water processor assembly
I. Introduction
he International Space Station (ISS) Water Recovery and Management System provides potable water for crew
drinking and hygiene activities, oxygen generation, urinal flush water, and various payloads. To this end,
wastewater is collected in the form of crew urine, humidity condensate, and Sabatier product water, and subsequently
processed by the Water Recovery System (WRS) to potable water quality standards. This product water is provided
to the potable bus for the various users, and is stored in water bags for future use when the potable bus needs
supplementing. The WRS is comprised of the Urine Processor Assembly (UPA) and Water Processor Assembly
(WPA), which are located in two International Standard Payload Racks named WRS-1 and WRS-2 as shown by Figure
1. This hardware was delivered to ISS on STS-126 on November 14, 2008 and initially installed in the US Lab module.
On February 18, 2010, the racks were transferred to their permanent home in the Node 3 module. The layout of the
two WRS racks is as shown in Fig. 1, along with the Oxygen Generation System (OGS). The WPA is packaged in
WRS Rack 1 and partially in WRS Rack 2, linked by process water lines running between the two racks. The
remaining portion of WRS Rack 2 houses the UPA. Detailed process descriptions and schematics of the entire WRS
are provided by Pruitt et al. (2015)1 and by Carter et. al (2015)2. In addition, Ref. 1 provides detailed information
regarding recent ISS WRS upgrade efforts.
A notable change to WRS-2 was made in 2016 to improve accessibility and urine brine transfer operations to and
from the Advanced Recycle Filter Tank Assembly (ARFTA). A new door was installed on WRS-2 that includes a
three-way valve to fill, drain, or process the installed ARFTA tank without having to remove it from the rack.
T
Figure 1. International Space Station Regenerative ECLSS Racks and process flows for the OGS and
WRS.

International Conference on Environmental Systems
3
II. Multifiltration Bed Lifetime Extension Testing
The WPA Multifiltration (MF) Beds comprise a significant resupply mass as required to support system operation.
This resupply penalty is currently augmented because of the emergence of dimethylsilanediol (DMSD) in the WPA
wastewater stream which necessitates replacement of both MF Beds more frequently than their nominal design
lifetime.2,3 Ultimately, DMSD saturates the entire WPA system, is incompletely oxidized by the catalytic reactor, and
therefore degrades the product water purity as indicated by the ISS Total Organic Carbon Analyzer (TOCA). There is
an ongoing design effort to address DMSD by removing it from the cabin air stream entering the ISS Common Cabin
Air Assembly (CCAA) and thus preventing contamination of the condensing heat exchanger located within.4 Node 1
air scrubbers were installed in ISS on May 12, 2015 and demonstrated that activated charcoal (Cabot GCA48) was
capable of reducing detectable airborne siloxane levels; the influence on product water quality remains to be seen.
Assuming that an engineering solution to controlling DMSD contamination will be successfully implemeneted,5 the
lifetime of the MF Beds can theoretically be extended by employing a change in their operational approach and
frequency of R&R, as described within.
The MF Beds utilize adsorption and ion exchange media to remove the majority of dissolved contaminants from
the WPA wastewater stream. Ideally, once the 1st MF Bed is expended (as indicated by conductivity breakthrough),
the 2nd MF Bed is moved into the 1st position and a fresh MF Bed is placed in the now vacant 2nd location. As designed,
the MF beds are layered to specifically ensure ionic breakthrough occurs before non-volatile organic chemical
breakthrough. Operating in this manner, only volatile organic compounds (VOC) pass through to the downstream
catalytic reactor where they are ideally oxidized to primarily acetate and/or bicarbonate. Recognizing that these
reactor products are identical to species the MF Beds remove, and comprise a substantial portion of the wastewater
ionic load, it follows that allowing these species to break through the MF Beds and enter the catalytic reactor may
extend MF Bed life and therefore reduce upmass. Initial testing at MSFC with a full-scale development catalytic
reactor, Item 9503 of the Development Water Processor Package, P/N SVSK118440-1, demonstrated that typical
bicarbonate and acetate levels in a saturated MF Bed effluent were within the reactor’s oxidation capacity for a process
Ersatz feed.7 Ultimately, the careful characterization of the MF Bed breakthrough products (sequence of breakthrough
species, process conductivity) is required to determine both the viability and operational approach for allowing
bicarbonate, acetate, and potentially ammonium to saturate one or both MF Beds prior to bed replacement.
To this end, ground testing at MSFC was conducted with two, in series, one-half scale flight MF Beds having a
modified sorbent media layering design. The beds were challenged with 17,771 lbm of total Ersatz water throughput
and simultaneously monitored with process effluent conductivity sensors. Additional water sampling was done to
characterize process pH, total organic carbon (TOC), total inorganic carbon (TIC), off-line conductivity, and ion
chromatography (cations & anions) throughout the test duration for both bed effluent streams. The Ersatz water
formulation was developed under ISS Program Office CR013322 and described by Rector et al. (2014).6 This
formulation includes 22 mg/L of DMSD and testing at MSFC included the methanol hydrolysis byproduct (15.3 mg/L)
from the dimethoxydimethylsilane precursor. All Ersatz water process tanks were quality controlled by the MSFC
ES62 Chemistry Laboratory to verify matching (± 10%) the theoretical TOC target of ≈ 56 ppm and the conductivity
target of 170 µmho/cm. In order to facilitate acetate breakthrough, the flight layering was be modified to remove
Amberlite® IRN-77 and Amberlite® IRN-67. Additionally, Ambersorb® 4652 replaced the obsolete Barnebey-Cheney
580-26 activated charcoal layer. Table 1 displays the resin volumes loading into each one-half scale bed at MSFC.
Resin layers were separated by floating PTFE pucks with fine mesh retaining screens to allow for bed expansion or
contraction during the test duration. Each half-scale bed was comprised of an aggregate of three media canisters of
3.3125 inch diameter.2 The flight water flowrate of 13 lbm/h was adjusted up to 15.6 lbm/h to preserve superficial
velocity in the half-scale beds in accordance with Eq. 1.
����������
��� ���� = 1.21 (1)
Table 1. MF bed media type, volume, and orientation required for a single, one-half scale
developmental MF bed. ǂBased on 580-26 bed volume.
Media Type Bulk Density
[g/L]
Volume
[in3]
Volume
[cm3] Flow Orientation
Amberlite® IRN-150 690 462 7,570.8 TOP / OUTLET
↑
BOTTOM / INLET
Ambersorb® 4652 400 252ǂ 4,129.5
SUM 714 11,700

46th International Conference on Environmental Systems ICES-2016-16 10-14 July 2016, Vienna, Austria
A. Process Conductivity Trends
Based on the 5 pairs of MF Beds used on ISS, the first flight MF Bed experiences initial breakthrough (presumably
due to bicarbonate) of 10 µmhos/cm after an average of approximately 3,200 L of throughput (see Appendix, Figure
A1). The actual throughput to achieve breakthrough of acetate and ammonium is unknown because MF Bed
replacement has always occurred prior to these events. Based on an average mass of Ersatz throughput of 125 lbm per
test day (56.7 L/day), it was anticipated that initial breakthrough would occur after approximately 28 test days for the
first half-scale developmental aggregate MF Bed. As shown by Fig. 2, the initial onset of process conductivity rise
was observed on day 56 after 6,897 lbm (3,128 L) of Ersatz water throughput. Remarkably, when considering scale,
this was approximately twice as long as compared to the flight beds (i.e. nearly equivalent volume throughput) at less
than one half the total ion exchange resin volume. Recall that the media layering on orbit differs from the half-scale
test bed. The full-scale ISS MF Beds each contain a total of 924 in3 of IRN-150 plus additional volumes of ion
exchange resins (IRN77 & IRA67). The half-scale developmental beds contain only IRN-150 and were packed with
one half the in-flight volume (462 in3). This result suggests that either the ion exchange capacities are significantly
varied between flight and ground test beds (unlikely for such a large discrepancy of < 50%) or the ersatz formulation
does not fully characterize the ionic load in ISS wastewater. ISS wastewater samples (US) showed TIC levels (µ ± σ)
on the order of 21.5 ± 9.7 mg/L with a mean pH of 7.1. The bicarbonate level in the test Ersatz water was consistent
with this load at 23.15 mg/L. Examining all TIC sources in the wastewater further we find little experimental evidence
of elevated, unaccounted TIC. Due to the low pH of pretreated urine and process conditions in the distillation assembly
(32 mm Hg; 85°F) it was expected that dissolved CO2 would be degased from solution. Indeed, ground testing of
urine distillate showed a TIC level on the order of 5 mg/L at pH ~3.4. In addition, analyzed humidity condensate
samples (US) returned from flight contained TIC levels (µ ± σ) of 33.8 ± 13.8 mg/L with a mean pH of 7.3. This is
also consistent with the Ersatz load. However, recent theoretical predictions of pH dependent humidity condensate
loading by Perry and Kayatin (2016) indicate inconsistencies between expected and measured grab sample TIC levels.8
Considering the ISS partial pressure of 3.5 mm Hg CO2 (~ 8,000 mg/m3) much more TIC is predicted than observed
by grab sample analysis. In fact, at an average pH of 7.3 the condensate, the TIC load for 8,000 mg/m3 cabin CO2 is
predicted to be on the order of 70 – 75 mg/L (see Fig. 7b in Ref. 8). This discrepancy may be due to both the differences
in CO2 solubility in the cold condensate (4.4°C) as well as losses occurring from the sampling, storage environment
(ambient temp.), and sample transit (e.g. permeation effects). Given the apparent inherent inaccuracy associated with
analysis of TIC (which includes dissolved carbon dioxide, bicarbonate, and carbonate), it is credible that significantly
more bicarbonate is present in the ISS wastewater, resulting in earlier breakthrough on ISS.
Figure 2 displays the test stand in-line process conductivity sensor data for both half-scale MF Beds. All process
conductivity data shown are representative of the daily final 100 lbm tank averages. The inlet conductivity was
remarkably consistent over the test lifetime averaging 173.7 ± 3.8 µmhos/cm. Highlighted are test days showing onset
of ion breakthrough, the corresponding conductivity, and the cumulative mass throughput the system at that time. Bed
#1 exhibited two conductivity plateaus each having an average magnitude of 10.51 µmhos/cm (6 test day duration)
and 35.58 µmhos/cm (6 test day duration), respectively. Bed #2 exhibited two conductivity plateaus each having an
average magnitude of 9.46 µmhos/cm (3 test day duration) and 27.31 µmhos/cm (20 test day duration), respectively.
Scatter in the beginning of the 2nd plateau (~30 µmhos/cm) for Bed #2 were believed to be from the intermittent test
stand operation over this time.
Flight process conductivity trends and water throughput are shown in Appendix A. The duration of the 1st
conductivity plateau was on the order of 1,500 L (~ 3,315 lbm) for MF Bed S/N 00009 starting with the 03/13 onset in
conductivity rise. This plateau was not allowed to extend to complete breakthrough before flight bed change out,
however, so this should be considered a lower approximate limit for its true duration. The duration of the first
conductivity plateau for the half-scale Bed #1 (Fig. 2) was approximately 1,130 lbm (510 L). This onset appears less
sharp or of longer duration (3-4 test days) than the flight MF Bed data but analysis shows they are similar in length
based on volume of water throughput. Comparing the duration of the flight and ground test beds, it appears that the
length of the ground test bed duration is of reasonable magnitude. Unfortunately, since the true duration of the flight
plateau is unknown, the conclusions that can be drawn by comparison are limited. As discussed in subsequent sections,
the length of the ground test bed plateau would ultimately be determined by the Ersatz water formulation closely
matching acetate ion loads with flight loads.
Note that influent to Bed #2 is subject to the breakthrough history of Bed #1 and thus the profiles of the two beds
do not match (Fig. 2). It was anticipated that Bed #2’s cumulative capacity for the breakthrough products of Bed #1
would be reduced and reflected in the conductivity profile. Indeed, the capacity for TIC was reduced as shown by the
short 1st plateau. Conversely, the 2nd conductivity plateau for Bed #2 was much longer. As shown in subsequent

International Conference on Environmental Systems
5
sections, the ion profile during this plateau does not exactly match Bed #1, and this must be taken in to consideration
when interpreting results. It is noteworthy that the off-line, lab analyzed sample conductivity data for both
developmental MF beds matched the in-line process conductivity sensor data trends well. Also, the 1st conductivity
plateau of Bed #2 was so short that only one sample was captured for lab analysis resulting from the weekly (every 5
test days) sampling schedule.
B. Bed #1 Effluent Characterization
Figure 3 overlays the Bed #1 conductivity, major ion species, and pH correlations throughout breakthrough for the
first 100 test days. The bed breakthrough profile was accompanied by a decrease in process pH over the 1st and 2nd
conductivity plateaus before increasing upon complete ion breakthrough. Analysis of the major ionic constituents
indicated the initial pH drop was first due to the breakthrough of dissolved TIC (pH dependent equilibrium of
bicarbonate and carbonic acid)8, followed next by acetate (acetic acid). These two ions emerge as the main constituents
in the 1st and 2nd conductivity plateaus. The onset of the final conductivity breakthrough was due to the additional
breakthrough of the ammonium ion which also was accompanied by an increase the process pH. Potassium was the
last major constituent to emerge over this period. It appears after complete ion breakthrough the effluent stream pH
remained steady at approximately 7.7.
Figure 2. MF test stand in-line process conductivity sensor data for both half-scale MF Beds.
Conductivities and mass cumulative Ersatz water throughput are shown at the onset of each
breakthrough event. Average total daily mass throughput was 125 lbm of Ersatz water.
0
20
40
60
80
100
120
140
160
180
200
0 10 20 30 40 50 60 70 80 90 100 110 120 130 140 150
Pro
cess
Co
nd
uct
ivit
y, µ
mh
os/
cm
Test Day
Bed #1
Bed #2
Day 56: 0.95 µmhos/cm; 6,897 lbm
Day 65: 20.71 µmhos/cm; 8,031 lbm
Day 72: 58.46 µmhos/cm; 8,831 lbm
Day 114:
1.99 µmhos/cm;
14,014 lbm
Day 119:
31.03 µmhos/cm;
14,644 lbm
Day 139:
44.01 µmhos/cm;
17,145 lbm

International Conference on Environmental Systems
6
Figure 4 displays the complete Bed #1 breakthrough ion species profile. By stacking the cumulative ion data for
each test day, ion breakthrough waves were observed. Overshooting waves were observed for TIC, acetate,
ammonium, and to a lesser extent, calcium, sodium, and fluoride, indicating that these species were likely pushed off
the bed by more strongly associating ions. Samples on Test Days 59 and 60 were taken within the 1st conductivity
plateau and confirm the first species to break through was TIC. The next ion to breakthrough was acetate and,
combined with the inorganic carbon, appeared to comprise the majority of the 2nd conductivity plateau shown on Test
Day 65. Near the onset of the 3rd and final conductivity breakthrough rise (Day 70), sodium and ammonium appear
at levels of 0.78 ppm and 2 ppm, respectively. Calcium, potassium, chlorine, and fluorine were detected at levels ≤
0.5 ppm (Day 70). The plot shows that the largest contributor to the 3rd and final conductivity plateau were chloride,
potassium, and ammonium. Although subjective, the general trend in appearance of ion breakthrough can be
summarized as: TIC > acetate > ammonium > sodium ≈ fluoride ≈ calcium > potassium > chloride. Iodide (0.198
mg/L) was not analyzed in the test effluent. Due to its ion radius, it was assumed that iodide may be irreversibly
adsorbed, or below detection, while exchanging within the current Ersatz formulation.
Figure 3. Bed #1 breakthrough conductivity, major ion species, and pH correlations for first 100 test
days. All data are representative of aliquots sampled on the test day indicated and analyzed off-line
by the MSFC ECLSS Chemistry Lab.
0
20
40
60
80
100
120
140
160
180
0
2
4
6
8
10
12
14
40 50 60 70 80 90 100
Ion
Co
nce
ntra
tion
, pp
m &
Co
nd
uctiv
ity, µm
ho
s/cm
pH
Test Day
pH
Conductivity
TIC
Acetate
NH4
K

International Conference on Environmental Systems
7
Figure 5 displays the MF Bed #1 total organic carbon breakthrough profile and single-pass adsorption efficiency.
Single-pass adsorption efficiency was defined in accordance with Eq. 2.
� =��� ��������
��� �× 100% (2)
The inlet TOC was remarkably consistent over the test lifetime averaging 55.2 ± 3.6 ppm. Overall, the trend in
adsorption efficiency decreased over time, as expected for a gradual saturation of the Ambersorb activated carbon
spheres. There was a noticeable dip in the adsorption efficiency beginning around Test Day 65 and continuing through
Test Day 95. Overlaid with the TOC data is the Bed #1 conductivity trend data. The apparent drop in adsorption
efficiency was attributed to the superposition of ion breakthrough, most notably the organic acetate ion rather than
any organic desorption from the carbon itself. In summary, the Ambersorb in Bed #1 displayed an efficiency of
approximately 55% at test start and this dropped to 30% at test end (17,771 lbm Ersatz water).
Figure 4. Bed #1 breakthrough ion characterization profile. All data are representative of aliquots
sampled on the test day indicated and analyzed off-line by the MSFC ECLSS Chemistry Lab.
0
20
40
60
80
100
120
140
160
180
0
20
40
60
80
100
56
59
60
65
70
73
74
75
80
85
90
95
10
01
05
11
0
11
41
15
11
71
19
12
01
25
13
01
35
13
91
40
14
4
Co
nd
uctiv
ity, µm
ho
s/cmIo
n C
on
cen
tra
tio
n,
pp
m
Test Day
Conductivity TIC Acetate Cl K NH4 Na F Ca

International Conference on Environmental Systems
8
C. Bed #2 Effluent Characterization
Figure 6 displays the overlaid conductivity, ion species, and pH breakthrough correlations for Bed #2. Note that
the 1st plateau of Bed #2 was so short-lived (see Fig. 2) that only one sample was collected on Day 117. In addition,
lab samples measured by conductivity dip probe on days 100 through 110 were higher than believed to be if measured
using a flow cell (liquid junction artifact) and should not be confused with the 1st breakthrough plateau. The bed
breakthrough profile was accompanied by a decrease in process pH over the 1st and 2nd conductivity plateaus before
slightly increasing upon complete ion breakthrough. Analysis of the major ionic constituents indicated the initial pH
drop was first due to the breakthrough of dissolved TIC followed closely by acetate. These two contaminants emerge
as the main constituents in the 1st and 2nd conductivity plateaus, respectively. The onset of the final conductivity
breakthrough was delayed as compared to Bed #1. As compared to Fig. 2 and Fig. 3, the duration of the 2nd plateau
was increased for Bed #2 lasting approximately 2,500 lbm of throughput versus only 750 lbm for Bed #1. A slight
increase in ammonium was observed which appeared to slightly increase the process pH. The test program was
terminated before complete ion breakthrough was completed.
The process influent to Bed #2 was not representative of the true Ersatz conductivity until at least Test Day 74
(9,083 lbm). This puts the mass throughput until the initial breakthrough on Test Day 114 at 4,931 lbm which is reduced
as compared to Bed #1 at 6,897 lbm. This discrepancy can be rationalized by observing that prior to Test Day 74, the
breakthrough products from Bed #1 fed a low conductivity process stream into Bed #2 which included 353 lbm at a
mean load of 74 µmhos/cm (TIC, acetate & ammonium), 1,205 lbm at 33.5 µmhos/cm (TIC and acetate), and 1,043
lbm at 10.5 µmhos/cm (TIC). The persistent presence of TIC in the Bed #2 feed over this initial 2,600 lbm of
breakthrough prior to Test Day 74 explains the observed short lived 1st plateau. The extension of the 2nd plateau must
be related to the delayed breakthrough of ammonium and is also likely related to the varied influent history of Bed #2.
Figure 4. Bed #1 total organic carbon breakthrough profile and single-pass adsorption efficiency. All
data are representative of aliquots sampled on the test day indicated and analyzed off-line by the
MSFC ECLSS Chemistry Lab.
0
20
40
60
80
100
120
140
160
180
200
-10
0
10
20
30
40
50
60
70
0 20 40 60 80 100 120 140
Co
nd
uctiv
ity, µm
ho
s/cmT
OC
, p
pm
& A
dso
rpti
on
Eff
icie
ncy
, %
Test Day
TOC, In
TOC, Out
Efficiency
Conductivity
Additional effluent TOC from
Acetate breakthrough

International Conference on Environmental Systems
9
Figure 7 displays the complete profile of the Bed #2 breakthrough ion species showing inorganic carbon as the 1st
major breakthrough species (Day 117) followed by acetate (Day 119). Note, TIC was not analyzed in Test Day 136
and is therefore absent form Fig. 7. During the 1st conductivity plateau, calcium, sodium, and fluoride were detected
at levels ≤ 0.5 ppm. Detailed analysis results are given in Table A2 and discussed further below. Additionally, trace
levels of chloride were observed in the 2nd conductivity plateau. Sulfate appears near the final breakthrough. Similar
to Bed #1, ammonium was the primary breakthrough product for the final conductivity rise.
Figure 6. Bed #2 breakthrough conductivity, major ion species, and pH correlations. All data are
representative of aliquots sampled on the test day indicated and analyzed off-line by the MSFC ECLSS
Chemistry Lab.

International Conference on Environmental Systems
10
Figure 8 displays the Bed #2 total organic carbon breakthrough profile and single-pass adsorption efficiency. The
inlet TOC content to Bed #2 was dependent on the effluent from Bed #1 and therefore was comprised of any organic
carbon not readily adsorbed in the first bed but also any upstream organic acetate breakthrough. The Bed #1
breakthrough of acetate, as described by Fig. 8, was observed in the inlet to Bed #2 around Test Day 65. This caused
an artificial rise in the calculated single-pass adsorption efficiency. Similarly, breakthrough of acetate through Bed
#2 caused a large drop in the efficiency starting around Test Day 125. Overall, the trend in adsorption efficiency
decreased over time. The observed performance of Ambersorb in Bed #2 is handicapped by the fact that most of the
readily adsorbable TOC was already removed in Bed #1 leaving only lighter, less adsorbable organics influent to Bed
#2. Nevertheless the initial adsorption efficiency was approximately 20% and this dropped to 15% before the data
was skewed by Bed #2 acetate breakthrough as shown by the overlaid conductivity trend data.
Figure 7. Bed #2 breakthrough ion species characterization profile. All data are representative of
aliquots sampled on the test day indicated and analyzed off-line by the MSFC ECLSS Chemistry Lab.
0
10
20
30
40
50
60
70
80
90
0
10
20
30
40
50
60
70
80
100 105 110 114 115 117 119 120 125 130 135 136 139 140 144
Co
nd
uctiv
ity, µm
ho
s/cmIo
n C
on
cen
tra
tio
n,
pp
m
Test Day
Conductivity TIC Acetate Cl K NH4 Na F Ca PO4 SO4
TIC not analyzed for Day 136

International Conference on Environmental Systems
11
D. Multifiltration Bed Lifetime Extension Discussion
Based on the bed breakthrough characterization data presented herein, potential operational changes can be
considered. Remarkably, in allowing Bed #1 to saturate and pass all breakthrough products to Bed #2 the onset of
ammonium breakthrough in Bed #2 appeared to be delayed. By allowing MF Bed #1 to completely saturate and
breakthrough, and also operating MF Bed #2 to Test Day 136, a total of 16,770 lbm (7,606 L) of water can be processed
by the half-scale beds before R&R. In this scenario, an inorganic load consisting of predominantly TIC and acetate
(Fig. 7, Test Days 119 to 136) would be passed to the catalytic reactor. Mean residual contaminants (mg/L) over this
time-period are: TIC = 9.9 ± 1.4; Na+ = 0.30 ± 0.1; F- = 0.30 ± 0.04; Cl- = 0.20 ± 0.01; C2H3O2- = 19.4 ± 7.1. Ions not
listed had mean values ≤ 0.1 mg/L. The TOC over this time was 39.7 ± 4.6 ppm. The bed should be pulled at first
sign of the next conductivity rise due to threat of sulfates (~ 0.35 mg/L) reaching the catalyst. It therefore follows that
testing be conducted with an Ersatz water load representative of these specific test days on the developmental catalytic
reactor at MSFC. For conservatism, mean plus one standard deviation Ersatz loads are recommended for this
evaluation. Note that this reactor contains the same quantity of flight catalyst as that employed in the ISS WPA, and
was manufactured per the same process by the supplier, United Technologies Aerospace Systems (UTAS). While the
reactor might have capacity for the ammonium load, the presence of many other inorganic species during the final
breakthrough trend makes allowing these products to pass downstream unattractive. Should some ammonium reach
the reactor it is important to consider the potential implications for the process and for the spacecraft product water
and air quality.
The catalytic wet oxidation (CWO) of ammonia is of practical importance for remediation of toxic industrial
wastewaters (see Ref. 9 and citations within).9 In specific, complete selective oxidation to form molecular nitrogen is
desired. In general, CWO of ammonia requires harsh temperatures and pressures to proceed and has been
characterized as very slow without a catalyst (see Ref. 10, 11 and included citations).10,11 Fortunately, varied catalyst
Figure 8. Bed #2 total organic carbon breakthrough profile and single-pass adsorption efficiency. All
data are representative of aliquots sampled on the test day indicated and analyzed off-line by the
MSFC ECLSS Chemistry Lab.

International Conference on Environmental Systems
12
formulations have shown certain Group 8-10 elements (VIIIB), such as Ruthenium, exhibit high activity.10 CWO has
been achieved at temperatures and pressures comparable to the WPA and is pH sensitive.9 Ammonia oxidation is
enhanced at high pH due to favorable reaction kinetics of ammonia over ammonium.10 This pH effect is apparent
from studying the mechanism proposed by Lee et. al (2005) wherein molecular ammonia must be present to form
nitrite (via intermediate nitrous acid dissociation) which in turn can then react with ammonium to molecular nitrogen.9
In considering any potential ECLSS impacts associated with such an operational change, there is concern that reaction
intermediates, like nitrite (NO2-) may persist and possibly evolve nitrogen oxides (NOx) in the vapor phase. Nitrite
may only be formed, however, by a cascade of reactions in which nitrous acid is formed from dissolved molecular
ammonia. As shown by Fig. 6, this is not the case for the Bed #2 effluent where the pH averaged around 4.3 near
breakthrough. At room temperature, the ammonium fraction is near unity for this pH.8 Furthermore, if oxygen is in
excess, such as in the WPA, then additional oxidation of any nitrite to nitrate (but also decreases N2 yield) should
further alleviate concerns of NOx evolution.9 Finally, the reaction of nitrite with ammonium (present in excess to any
ammonia) to molecular nitrogen is also kinetically favored. Therefore, the permission of ammonium to the catalytic
reactor may be acceptable but testing should be carried out to characterize the reactor product dissolved/evolved
species and well as effluent pH.
III. WPA Ambient Catalyst Development
In response to a competitive RFP released in April 2014 titled “ISS Water Processor Assembly Ambient Catalytic
Reactor Catalyst Development,” contracts were awarded to two offerors (United Technology Aerospace Systems and
Umpqua Research Company) in pursuit of development of WPA catalyst with enhanced activity capable of operation
at ambient system pressures. Performance goals for effluent TOC and a required ersatz water definition were provided
by NASA MSFC for benchmarking catalyst activity. As a result of these research efforts two full-scale volumes of
catalyst will be delivered to MSFC for evaluation in 2016. Both catalyst formulations include VIIIB group element(s)
deposited on a porous support. As discussed by Ping et al. (2016), the UTAS catalyst is supported on alumina12
whereas the UMPQUA catalyst is supported on zirconia.¥2 The two supports differ based on their bulk density, surface
area, and pore/channel sizes. Alumina supports generally have one order of magnitude greater surface area than
zirconia but the higher zirconia density may offset some of this effect in a fixed volume reactor. Furthermore, the
reaction rate can be limited by diffusion of the reactants/products to and away from the support and this is enhanced
in supports with increased pore/channel sizes. However, there is a general tradeoff between increased support surface
area and decreased pore/channel size. The competing effects of each support’s physical properties will be empirically
discerned by reactor performance testing.
In order to thoroughly evaluate each catalyst’s activity and stability, performance testing and long duration testing
will be conducted. Testing on each developmental catalyst formulation will be carried out in parallel using the
Aqueous Phase Catalytic Oxidation test stand and the Thermal Catalyst Test Stand located at MSFC. Process
flowrates will be standardized (13 lbm/h Ersatz water; 0.011 lbm/h O2) and two separate challenge Ersatz water
formulations will be used for evaluation: 1) Standard Ersatz Formulation (alcohols, aldehydes, acetone, glycols; TOC
= 35.8 mg/L) and 2) Challenge Ersatz Formulation (elevated Standard Ersatz load plus formic acid and urea; TOC =
64.8 mg/L). Each catalyst will be challenged over a range of temperatures 200°F to 270°F and at both elevated (45
psig) and ambient system backpressures. Reactor effluents will be sampled and analyzed for TIC/TOC, alcohols
(including acetone), acetate, pH, and conductivity. In addition, reactor effluents will be sampled for particle size
distribution analysis. Catalyst performance testing will be carried out over 18 test days. After this time each reactor
will be left idle at 270°F and at 6 month intervals will be challenged with 12 days of performance testing utilizing
varied temperatures and pressures for each Ersatz formulation. Testing will continue until a satisfactory test duration
is achieved or until catalyst performance degradation is observed.
IV. UPA Upgrades
As of April 2, 2016, the total UPA production on ISS was 11,214 L (24,715 lbm) of distillate from crewmember
urine since initial operation in 2008. Over that time, a total Orbital Replacement Unit (ORU) mass of 4,489 lbm (2,036
kg) has operated in the UPA, including initial hardware installation, replacements of failed ORUs, and improved
hardware like the ARFTA. Overall, the UPA hardware replacement rate is currently 0.18 lbm of hardware per 1 lbm of
distillate that has produced. In the pursuit to reduce replacement rates by improving robustness, durability, and
extended life, several upgrades have been under evaluation. Once developed, these upgrades will be incorporated into
ISS UPA ORUs to collect extended performance demonstration in an operational flight environment. Successful
¥Information provided by John Holtsnider at UMPQUA Research Company.

International Conference on Environmental Systems
13
demonstrations will provide tangible life cycle cost benefits to the ISS over its remaining operational life and increase
confidence that the UPA design can meet demanding exploration mission needs.
A. Parametric Test and Thermal Model
The development of the vapor compression distillation (VCD) technology primarily occurred at Life Systems
International in the 1980’s based on an empirical test effort. Though the VCD technology has operated well on ISS,
the UPA engineering team believes performance can be improved by optimizing the system operation. To improve
the overall understanding of the system operation, a parametric test was completed to evaluate multiple operational
parameters of the VCD. These parameters include the system pressures and temperatures, motor currents, production
rate, and distillate conductivity and quality. In addition to the standard pressure and temperature instrumentation, the
DA was also outfitted with remote temperature sensors installed inside the evaporator and stationary bowl to provide
insight into the thermal transients during VCD operation.
In parallel with this effort, the MSFC Thermal Analysis and Control Branch (EV34) has developed fluids and
thermal models of the VCD using the COMSOL Multiphysics13 and Thermal Desktop14 modeling packages to
demonstrate and predict VCD performance. The models are correlated to data from the parametric test and will
ultimately be used to identify the optimal operating conditions for the VCD. In addition, the models will be used to
determine if the distillation assembly (DA) size can be reduced (either length or diameter) while maintaining
production rate and distillate quality. A COMSOL model of the DA evaporator volume is shown below in Figure 9.
A summary of findings from the evaluation of parametric test data and correlation of the VCD, Pressure Control
and Pump Assembly (PCPA) and Fluids Control and Pump Assembly (FCPA) models is presented in Table 2. Each
potential enhancement or optimization is listed with an impact evaluation and explanation. The enhancements are
parsed into three categories representing operational changes, modest hardware changes and significant hardware
changes. Operational changes could presumably be implemented on existing hardware with little to no impact (and
most were through the parametric test program).
Figure 9. DA Evaporator Model in COMSOL

International Conference on Environmental Systems
14
Table 2. Parametric Test/Model Correlation Findings
Increasing the DA motor speed for synchronous changes in compressor and centrifuge rotational speeds provided
the single biggest improvement in production rate for all enhancements considered in the parametric test program.
The production rate scaled nearly linearly with motor speed over the conditions tested. It is thought that the increased
volume throughput with motor speed (of the essentially positive displacement compressor) is directly responsible for
the improved production rates while boiling/condensation rates in the evaporator/condenser are not a limiting factor
or at least kept pace with increases in the production rate. Through correlation, the VCD system model should be able
to asynchronously optimize the compressor/centrifuge spin rates.
An interesting observation was a slight decrease in product rate with an increase in FCPA pumping rate (or recycle
loop flow rate). It is conjectured that this is evidence of a dependency on evaporator film thickness. Increased recycle
loop flow rate may increase the film thickness which may increase the boiling point due to hydrostatic influences (i.e.
weight of the film under high rotational acceleration) on pressure. Conversely, decreases in the recycle loop flow rate
may reduce film thickness thereby enhancing production rates slightly.
Changing the stationary bowl heater set-point from 130°F to 110°F had a significant impact on power consumption
with reductions up to 50%. The unit operated without incident through the heater set-point changes but one caveat is
that any accumulation of water in the stationary bowl volume was not quantified through the test.
As expected, PCPA enhancements for low temperature coolant and thermal conditioning of the purge flow from
the DA condenser provided increases in pumping performance as indicated from model predictions. Increasing the
PCPA pumping rate was not tested but could be predicted as well using the detailed PCPA model.
Analysis indicates that geometric resizing of the DA evaporator should be possible when accompanied by
proportional changes in centrifuge speed. No disqualifying impacts or disturbance in the flow field from the boiling
surface to vapor exiting through the demister were observed in the analysis for the cases studied. The most significant
impact to modest changes in the evaporator diameter may be increases in centrifuge rotation to maintain production
rate over the reduced boiling area.

International Conference on Environmental Systems
15
B. FCPA and PCPA Valve Design
There are 3 valves that change fluid direction on the FCPA manifold. The old valve design included a static preload
on the valve packing that was found to decay during thermal cycle environmental testing, requiring more
manufacturing time. These valves would historically spend a minimum of 20 days in an iterative assembly process to
incrementally achieve the desired preload. In order to reduce manufacturing time and create a more reliable preload,
all newly assembled FCPAs include an improved packing preload design. The design added Belleville washers to
maintain a dynamic preload on the valve packing, thereby removing the iterative nature of the test sequence and make
the packing more reliable against cold flow. As of April 2016, four FCPAs have been successfully assembled with the
improved valve design. Of these, SN004 has been installed on ISS with no performance issues observed.
C. FCPA and PCPA Drive Train
Over the life of UPA on ISS, FCPA operational life had been drastically reduced compared to the originally
predicted lifespan and end of life failure of peristaltic tube wear-out. The majority of FCPA failures have been
attributed to failures with the drive train. FCPA and PCPA designs have used the same harmonic drive train design,
though they are operated at different speeds. All PCPA failures on ISS have been related to burst tubing, which is the
expected failure for the peristaltic pumps. In contrast, the FPCAs were historically failing after an average of 600
operating hours on ISS, which is only approximately 4 months for a 6-crew urine load. It is unclear why the drive train
issues have been seen so frequently in the FCPA, but not in the PCPA. Due to the frequent failures, the FCPA Mean
Time Between Failures (MTBF) was reduced from the expected 8,760 operating hours to the historically averaged
600 operating hours.
To increase FCPA life and reliability, a new drive train was implemented and tested at MSFC. This new design is
the planetary gear drive train, which requires less precision during assembly and operation to maintain functionality.
Though the harmonic drive is good for precision applications, the planetary gear is more advantageous for power
transfer situations such as the UPA peristaltic pumps. The new design was first evaluated in the FCPA used in the
UPA development test bed for 2,400 hours, which is four times the MTBF established for the FCPA on ISS. The first
FCPA implementing the planetary gear design was installed on ISS in October 2016 with FCPA SN004. As of March
30, 2016, FCPA SN004 has operated for 593 hours with nominal performance and lower current drawn that the
previous design. Unfortunately, the ground unit failed after 3,223 hours of operation and 657 on/off cycles. The failure
investigation is ongoing, but at this time it is not expected that the planetary gear design is the root cause.
D. DA O-ring Belt
Rotation of the DA is currently driven by an O-ring belt (Figure 10). However, there is an ongoing risk of the belt
slipping during operation due to the steam environment in the DA. The risk is greatest at the beginning of a process
run, since the steam has time to condense as the DA cools between processing. Belt slippage at startup has been
consistently observed in UPA operations on ISS. In February 2016, DA SN002 experienced a failure when the belt
slipped during a process cycle, causing the centrifuge speed to fall. Attempts to recover the DA operation were
unsuccessful at achieving more than 30 minutes of operation. As a result, the DA SN002 was replaced at only 30% of
expected life.
The failed unit will return to MSFC in the summer of 2016 for evaluation of the hardware. However, this belt was
already on the list of upgrades to the system. Before the belt slip failure, the UPA had shown indications of water in
the stationary bowl, which is known to happen during nominal UPA operation. The heaters around the stationary bowl
volume were added to the design to evaporate the water back into the condenser and prevent it from accumulating in
the stationary bowl. However, as the condensate forms in the stationary bowl, droplets may form and reach the o-ring
drive belt. Ground tests have shown that only a drop of water is required to cause the belt to slip.
To improve the drive belt reliability in this environment, two design options are under consideration. A belt with
teeth (such as a Gates belt design) would provide a more robust design, but would also require improved timing to
insure the teeth properly interface with both pulleys. This will be challenging since the pulleys have different
diameters. Another more achievable design solution is with a v-type belt. This design change was also previously
evaluated, resulting in the conclusion that a tensioner would be required to insure proper function. At the time, this
approach was not considered viable due to the limited space available for the tensioner location. Incorporation of this
technology would drive an enlargement of the DA, which was considered an unacceptable option. With the new
information gleaned from the parametric testing regarding DA resizing, both of these design options are now under
consideration.

International Conference on Environmental Systems
16
V. Conclusion
Though the initial operation of the WPA and UPA on ISS has been acceptable, improvements are highly desirable
to optimize their performance on ISS and position them for use on future missions. The WPA improvements focus on
reducing the resupply penalty for the WPA MF Beds and improving system reliability through the use of an improved
catalyst that can operate at ambient pressure. UPA improvements are solely focused on improving system reliability
by addressing known design issues currently identified from operation on ISS and manufacturing processes.
Successful implementation of these upgrades will position the WPA and UPA technologies for optimum performance
on ISS and execution in future manned mission beyond ISS.
Figure 10. DA O-ring Belt

International Conference on Environmental Systems
17
Appendix
Figure A1. Flight MF Bed Data showing process conductivity and throughput.
International Conference on Environmental Systems
18
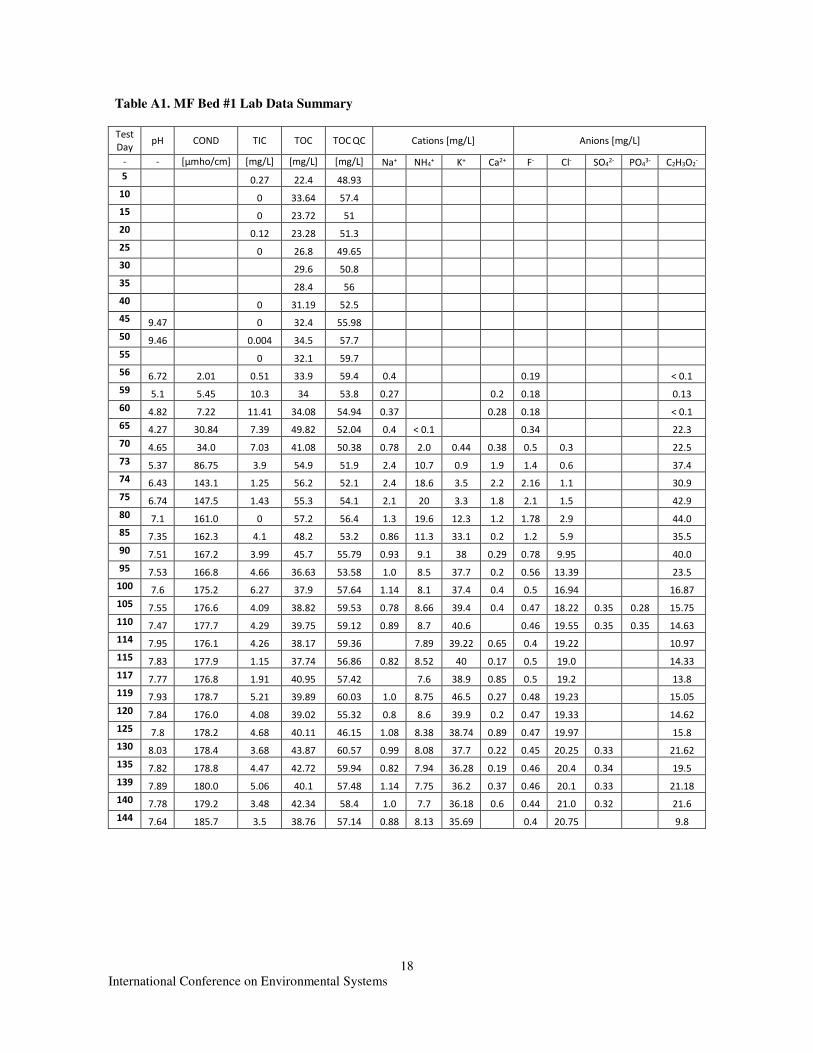
Table A1. MF Bed #1 Lab Data Summary
Test
Day pH COND TIC TOC TOC QC Cations [mg/L] Anions [mg/L]
- - [µmho/cm] [mg/L] [mg/L] [mg/L] Na+ NH4+ K+ Ca2+ F- Cl- SO4
2- PO43- C2H3O2
-
5 0.27 22.4 48.93
10 0 33.64 57.4
15 0 23.72 51
20 0.12 23.28 51.3
25 0 26.8 49.65
30 29.6 50.8
35 28.4 56
40 0 31.19 52.5
45 9.47 0 32.4 55.98
50 9.46 0.004 34.5 57.7
55 0 32.1 59.7
56 6.72 2.01 0.51 33.9 59.4 0.4 0.19 < 0.1
59 5.1 5.45 10.3 34 53.8 0.27 0.2 0.18 0.13
60 4.82 7.22 11.41 34.08 54.94 0.37 0.28 0.18 < 0.1
65 4.27 30.84 7.39 49.82 52.04 0.4 < 0.1 0.34 22.3
70 4.65 34.0 7.03 41.08 50.38 0.78 2.0 0.44 0.38 0.5 0.3 22.5
73 5.37 86.75 3.9 54.9 51.9 2.4 10.7 0.9 1.9 1.4 0.6 37.4
74 6.43 143.1 1.25 56.2 52.1 2.4 18.6 3.5 2.2 2.16 1.1 30.9
75 6.74 147.5 1.43 55.3 54.1 2.1 20 3.3 1.8 2.1 1.5 42.9
80 7.1 161.0 0 57.2 56.4 1.3 19.6 12.3 1.2 1.78 2.9 44.0
85 7.35 162.3 4.1 48.2 53.2 0.86 11.3 33.1 0.2 1.2 5.9 35.5
90 7.51 167.2 3.99 45.7 55.79 0.93 9.1 38 0.29 0.78 9.95 40.0
95 7.53 166.8 4.66 36.63 53.58 1.0 8.5 37.7 0.2 0.56 13.39 23.5
100 7.6 175.2 6.27 37.9 57.64 1.14 8.1 37.4 0.4 0.5 16.94 16.87
105 7.55 176.6 4.09 38.82 59.53 0.78 8.66 39.4 0.4 0.47 18.22 0.35 0.28 15.75
110 7.47 177.7 4.29 39.75 59.12 0.89 8.7 40.6 0.46 19.55 0.35 0.35 14.63
114 7.95 176.1 4.26 38.17 59.36 7.89 39.22 0.65 0.4 19.22 10.97
115 7.83 177.9 1.15 37.74 56.86 0.82 8.52 40 0.17 0.5 19.0 14.33
117 7.77 176.8 1.91 40.95 57.42 7.6 38.9 0.85 0.5 19.2 13.8
119 7.93 178.7 5.21 39.89 60.03 1.0 8.75 46.5 0.27 0.48 19.23 15.05
120 7.84 176.0 4.08 39.02 55.32 0.8 8.6 39.9 0.2 0.47 19.33 14.62
125 7.8 178.2 4.68 40.11 46.15 1.08 8.38 38.74 0.89 0.47 19.97 15.8
130 8.03 178.4 3.68 43.87 60.57 0.99 8.08 37.7 0.22 0.45 20.25 0.33 21.62
135 7.82 178.8 4.47 42.72 59.94 0.82 7.94 36.28 0.19 0.46 20.4 0.34 19.5
139 7.89 180.0 5.06 40.1 57.48 1.14 7.75 36.2 0.37 0.46 20.1 0.33 21.18
140 7.78 179.2 3.48 42.34 58.4 1.0 7.7 36.18 0.6 0.44 21.0 0.32 21.6
144 7.64 185.7 3.5 38.76 57.14 0.88 8.13 35.69 0.4 20.75 9.8

International Conference on Environmental Systems
19
Table A2. MF Bed #2 Lab Data Summary
Test
Day pH COND TIC TOC
TOC
Bed
#1
Cations [mg/L] Anions [mg/L]
- - [µmho/cm] [mg/L] [mg/L] [mg/L] Na+ NH4+ K+ Ca2+ F- Cl- SO4
2- PO43- C2H3O2
-
30 24.0 29.6
35 23.2 28.4
40 0 23.56 31.19
45 0 23.04 32.4
50 0.04 24.1 34.5
55 0.36 21.1 32.1
56 0.36 21.09 33.9
60 0.2 28.0 34.08
65 0.09 41.54 49.82
70 0 22.06 41.08
73 0 22.96 54.9
74 0 21.9 56.2
75 0.04 22.5 55.3
80 0 29.53 57.2
85 0.43 26.02 48.2
90 0 29.5 45.7
95 0 27.3 36.63
100 4.5 5.8 0.37 31.1 37.9 0.24 0.2 0.18 0.19
105 8.1 2.14 0 33.69 38.82 0.13 0.47 0.19 < 0.1
110 7.36 1.74 0 33.67 39.75 0.38 0.18 < 0.1
114 6.47 2.29 0 32.86 38.17 0.18 0.13
115 5.76 3.76 1.15 31.89 37.74 0.32 0.4 0.2 0.22
117 5.03 7.34 11.6 31.03 40.95 0.31 0.34 0.2 0.2
119 4.41 25.45 8.59 40.27 39.89 0.25 0.37 0.28 17.57
120 4.47 21.01 10.87 34.85 39.02 0.25 < 0.1 0.27 11.85
125 4.5 20.0 11.7 35.06 40.11 0.4 0.26 11.3
130 4.38 26.2 8.41 44.33 43.87 0.49 < 0.1 0.34 0.2 0.36 28.28
135 4.19 29.09 10.05 43.96 42.72 0.1 < 0.1 0.28 0.21 0.34 25.8
136 29.09 0.21 < 0.1 0.14 0.28 0.2 0.32 21.4
139 4.93 54.66 7.54 49.33 40.1 1.75 7.68 0.28 0.2 0.63 0.34 36.6
140 5.13 69.94 4.79 54.56 42.34 1.75 7.68 0.28 0.2 1.2 0.35 48.11
144 5.4 87.54 3.05 51.29 38.76 1.74 12.24 0.7 1.9 1.6 0.3 40.77

International Conference on Environmental Systems
20
Acknowledgments
The authors would like to acknowledge the design and test engineers at MSFC that are developing and evaluating
the hardware upgrades addressed in this paper.
References 1Pruitt, J.M., Carter, D.L., Bagdigian, R.M., and Kayatin, M.J., “Upgrades to the ISS Water Recovery System,” ICES 2015-
133, 45th International Conference on Environmental Systems, Bellevue, Washington, 2015. 2Carter, D.L., Pruitt, J.M., Brown, C.A., Schaezler, R.N., and Bankers, L.A., “Status of ISS Water Management and Recovery,”
ICES 2015-073, 45th International Conference on Environmental Systems, Bellevue, Washington, 2015. 3Carter, D.L., Bowman, E.M., Wilson, M.E., Gentry, G.J., and Rector, T.J., “Investigation of DMSD trend in the ISS Water
Processor Assembly,” AIAA 2013-3510, AIAA 43rd International Conference on Environmental Systems, Vail, Colorado, 2013. 4Carter, D.L., Perry, J.L., Kayatin, M.J., Wilson, M.E., Gentry, G.J., Bowman, E.M., Monje, O.A., Rector, T.J., and Steele,
J.W., “Process Development for Removal of Siloxanes from ISS Atmosphere,” ICES 2015-074, 45th International Conference on
Environmental Systems, Bellevue, Washington, 2015. 5Carter, D.L., Kayatin, M.J., Wilson, M.E., Perry, J.L., Rector, T.J., Agui, J.H., Gentry, G.J., Bowman, E.M., and Greene, R.D.,
“Design and Delivery of Filter for Removal of Siloxanes from ISS Atmosphere,” ICES 2016-015, 46th International Conference
on Environmental Systems, Vienna, Austria, 2016. 6Rector, T.J., Metselaar, C., Peyton, B.M., Steele, J.W., Michalek W., Bowman, E.M., Wilson, M.E., Gazda, D.B., and Carter,
D.L., “An Evaluation of Technology to Remove Problematic Organic Compounds from the International Space Station Potable
Water,” ICES 2014-135, 44th International Conference on Environmental Systems, Tucson, Arizona, 2014. 7D. L. Carter, "WRS-TPS-13-106," Marshall Space Flight Center, 2013. 8Perry, J.L., and Kayatin, M.J., “The Fate of Trace Contaminants in a Crewed Spacecraft Cabin Environment,” ICES 2016-
091, 46th International Conference on Environmental Systems, Vienna, Austria, 2016. 9Lee, D.K., Cho J.S., and Yoon, W.L., "Catalytic wet oxidation of ammonia: Why is N2 formed preferentially against NO3
-?."
Chemosphere, Vol. 61, No. 4, 2005, pp. 573-578. 10Qin, J., and Aika, K.. "Catalytic wet air oxidation of ammonia over alumina supported metals." Applied Catalysis B:
Environmental, Vol. 16, No. 3, 1998, pp. 261-268. 11Zhang, Q., and Chuang, K.T., "Kinetics of wet oxidation of black liquor over a Pt–Pd–Ce/alumina catalyst." Applied Catalysis
B: Environmental, Vol. 17, No. 4, 1998, pp. 321-332. 12Yu, P., Nalette, T., and Kayatin, M.J., “Development of Advanced ISS-WPA Catalysts for Organic Oxidation at Reduced
Pressure and Temperature,” ICES 2016-218, 46th International Conference on Environmental Systems, Vienna, Austria, 2016. 13COMSOL (Common Solution) Multi-Physics, www.comsol.com 14Thermal Desktop, Cullimore and Ring Technologies, www.crtech.com