updates on) naturalresourcemanagement...
TRANSCRIPT

Department of Agriculture MINDANAO RURAL DEVELOPMENT PROGRAM
Program Support Office
Department of Agriculture MINDANAO RURAL DEVELOPMENT PROGRAM
Program Support Office
as of March 15, 2013
Updates on
Natural Resource Management as of March 15, 2013
Updates on
Natural Resource Management
Department of Agriculture MINDANAO RURAL DEVELOPMENT PROGRAM
Program Support Office
Department of Agriculture MINDANAO RURAL DEVELOPMENT PROGRAM
Program Support Office

Department of Agriculture MINDANAO RURAL DEVELOPMENT PROGRAM
Program Support Office
Department of Agriculture MINDANAO RURAL DEVELOPMENT PROGRAM
Program Support Office
HIGHLIGHTS of
Financial Status as of March 15, 2013
Natural Resource Management

NATURAL RESOURCES MANAGEMENT Financial Status
YEAR 1 as of March 15, 2013
Covered LGU Project Cost (80% LP) Fund Released Liquidation Liquidation
Rate % Unliquidated (A) (B) (C) ( C/B)
RT Lim, Zambo. Sibugay 5,599,896.40 5,599,896.40 5,444,681.29 97.23% 155,215.11
Linamon, Lanao del Norte 5,600,000.00 5,600,000.00 5,455,356.57 97.42% 144,643.43 Don Marcelino, Davao Sur 5,543,999.96 5,313,810.08 5,242,837.05 98.66% 70,973.03 Kalamansig, Sultan Kudarat 5,600,000.00 5,600,000.00 5,549,637.24 99.10% 50,362.76 Nasipit, Agusan del Norte 5,600,000.00 5,600,000.00 5,590,852.06 99.84% 9,147.94 Datu Odin Sinsuat, Maguindanao 5,600,000.00 5,600,000.00 4,923,456.98 87.92% 676,543.02
T O T A L 33,543,896.36 33,313,706.48 32,206,821.19 96.68% 1,106,885.29

Department of Agriculture MINDANAO RURAL DEVELOPMENT PROGRAM
Program Support Office
Department of Agriculture MINDANAO RURAL DEVELOPMENT PROGRAM
Program Support Office
NATURAL RESOURCES MANAGEMENT
Financial Status
YEAR 2 as of March 15, 2013
Covered LGU Project Cost (80%
LP) Fund Released Liquidation Liquidation Rate % Unreleased
Funds (A) (B) (C) ( C/B)
Tungawan, Zambo Sibugay 5,600,000.00 5,600,000.00 5,393,008.56 96.30% 0.00
Sugbongcogon, Misamis Or. 5,600,000.00 5,599,999.77 3,391,274.04 60.56% 0.23
San Isidro, Davao Oriental 5,599,999.20 5,599,999.20 5,040,574.15 90.01% 0.00
Malapatan, Sarangani 5,600,000.00 3,969,540.00 3,265,384.30 82.26% 1,630,460.00
Gigaquit, Surigao Norte 5,600,000.00 5,173,320.00 2,767,200.32 53.49% 426,680.00
Kapatagan, Lanao del Sur 5,600,000.00 5,600,000.00 4,865,418.13 86.88% 0.00
T O T A L 33,599,999.20 31,542,858.97 24,722,859.50 78.38% 2,057,140.23
Department of Agriculture MINDANAO RURAL DEVELOPMENT PROGRAM
Program Support Office
Department of Agriculture MINDANAO RURAL DEVELOPMENT PROGRAM
Program Support Office
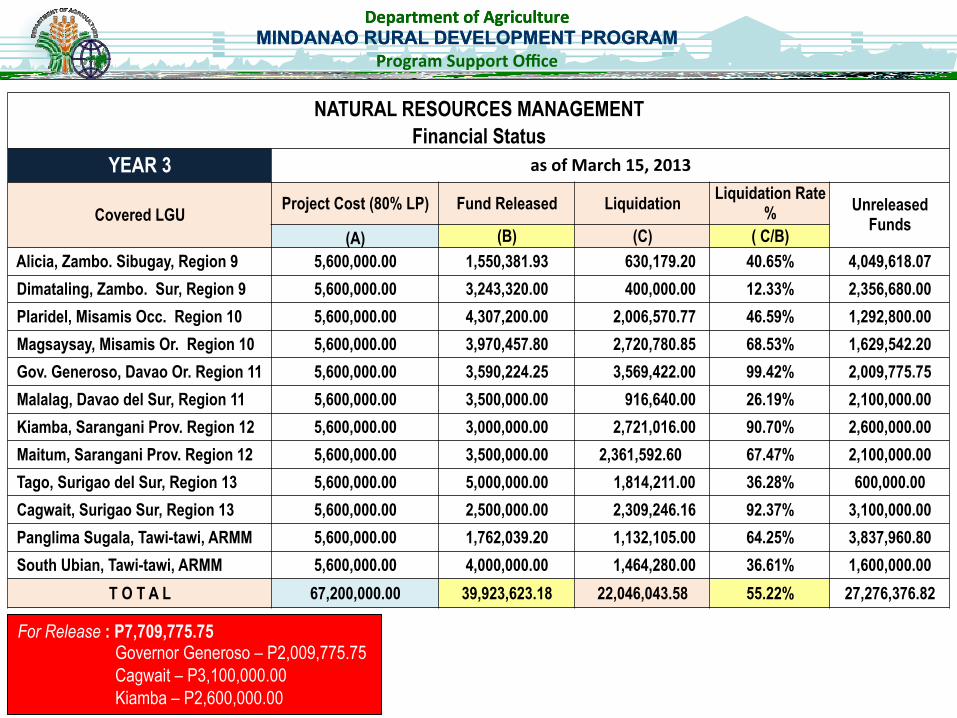
NATURAL RESOURCES MANAGEMENT Financial Status
YEAR 3 as of March 15, 2013
Covered LGU Project Cost (80% LP) Fund Released Liquidation Liquidation Rate % Unreleased
Funds (A) (B) (C) ( C/B)
Alicia, Zambo. Sibugay, Region 9 5,600,000.00 1,550,381.93 630,179.20 40.65% 4,049,618.07 Dimataling, Zambo. Sur, Region 9 5,600,000.00 3,243,320.00 400,000.00 12.33% 2,356,680.00 Plaridel, Misamis Occ. Region 10 5,600,000.00 4,307,200.00 2,006,570.77 46.59% 1,292,800.00 Magsaysay, Misamis Or. Region 10 5,600,000.00 3,970,457.80 2,720,780.85 68.53% 1,629,542.20 Gov. Generoso, Davao Or. Region 11 5,600,000.00 3,590,224.25 3,569,422.00 99.42% 2,009,775.75 Malalag, Davao del Sur, Region 11 5,600,000.00 3,500,000.00 916,640.00 26.19% 2,100,000.00 Kiamba, Sarangani Prov. Region 12 5,600,000.00 3,000,000.00 2,721,016.00 90.70% 2,600,000.00 Maitum, Sarangani Prov. Region 12 5,600,000.00 3,500,000.00 2,361,592.60 67.47% 2,100,000.00 Tago, Surigao del Sur, Region 13 5,600,000.00 5,000,000.00 1,814,211.00 36.28% 600,000.00 Cagwait, Surigao Sur, Region 13 5,600,000.00 2,500,000.00 2,309,246.16 92.37% 3,100,000.00 Panglima Sugala, Tawi-tawi, ARMM 5,600,000.00 1,762,039.20 1,132,105.00 64.25% 3,837,960.80 South Ubian, Tawi-tawi, ARMM 5,600,000.00 4,000,000.00 1,464,280.00 36.61% 1,600,000.00
T O T A L 67,200,000.00 39,923,623.18 22,046,043.58 55.22% 27,276,376.82
For Release : P7,709,775.75 Governor Generoso – P2,009,775.75 Cagwait – P3,100,000.00 Kiamba – P2,600,000.00
Department of Agriculture MINDANAO RURAL DEVELOPMENT PROGRAM
Program Support Office
Department of Agriculture MINDANAO RURAL DEVELOPMENT PROGRAM
Program Support Office
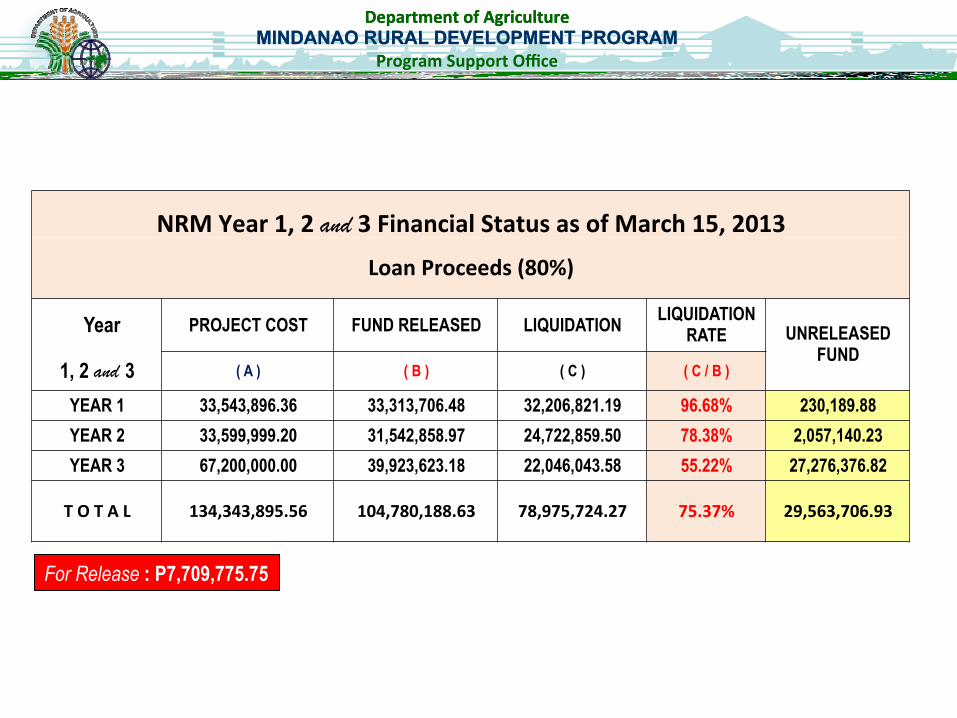
NRM Year 1, 2 and 3 Financial Status as of March 15, 2013
Loan Proceeds (80%)
Year PROJECT COST FUND RELEASED LIQUIDATION LIQUIDATION RATE UNRELEASED
FUND 1, 2 and 3 ( A ) ( B ) ( C ) ( C / B )
YEAR 1 33,543,896.36 33,313,706.48 32,206,821.19 96.68% 230,189.88 YEAR 2 33,599,999.20 31,542,858.97 24,722,859.50 78.38% 2,057,140.23 YEAR 3 67,200,000.00 39,923,623.18 22,046,043.58 55.22% 27,276,376.82
T O T A L 134,343,895.56 104,780,188.63 78,975,724.27 75.37% 29,563,706.93
For Release : P7,709,775.75
Department of Agriculture MINDANAO RURAL DEVELOPMENT PROGRAM
Program Support Office
Department of Agriculture MINDANAO RURAL DEVELOPMENT PROGRAM
Program Support Office
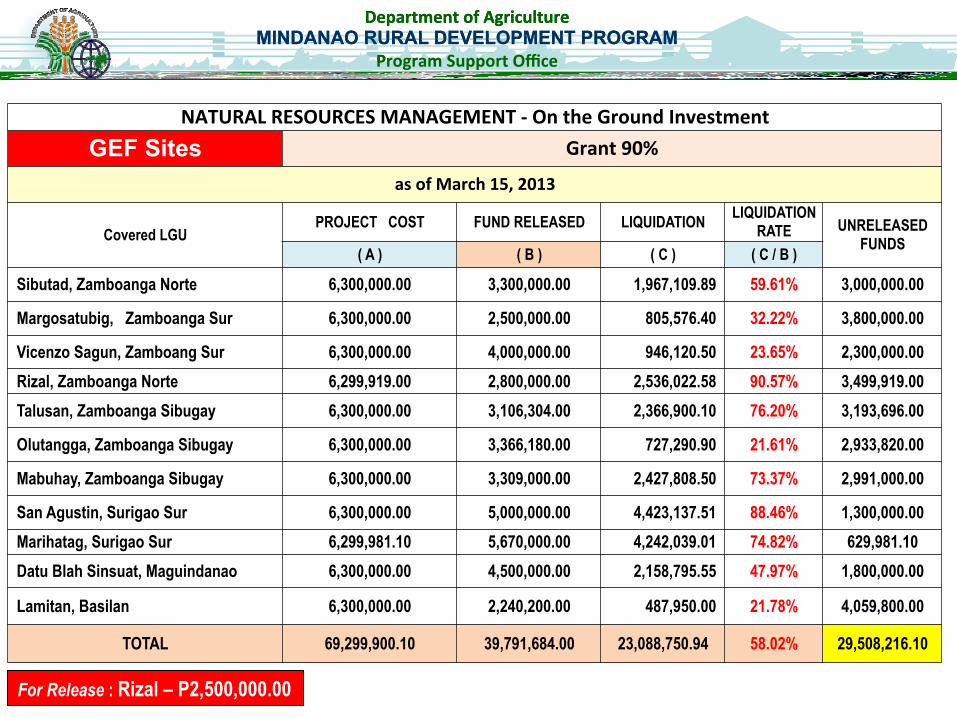
NATURAL RESOURCES MANAGEMENT -‐ On the Ground Investment GEF Sites Grant 90%
as of March 15, 2013
Covered LGU PROJECT COST FUND RELEASED LIQUIDATION LIQUIDATION
RATE UNRELEASED FUNDS ( A ) ( B ) ( C ) ( C / B )
Sibutad, Zamboanga Norte 6,300,000.00 3,300,000.00 1,967,109.89 59.61% 3,000,000.00
Margosatubig, Zamboanga Sur 6,300,000.00 2,500,000.00 805,576.40 32.22% 3,800,000.00
Vicenzo Sagun, Zamboang Sur 6,300,000.00 4,000,000.00 946,120.50 23.65% 2,300,000.00 Rizal, Zamboanga Norte 6,299,919.00 2,800,000.00 2,536,022.58 90.57% 3,499,919.00 Talusan, Zamboanga Sibugay 6,300,000.00 3,106,304.00 2,366,900.10 76.20% 3,193,696.00
Olutangga, Zamboanga Sibugay 6,300,000.00 3,366,180.00 727,290.90 21.61% 2,933,820.00
Mabuhay, Zamboanga Sibugay 6,300,000.00 3,309,000.00 2,427,808.50 73.37% 2,991,000.00
San Agustin, Surigao Sur 6,300,000.00 5,000,000.00 4,423,137.51 88.46% 1,300,000.00 Marihatag, Surigao Sur 6,299,981.10 5,670,000.00 4,242,039.01 74.82% 629,981.10 Datu Blah Sinsuat, Maguindanao 6,300,000.00 4,500,000.00 2,158,795.55 47.97% 1,800,000.00
Lamitan, Basilan 6,300,000.00 2,240,200.00 487,950.00 21.78% 4,059,800.00
TOTAL 69,299,900.10 39,791,684.00 23,088,750.94 58.02% 29,508,216.10
For Release : Rizal – P2,500,000.00

Department of Agriculture MINDANAO RURAL DEVELOPMENT PROGRAM
Program Support Office
Department of Agriculture MINDANAO RURAL DEVELOPMENT PROGRAM
Program Support Office
NATURAL RESOURCES MANAGEMENT Financial Status
S I G A as of March 15, 2013
Covered LGU Grant (80% LP) Fund Released Liquidation Liquidation Rate % Unreleased Funds (A) (B) (C) ( C/B)
Sibutad 2,000,000.00 1,000,000.00 0.00% 1,000,000.00 Margosatubig 2,000,000.00 1,000,000.00 0.00% 1,000,000.00 Vicenzo Sagun 2,000,000.00 2,000,000.00 997,150.00 49.86% 0.00 Rizal 2,000,000.00 1,000,000.00 0.00% 1,000,000.00 Talusan 2,000,000.00 1,000,000.00 857,200.00 85.72% 1,000,000.00 Olutangga 2,000,000.00 1,000,000.00 920,000.00 92.00% 1,000,000.00 Mabuhay 2,000,000.00 1,000,000.00 961,600.00 96.16% 1,000,000.00 San Agustin 2,000,000.00 1,000,000.00 938,334.80 93.83% 1,000,000.00 Marihatag 2,000,000.00 2,000,000.00 1,000,000.00 50.00% 0.00 Datu Blah Sinsuat 2,000,000.00 1,000,000.00 778,932.00 77.89% 1,000,000.00 Lamitan 2,000,000.00 1,000,000.00 0.00% 1,000,000.00
T O T A L 22,000,000.00 13,000,000.00 6,453,216.80 49.64% 9,000,000.00
For Release : Datu Blah Sinsuat – 1,000,0000.00 San Agustin – P1,000,000.00

HIGHLIGHTS of
Physical Status as of March 15, 2013
Natural Resource Management

Accomplishment on Year 1 Sites NRM Year 1 as of March 15, 2013
Covered LGU No. of SPs
Subproject Target Area Accomp. Value of Cost Accomp.
(P) Has Kms. (%) (P)
RT Lim, Zambo. Sibugay 4 6,999,870.50 387 100 6,546,336.90
Linamon, Lanao del Norte 3 7,000,000.00 23 100 6,195,618.10
Don Marcelino, Davao Sur 2 6,929,999.95 274.62 100 5,242837.05 * based on Liquidation
Kalamansig, Sultan Kudarat 4 7,000,000.00 90 30 100 6,935,218.37
Nasipit, Agusan del Norte 5 7,000,000.00 191 100 6,877,022.25
Datu Odin Sinsuat, Maguindanao 6 7,000,000.00 169 100 6,323,456.72
T O T A L 24 41,929,870.45 1,134.62 30 100 37,117,244.24

Accomplishment on Year 1 Sites REGION IX
YEAR 1 as of March 15, 2013
Covered LGU No. of SPs
Subproject Cost
(P)
Target Area Physical Accomp.
(%)
Value of Accomp.
(P)
Weighted Accomp.
(%) Has. Kms
RT Lim, Zambo. Sibugay
Riverbank 1 203,600.00 5.00 100.00% 165,000.00 81.04 Agro forestry 1 3,451,895.50 100.00 100.00% 3,195,150.40 92.56
UPLAND 2 3,655,495.50 105.00 0.00 100.00% 3,360,150.40 91.92 Mangrove 1 2,344,375.00 150.00 100.00% 2,192,375.00 93.52
Fish Sanctuary 1 1,000,000.00 132.00 100.00% 993,811.50 99.38 COASTAL 2 3,344,375.00 282.00 0.00 100.00% 3,186,186.50 95.27
TOTAL 4 6,999,870.50 387.00 100% 6,546,336.90 93.52

Accomplishment on year 1 Sites REGION X
YEAR 1 as of March 15, 2013
Covered LGU No. of SPs Subproject
Cost (P)
Target Area Physical Accomp.
(%)
Value of Accomp.
(P)
Weighted Accomp.
(%) Has. Kms
Linamon, Lanao del Norte
Larapan Riverbank 1 1,300,000.00 5.00 100% 762,970.96 80.47 Agro forestry 1 2,365,000.00 12.00 100% 1,672,083.86 80.69
UPLAND 2 3,665,000.00 17.00 100 % 2,435,054.82 80.61 Coral Reef 1 3,335,000.00 6.00 100.00% 3,241,163.36 97.19
COASTAL 1 3,335,000.00 6.00 100.00 % 3,241,163.36 97.19
TOTAL 3 7,000,000.00 23.00 100 % 6,195,618.10 88.51
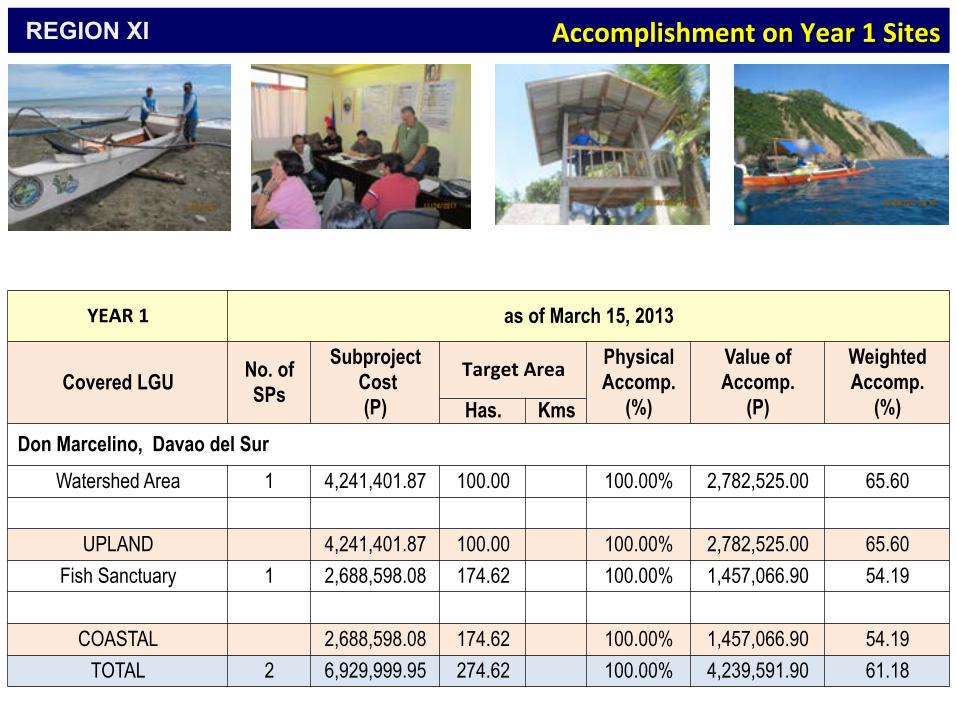
Accomplishment on Year 1 Sites REGION XI
YEAR 1 as of March 15, 2013
Covered LGU No. of SPs
Subproject Cost
(P)
Target Area Physical Accomp.
(%)
Value of Accomp.
(P)
Weighted Accomp.
(%) Has. Kms Don Marcelino, Davao del Sur
Watershed Area 1 4,241,401.87 100.00 100.00% 2,782,525.00 65.60
UPLAND 4,241,401.87 100.00 100.00% 2,782,525.00 65.60 Fish Sanctuary 1 2,688,598.08 174.62 100.00% 1,457,066.90 54.19
COASTAL 2,688,598.08 174.62 100.00% 1,457,066.90 54.19
TOTAL 2 6,929,999.95 274.62 100.00% 4,239,591.90 61.18

Accomplishment on Year 1 Sites REGION XII
YEAR 1 as of March 15, 2013
Covered LGU No. of SPs
Subproject Cost
(P)
Target Area Accomp. (%)
Value of Accomp.
(P)
Weighted Accomp.
(%)
Geo-tagging Status Has. Kms
Kalamansig, Sultan Kudarat
Riverbank 1 3,315,386.50 30.00 100.00% 3,315,386.50 100.00
Agroforestry 1 1,348,082.50 50.00 100.00% 1,348,082.50 100.00
UPLAND 2 4,663,469.00 50.00 30.00 100.00% 4,663,469.00 100.00
Marine Sanctuary 1 262,000.00 20.00 100.00% 210,218.37 85.15
Mangrove 2,074,531.00 20.00 100.00% 2,061,531.00 99.37
COASTAL 2 2,336,531.00 40.00 100.00% 2,271,749.37 97.23
TOTAL 4 7,000,000.00 90.00 30.00 100.00% 6,935,218.37 99.07

Accomplishment on Year 1 Sites REGION XIII
YEAR 1 as of March 15, 2013
Covered LGU No. of SPs
Subproject Cost
(P)
Target Area Physical Accomp.
(%)
Value of Accomp.
(P)
Weighted Accomp.
(%)
Geo-tagging Status Has. Kms
Nasipit, Agusan del Norte Riverbank 1 738,057.00 17.00 100.00% 730,685.00 99.00
Agroforestry 1 2,857,379.25 100.00 100.00% 2,838,083.50 99.32 UPLAND 2 3,595,436.25 117.00 100.00% 3,568,768.50 99.26
Fish Reserve 1 1,900,089.75 41.00 100.00% 1,835,446.75 97.10 Marine Sanctuary 1 771,951.00 30.00 100.00% 735,334.00 95.26
Mangrove 1 732,523.00 3.00 100.00% 728,023.00 99.39 COASTAL 3 3,404,563.75 74.00 100.00% 3,308,253.75 97.17
TOTAL 5 7,000,000.00 191.00 100.00% 6,815,549.25 98.24

Accomplishment on Year 1 Sites A R M M
YEAR 1 as of March 15, 2013
Covered LGU No. of SPs
Subproject Cost
(P)
Target Area Physical Accomp.
(%)
Value of Accomp.
(P)
Weighted Accomp.
(%) Has. Kms
Datu Odin Sinsuat, Maguindanao Agroforestry 1 1,919,820.00 54.00 100.00% 1,756,469.80 91.49
SALT 1 339,000.00 5.00 100.00% 256,309.50 75.61 Forest Plantation 1 3,092,617.50 72.00 100.00% 2,887,906.42 93.38
Riverbank 1 278,500.00 8.00 100.00% 190,300.00 68.33 UPLAND 4 5,629,937.50 139.00 100.00% 5,090,985.72 90.43 Mangrove 1 642,387.50 15.00 100.00% 538,919.00 83.89
Fish Sanctuary 1 727,675.00 15.00 100.00% 693,552.00 95.31
COASTAL 2 1,370,062.50 30.00 100.00% 1,232,471.00 89.96 TOTAL 6 7,000,000.00 169.00 100.00% 6,323,456.72 90.34
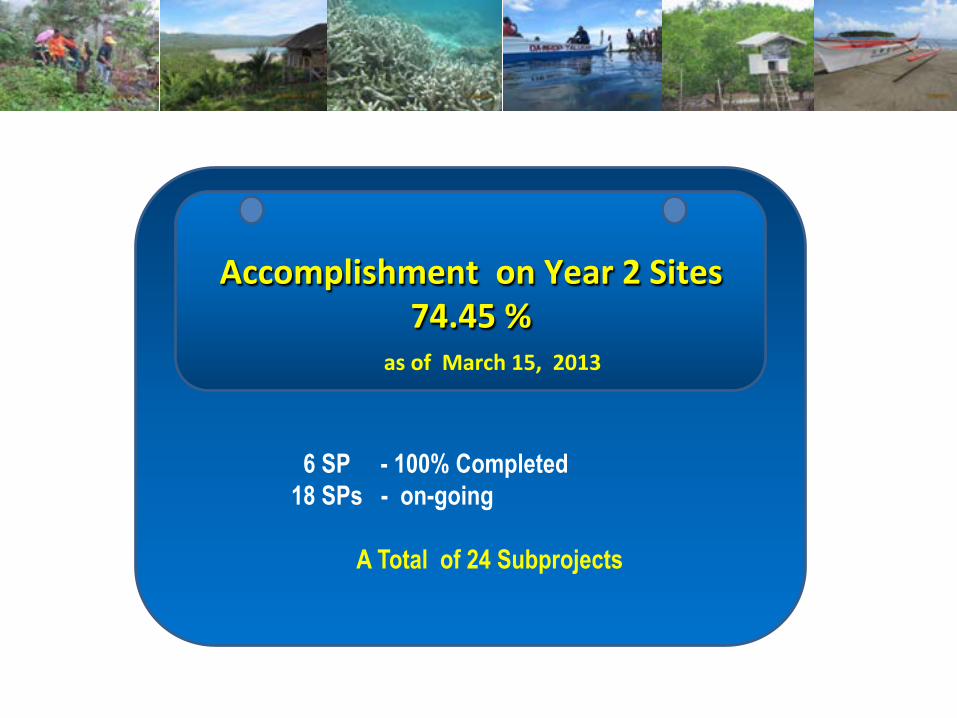
Accomplishment on Year 2 Sites 74.45 %
6 SP - 100% Completed 18 SPs - on-going
A Total of 24 Subprojects
as of March 15, 2013

Accomplishment on Year 2 Sites Region IX
NATURAL RESOURCES MANAGEMENT
Physical Status
Year 2 as of March 15, 2013
Covered LGU No. of SPs
Subproject Cost (P)
Target Area Relative Weight
Accomp. (%)
Value of Accomp. (P) Has. Kms
Tungawan, Zambo Sibugay Riverbank 1 470,000.00 21.00 6.71 89.32 419,800.00
Agro forestry 1 3,580,000.00 100.00 51.14 100 3,635,326.90
UPLAND 2 4,050,000.00 100.00 21.00 57.86 100.13 4,055,126.90
Mangrove 1 2,000,000.00 100.00 28.57 100 1,999,269.40
Marine Sanctuary 1 950,000.00 64.00 13.57 82.52 783,983.00
COASTAL 2 2,950,000.00 164.00 0.00 42.14 94.35 2,783,252.40
TOTAL 4 7,000,000.00 264.00 21.00 100.00 97.69 6,838,379.30

Accomplishment on Year 2 Sites Region X
Physical Status YEAR 2 as of March 15, 2013
Covered LGU No. of SPs
Subproject Cost (P)
Target Area Relative Weight Accomp. (%) Value of
Accomp. (P) Has. Kms
Sugbongcogon, Misamis Oriental
Rehab of Silad Riverbank 1 1,226,685.00 28.00 17.52 4.61 56,523.50
Agro forestry 1 2,383,006.00 100.00 34.04 79.81 1,901,931.00 UPLAND 2 3,609,691.00 128.00 51.57 54.26 1,958,454.50
Rehab of Fish Sanctuary 1 2,516,109.00 5.50 35.94 40.82 1,027,102.33
Mangrove Rehabilitation 1 874,200.00 6.00 12.49 31.23 273,000.00
COASTAL 2 3,390,309.00 11.50 48.43 38.35 1,300,102.33 TOTAL 4 7,000,000.00 139.50 100.00 46.55 3,258,556.83

Accomplishment on Year 2 Sites Region XI
Physical Status YEAR 2 as of March 15, 2013
Covered LGU No. of SPs
Subproject Cost (P)
Target Area Relative Weight
Accomp. (%)
Value of Accomp. (P) Has. Kms
San Isidro, Davao Oriental Agro Forestry 1 4,818,533.00 136.00 68.84 91.04 4,386,804.19
River Bank 1 14.40 UPLAND 2 4,818,533.00 136.00 14.40 68.84 91.04% 4,386,804.19
Fish Sanctuary Reserved 1 1,448,133.00 5.00 20.69 81.80 1,184,502.88
Mangrove Rehab 1 733,333.00 7.50 10.48 100.00% 729,410.60 COASTAL 2 2,181,466.00 12.50 31.16 87.74% 1,913,913.48
TOTAL 4 6,999,999.00 148.50 14.40 100.00 90.01 6,300,717.67

Accomplishment on Year 2 Sites Region XII
Physical Status YEAR 2 as of March 15, 2013
Covered LGU No. of SPs
Subproject Cost (P)
Target Area Relative Weight
Accomp. (%)
Value of Accomp. (P) Has. Kms
Malapatan, Sarangani Province
Riverbank 1 2,000,000.00 26.00 28.57 51.63 1,032,545.00
Agroforestry 1 3,700,000.00 150.00 52.86 55.74 2,062,389.47 UPLAND 2 5,700,000.00 150.00 26.00 81.43 54.30 3,094,934.47
Mangrove 1 1,300,000.00 10.00 18.57 88.51 1,150,597.45 COASTAL 1 1,300,000.00 10.00 18.57 88.51 1,150,597.45
TOTAL 3 7,000,000.00 160.00 26.00 100.00 60.65 4,245,531.92

Physical Status YEAR 2 as of March 15, 2013
Covered LGU No. of SPs
Subproject Cost (P)
Target Area Relative Weight
Accomp. (%)
Value of Accomp. (P) Has. Kms
Gigaquit, Surigao Norte Riverbank 1 1,780,831.00 18.00 25.44 0.00% 0.00
Agroforestry 1 1,377,772.00 150.00 19.68 48.72% 671,265.00 UPLAND 2 3,158,603.00 150.00 18.00 45.12 24.36% 671,265.00
Fish Sanctuary (Cagban) 1 1,236,000.00 45.00 17.66 100.00% 1,230,000.00
Expansion of Fish Sanctuary (Borason Reef) 1 1,311,093.00 18.73 41.23% 540,544.80 Mangrove 1 1,294,304.00 40.00 18.49 100.00% 1,091,985.00 COASTAL 3 3,841,397.00 85.00 54.88 100.00% 2,862,529.80
TOTAL 4 7,000,000.00 235.00 18.00 100.00 62.18% 3,533,794.80
Accomplishment on Year 2 Sites Region XIII
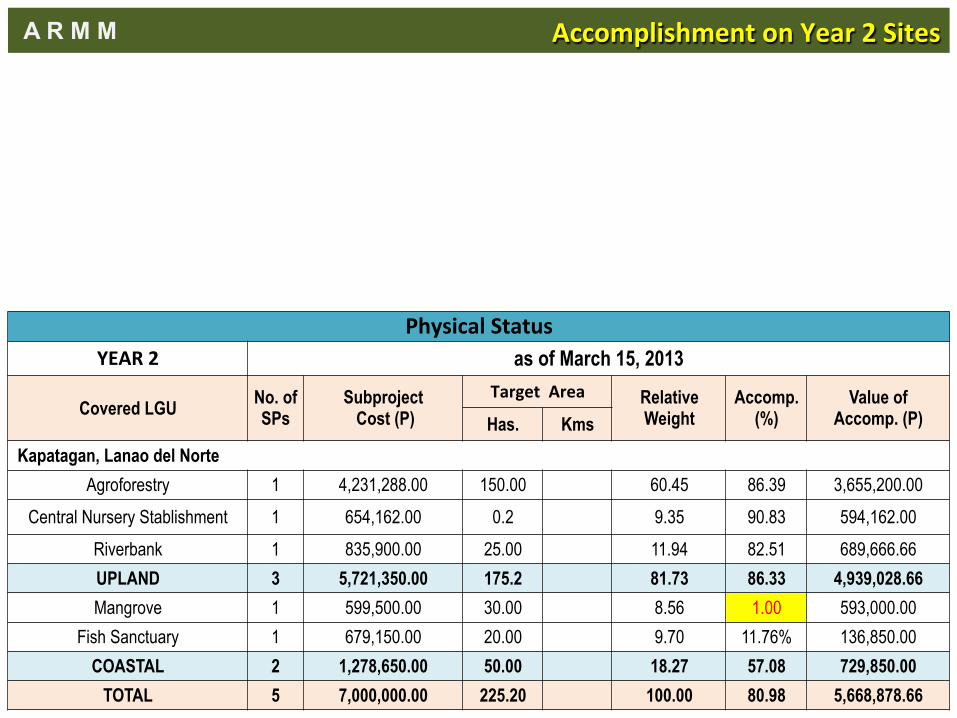
Accomplishment on Year 2 Sites A R M M
Physical Status YEAR 2 as of March 15, 2013
Covered LGU No. of SPs
Subproject Cost (P)
Target Area Relative Weight
Accomp. (%)
Value of Accomp. (P) Has. Kms
Kapatagan, Lanao del Norte Agroforestry 1 4,231,288.00 150.00 60.45 86.39 3,655,200.00
Central Nursery Stablishment 1 654,162.00 0.2 9.35 90.83 594,162.00 Riverbank 1 835,900.00 25.00 11.94 82.51 689,666.66 UPLAND 3 5,721,350.00 175.2 81.73 86.33 4,939,028.66 Mangrove 1 599,500.00 30.00 8.56 1.00 593,000.00
Fish Sanctuary 1 679,150.00 20.00 9.70 11.76% 136,850.00 COASTAL 2 1,278,650.00 50.00 18.27 57.08 729,850.00
TOTAL 5 7,000,000.00 225.20 100.00 80.98 5,668,878.66

Department of Agriculture MINDANAO RURAL DEVELOPMENT PROGRAM
Program Support Office
Department of Agriculture MINDANAO RURAL DEVELOPMENT PROGRAM
Program Support Office
Accomplishment on Year 2 Sites YEAR 2
PHYSICAL STATUS (Based on Actual Liquida<on) YEAR 2 as of March 15, 2013
Covered LGU No. of SPs
Subproject Cost (P)
Area Target Relative Weight Accomp. (%) Value of
Accomp. (P) Has. Kms
Tungawan 4 7,000,000.00 264.00 21.00 16.67 97.69 6,838,379.30 * Sugbongcogon 4 7,000,000.00 139.50 16.67 50.79 3,555,562.00
San Isidro 4 6,999,999.00 148.50 14.40 16.67 90.01 6,300,717.67 * Malapatan 3 7,000,000.00 160.00 26.00 16.67 60.65 4,339,355.17 * Gigaquit 4 7,000,000.00 235.00 18.00 16.67 59.32 4,152,177.68
Kapatagan 5 7,000,000.00 225.20 16.67 86.88 6,081,522.67
TOTAL YEAR 2 24 41,999,999.00 1,172.20 79.40 100.00 74.45 31,267,714.49
* Based on SWA Report

Accomplishment on Year 3 Sites 42.96 %
3 SP - 100% Completed 39 SPs - on-going
A Total of 42 Subprojects
as of March 15, 2013

Physical Status Year 3 as of March 15, 2013 ( Based on SWA Report)
Regions Covered LGU No. of SPs
Subproject Cost (P)
Area Target Relative Weight
Accomp. (%)
Value of Accomp. (P) Has. Kms
9 Dimataling, Zamboanga Sur 4 7,000,000.00 225 0 8.33 79.53 5,567,350.00
Alicia, Zamboanga del Sur 4 7,000,000.00 152 0 8.33 36.19 2,533,236.00
10 Plaridel, Misamis Occ. 3 7,000,000.00 238.5 0 8.33 28.06 1,964,115.32
Magsaysay, Misamis Or. 4 7,000,000.00 151 27 8.33 53.56 3,748,990.25
11 Gov. Generoso, Davao Or. 4 7,000,000.00 168 0 8.33 55.18 3,862,440.50 Malalag, Davao del Sur 4 7,000,000.00 193 0 8.33 51.36 3,594,866.00
12 Kiamba, Sarangani Prov. 3 7,000,000.00 173 19 8.33 48.19 3,373,451.00
Maitum, Sarangani Prov. 2 7,000,000.00 130 0 8.33 18.05 1,263,191.00
13 Tago, Surigao del Sur 3 7,000,000.00 135 0 8.33 22.17 1,551,765.50
Cagwait, Surigao del Sur 4 7,000,000.00 207 0 8.33 57.28 4,009,685.30
ARMM South Ubian, Tawi-tawi 3 7,000,000.00 163 0 8.33 37.91 2,653,560.00
Panglima Sugala, Tawi-tawi 4 7,000,000.00 194.8 0 8.33 28.05 1,963,571.00
T O T A L TOTAL 42 84,000,000.00 2,130.30 46.00 99.96 42.96 36,086,221.87

Accomplishment on Year 3 Sites Region IX
Physical Status Year 3 as of March 15, 2013
Covered LGU No. of SPs
Subproject Cost (P)
Area Target RelaYve Weight
Accomp. (%)
Value of Accomp. (P) Has. Kms
Dimataling, Zamboanga del Sur
Agroforestry 1 1,983,440.00 40.00 28.33 98.42 1,952,040.00
Riverbank 1 1,102,750.00 35.00 15.75 100.00 1,102,750.00 UPLAND 2 3,086,190.00 75.00 0.00 44.09 98.98 3,054,790.00
Fish Sanctuary 1 1,401,250.00 50.00 20.02 0.00
Mangrove 1 2,512,560.00 100.00 35.89 100.00 2,512,560.00
COASTAL 2 3,913,810.00 150.00 0.00 55.91 64.20 2,512,560.00
TOTAL 4 7,000,000.00 225.00 0.00 100.00 79.53 5,567,350.00

Accomplishment on Year 3 Sites Region IX
Physical Status Year 3 as of March 15, 2013
Covered LGU No. of SPs Subproject Cost (P)
Area Target RelaYve Weight
Accomp. (%)
Value of Accomp. (P) Has. Kms
Alicia, Zamboanga del Sur
Agroforestry 1 3,566,000.00 70.00 50.94 29.44 1,050,000.00 Riverbank 1 849,960.00 22.00 12.14 6.91 58,700.00 UPLAND 2 4,415,960.00 92.00 0.00 63.09 25.11 1,108,700.00
Marine Sanctuary 1 2,199,040.00 30.00 31.41 56.57 1,243,889.00 Mangrove 1 385,000.00 30.00 5.50 46.92 180,647.00 COASTAL 2 2,584,040.00 60.00 0.00 36.91 55.13 1,424,536.00
TOTAL 4 7,000,000.00 152.00 0.00 100.00 36.19 2,533,236.00

Accomplishment on Year 3 Sites Region X
Physical Status
Year 3 as of March 15, 2013
Covered LGU No. of SPs
Subproject Cost (P)
Area Target RelaYve Weight
Accomp. (%)
Value of Accomp. (P) Has. Kms
Plaridel, Misamis Occidental
Agroforestry 1 2,870,199.00 100.50 41.00 6.94 199,212.62 Riverbank 1 2,471,684.00 78.00 35.31 33.14 819,035.50 UPLAND 2 5,341,883.00 178.50 0.00 76.31 19.06 1,018,248.12
Marine Sanctuary 1 1,658,117.00 60.00 23.69 57.04 945,867.20
COASTAL 1 1,658,117.00 60.00 0.00 23.69 57.04 945,867.20 TOTAL 3 7,000,000.00 238.50 0.00 100.00 28.06 1,964,115.32

Accomplishment on Year 3 Sites Region X
Physical Status
Year 3 as of March 15, 2013
Covered LGU No. of SPs
Subproject Cost (P)
Target Area Relative Weight
Accomp. (%)
Value of Accomp. (P) Has. Kms
Magsaysay, Misamis Oriental Agroforestry 1 3,628,617.60 130.00 51.84 49.91 1,811,147.39 Riverbank 1 2,090,290.45 27.00 29.86 60.51 1,264,868.89 UPLAND 2 5,718,908.05 130.00 27.00 81.70 53.79 3,076,016.28
Marine Sanctuary 1 970,161.50 18.00 13.86 56.46 547,770.59 Mangrove 1 310,930.45 3.00 4.44 40.27 125,203.38 COASTAL 2 1,281,091.95 21.00 0.00 18.30 52.53 672,973.97
TOTAL 4 7,000,000.00 151.00 27.00 100.00 53.56 3,748,990.25

Accomplishment on Year 3 Sites Region XI
Physical Status Year 3 as of March 15, 2013
Covered LGU No. of SPs
Subproject Cost (P)
Physical Target RelaYve Weight
Accomp. (%)
Value of Accomp. (P) Has. Kms
Gov. Generoso, Davao Oriental Agroforestry 1 4,780,244.00 140.00 68.29 52.40 2,504,610.50 Riverbank 1 755,942.00 16.00 27.00 10.80 75.37 569,790.00 UPLAND 2 5,536,186.00 156.00 27.00 79.09 55.53 3,074,400.50
Marine Sanctuary 1 1,205,754.00 6.00 17.23 54.70 659,540.00 Mangrove 1 258,060.00 6.00 3.69 49.79 128,500.00 COASTAL 2 1,463,814.00 12.00 0.00 20.91 53.83 788,040.00
TOTAL 4 7,000,000.00 168.00 27.00 100.00 55.18 3,862,440.50

Accomplishment on Year 3 Sites Region XI
Physical Status Year 3 as of March 15, 2013
Covered LGU No. of SPs
Subproject Cost (P)
Physical Target RelaYve Weight
Accomp. (%)
Value of Accomp. (P) Has. Kms
Malalag, Davao del Sur Agroforestry 1 3,720,341.00 110.00 53.15 83.42 3,103,432.00 Riverbank 1 1,347,190.00 30.00 19.25 0.00 0.00 UPLAND 2 5,067,531.00 140.00 0.00 72.39 61.24 3,103,432.00
Marine Sanctuary 1 1,187,357.00 50.00 16.96 41.39 491,434.00 Mangrove 1 745,112.00 3.00 10.64 0.00 0.00 COASTAL 2 1,932,469.00 53.00 0.00 27.61 25.43 491,434.00
TOTAL 4 7,000,000.00 193.00 0.00 100.00 51.36 3,594,866.00

Accomplishment on Year 3 Sites Region XII
Physical Status
Year 3 as of March 15, 2013
Covered LGU No. of SPs
Subproject Cost (P)
Target Area Relative Weight
Accomp. (%)
Value of Accomp. (P) Has. Kms
Kiamba, Sarangani Province
Agroforestry 1 4,166,829.10 120.00 59.53 63.39 2,641,287.00 Riverbank 1 1,503,760.90 19.00 21.48 0.00 0.00 UPLAND 2 5,670,590.00 120.00 19.00 81.01 46.58 2,641,287.00
Marine Protected 1 1,329,410.00 53.00 18.99 55.07 732,164.00 COASTAL 1 1,329,410.00 53.00 0.00 18.99 55.07 732,164.00
TOTAL 3 7,000,000.00 173.00 19.00 100.00 48.19 3,373,451.00

Accomplishment on Year 3 Sites Region XII
Physical Status
Year 3 as of March 15, 2013
Covered LGU No. of SPs
Subproject Cost (P)
Target Area Relative Weight
Accomp. (%)
Value of Accomp. (P) Has. Kms
Maitum, Sarangani Province
Agroforestry 1 5,338,715.70 100.00 76.27 14.19 757,592.00 Riverbank 1 1,661,284.30 30.00 23.73 30.43 505,599.00 UPLAND 2 7,000,000.00 130.00 0.00 100.00 18.05 1,263,191.00
COASTAL
TOTAL 2 7,000,000.00 130.00 0.00 100.00 18.05 1,263,191.00

Accomplishment on Year 3 Sites Region XIII
Physical Status Year 3 as of March 15, 2013
Covered LGU No. of SPs
Subproject Cost (P)
Target Area RelaYve Weight
Accomp. (%)
Value of Accomp. (P) Has. Kms
Tago, Surigao del Sur Agroforestry 1 3,281,373.00 70.00 46.88 30.16 989,682.00 Riverbank 1 855,685.00 20.00 12.22 0.00 0.00 UPLAND 2 4,137,058.00 90.00 0.00 59.10 0.00 0.00
Mangrove Rehab 1 2,862,942.00 45.00 40.90 19.63 562,083.00
COASTAL 1 2,862,942.00 45.00 0.00 40.90 0.00 0.00 TOTAL 3 7,000,000.00 135.00 0.00 100.00 22.17 1,551,765.00

Accomplishment on Year 3 Sites Region XIII
Physical Status Year 3 as of March 15, 2013
Covered LGU No. of SPs
Subproject Cost (P)
Physical Target RelaYve Weight
Accomp. (%)
Value of Accomp. (P) Has. Kms
Cagwait, Surigao del Sur Agroforestry 1 2,287,865.00 115.00 32.68 75.98 1,738,319.10 Riverbank 1 359,037.00 2.00 5.13 44.30 159,053.40 UPLAND 2 2,646,902.00 117.00 0.00 37.81 71.68 1,897,372.50
Fish Sanctuary 1 1,403,941.00 30.00 20.06 61.18 858,931.10 Mangrove 1 2,949,157.00 60.00 42.13 42.50 1,253,381.70 COASTAL 2 4,353,098.00 90.00 0.00 62.19 48.52 2,112,312.80
TOTAL 4 7,000,000.00 207.00 0.00 100.00 57.28 4,009,685.30

Accomplishment on Year 3 Sites A R M M
Physical Status
Year 3 as of March 15, 2013
Covered LGU No. of SPs
Subproject Cost (P)
Target Area Relative Weight
Accomp. (%)
Value of Accomp. (P) Has. Kms
South Ubian, Tawi-tawi Agroforestry 1 1,650,000.00 33.00 23.57 0.00 0.00
UPLAND 1 1,650,000.00 33.00 0.00 23.57 0.00 0.00 Fish Sanctuary 1 4,725,000.00 105.00 67.50 56.16 2,653,560.00
Mangrove Rehab 1 625,000.00 25.00 8.93 0.00 0.00 COASTAL 2 5,350,000.00 130.00 0.00 76.43 49.60 2,653,560.00
TOTAL 3 7,000,000.00 163.00 0.00 100.00 37.91 2,653,560.00

Accomplishment on Year 3 Sites A R M M
Physical Status
Year 3 as of March 15, 2013
Covered LGU No. of SPs
Subproject Cost (P)
Target Area Relative Weight
Accomp. (%)
Value of Accomp. (P) Has. Kms
Panglima Sugala, Tawi-tawi Agroforestry 1 3,000,000.00 60.00 42.86 19.69 590,550.00 Riverbank 1 875,000.00 15.00 12.50 37.50 328,125.00 UPLAND 2 3,875,000.00 75.00 0.00 55.36 23.71 918,675.00
Fish Sanctuary 1 1,900,000.00 70.80 27.14 25.71 488,400.00 Mangrove 1 1,225,000.00 49.00 17.50 45.43 556,496.00 COASTAL 2 3,125,000.00 119.80 0.00 44.64 33.44 1,044,896.00
TOTAL 4 7,000,000.00 194.80 0.00 100.00 28.05 1,963,571.00

Accomplishment on G E F Sites is 37.92 % ( Based on SWA Report )
GEF Sites as of March 15, 2013
Covered LGU No. of SPs
Subproject Cost (P)
Area Target Accomp. (%)
Value of Accomp. (P) Has. Kms
Rizal, Zamboanga Norte 4 7,000,000.00 240.00 20.00 40.86 2,860,510.04 Sibutad, Zamboanga Norte 4 7,000,000.00 184.32 12.50 37.69 2,638,185.85
Margosatubig, Zamboanga Sur 3 7,000,000.00 205.50 31.31 2,191,734.90 Vincenso Sagun, Zamboanga Sur 5 7,000,000.00 200.00 10.00 28.77 2,014,025.00
Mabuhay, Zamboanga Sibugay 3 7,000,000.00 192.00 0.00 37.44 2,621,050.00 Talusan, Zamboanga Sibugay 3 7,000,000.00 199.50 0.00 38.17 2,671,849.00
Ulotanga, Zamboanga Sibugay 3 7,000,000.00 157.00 0.00 12.34 864,000.00 Marihatag, Surigao del Sur 3 7,000,001.00 230.30 0.00 70.84 4,958,457.00
San Agustin, Surigao del Sur 4 6,999,999.20 102.00 24.80 75.22 5,265,156.70 Lamitan, Basilan 3 7,000,000.00 210.00 0.00 7.33 512,950.00
Datu Blah Sinsuat, Maguindanao 4 7,000,000.00 200.00 16.00 37.18 2,602,780.55 TOTAL 39 77,000,000.20 2,120.62 83.30 37.92 29,200,699.04

Accomplishment on GEF Sites Region IX
Physical Status GEF Sites as of March 15, 2013
Covered LGU No. of SPs
Subproject Cost (P)
Target Area Relative Weight
Accomp. (%)
Value of Accomp. (P) Has. Kms
Rizal, Zamboanga del Norte Agroforestry 1 3,691,765.00 100.00 52.74 30.95 1,142,471.78 Riverbank 1 588,650.00 20.00 8.41 0.00 UPLAND 2 4,280,415.00 100.0 20.00 61.15 26.69 1,142,471.78
Fish Sanctuary 1 2,209,435.00 115.00 31.56 77.76 1,718,038.26 Mangrove Rehab 1 510,150.00 25.00 7.29 0.00
COASTAL 2 2,719,585.00 140.00 38.85 63.17 1,718,038.26 TOTAL 4 7,000,000.00 240.00 20.00 100.00 40.86 2,860,510.04
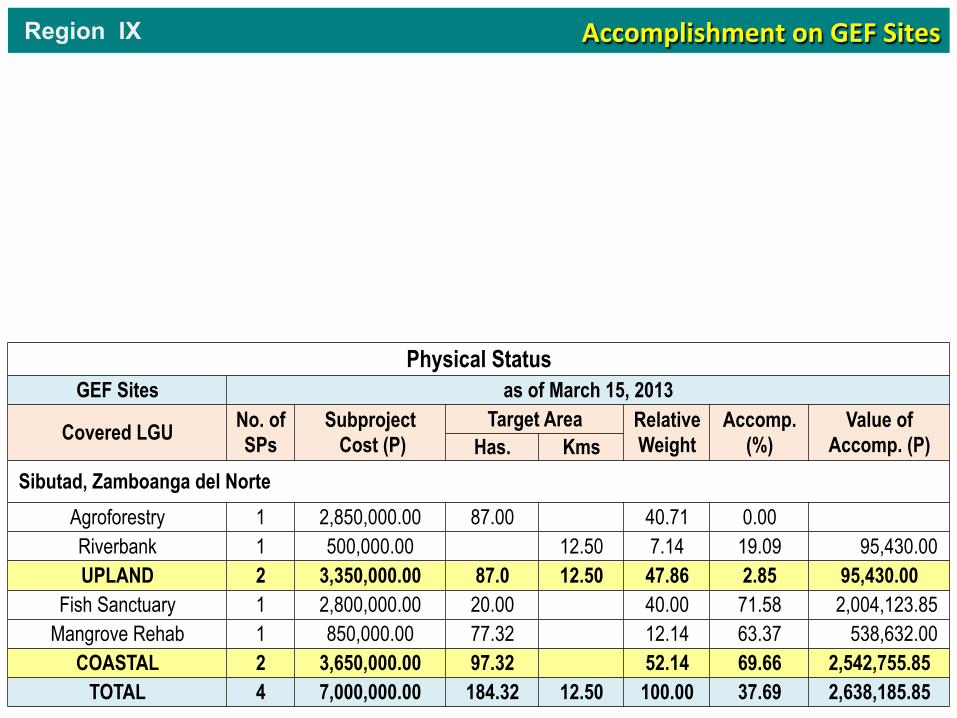
Accomplishment on GEF Sites Region IX
Physical Status GEF Sites as of March 15, 2013
Covered LGU No. of SPs
Subproject Cost (P)
Target Area Relative Weight
Accomp. (%)
Value of Accomp. (P) Has. Kms
Sibutad, Zamboanga del Norte Agroforestry 1 2,850,000.00 87.00 40.71 0.00 Riverbank 1 500,000.00 12.50 7.14 19.09 95,430.00 UPLAND 2 3,350,000.00 87.0 12.50 47.86 2.85 95,430.00
Fish Sanctuary 1 2,800,000.00 20.00 40.00 71.58 2,004,123.85 Mangrove Rehab 1 850,000.00 77.32 12.14 63.37 538,632.00
COASTAL 2 3,650,000.00 97.32 52.14 69.66 2,542,755.85 TOTAL 4 7,000,000.00 184.32 12.50 100.00 37.69 2,638,185.85

Accomplishment on GEF Sites Region IX
Physical Status GEF Sites as of March 15, 2013
Covered LGU No. of SPs
Subproject Cost (P)
Target Area Relative Weight
Accomp. (%)
Value of Accomp. (P) Has. Kms
Margosatubig, Zamboanga del Sur, Region 9 Agroforestry 1 1,423,399.00 28.00 20.33 41.58 591,834.50
UPLAND 1 1,423,399.00 28.0 20.33 41.58 591,834.50
Fish Sanctuary 1 4,086,751.00 170.00 58.38 23.46 958,585.40 Mangrove Rehab 1 1,489,850.00 7.50 21.28 43.05 641,315.00
COASTAL 2 5,576,601.00 177.50 79.67 28.69 1,599,900.40 TOTAL 3 7,000,000.00 205.50 0.00 100.00 31.31 2,191,734.90

Accomplishment on GEF Sites Region IX
Physical Status GEF Sites as of March 15, 2013
Covered LGU No. of SPs
Subproject Cost (P)
Target Area Relative Weight
Accomp. (%)
Value of Accomp. (P) Has. Kms
Vincenso Sagun, Zamboanga del Sur Agroforestry 1 2,979,120.00 100.00 42.56 32.07 955,425.00
Watershed Refo 1 227,850.00 10.00 3.26 63.20 144,000.00 Riverbank 1 360,600.00 10.00 5.15 0.00 UPLAND 3 3,567,570.00 110.0 10.00 50.97 1,099,425.00
Fish Sanctuary 1 3,011,730.00 70.00 43.02 30.37 914,600.00 Mangrove Rehab 1 420,700.00 20.00 6.01 0.00
COASTAL 2 3,432,430.00 90.00 49.03 26.65 914,600.00 TOTAL 5 7,000,000.00 200.00 10.00 100.00 28.77 2,014,025.00

Accomplishment on GEF Sites Region IX
Physical Status GEF Sites as of March 15, 2013
Covered LGU No. of SPs
Subproject Cost (P)
Target Area Relative Weight
Accomp. (%)
Value of Accomp. (P) Has. Kms
Mabuhay, Zamboanga Sibugay Agroforestry 1 3,587,210.00 62.00 51.25 34.57 1,240,000.00
UPLAND 1 3,587,210.00 62.0 51.25 34.57 1,240,000.00 Fish Sanctuary 1 1,897,907.00 30.00 27.11 56.96 1,081,050.00
Mangrove Rehab 1 1,514,883.00 100.00 21.64 19.80 300,000.00 COASTAL 2 3,412,790.00 130.00 48.75 40.47 1,381,050.00
TOTAL 3 7,000,000.00 192.00 0.00 100.00 37.44 2,621,050.00

Accomplishment on GEF Sites Region IX
Physical Status GEF Sites as of March 15, 2013
Covered LGU No. of SPs
Subproject Cost (P)
Target Area Relative Weight
Accomp. (%)
Value of Accomp. (P) Has. Kms
Talusan, Zamboanga Sibugay Agroforestry 1 3,942,197.00 82.00 56.32 0.00 0.00
UPLAND 1 3,942,197.00 82.0 56.32 0.00 0.00 Fish Sanctuary 1 1,570,569.00 42.50 22.44 52.30 821,469.00
Mangrove Rehab 1 1,487,234.00 75.00 21.25 0.00 - COASTAL 2 3,057,803.00 117.50 43.68 26.86 821,469.00
TOTAL 3 7,000,000.00 199.50 0.00 100.00 11.74 821,469.00

Accomplishment on GEF Sites Region IX
Physical Status GEF Sites as of March 15, 2013
Covered LGU No. of SPs
Subproject Cost (P)
Target Area Relative Weight
Accomp. (%)
Value of Accomp. (P) Has. Kms
Olutanga, Zamboanga Sibugay Agroforestry 1 1,700,000.00 32.00 24.29 0.00 0.00
UPLAND 1 1,700,000.00 32.0 24.29 0.00 0.00 Fish Sanctuary 1 3,300,000.00 70.00 47.14 26.18 864,000.00
Mangrove Rehab 1 2,000,000.00 55.00 28.57 0.00 - COASTAL 2 5,300,000.00 125.00 75.71 16.30 864,000.00
TOTAL 3 7,000,000.00 157.00 0.00 100.00 12.34 864,000.00

Accomplishment on GEF Sites Region XIII
Physical Status GEF Sites as of March 15, 2013
Covered LGU No. of SPs
Subproject Cost (P)
Target Area Relative Weight
Accomp. (%)
Value of Accomp. (P) Has. Kms
Marihatag, Surigao del Sur Agroforestry 1 4,529,463.00 200.00 64.71 75.65 3,426,442.00 Riverbank 1 1,163,117.00 20.00 16.62 80.64 937,915.00 UPLAND 2 5,692,580.00 220.0 81.32 76.67 4,364,357.00
Fish Sanctuary 1 1,307,421.00 10.30 18.68 45.44 594,100.00 COASTAL 1 1,307,421.00 10.30 18.68 45.44 594,100.00
TOTAL 3 7,000,001.00 230.30 0.00 100.00 70.84 4,958,457.00

Accomplishment on GEF Sites Region XIII
Physical Status GEF Sites as of March 15, 2013
Covered LGU No. of SPs
Subproject Cost (P)
Target Area Relative Weight
Accomp. (%)
Value of Accomp. (P) Has. Kms
San Agustin, Surigao del Norte Agroforestry 1 2,569,642.20 60.00 36.71 86.71 2,228,084.20 Riverbank 1 1,536,917.00 24.80 21.96 62.20 955,918.00 UPLAND 2 4,106,559.20 60.00 24.80 58.67 77.53 3,184,002.20
Fish Sanctuary 1 1,477,740.00 12.00 21.11 68.75 1,015,947.00 Mangrove Rehab 1 1,415,700.00 30.00 20.22 75.24 1,065,197.50
COASTAL 2 2,893,440.00 42.00 41.33 71.93 2,081,144.50 TOTAL 4 6,999,999.20 102.00 24.80 100.00 75.22 5,265,146.70

Accomplishment on GEF Sites A R M M
Physical Status GEF Sites as of March 15, 2013
Covered LGU No. of SPs
Subproject Cost (P)
Target Area Relative Weight
Accomp. (%)
Value of Accomp. (P) Has. Kms
Lamitan, Basilan Agroforestry 1 2,760,906.76 70.00 39.44 0.00 0.00
UPLAND 1 2,760,906.76 70.0 39.44 0.00 0.00
Fish Sanctuary 1 2,933,175.00 80.00 41.90 17.49 512,950.00 Mangrove Rehab 1 1,305,918.24 60.00 18.66 0.00 -
COASTAL 2 4,239,093.24 140.00 60.56 12.10 512,950.00 TOTAL 3 7,000,000.00 210.00 0.00 100.00 7.33 512,950.00

Accomplishment on GEF Sites A R M M
Physical Status GEF Sites as of March 15, 2013
Covered LGU No. of SPs
Subproject Cost (P)
Target Area Relative Weight
Accomp. (%)
Value of Accomp. (P) Has. Kms
Datu Blah Sinsuat, Maguindanao Agroforestry 1 2,049,000.00 60.00 29.27 56.53 1,158,233.75 Reforestation 1 2,049,000.00 40.00 29.27 45.13 924,687.80
Riverbank 1 524,000.00 16.00 7.49 6.98 36,600.00 UPLAND 3 4,622,000.00 100.00 16.00 66.03 45.86 2,119,521.55
Fish Sanctuary 1 2,378,000.00 100.00 33.97 20.32 483,259.00
COASTAL 1 2,378,000.00 100.00 33.97 20.32 483,259.00 TOTAL 4 7,000,000.00 200.00 16.00 100.00 37.18 2,602,780.55

Department of Agriculture MINDANAO RURAL DEVELOPMENT PROGRAM
Program Support Office
Department of Agriculture MINDANAO RURAL DEVELOPMENT PROGRAM
Program Support Office
0
5
10
15
20
25
30
35
Year 1 Year 2 Year 3 Total
0% 1-25 % 26-50% 51-75% 76-91% 92-100%
NRM No. of SPs 0% 1-‐25 % 26-‐50% 51-‐75% 76-‐91% 92-‐100% Year 1 24 0 0 0 0 0 24 Year 2 24 1 2 4 2 9 6 Year 3 42 7 6 13 11 2 3
Total 90 8 8 17 13 11 33
NRM OGIs Subproject Physical Status (as of March 15, 2013)

Department of Agriculture MINDANAO RURAL DEVELOPMENT PROGRAM
Program Support Office
Department of Agriculture MINDANAO RURAL DEVELOPMENT PROGRAM
Program Support Office
0
2
4
6
8
10
12
GEF 0% 1-25 % 26-50% 51-75% 76-91% 92-100%
No. of SPs 0 % 1 - 25 % 26 – 50 % 51 – 75 % 76 - 91% 92 – 100 %
39 11 6 9 9 4 0
GEF Site Subproject Physical Status (as of March 15, 2013)

Department of Agriculture MINDANAO RURAL DEVELOPMENT PROGRAM
Program Support Office
Department of Agriculture MINDANAO RURAL DEVELOPMENT PROGRAM
Program Support Office
Physical Status (Based on Actual Liquidation)
S I G A as of March 15, 2013
Covered LGU No. of SPs
Subproject Cost (P)
Beneficiaries Accomp. (%)
Value of Accomp. (P) Upland Coastal
Sibutad, Zamboanga Norte 0 2,500,000.00 0.00 0.00 0.00 0.00
Margosatubig, Zamboanga Sur 0 2,500,000.00 0.00 0.00 0.00 0.00 Vincenso Sagun, Zamboanga Sur 0 2,500,000.00 0.00 0.00 45.24 1,131,050.00
Rizal, Zamboanga Norte 0 2,500,000.00 0.00 0.00 0.00 0.00 Talusan, Zamboanga Sibugay 0 2,500,000.00 0.00 0.00 42.86 1,071,500.00
Olutanga, Zamboanga Sibugay 0 2,500,000.00 0.00 0.00 46.00 1,150,000.00 Mabuhay, Zamboanga Sibugay 0 2,500,000.00 0.00 0.00 48.08 1,202,000.00 San Agustin, Surigao del Sur 0 2,500,000.00 0.00 0.00 47.02 1,175,518.50 Marihatag, Surigao del Sur 0 2,500,000.00 0.00 0.00 50.00 1,250,000.00
Datu Blah Sinsuat, Maguindanao 0 2,500,000.00 0.00 0.00 34.62 865,480.00 Lamitan, Basilan 0 2,500,000.00 0.00 0.00 0.00 0.00
TOTAL 0 27,500,000.00 0.00 0.00 28.53 7,845,548.50

Department of Agriculture MINDANAO RURAL DEVELOPMENT PROGRAM
Program Support Office
Department of Agriculture MINDANAO RURAL DEVELOPMENT PROGRAM
Program Support Office
NRM and GEF Site Geo-‐tagging Status (as of March 15, 2013)
NRM and GEF Site
as of March 15, 2013
No. of SPs Area Target Geo tagging Status
Has. Kms Uploaded To finalize for uploading
On process
For Schedule
TOTAL NRM OGI 90 4,437 155 10 13 23 44
TOTAL GEF Sites 39 2,120.62 83.30 3 4 4 28
TOTAL 129 6,558 239 13 17 27 72

Department of Agriculture MINDANAO RURAL DEVELOPMENT PROGRAM
Program Support Office
Department of Agriculture MINDANAO RURAL DEVELOPMENT PROGRAM
Program Support Office

Department of Agriculture MINDANAO RURAL DEVELOPMENT PROGRAM
Program Support Office
Department of Agriculture MINDANAO RURAL DEVELOPMENT PROGRAM
Program Support Office

Department of Agriculture MINDANAO RURAL DEVELOPMENT PROGRAM
Program Support Office
Department of Agriculture MINDANAO RURAL DEVELOPMENT PROGRAM
Program Support Office
PARTNER AGENCIES Status of Operational Funds
as of January 28, 2013
Agency FUND RELEASES as of December 31, 2012 Liquidation
2008 2009 2010 2011 2012 T O T A L Total % DENR IX 250,000.00 400,000.00 400,000.00 400,000.00 1,450,000.00 671,111.52 46.28 DENR X 250,000.00 400,000.00 400,000.00 1,050,000.00 650,010.00 61.91 DENR XII 250,000.00 75,000.00 400,000.00 400,000.00 400,000.00 1,525,000.00 971,675.35 63.72 DENR XII 250,000.00 75,000.00 400,000.00 400,000.00 400,000.00 1,525,000.00 605,294.57 39.69 DENR XIII 250,000.00 75,000.00 400,000.00 400,000.00 400,000.00 1,525,000.00 833,050.41 54.63 DENR ARMM 250,000.00 400,000.00 400,000.00 400,000.00 1,450,000.00 807,454.20 55.69 NCIP IX 83,333.00 250,000.00 333,333.00 88,938.00 26.68 NCIP X 83,333.00 250,000.00 250,000.00 250,000.00 833,333.00 583,580.56 70.03 NCIP XI 83,333.00 250,000.00 250,000.00 583,333.00 193,988.12 33.26 NCIP XII 83,333.00 83,333.00 74,965.00 89.96 NCIP XIII 83,333.00 50,000.00 250,000.00 250,000.00 250,000.00 883,333.00 515,240.33 58.33 OSCC ARMM 83,333.00 250,000.00 333,333.00 0.00 BSWM 500,000.00 1,500,000.00 1,500,000.00 1,500,000.00 5,000,000.00 2,821,752.28 56.44 BFAR CO 1,500,000.00 1,500,000.00 1,236,205.82 82.41 BFAR IX 400,000.00 400,000.00 800,000.00 0.00 BFAR X 400,000.00 400,000.00 400,000.00 1,200,000.00 799,378.98 66.61 BFAR XI 400,000.00 200,000.00 400,000.00 1,000,000.00 346,937.25 34.69 BFAR XII 400,000.00 400,000.00 0.00 BFAR XIII 400,000.00 400,000.00 400,000.00 1,200,000.00 794,438.00 66.20 BFAR ARMM 400,000.00 400,000.00 400,000.00 1,200,000.00 385,024.00 32.09
GRAND TOTAL 3,999,998.00 275,000.00 6,900,000.00 6,050,000.00 6,650,000.00 23,874,998.00 12,379,044.39 51.85

Department of Agriculture MINDANAO RURAL DEVELOPMENT PROGRAM
Program Support Office
Department of Agriculture MINDANAO RURAL DEVELOPMENT PROGRAM
Program Support Office
Good Day!!

Department of Agriculture MINDANAO RURAL DEVELOPMENT PROGRAM
Program Support Office
Department of Agriculture MINDANAO RURAL DEVELOPMENT PROGRAM
Program Support Office
NRM and GEF Subproject Physical Status
Accomp. % Rate
Region IX Region X Region XI Region XII Region XIII ARMM TOTAL
Unit Cost Unit Cost Unit Cost Unit Cost Unit Cost Unit Cost Unit Cost
0% 10 15.3 0 2 2.1 1 1.5 2 2.6 4 6.3 19 27.8
1-‐25 % 4 2.8 2 0.8 0 2 1.3 1 0.6 5 1.7 14 7.1
26-‐50 % 9 8.6 5 4.1 2 0.6 0 6 4.2 4 2.3 26 19.8
51-‐75 % 6 5.8 3 2.8 3 3.7 4 6.5 4 3.9 2 3.8 22 26.5
76-‐91 % 3 2.9 1 1.9 3 8.7 1 1.2 4 8.3 3 4.9 15 27.9
92-‐100 % 9 17.7 3 6.6 3 6.0 4 6.9 7 9.1 7 6.9 33 53.2
TOTAL 41 53.1 14 16.0 13 21.1 12 17.3 24 28.8 25 26.0 129 162.3