update to the 2016 registration document and …update to the 2016 registration document and...
TRANSCRIPT

Natixis Update to the 2016 Registration Document 1
Public limited company (société anonyme) with a share capital of €5,019,776,380.80 Registered office: 30 avenue Pierre Mendès France, 75013 Paris 542 044 524 Paris Trade Registry
UPDATE TO THE 2016 REGISTRATION DOCUMENT AND HALF-YEAR FINANCIAL REPORT Update of the 2016 Registration Document and annual financial report filed with the French Financial Markets Authority (Autorité des Marchés Financiers) on March 21, 2017 under number D.17-0195. This update was filed with the French Financial Supervisory Authority on August 9, 2017 under number D.17-0195-A01. The English version of this report is a free translation from the original which was prepared in French. All possible care has been taken to ensure that the translation is an accurate presentation of the original. However, the original language version of the document in French prevails over the translation.
This update of the 2016 Registration Document was filed with the French Financial Markets Authority on August 9, 2017, in accordance with Article 212-13 of the general regulations of the French Financial Markets Authority. It may be used in connection with a financial transaction only if accompanied by a transaction note approved by the Financial Markets Authority. The document has been prepared by the issuer and its signatories incur liability in this regard.

Natixis Update to the 2016 Registration Document 2
CONTENTS
UPDATE BY CHAPTER OF THE 2016 REGISTRATION DOCUMENT
I PRESENTATION OF NATIXIS
p.3
1.1 Press Releases subsequent to the submission of the registration document
p.3
1.2 Results as at June 30, 2017 : Press release
p.7
II SECTION 2: CORPORATE GOVERNANCE
p.34 2.1 Corporate governance
p.34
2.2 Additional information on the director's positions
p.40 2.3 Management and oversight of corporate governance
p.41
2.4 Natixis Compensation Policy
p.42
III SECTION 3: RISKS AND CAPITAL ADEQUACY
p.43 3.1 Introduction
p.43
3.3 Capital management and capital adequacy
p.43 3.4 Credit and counterparty risks
p.48
3.6 Market risks
p.51 3.8 Liquidity risk and refinancing strategy
p.55
3.9 Legal risks
p.60 3.10 Other risks
p.63
3.11 Sensitive exposures
p.67
IV SECTION 4: OVERVIEW OF THE FISCAL YEAR
p.69 4.1 Interim management report as of June 30, 2017
p.69
V SECTION 5: FINANCIAL DATA
p.91 5.1 Financial data (interim consolidated financial statements and notes)
p.91
5.2 Statutory Auditors' report on 2017 interim financial information
p.156
VI SECTION 7: LEGAL INFORMATION
p.158 7.1 Natixis Bylaws
p.158
7.3 Distribution of share capital and voting rights
p.158
VII SECTION 8: ADDITIONAL INFORMATION
p.160
8.1 Statement by the person responsible for the Registration Document Update
p.160
8.2 Documents available to the public
p.160 8.3 Cross-reference table of registration document
p.161
8.4 Cross-reference table for the half-year financial report
p.163
8.5 Cross-reference table between articles of the CRR, Basel Committee/EBA and statements, and the Pillar III report
p.164
8.6 Table index
p.167 8.7 Persons responsible for auditing the financial statements
p.170

Update to the 2010 Registration Document Page 3/171
I SECTION 1: PRESENTATION OF NATIXIS 1.1 Press Releases subsequent to the submission of the registration document 1.1.1 Press release dated March 28th, 2017
Natixis, IBM and Trafigura introduce first-ever Blockchain solution for U.S. crude oil
market March 28th, 2017 – Natixis, IBM and Trafigura have pioneered the first blockchain solution in commodity trade finance for US crude oil transactions. The distributed ledger platform, built on the Linux Foundation open source Hyperledger Fabric, allows major steps in a crude oil transaction to be digitized on the blockchain, ensuring improved transparency, enhanced security, and optimized efficiency. By having the buyer, seller and their respective banks all on the same ledger, all parties can simultaneously view and share data on the status of a transaction, from the time a new trade is confirmed and validated, to when the crude oil is inspected, to its final delivery and cancellation of the letter of credit. Key benefits of the solution include reduced cash cycle times, improved efficiency via lower overhead costs and fewer cost intermediaries, increased transaction visibility to help reduce the threat of tampering, fraud and cyber-crime, and the creation of transparent transactions by using shared processes and recordkeeping. This initiative is part of a broader effort to modernize trading in the global crude oil industry, which today is predominantly driven by manual, non-digital processes. “Natixis wants to use blockchain to enhance client service by optimizing the antiquated arena of commodity trade finance,” said Arnaud Stevens, Natixis’ New York Head of Global Energy & Commodities. “The current process is paper and labor intensive, we have multiple friction points with high processing costs and limited automation. Distributed ledger technology brings some much-needed innovation into our industry.” The new trading platform allows trade documents, shipment updates, delivery and payment status to be shared across a single shared ledger, helping to reduce transaction time, duplication of documents and authentication processes among all trading partners. Traditionally these transactions require complex workflows and paper-based processes in which documentation is shared through courier, fax and email exchange. The solution, which is hosted on IBM's cloud platform, Bluemix, was led and delivered by IBM France. “Processes in the energy and commodities trade business are ripe for improvement,” said James Wallis, Vice President, blockchain markets and engagements, IBM. “The approach we are taking, using a permissioned blockchain network built on the Hyperledger Fabric, has the potential to transform the crude oil industry by creating consistency in trade finance and by digitizing transactions and information sharing. Creating this ecosystem for the commodities market working with two world leaders in this industry will help create an entirely new approach to managing the global commodities trade." The platform will soon be expanded to allow all parties in the transaction to enter data directly onto the blockchain. For example, the shipping company, pipeline operator, inspector or warehouse can provide real-time status updates via the blockchain on the crude oil transaction, helping lower the risk of fraudulent transactions. More importantly, the distributed ledger for crude oil transactions is designed to be adopted at scale across the entire industry. By creating a shared permissioned ledger for use across all trading partners, including multiple buyers, sellers, banks and trading partners, even further efficiencies can be anticipated. “Together with Natixis and IBM, we have analyzed the workflow of crude oil transactions in the US, detailing the different steps of a transaction, our interactions with the financial institutions and the documents exchanged among the various parties,” said Rodney Malcolm, Trafigura Trading’s North American Chief Financial Officer. “The goal is to replace paper-heavy manual processes with blockchainbased workflows to improve transparency and data sharing. With the distributed ledger technology, all transaction participants in the network are updated simultaneously with a
Natixis Update to the 2016 Registration Document 4
record that cannot be altered or tampered with. Each change or new transaction immediately creates a new record in the shared ledger.” Natixis’ CIB Head of Digital, Frederic Dalibard said, “This partnership with IBM and Trafigura represents great momentum for Natixis and supports our aim to move distributed ledger technology from vision to execution.”
1.1.2 Press release dated April 11, 2017
Natixis completes the acquisition of PayPlug and confirms its ambitions on the e-
commerce market Natixis has just completed the purchase of a majority interest in PayPlug, thereby reinforcing its development ambitions for the Payment business line in France and Europe. The deal(1) is coupled with a €7m capital increase for PayPlug, designed to fund the rapid growth of this new-generation online payment solution. The French startup PayPlug, founded in 2012, markets a proprietary online payment solution enabling e-merchants to increase their sales, while also securing their transactions via a fraud prediction technology based on machine learning. The acquisition of this fintech reinforces the full digital offering of the Payment business line which groups together all Groupe BPCE’s payment activities (Natixis Payment Solutions, Natixis Intertitres, PayPlug, S-money and its subsidiaries Depopass, E-Cotiz, Le Pot Commun). It is also consistent with the aim of offering merchants ever more agile solutions suited to new usages. The Payment business line develops services for merchants and solutions for consumers including prepaid services. Its diversified offering is underpinned by an approach combining technology, business orientation and entrepreneurial momentum. For Catherine Fournier, Head of Payment business line, “We need acquisitions to enhance our offering and accelerate our growth on this fast-changing market. PayPlug provides us with a very easy-to-use solution that has proved its worth with small and medium-sized merchants by demonstrating a close understanding of their needs. We can now work together on some fine challenges while respecting the agility that forms part of PayPlug’s DNA.” For Camille Tyan and Antoine Grimaud, founders of PayPlug who continue to head the company, “Natixis’ investment in our company is vital to continue expanding our business not just in France, but also in Spain and Italy, and to move into new European markets. It will also allow us to develop new features in order to respond ever-better to e-merchants’ needs, particularly by improving their conversion rates and the levels of security PayPlug offers. Once operational, this tie-up with Natixis will ensure we retain our agility. It therefore represents a genuine business opportunity, and also a human one, given that our teams share the same ambition to distinguish ourselves in the payment world.” (1) Authorized by Autorité de Contrôle Prudentiel et de Résolution (ACPR)

Natixis Update to the 2016 Registration Document 5
1.1.3 Press release dated April 19, 2017 Free share allocation for the Chief Executive Officer of Natixis Board of Directors’ decision of
April 10, 2017 On April 10, 2017, based on the positive opinion of the Compensation Committee, and as authorized by Natixis' General Shareholders' Meeting held on May 24, 2016 in its 20th resolution, Natixis' Board of Directors granted free shares to certain categories of employees. The Chief Executive Officer was granted 53 841 shares, of which 17 947 shares will only be vested in March 2019 and 35 894 shares in March 2020, and subject to a 6 month lockin period as well as to performance conditions being assessed on the basis of the gross operating income after deduction of variable remunerations and cost of risk, and on Natixis' compliance with its regulatory obligations in terms of capital requirements. Furthermore, 30% of the shares delivered to the Chief Executive Officer at the end of the vesting periods will be subject to a lock-in period ending upon the termination of his office as Chief Executive Officer of Natixis. 1.1.4 Press release dated May 24, 2017 Free share allocation for the Chief Executive Officer of Natixis Board of Directors’ decision of
May 23, 2017 On May 23, 2017, based on the positive opinion of the Compensation Committee, and as authorized by Natixis' General Shareholders' Meeting held on May 24, 2016 in its 19th resolution, Natixis' Board of Directors granted performance shares to the members of the Senior Management Committee; 29 911 performance shares are allocated to the Chief Executive Officer, which can lead to a maximum acquisition of 32 902 securities, depending on the attainment of the performance condition. The purpose of this allocation is to strengthen the alignment over time between shareholders' interests and those of senior management. The shares will only be vested at the end of a four-year period and subject to performance and presence conditions. The performance condition has been defined based on the relative performance (Total Shareholder Return) of Natixis’ share against that of other banking institutions making up the Euro Stoxx Banks index. Furthermore, 30% of the shares delivered to the Chief Executive Officer at the end of the Vesting Period will be subject to a lock-in period ending upon the termination of his office as Chief Executive Officer of Natixis. 1.1.5 Press release dated June 26, 2017
Natixis and Dalenys join forces in payment solutions for retailers and e-commerce Natixis announces the signature of an agreement to acquire 50.04% of the capital of Dalenys (representing 58.09% of its voting rights) from Saint-Georges Finance and Jean-Baptiste Descroix-Vernier at a price of 9 EUR per share. Completion of the transaction is subject to several conditions precedent, in particular, the authorization from the regulatory authorities. The telecom activity of Dalenys will be divested prior to the closing of the transaction. In accordance with Belgian stock market regulation, once the transaction is completed, a public bid will be launched for Dalenys’ remaining capital, listed on the Euronext stock exchanges in Brussels (EBR: NYS) and Paris (C compartment). The acquisition will be financed out of Natixis’ own funds. The estimated impact for 100% of the acquisition on Natixis CET1 ratio at end-March 2017 is around -10 bps. This announcement confirms Natixis’ strategic ambition to become one of the European leaders in the payments industry, particularly for merchant services. The acquisition of Dalenys strengthens Natixis’ range of payment solutions for e-retailers on a fast-growing market with transaction volume in Europe in excess of €500bn. This transaction rounds out the Groupe BPCE’s commercial set-up, enabling it to develop new services based on data analysis, and provide innovative digital offerings for mid-sized and large retailers in Europe.

Natixis Update to the 2016 Registration Document 6
The acquisition of Dalenys is part of the creation of the Payment business line at Natixis at the end of 2016, bringing together Natixis Payment Solutions, Natixis Intertitres and S’money, along with the acquisition of Fintech PayPlug, which was finalized in April 2017. Dalenys will increase Natixis Payment Solutions’ international client base and will pave the way for a rapid European expansion. Gils Berrous, Member of Natixis’ Senior Management Committee, Head of Specialized Financial Services division: “We are very delighted to develop, with Dalenys teams, a major player in e-commerce, on a European scale. We are convinced that Dalenys’ client relationship model, based on an excellent insight into their needs and an integrated distribution system, will help increase value for our clients over the long term”. Thibaut Faurès Fustel de Coulanges, Chief Executive Officer of Dalenys: “It is a great pride for Dalenys to join Natixis. This combination illustrates the strategic nature of Payments in the digital transformation of Group BPCE and its approach vis-à-vis technology companies and entrepreneurs. Together, Natixis and Dalenys, the first French Fintech1, are able to accompany the major European merchants (online and offline) on their cross-border problems, their marketplace or omnicanal sales management projects throughout the zone SEPA“. 1) According to Frenchweb in 2016 and 2017

Natixis Update to the 2016 Registration Document 7
1.2 Results as at June 30, 2017: Press release dated August 1, 2017
2Q17 and 1H17 RESULTS
REVENUES rose 9% to over €2.4bn in 2Q17 Reported NET INCOME climbed 28% to €487m in 2Q17 and 32% in 1H17 to
€768m
FURTHER GROWTH MOMENTUM IN CORE BUSINESSES
INVESTMENT SOLUTIONS: SOUND EXPANSION IN INSURANCE AND GOOD LEVEL OF NET INFLOWS IN ASSET MANAGEMENT
Insurance: overall turnover amounting to €6.4bn, up 81%/1H16, excluding the reinsurance treaty with CNP
Asset management: €9bn in net inflows in 2Q17 (€14bn in 1H17) and €834bn of AuM at end-June 2017
CIB: STRONG ACTIVITY LEVELS FOR ALL BUSINESS LINES
Global markets: net revenues (excluding the CVA/DVA desk) up 20% vs. 2Q16, with net revenues rising 13% for FICT and 33% for Equity
Global finance & Investment banking: net revenues up 16% vs. 2Q16, driven by M&A and Investment banking
Increased contribution to revenues from international platforms, up to 57% in 1H17
SFS: GOOD COMMERCIAL DYNAMICS, REINFORCEMENT IN PAYMENTS
Fine performances in Specialized Financing (net revenues +3% vs. 2Q16)
Payments: new step forward in the merchant services sector with the proposed acquisition of 50.04% stake in Dalenys signed on June, 26
MARKED INCREASE IN PROFITABILITY IN 2Q17 AND 1H17(1)
Core-business net revenues up 12% in 2Q17 and 13% in 1H17, to €2.3bn and €4.5bn,
respectively, fueled by Investment Solutions and CIB
Improvement in cost of risk for core businesses to 31bps in 2Q17 and 28bps in 1H17
Reported net income (group share) of €487m in 2Q17 (+28%/2Q16) and €768m in 1H17 (+32%/1H16)
Core-business ROE: 16.1% in 2Q17 (+140bps/2Q16) and 16% in 1H17 (+260bps/1H16)
Natixis ROTE of 13.7% in 2Q17 (+200bps/2Q16) and 13.1% in 1H17 (+270bps/1H16), above the
New Frontier target
MAIN OBJECTIVES OF THE PLAN ACHIEVED: SUCCESS OF THE ASSET LIGHT MODEL
18% drop in RWA for CIB and 6% decline for Natixis since end-2013
Reinforcement of franchises in Asset Light activities: Asset management, M&A and Payments
Share of capital allocated to Investment Solutions up to 35% at end-June 2017 vs. 29% at end-2013
CET1 ratio(2)
of 11.3% at end-June 2017 after factoring in a projected minimum dividend payout of 50%
(1) Excluding exceptional items and the IFRIC 21 impact for ROE and ROTE (2) Based on CRR-CRD4 rules published on June 26, 2013, including the Danish compromise - no phase-in except for DTAs on loss carry-forwards

Natixis Update to the 2016 Registration Document 8
The Board of Directors approved Natixis’ accounts for second-quarter 2017 on August 1st
, 2017.
For Natixis, the main features of 2Q17 were:
revenue growth of 12% yoy to €2.298bn for core businesses and 9% yoy to €2.410bn for Natixis.
Growth in the Investment Solutions (net revenues +11% yoy to €920m) was underpinned by the diversity and adaptation of the product range, both in Asset management and Insurance, where revenues advanced by 12% yoy to €696m and 13% yoy to €177m, respectively.
Asset management recorded €9bn of net inflow during the quarter, including €8bn on long-term products, while AuM were down by €3bn vs. end-March 2017to €834bn, due to adverse exchange-rate effects.
In Insurance, momentum remained robust in all segments and overall turnover (excluding the reinsurance treaty with CNP) climbed 78% vs. 2Q16 to reach €3bn.
Corporate & Investment banking also enjoyed strong momentum across all business lines, while continuing to strengthen its international franchises, particularly in Asia. All in all, revenues grew 16% vs. 2Q16 and reached €1bn. The quarter was notably boosted by further strong growth in Investment banking and by significant yoy expansion in revenues from Fixed-Income and Derivative solutions in the Capital markets field.
Specialized Financial Services grew net revenues by 2% to €347m, buoyed by solid performances in Sureties and Guarantees (net revenues +7%) and Leasing (net revenues +3%).
a tight grip on operating expenses, which rose only 5% yoy to €1.594bn,
a significant improvement in cost-income ratio, excluding IFRIC 21(1), to 66,5%, down 280bps vs. 2Q16,
a drop in cost of risk for core businesses to €63m vs. €71m in 2Q16, with the year-earlier period having been marked by the provisions set aside on the Oil & Gas sector,
28% growth in reported net income (group share) to €487m,
core-business ROE(1) of 16.1% excluding the IFRIC 21 impact,
a CET1 ratio(2)
of 11.3% at end-June 2017,
a leverage ratio(1) of 4.3% at end-June 2017.
Laurent Mignon, Natixis Chief Executive Officer, said: “After faring well in the first quarter 2017, Natixis enjoyed a fine second quarter, fueled particularly by sharp increases in both revenues and profitability in core businesses. These results testify to the successful application of our asset light strategy across all of our business lines with the resolute development of our Asset management, Insurance, M&A and Payments activities whether in the financing area, where our Originate-to-Distribute model is working effectively. In order to enhance our agility and efficiency, and to continue expanding our business and leveraging our talents, we began work in the second quarter on an in-depth transformation of our organizations, processes and working methods, with the aim of seizing all the opportunities offered by innovation. These initiatives will leave us well-placed for the start of our new strategic plan in 2018”.
(1) See note on methodology
(2) Based on CRR-CRD4 rules published on June 26, 2013, including the Danish compromise without phase-in except for DTAs on tax-loss carryforwards

Presentation of Natixis 1 Results presentation
Natixis Update to the 2016 Registration Document 9
1 – NATIXIS 2Q17 AND 1H17 RESULTS
€m
2Q17
2Q17 o/w
recurring o/w
exceptional
1H17 1H17 o/w
recurring o/w
exceptional reported vs.
2Q16
reported vs.
1H16
Net revenues
2,410 9% 2,458 (49) 4,756 11% 4,816 (60)
o/w core businesses
2,298 12% 2,298 - 4,518 13% 4,518 -
Expenses
(1,594) 5% (1,584) (11) (3,365) 8% (3,327) (38)
Gross operating income
815 18% 875 (60) 1,391 21% 1,490 (98)
Provision for credit losses
(67) (23)% (67) - (138) (22)% (138) -
Pre-tax profit
772 37% 831 (60) 1,294 33% 1,392 (98)
Income tax
(255) 21% (274) 19 (469) 23% (501) 32
Minority interests
(29) nm (29) - (57) nm (57) -
Net income – group share
487 28% 528 (40) 768 32% 834 (66)
1.1 EXCEPTIONAL ITEMS
€m 2Q17 2Q16 1H17 1H16
Exchange rate fluctuations on DSN in currencies (Net revenues)
Corporate center (49) 8
(60) (7)
Transformation & Business Efficiency Investment costs (Expenses)
Business lines & Corporate center (11)
(1)
(20)(1)
Non-recurring additional Corporate Social Solidarity Contribution resulting from agreement with CNP (Expenses)
Insurance
(19)
Goodwill impairment on Coface (change in value of goodwill) Financial investments
(75)
(75)
FV adjustment on own senior debt (Net revenues) Corporate center (20)
(26)
Impact in income tax 19 4 32 11
Impact in minority interest 44 44
Total impact in net income (gs) (40) (39)
(66) (53)
(1) o/w €9m in Corporate Center in 2Q17 and €16m in 1H17

Presentation of Natixis 1 Results presentation
Natixis Update to the 2016 Registration Document 10
1.2 2Q17 RESULTS
Excluding exceptional items
(1)
2Q17 2Q16
2Q17
€m vs. 2Q16
Net revenues
2,458 2,224 11%
o/w core businesses 2,298 2,060 12%
Expenses (1,584) (1,522) 4%
Gross operating income
875 702 25%
Provision for credit losses (67) (88) (23)%
Pre-tax profit
831 651 28%
Income tax (274) (215) 28%
Minority interest (29) (16) 82%
Net income – (gs) – restated
528 420 26%
€m
2Q17 2Q16
2Q17
vs. 2Q16
Restatement of IFRIC 21 impact (46) (20)
Net income – (gs) – restated excl.
482 400 20% IFRIC impact
ROTE excl. IFRIC 21 impact
13.7% 11.7%
(1) See page 3
Unless stated otherwise, the commentary that follows refers to results excluding exceptional items (see detail p3). Natixis posted €2.458bn in net revenues in 2Q17, an 11% increase yoy. Net revenues from core businesses advanced 12% yoy to €2.298bn, fueled notably by Corporate & Investment Banking and Investment Solutions, which improved revenues by 16% and 11% yoy, respectively. Specialized Financial Services with a 2% increase of their revenues relative to 2Q16 maintained good performances. Net revenues from Financial Investments improved slightly compared to the year-earlier period and reached €156m. This figure included a 10% yoy increase in revenues from Coface. Operating expenses came out at €1.584bn in 2Q17. The 4% yoy increase was well below the pace of revenue growth and testified to the tight grip exerted on costs. As a result, the cost-income ratio excluding IFRIC 21 improved by 280bps vs. 2Q16 to reach 66.5%. Gross operating income made strong progress to €875m, up 25% yoy.

Presentation of Natixis 1 Results presentation
Natixis Update to the 2016 Registration Document 11
The provision for credit loss improved substantially relative to 2Q16, dropping 23% to €67m. Expressed in basis points of the loan book (excluding credit institutions), the core-business provision for credit loss worked out to 31bps in 2Q17 vs. 37bps in 2Q16, the improvement being fueled primarily by Corporate & Investment Banking. Tax expense in 2Q17 included €32m of tax levied on dividends paid in respect of 2016. The 82% yoy jump in minority interests stemmed from fine performances by certain Asset Management affiliates (primarily H2O). Net income (group share) adjusted for the IFRIC 21 impact and excluding exceptional items came out at €482m in 2Q17, a 20% yoy increase. After including exceptional items (-€40m impact net of tax in 2Q17) and IFRIC 21 (+€46m impact in 2Q17), reported net income (group share) advanced 28% yoy to €487m. Excluding IFRIC 21, Natixis’ ROTE equated to 13.7% and core-business ROE amounted to 16.1%, up 200bps and 140bps, respectively, relative to 2Q16.
1.3 1H17 RESULTS
Excluding exceptional items
(1)
1H17 1H16
1H17
€m vs. 1H16
Net revenues
4,816 4,307 12%
o/w core businesses 4,518 4,009 13%
Expenses (3,327) (3,127) 6%
Gross operating income
1,490 1,180 26%
Provision for credit losses (138) (176) (22)%
Pre-tax profit
1,392 1,078 29%
Income tax (501) (395) 27%
Minority interest (57) (50) 14%
Net income – (gs) – restated
834 633 32%
€m
1H17 1H16
1H17
vs. 1H16
Restatement of IFRIC 21 impact 83 78
Net income – (gs) – restated excl.
917 711 29% IFRIC impact
ROTE excl. IFRIC 21 impact
13.1% 10.4%
(1) See page 3
Unless stated otherwise, the commentary that follows refers to results excluding exceptional items (see detail p3).

Presentation of Natixis 1 Results presentation
Natixis Update to the 2016 Registration Document 12
Natixis posted net revenues of €4.816bn in 1H17, a 12% increase compared to the year-earlier period. During the first six months of the year, core-business net revenues advanced 13% to €4.518bn. First-half 2017 featured a rebound in Asset Management, robust activity levels in Global Markets and strong growth in Insurance business lines. Net revenues from Financial Investments fell 9% yoy in 1H17, reflecting contractions in revenues at Coface and for Corporate Data Solutions. Operating expenses increased 6% yoy, with fixed costs rising only 4%. The cost-income ratio excluding IFRIC 21 improved by 3.3pps in 1H17 vs. 1H16 and worked out to 67.2%. Gross operating income climbed 26% yoy to €1.490bn. The overall provision for credit loss decreased 22% relative to 1H16 and totaled €138m. 1H16 had been marked by provisioning efforts on the Oil & Gas sector. Pre-tax profit advanced 23% yoy to over €1.6bn for core businesses, and 29% to €1.4bn for Natixis. Net income (group share) adjusted for the IFRIC 21 impact and excluding exceptional items came out at €917m in 1H17, a 29% yoy increase. After including exceptional items (-€66m impact net of tax in 1H17) and IFRIC 21 (-€83m impact in 1H17), reported net income (group share) advanced 32% yoy to €768m. Excluding IFRIC 21, Natixis’ ROTE equated to 13.1% and core-business ROE amounted to 16.0%, up 270bps and 260bps, respectively, relative to 1H16.
2 – FINANCIAL STRUCTURE
Natixis’ Basel 3 CET1 ratio
(1) worked out to 11.3% at June 30, 2017.
Based on Basel 3 CET1 ratio of 11.0% at March 31, 2017, the respective impacts in the second quarter of 2017 were as follows: - effect of allocating net income (group share) to retained earnings in 2Q17: +43bps, - planned dividend for 2Q17: -18bps, - RWA, FX and other effects: +8bps.
Basel 3 capital and risk-weighted assets(1)
amounted to €12.8bn and €112.6bn, respectively, at June 30, 2017.
EQUITY CAPITAL – TIER ONE CAPITAL – BOOK VALUE PER SHARE Equity capital (group share) totalled €19.5bn at June 30, 2017, of which €2.1bn was in the form of hybrid securities (DSNs) recognized in equity capital at fair value (excluding capital gain following reclassification of hybrids).
Core Tier 1 capital (Basel 3 – phase-in) stood at €12.6bn and Tier 1 capital (Basel 3 – phase-in) at €14.7bn.
Natixis’ risk-weighted assets totalled €112.6bn at June 30, 2017 (Basel 3 – phase-in), breakdown as following:
- Credit risk: €79.1bn

Presentation of Natixis 1 Results presentation
Natixis Update to the 2016 Registration Document 13
- Counterparty risk: €7.0bn - CVA risk: €1.7bn - Market risk: €10.8bn - Operational risk: €14.0bn
Under Basel 3 (phase-in), the CET1 ratio amounted to 11.2%, the Tier 1 ratio to 13.1% and the total solvency ratio to 15.4% at June 30, 2017. Book value per share, was €5.48 at June 30, 2017 based on 3,135,383,861 shares excluding treasury stock (the total number of shares stands at 3,137,360,238). Tangible book value per share (after deducting goodwill and intangible fixed assets) was €4.35. LEVERAGE RATIO
(2)
The leverage ratio worked out to 4.3% at June 30, 2017.
OVERALL CAPITAL ADEQUACY RATIO As at June 30, 2017, the financial conglomerate’s capital excess was estimated at around €3bn.
(1) Based on CRR-CRD4 rules as reported on June 26, 2013, including the Danish compromise - without phase-in except for DTAs on tax-loss carryforwards
(2) See note on methodology
3 – RESULTS BY BUSINESS LINE
Investment Solutions Data excludes exceptional items
(1)
€m 2Q17 2Q16 2Q17
vs. 2Q16 1H17
1H17 vs. 1H16
1H17 vs. 1H16.
constant exchange
rate
Net revenues 920 832 11% 1,811 9% 8%
o/w Asset management 696 623 12% 1,363 9% 7%
o/w Insurance 177 156 13% 364 13%
o/w Private Banking 30 33 (9)% 64 (6)%
Expenses (619) (579) 7% (1,244) 6% 5%
Gross operating income 301 253 19% 566 16% 14%
Provision for credit losses 0 0
0
Gain or loss on other assets 0 (1) 9
Pre-tax profit 303 253 20% 582 14% 13%
Cost/income ratio(1)
67.8% 70.0% (2.2)pp 68.2% (1.9)pp
ROE after tax(1)
14.2% 13.8% +0.4pp 14.4% +0.2pp
(1) See note on methodology and excluding IFRIC 21 impact on the calculation of the cost-income ratio and ROE

Presentation of Natixis 1 Results presentation
Natixis Update to the 2016 Registration Document 14
Investment Solutions posted strong yoy growth in revenues in both 2Q17 (+11%) and 1H17 (+9%). On a constant exchange-rate basis, revenues rose 8% in 1H17 vs. 1H16. 2Q17 witnessed the confirmation of recovery in the Asset Management business and further rapid growth in Insurance. Operating expenses increased 7% yoy to €619m in 2Q17. The cost-income ratio excluding IFRIC 21 eased 2.2pps to 67.8% in 2Q17. Revenue growth also outstripped expense growth in 1H17, with the result that the cost-income ratio excluding IFRIC 21 declined 1.9pps yoy. In 1H17, gross operating income advanced 16% yoy on a current exchange-rate basis and 14% on constant exchange rates. In 1H17, the “Gain or loss on other assets” line included mainly the proceeds from the divestment of the Caspian private equity funds realized in 1Q17. ROE after tax and excluding IFRIC 21 amounted to 14.2% in 2Q17, up slightly compared to 2Q16, whereas the amount of capital allocated to the Investment Solutions core business rose 5% between the two periods.
Net revenues from Asset Management progressed 12% yoy in 2Q17 to reach €696m and 9% in 1H17 yoy (7% on constant exchange rates) to €1,363m. In 1H17, they included increases of 16% for asset management firms in Europe and 3% for their counterparts in the US. Underlying revenues
(1) from Asset Management reached €721m in 2Q17 and €1,388m in 1H17, increasing
respectively by 16% and 11% yoy. In Europe, underlying revenues (1)
made strong progress in 2Q17, rising 36% vs. 2Q16. Strong revenue growth and a tight grip on costs (+6% yoy in 2Q17 and 1H17) combined to drive sizeable yoy advances in gross operating income of 27% in 2Q17 and 17% in 1H17. Net inflow amounted to €9bn in 2Q17, including €8bn on long-term products. The rebound initiated at the end of 2016 continued through 1H17, with total inflow on long-term products representing €13bn. In Europe, inflow continued to be buoyed by the dynamic alternative strategies developed by DNCA, H2O and Mirova. In the US, Loomis Sayles reaped the benefits of efforts to diversify on fixed-income and equity products, and recorded $5.2bn of net inflow in 1H17. Over the same period, Harris Associates attracted $4.1bn of new money, particularly thanks to its Oakmark International fund. At the end of June 2017, assets under management amounted to €834bn vs. €837bn at March 31, 2017. During 2Q17, inflow of €9bn and a positive market effect of €13bn were offset by a negative exchange-rate effect of €26bn. Overall fee rate excluding performance fees, reached 28.3bps in 1H17. They worked out to 38.5bps in the US and 13bps in Europe. In Insurance, overall turnover excluding the reinsurance treaty with CNP amounted to €6.4bn in 1H17, up 81% yoy. Turnover was spurred by increases of 10% in the Personal Protection & borrower’s insurance segment and 9% in Property & Casualty. In the Life Insurance segment, turnover more than doubled between 1H16 and 1H17, reflecting the success of the gradual rollout of the product offering in the Caisse d’Epargne network in 2016. Unit-linked policies instruments continue to gain in importance, capturing almost half of Life Insurance net inflow in 1H17 (+11pps yoy) and accounting for 21% of assets under management at end-June (+3pps yoy). Assets under management amounted to €52bn at end-June 2017, up 14% yoy.
(1) Underlying revenues refer to revenues excluding €25m provision in 2Q17 related to AMF sanction concerning Formula funds

Presentation of Natixis 1 Results presentation
Natixis Update to the 2016 Registration Document 15
Corporate & Investment Banking Data excludes exceptional items
(1)
€m 2Q17 2Q16 2Q17 1H17 1H17
vs. 2Q16 vs. 1H16
Net revenues 1,032 887 16% 2,016 21%
Net revenues excl. CVA/DVA 1,045 854 22% 1,994 21%
o/w Global Markets 566 473 20% 1,139 28%
o/w Global Finance & IB 472 407 16% 872 14%
Expenses (552) (482) 14% (1,114) 12%
Gross operating income 481 405 19% 902 34%
Provision for credit losses (48) (53) (8)% (78) (37)%
Pre-tax profit 435 356 22% 829 49%
Cost/income ratio(1)
54.3% 55.5% (1.2)pp 54.4% (3.9)pp
ROE after tax(1)
17.6% 13.8% +3.8pp 17.4% +6.0pp
(1) See note on methodology and excluding IFRIC 21 impact on the calculation of the cost-income ratio and ROE
Corporate & Investment Banking posted significant yoy growth in net revenues in both 2Q17 (+16%) and 1H17 (+21%), fueled notably by Global Markets and Investment Banking. International platforms raised their contribution to overall CIB revenues from 52% in 1H16 to 57% in 1H17, driven by strong momentum on the Asia-Pacific platform, where revenues climbed 73% yoy in 1H17. Operating expenses amounted to €1.114bn in 1H17, up 12% yoy overall, but with fixed costs only 5% higher. The cost-income ratio excluding IFRIC 21 declined 1.2pps yoy to 54.3% in 2Q17 and 3.9pps yoy to 54.4% in 1H17, testifying particularly to good cost control. Gross operating income made strong progress during the two periods, rising 19% and 34% yoy in 2Q17 and 1H17, respectively. The provision for credit loss fell 8% in 2Q17 and 37% in 1H17 compared to the year-earlier periods. Pre-tax profit advanced 22% in 2Q17 and 49% in 1H17 yoy, spurred by the return of the provision for credit loss to a more normal level. Compared to 2Q16, ROE after tax and excluding IFRIC 21 gained 380bps to 17.6% in 2Q17 (+600bps in 1H17 vs. 1H16), confirming the perspective of finishing above the New Frontier plan target.
Global markets net revenues excluding the CVA/DVA desk increased by 20% yoy to reach €566m in 2Q17, of which €361m posted by FICT and €205m by Equity. In 1H17, they grew by 28% yoy fueled by strong commercial momentum, notably for international platforms, since 1Q17.

Presentation of Natixis 1 Results presentation
Natixis Update to the 2016 Registration Document 16
In 2Q17, FICT net revenues excluding the CVA/DVA desk gained 13% YoY driven by strong client activity for Rates (+26% vs. 2Q16), SFG
(1) (+37%vs. 2Q16) and GSCS (+17% vs. 2Q16).
On Americas & APAC platforms, FICT revenues advanced 64% yoy in 2Q17. Net revenues for Derivatives are up 34% vs. 2Q16. Net revenues from Global Finance & Investment Banking advanced 16% yoy in 2Q17 to reach €472m. Within Global Finance, origination activities lifted revenues 24% yoy in 2Q17. New structured financing production expanded 11% during the same period, buoyed by the Real Estate Finance and Aviation, Export & Infrastructure. Within Investment Banking, Acquisition & Strategic Finance turned in an outstanding performance, by virtually doubling revenues in 2Q17 relative to 2Q16, in a very active market with many deals/Jumbo operations and sound investor debt appetite. Natixis notably ranked 3
rd among MLA bookrunners on
sponsored loans in value in the EMEA region in 1H17 (source Thomson Reuters). With €66m in revenues in 1H17, M&A activities were on course to exceed the initial target for annual revenues of over €100m. In 1H17, Natixis ranked 4th in M&A advisory in France by deal count (source: Merger Market).
(1) Merger of the Fixed Income and Treasury businesses’ repo and collateral management activities
Specialized Financial Services
Data excludes exceptional items(1)
€m 2Q17 2Q16 2Q17 1H17 1H17
vs. 2Q16 vs. 1H16
Net revenues 347 341 2% 691 1%
Specialized financing 217 211 3% 436 3%
Financial services 129 130 flat 254 (2)%
Expenses (227) (220) 3% (458) 3%
Gross operating income 120 121 (1)% 233 (2)%
Provision for credit losses (14) (17) (15)% (35) 20%
Gain or loss on other assets 0 31 0
Pre-tax profit 106 135 (22)% 197 (18)%
Cost/income ratio(1)
66.1% 65.4% +0.7pp 65.6% +1.2pp
ROE after tax(1)(2)
15.5% 16.3% (0.8)pp 14.9% (2.4)pp
(1) See note on methodology and excluding IFRIC 21 impact on the calculation of the cost-income ratio and ROE (2) Excluding capital gain on real-estate asset in 2Q16

Presentation of Natixis 1 Results presentation
Natixis Update to the 2016 Registration Document 17
Net revenues from Specialized Financial Services grew 2% yoy in 2Q17, fueled by a strong performance in Specialized Financing, where revenues increased 3% during the same period. Sureties & Guarantees business lines lifted revenues 7% yoy in 2Q17, while Leasing expanded by 3% during the same period. Operating expenses in 2Q17 increased 3% yoy and 1% only excluding the integration of Groupe BPCE payment structures into Natixis. The provision for credit loss amounted to €14m in 2Q17, down 15% vs. 2Q16 and 33% vs. 1Q17, with the latter period having been temporarily impacted by the migration towards a new recovery system in the Consumer Finance line. In 1H17, the provision for credit loss totaled €35m vs. €29m in 1H16. Pre-tax profit worked out to €106m in 2Q17 versus €135m in 2Q16. After adjusting for the €31m gain linked to the sale of a building and booked in “Gain or loss on other assets” in 2Q16, pre-tax profit rose 2% yoy in 2Q17. ROE after tax and excluding IFRIC 21 remained solid at 15.5% in 2Q17 and 14.9% in 1H17. In addition, on June 26, 2017, Natixis announced the signature of an agreement to acquire 50.04% of the capital of Dalenys (representing 58.09% of its voting rights). This announcement confirms Natixis’ strategic ambition to become one of the European leaders in the payments industry, particularly for merchant services. The acquisition of Dalenys strengthens Natixis’ range of payment solutions for e-retailers. The acquisition of Dalenys is part of the creation of the Payment business line at Natixis at the end of 2016, bringing together Natixis Payment Solutions, Natixis Intertitres and S’money, along with the acquisition of Fintech PayPlug, which was finalized in April 2017. It will increase Natixis Payment Solutions’ international client base and will pave the way for a rapid European expansion.
Financial Investments Data excludes exceptional items
(1)
€m 2Q17 2Q16 2Q17 1H17 1H17
vs. 2Q16 vs. 1H16
Net revenues 156 155 1% 309 (9)%
Coface 146 133 10% 277 (4)%
Corporate Data Solutions 0 9
10 (58)%
Other 10 12 (17)% 21 (12)%
Expenses (147) (153) (4)% (298) (5)%
Gross operating income 9 1
11 (51)%
Provision for credit losses (5) (18) (70)% (10) (59)%
Gain or loss on other assets 22 0 22
Pre-tax profit 26 (16)
24
(1) See note on methodology
Net revenues from Financial Investments contracted 9% yoy in 1H17. The strategy of withdrawing from Corporate Data Solutions activities continues apace, as witnessed by the disposal of Ellisphère in 2Q17, in a deal that generated a €22m gain.

Presentation of Natixis 1 Results presentation
Natixis Update to the 2016 Registration Document 18
On a constant structure and exchange-rate basis, Coface’s sales amounted to €342m in 2Q17 and €687m in 1H17, these levels being relatively unchanged from the year-earlier periods. In 2Q17, Coface’s net revenues advanced 22% on a constant structure and exchange-rate basis (+10% in current terms) and reached €146m. Claims expense was well down, particularly in Asia and North America, with the loss ratio falling to 58.4% in 2Q17 vs. 66.9% in 2Q16. The cost ratio worked out to 37.1% vs. 30.8% in 2Q16, and reflected the impact of a one-off tax expense in Italy (+1.4pps) in 2Q17. The combined ratio net of reinsurance eased 2.2pps yoy to 95.5%. In 1H17, Coface net revenues rose 5% on a constant structure and exchange-rate basis (-4% in current terms) and totaled €276m. The combined ratio net of reinsurance worked out to 93.7% in 1H17 and included a reduction in the loss ratio to 58.3% (-2.5pps vs. 1H16) , leading to an upgraded guidance for full-year 2017 below 58% (vs. 61% previously). The cost ratio equated to 35.5% vs. 31.4% in 1H16 (34.4% excluding the public guarantee management business). Excluding the public guarantee management business – sold on January 1, 2017 - the combined ratio net of reinsurance would have amounted out to 95.2% in 1H16, 1.5pps higher than the 93.7% in 1H17. Regarding the Fit-to-Win plan, cost savings amounted to €5.4m in 1H17, slightly ahead of objective for the year (€10m).
Appendices Note on methodology: The results at 06/30/2017 were examined by the board of directors at their meeting on 08/01/2017. Figures at 06/30/2017 are presented in accordance with IAS/IFRS accounting standards and IFRS Interpretation Committee (IFRIC) rulings as adopted in the European Union and applicable at this date.
2016 figures are presented pro forma of new intra-pole organizations: (1) CIB: The 1H16 quarterly series have been restated for the change in CIB organization
announced on March 15 2016. The new presentation of businesses within CIB mainly takes into account the creation of a new business line: Global Finance & Investment banking housing all financing businesses (structured & plain vanilla financing), as well as M&A, Equity Capital Markets, and Debt Capital Markets.
(2) SFS: Within Financial services, transfer of the Intertitres activity from Employee savings scheme to the Payments business. Employee savings scheme becomes Employee savings plans. The 2016 series have been restated accordingly to this new organization.
2017 presentation: transfer of short term treasury activities run by Treasury & collateral management department from FIC-T in CIB to Financial Management Division in 04/01/2017 in accordance with the French banking law. To ensure comparability, in this presentation CIB refers to CIB including Treasury & collateral management.
Business line performances using Basel 3 standards: - The performances of Natixis business lines are presented using Basel 3 standards. Basel 3 risk-
weighted assets are based on CRR-CRD4 rules as published on June 26th, 2013 (including the Danish compromise treatment for qualified entities).

Presentation of Natixis 1 Results presentation
Natixis Update to the 2016 Registration Document 19
- Natixis’ ROTE is calculated by taking as the numerator net income (group share) excluding DSN interest expenses on preferred shares after tax. Equity capital is average shareholders’ equity group share as defined by IFRS, after payout of dividends, excluding average hybrid debt, average intangible assets and average goodwill.
- Natixis’ ROE: results used for calculations are net income (group share), deducting DSN interest
expenses on preferred shares after tax. Equity capital is average shareholders’ equity group share as defined by IFRS, after payout of dividends, excluding average hybrid debt, and excluding unrealized or deferred gains and losses recognized in equity (OCI).
- ROE for business lines is calculated based on normative capital to which are added goodwill
and intangible assets for the business line. Normative capital allocation to Natixis’ business lines is carried out on the basis of 10% of their average Basel 3 risk-weighted assets. Business lines benefit from remuneration of normative capital allocated to them. By convention, the remuneration rate on normative capital is maintained at 3%.
Net book value: calculated by taking shareholders’ equity group share, restated for hybrids and capital gains on reclassification of hybrids as equity instruments. Net tangible book value is adjusted for goodwill relating to equity affiliates, restated goodwill and intangible assets as follows:
In €m 06/30/2017 Intangible assets 728 Restatement for Coface minority interest & others (49) Restated intangible assets 679
In €m 06/30/2017 Goodwill 3,504 Restatement for Coface minority interest (165) Restatement for Investment Solutions deferred tax liability & others (491) Restated goodwill 2,848
Own senior debt fair-value adjustment: calculated using a discounted cash-flow model, contract by contract, including parameters such as swaps curve, and revaluation spread (based on the BPCE reoffer curve). Adoption of IFRS 9 standards, on November 22, 2016, authorizing the early application of provisions relating to own credit risk as of FY2016 closing. All impacts since the beginning of the financial year 2016 are recognized in equity, even those that had impacted the income statement in the interim financial statements for March, June and September 2016. Leverage ratio: based on delegated act rules, without phase-in except for DTAs on tax-loss carryforwards and with the hypothesis of a roll-out for non-eligible subordinated notes under Basel 3 by eligible notes. Repo transactions with central counterparties are offset in accordance with IAS 32 rules without maturity or currency criteria. Leverage ratio disclosed including the effect of intragroup cancelation - pending ECB authorization. Exceptional items: figures and comments on this press release are based on Natixis and its businesses’ income statements excluding non- operating and/or exceptional items detailed page 3. Natixis and its businesses’ income statements including these items are available in the appendix of this press release.

Presentation of Natixis 1 Results presentation
Natixis Update to the 2016 Registration Document 20
Restatement for IFRIC 21 impact: The cost/income ratio and the ROE excluding IFRIC 21 impact calculation in 1H17 takes into account half of the annual duties and levies concerned by this new accounting rule.
Earnings capacity: net income (group share) restated for exceptional items and the IFRIC 21 impact.
Expenses: sum of operating expenses and Depreciation, amortization and impairment on property, plant and equipment and intangible assets.
2Q17 results: from data excluding exceptional items
to reported data
in €m 2Q17 excl.
exceptional items
Exchange rate fluctuations on DSN in currencies
Transformation & Business Efficiency
Investment costs
2Q17
reported
Net revenues 2,458 (49)
2,410
Expenses (1,584)
(11) (1,594)
Gross operating income 875 (49) (11) 815
Provision for credit losses (67)
(67)
Associates 6
6
Gain or loss on other assets 18
18
Change in value of goodwill 0
0
Pre-tax profit 831 (49) (11) 772
Tax (274) 16 3 (255)
Minority interest (29)
(29)
Net income (group share) 528 (33) (7) 487
1H17 results: from data excluding exceptional items
to reported data
in €m 1H17 excl.
exceptional items
Exchange rate
fluctuations on DSN in currencies
Transformation & Business Efficiency
Investment costs
Non-recurring additional Corporate
Social Solidarity Contribution
resulting from agreement with CNP
1H17
reported
Net revenues 4,816 (60)
4,756
Expenses (3,327)
(20) (19) (3,365)
Gross operating income 1,490 (60) (20) (19) 1,391
Provision for credit losses (138)
(138)
Associates 13
13
Gain or loss on other assets 27
27
Pre-tax profit 1,392 (60) (20) (19) 1,294
Tax (501) 19 6 6 (469)
Minority interest (57)
(57)
Net income (group share) 834 (40) (13) (13) 768

Presentation of Natixis 1 Results presentation
Natixis Update to the 2016 Registration Document 21
Natixis – Consolidated
in €m 1Q16 2Q16 3Q16 4Q16 1Q17 2Q17 1Q17
vs. 1Q16
1H16 1H17
1H17 vs. 1H16
Net revenues 2,063 2,211 1,924 2,520 2,347 2,410 9%
4,274 4,756 11%
Expenses (1,605) (1,522) (1,447) (1,664) (1,771) (1,594) 5% (3,127) (3,365) 8%
Gross operating income 458 689 477 856 576 815 18%
1,147 1,391 21%
Provision for credit losses (88) (88) (69) (60) (70) (67) (23)%
(176) (138) (22)%
Associates 8 7 4 (6) 7 6 (12)% 14 13 (7)%
Gain or loss on other assets 29 31 104 12 9 18 (42)%
60 27 (55)%
Change in value of goodwill 0 (75) 0 0 0 0 (75) 0
Pre-tax profit 407 564 516 801 523 772 37%
970 1,294 33%
Tax (172) (211) (184) (255) (214) (255) 21% (383) (469) 23%
Minority interest (34) 28 (34) (50) (28) (29)
(6) (57)
Net income (group share) 200 381 298 496 280 487 28%
581 768 32%
Natixis - Breakdown by Business division in 2Q17
in €m Investment Solutions
CIB SFS Financial
Investments Corporate
Center
2Q17 reported
Net revenues 920 1,032 347 156 (45)
2,410
Expenses (620) (552) (227) (147) (48)
(1,594)
Gross operating income 299 481 120 9 (93)
815
Provision for credit losses 0 (48) (14) (5) 0
(67)
Net operating income 300 432 105 4 (93)
748
Associates 3 3 0 0 0
6
Other items 0 0 0 22 (4)
18
Pre-tax profit 302 435 105 26 (97)
772
Tax (255)
Minority interest (29)
Net income (gs)
487

Presentation of Natixis 1 Results presentation
Natixis Update to the 2016 Registration Document 22
IFRIC 21 effects by business line
Effect in Expenses
in €m 1Q16 2Q16 3Q16 4Q16 1Q17 2Q17
1H16 1H17
Investment Solutions (11) 4 4 4 (28) (1)
9(2)
(8) (19)
CIB (31) 10 10 10 (28) 9 (21) (18)
Specialized Financial Services (7) 2 2 2 (6) 2 (5) (4)
Financial Investments (2) 1 1 1 (1) 0 (1) (1)
Corporate center (57) 1 28 28 (92) 34 (55) (59)
Total Natixis (107) 18 45 45 (156) 55 (89) (101)
Effect in Net Revenues
in €m 1Q16 2Q16 3Q16 4Q16 1Q17 2Q17
1H16 1H17
Specialized Financial Services (Leasing)
(2) 1 1 1 (1) 0 (1) (1)
Total Natixis (2) 1 1 1 (1) 0 (1) (1)
(1) -€14m in recurring expenses and -€14m in non-recurring expenses linked to the additional Corporate Social Solidarity Contribution resulting from agreement with CNP
(2) 4.7m in recurring expenses and €4.7m in non-recurring expenses linked to the additional Corporate Social Solidarity Contribution resulting from agreement with CNP

Presentation of Natixis 1 Results presentation
Natixis Update to the 2016 Registration Document 23
Investment Solutions
in €m 1Q16 2Q16 3Q16 4Q16 1Q17 2Q17 2Q17 vs.
2Q16 1H16 1H17
1H17 vs.
1H16
Net revenues 825 832 804 904 891 920 11% 1,656 1,811 9%
Asset Management 626 623 609 689 667 696 12% 1,249 1,363 9%
Private Banking 34 33 34 35 34 30 (9)% 67 64 (6)%
Insurance 167 156 155 169 187 177 13% 322 364 13%
Expenses (590) (579) (558) (623) (645) (620) 7% (1,169) (1,266) 8%
Gross operating income 234 253 246 280 246 299 18% 487 545 12%
Provision for credit losses 0 0 0 0 0 0 0 0
Net operating income 234 253 246 281 246 300 18% 487 545 12%
Associates 4 2 5 (10) 4 3 32% 6 7 23%
Other items 18 (2) (2) 2 9 0
16 8 (49)%
Pre-tax profit 256 253 249 273 259 302 19% 509 561 10%
Cost/Income ratio 71.6% 69.6% 69.4% 69.0% 72.4% 67.5% 70.6% 69.9%
Cost/Income ratio excluding IFRIC 21 effect
70.2% 70.0% 69.8% 69.4% 69.3% 68.5% 70.1% 68.9%
RWA (Basel 3 – in €bn) 16.4 17.0 17.3 18.1 18.0 17.4 2% 17.0 17.4 2%
Normative capital allocation (Basel 3) 4,350 4,381 4,467 4,491 4,641 4,609 5% 4,366 4,625 6%
ROE after tax
(Basel 3)(1)
13.9% 14.0% 13.1% 12.3% 12.6% 14.4% 13.9% 13.5%
ROE after tax
(Basel 3) excluding IFRIC
21 effect(1)
14.5% 13.8% 12.9% 12.1% 14.3% 13.8% 14.2% 14.1%
(1) Normative capital allocation methodology based on 10% of the average RWA-including goodwill and intangibles

Presentation of Natixis 1 Results presentation
Natixis Update to the 2016 Registration Document 24
Corporate & Investment Banking
in €m 1Q16 2Q16 3Q16 4Q16 1Q17 2Q17 2Q17 vs.
2Q16 1H16 1H17
1H17 vs.
1H16
Net revenues 782 887 757 896 984 1,032 16% 1,668 2,016 21%
Global Markets 407 507 410 477 608 553 9% 914 1,161 27%
FIC-T 291 319 291 317 397 361 13% 610 758 24%
Equity 123 154 106 150 176 205 33% 278 380 37%
CVA/DVA desk (7) 33 13 10 36 (13) 26 22 (14)%
Global Finance & Investment Banking 362 407 412 412 400 472 16% 768 872 14%
Other 12 (26) (65) 7 (25) 7 (14) (17) 23%
Expenses (512) (482) (468) (569) (563) (552) 14% (994) (1,114) 12%
Gross operating income 270 405 289 327 421 481 19% 675 902 34%
Provision for credit losses (71) (53) (50) (21) (29) (48) (8)% (124) (78) (37)%
Net operating income 198 352 239 306 392 432 23% 550 824 50%
Associates 3 4 3 3 3 3 (36)% 8 5 (31)%
Other items 0 0 0 0 0 0 0 0
Pre-tax profit 202 356 242 309 394 435 22% 558 829 49%
Cost/Income ratio 65.5% 54.4% 61.8% 63.5% 57.2% 53.4% 59.6% 55.3%
Cost/Income ratio excluding IFRIC 21
effect 61.5% 55.5% 63.2% 64.7% 54.4% 54.3% 58.3% 54.4%
RWA (Basel 3 – in €bn) 67.0 68.8 64.9 66.1 64.4 61.3 (11)% 68.8 61.3 (11)%
Normative capital allocation (Basel 3) 6,935 6,772 7,064 6,672 6,805 6,641 (2)% 6,854 6,723 (2)%
ROE after tax
(Basel 3)(1)
7.9% 14.2% 9.3% 13.6% 16.1% 18.0% 11.0% 17.0% ROE after tax
(Basel 3) excluding IFRIC
21 effect(1)
9.1% 13.8% 8.9% 13.2% 17.2% 17.6% 11.4% 17.4%
(1) Normative capital allocation methodology based on 10% of the average RWA-including goodwill and intangibles

Presentation of Natixis 1 Results presentation
Natixis Update to the 2016 Registration Document 25
Specialized Financial Services
in €m 1Q16 2Q16 3Q16 4Q16 1Q17 2Q17 2Q17 vs.
2Q16 1H16 1H17
1H17 vs.
1H16
Net revenues 343 341 325 341 344 347 2% 684 691 1%
Specialized Financing 214 211 203 210 219 217 3% 425 436 3%
Factoring 38 39 40 43 40 40 2% 77 79 3%
Sureties & Financial Guarantees 55 43 46 45 54 46 7% 98 100 2%
Leasing 51 58 48 53 54 60 3% 109 114 4%
Consumer Financing 65 66 64 64 66 66 (1)% 131 132 1%
Film Industry Financing 5 6 5 6 5 7 16% 11 12 12%
Financial Services 129 130 122 131 125 129 Flat 258 254 (2)%
Employee savings plans 22 25 20 21 21 22 (11)% 47 43 (8)%
Payments 83 81 80 86 81 83 3% 164 165 Flat
Securities Services 24 23 23 24 23 23 Flat 47 46 (2)%
Expenses (225) (220) (215) (220) (232) (227) 3% (446) (459) 3%
Gross operating income 118 121 110 122 113 120 (1)% 238 232 (3)%
Provision for credit losses (13) (17) (12) (16) (21) (14) (15)% (29) (35) 20%
Net operating income 105 104 98 106 92 105 1% 209 197 (6)%
Associates 0 0 0 0 0 0 0 0
Other items 0 31 0 0 0 0 31 0
Pre-tax profit 105 135 98 106 91 105 (22)% 240 197 (18)%
Cost/Income ratio 65.7% 64.6% 66.2% 64.4% 67.3% 65.5% 65.2% 66.4%
Cost/Income ratio excluding IFRIC 21
effect 63.4% 65.4% 67.0% 65.1% 65.3% 66.2% 64.4% 65.7%
RWA (Basel 3 – in €bn) 13.7 14.8 14.6 15.4 15.2 16.0 8% 14.8 16.0 8%
Normative capital allocation (Basel 3) 1,629 1,626 1,730 1,709 1,885 1,813 12% 1,628 1,849 14%
ROE after tax
(Basel 3)(1)
16.9% 21.8% 14.8% 16.2% 13.2% 15.8% 19.3% 14.5%
ROE after tax
(Basel 3) excluding IFRIC
21 effect(1)
18.3% 21.3% 14.4% 15.8% 14.3% 15.5% 19.8% 14.9%
(1) Normative capital allocation methodology based on 10% of the average RWA-including goodwill and intangibles

Presentation of Natixis 1 Results presentation
Natixis Update to the 2016 Registration Document 26
Financial Investments
in €m 1Q16 2Q16 3Q16 4Q16 1Q17 2Q17 2Q17 vs.
2Q16
1H16 1H17
1H17 vs. 1H16
Net revenues 183 155 137 224 153 156 (1)%
338 309
(9)%
Coface 156 133 119 197 131 146 10%
289 277
(4)%
Corporate data solutions 15 9 8 10 10 0
24 10
(58)%
Others 12 12 10 18 11 10 (17)%
25 21
(12)%
Expenses (162) (153) (151) (174) (151) (147) (4)%
(315) (298)
(5)%
Gross operating income 21 1 (14) 50 2 9
23 11
(51)%
Provision for credit losses (6) (18) (7) (6) (5) (5)
(24) (10)
(59)%
Net operating income 15 (17) (20) 44 (3) 4
(2) 1
Associates 0 0 (3) 1 0 0
1 1
flat
Other items 11 (75) 7 0 0 22
(64) 22
Pre-tax profit 27 (91) (17) 45 (2) 26
(65) 24
Corporate center
in €m 1Q16 2Q16 3Q16 4Q16 1Q17 2Q17
1H16 1H17
Net revenues (69) (3) (100) 155 (25) (45)
(72) (70)
Expenses (116) (87) (55) (78) (180) (48)
(204) (228)
Gross operating income (185) (91) (155) 77 (205) (93)
(276) (299)
Provision for credit losses 2 0 0 (18) (15) 0
2 (15)
Net operating income (183) (91) (155) 59 (220) (93)
(274) (314)
Associates 0 0 0 0 0 0
0 0
Other items 0 2 99 10 1 (4)
2 (3)
Pre-tax profit (183) (89) (56) 68 (220) (97)
(272) (317)
Presentation of Natixis 1 Results presentation
Natixis Update to the 2016 Registration Document 27
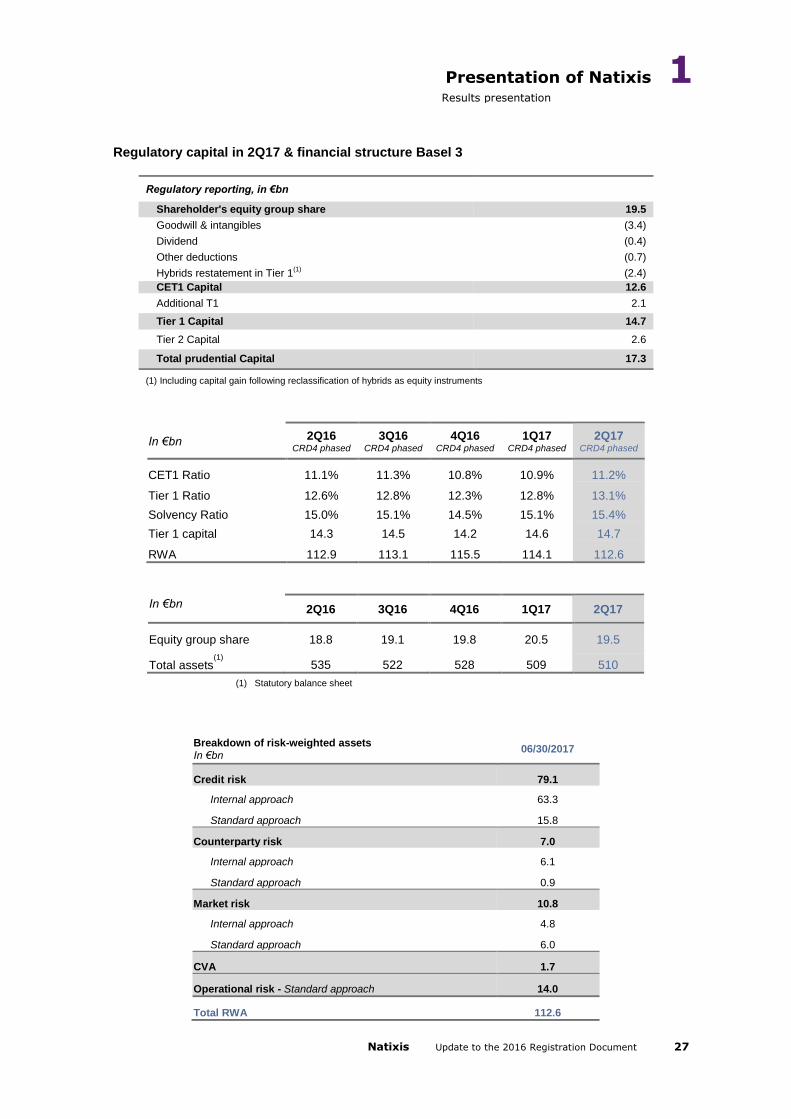
Regulatory capital in 2Q17 & financial structure Basel 3
Regulatory reporting, in €bn
Shareholder's equity group share 19.5
Goodwill & intangibles (3.4)
Dividend (0.4)
Other deductions (0.7)
Hybrids restatement in Tier 1(1)
(2.4)
CET1 Capital 12.6
Additional T1 2.1
Tier 1 Capital 14.7
Tier 2 Capital 2.6
Total prudential Capital 17.3
(1) Including capital gain following reclassification of hybrids as equity instruments
In €bn 2Q16 CRD4 phased
3Q16 CRD4 phased
4Q16 CRD4 phased
1Q17 CRD4 phased
2Q17 CRD4 phased
CET1 Ratio 11.1% 11.3% 10.8% 10.9% 11.2% Tier 1 Ratio 12.6% 12.8% 12.3% 12.8% 13.1% Solvency Ratio 15.0% 15.1% 14.5% 15.1% 15.4% Tier 1 capital 14.3 14.5 14.2 14.6 14.7 RWA 112.9 113.1 115.5 114.1 112.6
In €bn 2Q16 3Q16 4Q16 1Q17 2Q17 Equity group share 18.8 19.1 19.8 20.5 19.5 Total assets
(1)
535 522 528 509 510 (1) Statutory balance sheet
Breakdown of risk-weighted assets In €bn 06/30/2017 Credit risk 79.1
Internal approach 63.3 Standard approach 15.8
Counterparty risk 7.0 Internal approach 6.1 Standard approach 0.9
Market risk 10.8 Internal approach 4.8 Standard approach 6.0
CVA 1.7 Operational risk - Standard approach 14.0 Total RWA 112.6

Presentation of Natixis 1 Results presentation
Natixis Update to the 2016 Registration Document 28
Leverage ratio According to the rules of the Delegated Act published by the European Commission on October 10, 2014, including the effect of intragroup cancelation - pending ECB authorization
€bn 06/30/2017
Tier 1 capital (1)
14.9
Total prudential balance sheet 420.5
Adjustment on derivatives (50.3)
Adjustment on repos (2)
(27.5)
Other exposures to affiliates (26.5)
Off balance sheet commitments 36.8
Regulatory adjustments (4.1)
Total leverage exposures 349.0
Leverage ratio 4.3%
(1) Without phase-in except for DTAs on tax loss carryforwards - supposing replacement of existing subordinated issuances when they become ineligible (2) Repos with clearing houses cleared according to IAS32 standard, without maturity or currency criteria
Normative capital allocation and RWA breakdown at end-June 2017 – under Basel 3
in €bn RWA
(end of period) In % of
the total
Average Goodwill and intangibles
Average capital allocation
beginning of period
ROE after tax in 1H17
CIB 61.3 61% 0.2 6.7 17.0%
Investment Solutions 17.4 17% 2.8 4.6 13.5%
SFS 16.0 16% 0.3 1.8 14.5%
Financial Investments 6.1 6% 0.2 0.8
TOTAL (excl. Corporate Center) 100.7 100% 3.5 13.9

Presentation of Natixis 1 Results presentation
Natixis Update to the 2016 Registration Document 29
Net book value as of June 30, 2017
in €bn 06/30/2017
Shareholders’ equity (group share) 19.5
Deduction of hybrid capital instruments (2.1)
Deduction of gain on hybrid instruments (0.3)
Net book value 17.2
Restated intangible assets(1)
0.7
Restated goodwill(1)
2.9
Net tangible book value(2)
13.6
in €
Net book value per share(3)
5.48
Net tangible book value per share(3)
4.35
(1) See note on methodology (2) Net tangible book value = Book value – goodwill - intangible assets (3) Calculated on the basis of 3,135,383,861 shares - end of period
Earnings per share (1H17)
in €m 06/30/2017
Net income (gs) 768
DSN interest expenses on preferred shares after tax (47)
Net income attributable to shareholders 721
Average number of shares over the period, excluding treasury shares 3,135,558,616
Earnings per share (€) 0.23
Net income attributable to shareholders
in €m 2Q17 1H17
Net income (gs) 487 768
DSN interest expenses on preferred shares after tax (25) (47)
ROE & ROTE numerator 462 721

Presentation of Natixis 1 Results presentation
Natixis Update to the 2016 Registration Document 30
NATIXIS ROTE
in €m 06/30/2017
Shareholders’ equity (group share) 19,520
DSN deduction (2,342)
Dividends
provision(1) (361)
Intangible assets (679)
Goodwill (2,851)
ROTE Equity end of period 13,287
Average ROTE equity (2Q17) 13,310
2Q17 ROTE annualized 13.9%
Average ROTE equity (1H17) 13,294
1H17 ROTE annualized 10.8%
NATIXIS ROE
in €m 06/30/2017
Shareholders’ equity (group share) 19,520
DSN deduction (2,342)
Dividends
provision(1) (361)
Exclusion of unrealized or deferred gains and losses recognized in equity (OCI)
(444)
ROE Equity end of period 16,373
Average ROE equity (2Q17) 16,472
2Q17 ROE annualized 11.2%
Average ROE equity (1H17) 16,503
1H17 ROE annualized 8.7%
(1) Dividend based on 50% of the net income attributable to shareholders

Presentation of Natixis 1 Results presentation
Natixis Update to the 2016 Registration Document 31
Balance sheet
Assets (in €bn) 06/30/2017 12/31/2016
Cash and balances with central banks 41.9 26.7
Financial assets at fair value through profit and loss 186.2 187.6
Available-for-sale financial assets 55.4 55.0
Loans and receivables 167.6 199.1
Held-to-maturity financial assets 1.9 2.1
Accruals and other assets 51.0 50.5
Investments in associates 0.6 0.7
Tangible and intangible assets 2.3 2.5
Goodwill 3.5 3.6
Total 510.4 527.8
Liabilities and equity (in €bn) 06/30/2017 12/31/2016
Due to central banks 0.0 0.0
Financial liabilities at fair value through profit and loss 138.5 146.2
Customer deposits and deposits from financial institutions 189.7 187.9
Debt securities 38.1 48.9
Accruals and other liabilities 44.5 48.7
Insurance companies’ technical reserves 73.2 68.8
Contingency reserves 1.9 2.0
Subordinated debt 3.7 4.2
Equity attributable to equity holders of the parent 19.5 19.8
Minority interests 1.3 1.3
Total 510.4 527.8

Presentation of Natixis 1 Results presentation
Natixis Update to the 2016 Registration Document 32
Doubtful loans (inc. financial institutions)
In €bn 2Q16 3Q16 4Q16 1Q17 2Q17
Doubtful loans(1)
4.1 4.2 4.1 4.0 3.8
Collateral relating to loans written-down(1)
(1.4) (1.6) (1.5) (1.4) (1.2)
Provisionable commitments(1)
2.6 2.6 2.6 2.6 2.6
Specific provisions(1)
(1.7) (1.7) (1.7) (1.6) (1.7)
Portfolio-based provisions (1)
(0.4) (0.4) (0.4) (0.4) (0.4)
Provisionable commitments(1)
/ Gross debt 2.0% 2.2% 2.0% 2.1% 2.4%
Specific provisions/Provisionable commitments(1)
64% 64% 65% 64% 64%
Overall provisions/Provisionable commitments(1)
80% 79% 81% 79% 80%
(1) Excluding securities and repos
Disclaimer This media release may contain objectives and comments relating to the objectives and strategy of Natixis. Any such objectives inherently depend on assumptions, project considerations, objectives and expectations linked to future and uncertain events, transactions, products and services as well as suppositions regarding future performances and synergies.
No assurance can be given that such objectives will be realized. They are subject to inherent risks and uncertainties, and are based on assumptions relating to Natixis, its subsidiaries and associates, and the business development thereof; trends in the sector; future acquisitions and investments; macroeconomic conditions and conditions in Natixis' principal local markets; competition and regulation. Occurrence of such events is not certain, and outcomes may prove different from current expectations, significantly affecting expected results. Actual results may differ significantly from those implied by such objectives.
Information in this media release relating to parties other than Natixis or taken from external sources has not been subject to independent verification, and Natixis makes no warranty as to the accuracy, fairness, precision or completeness of the information or opinions herein. Neither Natixis nor its representatives shall be liable for any errors or omissions, or for any prejudice resulting from the use of this media release, its contents or any document or information referred to herein.
Included data in this press release have not been audited.

Presentation of Natixis 1 Other information
Natixis Update to the 2016 Registration Document 33
OTHER INFORMATION Long-term ratings (as of August 9, 2017) Standard & Poor’s: A (stable outlook) Moody’s: A2 (positive outlook) Fitch Ratings: A (stable outlook) 2017 Financial calendar
November 7, 2017 After market close (subject to modification) 2017 Third Quarter Results
November 20, 2017 Natixis Investor Day
February 13, 2018 After market close (subject to modification) 2017 Annual Results
May 23, 2018
General Shareholders’ Meeting (approving the 2017 financial
statements)

Corporate Governance 2 Role and operating rules of the corporate bodies
Natixis Update to the 2016 Registration Document 34
II SECTION 2: CORPORATE GOVERNANCE
2.1 Governance of Natixis as of August 1, 2017
2.1.1 Structure of the Board of Directors
Member's first and last name Main position within the company (a)
Main position outside the
company
François Pérol
Date of birth: 11.06.1963
Nationality: French
Natixis shares held: 60,000
Chairman of the Board of Directors
First appointed: AGM of 04.30.2009
(Chairman of the Board of Directors since the Board
Meeting of 04.30.2009)
Term expires: 2019 AGM (b)
Member - Strategic Committee
First appointed: Board Meeting of 05.11.2011
Term expires: 2019 AGM (b)
Chairman of the BPCE
Management Board
50, avenue Pierre Mendès-France
75201 Paris Cedex 13
BPCE
Natixis shares held:
2,227,221,174
Director
Permanent Representative: Marguerite Bérard-Andrieu
Date of birth: 12.31.1977
First BPCE appointment: Co-opted by the Board of
Directors on 08.25.2009 and ratified at the AGM of
05.27.2010
Term expires: 2019 AGM (b)
Member – Audit Committee
First appointed: Board Meeting of 05.09.2016
Term expires: 2019 AGM (b)
Member - Risk Committee
First appointed: Board Meeting of 05.09.2016
Term expires: 2019 AGM (b)
Member - Strategic Committee
First appointed: Board Meeting of 05.09.2016
Term expires: 2019 AGM (b)
Member of the BPCE
Management Board
Chief Executive Officer in charge of
the Group Finance, Strategy, Legal
Affairs divisions and Group Company
Secretary
50, avenue Pierre Mendès-France
75201 Paris Cedex 13
Thierry Cahn
Date of birth: 09.25.1956
Nationality: French
Natixis shares held: 1,000
Director
First appointed: Co-opted by the Board of Directors on
01.28.2013 and ratified at the AGM of 05.21.2013
Term expires: 2019 AGM (b)
Member - Appointments Committee
First appointed: Board Meeting of 02.09.2017
Term expires: 2019 AGM (b)
Member - Strategic Committee
First appointed: Board Meeting of 01.28.2013
Term expires: 2019 AGM (b)
Chairman of the Board of Directors of
Banque Populaire Alsace Lorraine
Champagne
Immeuble le Concorde
4 quai Kléber
BP 10401
67000 Strasbourg Cedex

Corporate Governance 2 Role and operating rules of the corporate bodies
Natixis Update to the 2016 Registration Document 35
Member's first and last name Main position within the company (a)
Main position outside the
company
Alain Condaminas
Date of birth: 04.06.1957
Nationality: French
Natixis shares held: 1,000
Director
First appointed: OGM of 05.29.2012
Term expires: 2020 AGM (c)
Member - Compensation Committee
First appointed: Board Meeting of 05.29.2012
Term expires: 2020 AGM (c)
Member - Strategic Committee
First appointed: Board Meeting of 05.29.2012
Term expires: 2020 AGM (c)
Chief Executive Officer of Banque
Populaire Occitane
33-43 avenue Georges Pompidou
31135 Balma Cedex
Alain Denizot
Date of birth: 10.01.1960
Nationality: French
Natixis shares held: 1,000
Director
First appointed: AGM of 05.19.2015
Term expires: 2019 AGM (b)
Member – Compensation Committee
First appointed: Board Meeting of 05.19.2015
Term expires: 2019 AGM (b)
Member – Risk Committee
First appointed: Board Meeting of 02.09.2017
Term expires: 2019 AGM (b)
Member – Strategic Committee
First appointed: Board Meeting of 05.19.2015
Term expires: 2019 AGM (b)
Chairman of the Management Board
of Caisse d’Epargne Hauts de
France
135 Pont de Flandres
59777 EURALILLE
Bernard Dupouy
Date of birth: 09.19.1955
Nationality: French
Natixis shares held: 0*
Director
First appointed: Co-opted by the Board of Directors on
08.01.2017
Term expires: 2019 AGM (b)
Member – Strategic Committee
First appointed: Board Meeting of 08.01.2017
Term expires: 2019 AGM (b)
Chairman of the Board of Directors of
Banque Populaire Aquitaine Centre
Atlantique
84, rue Deveaux
33200 Bordeaux
Sylvie Garcelon
Date of birth: 04.14.1965
Nationality: French
Natixis shares held: 26*
Director
First appointed: co-opted by the Board of Directors on
02.10.2016
and ratified at the AGM of 05.24.2016
Term expires: 2020 AGM (c)
Member – Audit Committee
First appointed: Board Meeting of 02.10.2016
Term expires: 2020 AGM (c)
Member - Strategic Committee
First appointed: Board Meeting of 02.10.2016
Term expires: 2020 AGM (c)
Chief Executive Officer of CASDEN
Banque Populaire
91 cours des Roches - Noisiel
77424 Marne-La-Vallée Cedex 2

Corporate Governance 2 Role and operating rules of the corporate bodies
Natixis Update to the 2016 Registration Document 36
Member's first and last name Main position within the company (a)
Main position outside the
company
Anne Lalou
Date of birth: 12.06.1963
Nationality: French
Natixis shares held: 1,000
Independent director
First appointed: co-opted by the Board of Directors on
02.18.2015
and ratified at the AGM of 05.19.2015
Term expires: 2019 AGM (b)
Member - Compensation Committee
First appointed: Board Meeting of 02.18.2015
Term expires: 2019 AGM (b)
Member - Appointments Committee
First appointed: Board Meeting of 02.18.2015
Term expires: 2019 AGM (b)
Chairman - Strategic Committee (e)
First appointed: Board Meeting of 02.18.2015
Term expires: 2019 AGM (b)
Dean and Managing Director of Web
School Factory, Managing Director of
the Innovation Factory
59 rue Nationale
75013 Paris
Françoise Lemalle
Date of birth: 01.15.1965
Nationality: French
Natixis shares held: 1,000
Director
First appointed: Co-opted by the Board of Directors on
07.30.2015
Term expires: 2019 AGM (b)
Member – Audit Committee
First appointed: Board Meeting of 02.09.2016
Term expires: 2019 AGM (b)
Member - Strategic Committee
First appointed: Board Meeting of 07.30.2015
Term expires: 2019 AGM (b)
Chairman of the Steering and
Supervisory Board of Caisse
d’Epargne Côte d'Azur (CECAZ)
455 promenade des Anglais
06200 Nice
Bernard Oppetit
Date of birth: 08.05.1956
Nationality: French
Natixis shares held: 1,000
Independent director
First appointed: Co-opted by the Board of Directors on
11.12.2009
and ratified at the AGM of 05.27.2010
Term expires: 2019 AGM (b)
Chairman - Risk Committee
First appointed: Board Meeting of 12.17.2014
Term expires: 2019 AGM (b)
Member – Audit Committee
First appointed: Board Meeting of 12.17.2009
Term expires: 2019 AGM (b)
Member - Strategic Committee
First appointed: Board Meeting of 05.11.2011
Term expires: 2019 AGM (b)
Chairman of Centaurus Capital
33 Cavendish Square
London W1G 0PW
Stéphanie Paix Director Chairman of the Management Board
of Caisse d’Epargne Rhône Alpes
Corporate Governance 2 Role and operating rules of the corporate bodies
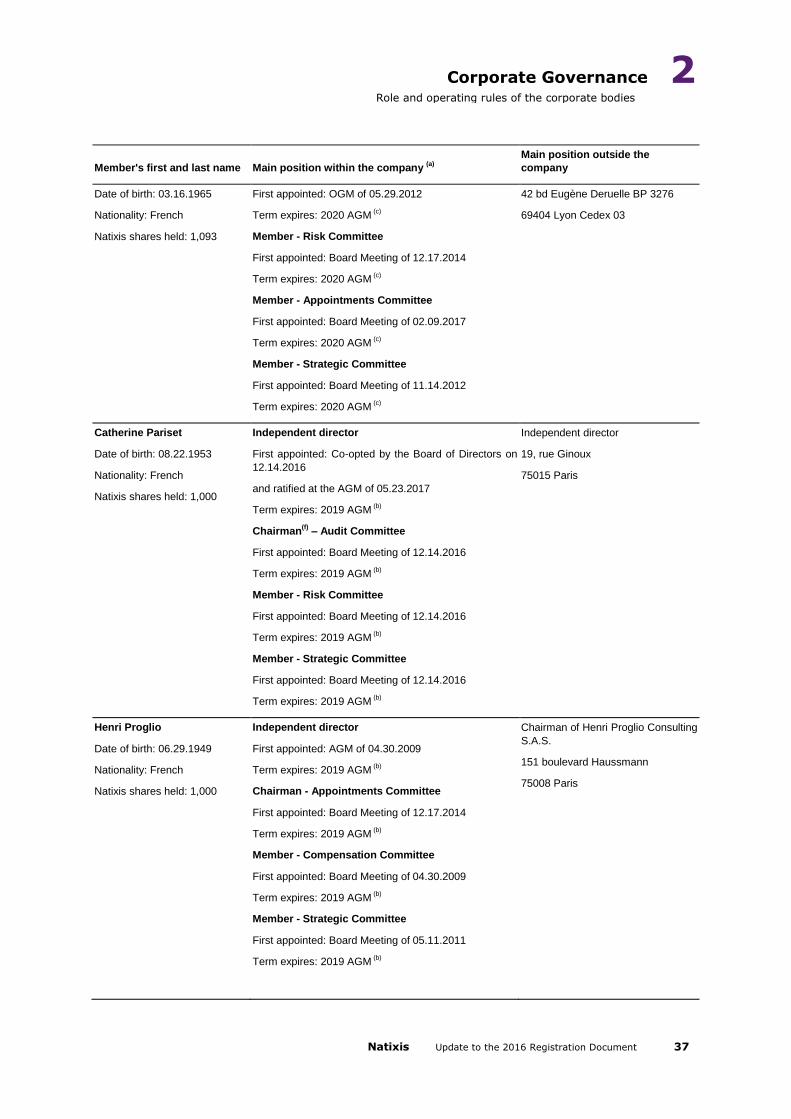
Natixis Update to the 2016 Registration Document 37
Member's first and last name Main position within the company (a)
Main position outside the
company
Date of birth: 03.16.1965
Nationality: French
Natixis shares held: 1,093
First appointed: OGM of 05.29.2012
Term expires: 2020 AGM (c)
Member - Risk Committee
First appointed: Board Meeting of 12.17.2014
Term expires: 2020 AGM (c)
Member - Appointments Committee
First appointed: Board Meeting of 02.09.2017
Term expires: 2020 AGM (c)
Member - Strategic Committee
First appointed: Board Meeting of 11.14.2012
Term expires: 2020 AGM (c)
42 bd Eugène Deruelle BP 3276
69404 Lyon Cedex 03
Catherine Pariset
Date of birth: 08.22.1953
Nationality: French
Natixis shares held: 1,000
Independent director
First appointed: Co-opted by the Board of Directors on
12.14.2016
and ratified at the AGM of 05.23.2017
Term expires: 2019 AGM (b)
Chairman(f)
– Audit Committee
First appointed: Board Meeting of 12.14.2016
Term expires: 2019 AGM (b)
Member - Risk Committee
First appointed: Board Meeting of 12.14.2016
Term expires: 2019 AGM (b)
Member - Strategic Committee
First appointed: Board Meeting of 12.14.2016
Term expires: 2019 AGM (b)
Independent director
19, rue Ginoux
75015 Paris
Henri Proglio
Date of birth: 06.29.1949
Nationality: French
Natixis shares held: 1,000
Independent director
First appointed: AGM of 04.30.2009
Term expires: 2019 AGM (b)
Chairman - Appointments Committee
First appointed: Board Meeting of 12.17.2014
Term expires: 2019 AGM (b)
Member - Compensation Committee
First appointed: Board Meeting of 04.30.2009
Term expires: 2019 AGM (b)
Member - Strategic Committee
First appointed: Board Meeting of 05.11.2011
Term expires: 2019 AGM (b)
Chairman of Henri Proglio Consulting
S.A.S.
151 boulevard Haussmann
75008 Paris

Corporate Governance 2 Role and operating rules of the corporate bodies
Natixis Update to the 2016 Registration Document 38
Member's first and last name Main position within the company (a)
Main position outside the
company
Philippe Sueur
Date of birth: 07.04.1946
Nationality: French
Natixis shares held: 4,000
Director
First appointed: AGM of 04.30.2009
Term expires: 2019 AGM (b)
Member - Appointments Committee
First appointed: Board Meeting of 12.17.2014
Term expires: 2019 AGM (b)
Member - Strategic Committee
First appointed: Board Meeting of 05.11.2011
Term expires: 2019 AGM (b)
Member of the Steering and
Supervisory Board of Caisse
d’Epargne Île-de-France
57 rue du Général-de-Gaulle
95880 Enghien-Les-Bains
Nicolas de Tavernost
Date of birth: 08.22.1950
Nationality: French
Natixis shares held: 1,000
Independent director
First appointed: OGM of 07.31.2013
Term expires: 2021 AGM (d)
Chairman - Compensation Committee
First appointed: Board Meeting of 08.06.2013
Term expires: 2021 AGM (d)
Member - Appointments Committee
First appointed: Board Meeting of 12.17.2014
Term expires: 2021 AGM (d)
Member - Strategic Committee
First appointed: Board Meeting of 08.06.2013
Term expires: 2021 AGM (d)
Chairman of the Groupe M6
Management Board
89 avenue Charles de Gaulle
92575 Neuilly sur Seine Cedex
(*) In the course of being acquired
(a) A brief resume for each Natixis corporate officer and the list of corporate offices they held in 2016 as well as previous years
are provided in paragraph 2.2 of the Natixis 2016 Registration Document.
(b) AGM held to approve the financial statements for fiscal year 2018.
(b) AGM held to approve the financial statements for fiscal year 2019.
(d) AGM held to approve the financial statements for fiscal year 2020.
(e) Since February 10, 2016.
(f) Since February 9, 2017
2.1.2 SENIOR MANAGEMENT COMMITTEE AND EXECUTIVE COMMITTEE
2.1.2.1 Senior management as of August 1, 2017
Corporate officer's first and last name Main position within the company Main position outside the company
Laurent Mignon Date of birth: 12.28.1963 Nationality: French Natixis shares held: 1,090
Chief Executive Officer First appointed: Board Meeting of 04.30.2009 with effect from 05/14/2009 Renewal date: Board Meeting of 02.18.2015 Term expires: 2019 AGM
Member of the BPCE Management Board (a)
(a) The list of corporate offices held by the Chief Executive Officer in 2016 and in previous years is provided in paragraph 2.2 of the Natixis 2016 Registration Document.

Corporate Governance 2 Role and operating rules of the corporate bodies
Natixis Update to the 2016 Registration Document 39
2.1.2.2 Senior Management Committee and Executive Committee
■ MEMBERS OF THE SENIOR MANAGEMENT COMMITTEE (SMC) AS OF
AUGUST 1, 2017
Laurent Mignon Chief Executive Officer Chairman of the Committee
Gils Berrous Specialized Financial Services
Jean Cheval Finance and Risks
Norbert Cron Operations and Information Systems
Anne Lebel Human Resources
Jean-François Lequoy Investment Solutions - Insurance
André-Jean Olivier Corporate Secretariat
Jean Raby Investment Solutions – Asset Management and Private Banking
François Riahi Corporate & Investment Banking (CIB)
Marc Vincent Corporate & Investment Banking (CIB)
■ MEMBERS OF THE EXECUTIVE COMMITTEE (EXCO) AS OF
AUGUST 1, 2017
Laurent Mignon Chief Executive Officer
Stéphane About Financing and Market Solutions - Americas
Carine André Operations and Information Systems - Operations
Patrick Artus Chief Economist
Luc Barnaud Chief Digital Officer
Beverly Bearden Asset Management and Private Banking – Natixis Global Asset Management and Human Resources
Franck Bernay Operations and information systems – Information systems
Gils Berrous Specialized Financial Services
Olivier Bilal Asset Management and Private Banking – Natixis Global Asset Management – International Sales and Marketing
Nathalie Bricker Finance and Risks – Accounting and Ratios
Nathalie Broutèle Insurance – Natixis Assurances
Stéphane Caminati SFS – Natixis Interépargne
Marc Cattelin SFS – EuroTitres
Jean Cheval Finance and Risks
Norbert Cron Operations and Information Systems
Elisabeth de Gaulle Communication
Georges-Eric de La Brunière Asset Management and Private Banking – Banque Privée 1818
Guillaume de Saint-Seine Corporate & Investment Banking – Coverage
Pierre Debray Corporate & Investment Banking – Global Finance
Anne-Cécile Delas Corporate & Investment Banking – Global Transaction Banking
Matthieu Duncan Asset Management and Private Banking – Natixis Asset Management
Christophe Eglizeau Transformation and Business Efficiency
Catherine Fournier SFS – Natixis Payment Solutions
Luc François Corporate & Investment Banking – Market Solutions
Alain Gallois Corporate & Investment Banking – Asia-Pacific
David Giunta Asset Management and Private Banking – Natixis Global Asset Management – United States and Canada
Hervé Housse General Inspection
Philippe Jeanne Finance and Risks – Financial Management
Mohamed Kallala Corporate & Investment Banking – Investment Banking
Christophe Lanne Risks
Christophe Le Pape Insurance – Natixis Assurances
Anne Lebel Human Resources
Jean-François Lequoy Investment Solutions - Insurance
Christian Le Hir Corporate Secretariat – Chief Legal Officer
Stéphane Morin Corporate Secretariat - Compliance
Nicolas Namias Strategy
André-Jean Olivier Corporate Secretariat
Jean Raby Investment Solutions – Asset Management and Private Banking
François Riahi Corporate & Investment Banking (CIB)
Dominique Sabassier Investment Solutions – Asset Management and Private Banking Natixis Private Equity
Anne Sallé Mongauze SFS – Compagnie Européenne de Garanties et Cautions
Jérôme Terpereau SFS – Natixis Financement
Cécile Tricon-Bossard Human Resources
Didier Trupin SFS – Natixis Lease
Claude Valade SFS – Natixis Factor
Marc Vincent Corporate & Investment Banking (CIB)

Corporate Governance 2 Role and operating rules of the corporate bodies
Natixis Update to the 2016 Registration Document 40
2.2 Additional information on the corporate officers
Bernard Dupouy (since August 1, 2017)
Chairman of the Board of Directors of Banque Populaire Aquitaine Centre Atlantique (BPACA)
Date of birth: 09.19.1955
Nationality: French
Natixis shares held: 0*
Address:
10, quai des Queyries
33072 Bordeaux Cedex
Director
First appointed: co-opted by the Board of Directors on 08.01.2017
Term expires: 2019 AGM(b)
Member – Strategic Committee
First appointed: Board Meeting of 08.01.2017
Attendance rate in 2016 Board
of Directors:
N/A
Strategic Committee:
N/A
A graduate of the Ecole Supérieure de Commerce, d’Administration et
des Entreprises de Bordeaux, Bernard Dupouy joined the Board of
Directors of Banque Populaire du Sud-Ouest (BPSO) in 1996 as a
Director. He was appointed Secretary in 2006, then Vice-Chairman in
2009. In November 2011, BPSO became Banque Populaire Aquitaine
Centre Atlantique (BPACA). Bernard Dupouy subsequently became
Deputy Vice-Chairman, then Chairman of the Board of Directors in
January 2015.
He was also Chairman of the Board of Directors of BPSO subsidiary
Crédit Commercial du Sud-Ouest, from 2008 to 2011. From 2011 to
2015, he was a Director and Chairman of the Audit and Risks
Committee.
In addition, he was a Director of Crédit Maritime Mutuel du Littoral
Sud-Ouest from 2012 to 2015, and subsequently became Permanent
Representative of BPACA, and a Director of Crédit Maritime. Since
2012, he has chaired the Audit, Risks and Accounts Committee of
Crédit Maritime.
A well-known entrepreneur in the Aquitaine region, Bernard Dupouy is
also Chairman of Villa Primrose, Vice-Chairman of Congrès et
Exposition de Bordeaux and Director of Union Maritime du Port de
Bordeaux.
Key advisory skills: expertise in business administration, with in-
depth knowledge of retail banking, the regional economy and French
overseas territories.
Other offices held in 2016:
Within Groupe BPCE
• Chairman of the Board of Directors of Banque Populaire
Aquitaine Centre Atlantique (BPACA) (since 01.27.2015)
• Director of: Fédération Nationale des Banques Populaires
(since May 2015), Natixis Interépargne (since 11.30.2016) and
BPCE Vie (since 03.28.2017)
• Permanent Representative of BPACA, Director of Crédit
Maritime Mutuel du Littoral du Sud-Ouest (since 01.29.2015) and
Chairman of the Audit, Risks and Accounts Committee of Crédit
Maritime Mutuel (since 2012)
Outside Groupe BPCE
• Chairman and Chief Executive Officer of GROUPE DUPOUY
SA (since 07.22.1993)
• Chairman and Chief Executive Officer of ETS DUPOUY SBCC
(since 02.01.2004)
• Chairman of: Villa Primrose (since 2000), Madikera
Management 2M SAS (since 07.12.2016)
• Vice-Chairman of Congrès et Expositions de Bordeaux SAS
(since 2008)
• Permanent Representative of BPACA, Director of Bordeaux
Grands Evènements (since 2013)
• Director of: Union Maritime du Port de Bordeaux (since 2008)
• Manager of SCI Badimo (since 01.26.2000)
Compliance with rules governing
the number of offices held
AFEP-Medef code:
compliant
French Monetary and Financial Code:
compliant

Corporate Governance 2 Role and operating rules of the corporate bodies
Natixis Update to the 2016 Registration Document 41
Offices held in previous fiscal years
2013 2014 2015 2016
(until 01.29.2015)
(until March 2015)
(until 11.23.2016)
(a) Company outside Groupe BPCE (b) AGM held to approve the financial statements for fiscal year 2018 * Acquisition in
progress
2.3 Management and oversight of corporate governance
2.3.1 Board of Directors
2.3.1.1 Organization
Changes in the structure of the Board since March 21, 2017:
On May 23, 2017, the Combined Shareholders’ Meeting of Natixis:
- ratified the co-opting of Catherine Pariset as a Director by the Board of Directors on December 14, 2016, to replace Laurence Debroux, to serve out the remainder of her predecessor’s term of office, i.e. until the General Shareholders’ Meeting held to approve the financial statements for the year ending on December 31, 2018;
- renewed the term of office of Nicolas de Tavernost for four years, i.e. until the General Shareholders’ Meeting held to approve the financial statements for the year ending on December 31, 2020.
On May 24, 2017, Michel Grass resigned from his position as a Director of Natixis and from his roles as a member of the Compensation Committee and the Strategic Committee following his appointment as Chairman of the Supervisory Board of BPCE. On August 1, 2017, the Board of Directors co-opted Bernard Dupouy to replace Michel Grass, to serve out the remainder of his predecessor’s term of office, i.e. until the General Shareholders’ Meeting held to approve the financial statements for the year ending on December 31, 2018. The Board of Directors of Natixis discussed, as it does each year, the desirable balance of its composition, with particular reference to the knowledge, expertise and experience of its members, both individually and collectively. The Board of Directors considered that the knowledge and experience of each of its members give it the breadth of expertise necessary to ensure that the Company is properly run and to define an effective strategy. 2.3.2 Special Committees: offshoots of the Board of Directors The General Shareholders’ Meeting of Natixis of May 23, 2017 reappointed Nicolas de Tavernost as a Director. Subsequent to this meeting, the Board of Directors proceeded to reappoint Nicolas de Tavernost as a member and Chairman of the Compensation Committee and a member of the Appointments Committee. Moreover, as Directors, Nicolas de Tavernost and Bernard Dupouy automatically become members of the Strategic Committee.
Director of Crédit Maritime Mutuel du Littoral Sud-Ouest (since 2012) . Director of Crédit Commercial du Sud-Ouest (since 2008) and Chairman of the Audit and Risks Committee (since 2011) . Elected member of the Bordeaux Chamber of Commerce and Industry (a) (since 2006)

Corporate Governance 2 Role and operating rules of the corporate bodies
Natixis Update to the 2016 Registration Document 42
2.3.2.3 The Compensation Committee
A Organization
As of August 1, 2017, the members of this Committee were as follows:
Nicolas de Tavernost Chairman
Alain Condaminas Member
Alain Denizot Member
Anne Lalou Member
Henri Proglio Member
2.3.3 Senior Management
2.3.3.1 Organization
The executive management of Natixis is provided by two executive managers: Laurent Mignon (Chief Executive Officer) and Jean Cheval (Chief Finance and Risk Officer).
It should be noted that in the event of the absence of the Chief Executive Officer, his second-in-command will ensure business continuity until the Board of Directors appoints a new Chief Executive Officer, on the proposal of the Appointments Committee.
2.4 Natixis Compensation Policy 2.4.3.3 Compensation and benefits of any kind for Laurent Mignon in connection with his duties as Chief Executive Officer of Natixis
Annual variable compensation It should be noted that for the 2016 fiscal year, the variable compensation target was set at €960,000, i.e. 120% of Laurent Mignon's fixed compensation, with a range of between 0% and 156.75% of the target, i.e. the maximum amount of annual variable compensation is 188.10% of the amount of his fixed compensation. Rules for determining the compensation for the Chief Executive Officer for 2017 Quantitative and strategic criteria for determining the Chief Executive Officer's annual variable compensation for 2017 were approved by the Board of Directors on February 9, 2017 after review by the Compensation Committee, as was the target which was set at 120% of fixed compensation, with a range of 0% to 156.75% of the target, i.e. the maximum amount of annual variable compensation is 188.10% of the fixed compensation.

Risk and capital adequacy 3 Capital management and capital adequacy
Natixis Update to the 2016 Registration Document 43
III SECTION 3: RISK AND CAPITAL ADEQUACY 3.1.2 Risk factors
There were no significant changes in the risk factors applicable to Natixis compared to the description
given in the Natixis 2016 Registration Document (Chapter 3, pgs. 112 to 118).
3.3 Capital management and capital adequacy
3.3.3 Changes in regulatory capital, regulatory own funds requirements and ratios in the first half of 2017
TRANSITION FROM SHAREHOLDER’S EQUITY TO PRUDENTIAL CAPITAL AFTER APPLYING PHASE-IN ARRANGEMENTS
(In millions of euros) 06.30.2017 12.31.2016
Shareholders' equity
Capital 5,020 5,019
Issue premium 4,210 4,210
Retained earnings 6,651 6,471
Treasury shares -18 0
Other, including items of comprehensive income 804 1,150
Other instruments to be reclassified as Additional Tier 1 capital 2,085 1,611
Net income 768 1,374
Total shareholders' equity - group share 19,520 19,836
Reclassification as Additional Tier 1 capital -2,085 -1,611
Translation adjustments -27 -86
Restatement of dividend forecast (dividend for previous year) 0 0
Prudential filters after phase-in arrangements
Own credit risk: Gain on reclassification of hybrid securities -257 -257
Own credit risk: liabilities and derivatives net of deferred taxes 74 9
Prudent valuation adjustment -253 -257
Unrealized gains and losses 57 -8
Total prudential filters -379 -513
Deductions after pase-in arrangements
Dividend proposed for current year and related expenses -371 -1,130
Goodwill
Amount as per accounting base -3,117 -3,213
Amount of related deferred tax liabilities 491 530
Amount included in value of investments in associates -234 -262
Intangible assets
Amount as per accounting base -508 -521
Minority interests
Amount as per accounting base 72 90
Prudential adjustment including phase-in arrangements -70 -89
Deferred tax assets (tax loss carry-forwards)
Amount as per accounting base -1,813 -1,914
o/w portion not including tax loss carry-forwards and impact of netting 825 799
Prudential adjustment including phase-in arrangements 395 669
Shortfall of provisions to expected losses 0 0
Investments in the share capital of financial sector entities 0 0
Other prudential adjustments including phase-in arrangements -72 -112
Total deductions -4,401 -5,152
Total Common Equity Tier 1 (CET1) 12,628 12,474
Hybrid capital instruments

Risk and capital adequacy 3 Capital management and capital adequacy
Natixis Update to the 2016 Registration Document 44
Amount as per accounting base
Other equity instruments 2,085 1,611
Residual gain on reclassification as equity 257 257
Nominal value adjustment during the period 44 111
Early redemption through exercise of call option 0 0
Leveling due at the grandfathering limit -140 0
Total hybrid instruments 2,246 1,979
Deductions -62 -62
Other prudential adjustments including phase-in arrangements -73 -146
Total Additional Tier 1 (AT1) 2,111 1,770
Total Tier 1 capital 14,739 14,244
Subordinated debt instruments
Amount as per accounting base 3,121 3,591
Regulatory adjustment -101 -509
Transfer of grandfathering leveling on hybrid capital instruments 140 0
Total Tier 2 instruments 3,161 3,082
Surplus of provisions to expected losses 103 100
Deductions -760 -760
Other prudential adjustments including phase-in arrangements 70 133
Total Tier 2 capital 2,573 2,555
Total prudential capital 17,312 16,799

Risk and capital adequacy 3 Capital management and capital adequacy
Natixis Update to the 2016 Registration Document 45
3.3.4 Changes in regulatory capital, regulatory own funds requirements and ratios in the first half of 2017
CHANGES IN PRUDENTIAL CAPITAL AFTER APPLYING PHASE-IN ARRANGEMENTS FOR THE PERIOD
(In millions of euros)
H1 2017
Common Equity Tier 1 (CET1)
Amount at start of period 12,474
New instruments issued (including issue premiums) 0
Instruments redeemed 0
Retained earnings from previous periods -5
Net income/(loss) for the period 768
Gross dividend proposed -371
Dividend payout in new shares 0
Changes in other comprehensive income
Translation adjustments -389
Available-for-sale assets 4
Cash flow hedging reserve 67
Other -26
Other 1
Minority interests 0
Filters and deductions not subject to the phase-in arrangements
Goodwill and intangible assets 98
Own credit risk 64
Other comprehensive income CFH -67
Prudent valuation adjustment 5
Other 2
Other, including prudential adjustments and phase-in arrangements
Deferred tax assets that rely on future earnings (excluding temporary differences) 127
Deductions in respect of breaches of capital thresholds 66
Other -18
Impact of phase-in arrangements -171
o/w impact of changes in phase-in rate -104
o/w impact of change in basis subject to phase-in arrangements -67
Amount of Common Equity Tier 1 (CET1) at end of period 12,628
Additional Tier 1 (AT1) capital
Amount at start of period 1,770
New eligible instruments issued 438
Redemptions during the period 0
Other, including prudential adjustments and phase-in arrangements -98
o/w impact of changes in phase-in rate -98
o/w other impact of changes in basis 0
Amount of Additional Tier 1 (AT1) capital at end of period 2,111
Tier 1 capital 14,739
Tier 2 capital
Amount at start of period 2,555
New eligible instruments issued 0
Redemptions during the period 0
Other, including prudential adjustments and phase-in arrangements 19
o/w impact of changes in phase-in rate 104
o/w other impact of changes in basis -86
Amount of Tier 2 capital at end of period 2,573
Total prudential capital 17,312

Risk and capital adequacy 3 Capital management and capital adequacy
Natixis Update to the 2016 Registration Document 46
In the first half of 2017, Basel 3/CRR prudential capital, after applying phase-in arrangements, changed
as follows:
Common Equity Tier 1 (CET1) totaled €12.6 billion at June 30, 2017, up slightly by €0.2 billion over the period. The €0.3 billion decrease in accounting shareholders’ equity group share was mostly attributable to the dividend payout of -€1.1 billion in the period in respect of the 2016 fiscal year, and an unfavorable conversion effect of -€0.4 billion, offset by the first half-year profit of €0.8 billion and a subordinated debt issue of €0.4 billion. In addition to first half-year profit of €0.8 billion, CET1 capital includes a provision for 2017 first half-year dividends payable in cash in the amount of -€0.4 billion, a prudential reduction in respect of goodwill of +€0.1 billion, and the phase-in effect of deferred tax, which increased from 40% in 2016 to 60% in 2017, combined with the use of deferred taxes on tax loss carry forwards for a net amount of -€0.1 billion. It also includes a reduction in restatements in recognized own credit risk adjustments of -€0.1 billion and a fall in deductions in respect of the amount exceeding threshold 3 of -€0.1 billion. Lastly, the above-mentioned subordinated debt issue of -€0.4 billion is reclassified in the Tier 1 capital compartment as it no longer meets CET1 eligibility criteria. Tier 1 capital increased by €0.3 billion mainly due to the €0.4 billion subordinated debt issue. Tier 2 capital was stable at €2.6 billion. At €112.6 billion, risk-weighted assets were down -€2.9 billion over the period.
RISK-WEIGHTED ASSETS AT JUNE 30, 2017
(in billions of euros) Credit risk CVA Market risk Operational risk Total RWA
Basel 3 at 12.31.2016 86.9 3.8 11.1 13.7 115.5
Changes in exchange rates -1.4 -1.4
Changes in business activity 2.2 -2 0.3 0.5
Improvement in risk parameters -1.8 -0.3 -2.1
Acquisitions and disposals of financial investments 0
Impact of guarantees 0 0
Basel 3 at 06.30.2017 86 1.8 10.8 14 112.6
The €2.9 billion decrease in risk-weighted assets over the first half of the year was primarily due to the following factors:
• the impact of dollar depreciation (-€1.4 billion);
• an increase in outstandings (+€0.5 billion), with the impact of the increase in activity on credit
RWA being partly offset by the implementation of hedging transactions on CVA RWA and the
reduction in exposure giving rise to CVA risk;
• the impact of risk inputs (-€2.1 billion), mainly due to changes in PD, LGD and exposure
maturities.

Risk and capital adequacy 3 Capital management and capital adequacy
Natixis Update to the 2016 Registration Document 47
3.3.5 Capital planning
BASEL 3 RWA BY KEY NATIXIS BUSINESS LINE (NX02)
(In millions of euros) RWAs
Division TOTAL Credit (a)
Market(b)
Operational
Corporate and Investment Banking 60,767 44,449 9,945 6,373
Investment Solutions 17,357 13,038 1 4,319
Specialized Financial Services 16,004 13,768 2,237
Corporate Center 11,878 8,871 2,563 444
Financial Investments 6,051 5,651 400
Treasury & Collateral Management 535 264 24 247
TOTAL AT 06.30.2017 112,592 86,040 12,533 14,019
TOTAL AT 12.31.2016 115,524 86,968 14,847 13,709
(a): Including counterparty risk. (b): Including settlement-delivery risk of €1,752 million in CVA RWA.

Risk and capital adequacy 3 Credit and counterparty risks
Natixis Update to the 2016 Registration Document 48
3.4 Credit and counterparty risks
3.4.8 Credit risk exposure
EAD, RWA AND CAPITAL REQUIREMENT BY APPROACH AND BY BASEL EXPOSURE CATEGORY (NX01)
06.30.2017 12.31.2016*
(In millions of euros)
Exposure at default
(EAD) RWA
Regulatory capital
requirement
Exposure at default
(EAD) RWA
Regulatory capital
requirement
Credit risk
Internal approach 183,303 63,241 5,059 175,830 65,643 5,251
Equities 5,394 16,347 1,308 5,620 16,826 1,346
Governments or central banks 52,149 587 47 36,305 748 60
Other items 929 231 18 934 233 19
Retail 727 193 15 813 217 17
Corporates 109,901 42,434 3,395 115,021 43,496 3,480
Institutions 8,600 2,235 179 9,632 2,719 217
Securitization 5,604 1,213 97 7,505 1,404 112
Standardized approach 54,325 15,825 1,266 70,860 13,526 1,082
Equities 171 322 26 118 259 21
Governments or central banks 6,393 2,038 163 8,503 2,027 162
Other items 8,478 8,076 646 7,306 6,538 523
Retail 2,266 1,662 133 2,571 1,892 151
Corporates 2,182 1,470 118 1,916 1,257 100
Institutions 31,237 463 37 46,759 538 43
Exposures at default 263 301 24 206 215 17
Exposures secured by mortgages on immovable property
264 112 9 221 97 8
Collective investment undertaking 247 247 20 282 282 23
Exposures to institutions and corporates with a short-term credit assessment
606 109 9 2,315 124 10
Securitization 2,218 1,026 82 663 297 24
Sub-total credit risk 237,628 79,066 6,325 246,690 79,169 6,333
Counterparty risk
Internal approach 36,018 6,092 487 36,048 7,047 564
Governments or central banks 5,524 192 15 4,069 195 16
Corporates 15,300 3,828 306 15,579 4,371 350
Institutions 14,886 2,014 161 15,528 2,364 189
Securitization 308 58 5 872 117 9
Standardized approach 19,750 628 50 19,093 479 38
Governments or central banks 844 119 10 2,150 134 11
Retail 1 1 2 1
Corporates 27 13 1 140 5
Institutions 18,541 340 27 16,639 298 24
Exposures at default
Exposures to institutions and corporates with a short-term credit assessment
337 155 12 162 41 3
Securitization 1 1
CCP default fund exposure 318 254 20 285 273 22

Risk and capital adequacy 3 Credit and counterparty risks
Natixis Update to the 2016 Registration Document 49
Sub-total counterparty risk 56,085 6,975 558 55,426 7,799 624
Market risk
Internal approach 4,744 380 5,437 435
Standardized approach 6,015 481 5,646 452
Equity risk 772 62 414 33
Foreign exchange risk 2,764 221 2,916 233
Commodities risk 639 51 708 57
Interest rate risk 1,840 147 1,608 129
Sub-total market risk 10,759 861 11,083 887
CVA 9,233 1,752 140 11,129 3,736 299
Settlement-delivery risk 22 2 28 2
Operational risk (standardized approach)** 14,019 1,122 13,709 1,097
TOTAL 112,593 9,008 115,524 9,242
*Figures at December 31, 2016 are shown pro forma in respect of the reclassification of credit risk as counterparty risk for the CCP default fund exposure. **RWA on operational risk have been revalued at June 30, 2017 based on the financial indicators published on December 31, 2016.
EAD BY GEOGRAPHIC AREA AND BY ASSET CLASS (NX05)
(In millions of euros)
Category of exposure France Europe North America Other Total
Corporates
Other than SMEs and SF 45,085 28,134 14,035 17,445 104,699
Specialized Financing (SF) 3,853 6,013 3,810 4,862 18,538
SMEs 3,354 439 13 368 4,174
Sub-total 52,292 34,586 17,858 22,675 127,411
Institutions 40,084 15,515 11,357 6,626 73,581
Governments or central banks
Central governments or central banks 38,622 5,316 13,222 5,652 62,811
International organizations 421 421
Multilateral development banks
Regional governments or local authorities
323 241 564
Public sector entities 754 272 85 2 1,114
Sub-total 39,698 5,828 13,307 6,076 64,909
Securitization 3,084 760 3,565 721 8,130
Other items 8,625 547 181 54 9,407
Equities 4,732 458 224 151 5,565
Retail
Other than SMEs 2,231 2,231
SMEs 692 9 62 763
Sub-total 2,923 9 62 2,994
Exposures secured by mortgages on immovable property
264 264
Exposures to institutions and corporates with a short-term credit assessment
125 84 199 534 943
Exposures at default 162 68 34 263
Collective investment undertaking 246 247
Total 06.30.2017 152,235 57,855 46,691 36,931 293,713
Total 12.31.2016 139,729 59,243 63,937 39,207 302,116

Risk and capital adequacy 3 Credit and counterparty risks
Natixis Update to the 2016 Registration Document 50
EAD BY INTERNAL RATING (S&P EQUIVALENT) (NX12)
The following table shows the breakdown of exposures at risk by internal rating (S&P equivalent) for asset classes measured using the IRB approach, excluding: exposures to equities (calculated using a simple weighting); pool-based exposures (acquired portfolios) and third parties grouped into homogeneous risk
classes; securitization positions. (% breakdown)
Grade Internal rating 06.30.2017 12.31.2016(*)
Investment Grade AAA 0.4% 0.2%
AA+ 6.1% 14.9%
AA 18.9% 3.8%
AA- 10.6% 9.3%
A+ 4.7% 5.3%
A 9.7% 11.3%
A- 7.9% 8.4%
BBB+ 6.6% 7.1%
BBB 7.4% 8.1%
BBB- 7.8% 9.1%
Investment Grade 80.2% 77.4%
Non-Investment Grade BB+ 4.7% 5.0%
BB 3.9% 5.0%
BB- 3.5% 4.3%
B+ 2.2% 2.1%
B 0.9% 1.0%
B- 0.3% 0.4%
CCC+ 0.1% 0.3%
CCC 0.1% 0.2%
CCC-
CC
C
Non-Investment Grade 15.8% 18.3%
Non-rated Non-rated 1.7% 1.6%
Default D 2.2% 2.7%
Total 100.0% 100.0%
(*) The figures published at December 31, 2016 have been adjusted for the reclassification of the Banque de France counterparty from AA+ to AA.

Risk and capital adequacy 3 Market risks
Natixis Update to the 2016 Registration Document 51
3.6 Market risks 3.6.4 Measurement methodology of market risk management
Change in Natixis VaR The VaR level for Natixis’ trading portfolios averaged €7 million on a rolling one-year period. It peaked at €10.1 million on September 29, 2016 and bottomed out at €5.2 million on April 6, 2017, standing at €6.7 million at June 30, 2017. OVERALL NATIXIS VAR – TRADING PORTFOLIO (1 DAY VAR 99%)
Breakdown of total trading VaR by portfolio
The following table presents VaR figures for the main activities:
(In millions of euros) VaR as of 06.30.2017
Natixis 6.7
Corporate & Investment Banking o/w 6.6
Global Markets 6.5
Equity Markets 4.8
Fixed Income 4.8
Commodities 0.3
Run off activities 1.5

Risk and capital adequacy 3 Market risks
Natixis Update to the 2016 Registration Document 52
Breakdown of total trading VaR by risk factors and compensation effect The following table presents VaR figures by risk factor and compensation effects:
Natixis backtesting for regulatory scope The following chart shows the results of backtesting (ex-post comparison of potential losses, as calculated ex-ante by VaR, with actual P&L impacts) on the regulatory scope, and can be used to verify the reliability of the VaR indicator:
Over a rolling one-year period, Natixis' regulatory backtesting revealed no exceptions.

Risk and capital adequacy 3 Market risks
Natixis Update to the 2016 Registration Document 53
Stressed NATIXIS VaR The regulatory Stressed VaR level averaged €15.7 million on a rolling one-year period. It peaked at €27.3 million on January 5, 2017 and bottomed out at €11.1 million on February 10, 2017, standing at €12.9 million at June 30, 2017. Change in regulatory Stressed VaR and End-of-period VaR:
IRC INDICATOR Natixis’ IRC level averaged €48 million. It peaked at €90 million on November 18, 2016 and bottomed out at €29 million on March 10, 2017, standing at €57 million at June 30, 2017. This indicator covers the regulatory scope:

Risk and capital adequacy 3 Market risks
Natixis Update to the 2016 Registration Document 54
Stress test results for the Natixis scope Overall stress test levels averaged €12.5 million at June 30, 2017. The historical stress test replicating the sovereign debt crisis in 2011 gave the maximum loss (-€67 million at June 30, 2017).
NATIXIS OVERALL STRESS TESTS AT JUNE 30, 2017 (IN MILLIONS OF EUROS)
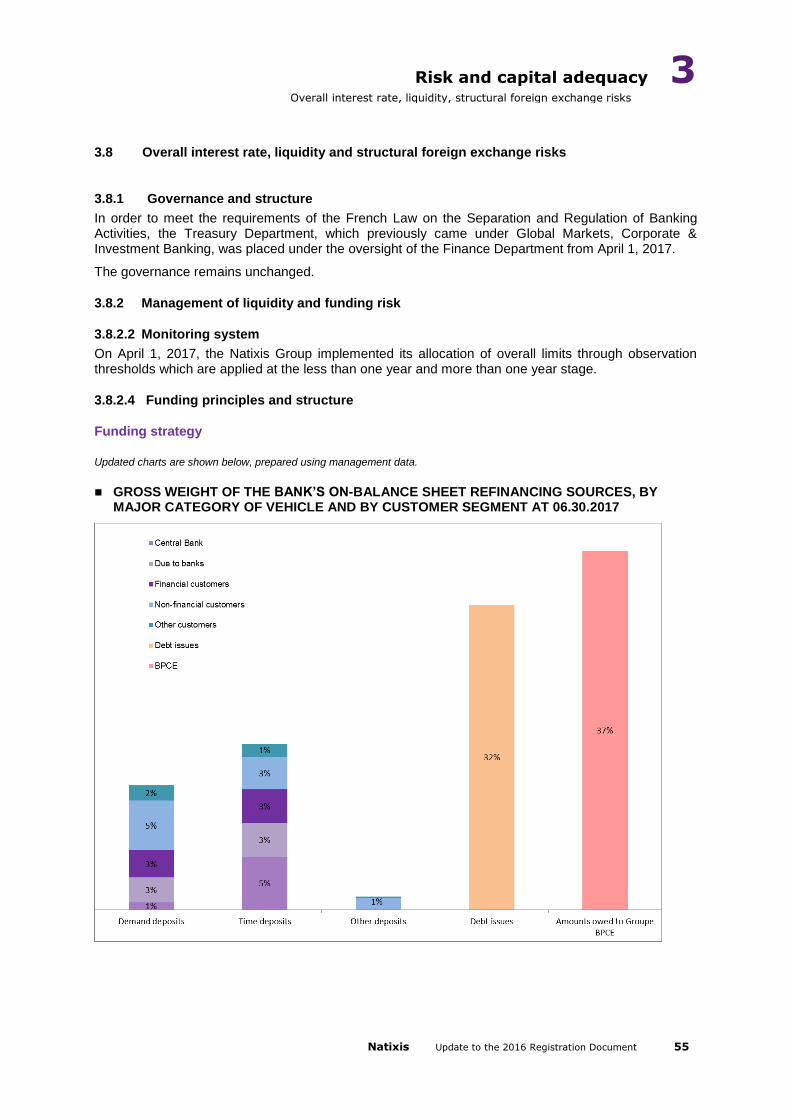
Risk and capital adequacy 3 Overall interest rate, liquidity, structural foreign exchange risks
Natixis Update to the 2016 Registration Document 55
3.8 Overall interest rate, liquidity and structural foreign exchange risks
3.8.1 Governance and structure
In order to meet the requirements of the French Law on the Separation and Regulation of Banking Activities, the Treasury Department, which previously came under Global Markets, Corporate & Investment Banking, was placed under the oversight of the Finance Department from April 1, 2017.
The governance remains unchanged.
3.8.2 Management of liquidity and funding risk
3.8.2.2 Monitoring system
On April 1, 2017, the Natixis Group implemented its allocation of overall limits through observation thresholds which are applied at the less than one year and more than one year stage.
3.8.2.4 Funding principles and structure
Funding strategy
Updated charts are shown below, prepared using management data.
GROSS WEIGHT OF THE BANK’S ON-BALANCE SHEET REFINANCING SOURCES, BY MAJOR CATEGORY OF VEHICLE AND BY CUSTOMER SEGMENT AT 06.30.2017

Risk and capital adequacy 3 Overall interest rate, liquidity, structural foreign exchange risks
Natixis Update to the 2016 Registration Document 56
06.30.2017: BREAKDOWN OF GROSS FUNDING STRUCTURE BY CURRENCY, AT CURRENT USD EXCHANGE RATES
06.30.2017: BREAKDOWN OF GROSS FUNDING STRUCTURE BY CURRENCY, AT CONSTANT USD EXCHANGE RATES
About 3/4 of the Group’s medium-term refinancing program was achieved during the first half of the year 2017.
06.30.20 17: INDICATIVE BREAKDOWN MLT REFINANCING PROGRAM
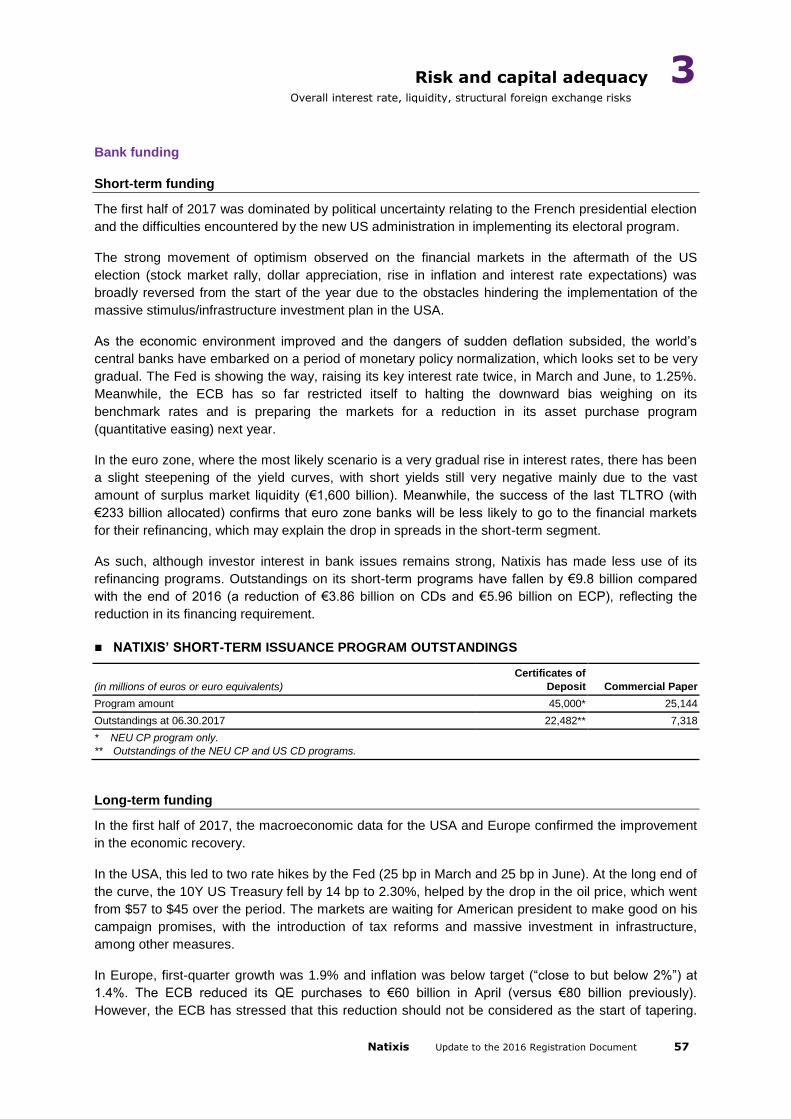
Risk and capital adequacy 3 Overall interest rate, liquidity, structural foreign exchange risks
Natixis Update to the 2016 Registration Document 57
Bank funding
Short-term funding
The first half of 2017 was dominated by political uncertainty relating to the French presidential election
and the difficulties encountered by the new US administration in implementing its electoral program.
The strong movement of optimism observed on the financial markets in the aftermath of the US
election (stock market rally, dollar appreciation, rise in inflation and interest rate expectations) was
broadly reversed from the start of the year due to the obstacles hindering the implementation of the
massive stimulus/infrastructure investment plan in the USA.
As the economic environment improved and the dangers of sudden deflation subsided, the world’s
central banks have embarked on a period of monetary policy normalization, which looks set to be very
gradual. The Fed is showing the way, raising its key interest rate twice, in March and June, to 1.25%.
Meanwhile, the ECB has so far restricted itself to halting the downward bias weighing on its
benchmark rates and is preparing the markets for a reduction in its asset purchase program
(quantitative easing) next year.
In the euro zone, where the most likely scenario is a very gradual rise in interest rates, there has been
a slight steepening of the yield curves, with short yields still very negative mainly due to the vast
amount of surplus market liquidity (€1,600 billion). Meanwhile, the success of the last TLTRO (with
€233 billion allocated) confirms that euro zone banks will be less likely to go to the financial markets
for their refinancing, which may explain the drop in spreads in the short-term segment.
As such, although investor interest in bank issues remains strong, Natixis has made less use of its
refinancing programs. Outstandings on its short-term programs have fallen by €9.8 billion compared
with the end of 2016 (a reduction of €3.86 billion on CDs and €5.96 billion on ECP), reflecting the
reduction in its financing requirement.
NATIXIS’ SHORT-TERM ISSUANCE PROGRAM OUTSTANDINGS
(in millions of euros or euro equivalents)
Certificates of
Deposit Commercial Paper
Program amount 45,000* 25,144
Outstandings at 06.30.2017 22,482** 7,318
* NEU CP program only.
** Outstandings of the NEU CP and US CD programs.
Long-term funding
In the first half of 2017, the macroeconomic data for the USA and Europe confirmed the improvement
in the economic recovery.
In the USA, this led to two rate hikes by the Fed (25 bp in March and 25 bp in June). At the long end of
the curve, the 10Y US Treasury fell by 14 bp to 2.30%, helped by the drop in the oil price, which went
from $57 to $45 over the period. The markets are waiting for American president to make good on his
campaign promises, with the introduction of tax reforms and massive investment in infrastructure,
among other measures.
In Europe, first-quarter growth was 1.9% and inflation was below target (“close to but below 2%”) at
1.4%. The ECB reduced its QE purchases to €60 billion in April (versus €80 billion previously).
However, the ECB has stressed that this reduction should not be considered as the start of tapering.

Risk and capital adequacy 3 Overall interest rate, liquidity, structural foreign exchange risks
Natixis Update to the 2016 Registration Document 58
The yield on the 10-year Bund, which was at -0.18% at the start of the year, ended the first half at
+0.45%. There was high volatility in the 10Y yield in the first half of the year mainly due to France-
related risk in the months preceding the presidential election.
In the credit market in Europe, bank spreads on senior unsecured debt continued to tighten, mainly
due to the strengthening of bank balance sheets and the rapid decisions taken under the Single
Resolution Mechanism to resolve the difficulties faced by Banco Popular, Veneto Banca, Banca
Popolare di Vicenza and Banca Monte Dei Paschi Di Siena.
In France, systemically important banks (BNP, BPCE, Crédit Agricole, Société Générale) have issued
an equivalent of €22.6 billion in TLAC-eligible senior non-preferred debt since the new French law was
passed in December 2016.
In these market conditions, Natixis raised a euro-equivalent total of €8.2 billion in funding in the first
half of 2017 under its medium- and long-term refinancing program). As the only long-term issuer in the
public issues segment, BPCE provided Natixis with financing for a total euro-equivalent amount of
€1.8 billion.
NATIXIS’ MEDIUM- AND LONG-TERM DEBT ISSUANCE PROGRAM
(in millions of euros or euro equivalents) EMTN NEU MTN US MTN Bond issues
Issues at 06.30.2016 4,575 170 25 2,700
Outstandings at 06.30.2017 13,041 658 233 8,009
3.8.2.5 Regulatory liquidity ratios
3.8.2.6 Reserves and operational management of ratios
Oversight of the leverage ratio
Natixis maintained its leverage ratio above 4% in its quarterly reporting.
COMPARISON OF ACCOUNTING EXPOSURES AND LEVERAGE EXPOSURES (LR1)
(In millions of euros)
Category 06.30.2017 12.31.2016
Total consolidated assets reported in the financial statements 420,546 442,725
Adjustment for investments in banking, financial, insurance or commercial entities that are consolidated for accounting purposes but outside the scope of regulatory consolidation
(Adjustment for fiduciary assets recognized on the balance sheet pursuant to the operative accounting framework but excluded from the leverage ratio exposure measurement, in accordance with Article 429 (13) of Regulation (EU) No. 575/2013 “CRR”)
Adjustments for derivative financial instruments - 36,377 - 38,832
Adjustment for securities financing transactions (repurchase transactions and other types of collateralized loans)
- 17,137 - 20,183
Adjustment for off-balance sheet items (i.e. conversion of off-balance sheet exposures to credit equivalent amounts)
35,889 37,038
Other adjustments - 19,144 - 19,129
Leverage ratio exposure (*) 383,778 401,619
(*) o/w exposure related to affiliates 35,003 50,540
Excluding exposure related to affiliates 348,775 351,079

Risk and capital adequacy 3 Overall interest rate, liquidity, structural foreign exchange risks
Natixis Update to the 2016 Registration Document 59
3.8.4 Overall interest rate risk
3.8.4.3 Quantitative information
Overall interest rate risk remains moderate for Natixis given the outstanding positions managed by the company. The Basel 2 normative shock (immediate -200 bp change in yield curves) at June 30, 2017 would lead to a variation of -€398 million in the portfolio’s economic value. This sensitivity is low given the size of the banking book and represents less than 5% of the bank's CET1 capital.
3.8.5 Other information
3.8.5.3 Monitoring of rating triggers
They are covered under the LCR management policy and are estimated at €2.6 billion in EUR equivalent at 06.30.2017, versus €3.1 billion at 12.31.2016.

Risk and capital adequacy 3 Legal risks
Natixis Update to the 2016 Registration Document 60
3.9 Compliance and reputational risk, Legal risks 3.9.2 Legal risks 3.9.2.1 Legal and arbitration proceedings The following legal disputes are updated compared with the 2016 Registration document:
Class action lawsuits in the United States relating to Municipal Guaranteed Investment Contract transactions
In March 2008, Natixis and Natixis Funding Corp. were named among the defendants in multiple class-action and individual lawsuits filed by and on behalf of certain state, county and municipal bond issuers in the US federal courts in New York, Washington D.C. and California. The plaintiffs alleged that providers and brokers of municipal derivatives conspired to fix prices, rig bids and allocate customers beginning in 1992. The various lawsuits, as initially filed, named more than 30 other US and European banks and brokers as defendants in all. The lawsuits were grouped in federal court (the United States District Court for the Southern District of New York) under the caption “Municipal Derivatives Antitrust Litigation.”
Some plaintiffs sought to certify a class of all state, local and municipal government entities, independent government agencies and private entities that purchased municipal derivatives from the banks and brokers named as defendants beginning in 1992, and sought to recover alleged damages resulting from the alleged anticompetitive activities.
These civil claims arose out of investigations in the industry that were performed beginning in late 2006 by certain government agencies, including the US Internal Revenue Service (“IRS”), the Department of Justice (“DOJ”) Anti-Trust division, the US Securities and Exchange Commission (“SEC”) and state prosecutors.
Over the course of the litigation, several defendants entered into settlements with the plaintiffs. Although Natixis denied and continues to deny the allegations of wrongdoing and any liability in these proceedings, Natixis Funding Corp., together with other remaining class action defendants, reached a final settlement in early 2016. The class, under the terms of this settlement, includes all state, local and municipal government entities, independent government agencies and private entities that purchased, by negotiation, competitive bidding or auction, municipal derivatives from Natixis Funding Corp. or any other provider defendant or alleged co-conspirator, or municipal derivative transactions brokered by any broker or alleged co-conspirator, in the US or its territories. Natixis Funding Corp. paid $28,452,500 in respect of the class action and $1,497,000 to a group of 22 state Attorneys General.
The settlement is applicable to Natixis and its affiliates and encompasses all claims that were or could have been included in the nationwide consolidated class action or submitted by the group of Attorneys General, and is binding on all class members except for certain individual claimants who chose to exclude themselves from the class. The class action settlement received court approval in July 2016, bringing an end to the legal proceedings.
Furthermore, by the end of 2016 Natixis had finalized settlements with each of the individual claimants outside the class, none of which involved a material amount. This matter is now closed.
MMR claim
In 2007, Ixis Corporate & Investment Bank (the predecessor of Natixis) issued EMTNs (Euro Medium Term Notes) indexed to a fund that invested in the Bernard Madoff Investment Securities fund. Renstone Investments Ltd (the apparent predecessor of MMR Investment Ltd) is alleged to have subscribed, via a financial intermediary acting as the placement agent, for these bonds in the amount of $50 million.

Risk and capital adequacy 3 Legal risks
Natixis Update to the 2016 Registration Document 61
In April 2012, MMR Investment Ltd filed a joint claim against Natixis and the financial intermediary before the Commercial Court of Paris, claiming not to have received the bonds, despite having paid the subscription price to the financial intermediary. The claim mainly concerns the reimbursement of the subscription price of the bonds and, and as an alternative, the annulment of the subscription on the grounds of defect in consent. On February 6, 2017, the Commercial Court of Paris dismissed all of MMR Investment Ltd’s claims.
MMR Investment Ltd filed an appeal on March 27, 2017. The case is still in progress.
SEEM
In January 2013, Natixis received a compulsory third-party joinder at the request of SEEM. This company seeks a joint sanction against Natixis, asking that Cube Energy SCA and its general partner Natixis Environnement & Infrastructures Luxembourg S.A. (NEIL – a Natixis subsidiary at the time) be ordered to pay approximately €30 million, alleging that Cube Energy SCA, via its general partner NEIL, acted in breach of its duty of loyalty to its partner SEEM.
The Commercial Court of Paris acquitted Natixis in its ruling handed down on November 8, 2016. Some plaintiffs launched an appeal against this ruling in February 2017.
A solution was found in June 2017, leading the Paris Court of Appeal to close the case on June 20, 2017.
This dispute has been settled.
Union Mutualiste Retraite
In June 2013, Union Mutualiste Retraite filed three complaints against AEW Europe in relation to the acquisition and management of two real estate portfolios in Germany between 2006 and 2008. The amounts claimed by Union Mutualiste Retraite total €103 million.
On January 19, 2016, the Commercial Court of Paris ordered a stay of proceedings on the merits of the case, pending a final decision by the Paris Court of Appeal as requested by AEW Europe in early July 2015 in the context of an appeal for annulment (“appel-nullité”) submitted against the ruling of the Commercial Court of July 1, 2015, which had declared the legal action by the claimants to be admissible. In an order dated July 17, 2017, the Paris Court of Appeal ruled the AEW Europe annulment to be inadmissible.
On October 25, 2016, the Commercial Court of Paris ordered the two insurance schemes involved to honor, in respect of AEW Europe, the sanctions covered by the policies that may be ruled in favor of UMR in connection with the litigation and to cover the defense costs incurred by AEW Europe. One of the insurers concerned appealed this decision on December 7, 2016.
The case is still in progress.
Securitization in the United States
Since 2012, five separate legal proceedings regarding residential mortgage-backed security (RMBS) transactions executed between 2001 and mid-2007 have been initiated against Natixis Real Estate Holdings LLC before the New York Supreme Court.
Two of these proceedings relate to accusations of fraud. One was dismissed in 2015 as time-barred. Some claims related to the second proceeding were also dismissed as time-barred. That case, for the remaining claims, is currently in the discovery phase, and Natixis believes that it has meritorious defenses.
Three of these proceedings have been brought against Natixis, purportedly on behalf of certificate holders, alleging that Natixis failed to repurchase defective mortgages from certain securitizations.

Risk and capital adequacy 3 Legal risks
Natixis Update to the 2016 Registration Document 62
Natixis considers the claims brought against it to be without merit for multiple reasons, including that they are time-barred under applicable statute of limitations and that the claimants do not have the legal standing to file the suit, and intends to defend itself vigorously.
Another lawsuit has been filed before a US federal court against Natixis Real Estate Holdings LLC and several subsidiaries, alleging violations of the False Claims Act in RMBS activities. Natixis filed a motion to dismiss the case in its entirety in January 2017.
Formula funds
Following an inspection by the AMF (French Financial Markets Authority) in February 2015 on Natixis Asset Management’s compliance with its professional obligations, particularly the management of its formula funds, the AMF's Enforcement Committee delivered its decision on July 25, 2017, issuing a warning and a fine of €35 million. The Enforcement Committee found a number of failings concerning the redemption fees charged to funds and structuring margins.
Natixis Asset Management is mounting a rigorous defense against this decision.

Risk and capital adequacy 3 Other risks
Natixis Update to the 2016 Registration Document 63
3.10 Other risks 3.10.1 Risks related to insurance activities Natixis Assurances Natixis Assurances is the Insurance division of Natixis and is structured into two businesses:
▪ the personal insurance business, focused on developing portfolios for life insurance, investment and retirement savings, and personal protection insurance;
▪ the non-life insurance business, focused on developing portfolios for motor and multi-risk home insurance, personal accident insurance, legal protection, healthcare and property and casualty insurance.
Given the predominance of the Investment Solutions activity, the main risks to which Natixis Assurances is exposed are financial. The company is also exposed to underwriting risks (life and non-life), as well as counterparty risk.
Market risk
Market risk is in large part borne by the subsidiary BPCE Vie on the financial assets that underpin its commitments with guaranteed principal and returns (euro-denominated policies: €47.4 billion on the main fund balance sheet at June 30, 2017). The company is exposed to asset impairment risk (fall in the equity or real estate market, wider spreads, interest rate hikes) as well as the risk of lower interest rates which would generate insufficient capital to meet its guaranteed rate. To deal with this risk, BPCE Vie has only sold policies with a minimum guaranteed return in recent years: more than 90% of the policies have a zero minimum guaranteed return. The minimum guaranteed return averaged 0.15% at end-June 2017.
To manage market risk, the sources of return have been diversified, namely via investments in new asset classes (financing the economy, low-volatility equity, etc.). This diversification is managed by a strategic allocation, defined on a yearly basis, which takes into account regulatory constraints, commitments to policyholders and commercial requirements.
Credit risk
Credit risk is monitored and managed in compliance with Natixis Assurances’ standards and internal limits. As of June 30, 2017, 62% of the fixed-income portfolio was invested in securities rated higher than A-.
Life insurance underwriting risk
The main risk to which life insurance underwriting is exposed is linked to the Investment Solutions activity. In an especially low interest-rate environment, the biggest risk is that of fewer redemptions and/or excessive inflows in euro-denominated vehicles, as reinvestments in securities dilute the main fund’s return. To prioritize inflows in unit-linked policies, measures have been taken, such as the creation of unit-linked policy products and communication campaigns, and a communication campaign targeting customers and the network.
Non-life insurance underwriting risk
The non-life insurance underwriting risk to which Natixis Assurances is exposed is borne by its subsidiary BPCE Assurances:
▪ premium risk: in order to ensure that the premiums paid by the policyholders correspond to the transferred risk, BPCE Assurances implemented a portfolio monitoring policy whereby each policy is given a score based on its track record over three years. Factored in are types of claims, number of claims, their cost and other variables specific to the activity in question (degree of liability and bonuses/penalties for motor insurance, for instance). This monitoring policy also contributes to detecting potential risks arising from large claims, and to arranging adequate reinsurance coverage;

Risk and capital adequacy 3 Other risks
Natixis Update to the 2016 Registration Document 64
▪ risk of loss: each time inventory is taken, an actuarial assessment of the reserves for claims to be paid is conducted based on methods widely recognized by the profession and required by the regulator;
▪ catastrophe risk: catastrophe risk is the exposure to an event of significant magnitude generating a multitude of claims (storm, risk of civil liability, etc.). This risk is therefore reinsured either through the government in the event of a natural disaster or an attack, for example, or through private reinsurers, specifically in the event of a storm or a civil liability claim, or through reinsurance pools.
Counterparty risk
The counterparty risk to which Natixis Assurances is exposed mainly concerns reinsurance counterparties. The selection of reinsurers is a key component of managing this risk:
▪ Natixis Assurances deals with reinsurers who are subject to a financial rating by at least one of the three internationally recognized rating agencies, and who have a Standard & Poor’s equivalent rating of A- or higher;
▪ using several reinsurers ensures counterparty diversification and limits counterparty risk.
Coface
Through its activities, Coface is exposed to five main types of risk (strategic risk, credit risk, financial
risk, operational and non-compliance risk, and reinsurance risk).
The two principal risks are credit risk and financial risk. Credit risk is the risk of loss generated by the
portfolio of insurance policies. Financial risk relates to the risk of losses arising from adverse changes
in interest rates, exchange rates or the market value of securities or real estate investments. Coface
has implemented the appropriate tools to control these risks and to ensure they remain within
conservative limits.
Given its listing on the stock market, the main risk factors and uncertainties to which Coface is
exposed are set out in detail under paragraph 2.4 “Chairman’s report on corporate governance,
internal risk control and risk management procedures” published on March 21, 2017, and in Chapter 5
“Main risk factors and their management within the Group” of the Coface registration document, filed
with the AMF on April 12, 2017 under number R.17-016.
In the first half of 2017, following action taken to reduce corporate risks in 2016 in certain sensitive
geographic areas and in business sectors deemed to be risky, Coface's risk management is being
implemented in accordance with the previously established management principles.
CEGC
Compagnie Européenne de Garanties et Cautions is the BPCE Group’s multiple business line security and guarantee platform. It is exposed to underwriting risk, market risk and the risk of the reinsurers defaulting, as well as operational risk.
Under the Solvency II supervisory regime, which came into effect on January 1, 2016, the ACPR (French Prudential Supervisory Authority) approved CEGC’s internal model for assessing the underwriting risk on deposits for real estate loans to retail customers in March 2017.
In 2017, CEGC submitted the new annual quantitative statements required by the Solvency II regulations, accompanied by the qualitative and quantitative reports intended for the supervisor (RSR) and the public (SFCR).

Risk and capital adequacy 3 Other risks
Natixis Update to the 2016 Registration Document 65
Underwriting risk
Underwriting risk is the main risk incurred by CEGC. It is essentially a counterparty risk, as the commitments given by CEGC to beneficiaries of guarantees result in direct exposure to underwriters. These regulated commitments recorded on the liabilities side of the balance sheet amounted to €1.75 billion at June 30, 2017 (up 9.3% compared to the end of 2016). This increase was in line with fiscal year 2016, driven mainly by mortgage guarantees for retail customers.
CEGC’S OUTSTANDINGS (IN MILLIONS OF EUROS)
CEGC’s activities June 2017
Change (June 2017 versus
December 2016)
Retail customers 1,557 9.2 %
Single-family home builders 20 17.6 %
Property administrators – Realtors 16 77.8 %
Corporates 23 9.5 %
Real estate developers 13 (27.8) %
Professional customers 68 4.6 %
Social economy – Social housing 39 14.7 %
Run-off activities 11 37.5 %
TOTAL 1,747 9.3 %
Market risk
CEGC holds an investment portfolio of about €1.80 billion on its balance sheet as at June 30, 2017. The portfolio is up slightly (4.5% since the end of 2016). Market risk from the investment portfolio is limited by the Company’s investment choices. Its risk limits are set forth in the portfolio management mandate established with Natixis Asset Management. By collecting surety insurance premiums at the time of commitment, CEGC does not require funding. Neither does CEGC carry transformation risk: the investment portfolio is entirely backed by equity and technical reserves.
06.30.2017 12.31.2016
(in millions of euros)
Gross
balance
sheet value
of the
provision % breakdown Market value
Gross
balance
sheet value
of the
provision % breakdown Market value
Equities 120 6.8% 144 130 7.7% 155
Bonds 1,311 74.2% 1,441 1,244 73.5% 1,387
Diversified 138 7.8% 144 111 6.6% 115
Cash 26 1.5% 26 119 7.0% 119
Real estate 153 8.7% 182 70 4.2% 99
Private equity investment
funds 18 1.0% 24 18 1.0% 22
Other 1 0.1% 1 1 0.1% 1
TOTAL 1,768 100% 1,961 1,693 100% 1,899
Reinsurance risk
CEGC hedges its liability portfolio by implementing a reinsurance program tailored to its activities.
In loan guarantees, reinsurance is used as a way to manage regulatory capital by protecting guarantee beneficiaries in the event of an economic recession leading to a loss of up to 2% of outstanding guaranteed loans.
Risk and capital adequacy 3 Other risks
Natixis Update to the 2016 Registration Document 66
In the Corporate segments, the program is used to protect CEGC’s capital by covering high-severity risks. It has been calibrated to protect against three individual loss events (loss related to a counterparty or a group of counterparties) which could have a significant impact on the Corporate segment’s income statement.
Any modification of the reinsurance program (reinsurers, pricing, structure) is subject to the validation of the Capital and Solvency Management Committee chaired by a director.
Reinsurer default risk is governed by counterparty concentration and rating limits. CEGC’s reinsurance programs are underwritten by a broad panel of international reinsurers with a minimum rating of A on the S&P scale.

Risk and capital adequacy 3 Sensitive exposures
Natixis Update to the 2016 Registration Document 67
3.11 At-risk exposures (These data form an integral part of the Statutory Auditors' report on the condensed consolidated interim financial information.)
Natixis was exposed to the following risks at June 30, 2017.
Exposure to monoline insurers
Value adjustments decrease by €12 million during half-year 2017 (excluding the effect of the BPCE guarantee) to €61 million at June 30, 2017, versus €73 million at December 31, 2016.
(in millions of euros)
Data at 06.30.2017 Data at 12.31.2016
Notional amount
Pre-value adjustment
exposure Value
adjustments Notional amount
Pre-value adjustment
exposure Value
adjustments
Protection for CLOs 42 2 - 68 4 -
Protection for RMBS 37 6 - 44 7 -
Other risks 1,610 273 (61) 1,840 342 (73)
TOTAL 1,689 281 (61) 1,952 353 (73)
(in millions of euros) 06.30.2017 12.31.2016
Pre-value adjustment exposure 281 353
Value adjustments (61) (73)
RESIDUAL EXPOSURE 219 280
Discount (%) 22% 21%
European RMBS
- NET EXPOSURE TO UK RMBS
(in millions of euros) UK RMBS
Net exposure
at 12.31.2016
Change in value in H1
2017 Other
changes
Net exposure
at 06.30.2017 AAA AA A BBB BB B CCC CC
Trading book 40 72 112 41 28 37 5 1
TOTAL 40 - 72 112 41 28 37 5 1
- NET EXPOSURE TO SPANISH RMBS
(in millions of euros) Spanish RMBS
Net exposure
at 12.31.2016
Change in value in H1
2017 Other
changes
Net exposure
at 06.30.2017 AAA AA A BBB BB B CCC CC
Trading book 45 45 22 6 4 13
TOTAL 45 45 22 6 4 13
CMBS
(in millions of euros) CMBS
Net exposure as at 12.31.2016
Change in value in H1 2017 Other changes
Net exposure as at 06.30.2017
Trading book 0 -
Loans and receivables portfolio 28 15 43
TOTAL 28 0 15 43

Risk and capital adequacy 3 Sensitive exposures
Natixis Update to the 2016 Registration Document 68
Breakdown by rating % breakdown
Breakdown by country % breakdown
AAA 50%
US 100%
AA 5%
TOTAL 100%
NR 45%
TOTAL 100%
Exposures to countries receiving financial assistance
At June 30, 2017 exposures to sovereign risk in countries receiving financial aid or facing uncertainties (political, currency, etc.) were as follows:
(in millions of euros)
06.30.2017 (1)
12.31.2016 (1)
Sovereign securities Derivatives
(2) Other Total
Sovereign securities Derivatives
(2) Other Total
Spain* 1,015 4 9 1,028 1,088 5 4 1,097
Greece* 2 2 2 2
Ireland* 111 (9) 102 162 162
Portugal* 100 100 101 101
Russia 0 2 4 6 2 2 23 27
Ukraine 1 1 0
Venezuela (3)
64 64 70 70
TOTAL 1,229 (3) 77 1,304 1,355 7 97 1,459
(*) Countries which benefited from European Union financial assistance. (1) Excluding corporates. (2) Including credit derivatives.
(3) The exposure amount shown is the gross amount before the guarantee. The net exposure after taking into account the guarantee was €3.2 million at June 30, 2017 and €3.5 million at December 31, 2016.
At June 30, 2017 exposure to non-government risk, in particular Greece and countries facing uncertainties (political, currency, etc.), directly held by Natixis stood as follows:
(in millions of euros)
Gross exposure at June 30, 2017
(1)
Total gross
exposure
Provi- sions
(2)
Net exposure
at June
30, 2017
Gross exposure at December 31, 2016
(1)
Total gross
exposure
Provi-sions
(2)
Net exposure
at Dec. 31,
2016 Bank Asset
financing and
structured transactions
(3)
Corpo-rate
Bank Asset financing and
structured transactions
Corporate
Greece(*)
40 208 51 299 (59) 240 23 228 63 314 (60) 254
Russia 507 563 549 1,618 (5) 1,613 722 619 712 2,053 (5) 2,048
Ukraine 0 128 17 145 (21) 123 - 207 28 234 (23) 211
Total 547 898 617 2,062 (85) 1,977 745 1,054 802 2,601 (88) 2,513
(*) Countries receiving financial aid from the European Union. (1) Gross exposure: gross carrying amount on the balance sheet at June 30, 2017 and December 31, 2016. (2) Individual and collective provisions. (3) Exposure corresponds mainly to the "shipping finance" sector amounting to €119 million at June 30, 2017 versus
€134 million at December 31, 2016.

Overview of the fiscal year 4 Refinancing
Natixis Update to the 2016 Registration Document 69
IV SECTION 4: OVERVIEW OF THE FISCAL YEAR 4.1 Interim Management Report as of June 30, 2017
4.1.1 Note on methodology
The interim management report is presented in respect of the half years ended June 30, 2017 and June 30, 2016. In accordance with European regulation 809/2004 relating to information contained in prospectuses, the financial statements for the half year ended June 30, 2015 can be consulted in the update of August 4, 2016, registration number D.16-0127-A01, of the registration document filed with the AMF on March 10, 2016, under registration number D.16-027.
The presentation of the divisions in 2017 is unchanged relative to December 31, 2016, except for
the short-term treasury business which was transferred to the Corporate Center with retroactive effect
as of January 1, 2017, after it was made part of Natixis’ Finance Department. The presentation of the
2016 figures has not been amended to reflect this change.
Assessment of business line performances
The results of the Natixis business lines are presented in accordance with the Basel 3 regulatory
framework.
Capital is allocated to Natixis business lines on the basis of 10% of their Basel 3 average risk-
weighted assets.
Capital allocation specific to the insurance businesses is based on the Basel 3 accounting treatment
for investments in insurance companies, as transposed into the CRD4 and CRR (“Danish
compromise”). The capital allocated to CEGC takes into account its exclusion from the “Danish
compromise”. It is based on a 250% risk weighting of the value of the securities held by CECG, which
is the prudential treatment under the threshold mechanism applied to holdings of equity instruments
issued by financial entities.
The conventions applied to determine the results generated by the various business lines are
as follows:
the business lines record the return on normative capital allocated to them. By convention, the rate
of return on normative capital is 3%;
the return on issued share capital of the entities comprising the divisions is eliminated;
the cost of Tier two debt subordination is now charged to the divisions pro rata to their normative
capital;
the divisions are invoiced for an amount representing the bulk of Natixis’ overhead. The
uninvoiced portion accounts for less than 3% (excluding Single Resolution Fund) of Natixis' total
overhead. The Single Resolution Fund (SRF) contribution is covered by the Corporate Center and
is not charged back to the divisions.
Deeply Subordinated Notes (DSNs) are classified as equity instruments; interest expense on those
instruments is not recognized in the income statement.
ROE and ROTE for Natixis and the business lines are calculated as follows:
• the result used to determine Natixis’ ROE is net income (Group share) minus the post-tax interest
expense on DSNs. The equity used is average shareholders' equity (Group share) under IFRS,
after distribution of dividends, excluding average hybrid debt, and eliminating unrealized or
deferred gains and losses recognized in equity;
• the calculation of business line ROE is based on:

Overview of the fiscal year 4 Refinancing
Natixis Update to the 2016 Registration Document 70
• as the numerator, the business line’s pre-tax profit, as per the aforementioned rules, to which
a normative tax is applied that reflects the business line’s average tax conditions and is
updated at the start of every fiscal year;
• as the denominator, normative capital, calculated on the basis of 10% of RWA assigned to the
division, plus goodwill and intangible assets related to the business line.
• Natixis’ ROTE is determined using, as the numerator, net income (Group share) minus the post-
tax interest expense on DSNs. The equity used is average shareholders' equity (Group share)
under IFRS, after distribution of dividends, excluding average hybrid debt, average intangible
assets and average goodwill.
4.1.2 Key events for the period
In the first half of 2017, Natixis operated amid the ongoing normalization of the global economy, the rebound in international trade illustrating the improvement in economic conditions.
Global inflation, which had been climbing for two years, peaked at 3.0% in January 2017 before settling at 2.5% at the end of June following the stabilization of the oil price within the $45 to $55 per barrel range.
The normalization of commodities helped to even out current account balances and stabilized many emerging market currencies.
G4 economies all reached full employment, except for the euro zone which is somewhat lagging. The situation in the United Kingdom deteriorated and the country’s consumer confidence continued to slide. In contrast, the euro zone and Japan are stronger that six months ago, and growth in developed economies recovered half a point year-on-year to reach 1.9% at the end of June 2017.
Against this backdrop, the French economy continued to recover. Growth was still only 1.1% at the end of the first quarter (year-on-year), but is expected to accelerate to 1.4% by the end of the year: France’s strongest year-on-year GDP gain since 2011. The recovery of the French economy was largely driven by private investment, especially housing investment which remained at strong levels (+3.6% year-on-year at the end of the first quarter). Transactions and building permits are returning close to their 2013 peak, as lower real interest rates help French real estate to make a comeback. The inflation trend-adjusted home loan rate fell by 200 bp over the year, and the volume of new home loans rose.
The turnaround of the French economy, coupled with the improved employment situation, revived the optimism of French consumers whose confidence is now at a 10-year high.
Share prices continued to climb to reach record levels. But while the PER of US stocks (S&P500) appreciated to 22.9x, the highest in a non-recessionary period, the PER of European stocks (Stoxx600) fell 4 points to 23x on the back of accelerated European growth. This cyclical gap between Europe and the US has resulted in the redirection of capital flows into European equities, particularly since the new US administration has yet to deliver its fiscal stimulus and the outlook on US growth has been revised downwards.
This decoupling of the US and European economies is also visible on the debt markets. While bond yields on the US dollar market have not increased for six months and curves have slightly flattened (by 20 bp on sovereign debt), bond yields on the euro market have increased and curves have steepened (by 10 bp). At its June meeting, the Fed again raised its key interest rate (+25 bp to the 1.00%-1.25% range) and announced that it no longer wants to systematically reinvest debt securities reaching maturity, which it had been purchasing under its quantitative easing program.
The ECB announced that it will not be lowering its key interest rate any further, and reduced its monthly securities purchases from €80 billion to €60 billion from April. In June, the ECB carried out its fourth and final targeted longer-term refinancing operation aimed at incentivizing bank lending (TLTRO II.4). Yields on the German Bund ended the first six months of the year at a one-year high (56 bp), while French OAT treasury bond yields fell in the second quarter.

Overview of the fiscal year 4 Refinancing
Natixis Update to the 2016 Registration Document 71
Against this backdrop, Natixis pursued the roll-out of its New Frontier strategic plan, which aims to turn
Natixis into a client-focused bank offering high added-value financial solutions.
In particular, Natixis bolstered its positions in its core businesses and continued to expand the
operations of its main business lines, which cater to both the BPCE networks and its own clientele.
The new structure of the Corporate & Investment Banking core business has proved a success
in its first 12 months. It has three aims: providing better support to clients through enhanced
strategic dialog; moving the implementation of its Originate-to-Distribute (O2D) model up a gear; and
stepping up the expansion of its businesses abroad.
The alignment of all the players on the financing chain has improved distribution through a resolute
focus in on the interests of all categories of investors. The Investment Banking business has
reinforced strategic dialog with clients by giving equal weight to project financing, and to debt and
equity products, and by developing combined advisory, financing and hedging solutions.
More generally, Natixis increased its capacity to offer clients fully-integrated and bespoke high added-
value solutions.
Corporate & Investment Banking activities were particularly robust in the first half of the year:
▪ Business outside France picked up across the three platforms, which continued to build up their
business franchises, expand their geographical footprint (particularly after opening an office in Taipei
in March 2017), and work together in the interests of their clients. The platforms’ contribution to
Corporate & Investment Banking revenues came to 57% in the first half of 2017 versus 52% a year
previously.
▪ The capital markets business was very dynamic, particularly in the fixed income and equity
derivatives markets, confirming the relevance of the business model based exclusively on client-
centered solutions.
In keeping with this strategy, in May 2017 Global Markets launched its plans to create a Global
Securities Financing team out of the merger of the Securities Financing Group (Fixed Income) and
the Equity Finance (Equity Derivatives) teams. Reporting to the Fixed Income and Equity Derivatives
business lines and pooling their expertise, the new global team will use its multi-asset global approach
to optimize Natixis’ collateral management. It will raise Natixis’ profile on these markets by crafting
multi-asset/multi-product solutions suited to clients’ individual requirements. The merged team’s multi-
platform offering will enhance the client penetration rate.
In Fixed Income, a cross-business European sales and financial engineering team was created in
early January. The aim was to make financial engineering a key component in the development of
innovative and bespoke solutions for clients. Business was also brisk in the securitization segment
across the three international platforms. In Europe, a new investment solution (Mérius) was set up in
the Dutch residential mortgage loan market. Growing interaction between the platforms has led to
some major deals, including the BSL (broadly syndicated loan) CLO in early 2017 for US asset
manager Voya. The CLO was distributed in the Americas, Europe and Asia, and its equity tranche,
placed with Taiwanese investors, was named Best Insurance Deal of the Year, APAC (source: SRP
Asia Pacific Awards 2017).
Natixis performed very well on the equity derivatives market and gained market share with its
enhanced, innovative range of individual and institutional investor solutions, based primarily on its
NXS Indices platform. This strong performance is also owed to intensified customer relations, the
growing industrialization of digital solutions (such as MOOCs and the E-MAPS pricing platform), and
the use of Alternative Risk Transfer strategies to give institutional clients and hedge funds access to
alternative asset class performance drivers. On the French market, Natixis was ranked No. 3 supplier
in structured products by a panel of 3,200 wealth management advisors. In Asia, the innovative
Zephyr Max Violet Note solution developed by the Equity Finance team was voted Deal of the Year,
APAC (source: SRP Asia Pacific Awards 2017).

Overview of the fiscal year 4 Refinancing
Natixis Update to the 2016 Registration Document 72
In Hong Kong, Natixis launched a fully-automated, end-to-end stock-option market-making service,
from quote request to clearing, that will contribute to developing client business, particularly in private
banking.
Global Market Research, covering equity, credit, macro-economic, SRI and market strategy
research, received a number of awards in the first six months of 2017, attesting to the quality of its
publications, the expertise of its teams and their commitment to supporting clients. The team
continued to develop interdisciplinary research aimed at providing clients with an increasingly wide
market perspective.
The expertise of the Cash Equity teams, together with the quality of equity research, was also
recognized in the Extel 2017 survey in which 20,000 European investors participated, ranking Natixis
No. 3 broker in France (vs. No. 5 in 2016), and No. 1 broker with French investors.
▪ In Global Finance, structured finance origination activities generated a strong increase in revenues
across all sectors.
In Real Estate Finance, several high-profile deals were arranged in both Europe and the US,
especially in the hotel and office acquisition/construction/renovation sectors. Driving these results
were strong syndication business (€1.12 billion) and high Pfandbriefbank volumes (€250 million in
Pfandbriefe issued in the first half of 2017, or €1.3 billion in issuances since its launch), and by Natixis’
first green bond on the US CMBS market.
Global Energy & Commodities assisted its commodity producing, transforming and trading clients in
all their financing transactions. Natixis pursued its digital initiatives aimed at improving customer
service, and worked with its client Trafigura and IBM to create the first commodity trading blockchain
to process crude oil transactions in the US. The initiative was named on of Global Finance magazine’s
“Innovators” for 2017. In the metals sector, Natixis also finalized its first transaction processed by
CargoDocs on behalf of its client Louis Dreyfus Company Metals.
Aviation finance continued to perform well thanks to innovative structures, particularly in Islamic
finance. Infrastructure finance maintained its focus on renewable energy projects.
Already in the first six months of 2017, the new structure of the portfolio management business (set
up at end-2016) delivered a more proactive approach to managing the Corporate & Investment
Banking’s loan book. This approach involved defining a portfolio strategy to accelerate balance-sheet
rotation; completing a program of secondary deals; devising securitization programs; and building
partnerships with institutional investors. Accordingly, the infrastructure platform signed a new co-
financing agreement with a European insurer for the infrastructure debt originated by Natixis. The
platform now has seven European and Asian partners with a multi-currency capacity of over €5 billion.
In Investment Banking, Acquisition & Strategic Finance delivered a strong performance in line with
2016 within a generally positive environment, both for acquisition financing and high-yield bond or
bank refinancing, and concluded landmark deals across the three international platforms.
The business draws on its primary market (origination, syndication and distribution) and secondary
market (trading) teams whose close interaction and cooperation deliver high added-value solutions for
their clients.

Overview of the fiscal year 4 Refinancing
Natixis Update to the 2016 Registration Document 73
Debt Capital Markets continued to expand in the primary bond market to confirm its leading position
in the euro market across issuer categories, with recognized expertise in segments including senior
non-preferred debt, covered bonds, green bonds and euro private placements (Euro PP). Natixis was
ranked primary bond market leader in all currencies by French corporate issuers in the first half of
2017 (source: Dealogic).
The Equity Capital Markets business confirmed their position on the French market by ranking No. 2
on the equity-linked market in the first half of 2017 by number of deals (source: Bloomberg).
Natixis pursued its growth in mergers and acquisitions (M&A) across the three international platforms,
strengthening its position with French corporates and private equity funds. With Natixis Partners, in the
first half of 2017 it was ranked No. 4 in France by number of deals (source: Mergermarket). In the US,
Natixis’ 51% stake in Peter J. Solomon Company (PJSC) acquired in mid-2016 allowed it to extend its
global M&A advisory franchise to the commodities and infrastructure sectors. In Europe, the branch in
Milan strengthened its M&A advisory offering by hiring top talent, and the Madrid subsidiary, Natixis
Partners España, was ranked No. 1 on the Iberian market by volume in March 2017 (source:
Transactional Track record). In Asia-Pacific, Natixis obtained a local license in Hong Kong allowing it
to provide M&A advisory services, and sealed its first Asian asset deal.
Global Transaction Banking’s sales activity featured major trade finance deals. Its experts were
actively involved in working groups with other major European banks to come up with innovative
solutions using new technologies.
Natixis is a member of the SWIFT Global Payments Innovation (GPI) initiative aimed at improving the
transparency and traceability of international payments. Natixis is also working with a number of
fintech companies: under the Digital Trade Chain project, named an “Innovator” for 2017 in Trade
Finance by Global Finance magazine, Natixis participated in building a blockchain platform to
streamline international trade for European SMEs and mid-caps. GTB’s participation in these
initiatives is fully in line with Groupe BPCE’s digital strategy.
Natixis’ rankings and awards in the first six months of 2017 attest to the quality and expertise
of its teams:
- No. 1 bookrunner on the primary bond market in all currencies by French corporate issuers
(source: Dealogic);
- No. 2 lead bookrunner on equity capital markets by number of equity-linked deals (source:
Bloomberg); - No. 3 CLO arranger in the US by number of deals (sources: Thomson Reuters / Bloomberg);
- No. 3 MLA/bookrunner on sponsored loans by value in the EMEA area (source: Thomson
Reuters).
- No. 4 lead bookrunner in France on equity capital markets excluding accelerated book building
(source: Bloomberg).
- No. 4 in M&A advisory services in France by number of deals concluded (source:
Mergermarket);
- No. 1 in equity research in France (source: Thomson Reuters Analyst Awards 2017);
- Best 2017 commodities and energy researcher (source: Energy Risk Awards 2017);
- No. 1 in SRI/ESG research in Europe (source: Extel 2017);
- No. 3 broker in France (source: Extel 2017);
- No. 3 structured products provider on the French market (source: 2017 Gestion de Fortune
awards);
- Named a 2017 “Innovator” in trade finance for the Digital Trade Chain developed with seven
other banks, and for the crude oil trade blockchain developed in the US with IBM and
Trafigura (source: Global Finance);
- Awarded the Grands Prix 2017 title by Magazine des Affaires in the M&A deal category for the
public takeover bid launched by Eurosic for Financière de Paris (advised by Natixis).

Overview of the fiscal year 4 Refinancing
Natixis Update to the 2016 Registration Document 74
Lastly, Natixis played a leading role across three international platforms in several major deals:
▪ Fixed income:
- Voya CLO 2017-1, BSL CLO for $513 million for the US asset manager Voya.
▪ Real estate finance:
- €250 million financing for Paris region-based data center group Data4;
- financing of Allianz and CBRE’s Piazza Duomo offices in Milan;
- acquisition of hotel properties by Foncière des Murs in Spain for €542 million;
- issuance of the very first green CMBS for the acquisition of 85 Broad Street, New York;
- optimization by Natixis and PJSC of Kenneth Cole’s outstanding loans and real estate
holdings.
▪ Commodity finance:
- pre-financing of oil products of the Sinochem Hongrun refinery in China;
- financing Gavilan Resources’ oil asset acquisition, held by the Blackstone fund, in the United
States;
- export pre-financing of cacao beans in Ghana for Cocoa Touton Processing Company;
- a structured finance borrowing-base facility of €2.1 billion for Freepoint Commodities in the
energy sector in the US. Natixis acted as co-lead arranger and co-bookrunner.
▪ Aviation, export and infrastructure finance:
- for Etihad Airways, financing of two A380 aircraft domiciled at Abu Dhabi Global Market
(ADGM), which offers sharia-compliant financing opportunities; - JOLCO for the acquisition of a 787 by Air France; - in the Emirate of Abu Dhabi, financing of the Sweihan Solar 1.177 MWp photovoltaic plant
(total project cost: $871.6 million);
- for Airtrunk, debt arrangement for the construction of massive data centers in Melbourne and
Sydney.
▪ Acquisition finance: - In the US, acquisition of Safway Group by Brand Energy & Infrastructure Services, a company
currently held by Clayton, Dubilier & Rice ($4 billion) as co-leader arranger and co-bookrunner; Natixis also acted as lead manager and bookrunner in the acquisition ($1 billion) of Truck Hero by CCMP Capital Advisors;
- in Spain, the acquisition of a 25% stake in Compania Logistica de Hidrocarburos (CLH) by CVC Capital Partners (Natixis acted as sole arranger and underwriter);
- in France, the acquisition of Cerba Healthcare by Partners Group and PSP (via bank loans and a senior-unsecured bond issuance).
▪ Primary bond market:
Debt Capital Markets managed several bond issuances across the thee international platforms,
particularly for the Arab Republic of Egypt for a total of $7 billion; Debt Capital Markets were active in a wide array of segments, including the green bond segment, and issued:

Overview of the fiscal year 4 Refinancing
Natixis Update to the 2016 Registration Document 75
- a green OAT for Agence France Trésor ($7 billion). The biggest issuance by size and duration ever to have taken place, expanding Natixis’ presence in the segment.
▪ Other segments:
- corporate for LVMH ($4.5 billion), - in Spain, senior non-preferred for Banco Santander ($1.5 billion),
▪ Equity capital markets: - record capital increase for Unicredit ($13 billion); - initial public offering of Balyo (€46 million) (which benefited from the Euronext Techshare
program sponsored by Natixis); - non-dilutive convertible bond issuance for Carrefour ($500 million); - public offer on Christian Dior.
▪ mergers and acquisitions:
- financing the acquisition of Compania Logistica de Hidrocarburos by CVC Capital Partners (Natixis Partners Spain advised CVC Capital Partners in the transaction);
- exclusive financial and strategic advisor to Eurazeo and its subsidiary Fintrax for the acquisition of interests in Cube Refund, a subsidiary of Korean conglomerate Lotte Group;
- financial adviser to Vivendi for the acquisition contract relative to the 60% stake in Havas held by the Bolloré Group.
Global Transaction Banking:
- for Alstom, issuance of a $145 million guarantee to cover the delivery of 28 new generation trains to Amtrack. The trains will link Boston and Washington DC.
As for Investment Solutions, the business highlight in the first half of the year for of Natixis Global Asset Management (NGAM) was the disposal of its 25% stake in the IDFC entities (India) at end-March.
At December 31, 2016, Cerulli Associates ranked NGAM 15th largest asset manager in the world (16
th
in the previous financial year).
NGAM was honored with several distinctions over the last six months. The main awards are detailed
below.
Ranked 16th on the IPE (Investment & Pensions Europe) 2017 Top 400 Asset Managers list; 11
th
out of the Top 120 asset management companies for institutional clients in Europe based on AuM; and 2
nd among the leading asset management companies in France based on AuM.
At the Thomson Reuters Lipper Fund Awards 2017 Netherlands, Europe, Taiwan, Switzerland, Singapore and US: the companies Natixis AM, H20 Asset Management, Gateway Investment Advisers and Loomis, Sayles & Company were recognized in several categories of funds.
At the Mieux Vivre Votre Argent 2017 certification awards, Natixis Asset Management was awarded the Five-Year Performance certification in the “Euro zone equity - small- and mid-cap” category for its fund Natixis Actions Small & Mid Cap Euro (part R), and the Five-Year Performance certification in the “North American Equity” category for its fund Natixis Actions US Growth (part R USD), awarded to Loomis, Sayles & Company, L.P; DNCA obtained the Performance certification in the General Equities Europe category for its fund DNCA Value Europe, and the Performance certification in the General Equities France category for its fund Gallica.
Natixis Asset Management, H2O Asset Management, Dorval Asset Management and DNCA were
recognized at the 2017 European Funds Trophy: NAM was named Best French Asset
Management Company in the “over 200 rated funds” category; H2O was named Best European
Asset Management Company in the “4 to 7 rated funds” category, Dorval was named Best
European Asset Management Company in the “8 to 15 rated funds” category, DNCA was named
Best Multi-Country Asset Management Company in the “16 to 25 rated funds” category.

Overview of the fiscal year 4 Refinancing
Natixis Update to the 2016 Registration Document 76
At the Grands Prix BFM Business de la Bourse awards, Dorval’s fund Dorval Manageurs received
the Best UCITS Performance France award in the five-year category, while H20 won Best UCITS
Performance World award for its fund H2O Multiequities.
Natixis Asset Management received the Actif d’Or de la Performance 2017 award from AGEFI in
the equity funds category for the Natixis Actions Euro PME fund.
At the 2017 Sommet Infrastructures, Aménagement du Territoire et Immobilier (SIATI) awards,
Mirova won the Gold Trophy in the Infrastructure Fund: Best Green Strategy category for the
Mirova-Eurofideme 3 fund.
In Insurance, the roll-out of the new life and personal protection insurance products to the
Caisse d’Epargne network continued throughout 2016 and boosted revenues throughout the period.
These revenues were drawn primarily from unit-linked policies, which accounted for 35% of inflows,
representing a significant year-on-year increase that outperformed the market. Specialized Financial Services continued to grow due to synergies with BPCE networks. They also maintained their strict control of operating expenses and use of scarce resources, while implementing a strategy based on operational efficiency and innovation. The merger at Natixis of all Payments activities for Groupe BPCE was carried out during the period in the interest of efficiency gains, enhanced competitiveness, and to benefit from new digital business models to address the European market. The development of the three core businesses went hand-in-hand with strict financial management:
liquidity needs remained contained over the first half of 2017 and posted a 1% decrease year-on-
year;
the consumption of Basel 3 RWA was stable year-on-year at €112.6 billion.
Lastly, at Natixis’ General Shareholders' Meeting on May 23, 2017, a resolution was made to pay an
ordinary dividend of €0.35 per share.

Overview of the fiscal year 4 Refinancing
Natixis Update to the 2016 Registration Document 77
4.1.3 Consolidated results
Natixis
6M-2017 6M-2016 Change 2017/2016
(in millions of euros) pro forma
(**)
Net revenues 4,756 4,274 +11.3%
+10.1%
o/w Businesses (*) 4,756 4,346 +9.4%
+8.3%
Expenses -3,365 -3,127 +7.6%
+6.8%
Gross operating income 1,391 1,147 +21.3%
+19.3%
Provision for credit losses -138 -176 -21.9% Net operating income 1,254 971 +29.1% Associates 13 14 -6.9% Gains or losses on other assets 27 60 -54.6% Change in value of goodwill -0 -75 -100.0% Pre-tax profit 1,294 970 +33.4% Taxes -469 -383 +22.5% Minority interests -57 -6
Net income (Group share) 768 581 +32.2%
Cost/income ratio 70.7% 73.2% Equity (Average) 16,503 16,332 ROE 8.7% 6.7% ROTE 10.8% 8.4%
(*) Core businesses and financial investments
(**) At constant exchange rates
Analysis of changes in the main items comprising the consolidated income statement NET REVENUES Natixis’ net revenues stood at €4,756 million at June 30, 2017, up 10.1% from June 30, 2016 at constant exchange rates.
At €4,756 million, net revenues generated by the business lines (1)
were up 8.3% at constant exchange rates versus the first half of 2016. All of the core businesses posted increased revenues overall: an increase of 15% at constant exchange rates for Corporate & Investment Banking; 8% for Investment Solutions; and 1% for the SFS division. Financial Investments’ net revenues were down 9%. The Corporate Center’s net revenues stood at €1 million in the first half of 2017 (including -€60 million for the return of foreign-currency DSNs to the historic exchange rate).
(1) Core businesses and financial investments.

Overview of the fiscal year 4 Refinancing
Natixis Update to the 2016 Registration Document 78
OPERATING EXPENSES AND HEADCOUNT Recurring expenses totaled €3,365 million, up 6.8% at constant exchange rates compared to the first half of 2016. At constant exchange rates, costs increased 8% for Corporate & Investment Banking, 7% for Investment Solutions and 3% for SFS. Financial Investments expenses were down by 5%. Corporate Center expenses were up €261 million in the first half of 2017 versus €204 million in the first half of 2016 after including in the scope the short-term treasury business from January 1, 2017 (€33 million), investments linked to the Transformation and Business Efficiency plan (€20 million) and the increase in the single resolution fund contribution (€9 million).
Headcount at the end of the period stood at 20,394 FTE, down 1% year-on-year. The higher headcount in the core businesses (2%) was offset by a lower headcount in Financial Investments (-13%), with the headcount of the Support Departments up 4%. GROSS OPERATING INCOME Gross operating income stood at €1,391 million at June 30, 2017, up 19.3% at constant exchange rates versus June 30, 2016. PRE-TAX PROFIT The provision for credit losses was €138 million at June 30, 2016, down 21.9% compared to the first half of 2016. The provision for credit losses of core businesses as a percentage of assets amounted to 28 basis points at June 30, 2017 versus 41 basis points at June 30, 2016.
Gains or losses on other assets reached €27 million in the first half of 2017, €21.5 million of which following the disposal of the Ellisphère subsidiary (Financial Investments). As a reminder, in the first half this item included gains related to the sale of CGM and Snyder entities to Asset Management and Altus within Financial Investments, as well as gains related to the sale of an apartment block to CEGC within the SFS division (€31 million).
Change in the value of goodwill was nil in the first half of 2017. In the first half of 2016, this line comprised a goodwill impairment loss of €75 million on Coface.
Accordingly, pre-tax profit amounted to €1,294 million at June 30, 2017 versus €970 million at June 30, 2016. RECURRING NET INCOME (GROUP SHARE) The recurring tax expense came to €469 million at June 30, 2017. The effective tax rate was 36.7% at June 30, 2017.
After incorporating -€57 million in non-controlling interests, recurring net income (group share) amounted to €768 million, up 32% compared to the first half of 2016. Consolidated management ROE after tax was 10.6% at June 30, 2016 (excluding the IFRIC 21 impact and non-recurring items), giving an accounting ROE of 8.7%.

Overview of the fiscal year 4 Refinancing
Natixis Update to the 2016 Registration Document 79
4.1.4 Analysis by Natixis business line
4.1.4.1 Investment Solutions
Investment Solutions
6M-2017 6M-2016 Change 2017/2016
(in millions of euros) pro forma
(*)
Net revenues 1,811 1,656 +9.3%
+7.7%
Asset Management 1,363 1,249 +9.2%
+7.0%
Private Banking 64 67 -5.5%
-5.5%
Private Equity funds 20 18 +10.9%
+10.9%
Insurance 364 322 +12.9%
12.9%
Expenses -1,266 -1,169 +8.3%
+6.7%
Gross operating income 545 487 +11.8%
+10.1%
Asset Management 398 339 +17.3%
+6.9%
Private Banking -4 -2 +79.7%
79.7%
Private Equity funds 16 14 +17.0%
17.0%
Insurance 135 136 -1.3%
-1.3%
Provision for credit losses 0 0 Pre-tax profit 561 509 +10.1%
Cost/income ratio 69.9% 70.6% Equity (Average) 4,625 4,366 ROE 13.5% 13.9%
(**) At constant USD exchange rates
Investment Solutions posted a 9.3% increase in revenues year-on-year to €1,810.7 million (+ 7.7%
at constant exchange rates) with strong growth in the Asset Management business in particular.
Expenses were up 8.3% (+ 6.7% at constant exchange rates) versus the first half of 2016 due to the
development of the business. In the Insurance segment, 2017 expenses take into account an
exceptional C3S tax contribution recorded in the first quarter for accepting 10% of CNP’s life insurance
product inventory for €19 million. In addition, IT expenses were negatively affected by increased
depreciation charged against IT assets compared to the first half of 2016.
Gross operating income was up 11.8% (10.1% at constant exchange rates) to €545 million.
Provision for credit losses was in positive territory at €0.5 million attributable to Private Banking.
Pre-tax profit totaled €560.8 million, up 10.1% at current exchange rates.
ROE was 13.5%, down a slight 0.4 point from the first half of 2016.
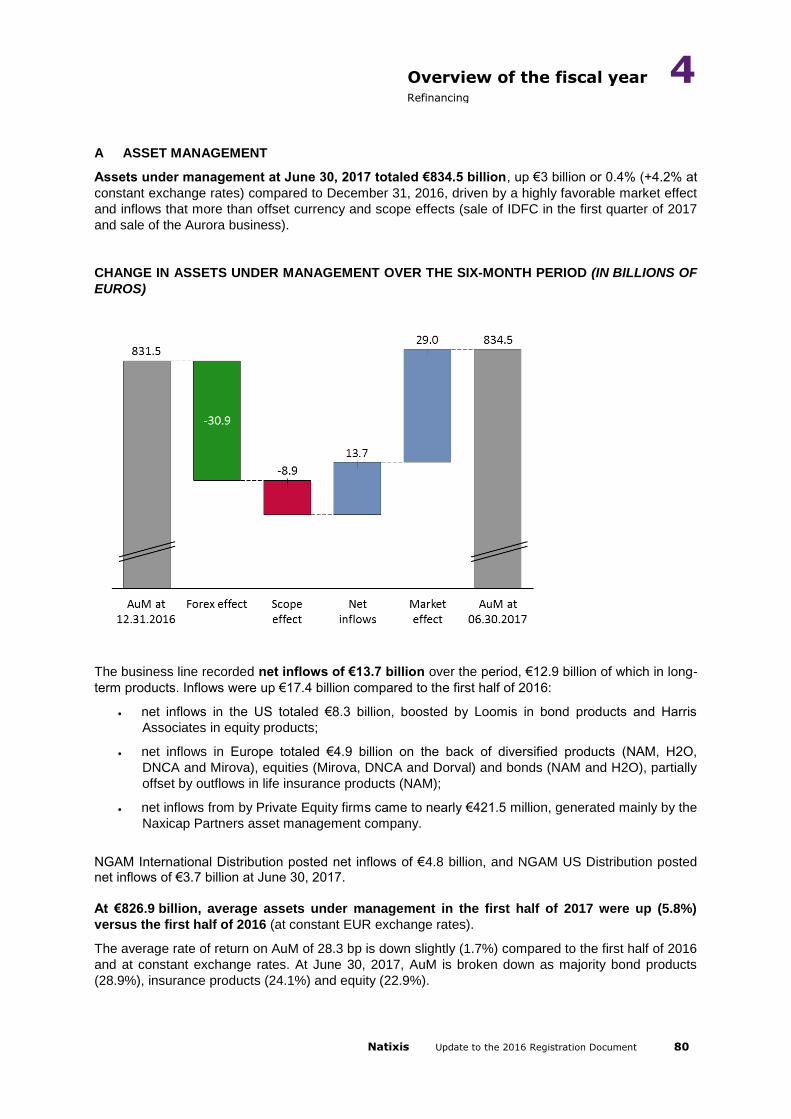
Overview of the fiscal year 4 Refinancing
Natixis Update to the 2016 Registration Document 80
A ASSET MANAGEMENT
Assets under management at June 30, 2017 totaled €834.5 billion, up €3 billion or 0.4% (+4.2% at
constant exchange rates) compared to December 31, 2016, driven by a highly favorable market effect
and inflows that more than offset currency and scope effects (sale of IDFC in the first quarter of 2017
and sale of the Aurora business).
CHANGE IN ASSETS UNDER MANAGEMENT OVER THE SIX-MONTH PERIOD (IN BILLIONS OF
EUROS)
The business line recorded net inflows of €13.7 billion over the period, €12.9 billion of which in long-
term products. Inflows were up €17.4 billion compared to the first half of 2016:
net inflows in the US totaled €8.3 billion, boosted by Loomis in bond products and Harris
Associates in equity products;
net inflows in Europe totaled €4.9 billion on the back of diversified products (NAM, H2O,
DNCA and Mirova), equities (Mirova, DNCA and Dorval) and bonds (NAM and H2O), partially
offset by outflows in life insurance products (NAM);
net inflows from by Private Equity firms came to nearly €421.5 million, generated mainly by the
Naxicap Partners asset management company.
NGAM International Distribution posted net inflows of €4.8 billion, and NGAM US Distribution posted net inflows of €3.7 billion at June 30, 2017.
At €826.9 billion, average assets under management in the first half of 2017 were up (5.8%)
versus the first half of 2016 (at constant EUR exchange rates).
The average rate of return on AuM of 28.3 bp is down slightly (1.7%) compared to the first half of 2016
and at constant exchange rates. At June 30, 2017, AuM is broken down as majority bond products
(28.9%), insurance products (24.1%) and equity (22.9%).

Overview of the fiscal year 4 Refinancing
Natixis Update to the 2016 Registration Document 81
At June 30, 2017, net revenues stood at €1,363 million, up 9.2% compared to the first half of
2016 (i.e. +7.0% at constant exchange rates), due to the increase in fees on AuM for all NGAM asset
management companies, linked primarily to the increase in average AuM over the period, the rise in
outperformance fees of European asset management companies, and the increase in financial
products.
Expenses totaled €965.0 million, up 6.1% compared to the first half of 2016 (+4.1% at constant
exchange rates) due to higher variable fee expenses at the European and US asset management
companies in line with results and, to a lesser extent, due to an increase in IT fees for US asset
management companies and distribution companies.
B INSURANCE
All insurance branches posted strong sales momentum in the first half of 2017.
With €5.6 billion in premiums, Life Insurance inflows gained 82% compared to the first half of 2016
following the roll-out of the new service offering to the Caisse d’Epargne network (+€2.7 billion
compared to the first half of 2016 when the roll-out was limited to seven establishments). Unit-linked
policy premiums were up 218% to €1,969 million, making up 35% of total gross inflows. This was
thanks to sales drives that boosted unit-linked policy inflows from the two networks. “Euro” fund
inflows increased by 47% to €3.6 billion.
Growth posted in Provident and Payment Protection insurance premiums (€422 million, up 10.5 %
on the first half of 2016) was fueled by both businesses. Growth in the ADE business (+10%) was
mainly driven by the growth in the Caisse d’Epargne network (+19%), which was markedly higher than
that of the Banque Populaire network (+4%). Premiums on personal protection insurance were up by
€10 million (+12%), propelled primarily by the Caisse d'Epargne network (+88%) which made up 18%
of the personal protection insurance business (11% in the first half of 2016) after the roll-out of the
offering. Small gains (+2%) were made in the personal protection insurance business in the
Banque Populaire network.
The Property and Casualty insurance business continued to gain market share on mature and
highly competitive markets: the 728,610 new policy subscriptions represented a 12% increase
compared to the first half of 2016 which already saw a 5% increase. Earned premiums on Property
and Casualty Insurance across the BP and CE networks were up 8.6% to €683 million, driven by
growth on Multi-Risk Home and Automotive Guarantees.
In a perpetually low interest rate environment, net revenues of the Insurance business gained 13%
to €364 million. The contributing factors were:
- strong net revenue growth in Life Insurance (€129 million in the first half of 2017, up 5%), fueled
by the roll-out of the business to the Caisse d’Epargne network and the surge in assets (+14% for
direct business, +11% including the €11.5 billion for acceptance of CNP inventory). Moreover, the
revenues generated from the “Equity” portfolios and the company diversification in interest rate
assets partially offset the dilution observed in yields on “vanilla” debt instruments.
- net revenues of the Personal Protection and Payment Protection insurance business increased
(€94 million in the first half of 2017, up +19%) on the back of significant growth in premiums
without a major deviation in claims;
- the increase in Property & Casualty Insurance net revenues (€144 million in the first half of 2017,
up +15%), explained by the increase in premiums in line with the portfolio’s development, a good
current year loss ratio and improved financial results. The overall combined ratio stood at 89.9%,
stable compared to the first half of 2016 (89.8%).
Operating expenses were up 23.3% to €229.6 million. The factors underlying this increase were an
exceptional C3S tax of €19 million (for the acceptance of 10% of CNP’s life insurance inventory),
fewer IT projects put on hold and increased depreciations, all of which weighed on the business line’s
expenses in 2017.

Overview of the fiscal year 4 Refinancing
Natixis Update to the 2016 Registration Document 82
C PRIVATE BANKING
At June 30, 2017, Private Banking posted net inflows of €0.7 billion, driven essentially by the
strong performance in international wealth management and the B2B private management services
provided by the networks.
Assets under management came to €30.8 billion, up 6% for the first half of the year and 8% for the
year.
In the first six months of the year, the business’s net revenues were down 6% (-€3.7 million) to
€63.7 million compared to the first six months of 2016 due to non-recurring items resulting from the
adjustment of the Group’s distribution mechanism. Restated for these effects, net revenues would be
up by €7.2 million (+11%) thanks to the strong performance of fees and commissions on structured
products, for outperformance and on transactions.
4.1.4.2 Corporate & Investment Banking
Corporate & Investment Banking
6M-2017 6M-2016 Change 2017/2016
(in millions of euros) pro forma
(*)
Net revenues 1,945 1,668 +16.6% +15.3%
Global Markets 1,090 914 +19.2% +18.4%
Fixed Income 687 610 +12.6% +12.5%
Equity 380 278 +37.1% +37.5%
XVA desks 22 26 -14.1% -14.1%
Global Finance & Investment Banking 872 768 +13.5% +11.9%
Other -17 -47 +23.0% +23.2%
Expenses (*) -1,082 -994 +8.8% +8.1%
Gross operating income 864 675 +28.0% +25.9%
Provision for credit losses -78 -124 -37.2% Pre-tax profit 791 558 +41.7%
Cost/income ratio 55.6% 59.6% Equity (Average) 6,658 6,854 ROE 17.2% 11.0%
(*) At constant exchange rates
In the first half of 2017, Corporate & Investment Banking's net revenues totaled €1,945 million, up 15.3% from the first half of 2016 at constant exchange rates. Capital market revenues totaled €1,090 million at June 30, 2017, up 18.4% compared to the first half of 2016, and up 25.2% like-for-like (excluding treasury activities).

Overview of the fiscal year 4 Refinancing
Natixis Update to the 2016 Registration Document 83
Revenues from Fixed Income, Forex, Credit, Commodities and Cash Management activities were €687 million in the first half of 2017, up 12.5% from the first half of 2016. The following changes were observed in each segment:
revenues from the Fixed Income and Forex activities were up 28%, fueled first and foremost by
the 56% rise in fixed income activities on the back of vibrant business activity, particularly in Asia;
Forex activities were down by 28%: low currency volatility in the first half of 2017, compared to the
Brexit uncertainty-fueled volatility of the same period last year, reduced flow volumes;
revenues from Credit activities were up 6% compared to the first half of 2016. The business
recorded continued growth in securitization activities, particularly in the US, as the roll-out of these
activities in Asia continued.
Revenues from Repo activities were up 57% compared to the first half of 2016, powered by strong
business in both France and the US, and taking into account increased revenues from the solutions
offering;
Revenues from joint-venture activities (the results of which are shared between Global Markets and Investment Banking to ensure alignment of teams) were up. Acquisition & Strategic Finance revenues gained 82% thanks to auspicious market conditions in the leverage and sponsor finance sectors that helped generate high transaction volumes during the period. Revenues from syndication on the bond market gained 3% compared to 2016, including a 15% increase in revenues generated on the primary bond issue market. This was partially offset by a slowdown in the market-making activity with respect to sovereign debt on the secondary market, due to the uncertainty surrounding the French election results. At €380 million, Equities revenues grew by 37.5% year-on-year, buoyed by Equity Derivatives: the Solutions activities revenues surged 83% year-on-year after rounding out and rolling out its offering abroad, and Equity Finance’s revenues grew 25%. At €872 million, the accumulated revenues from the Global Finance and Investment Banking activities increased 11.9% compared to the first half of 2016 and at constant exchange rates. Structured Finance revenues increased by 2.9% compared to 2016. In origination, new business increased by 3.2% compared to 2016 and was particularly dynamic in real estate finance in the US. Origination revenues gained 20% compared to the first half of 2016, as significant fees and commissions were recorded for the period in the Aviation segment in particular after finalizing, in 2017, the syndication of several transactions originated in 2016. Financing portfolio revenues were down 4% year-on-year at constant exchange rates, the progressive renewal of inventory still affecting average portfolio margins. Commodities Trade Finance remained strong in the first half of 2016. Revenues went up by 14%, boosted by an increase in drawn outstandings given a more favorable oil price per barrel than a year previously. Revenues from Investment Banking including M&A activities were up 61.8% at constant exchange rates compared to 2016. The business also benefited from: strong growth in Acquisition & Strategic Finance, of which 50% of revenues are recognized under Investment Banking; dynamic trade on the equity capital markets in the first half of 2017 when European banks carried out several capital increases; robust M&A activity in France, driven by Natixis Partners. At June 30, 2017, Corporate & Investment Banking’s expenses totaled €1,082 million, up 8.1% compared to 2016 at constant exchange rates.

Overview of the fiscal year 4 Refinancing
Natixis Update to the 2016 Registration Document 84
Gross operating income totaled €864 million, up 25.9% compared to 2016. The cost/income ratio
was 55.6% in 2017, up 4 points compared to 2016 (59.9%).
At €78 million, the provision for credit losses fell 37.2% compared to the first half of 2016 which saw higher levels of provisioning on oil sector exposures due to the sharp decline in the price per barrel that lasted until early 2016. ROE after tax totaled 17.2% in the first half of 2017, up 6.2 points compared to 2016 (11%), recording a decrease in reduced risk-weighted assets (RWA) together with improved results. 4.1.4.3 Specialized Financial Services
Specialized Financial Services
6M-2017 6M-2016 Change
(in millions of euros) pro forma
(*)
Net revenues 691 684 +1.0% 1.0%
Specialized financing 436 425 +2.6% +2.6%
Factoring 79 77 +2.9% +2.9%
Sureties & Financial Guarantees 100 98 +2.1% +2.1%
Leasing 114 109 +4.1% +4.1%
Consumer Financing 132 131 +0.8% +0.8%
Film Industry Financing 12 11 +12.2% +12.2%
Financial Services 254 258 -1.60% -1.60%
Employee savings plans 43 47 -2.0% -2.0%
Payments 165 164 +0.4% +0.4%
Securities 46 47 -2.0% -2.0%
Expenses -459 -446 +2.9% +2.9%
Gross operating income 232 238 -2.5% -2.5%
Provision for credit losses -35 -29 +20.5% Pre-tax profit 197 240 -18.0%
o/w Specialized Financing 171 204 -16.3% -16.3%
o/w Financial Services 39 43 -10.7% -10.7%
Cost/income ratio 66.4% 65.2% Equity (Average) 1,849 1,628 ROE 14.5% 19.3%
Specialized Financing sales activity remained solid, with earnings up considerably from the first half of 2016. This trend is linked primarily to business with the BPCE networks, and to a lesser extent to business with its own customers.

Overview of the fiscal year 4 Refinancing
Natixis Update to the 2016 Registration Document 85
As for Factoring, revenues were up 31% compared to the first half of 2016, driven by an increase in
Natixis’ business customers and in the Caisse d’Épargne network.
Sureties and guarantees sustained its strong performance, with issued premiums up 56% from the already record levels of mid-2016. The volume of guaranteed loans to retail customers remained solid owing to positive network momentum in real estate loans in a perpetually low interest rate environment that is conducive to high levels of refinancing.
Consumer Finance pursued the development of its revolving credit activities across the Banque Populaires banks and Caisses d’Épargne. At June 30, 2017, its outstandings were stable over the period at over €1.8 billion. Average outstanding personal loans, administered by the business line but recognized in the network ledgers, totaled €19.3 billion at June 30, 2017, up 12% year-on-year.
New loans from Equipment Leasing delivered excellent results, increasing 9% year-on-year to take outstandings at the end of the period up 4% to €12 billion. Against this backdrop, net revenues from Specialized Financing activities came to €436 million, a 3% increase on the first half of 2016. Financial Services posted growth despite a context of reduced margins. In the first half of 2017, the Payments business lines for Groupe BPCE were merged at Natixis and new digital business models were introduced. The Payments business delivered strong results, particularly in electronic banking which had a 10% increase in clearing transactions and a 4% increase in the number of cards. Services vouchers continued to grow: Chèque de Table® meal vouchers achieved market share of 17.7%, up 1.4% from mid-2016. The commercial development of the employee savings in the networks continued unabated in the first half of 2017. Assets under custody in collective pension plans (PERCO) rose 17% compared to June 30, 2016.
The Securities business line recorded a strong performance, the number of transactions gaining 8% compared to the first half of 2016. In total, net revenues from Financial Services amounted to €254 million for the half-year period, a decline of 2% from the first half of 2016.

Overview of the fiscal year 4 Refinancing
Natixis Update to the 2016 Registration Document 86
BREAKDOWN OF H1 2017 SFS NET REVENUES BY BUSINESS
The SFS division's revenues stood at €691 million, a rise of 1% from the first half of 2016. At 66.4%, the cost/income ratio lost 1.2 points compared to the first half of 2016, and gross operating income slid 2.5% to €232 million.
4.1.4.4 Financial Investments
Financial Investments
6M-2017 6M-2016 Change
(in millions of euros) pro forma
Net revenues 309 338 -8.5%
Coface 277 289 -4.1%
Corporate Data Solutions 10 24 -57.6%
NPE –3 –3 –2.3%
Natixis Algérie 25 28 -11.1%
Expenses -298 -315 -5.5%
Gross operating income 11 23 -50.9%
Provision for credit losses -10 -24 -58.7%
Pre-tax profit 24 -65
Cost/income ratio 96.4% 93.2%

Overview of the fiscal year 4 Refinancing
Natixis Update to the 2016 Registration Document 87
A COFACE
Revenues for the first half of 2017 stood at €691.7 million, down 3.5% (-0.5% at constant scope and
exchange rate, the scope impact linked to the sale of state guarantees) compared to the first half of
2016: credit insurance, which accounts for 95% of revenue, was down 3.8%, while factoring was up
3.4%.
The loss ratio net of reinsurance totaled 58.3% in the first half of 2017 versus 60.8% in 2016, which
was an improvement of 2.5 points.
Net revenues in the first half of 2017 totaled €277.4 million, down 4.1% (+4.5% at constant scope and
exchange rate) compared to the first half of 2016.
Operating expenses were under control and shed 2.9% to €264.6 million (+1.6% at constant scope
and exchange rates).
B CORPORATE DATA SOLUTIONS
By the end of the first half of 2017, the last two entities of CDS were sold/merged:
Ellisphère was sold on April 13, 2017;
HCP underwent a total transfer of assets and liabilities with Natixis SA on June 27, 2017.
Net revenues in 2017 totaled €10.2 million, down 57.6% compared to the first half of 2016, due to
significant changes in scope (sale of Ellisphère in early April and of Altus and HCP North America at
the end of the first quarter of 2016).
C NATIXIS PRIVATE EQUITY (NPE)
In the first half of 2017, Natixis Private Equity pursued its disengagement strategy and effectively ran
off its direct portfolio.
Compared to the first half of 2016, cash-at-risk commitments fell 10% to total €89 million at
June 30, 2017. At €50 million, off-balance sheet commitments were down 9% compared to the first
half of 2016.
Net revenues increased very slightly compared to the first half of 2016 (+€0.1 million) to stand at -
€3.4 million.
RWA totaled €370 million at June 30, 2017, down 16% compared to the first half of 2016 owing to the
runoff of commitments, particularly in the direct portfolio, and the partial redemption of the Orchidée
vendor loan.
D NATIXIS ALGÉRIE
New loan activity was limited given the low-growth environment and scarce (and costlier) liquidity. At
constant exchange rates, short-term outstanding loans in the first half of 2017 fell 3%, medium- and
long-term outstanding loans 7%, and leasing loans outstanding 24% compared to the first half of 2016.
During the same period, and despite the increasing scarcity of liquidity, customer deposits increased
by 3%.
Off-balance sheet commitments increased by 1%, especially in sureties and guarantees which offset
the decline in documentary credits in a somewhat unfavorable context (import licenses).
In the first half of 2017, Natixis Algérie posted a 11% decrease in net revenues to €24.9 million
compared to the first half of 2016. Excluding the exchange rate effect, net revenues were down 13%.

Overview of the fiscal year 4 Refinancing
Natixis Update to the 2016 Registration Document 88
4.1.4.5 Corporate Center
Corporate Center
6M-2017 6M-2016 Change
(in millions of euros) pro forma
Net revenues 1 -72
(*) o/w for short-term treasury: 71 0
o/w Issuer Spread 0 -26
o/w Exchange rate fluctuations of DSNs issued in foreign currency -60 -7
Expenses -261 -204 +28.2%
Gross operating income -260 -276 -5.6%
Provision for credit losses -15 2 Pre-tax profit -275 -272 +1.1%
Corporate Center net revenues totaled +€1 million versus -€72 million in the first half of 2016.
Since January 1, 2017, when the treasury business was transferred to Natixis’ Finance Department,
the Corporate Center recognizes the net revenues of the short-term treasury business: +€71 million for
the first half of 2017. Excluding issuer spread and exchange rate fluctuations of DSNs issued in dollars
and short-term treasury, net revenues were -€10 million at June 30, 2017, versus -€39 million at
June 30, 2016.
Corporate Center expenses consisted of expenses that were not re-invoiced to the Natixis business
lines.
The Single Resolution Fund contribution is covered by the Corporate Center and totaled €122.5 million
in the first half of 2017 versus €113.9 million in the first half of 2016. From 2017, the Corporate Center
business lines recognizes the short-term treasury business’s operating expenses, which
was -€33 million in the first half of 2017. Excluding these two items, the expenses of the Corporate
Center business lines totaled -€106 million at June 30, 2017, versus -€90 million at June 30, 2016.

Overview of the fiscal year 4 Refinancing
Natixis Update to the 2016 Registration Document 89
4.1.4.6 Provision for credit losses
The provision for credit losses was -€138 million at June 30, 2017, of which -€141 million was in respect of individual risk and +€3 million in collective provisions. At June 30, 2017, the provision for credit losses (excluding GAPC) totaled -€176 million. OVERALL PROVISION FOR CREDIT LOSSES BY BUSINESS
(in millions of euros) 06.30.2017 06.30.2016
Corporate and Investment Banking -78 -124
Investment Solutions +0 +0
Specialized Financial Services -35 -29
Financial Investments -10 -24
Other -15 +1
OVERALL PROVISION FOR CREDIT LOSSES -138 -176
OVERALL PROVISION FOR CREDIT LOSSES BY GEOGRAPHIC AREA
(in millions of euros) 06.30.2017 06.30.2016
Africa and the Middle East -8 -48
Central and Latin America -14 +46
North America -9 -65
Asia and Oceania -7 -5
Eastern Europe +0 +6
Western Europe -100 -110
OVERALL PROVISION FOR CREDIT LOSSES -138 -176
4.1.4.7 Related parties Financial information concerning transactions between related parties is provided in Note 8.3 to the interim consolidated financial statements presented in section 5.1 of the present updated version of the 2014 Registration Document.

Overview of the fiscal year 4 Refinancing
Natixis Update to the 2016 Registration Document 90
Appendix to 4.1.3 – Consolidated Results
1 - Management results reclassified as consolidated results in the first half of 2017
Natixis (June 2017)
6M-2017 Exceptional items 6M-2017
(in millions of euros)
management excl. non-
recurring items CIB
Investments
Solutions SFS Financial
Investments
Corporate
Center published
Net revenues 4,816 0 0 0 0 -60 4,756
Expenses -3,327 0 -22 -0 0 -16 -3,365
Gross operating income 1,490 0 -22 -0 0 -76 1,391
Provision for credit losses -138
-138
Net operating income 1,352 0 -22 -0 0 -76 1,254
Associates 13
13
Gains or losses on other assets 27
27
Change in value of goodwill -0
-0
Pre-tax profit 1,392 0 -22 -0 0 -76 1,294
Taxes -501 0 7 0 0 25 -469
Minority interests -57
-57
Net income (Group share) 834 0 -15 -0 0 -51 768
Cost/income ratio 69.1% 70.7%
2 - Management results reclassified as consolidated results in the first half of 2016
Natixis (June 2016)
6M-2016 Exceptional items 6M-2016
(in millions of euros)
management excl. non-
recurring items CIB
Investments
Solutions SFS Financial
Investments Corpora
te Center published
Net revenues 4,307 0 0 0 0 -33 4,274
Expenses -3,127 0 0 0 0 0 -3,127
Gross operating income 1,180 0 0 0 0 -33 1,147
Provision for credit losses -176
-176
Net operating income 1,004 0 0 0 0 -33 971
Associates 14
14
Gains or losses on other assets 60
60
Change in value of goodwill 0
-75 0 -75
Pre-tax profit 1,078 0 0 0 -75 -33 970
Taxes -395 0 0 0 0 11 -383
Minority interests -50
44 0 -6
Net income (Group share) 633 0 0 0 -31 -22 581
Cost/income ratio 72.6%
73.2%

Financial Data 5 Interim consolidated financial statements and notes
Natixis Update to the 2016 Registration Document 91
V SECTION 5: FINANCIAL DATA 5.1 Financial data (interim consolidated financial statements and notes)
CONSOLIDATED BALANCE SHEET CONSOLIDATED INCOME STATEMENT STATEMENT OF NET INCOME (LOSS) AND OTHER COMPREHENSIVE INCOME STATEMENT OF CHANGES IN SHAREHOLDERS’ EQUITY (from June 30, 2016 to June 30, 2017) NET CASH FLOW STATEMENT NOTES TO THE CONSOLIDATED FINANCIAL STATEMENTS NOTE 1 ACCOUNTING PRINCIPLES NOTE 2 CONSOLIDATION SCOPE NOTE 3 NOTES TO THE BALANCE SHEET NOTE 4 NOTES TO THE INCOME STATEMENT NOTE 5 NOTES TO THE STATEMENT OF CHANGES IN GAINS AND LOSSES
RECORDED DIRECTLY IN OTHER COMPREHENSIVE INCOME NOTE 6 SEGMENT REPORTING NOTE 7 RISK MANAGEMENT NOTE 8 OTHER INFORMATION NOTE 9 POST-CLOSING EVENTS

Financial Data 5 Interim consolidated financial statements and notes
Natixis Update to the 2016 Registration Document 92
CONSOLIDATED BALANCE SHEET - ASSETS
Cash, central banks 41,886 26,704
Financial assets at fair value through profit or loss 3.1 186,226 187,628
Hedging derivatives 1,242 1,220
Available-for-sale financial assets 3.2 55,449 54,990
Loans and receivables due from banks 3.5 39,665 58,783
o/w institutional operations
Customer loans and receivables 3.5 127,897 140,303
o/w institutional operations 899 758
Revaluation adjustments on portfolios hedged against interest rate risk
Held-to-maturity financial assets 3.6 1,941 2,066
Current tax assets 438 436
Deferred tax assets 1,865 1,908
Accrual accounts and other assets 46,618 46,109
Non-current assets held for sale 733 947
Deferred profit-sharing
Investments in associates 625 666
Investment property 847 1,084
Property, plant and equipment 704 672
Intangible assets 728 744
Goodwill 3.7 3,504 3,600
Total assets 510,368 527,859
In millions of euros Notes 06.30.2017 12.31.2016
CONSOLIDATED BALANCE SHEET - LIABILITIES AND SHAREHOLDERS’ EQUITY
Due to central banks
Financial liabilities at fair value through profit and loss 3.1 138,477 146,226
Hedging derivatives 1,787 2,011
Due to banks 3.5 109,013 101,374
o/w institutional operations 46 46
Customer deposits 3.5 80,670 86,472
o/w institutional operations 970 844
Debt securities 3.8 38,101 48,921
Revaluation adjustments on portfolios hedged against interest rate risk 165 193
Current tax liabilities 555 554
Deferred tax liabilities 725 685
Accrual accounts and other liabilities 40,566 44,464
o/w institutional operations 3 0
Liabilities on assets held for sale 694 813
Insurance companies' technical reserves 73,198 68,810
Provisions 3.9 1,913 1,994
Subordinated debt 3.10 3,714 4,209
Shareholders' equity (Group share) 19,520 19,836
- Share capital and reserves 10,976 10,895
- Consolidated reserves 6,972 6,417
- Gains and losses recognized directly in equity 1,004 1,323
- Non-recyclable gains and losses recorded directly in equity (200) (174)
- Net income/(loss) 768 1,374
Non-controlling interests 1,270 1,296
Total liabilities and shareholders’ equity 510,368 527,859
In millions of euros Notes 06.30.2017 12.31.2016

Financial Data 5 Interim consolidated financial statements and notes
Natixis Update to the 2016 Registration Document 93
CONSOLIDATED INCOME STATEMENT
In millions of euros Notes 06.30.201706.30.2016
Restated (*)
Interest and similar income 4.1 3,031 2,484
Interest and similar expenses 4.1 (1,663) (1,234)
Fee and commission income 4.2 2,813 2,522
Fee and commission expenses 4.2 (1,094) (1,029)
Net gains or losses on financial instruments at fair value through profit or loss 4.3 1,779 904
Net gains or losses on available-for-sale financial assets 4.4 313 130
Income from other activities 4.5 6,193 16,294
Expenses from other activities 4.5 (6,616) (15,756)
Net revenues 4,756 4,316
Operating expenses 4.6 (3,245) (3,014)
Depreciation, amortization and impairment on (120) (113)
property, plant and equipment and intangible assets
Gross operating income 1,391 1,189
Provision for credit losses 4.7 (138) (176)
Net operating income 1,254 1,013
Share in income of associates 13 14
Gains or losses on other assets 27 60
Change in value of goodwill 1.3 (75)
Pre-tax profit 1,294 1,012
Income tax 4.8 (469) (398)
Net income/(loss) from discontinued operations
Net income/(loss) for the period 825 615
o/w - Group share 768 608
- Non-controlling interest share 57 6
Earnings/(loss) per share (in euros)
0.23 0.18
Diluted earnings/(loss) per share (in euros)
0.23 0.18
Net income/(loss) attributable to shareholders (see Note 8.1.2) – Group share – per share, calculated
on the basis of the average number of shares over the period, excluding treasury shares
Net income/(loss) attributable to shareholders (see Note 8.1.2) – Group share – per share, calculated
on the basis of the average number of shares over the period, excluding treasury shares and including
shares that could be issued on the exercise of stock options and bonus shares
(*) Data restated for the impact of the early application of the provisions of IFRS 9 “Financial instruments” on financial liabilities at fair value through profit or loss as from January 1, 2016. This impact was as follows: +€42 million (including €12 million relating to balances on early repayments) on the line Net gains or losses on financial instruments at fair value through profit or loss (compared with +€862 million reported at June 30, 2016), -€14.5 million on Income tax (versus -€383 million reported at June 30, 2016), +€0.01 on earnings per share and diluted earnings per share (vs €0.17 reported at June 30, 2016).

Financial Data 5 Interim consolidated financial statements and notes
Natixis Update to the 2016 Registration Document 94
STATEMENT OF NET INCOME/(LOSS) AND OTHER COMPREHENSIVE INCOME
STATEMENT OF OTHER COMPREHENSIVE INCOME
In millions of euros Notes H1 2017 H1 2016 (*)
Net income 825 615
Revaluation adjustments on defined-benefit plans 16 (54)
Revaluation of own credit risk on financial liabilities at fair value through profit or loss (59) (42)
Tax impact on items not recyclable to income 14 33
Share of gains and losses recognized directly in the equity of associates not recyclable to
income
Items not recyclable to income (28) (63)
Translation adjustments (392) (157)
Revaluation of available-for-sale financial assets (14) 228
Revaluation of hedging derivatives 102 (95)
Tax impact on items recyclable to income (22) (39)
Share of gains and losses recognized directly in the equity of associates recyclable to income (1) 3
Items recyclable to income (326) (60)
Gains and losses recognized directly in comprehensive income (net of tax) (354) (124)
TOTAL INCOME 470 491
Group share 420 470
Non-controlling interests 51 22 (*) Data restated for the impact of the early application of the provisions of IFRS 9 “Financial instruments” on financial liabilities at fair value through
profit or loss as from January 1, 2016. The revaluation of own credit risk reclassified from income to items not recyclable to income amounted to -€42 million gross and -€27.5 million net of tax (no impact was reported in the financial statements at June 30, 2016).

Financial Data 5 Interim consolidated financial statements and notes
Natixis Update to the 2016 Registration Document 95
STATEMENT OF CHANGES IN SHAREHOLDERS’ EQUITY
In millions of euros
Shareholders’ equity as of December 31, 2015 after appropriation of income 5,005 5,864 1,213 (12) 6,173 825 459 (289) (78) 19,160 1,341 20,500
Initial application of IFRS 9 for financial liabilities under the fair value option through
profit or loss (3) (32) 32 0 0
Capital increase 2 (2) 0 0
Elimination of treasury stock 16 1 17 17
Equity component of share-based payment plans 0 0 0
2015 dividend paid in 2016 -1,094 (1,094) (111) (1,205)
Total activity related to relations with shareholders 2 (2) 0 16 (1,093) 0 0 0 0 0 0 (1,077) (111) (1,188)
Issuance and redemption of deeply subordinated notes and preference shares 398 0 398 398
Interest paid on deeply subordinated notes and preference shares (5) (37) (37) (37)
Change in gains and losses recorded directly in equity (115) 142 (62) (28) (62) 16 (46)
Appropriation to own credit risk reserve during the period (8) 8 0
Change in actuarial gains and losses under IAS19 R (35) (35) (35)
Income/(loss) as of June 30, 2016 608 608 6 615
Impact of acquisitions and disposals (4) (139) (42) 0 (181) (34) (214)
Other (10) (10) (0) (10)
Shareholders’ equity at June 30, 2016 (3) 5,007 5,862 1,611 4 4,854 669 602 (351) (113) 13 608 18,765 1,218 19,982
Capital increase 13 13 26 26
Elimination of treasury stock (4) 4 0 0
Equity component of share-based payment plans 5 5 5
2015 dividend paid in 2016 0 0 0 0
Total activity related to relations with shareholders 13 13 0 (4) 9 0 0 0 0 0 0 31 0 32
Issuance and redemption of deeply subordinated notes and preference shares 0 0 0 0
Interest paid on deeply subordinated notes and preference shares (5) (41) (41) (41)
Change in gains and losses recorded directly in equity 282 27 96 (75) 330 5 335
Appropriation to own credit risk reserve during the period 0 0
Change in actuarial gains and losses under IAS19 R 2 2 (3) (1)
Income/(loss) for H2 2016 766 766 84 850
Impact of acquisitions and disposals (4) (19) 1 0 (18) (9) (27)
Other 2 (2) 0 1 2
Shareholders’ equity at December 31, 2016 5,019 5,875 1,611 1 4,805 950 629 (255) (111) (62) 1,374 19,835 1,296 21,131
Appropriation of 2016 earnings 81 1,293 -1,374 0 0
Shareholders’ equity as of December 31, 2016 after appropriation of income 5,019 5,956 1,611 1 6,098 950 629 (255) (111) (62) 0 19,835 1,296 21,131
Capital increase 0 (0) 0 0
Elimination of treasury stock (19) (1) (20) (20)
Equity component of share-based payment plans 8 8 8
2016 dividend paid in 2017 (1,098) (1,098) (73) (1,170)
Total activity related to relations with shareholders 0 (0) 0 (19) (1,091) 0 0 0 0 0 0 (1,110) (73) (1,183)
Issuance and redemption of deeply subordinated notes and preference shares 474 0 474 474
Interest paid on deeply subordinated notes and preference shares (5) (47) (47) (47)
Change in gains and losses recorded directly in equity (380) 3 67 (39) (350) (7) (357)
Appropriation to own credit risk reserve during the period (2) 2 0 0
Change in actuarial gains and losses under IAS19 R 11 11 11
Income/(loss) as of June 30, 2017 768 768 57 825
Impact of acquisitions and disposals (5) (59) (9) 1 (68) (7) (74)
Other 6 6 3 9
Shareholders’ equity at June 30, 2017 5,020 5,956 2,085 (18) 4,905 560 633 (189) (101) (99) 768 19,520 1,270 20,789
Total
consolidated
equity
Net income
group share
Shareholders
' equity
group share
Non-
controlling
interests
Recyclable
Revaluation
adjustments on
defined-benefit
plan
commitments
Non-recyclable
Other
consolidated
reserves
Share capital and reserves Consolidated reserves
Available-for-
sale assets
Hedging
derivatives
Translation
adjustments
Reserves
related to
share capital (1)
Capital
Elimination
of treasury
stock
Other equity
instruments
issued (2)
Gains/(losses) recorded directly in equity
Revaluation of own
credit risk on
financial liabilities at
fair value through
profit or loss (3)
1. Issue premiums, legal reserve, contractual reserves, long-term capital gains reserve and other Natixis reserves; 2. Other equity instruments issued: these are perpetual deeply subordinated notes; as at June 30, 2017, BPCE had subscribed for a new
perpetual deeply subordinated note issue totaling €474 million. At June 30, 2016, a €400 million perpetual deeply subordinated note subscribed for by BPCE (in January 2016) and the partial repayment of -€2 million was recognized;
3. Data restated for the impact of the early application of the provisions of IFRS 9 “Financial instruments” on financial liabilities at fair value through profit or loss as from January 1, 2016. The impact of the early application of provisions relating to financial liabilities under IFRS 9 “Financial instruments” recognized under “Revaluation of own credit risk on financial liabilities at fair value through profit or loss” in opening shareholders' equity corresponds to own credit spread at January 1, 2016, i.e. €49 million (gross amount) and an associated tax impact of -€17 million (see Note 1.6). Realized and unrealized changes in fair value attributable to own credit risk on financial liabilities at fair value through profit or loss for the 2016 fiscal year recognized in shareholders' equity totaled -€156.5 million (gross amount, with an associated tax impact of +€53.9 million), including -€27.5 million in the first half of 2016 and -€75.1 million in the second half of 2016. Balances relating to the early repayment of Natixis issues recognized in shareholders' equity at June 30, 2016 totaled +€12 million (gross amount, with an associated tax impact of -€4 million).
Realized and unrealized changes in fair value attributable to own credit risk on financial liabilities at fair value through profit or loss” at June 30, 2017 recognized in shareholders' equity totaled -€58.6 million (gross amount, with an associated tax impact of +€19.5 million). Balances relating to the early repayment of Natixis issues recognized in shareholders’ equity at June 30, 2017 totaled +€2.4 million net of tax;
4. In 2016, shareholders' equity group share included the following:
- €73 million in call options granted to minority shareholders in Peter J. Solomon Company (PJSC); - €24 million in call options granted to minority shareholders in Ciloger; - €65 million related to the revaluation and unwinding of purchase options granted to minority shareholders of DNCA France;
- €18 million for the acquisition of 40% of AEW Europe;
- €44 million in translation adjustments following the repayment of USD 400 million in retained earnings by the New York branch; 5. At June 30, 2017, shareholders' equity group share included the following:
- €31 million related to the revaluation and unwinding of purchase options granted to minority shareholders of DNCA France and Ciloger; - €20 million related to the acquisition of 51% of S-Money and its subsidiary Lakooz from BPCE; - €4 million in call options granted to minority shareholders in PayPlug.

Financial Data 5 Interim consolidated financial statements and notes
Natixis Update to the 2016 Registration Document 96
NET CASH FLOW STATEMENT The balance of cash and cash equivalents consists of the net balances on cash and amounts due from central banks, as well as on-demand deposits with and loans from credit institutions. Changes in cash generated by operating activities consist of cash flows generated by Group activities, with the exception of those relating to held-to-maturity financial assets and investment property. Changes in cash related to investment operations result from cash flows related to acquisitions and disposals of investments in consolidated and non-consolidated affiliates, tangible and intangible fixed assets, and acquisitions and disposals of investment property, property provided under operating leases and financial assets held to maturity.
In millions of euros H1 2017 FY 2016H1 2016
Restated (*)
Pre-tax profit 1,294 2,287 1,012
+/- Net charge to depreciation and amortization of property, plant and equipment and
intangible assets156 304 143
+/- Writedown of goodwill and other non-current assets 78 76
+/- Net charge to other provisions (including insurance companies’ technical
reserves) 4,675 4,493 13,596
+/- Share in income of associates (13) (13) (14)
+/- Net loss/(gain) on investing operations (191) (481) (216)
+/- Net loss/(gain) on financing operations 44 139 74
+/- Other activity (518) (1,123) (11,413)
= Total non-cash items included in pre-tax profit and other adjustments4,153 3,398 2,246
+/- Decrease/(increase) in interbank and money market items 7,505 7,266 12,571
+/- Decrease/(increase) in customer items 7,596 (706) (3,949)
+/- Decrease/(increase) in financial assets or liabilities (15,119) (203) (300)
+/- Decrease/(increase) in non-financial assets or liabilities (5,612) 1,662 (329)
- Income taxes paid 8 (488) (256)
= Net decrease/(increase) in operating assets and liabilities (5,622) 7,531 7,736
Net cash provided/(used) by operating activities (175) 13,216 10,993
+/- Decrease/(increase) in financial assets and equity interests (1) 129 196 1
+/- Decrease/(increase) in investment property 123 143 68
+/- Decrease/(increase) in property, plant and equipment and intangible assets (147) (62) (74)
Net cash provided/(used) by investing operations 105 278 (4)
+/- Cash received from/(paid to) shareholders (2) (1,170) (1,179) (1,199)
+/- Other cash provided/(used) by financing operations (3) (616) (884) 201
Net cash provided/(used) by financing operations (1,786) (2,063) (998)
Cash flow of assets and liabilities held for sale (2) (6)
Impact of exchange rate changes on cash and cash equivalents (966) 887 (99)
Net increase/(decrease) in cash and cash equivalents (2,824) 12,312 9,891
Net cash provided/(used) by operating activities (175) 13,216 10,993
Net cash provided/(used) by investing operations 105 278 (4)
Net cash provided/(used) by financing operations (1,786) (2,063) (998)
Cash flow of assets and liabilities held for sale (2) (6)
Impact of exchange rate changes on cash and cash equivalents (966) 887 (99)
Cash and cash equivalents at beginning of period 37,969 25,656 25,656
Cash and balances with central banks 26,703 21,190 21,190Interbank balances 11,266 4,466 4,466
Cash and cash equivalents at end of period 35,145 37,969 35,548
Cash and balances with central banks 41,886 26,703 27,911Interbank balances (6,741) 11,266 7,636
Change in cash and cash equivalents (2,824) 12,312 9,891

Financial Data 5 Interim consolidated financial statements and notes
Natixis Update to the 2016 Registration Document 97
(*) Data restated for the impact of the early application of the provisions of IFRS 9 “Financial instruments” on financial liabilities at fair value through profit or loss as from January 1, 2016. This impact was as follows: +€42 million on Pre-tax profit (versus €969 million reported at June 30, 2016) and -€42 million on Other activity (vs -€11,370 million reported at June 30, 2016).
(1) Decrease/(increase) in financial assets and investments in associates, including in particular: - flows related to assets held to maturity (+€153 million); - flows related to investments in consolidated affiliates totaling +€53 million, corresponding to the acquisition of 51% of S-
Money (-€20 million), 79% of PayPlug (-€21 million), an additional 13.67% stake in Ossiam (-€4 million), the disposal of Ellisphère (+€55 million), IJCOF Corporate (+€9 million) and IDFC (+€35 million), and the exercise of part of the put option on Euro Private Equity (-€1 million);
- flows related to investments in non-consolidated affiliates for -€77 million. (2) Flows received from/(paid to) shareholders included dividends paid to BPCE in the amount of -€779 million and dividends paid
to non-group entities for -€391 million. (3) Flows from financing activities can be broken down as follows:
- the expiry of an EMTN issued in 2006 on January 20, 2017, for -€500 million; - interest paid on subordinated notes for -€69 million; - interest paid on deeply subordinated notes recorded as equity for -€47 million.

Financial Data 5 Interim consolidated financial statements and notes
Natixis Update to the 2016 Registration Document 98
NOTE 1 ACCOUNTING PRINCIPLES 1.1 Applicable standards Natixis’ consolidated half-year financial statements at June 30, 2017 include a set of condensed financial statements prepared and presented pursuant to the provisions of IAS 34 “Interim financial statements”. These condensed financial statements must be read in conjunction with the consolidated financial statements for the fiscal year ended December 31, 2016, filed with the Autorité des Marchés Financiers (AMF - French Financial Markets Authority) on March 21, 2017. They consist of:
- the balance sheet;
- the income statement;
- the statement of net income/(loss) and other comprehensive income;
- the statement of changes in shareholders’ equity;
- the net cash flow statement;
- and a selection of notes to the financial statements. They are presented with a comparison to December 31, 2016 and/or June 30, 2016. The accounting principles and methods used to prepare the consolidated interim financial statements of Natixis at June 30, 2017 are identical to those used to prepare the consolidated financial statements for the fiscal year ended December 31, 2016, prepared in accordance with IFRS as adopted in the European Union and detailed in Note 1 “Basis of presentation” to the consolidated financial statements for fiscal year 2016 (presented in Chapter 5.1 “Financial data - consolidated financial statements and notes" of the 2016 Registration Document). Natixis did not opt for early application of the following standards adopted by the European Union at June 30, 2017 but which had not yet entered into force:
- The new standard, IFRS 15 “Revenue from Contracts with Customers”, adopted by the European Commission on September 22, 2016 with application from January 1, 2018 with specific phase-in conditions. This standard will replace the current standards and interpretations on revenue recognition. Under IFRS 15, the entity must recognize income arising from ordinary activities at an amount that reflects the consideration that the entity expects to receive in exchange for the transfer of goods and services promised to customers. IFRS 15 applies to all contracts with customers except for leases (covered by IAS 17), insurance contracts (covered by IFRS 4) and financial instruments (covered by IFRS 9). If specific stipulations relating to revenue or contract costs are specified under a different standard, these will first be applied. Failing this, the provisions of IFRS 15 apply. Natixis began to analyze the impact of the application of this new standard in the second half of 2016 and this work will be completed during the 2017 fiscal year.
- The new standard, IFRS 9 “Financial instruments” adopted by the European Commission on November 22, 2016 and applicable retroactively as of January 1, 2018, except for the provisions relating to financial liabilities at fair value through profit or loss, for which Natixis has applied the option offered by the standard of applying them in advance to the financial statements as of December 31, 2016.

Financial Data 5 Interim consolidated financial statements and notes
Natixis Update to the 2016 Registration Document 99
The new standard introduces:
a new classification model for financial assets, based on the type of instrument (debt or equity
instrument):
o for debt instruments, the standard revises the distinction between amortized cost and fair value based on the business model for financial assets and their contractual cash flow characteristics. The business model depends on how Natixis manages its financial assets in order to generate cash flow and create value. Only “basic” instruments whose contractual conditions allow for solely payments of principle and interest at specific dates may be classified at amortized cost (if they are held under a “hold to collect” business model) or at fair value through other comprehensive income (if they are held under a “hold to collect and sell” business model);
o for equity instruments, fair value through profit or loss becomes the default classification.
Classification at fair value through shareholders’ equity remains possible as an option and
under certain conditions;
A single impairment model that is forward-looking and based not on incurred credit losses but on expected credit losses calculated across all portfolios recognized at amortized cost or at fair value through other comprehensive income (recyclable), as well as on finance lease receivables under IAS 17 and on contract assets under IFRS 15. This single impairment model will also apply to provisioning for financing commitments which fall outside the current standard’s scope (for their evaluation) and provisioning for financial guarantee commitments. Under the new framework, it will no longer be necessary to identify an event of default to record an impairment. IFRS 9 generally requires one-year expected losses to be recorded upon initial recognition, and subsequently, if the counterparty risk has deteriorated significantly since initial recognition, expected losses at maturity should be recognized. Thirdly, if credit quality deteriorates to the point that recoverability is threatened, a provision must be set aside for expected loss at maturity, which is the same as the requirement under IAS 39 for individual impairment of loans in default;
A new hedge accounting model that is more in line with risk management activities. Considering the major changes introduced by IFRS 9, Natixis is carrying out implementation work as part of the organization of a project involving all affected business lines and support functions. Launched in H1 2015, IT analysis, design and development work continued during fiscal year 2016 and the first half of 2017. The second half of 2017 will be primarily dedicated to revenue, finalizing work on model calibration, completing documentation and adapting processes imposed by the implementation of this new standard within the framework of change management.

Financial Data 5 Interim consolidated financial statements and notes
Natixis Update to the 2016 Registration Document 100
Work carried out so far on Classification and Measurement shows that the majority of financial assets that were recognized at amortized cost under IAS 39 will continue to meet the conditions to be recognized at amortized cost under IFRS 9, and conversely, that the majority of financial assets classified as available-for-sale assets or as assets at fair value through profit or loss under IAS 39 will continue to be measured at fair value through shareholders’ equity or profit or loss under IFRS 9.
Reclassifications identified at this stage include:
For financing portfolios:
o Repurchase agreements designated under the fair value option through profit or loss under IAS 39 for the purpose of comprehensive management at fair value and subject to a trading business model will be recognized as “Financial assets at fair value through profit or loss”;
o Repurchase agreements classified as loans and receivables under IAS 39 and subject to a trading business model under IFRS 9 will be recognized as “Financial assets at fair value through profit or loss”.
The vast majority of financing and lease receivables will continue to be classified and measures at amortized cost. Regarding these financing receivables, Natixis holds a portfolio of fixed income loans that bear a symmetrical repayment clauses: Questions regarding the interpretation of these clauses and whether or not these instruments should be considered “basic” were referred to the IASB (International Accounting Standards Board) in December 2016. A draft amendment to the standard was published in April 2017 and a decision as to whether the instruments can be considered basic and therefore recorded at amortized cost when they are held under a “hold to collect” business model under IFRS 9 should be announced before the end of the year.
For securities portfolios, reclassification should mainly relate to:
o Debt securities held in the liquidity reserve, which under IAS 39 were recognized as available-for-sale assets and which, as they were held under a “hold to collect and sell” business model will be reclassified as financial assets at fair value through recyclable OCI;
o Mutual fund and venture capital mutual fund units, except for those in the insurance business, classified as equity instruments under IAS 39 and recognized as “Available-for-sale assets” or as “Financial assets under the fair value option through profit or loss”, are considered under IFRS 9 as debt instruments with non-basic characteristics and as a result will be recognized as “Financial assets at fair value through profit or loss”;
o Investments in associates recognized as available-for-sale assets under IAS 39 which, as allowed under IFRS 9, subject to an individualized option, will either be recognized as “Financial assets at fair value through profit or loss” or as “Financial assets at fair value through OCI” (non-recyclable even in the event of disposal and recyclable for dividends);
o Securitization units held for the purpose of GSCS (Global Structured Credit and Solutions) activities, which are currently recognized as “Loans and receivables” and will not fulfill the characteristics of a basic instrument and which will be recognized as financial assets at fair value through profit or loss.
Reclassifications between financial assets at amortized cost and financial assets at fair value have a net impact on Natixis’ consolidated shareholders’ equity due to the difference in the method used to measure these assets. Nevertheless, as there are very few such reclassifications and those carried out affect assets whose value does not differ significantly from cost value, these reclassifications are not expected to have a material impact, in terms of amount, on Natixis’ opening shareholders’ equity on January 1, 2018.

Financial Data 5 Interim consolidated financial statements and notes
Natixis Update to the 2016 Registration Document 101
Regarding the implementation of new impairment provisions:
To calculate impairment, Natixis will use regulatory capital requirement calculation models and the
projection models used for regulatory stress tests. Specific adjustments will be made to reflect the
maturity of outstandings, current conditions and expected economic and financial projections.
Measurements may therefore, in some cases, differ significantly from those used to calculate
regulatory capital requirements due to the associated safety buffers and as they are “through-the-
cycle”.
The models which will be introduced to calculate impairment will be centralized to ensure that methods are consistent throughout Natixis and Groupe BPCE, depending on the type of asset.
Material impairment will be measured using a combination of indicators, the majority of which are
included in the current risk monitoring system and adapted to the characteristics of the portfolios.
These criteria include: the counterparty’s rating (internal, or external where there is no internal
rating), the non-technical unpaid amount, the counterparty’s Watch List status (incorporating the
forbearance status), and the internal sector rating of the sector or country to which the
counterparty belongs.
Quantified impact simulations carried out to date still include simplified options which cannot reasonably guarantee that estimates are sufficiently reliable to be published. In terms of hedge accounting: Natixis, like Groupe BPCE, has chosen the option offered by IFRS 9 of not applying its provisions relating to hedge accounting and of continuing to apply IAS 39 for hedge accounting transactions. Considering the limited number of asset reclassifications, the majority of hedge accounting transactions recognized according to IAS 39 will continue to be recognized in the same manner as of January 1, 2018. Furthermore, information included in the notes to the financial statements will comply with the provisions of IFRS 7 as amended by IFRS 9. Pursuant to the option available under IFRS 9, Natixis does not intend to provide comparative information for its financial statements. In terms of applying IFRS 9 to insurance activities: On June 29, 2017, the ARC (Accounting Regulatory Committee) voted in favor of Amendments to IFRS 4 applying IFRS 9 “Financial instruments” jointly with IFRS 4 “Insurance contracts”, with specific provisions for financial conglomerates. European regulations will therefore allow European financial conglomerates to opt to defer application of IFRS 9 for their insurance activities until January 1, 2021, subject to certain conditions:
that they do not transfer any financial instruments between the insurance segment and other
segments of the conglomerate (with the exception of instruments at fair value through profit or loss
and financial instruments issued by an entity in the insurance segment);
that they provide specific additional information in the Notes.
As a financial conglomerate, Natixis intends to apply this provision for its insurance entities, which will continue to be covered by IAS 39. The main entities concerned by this measure are CEGC, the

Financial Data 5 Interim consolidated financial statements and notes
Natixis Update to the 2016 Registration Document 102
Coface insurance subsidiaries, Natixis Assurances, BPCE Vie and its consolidated funds, Natixis Life, ADIR, BPCE Prévoyance, BPCE Assurances and BPCE IARD.
- IFRS 16 “Leases” will replace IAS 17 “Leases” and interpretations related to the accounting of these contracts. It will be applicable retrospectively as of January 1, 2019 according to specific phase-in conditions, subject to adoption by the European Union. Under IFRS 16, lease contracts shall be accounted such that they identify an asset and convey the right to use this asset for a period of time. From the lessor’s perspective, the impact is expected to be limited, as the provisions will not change substantially in relation to the current IAS 17. For lessees, the standard requires that all lease contracts be recorded in the balance sheet such that they convey the right to use the leased asset which must be recognized under fixed assets with a corresponding financial liability entry under liabilities to reflect the leases and the remaining payments over the duration of the lease contract. The right to use the asset will be amortized on a straight-line basis and the financial liability will be calculated an actuarial basis over the duration of the lease contract. The interest expense on financial debt and depreciation charge for the right of use will be carried separately in income. In contrast, under existing IAS 17, operating leases are not recorded in the balance sheet and only the related rental charge is recognized in the profit and loss statement. The estimated amount of the rights of use to be recorded in the balance sheet is currently being assessed. Natixis expects a major impact on Fixed assets and on Financial liabilities in the balance sheet.
1.2 H1 2017 key events In the first half of 2017, Natixis acquired a 51% majority stake in S-Money and its subsidiary Lakooz from BPCE. Both these companies specialize in new online payment methods. As the acquisition of S-Money and Lakooz took place between entities under the same ownership structure, the assets and liabilities of the acquired entities were recorded at their book value in Natixis’ consolidated financial statements and the difference between the price paid and Natixis’ share in the book value of the acquired entity’s assets and liabilities was deducted from shareholders’ equity in the amount of €19.8 million. The past goodwill recorded in BPCE’s consolidated financial statements, which would have been recognized when Groupe BPCE entered Lakooz’ capital, was recorded in Natixis’ financial statements for the amount recorded by BPCE, i.e. €11.9 million. Natixis exercises control over these two entities within the meaning of IFRS 10, and fully consolidates them. At June 30, 2017, Natixis had finalized the acquisition of PayPlug, a fintech company specialized in online payments for very small businesses and SMEs. Following the capital increase carried out immediately after the acquisition, Natixis held 79% of PayPlug’s share capital as at June 30, 2017. The company’s management holds shares alongside Natixis and exit provisions are in place which, if exercised, allows Natixis to acquire all the remaining capital. The promise to buy/sell shares led to the recognition of put options on minority shareholders, for €5.8 million. Natixis exercises control over this entity within the meaning of IFRS 10, and fully consolidates it. This transaction generated goodwill of €14.3 million as at June 30, 2017, as determined using the partial goodwill method. In terms of the activities of Corporate Data Solutions, Natixis sold Ellisphère and its subsidiary IJCOF Corporate in the first half of 2017. Since 2016, these entities had been treated under IFRS 5 owing to ongoing negotiations for their disposal. The full sale of these entities outside Natixis generated a capital gain (excluding the tax impact) of €21.5 million. After these disposals, the Corporate Data Solutions division no longer held any assets and its holding company Natixis HCP was absorbed by Natixis (via a total transfer of assets and liabilities) in June 2017. This transfer had no impact on the consolidated financial statements as it was an internal restructuring operation.

Financial Data 5 Interim consolidated financial statements and notes
Natixis Update to the 2016 Registration Document 103
On June 26, 2017, Natixis announced it had signed an agreement to acquire a 50.04% stake in Dalenys (representing 58% of voting rights) from Saint-Georges Finance and Jean-Baptiste Descroix-Vernier. The completion of this transaction is subject to conditions precedent, in particular the obtaining of regulatory authorization. In view of this, the transaction had no impact on Natixis’ financial statements at June 30, 2017. 1.3 Use of estimates In preparing its financial statements, Natixis is required to make certain estimates and assumptions based on available information that is likely to require expert judgment. These estimates and assumptions constitute sources of uncertainty which may affect the calculation of income and expenses in the income statement, the value of assets and liabilities in the balance sheet and/or certain disclosures in the notes to the financial statements. As a result, future results of certain operations may differ significantly from the estimates used in the financial statements at June 30, 2017. Accounting estimates which require assumptions to be made are mainly used to measure the items set out below: - Financial instruments recorded at fair value The fair value of hybrid market instruments not traded on an active market is calculated using valuation techniques. Valuations produced using valuation models are adjusted, depending on the instruments in question and the associated risks, to take account of the bid and ask price for the net position, modeling risks, assumptions regarding the funding cost of future cash flows from uncollateralized or imperfectly collateralized derivatives, as well as counterparty and input risks. The fair values obtained from these methods may differ from the actual prices at which such transactions might be executed in the event of a sale on the market. The valuation models used to price financial instruments that are illiquid or for which liquidity has dried up as a result of the financial crisis are described in Note 1.4. - Impairment of loans and receivables At the reporting date, Natixis assesses whether or not there is any objective evidence of impairment for loans and receivables, either on an individual basis or collectively by risk category. To identify evidence of impairment, Natixis analyzes trends in a number of objective criteria, but also relies on the judgment of its own expert teams. Similarly, Natixis may use its expert judgment to establish the likely timing of recoveries (where the aim is to calculate the amount of individual impairment losses), or to adjust the amount of expected losses under the Basel framework, on which the amount of collective impairment is based. - Valuation of unlisted equity instruments classified as “Available-for-sale financial assets” Unlisted equity instruments classified as available-for-sale financial assets primarily consist of investments in non-consolidated companies. The fair value of investments in unlisted non-consolidated companies is obtained principally by using valuation methods based on multiples or DCF (discounted cash flow). Use of these methods requires certain choices and assumptions to be made in advance (in particular, projected expected future cash flows and discount rates). - Value of cash-generating units (CGUs)

Financial Data 5 Interim consolidated financial statements and notes
Natixis Update to the 2016 Registration Document 104
All goodwill is assigned to a CGU so that it may be tested for impairment. Permanent impairment tests are performed whenever objective evidence of impairment points to the existence of such a risk, and in any event at least once a year. The tests conducted by Natixis consist in comparing the carrying amount of each CGU (including goodwill) with its recoverable amount. Where the recoverable amount equals the value in use, it is determined by discounting annual free cash flows to perpetuity (excluding the Private Equity CGU). For the Coface CGU, value in use is supplemented by other approaches using market data. Value in use is determined principally by discounting the expected future cash flows from the CGU. As such, use this method involves: estimating future cash flows. Natixis has based these estimates on forecasts included in its
business units’ medium-term plans spanning five years; projecting cash flows for the last year of the plan to perpetuity, at a rate reflecting the expected
annual growth rate; discounting cash flows at a specific rate for each CGU.
As there was no indication of impairment at June 30, 2017, no impairment tests were performed with the exception of the Coface CGU. Since the valuation of the Coface CGU is highly sensitive to inputs (spot price, brokers’ target price, multiples), the valuation inputs used were updated. The entity’s valuation was calculated and no additional goodwill impairment was recorded. - Fair value of loans and receivables recognized at amortized cost (excluding loans
reclassified under the amendment to IAS 39 and IFRS 7) The fair value of loans not quoted on an active market is determined using the discounted cash flow method. The discount rate is based on an assessment of the rates used by the institution during the period for groups of loans with similar risk characteristics. Loans have been classified into groups with similar risk characteristics based on statistical research enabling factors having an impact on credit spreads to be identified. Natixis also relies on expert judgment to refine this segmentation. - Employee benefits Natixis calls on independent actuaries to calculate its principal employee benefits. These commitments are determined using assumptions such as the salary growth rate, discount rates and rates of return on plan assets. These discount rates and rates of return are based on observed market rates at the end of each calculation period (e.g. the yield curve on AA Corporate bonds for discount rates). When applied to long-term benefit obligations, these rates introduce uncertainty into the valuations.

Financial Data 5 Interim consolidated financial statements and notes
Natixis Update to the 2016 Registration Document 105
- Insurance-related liabilities Insurance technical reserves are calculated using assumptions and estimates that may lead to adjustments in amounts reported over the subsequent period: For personal protection insurance, claims reserves are calculated by modeling claims
experience; For life insurance, underwriting reserves are computed based on economic and financial
assumptions, mortality and morbidity tables, and behavioral statistics, for example concerning surrenders;
For general insurance, technical reserves comprise provisions for unearned premium income (calculated on an accrual basis and representing the portion of premiums issued during the period that relate to a period after the reporting date) and reserves for claims to be paid, corresponding to known and unknown claims that have occurred but not yet paid at the reporting date;
For credit insurance, claims reserves include an estimate of claims reported but not settled at the reporting date. In addition to the amount of claims payable, a provision is set aside for unknown claims, calculated on a statistical basis in reference to the final amount of claims to be paid following settlement of risks and any debt recovery measures. Provisions for debt recovery procedures, representing estimates of expected recoveries, are calculated by applying a terminal recovery rate to all subscription periods not yet settled.
- Deferred profit-sharing The participation rate used to calculate deferred profit-sharing is determined based on payout ratios projected over the term of the medium-term plan and in line with the actual pay-out ratio for the previous fiscal year. In the event of a deferred profit-sharing asset, a recoverability test is carried out to verify that liquidity requirements arising from an unfavorable economic environment do not force the sale of assets and generate unrealized losses. This recoverability test relies on projected future cash flows based on different economic assumptions about historical redemptions and inflows. Application of the shadow accounting mechanism resulted in the recognition of a deferred profit-sharing liability at June 30, 2017; consequently, no recoverability test was performed. - Deferred taxes Natixis records a net deferred tax asset linked to its ability to generate taxable income over a given period (10 years maximum), while tax loss carry forwards are deductible with no time limitation in France and the UK or over very long periods (20 years in the US). To this end, Natixis prepares tax business plans over rolling periods as from the last tax reporting period, and based on growth assumptions used in the medium-term plans for the business lines. Adjustments for special tax schemes are also implemented.

Financial Data 5 Interim consolidated financial statements and notes
Natixis Update to the 2016 Registration Document 106
- Other provisions Provisions recognized in the consolidated balance sheet, other than those relating to financial instruments, employee benefits and insurance policies, mainly concern provisions for litigation, restructuring, fines and penalties. A provision is raised when it is likely that an outflow of resources embodying economic benefits will be required to settle an obligation arising from a past event, and when the amount of the obligation can be reliably estimated. In order to calculate this amount, Management is required to assess the probability of the risk occurring. Future cash flows are discounted where the impact of discounting is material. 1.4 Fair value measurement
General principles The fair value of an instrument (asset or liability) is the price that would be received to sell an asset or paid to transfer a liability in a standard arm’s length transaction between market participants at the measurement date. Fair value is therefore based on the exit price. The fair value of an instrument on initial recognition is normally the transaction price, i.e. the price paid to acquire the asset or received to assume the liability. In subsequent measurements, the estimated fair value of assets and liabilities must be based primarily on observable market data, while ensuring that all inputs used in the fair value calculation are consistent with the price that market participants would use in a transaction. In this case, fair value consists of a mid-market price and additional valuation adjustments determined according to the instruments in question and the associated risks. The fair value mid-market price is obtained based on: - the quoted price if the instrument is quoted on an active market. A financial instrument is regarded
as quoted on an active market if quoted prices are readily and regularly available from an exchange, dealer, broker, industry group, pricing service or regulatory agency, and those prices represent actual and regularly occurring transactions on an arm’s length basis on the main market or, failing that, the most advantageous market;
- valuation techniques if the market for a financial instrument is not active. The techniques used
must maximize the use of relevant observable entry data and minimize the use of non-observable entry data. They may refer to observable data from recent transactions, the fair value of similar instruments, discounted cash flow analysis and option pricing models, proprietary models in the case of hybrid instruments or non-observable data when no pricing or market data are available.
Additional valuation adjustments incorporate factors related to valuation uncertainties, such as market, credit and liquidity risks in order to account, in particular, for the costs resulting from an exit transaction on the main market. Similarly, a Funding Value Adjustment (FVA) aiming to account for – through assumptions – costs associated with the funding of future cash flows of uncollateralized derivatives or imperfectly collateralized derivatives is also taken into account. The main additional Funding Value Adjustments are as follows:
Bid/ask adjustment – Liquidity risk:

Financial Data 5 Interim consolidated financial statements and notes
Natixis Update to the 2016 Registration Document 107
This adjustment is the difference between the bid price and the ask price corresponding with the selling costs. It reflects the cost requested by a market player in respect of the risk of acquiring a position or of selling at a price proposed by another market player. Adjustment for model uncertainty: This adjustment takes into account the imperfections of the valuation techniques used – in particular, the risk factors that are not considered, even when observable market inputs are available. This is the case where risks inherent to various instruments differ from those considered by the observable inputs used to value them. Adjustment for input uncertainty: Observing certain prices or inputs used in valuation techniques may be difficult or the price or input may be too regularly unavailable to determine the selling price. Under these circumstances, an adjustment may be necessary to reflect the probability that market participants might adopt different values for the same inputs when evaluating the financial instrument’s fair value. Value adjustment for counterparty risk (Credit Valuation Adjustment – CVA): This adjustment applies to valuations that do not account for the counterparty’s credit quality. It corresponds to the expected loss related to the risk of default by a counterparty and aims to account for the fact that Natixis cannot recover all the transactions’ market value. The method for determining the CVA is primarily based on the use of market inputs in connection with professional market practices for all counterparty segments included in this calculation. In the absence of liquid market inputs, proxies by type of counterparty, rating and geographic area are used. Value adjustment for own credit risk (Debit Valuation Adjustment – DVA) and funding valuation adjustment (FVA): The DVA is symmetrical to the CVA and represents the expected loss, from the counterparty’s perspective, on liability valuations of derivative financial instruments. It reflects the impact of Natixis’ own credit quality on the valuation of these instruments. The adjustment is made by observing credit spreads on a sample of comparable entities, taking into account the liquidity of Natixis’ CDS spread over the period. The funding valuation adjustment (FVA) is taken into account in the DVA calculation.
The following criteria are used to determine whether a market is active: - the level of activity and trend of the market (including the level of activity on the primary market); - the length of historical data of prices observed in similar market transactions; - scarcity of prices recovered by a service provider; - sharp bid-ask price spread; - steep price volatility over time or between different market participants. Control system The calculation of fair value is subject to control procedures aimed at verifying that fair values are determined or validated by an independent function. Fair values determined by reference to external quoted prices or market parameters are validated by an independent unit (the Market Data Control Department). Second-level controls are carried out by the Risk Department. On less liquid markets, other market information, primarily observable data, is used to validate the fair value of instruments. The factors taken into account include the following:
- the origin of the external source (stock market pages, content contribution services, etc.);
- the consistency of the various sources;

Financial Data 5 Interim consolidated financial statements and notes
Natixis Update to the 2016 Registration Document 108
- the frequency at which the data are updated; - the representative nature of inputs based on recent market transactions.
For fair values determined using valuation models, the control system consists of the independent validation of model construction and of the inputs incorporating these models. This is carried out under the responsibility of the Risk Department. It involves verifying that the model is consistent with and relevant to its intended function (price setting, valuation, coverage, measurement and control of risk) and the product to which it applies, based on:
- the theoretical approach: the financial and mathematical foundations of the model;
- the application of the model: the pricing models used to generate risk and earnings data;
- the stability of the model under parametric stress;
- an assessment of the stability and consistency of the numerical methods used;
- the independent re-implementation of the model as part of algorithm validation;
- the comparative analysis of the calibration of model parameters;
- an assessment of the modeling risk, particularly the comparative analysis of the model
with other valuation models, in order to ensure the adequacy of the model and the payoff;
- the implementation of an adjustment in respect of modeling risk to account for potential
deficiencies in the model or its calibration;
- integration of the model in information systems.
The methods for determining fair value are monitored by a number of bodies including the Observability and Inputs Committee, the Valuation Committee, the Impairment Committee and the Model Validation Committee, which comprise representatives of the Risk Department, the Finance Department, and the Market Data and Valuations Control Department.
Fair value hierarchy For financial reporting purposes, IFRS 13 requires fair value measurements applied to financial and non-financial instruments to be allocated to one of three fair value levels: a) Level 1: Fair value measurement using prices quoted on liquid markets Level 1 comprises instruments whose fair value is determined based on directly usable prices quoted on active markets. This mainly includes securities listed on a stock exchange or traded continuously on other active markets, derivatives traded on organized markets (futures, options, etc.) whose liquidity can be demonstrated, and shares of UCITS whose NAV is determined and reported on a daily basis.
b) Level 2: Fair value measurement using observable market data
Level 2 fair value comprises instruments other than those mentioned in Level 1 fair value and instruments measured using a valuation technique incorporating inputs that are either directly observable (prices) or indirectly observable (price derivatives) through to maturity. This mainly includes: Simple instruments: Most over-the-counter derivatives, swaps, credit derivatives, forward rate agreements, caps, floors and plain vanilla options are traded in active markets, i.e. liquid markets in which trades occur regularly. These instruments are valued using generally accepted models (discounted cash flow method, Black & Scholes model, interpolation techniques), and on the basis of directly observable inputs.
For these instruments, the extent to which models are used and the observability of inputs has been
documented.

Financial Data 5 Interim consolidated financial statements and notes
Natixis Update to the 2016 Registration Document 109
Instruments measured using level 2 inputs also include: - securities that are less liquid than those classified as Level 1, whose fair value is determined
based on external prices put forward by a reasonable number of active market makers and which are regularly observable without necessarily being directly executable (prices mainly taken from contribution and consensus databases); where these criteria are not met, the securities are classified as Level 3 fair value;
- securities not quoted on an active market whose fair value is determined based on observable market date. E.g. use of market data published by listed peer companies or the multiple method from techniques commonly used by market participants;
- Greek sovereign securities, whose fair value was recorded under Level 2 given the wide bid-ask price spread on market prices;
- shares of UCITS whose NAV is not determined and published on a daily basis, but are subject to regular reporting or offer observable data from recent transactions;
- debt issues measured at fair value through profit and loss. The valuation of the “issuer credit risk” component is based on the discounted cash-flow method, using inputs such as yield curves, revaluation spreads, etc. For each issue, this valuation represents the product of the notional amount outstanding and its sensitivity, taking into account the existence of calls and the difference between the revaluation spread (based on the BPCE cash reoffer curve at June 30, 2017 as for previous closing dates) and the average issue spread. Changes in the issuer spread are generally not material for issues with an initial maturity of less than one year.
Complex instruments: Some more hybrid and/or long-maturity financial instruments are measured using a recognized model on the basis of market inputs derived from observable data such as yield curves, implied volatility layers of options, market consensus data or active over-the-counter markets. The main models for determining the fair value of these instruments are described below by type of product: - Equity products: complex products are valued using:
market data;
the “payoff”, i.e. a calculation of positive or negative cash flows attached to the product at maturity;
a model of changes in the underlying asset.
The products traded may be mono-underlying, multi-underlying or hybrid (e.g. fixed income/equity) products.
The main models used for equity products are local volatility, local volatility combined with the one-factor Hull & White (H&W1F) model, as well as the Tskew and Pskew models.
The local volatility model treats volatility as a function of time and the price of the underlying. Its main property is that it considers the implied volatility of the option (derived from market data) relative to its exercise price.
The hybrid local volatility combined with H&W1F consists of combining the local volatility model described above with a one-factor Hull & White model, described below (see fixed-income products).
The Tskew model is a valuation model for mono and multi-underlying options. Its principle is to calibrate the distribution of the underlying asset or assets at maturity to standard option prices.
The Pskew model is similar to the Tskew model. It is used in particular for simple ratchet equity products such as capped or floored ratchet products.

Financial Data 5 Interim consolidated financial statements and notes
Natixis Update to the 2016 Registration Document 110
- Fixed-income products: fixed-income products generally have specific characteristics which justify
the choice of model. The valuation of the payoff will take into account all underlying risk factors.
The main models used to value and manage fixed-income products are Hull & White models (one-factor and two-factor models or one-factor Hull & White stochastic volatility model), the Hunt Kennedy model and the “smiled” BGM model.
The Hull & White models are simple pricing models for plain vanilla fixed-income products and can be calibrated easily. Products valued using these models generally contain a Bermudan-type cancellation option (i.e. one that may be exercised at certain dates set at the beginning of the contract).
SBGM and Hunt Kennedy models are used to value fixed-income products that are sensitive to volatility smiles (i.e. implied change in volatility relative to the exercise price) and to autocorrelation (or correlation between interest rates).
- Currency products: currency products generally have specific characteristics which justify the
choice of model. The main models used to value and manage currency products are local volatility and stochastic models, as well as the hybrid models combining an underlying currency model with two one-factor Hull & White models to understand fixed-income factors.
Inputs relating to all such Level 2 instruments were demonstrated to be observable and documented. From a methodology perspective, observability is based on four inseparable criteria:
- inputs are derived from external sources (primarily a recognized contributor, for example);
- they are updated periodically; - they are representative of recent transactions; - their characteristics are identical to the characteristics of the transaction. If necessary, a proxy
may be used, provided that the relevance of such an arrangement is demonstrated and documented.
The fair value of instruments obtained using valuation models is adjusted to take account of liquidity
risk (bid-ask), counterparty risk, the risk relating to the cost of funding uncollateralized or imperfectly
collateralized derivatives, own credit risk (measurement of liability derivative positions), modeling risk
and input risk.
The margin generated when these instruments begin trading is immediately recognized in income.
c) Level 3: Fair value measurement using non-observable market data Level 3 comprises instruments measured using unrecognized models and/or models based on non-observable market data, where they are liable to materially impact the valuation. This mainly includes:
- unlisted shares whose fair value could not be determined using observable inputs; - private equity securities not listed on an active market, measured at fair value with models
commonly used by market participants, in accordance with International Private Equity Valuation (IPEV) standards, but which are sensitive to market fluctuations and whose fair value determination necessarily involves a judgment call;
- structured or representative of private placements, held by the insurance business line; - hybrid interest rate and currency derivatives and credit derivatives that are not classified in
Level 2;

Financial Data 5 Interim consolidated financial statements and notes
Natixis Update to the 2016 Registration Document 111
- instruments with a deferred day-one margin; - shares of UCITS for which the fund has not published a recent NAV at the valuation date, or
for which there is a lock-up period or any other constraint calling for a significant adjustment to available market prices (NAV, etc.) in respect of the low liquidity observed for such shares;
- instruments carried at fair value on the balance sheet and for which data are no longer available due to a freeze in trading in the wake of the financial crisis, which were not reclassified as “Loans and receivables” pursuant to the amendment to IAS 39 and IFRS 7 published on October 13, 2008 (see below). When there is a significant drop in trading in a given market, a valuation model is used based on the only available relevant data.
In accordance with the decree of February 20, 2007, amended by the decree of November 23, 2011, relating to regulatory capital requirements applicable to credit institutions and investment firms, and in accordance with the European Capital Requirements Regulation (CRR) of June 26, 2013 on requirements resulting from Basel 3, a description of crisis simulations and ex-post controls (validation of the accuracy and consistency of internal models and modeling procedures) is provided for each model used in Section 3.6 of Chapter III, “Risk Management and Capital Adequacy”. Under IAS 39, day-one profit should be recognized only if it is generated by a change in the factors that market participants would consider in setting a price, i.e. only if the model and parameters input into the valuation are observable. If the selected valuation model is not recognized by current market practices, or if one of the inputs significantly affecting the instrument’s valuation is not observable, the trading profit on the trade date cannot be recognized immediately in the income statement but is taken to income on a straight-line basis over the life of the transaction or until the date the inputs become observable. Any losses incurred at the trade date are immediately recognized in income.
At June 30, 2017, instruments for which the recognition of day-one profit/loss has been deferred
included:
- multi-underlying structured equity and index products;
- synthetic loans;
- options on funds (multi-asset and mutual funds);
- structured fixed-income products;
- securitization swaps.
For these instruments, the following table provides the main unobservable inputs as well as value ranges.
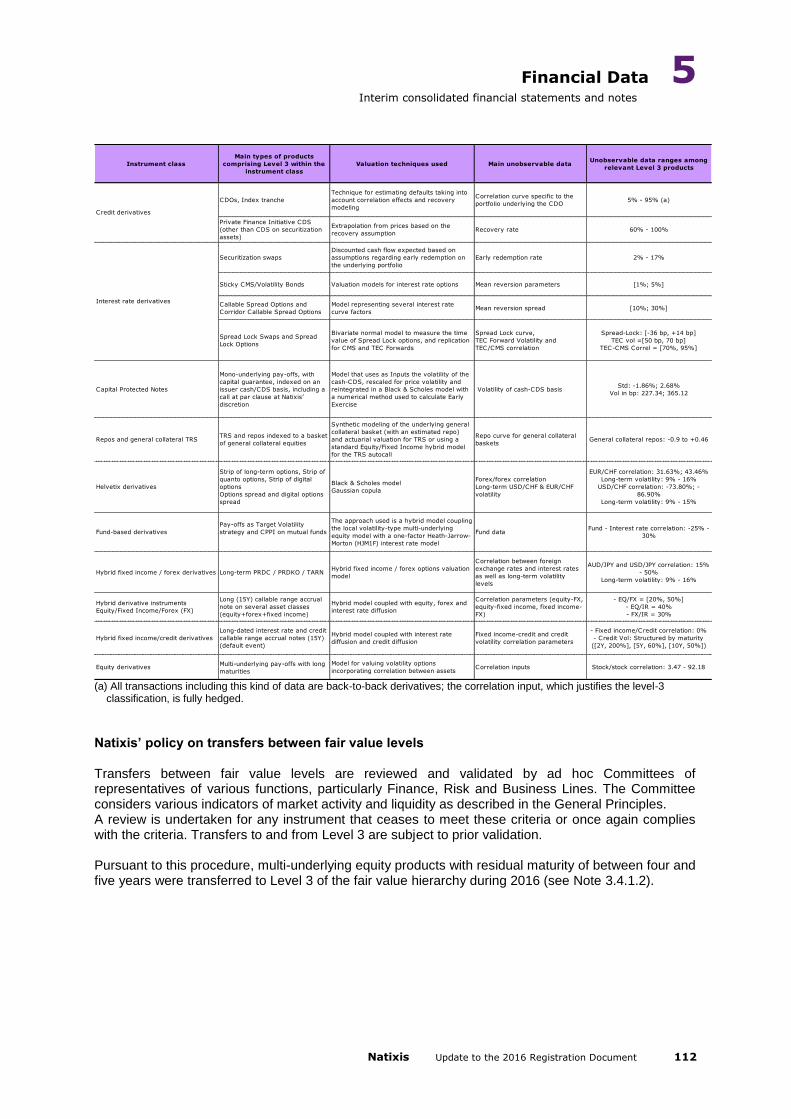
Financial Data 5 Interim consolidated financial statements and notes
Natixis Update to the 2016 Registration Document 112
Instrument class
Main types of products
comprising Level 3 within the
instrument class
Valuation techniques used Main unobservable dataUnobservable data ranges among
relevant Level 3 products
CDOs, Index tranche
Technique for estimating defaults taking into
account correlation effects and recovery
modeling
Correlation curve specific to the
portfolio underlying the CDO5% - 95% (a)
Private Finance Initiative CDS
(other than CDS on securitization
assets)
Extrapolation from prices based on the
recovery assumptionRecovery rate 60% - 100%
Securitization swaps
Discounted cash flow expected based on
assumptions regarding early redemption on
the underlying portfolio
Early redemption rate 2% - 17%
Sticky CMS/Volatility Bonds Valuation models for interest rate options Mean reversion parameters [1%; 5%]
Callable Spread Options and
Corridor Callable Spread Options
Model representing several interest rate
curve factorsMean reversion spread [10%; 30%]
Spread Lock Swaps and Spread
Lock Options
Bivariate normal model to measure the time
value of Spread Lock options, and replication
for CMS and TEC Forwards
Spread Lock curve,
TEC Forward Volatility and
TEC/CMS correlation
Spread-Lock: [-36 bp, +14 bp]
TEC vol =[50 bp, 70 bp]
TEC-CMS Correl = [70%, 95%]
Capital Protected Notes
Mono-underlying pay-offs, with
capital guarantee, indexed on an
issuer cash/CDS basis, including a
call at par clause at Natixis’
discretion
Model that uses as Inputs the volatility of the
cash-CDS, rescaled for price volatility and
reintegrated in a Black & Scholes model with
a numerical method used to calculate Early
Exercise
Volatility of cash-CDS basis Std: -1.86%; 2.68%
Vol in bp: 227.34; 365.12
Repos and general collateral TRSTRS and repos indexed to a basket
of general collateral equities
Synthetic modeling of the underlying general
collateral basket (with an estimated repo)
and actuarial valuation for TRS or using a
standard Equity/Fixed Income hybrid model
for the TRS autocall
Repo curve for general collateral
baskets General collateral repos: -0.9 to +0.46
Helvetix derivatives
Strip of long-term options, Strip of
quanto options, Strip of digital
options
Options spread and digital options
spread
Black & Scholes model
Gaussian copula
Forex/forex correlation
Long-term USD/CHF & EUR/CHF
volatility
EUR/CHF correlation: 31.63%; 43.46%
Long-term volatility: 9% - 16%
USD/CHF correlation: -73.80%; -
86.90%
Long-term volatility: 9% - 15%
Fund-based derivatives
Pay-offs as Target Volatility
strategy and CPPI on mutual funds
The approach used is a hybrid model coupling
the local volatility-type multi-underlying
equity model with a one-factor Heath-Jarrow-
Morton (HJM1F) interest rate model
Fund dataFund - Interest rate correlation: -25% -
30%
Hybrid fixed income / forex derivatives Long-term PRDC / PRDKO / TARNHybrid fixed income / forex options valuation
model
Correlation between foreign
exchange rates and interest rates
as well as long-term volatility
levels
AUD/JPY and USD/JPY correlation: 15%
- 50%
Long-term volatility: 9% - 16%
Hybrid derivative instruments
Equity/Fixed Income/Forex (FX)
Long (15Y) callable range accrual
note on several asset classes
(equity+forex+fixed income)
Hybrid model coupled with equity, forex and
interest rate diffusion
Correlation parameters (equity-FX,
equity-fixed income, fixed income-
FX)
- EQ/FX = [20%, 50%]
- EQ/IR = 40%
- FX/IR = 30%
Hybrid fixed income/credit derivatives
Long-dated interest rate and credit
callable range accrual notes (15Y)
(default event)
Hybrid model coupled with interest rate
diffusion and credit diffusion
Fixed income-credit and credit
volatility correlation parameters
- Fixed income/Credit correlation: 0%
- Credit Vol: Structured by maturity
([2Y, 200%], [5Y, 60%], [10Y, 50%])
Equity derivativesMulti-underlying pay-offs with long
maturities
Model for valuing volatility options
incorporating correlation between assetsCorrelation inputs Stock/stock correlation: 3.47 - 92.18
Credit derivatives
Interest rate derivatives
(a) All transactions including this kind of data are back-to-back derivatives; the correlation input, which justifies the level-3
classification, is fully hedged.
Natixis’ policy on transfers between fair value levels Transfers between fair value levels are reviewed and validated by ad hoc Committees of representatives of various functions, particularly Finance, Risk and Business Lines. The Committee considers various indicators of market activity and liquidity as described in the General Principles. A review is undertaken for any instrument that ceases to meet these criteria or once again complies with the criteria. Transfers to and from Level 3 are subject to prior validation. Pursuant to this procedure, multi-underlying equity products with residual maturity of between four and five years were transferred to Level 3 of the fair value hierarchy during 2016 (see Note 3.4.1.2).

Financial Data 5 Interim consolidated financial statements and notes
Natixis Update to the 2016 Registration Document 113
Instruments affected by the financial crisis
a) CDS contracted with credit enhancers (monoline insurers and CDPCs) Since December 31, 2015, the valuation model used to measure write-downs on CDS contracted with monoline insurers has moved more in line, in terms of method, with the adjustment made for counterparty risk (Credit Valuation Adjustment – CVA). It also takes account of the expected depreciation of exposures and the counterparty spread implied from the market data. The current method for determining provisions for contracts with CDPCs (Credit Derivatives Product Companies) was refined by applying a transparency-based approach to the underlying assets, based on an estimate of exposure at the time of default, with the PD and LGD based on the tranche’s maturity. A stress factor of 1.2 was applied to the probabilities of default thus determined for the underlyings, based on a recovery rate of 27%. Counterparties are associated with a probability of default whenever the losses resulting from the calculation exceed the CDPC’s net available assets. As the majority of CDPC positions matured at June 30, 2017 and the residual exposure gave rise to a positive valuation, no adjustment was recorded and the general reserve previously recorded was reversed (for €0.6 million). b) Other instruments not exposed to US housing risk measured by Natixis using a valuation
model The section below describes the underlying principles used to value assets resulting from securitization transactions for which no market prices could be identified and which were therefore measured using valuation models: CLOs: A scoring model was used defining the level of risk associated with certain structures based on a series of criteria. Trust Preferred Securities (TruPS) CDOs The valuation model is based on projected future cash flows and default rates determined according to a statistical approach that deduces the default probability of banks according to their financial ratios. For other sectors, default rates are estimated considering the current ratings of assets. Private Finance Initiative CDS (PFI CDS): The valuation model used, for Private Finance Initiative (PFI) CDS, is based on an approach calibrated to the market prices of underlying PFI bonds and the use of a uniform collection rate. 1.4.1 Loans classified as “Loans and receivables” and amounts payable under finance
leases The majority of Natixis’ loans are variable-rate loans, and their fair value is determined on the basis of discounted future cash flows. The discount rate applied for a given loan is the rate at which Natixis would grant a loan with similar characteristics to a similar counterparty at the reporting date. As these are primarily variable-rate loans, the contractual rate is adjusted according to the trend in market lending rates and in counterparty risk.
If there is a quoted price that meets the criteria of IFRS 13, the quoted price is used.
The fair value of loans with an initial term of less than one year is considered to be their book value.
This is also generally the case for financial assets with a term of one year or less and current
accounts.

Financial Data 5 Interim consolidated financial statements and notes
Natixis Update to the 2016 Registration Document 114
1.5 Guarantee mechanism for the assets of the former GAPC hive-off vehicle On November 12, 2009, an arrangement was made by BPCE to protect a portion of the portfolios of the former GAPC hive-off vehicle with retroactive effect at July 1, 2009. With this guarantee mechanism, Natixis was able to free up a significant portion of its equity allocated to segregated assets and to protect itself against the risk of loss from these portfolios subsequent to June 30, 2009. This protective arrangement is based on two mechanisms:
- a sub-participation with the characteristics of a financial guarantee, covering 85% of the face value of assets recognized in “loans and receivables” and “available-for-sale financial assets”. Under this guarantee, Natixis is protected from the very first euro in default up to 85% of the default amount;
- two Total Return Swaps (TRS), one in euros and one in US$, transferring to BPCE 85% of
unrealized and realized gains and losses on the portfolio of instruments at fair value through profit and loss (cash and derivatives) since July 1, 2009. TRS are derivatives and are therefore carried at fair value on the balance sheet, with a matching entry to income. At the same time, Natixis purchases an option from BPCE which, if exercised, allows it to recover the net gains on this portfolio after a ten-year period in return for the payment of a premium estimated at €367 million. The premium is also recognized at fair value.
The amount of the premium paid in 2009 by Natixis in return for the financial guarantee amounted to €1,183 million. Since the unrealized capital losses or write-downs on the assets covered by the guarantee have already been recorded in income, the premium was not immediately taken to income or recognized on a straight-line basis. Instead, the premium is initially recognized on the accruals line and taken to income over the same period, in the same amount and on the same line as:
- reversals of provisions for impairment (in Provision for credit losses); - the deferred recognition of the discount arising on October 1, 2008 on assets reclassified
within “Loans and receivables” at that date pursuant to the amendment to IAS 39 and IFRS 7 published on October 13, 2008.
1.6 Financial liabilities at fair value through profit or loss These include financial liabilities held for trading (including derivative financial instruments) and those designated as at fair value on initial recognition pursuant to the option available under IAS 39. The conditions for applying IAS 39 were described in the amendment to the standard published in June 2005. Financial liabilities in this category are carried at fair value at the reporting date and shown in the balance sheet as “Financial liabilities at fair value through profit or loss”. Changes in fair value are recognized in income for the period under “Net gains or losses on financial instruments at fair value through profit or loss”, except for changes in fair value attributable to own credit risk on financial liabilities at fair value through profit or loss, as such recognition does not create or increase an accounting mismatch. These are recognized in “Revaluation of own credit risk on financial liabilities at fair value through profit or loss” under “Gains and losses recognized directly in other comprehensive income” in accordance with IFRS 9, for which this component was applied early by Natixis as of January 1, 2016 (see the Statement of changes in shareholders’ equity).

Financial Data 5 Interim consolidated financial statements and notes
Natixis Update to the 2016 Registration Document 115
NOTE 2 CONSOLIDATION SCOPE 2.1 Key events Key events for the period are presented in Note 1.2. 2.2 Changes in consolidation scope since January 1, 2017 The main changes in scope since January 1, 2017 were as follows:
2.2.1 Corporate and Investment Banking
Deconsolidated entities
- Deconsolidation of Natixis Corporate Solutions Ltd as of January 1, 2017 as the percentage interest fell below eligible levels.
2.2.2 Investment Solutions
Deconsolidated entities
- Deconsolidation of the following funds in the first quarter of 2017 as the percentage
interest fell below eligible levels:
Ossiam Emerging Market Minimum Variance;
ABP Alternatif Offensif.
- Disposal during the first quarter of 2017 of two private equity entities: Natixis Private
Equity Caspian IA, LP and Natixis Private Equity Caspian IB, LP;
- On March 20, 2017, disposal by NGAM of its holdings in IDFC Asset Management
Company Limited and IDFC AMC Trustee Company Limited. These holdings were
previously held directly by NGAM Asia. As NGAM Asia was a holding company whose
sole purpose was to carry NGAM group’s shares in IDFC, this structure was closed on
March 27, 2017.
Changes in percentage interest
- In the first quarter of 2017, the percentage interest in DNCA Finance, DNCA Courtage
and DNCA Luxembourg fell from 75% to 72% following the increase in Société de Cadres’ holding in DNCA Finance from 3% to 6%;
- In the second quarter of 2017, the interest in Euro Private Equity SA and Euro Private
Equity France increased from 80% to 90% following the acquisition of an additional 10% of the share capital in accordance with the initial protocol agreement signed on the entity’s acquisition;
- In the second quarter of 2017, the interest in Ossiam increased from 64% to 78%

Financial Data 5 Interim consolidated financial statements and notes
Natixis Update to the 2016 Registration Document 116
following the buyout of shares from a manager who left the company.
2.2.3 Specialized Financial Services
Newly consolidated entities
- The holding company Natixis Paiement Holding was consolidated in the first quarter of
2017. This company centralizes holdings in entities in Natixis’ Payments business;
- Acquisition of S-Money and its subsidiary Lakooz, which specialize in new payment methods, from BPCE on February 9, 2017;
- Acquisition of PayPlug, which also specializes in new payment methods, on April 3, 2017.
Restructuring
- Natixis Consumer Finance IT was absorbed by Natixis Financement on April 30, 2017;
- Natixis Consumer Finance was absorbed by Natixis SA on April 30, 2017.
2.2.4 Financial Investments
Deconsolidated entities
- Disposal of IJCOF Corporate on April 7, 2017;
- Disposal of Ellisphère on April 13, 2017;
Restructuring
- Natixis HCP was absorbed by Natixis SA on June 27, 2017.
Changes in percentage interest
- In the first quarter of 2017, the interest in Coface Central Europe Holding increased from
31% to 41% following the reimbursement of capital to minority shareholders. This transaction modified the percentage holdings in Coface Poland CMS and Coface Romania CMS, which also increased from 31% to 41%.
2.2.5 Other Deconsolidated entities
- Liquidation of the securitization vehicle Nordri on June 19, 2017.
2.3 Entities held for sale The assets and liabilities of controlled entities which Natixis intends to sell within a maximum period of 12 months, and for which it is actively seeking a buyer, are identified separately on two specific lines of the consolidated balance sheet as non-current assets and liabilities.

Financial Data 5 Interim consolidated financial statements and notes
Natixis Update to the 2016 Registration Document 117
Natixis had started discussions regarding the disposal of part of its stake in Caspian, entities belonging to the Investment Solutions division. At December 31, 2016, Natixis maintained the full consolidation of its subsidiaries and, in accordance with the provisions of IFRS 5 “Non-current Assets Held for Sale and Discontinued Operations”, combined the assets and liabilities of those entities under two separate balance sheet line items: “Non-current assets held for sale” and “Liabilities associated with non-current assets held for sale”. As the disposal was completed in the first half of 2017, these entities are no longer included in Natixis’ consolidation scope as at June 30, 2017. Natixis had also started discussions regarding the disposal of its subsidiaries Ellisphère and IJCOF, entities belonging to the Corporate Data Solutions division. At December 31, 2016, Natixis had maintained the full consolidation of Ellisphère and, in accordance with the provisions of IFRS 5 “Non-current Assets Held for Sale and Discontinued Operations”, combined the assets and liabilities of that entity under two separate balance sheet line items: “Non-current assets held for sale” and “Liabilities associated with non-current assets held for sale”. IJCOF, consolidated using the equity method, was also treated in accordance with IFRS 5, and the stake was recorded under “Non-current assets held for sale”. As the disposal was completed in the first half of 2017, these entities are no longer included in Natixis’ balance sheet as at June 30, 2017. At December 31, 2016, Natixis had entered into a sale agreement related to one of its life insurance portfolios and securities representing these commitments. The completion of this sale was subject to approval by the ACPR (French Prudential Supervisory Authority). Securities representing insurance commitments initially recognized as “Available-for-sale financial assets” and “Financial assets and liabilities under the fair value option through profit or loss” were reclassified as “Non-current assets held for sale”. In accordance with IFRS 5, the reclassified securities were valued according to the provisions of IAS 39 and the technical provision of insurance commitments was discounted. As Natixis had not received the ACPR’s approval as of June 30, 2017, the accounting treatment under IFRS 5 was maintained.

Financial Data 5 Interim consolidated financial statements and notes
Natixis Update to the 2016 Registration Document 118
NOTE 3 NOTES TO THE BALANCE SHEET 3.1 Financial assets and liabilities designated at fair value through profit and loss
These assets and liabilities are measured at fair value at the reporting date, with changes in value,
including interest, recognized in income under “Net gains or losses on financial instruments at fair
value through profit or loss”, except for changes in fair value attributable to own credit risk on financial
liabilities at fair value through profit or loss, which are recognized as “Revaluation of own credit risk on
financial liabilities at fair value through profit or loss” under other comprehensive income (see Note 5)
for which this component of IFRS 9 is applied early.
3.1.1 Financial assets at fair value through profit or loss
The table below shows the breakdown of financial assets at fair value through profit and loss by instrument type.
In millions of euros Notes 06.30.2017 12.31.2016
Securities held for trading 51,888 46,116
Fixed-income securities 14,210 12,302
Variable-income securities (1) 37,677 33,813
Loans and receivables held for trading 2,678 2,871
Banks 1,372 1,521
Customers 1,306 1,350
Derivative instruments not eligible for hedge accounting (2) 65,205 69,754
Securities at fair value through profit or loss 3.1.3.1 59,343 61,633
Securities 16,137 14,593
Fixed-income 3,274 3,278
Variable-income (1) 12,862 11,316
Reverse repos (2) 43,206 47,040
Loans and receivables under the fair value option
through profit or loss 3.1.3.1 7,112 7,254
Banks 1,825 1,793
Customers 5,287 5,461
Total 186,226 187,628 (1) Including shares in mutual funds. (2) The information presented takes into account the impact of offsetting carried out in accordance with IAS 32 (see Note 3.3).
3.1.2 Financial liabilities at fair value through profit and loss Financial liabilities at fair value through profit and loss primarily comprise derivatives not used as hedging instruments. Securities classified as instruments held for trading essentially comprise short sales of financial assets.
In millions of euros Notes 06.30.2017 12.31.2016
Instruments held for trading 83,323 88,787
Securities 21,956 23,153
Derivative instruments not eligible for hedge accounting (1) 61,275 65,285
Other liabilities 93 349
Instruments designated at fair value through profit or loss 3.1.3.2 55,154 57,439
Securities 18,788 18,564
Repurchased securities (1) 34,592 37,364
Other liabilities 1,773 1,511
Total 138,477 146,226 (1) The information presented takes into account the impact of offsetting carried out in accordance with IAS 32 (see
Note 3.3).
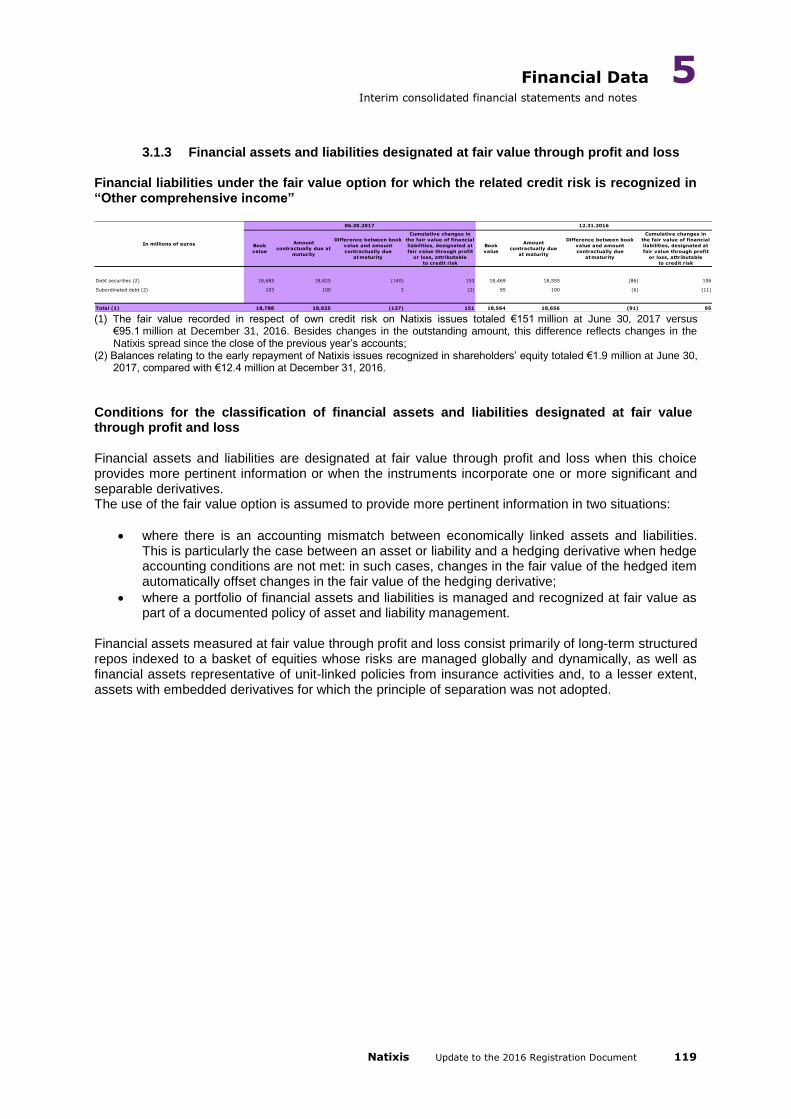
Financial Data 5 Interim consolidated financial statements and notes
Natixis Update to the 2016 Registration Document 119
3.1.3 Financial assets and liabilities designated at fair value through profit and loss Financial liabilities under the fair value option for which the related credit risk is recognized in “Other comprehensive income”
Book
value
Amount
contractually due at
maturity
Difference between book
value and amount
contractually due
at maturity
Cumulative changes in
the fair value of financial
liabilities, designated at
fair value through profit
or loss, attributable
to credit risk
Book
value
Amount
contractually due
at maturity
Difference between book
value and amount
contractually due
at maturity
Cumulative changes in
the fair value of financial
liabilities, designated at
fair value through profit
or loss, attributable
to credit risk
Debt securities (2) 18,685 18,825 (140) 153 18,469 18,555 (86) 106
Subordinated debt (2) 103 100 3 (2) 95 100 (6) (11)
Total (1) 18,788 18,925 (137) 151 18,564 18,656 (91) 95
In millions of euros
06.30.2017 12.31.2016
(1) The fair value recorded in respect of own credit risk on Natixis issues totaled €151 million at June 30, 2017 versus
€95.1 million at December 31, 2016. Besides changes in the outstanding amount, this difference reflects changes in the Natixis spread since the close of the previous year’s accounts;
(2) Balances relating to the early repayment of Natixis issues recognized in shareholders’ equity totaled €1.9 million at June 30, 2017, compared with €12.4 million at December 31, 2016.
Conditions for the classification of financial assets and liabilities designated at fair value through profit and loss Financial assets and liabilities are designated at fair value through profit and loss when this choice provides more pertinent information or when the instruments incorporate one or more significant and separable derivatives. The use of the fair value option is assumed to provide more pertinent information in two situations:
where there is an accounting mismatch between economically linked assets and liabilities. This is particularly the case between an asset or liability and a hedging derivative when hedge accounting conditions are not met: in such cases, changes in the fair value of the hedged item automatically offset changes in the fair value of the hedging derivative;
where a portfolio of financial assets and liabilities is managed and recognized at fair value as part of a documented policy of asset and liability management.
Financial assets measured at fair value through profit and loss consist primarily of long-term structured repos indexed to a basket of equities whose risks are managed globally and dynamically, as well as financial assets representative of unit-linked policies from insurance activities and, to a lesser extent, assets with embedded derivatives for which the principle of separation was not adopted.

Financial Data 5 Interim consolidated financial statements and notes
Natixis Update to the 2016 Registration Document 120
Liabilities valued using the fair value through profit and loss option consist mainly of long-term structured repos indexed to a basket of equities whose risks are managed globally and dynamically, as well as issues originated and structured for customers whose risks and hedges are managed collectively. These issues include significant embedded derivatives for which changes in value are neutralized, except for those allocated to own credit risk, by those of the derivative instruments hedging them.
3.1.3.1 Financial assets designated at fair value
In millions of eurosBook
value
Accounting
mismatch
Managed on a fair value
basisEmbedded derivatives
Book
value
Accounting
mismatch
Managed on a fair value
basisEmbedded derivatives
Loans and receivables due from banks 1,825 1,825 1,793 1,793
Loans and receivables due from customers 5,287 1,816 380 3,091 5,461 1,643 269 3,549
Fixed-income securities 3,274 1,422 287 1,566 3,278 1,526 341 1,411
Variable-income securities 12,862 10,781 2,081 11,316 9,277 2,039
Repurchased securities 43,206 43,206 47,040 47,040
Total 66,455 15,844 45,954 4,657 68,887 14,239 49,689 4,960
06.30.2017 12.31.2016
3.1.3.2 Financial liabilities designated at fair value through profit and loss
In millions of eurosBook
value
Accounting
mismatch
Managed on a fair value
basisEmbedded derivatives
Book
value
Accounting
mismatch
Managed on a fair value
basisEmbedded derivatives
Due to banks 76 6 69 10 10
Customer deposits 34 (1) 35 2 2
Debt securities 18,685 14,766 3,919 18,469 15,166 3,303
Subordinated debt 103 103 95 95
Repurchased securities 34,592 675 33,917 37,364 677 36,687
Other liabilities 1,663 1,664 1,499 1,500
Total 55,154 17,110 33,917 4,127 57,439 17,352 36,687 3,400
06.30.2017 12.31.2016
Some liabilities issued and recognized at fair value through profit and loss are covered by a guarantee. The effect of this guarantee is incorporated into the fair value of the liabilities. Available-for-sale financial assets The table below shows available-for-sale financial assets by type of instrument. It discloses the gross value before impairment, the amount of impairment and the carrying amount net of impairment. Available-for-sale financial assets are tested for impairment at the end of each reporting period (i.e. every quarter). When there is objective evidence of impairment and a reduction in fair value has previously been recognized in equity, the aggregate impairment loss is removed from equity and taken to income.

Financial Data 5 Interim consolidated financial statements and notes
Natixis Update to the 2016 Registration Document 121
In millions of euros 06.30.2017 12.31.2016
Loans outstanding 15 16
- Loans and receivables 15 16
- Accrued interest 0
Securities 55,936 55,538
- Fixed-income 47,231 47,611
- Variable-income (1) 8,185 7,363
- Accrued interest 520 564
Total available-for-sale financial assets before impairment 55,951 55,554
Impairment of available-for-sale assets (502) (563)
- Loans and receivables (15) (14)
- Fixed-income securities (38) (36)
- Variable-income securities (2) (449) (513)
Total 55,449 54,990
(1) Including shares in UCITS; (2) In first-half 2017, permanent impairment of variable-income securities stood at €8 million compared with €36 million at
June 30, 2016. This expense involves insurance portfolios for €3 million (€29 million at June 30, 2016), the impact of which is neutralized given the profit-sharing mechanism. The first-half 2017 expense can be broken down into additional impairment on securities previously impaired for €7 million including €2 million on insurance portfolios (versus €11 million at June 30, 2016 including €4 million on insurance portfolios) and an allowance of €1 million for newly impaired securities in accordance with the application of analysis criteria, primarily applicable to insurance portfolios (versus €25 million at June 30, 2016, in accordance with automatic criteria as defined in the accounting principles and methods, exclusively applicable to insurance portfolios).
3.2 Offsetting financial assets and liabilities The table below presents the amounts offset on the Natixis balance sheet meeting the criteria set out in IAS 32, as well as the impacts linked to the existence of an enforceable right of set-off under a master netting arrangement or similar agreements that do not meet the criteria set out in IAS 32 dealing with offsetting. The gross offset amounts reflect derivatives and repurchase agreements with clearing houses for which the criteria set out in IAS 32 are met:
- For derivatives, the information is presented in consideration of the effects of the currency offset between asset valuations and liability valuations of the derivatives;
- For asset switches that have similar nominal amounts and identical maturities and currencies, Natixis presents these transactions as a single financial asset or liability;
- As regards repurchase agreements, Natixis records on its balance sheet the net value of repurchase and reverse repurchase agreements that:
are entered into with the same clearing house; have the same maturity date; involve the same custodian; are made in the same currency.
The impacts linked to the existence of an enforceable right of set-off under master netting arrangements or similar agreements correspond to derivative amounts or outstanding repos covered by master arrangements under which the net settlement criterion or the simultaneous settlement of assets and liabilities cannot be demonstrated or for which the right to set-off cannot be exercised except in the event of the default, insolvency or bankruptcy of one or more counterparties. These amounts are not offset on the balance sheet. Guarantees received and given in the form of the securities shown in the “Financial instruments” column are recognized at fair value.

Financial Data 5 Interim consolidated financial statements and notes
Natixis Update to the 2016 Registration Document 122
3.2.1 Financial assets
In millions of euros
Gross amount
of financial
assets
recognized in
the balance
sheet (1)
Gross amount
of offset
financial
liabilities
Net amount of
financial
assets
recognized in
the balance
sheet
Gross amount
of financial
assets
recognized in
the balance
sheet (1)
Gross amount
of offset
financial
liabilities
Net amount of
financial
assets
recognized in
the balance
sheet
(a) (b) (c) = (a) - (b) (a) (b) (c) = (a) - (b)
Financial assets at fair value
through profit or loss113,044 24,348 88,696
116,535 24,130 92,405
Derivatives 70,230 17,347 52,882 68,257 16,628 51,629
Repurchase agreements 42,815 7,001 35,814 48,278 7,502 40,776
Other financial instruments
Hedging derivatives 2,404 2,202 2023,308 3,077 231
Loans and receivables due from
banks5,102 300 4,802
4,236 4,236
Repurchase agreements 5,102 300 4,802 4,236 4,236
Other financial instruments
Customer loans and receivables42,119 7,196 34,923
47,815 12,572 35,243
Repurchase agreements 42,119 7,196 34,923 47,815 12,572 35,243
Other financial instruments
TOTAL 162,669 34,047 128,622 171,894 39,779 132,115
06.30.2017 31.12.2016
(1) Gross amount of financial assets offset or covered by a master netting or similar arrangement.
In millions of euros
Net amount of
financial
assets
recognized in
the balance
sheet
Financial
instruments
Guarantees
received in
cash
Net exposure
Net amount of
financial
assets
recognized in
the balance
sheet
Financial
instruments
Guarantees
received in
cash
Net exposure
(c) (1)(e) =
(c) - (d)(c) (1)
(e) =
(c) - (d)
Derivatives 53,084 37,665 11,056 4,363 51,860 34,036 12,057 5,767
Repurchase agreements 75,538 75,375 7 156 80,255 80,053 44 158
Other financial instruments
TOTAL 128,622 113,041 11,063 4,519 132,115 114,089 12,101 5,925
06.30.2017 31.12.2016
Amounts not offset related to
(a)
(d)
Amounts not offset related to
(a)
(d)
Including collateral received in the form of securities.
3.2.2 Financial liabilities
In millions of euros
Gross amount
of financial
liabilities
recognized in
the balance
sheet (1)
Gross amount
of offset
financial
assets
Net amount of
financial
liabilities
recognized in
the balance
sheet
Gross amount
of financial
liabilities
recognized in
the balance
sheet (1)
Gross amount
of offset
financial
assets
Net amount of
financial
liabilities
recognized in
the balance
sheet
(a) (b) (c) = (a) - (b) (a) (b) (c) = (a) - (b)
Financial liabilities at fair value
through profit and loss 100,614 24,187 76,428 103,696 23,874 79,822
Derivatives 68,408 17,186 51,222 66,918 16,372 50,546
Repurchase agreements 32,206 7,001 25,205 36,778 7,502 29,276
Other financial instruments
Hedging derivatives 2,549 2,364 1853,640 3,333 307
Due to banks 21,090 300 20,790 11,318 11,318
Repurchase agreements 21,090 300 20,790 11,318 11,318
Other financial instruments
Customer deposits 50,830 7,196 43,634 51,791 12,572 39,219
Repurchase agreements 50,830 7,196 43,634 51,791 12,572 39,219
Other financial instruments
TOTAL 175,083 34,047 141,036 170,445 39,779 130,666
06.30.2017 31.12.2016
(1) Gross amount of financial liabilities offset or covered by a master netting or similar arrangement.

Financial Data 5 Interim consolidated financial statements and notes
Natixis Update to the 2016 Registration Document 123
In millions of euros
Net amount of
financial
liabilities
recognized in
the balance
sheet
Financial
instruments
Guarantees
given in cash Net exposure
Net amount of
financial
liabilities
recognized in
the balance
sheet
Financial
instrumentsGuarantees
given in cash Net exposure
(c) (1)(e) =
(c) - (d)(c) (1)
(e) =
(c) - (d)
Derivatives 51,407 37,410 10,469 3,529 50,853 34,957 11,768 4,128
Repurchase agreements 89,629 89,250 1 378 79,814 79,535 8 271
Other financial instruments
TOTAL 141,036 126,660 10,470 3,906 130,667 114,492 11,776 4,399
Amounts not offset
related to (a)
(d)
Amounts not offset
related to (a)
(d)
06.30.2017 12.31.2016
(1) Including collateral received in the form of securities.
3.3 Fair value of financial assets and liabilities carried at fair value in the balance sheet The table below presents the fair value of all financial assets recognized at fair value in the balance sheet. The fair value of financial assets carried at fair value in the balance sheet is broken down according to the hierarchy of inputs used to value the assets, as described in Note 1.4.1.
3.3.1 Fair value of financial assets carried at fair value in the balance sheet
Book value Level 1 Level 2 Level 3 Book value Level 1 Level 2 Level 3
Financial assets held for trading 119,771 48,589 67,628 3,554 118,741 40,575 73,616 4,549
Securities held for trading 51,888 47,801 3,910 177 46,116 39,653 6,206 257
o/w fixed-income securities 14,210 11,422 2,611 177 12,302 9,034 3,011 257
o/w variable-income securities 37,677 36,378 1,299 33,813 30,619 3,195
Derivative instruments not eligible for
hedge accounting (positive fair value)65,205 788 62,013 2,404 69,754 922 65,883 2,949
o/w interest rate derivatives 41,010 0 40,918 91 38,544 0 38,461 83
o/w currency derivatives 17,817 100 16,906 811 22,199 5 21,199 995
o/w credit derivatives 1,542 755 787 1,434 572 861
o/w equity derivatives 4,093 579 2,806 708 6,520 738 4,778 1,004
o/w other 744 109 628 7 1,057 179 873 5
Other financial assets held for trading 2,678 1,706 972 2,871 1,527 1,344
Financial assets under the fair value option
through profit or loss66,455 11,625 51,460 3,370 68,887 11,088 54,908 2,891
Securities under the fair value option
through profit or loss16,137 11,625 1,924 2,588 14,593 11,088 1,226 2,280
o/w fixed-income securities 3,274 650 787 1,837 3,278 642 1,112 1,524
o/w variable-income securities 12,862 10,975 1,137 751 11,316 10,446 114 756
Other financial assets under the fair value
option through profit or loss50,318 49,536 782 54,294 53,683 611
Hedging derivatives (assets) 1,242 1,242 1,220 1,220
o/w interest rate derivatives 1,242 1,242 1,220 1,220
o/w currency derivatives
Available-for-sale financial assets 55,449 46,529 4,392 4,528 54,990 46,600 4,428 3,962
Available-for-sale securities - Equity
investments1,138 97 1,041 979 100 0 879
Other available-for-sale securities 54,310 46,431 4,392 3,487 54,010 46,500 4,428 3,081
o/w fixed-income securities 47,710 40,907 3,693 3,111 48,139 41,864 3,298 2,977
o/w variable-income securities 6,600 5,525 699 377 5,871 4,637 1,131 104
Other available-for-sale financial assets 1 1
Total 242,917 106,743 124,723 11,451 243,838 98,263 134,173 11,401
Assets
In millions of euros
At June 30, 2017 At December 31, 2016
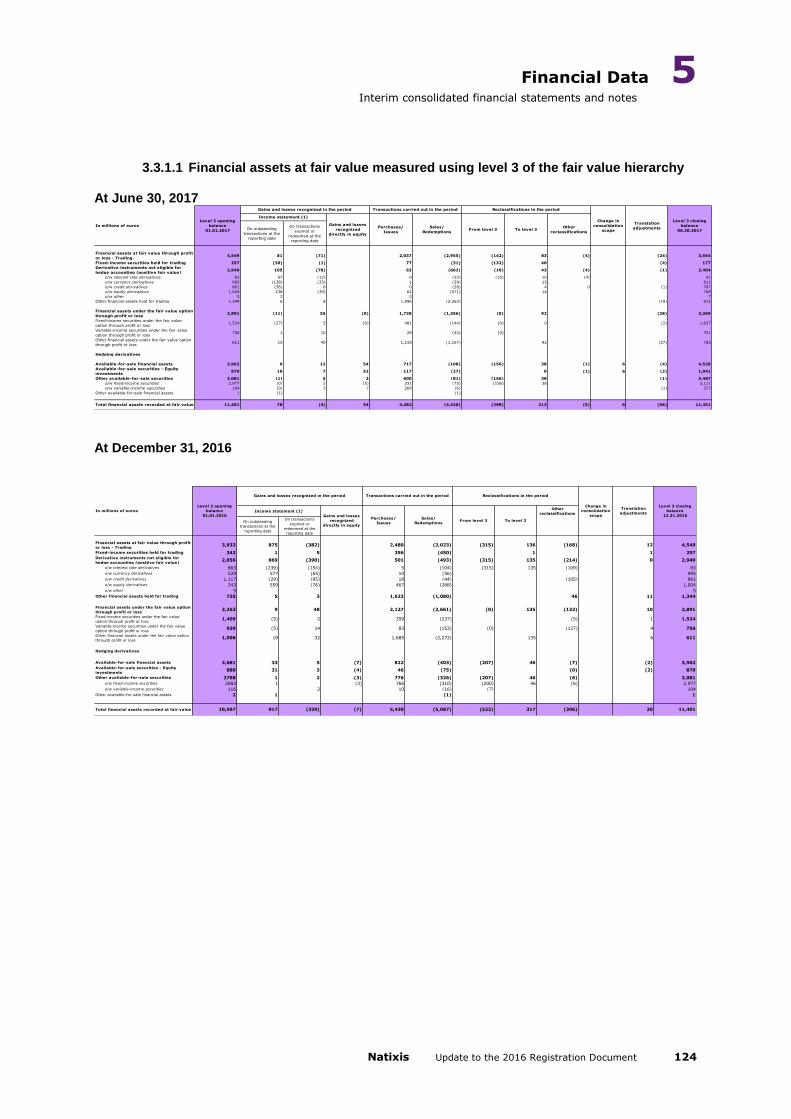
Financial Data 5 Interim consolidated financial statements and notes
Natixis Update to the 2016 Registration Document 124
3.3.1.1 Financial assets at fair value measured using level 3 of the fair value hierarchy
At June 30, 2017
On outstanding
transactions at the
reporting date
On transactions
expired or
redeemed at the
reporting date
Financial assets at fair value through profit
or loss - Trading4,549 81 (71) 2,037 (2,955) (142) 83 (4) (24) 3,554
Fixed-income securities held for trading 257 (30) (1) 77 (31) (132) 40 (4) 177
Derivative instruments not eligible for
hedge accounting (positive fair value)2,949 105 (78) 63 (662) (10) 43 (4) (1) 2,404
o/w interest rate derivatives 83 57 (12) 0 (33) (10) 10 (4) 91
o/w currency derivatives 995 (138) (33) 1 (29) 15 811
o/w credit derivatives 861 (56) 6 0 (28) 4 0 (1) 787
o/w equity derivatives 1,004 238 (39) 62 (571) 14 708
o/w other 5 2 0 7
Other financial assets held for trading 1,344 6 8 1,896 (2,263) (19) 972
Financial assets under the fair value option
through profit or loss2,891 (11) 55 (0) 1,728 (1,356) (0) 92 (28) 3,369
Fixed-income securities under the fair value
option through profit or loss1,524 (27) 5 (0) 481 (144) (0) 0 (2) 1,837
Variable-income securities under the fair value
option through profit or loss756 1 10 28 (44) (0) 751
Other financial assets under the fair value option
through profit or loss611 15 40 1,218 (1,167) 92 (27) 782
Hedging derivatives
Available-for-sale financial assets 3,962 9 12 54 717 (108) (156) 38 (1) 6 (4) 4,528
Available-for-sale securities - Equity
investments879 10 7 52 117 (27) 0 (1) 6 (3) 1,041
Other available-for-sale securities 3,081 (1) 5 2 600 (81) (156) 38 (1) 3,487
o/w fixed-income securities 2,977 (0) 2 (5) 331 (75) (156) 38 3,111
o/w variable-income securities 104 (0) 3 7 269 (6) (1) 377
Other available-for-sale financial assets 1 (1) (1)
Total financial assets recorded at fair value 11,401 78 (4) 54 4,482 (4,420) (298) 213 (5) 6 (56) 11,451
Level 3 opening
balance
01.01.2017
Gains and losses recognized in the period Transactions carried out in the period Reclassifications in the period
Purchases/
IssuesTo level 3
Level 3 closing
balance
06.30.2017Other
reclassifications
Change in
consolidation
scope
Translation
adjustmentsFrom level 3Sales/
Redemptions
In millions of euros Gains and losses
recognized
directly in equity
Income statement (1)
At December 31, 2016
Other
reclassifications
On outstanding
transactions at the
reporting date
On transactions
expired or
redeemed at the
reporting date
Financial assets at fair value through profit
or loss - Trading3,933 875 (382) 2,480 (2,023) (315) 136 (168) 12 4,549
Fixed-income securities held for trading 343 1 5 356 (450) 1 1 257Derivative instruments not eligible for
hedge accounting (positive fair value)2,856 869 (390) 501 (493) (315) 135 (214) 0 2,949
o/w interest rate derivatives 863 (239) (154) 5 (104) (315) 135 (109) 83
o/w currency derivatives 529 577 (65) 10 (56) 995
o/w credit derivatives 1,117 (29) (95) 18 (44) (105) 861
o/w equity derivatives 343 559 (76) 467 (288) 1,004
o/w other 5 5
Other financial assets held for trading 735 5 3 1,623 (1,080) 46 11 1,344
Financial assets under the fair value option
through profit or loss3,353 9 48 2,127 (2,661) (0) 135 (132) 10 2,891
Fixed-income securities under the fair value
option through profit or loss1,409 (5) 2 359 (237) (5) 1 1,524
Variable-income securities under the fair value
option through profit or loss939 (5) 14 83 (153) (0) (127) 4 756
Other financial assets under the fair value option
through profit or loss1,006 19 32 1,685 (2,272) 135 6 611
Hedging derivatives
Available-for-sale financial assets 3,681 33 5 (7) 822 (403) (207) 46 (7) (2) 3,962Available-for-sale securities - Equity
investments880 31 3 (4) 46 (75) (0) (2) 879
Other available-for-sale securities 2798 1 2 (3) 776 (326) (207) 46 (6) 3,081
o/w fixed-income securities 2683 1 (3) 766 (310) (200) 46 (6) 2,977
o/w variable-income securities 116 2 10 (16) (7) 104
Other available-for-sale financial assets 2 1 (1) 1
Total financial assets recorded at fair value 10,967 917 (329) (7) 5,430 (5,087) (522) 317 (306) 20 11,401
Level 3 closing
balance
12.31.2016Income statement (1)
Gains and losses
recognized
directly in equity
Purchases/
Issues
Sales/
RedemptionsFrom level 3 To level 3
Transactions carried out in the period
Change in
consolidation
scope
Translation
adjustments
Reclassifications in the period
In millions of euros
Gains and losses recognized in the period
Level 3 opening
balance
01.01.2016

Financial Data 5 Interim consolidated financial statements and notes
Natixis Update to the 2016 Registration Document 125
3.3.1.2 Financial assets at fair value: transfer between fair value levels
At June 30, 2017
From Level 1 Level 2 Level 2 Level 3 Level 3
To Level 2 Level 1 Level 3 Level 1 Level 2
Financial assets held for trading 23 36 83 142
Securities held for trading 23 36 40 132
o/w fixed-income securities 20 40 132
o/w variable-income securities 4 36
Derivative instruments not eligible for hedge
accounting (positive fair value)43 10
o/w interest rate derivatives 10 10
o/w currency derivatives 15
o/w credit derivatives 4
o/w equity derivatives 14
o/w other
Other financial assets held for trading
Financial assets under the fair value option
through profit or loss4 92
Securities under the fair value option through
profit or loss4
o/w fixed-income securities 4
o/w variable-income securities
Other financial assets under the fair value option
through profit or loss92
Hedging derivatives (assets)
Available-for-sale financial assets 767 389 38 156
Available-for-sale securities - Equity investments
Other available-for-sale securities 767 389 38 156
o/w fixed-income securities 765 389 38 156
o/w variable-income securities 1
Other available-for-sale financial assets
At June 30, 2017
In millions of euros
At December 31, 2016
From Level 1 Level 2 Level 2 Level 3 Level 3
To Level 2 Level 1 Level 3 Level 1 Level 2
Financial assets held for trading 17 429 136 315
Securities held for trading 17 429 1
o/w fixed-income securities 17 56 1
o/w variable-income securities 373
Derivative instruments not eligible for hedge
accounting (positive fair value)135 315
o/w interest rate derivatives 135 315
o/w currency derivatives
o/w credit derivatives
o/w equity derivatives
o/w other
Other financial assets held for trading
Financial assets under the fair value option
through profit or loss135
Securities under the fair value option through
profit or loss
o/w fixed-income securities
o/w variable-income securities
Other financial assets under the fair value option
through profit or loss135
Hedging derivatives (assets)
Available-for-sale financial assets 312 702 46 207
Available-for-sale securities - Equity investments
Other available-for-sale securities 312 702 46 207
o/w fixed-income securities 291 699 46 200
o/w variable-income securities 21 3 0 7
Other available-for-sale financial assets
In millions of euros
At December 31, 2016
Sensitivity analysis of the fair value of financial instruments measured according to Level 3 – Assets and Liabilities

Financial Data 5 Interim consolidated financial statements and notes
Natixis Update to the 2016 Registration Document 126
Sensitivity of the fair value of financial instruments measured using unobservable inputs was estimated at June 30, 2017. With the aid of probable assumptions, this sensitivity was used to estimate the impacts of market fluctuations in uncertain economic environments. This estimate was performed using: a “standardized
[1]" variation in unobservable inputs related to assumptions of additional valuation
adjustments for fixed income, currency and equity instruments. The resulting sensitivity was €16.8 million;
a flat variation of:
- +/-50 basis points applied to the margin used for the discounted cash flow expected on TruPS CDOs.
i.e. a sensitivity impact representing a valuation increase of €9.5 million (reflecting an improvement in the above-mentioned inputs) or a valuation decrease of €9.1 million (reflecting a deterioration in said inputs)
[2].
3.3.2 Fair value of financial liabilities carried at fair value in the balance sheet
Book value Level 1 Level 2 Level 3 Book value Level 1 Level 2 Level 3
Financial liabilities held for trading 83,323 22,495 60,002 826 88,787 22,868 65,089 830
Securities issued for trading purposes 21,945 21,546 399 23,137 22,113 1,024
Derivative instruments not eligible for
hedge accounting (negative fair value)61,275 949 59,499 826 65,285 756 63,700 830
o/w interest rate derivatives 37,600 12 37,413 175 35,176 31 34,949 197
o/w currency derivatives 17,055 109 16,893 52 20,728 1 20,672 54
o/w credit derivatives 948 609 340 844 420 424
o/w equity derivatives 5,376 725 4,393 259 8,071 523 7,394 154
o/w other 295 103 192 466 201 265
Other financial liabilities issued for trading
purposes103 103 0 365 365
Financial liabilities under the fair value
option through profit or loss55,154 1,292 52,884 977 57,439 1,170 55,498 771
Securities under the fair value option through
profit or loss18,788 18,486 302 18,564 18,471 93
Other financial liabilities under the fair value
option through profit or loss36,365 1,292 34,398 675 38,875 1,170 37,027 678
Hedging derivatives (liabilities) 1,787 1,787 2,011 2,011 1
o/w interest rate derivatives 1,787 1,787 2,011 2,011 1
o/w currency derivatives
o/w credit derivatives
Total 140,264 23,787 114,673 1,803 148,238 24,039 122,598 1,601
At December 31, 2016Liabilities
In millions of euros
At June 30, 2017
3.3.2.1 Financial liabilities at fair value measured using level 3 of the fair value hierarchy At June 30, 2017 In millions of euros
Level 3 opening
balance
01.01.2017
Gains and losses
recognized in the
period
Transactions
carried out in the
period
Reclassifications
in the period
Change in
consolidation
scope
Translation
adjustments
Level 3 closing
balance
06.30.2017
Income statement
Gains and losses
recognized
directly in equity
Purchases/
Issues
Sales/
RedemptionsFrom level 3 To level 3
Other
reclassifications
On outstanding
transactions at the
reporting date
On transactions
expired or
redeemed at the
reporting date
Financial liabilities at fair value through
profit or loss - Trading 830(286) (15) 344 (81) (13) 47 0 826
Securities issued for trading purposes
Derivative instruments not eligible for
hedge accounting (negative fair value) 830(286) (15) 344 (81) (13) 47 0 826
o/w interest rate derivatives 197 9 (3) (2) (20) (6) 0 175
o/w currency derivatives 54 (8) (8) 11 (10) (2) 16 52
o/w credit derivatives 424 (56) (6) 2 (25) 0 340
o/w equity derivatives 154 (230) 2 333 (27) (5) 31 259
o/w other derivatives
Other financial liabilities issued for trading
purposes
Financial liabilities under the fair value
option through profit or loss 77184 (79) 802 (601) 977
Securities under the fair value option through
profit or loss 93(3) 215 (2) 302
Other financial liabilities under the fair value
option through profit or loss 67887 (79) 588 (599) 675
Hedging derivatives
Total financial liabilities recognized at fair
value1,601 (201) (93) 1,146 (682) (13) 47 0 1,803
[1]
i.e. the standard deviation of consensus prices used to measure the inputs. [2]
Impact determined before taking the BPCE guarantee into account.

Financial Data 5 Interim consolidated financial statements and notes
Natixis Update to the 2016 Registration Document 127
At December 31, 2016
On outstanding
transactions at the
reporting date
On transactions
expired or
redeemed at the
reporting date
Financial liabilities at fair value through
profit or loss - Trading 1,560 (27) (409) 111 (194) (48) 52 (216) 830
Securities issued for trading purposes 24 (12) 13 (18) (6)
Derivative instruments not eligible for
hedge accounting (negative fair value) 1,536 (14) (408) 99 (176) (42) 52 (216) 830
o/w interest rate derivatives 707 (20) (212) 41 (66) (11) (1) (242) 197
o/w currency derivatives 17 43 2 (8) 54
o/w credit derivatives 504 (14) (82) 0 (59) (3) 53 25 424
o/w equity derivatives 308 (23) (115) 56 (43) (28) 154
o/w other derivatives
Other financial liabilities issued for trading
purposes
712 72 (48) 664 (633) 3 771
Financial liabilities under the fair value
option through profit or loss 36 (6) (1) 68 (3) 93
Securities under the fair value option through
profit or loss 676 79 (47) 596 (629) 3 678
Other financial liabilities under the fair value
option through profit or loss
Hedging derivatives 0
Total financial liabilities recognized at fair
value2,272 45 (456) (0) 776 (827) (48) 55 (216) 0 1,601
Level 3 opening
balance
01.01.2016
Gains and losses
recognized
directly in equity
Other
reclassifications
Reclassifications in the period
Change in
consolidation
scope
Transactions carried out in the period
Sales/
Redemptions
Translation
adjustmentsTo level 3
Level 3 closing
balance
12.31.2016
In millions of eurosFrom level 3
Gains and losses recognized in the period
Income statement
Purchases/
Issues
3.3.2.2 Financial liabilities at fair value: transfer between fair value levels At June 30, 2017
From Level 1 Level 2 Level 2 Level 3
To Level 2 Level 1 Level 3 Level 2
Financial liabilities held for trading 32 47 13
Securities issued for trading purposes 32
Derivative instruments not eligible for hedge
accounting (negative fair value)47 13
o/w interest rate derivatives 6
o/w currency derivatives 16 2
o/w credit derivatives
o/w equity derivatives 31 5
o/w other
Other financial liabilities issued for trading
purposes
Financial liabilities under the fair value
option through profit or loss
Securities under the fair value option through
profit or loss
Other financial liabilities under the fair value
option through profit or loss
Hedging derivatives (liabilities)
In millions of euros
At June 30, 2017
At December 31, 2016
From Level 1 Level 2 Level 2 Level 3
To Level 2 Level 1 Level 3 Level 2
Financial liabilities held for trading 5 2 53 48
Securities issued for trading purposes 5 2 6
Derivative instruments not eligible for hedge
accounting (negative fair value)53 42
o/w interest rate derivatives 1 11
o/w currency derivatives
o/w credit derivatives 53 3
o/w equity derivatives 0 28
o/w other
Other financial liabilities issued for trading
purposes
Financial liabilities under the fair value
option through profit or loss (2)3
Securities under the fair value option through
profit or loss
Other financial liabilities under the fair value
option through profit or loss3
Hedging derivatives (liabilities)
In millions of euros
At December 31, 2016

Financial Data 5 Interim consolidated financial statements and notes
Natixis Update to the 2016 Registration Document 128
3.4 Loans and receivables due from banks and customers and Due to banks and customer
deposits
3.4.1 Loans and receivables due from banks
In millions of euros 06.30.2017 12.31.2016
Outstanding 39,736 58,854
Performing loans 39,668 58,783
Non-performing loans 68 71
Provisions (70) (71)
Total 39,665 58,783
The fair value of loans and receivables due from banks totaled €40,155 million at June 30, 2017, compared with €59,281 million at December 31, 2016.
3.4.2 Customer loans and receivables
In millions of euros 06.30.2017 12.31.2016
Outstanding 129,938 142,454
Performing loans (1) 125,884 137,920
Non-performing loans (2) 4,054 4,534
Provisions (2,041) (2,151)
Total 127,897 140,303
The fair value of loans and receivables due from customers totaled €128,347 million at June 30, 2017, compared with €140,566 million at December 31, 2016. (1) This change corresponds mainly to repurchase agreements for €6.7 billion, and primarily relates to international platforms; (2) Non-performing loans were covered by sureties amounting to €1,310 million at June 30, 2017, compared with €1,510 million at December 31, 2016.
3.4.3 Due to banks
In millions of euros 06.30.2017 12.31.2016
Current accounts and accrued interest 5,356 6,726
Accounts and deposits 79,551 75,642
Repurchased securities 23,918 18,780
Other liabilities 55 60
Accrued interest 132 165
Total 109,013 101,374
The fair value of amounts due to banks totaled €109,301 million at June 30, 2017, compared with €101,514 million at December 31, 2016.

Financial Data 5 Interim consolidated financial statements and notes
Natixis Update to the 2016 Registration Document 129
3.4.4 Customer deposits
In millions of euros 06.30.2017 12.31.2016
Current accounts 20,546 21,700
Accounts and deposits 12,265 15,965
Repurchased securities 44,438 45,599
Special savings accounts 191 179
Factoring accounts 2,240 2,335
Accrued interest 60 60
Other 930 634
Total 80,670 86,472
The fair value of amounts due to customers was €80,665 million at June 30, 2017, compared with €86,511 million at December 31, 2016. 3.5 Held-to-maturity financial assets
06.30.2017 31.12.2016
Government securities
Gross value 1,096 1,104
Provisions
Net government securities 1,096 1,104
Bonds
Gross value 847 964
Provisions (2) (2)
Net bonds 845 962
Total 1,941 2,066
In millions of euros
The fair value of held-to-maturity financial assets totaled €2,290 million at June 30, 2017, compared with €2,479 million at December 31, 2016. 3.6 Goodwill At June 30, 2017
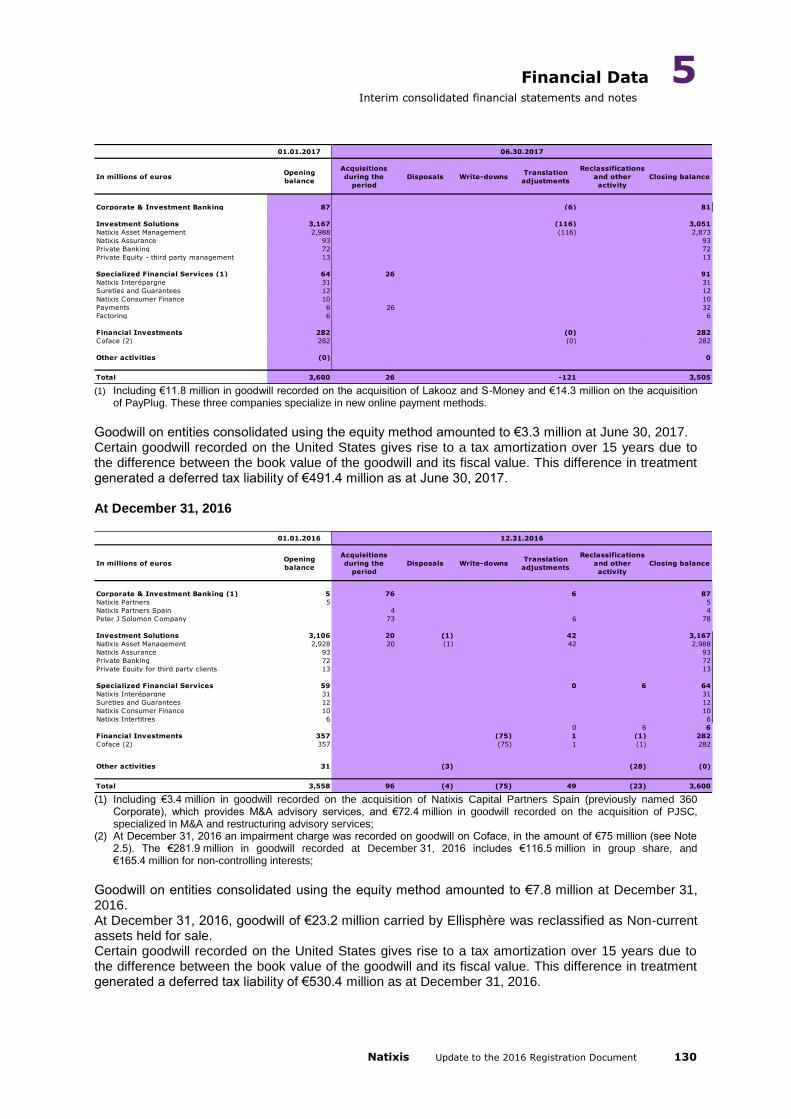
Financial Data 5 Interim consolidated financial statements and notes
Natixis Update to the 2016 Registration Document 130
01.01.2017
In millions of eurosOpening
balance
Acquisitions
during the
period
Disposals Write-downsTranslation
adjustments
Reclassifications
and other
activity
Closing balance
Corporate & Investment Banking 87 (6) 81
Investment Solutions 3,167 (116) 3,051
Natixis Asset Management 2,988 (116) 2,873
Natixis Assurance 93 93
Private Banking 72 72
Private Equity - third party management 13 13
Specialized Financial Services (1) 64 26 91
Natixis Interépargne 31 31
Sureties and Guarantees 12 12
Natixis Consumer Finance 10 10
Payments 6 26 32
Factoring 6 6
Financial Investments 282 (0) 282
Coface (2) 282 (0) 282
Other activities (0) 0
Total 3,600 26 -121 3,505
06.30.2017
(1) Including €11.8 million in goodwill recorded on the acquisition of Lakooz and S-Money and €14.3 million on the acquisition
of PayPlug. These three companies specialize in new online payment methods.
Goodwill on entities consolidated using the equity method amounted to €3.3 million at June 30, 2017. Certain goodwill recorded on the United States gives rise to a tax amortization over 15 years due to the difference between the book value of the goodwill and its fiscal value. This difference in treatment generated a deferred tax liability of €491.4 million as at June 30, 2017. At December 31, 2016
01.01.2016
In millions of eurosOpening
balance
Acquisitions
during the
period
Disposals Write-downsTranslation
adjustments
Reclassifications
and other
activity
Closing balance
Corporate & Investment Banking (1) 5 76 6 87
Natixis Partners 5 5
Natixis Partners Spain 4 4
Peter J Solomon Company 73 6 78
Investment Solutions 3,106 20 (1) 42 3,167
Natixis Asset Management 2,928 20 (1) 42 2,988
Natixis Assurance 93 93
Private Banking 72 72
Private Equity for third party clients 13 13
Specialized Financial Services 59 0 6 64
Natixis Interépargne 31 31
Sureties and Guarantees 12 12
Natixis Consumer Finance 10 10
Natixis Intertitres 6 6
0 6 6
Financial Investments 357 (75) 1 (1) 282
Coface (2) 357 (75) 1 (1) 282
Other activities 31 (3) (28) (0)
Total 3,558 96 (4) (75) 49 (23) 3,600
12.31.2016
(1) Including €3.4 million in goodwill recorded on the acquisition of Natixis Capital Partners Spain (previously named 360
Corporate), which provides M&A advisory services, and €72.4 million in goodwill recorded on the acquisition of PJSC, specialized in M&A and restructuring advisory services;
(2) At December 31, 2016 an impairment charge was recorded on goodwill on Coface, in the amount of €75 million (see Note 2.5). The €281.9 million in goodwill recorded at December 31, 2016 includes €116.5 million in group share, and €165.4 million for non-controlling interests;
Goodwill on entities consolidated using the equity method amounted to €7.8 million at December 31, 2016. At December 31, 2016, goodwill of €23.2 million carried by Ellisphère was reclassified as Non-current assets held for sale. Certain goodwill recorded on the United States gives rise to a tax amortization over 15 years due to the difference between the book value of the goodwill and its fiscal value. This difference in treatment generated a deferred tax liability of €530.4 million as at December 31, 2016.

Financial Data 5 Interim consolidated financial statements and notes
Natixis Update to the 2016 Registration Document 131
3.7 Debt securities Debt securities (interest-bearing notes, interbank market securities, etc.) are broken down by type of security, excluding subordinated securities which are included within “Subordinated debt”. These debts are initially recorded at their fair value and then valued at amortized cost.
In millions of euros 06.30.2017 12.31.2016
Money market instruments 33,464 44,420
Bonds 2,828 2,700
Other debt securities 1,767 1,770
Accrued interest 42 31
Total 38,101 48,921
The fair value of debt securities amounted to €37,880 million at June 30, 2017, compared with €48,694 million at December 31, 2016. 3.8 Provisions and impairment
3.8.1 Summary of provisions and impairment
In millions of euros 01.01.2017 Increase
Reversals
(utilized
provisions) (1)
Reversals
(surplus
provisions) (2)
Translation
adjustments
Changes in
scope Other (3) 06.30.2017
Provisions for impairment deducted from
assets 3,285327 (165) (304) (58) (2) 59 3,143
Provisions for loans and receivables (1) (2) 2,185 241 (163) (147) (48) 3 2,071
Impairment losses taken on
available-for-sale financial assets 563 13 (1) (123) (0) (2) 52 502
Other impairment 536 73 (1) (34) (10) 0 4 570
Provisions recognized in liabilities 2,268 177 (113) (57) (66) 0 (21) 2,189
Contingency reserves 1,994 174 (113) (57) (66) 0 (21) 1,913
Provisions for current taxes 273 3 (0) 276
Total 5,553 504 (277) (361) (124) (2) 39 5,332 The amounts shown in the above table include write-downs of assets held by life insurance companies. They are shown without the impact of changes in insurance company technical reserves. (1) Including €118 million in reversals used due to disposals of receivables during the first half (versus €122 million at
December 31, 2016); (2) Including €6 million in reversals not used due to disposals of receivables during the first half (versus €30 million at
December 31, 2016); (3) Including -€16 million in the first half of the year relating to changes in actuarial assumptions for employee benefits
recorded directly in non-recyclable other comprehensive income.
3.8.2 Contingency reserves
In millions of euros 01.01.2017 Increase
Reversals
(surplus
provisions)
Reversals
(utilized
provisions)
Translation
adjustments
Changes in
scopeOther 06.30.2017
Counterparty risks 741 44 (8) (0) (58) 720
Financing and guarantee commitments 51 26 (5) (2) 71
Legal disputes (1) 676 15 (1) (0) (55) 635
Other provisions 14 3 (2) (1) 14
Impairment risks 55 5 (5) (4) (0) 50
Long-term investments 41 2 (4) (3) (0) 36
Other provisions 14 3 (1) (1) 14
Employee benefit obligations 793 51 (2) (85) (5) (17) 735
Operational risks (2) 405 74 (41) (24) (3) (4) 408
Total 1,994 174 (57) (113) (66) (21) 1,913 (1) of which €435.8 million in provisions at June 30, 2017 in respect of Madoff net outstandings, compared with €479.9 million
at December 31, 2016; (2) of which €3.3 million at June 30, 2017 in respect of the workforce adjustment plan completed in 2015, versus €5.5 million at
December 31, 2016.

Financial Data 5 Interim consolidated financial statements and notes
Natixis Update to the 2016 Registration Document 132
3.9 Subordinated debt Subordinated debt differs from advances and bonds issued in that it is repaid after all senior and unsecured creditors, but before the repayment of participating loans and securities and deeply subordinated securities. Subordinated debt is valued at amortized cost.
In millions of euros 06.30.2017 31.12.2016
Dated subordinated debt (1) 3,434 3,907
Undated subordinated debt 261 261
Accrued interest 19 40
Total 3,714 4,208
(1) Subordinated debt issue agreements do not incorporate a clause providing for early redemption in the event that the covenants are not observed.
The fair value of subordinated debt amounted to €4,061 million at June 30, 2017, compared with €4,558 million at December 31, 2016. Changes in subordinated debt over the period
In millions of euros 01.01.2017 Issues Redemptions (1)Translation
adjustments
Changes in
scope
Other
(2)06.30.2017
Other dated subordinated debt 3,907 0 (500) (0) 26 3,434
Subordinated notes 1,157 0 (500) (0) 26 678
Subordinated loans 2,750 2,755
Other undated subordinated debt 261 261
Deeply subordinated notes
Subordinated notes 10 10
Subordinated loans 251 251
Total 4,168 0 (500) (0) 26 3,695 This table does not include accrued interest. (1) Redemptions comprised the expiry of an EMTN issued in 2006 on January 20, 2017, for -€500 million; (2) Other changes mainly pertained to the revaluation of debts subject to hedging and variations in intra-group securities held
by Natixis Funding for the purposes of market making with respect to Natixis’ debt on the secondary market.

Financial Data 5 Interim consolidated financial statements and notes
Natixis Update to the 2016 Registration Document 133
NOTE 4 NOTES TO THE INCOME STATEMENT 4.1 Interest margin “Interest and similar income” and “Interest and similar expenses” comprise interest on fixed-income securities recognized as available-for-sale financial assets, and interest on loans and receivables to and from banks and customers. These line items also include interest on held-to-maturity financial assets. Financial assets and liabilities valued at amortized cost give rise to the recognition of interest calculated using the effective interest rate method. Negative interest is deducted from interest income when income from a financial asset debt instrument is negative and is deducted from interest expenses when income from a financial liability debt instrument is positive.
Income Expenses Net Income Expenses Net
Central banks 154 (54) 100 105 (32) 73
Securities 551 (224) 327 575 (155) 420
Loans and receivables 1,911 (838) 1,073 1,654 (657) 997
Banks 209 (381) (172) 195 (341) (146)
Customers 1,469 (423) 1,046 1,281 (309) 973
Finance leases 233 (33) 199 177 (6) 171
Subordinated debt 0 (44) (44) 0 (74) (74)
Hedging instruments 401 (503) (102) 142 (316) (174)
Interest accrued or due on derivatives 401 (503) (102) 142 (316) (174)
Interest accrued on impaired loans and receivables
(including restructured items)14 0 14 7 0 7
Total 3,031 (1,663) 1,368 2,484 (1,234) 1,250
In millions of euros
H1 2017 H1 2016
4.2 Net fee and commission income The method of accounting for fees and commissions received in respect of services or financial instruments depends on the ultimate purpose of the services rendered and the method of accounting for the financial instruments to which the service relates. Fees and commissions for one-off services, such as business provider commissions, are recognized in income as soon as the service is provided. Fees and commissions for ongoing services such as guarantee commissions or management fees are recognized over the service period. Fiduciary or similar fees and commissions are those that result in assets being held or invested on behalf of individual customers, pension schemes or other institutions. In particular, trust transactions cover Asset Management and custody activities performed on behalf of third parties. Fees and commissions that form an integral part of the effective yield on an instrument, such as fees on financing commitments given or loan set-up fees, are recognized and amortized as an adjustment to the effective interest rate over the estimated term of the applicable loan. These fees and commissions are recognized as interest income rather than fee and commission income.
Income Expenses Net Income Expenses Net
Interbank transactions 1 (15) (14) 1 (17) (16)
Customer transactions 384 (1) 383 318 (2) 317
Securities transactions 74 (107) (33) 64 (94) (30)
Payment services 189 (27) 162 179 (22) 158
Financial services 216 (372) (155) 175 (354) (179)
Fiduciary transactions 1,622 0 1,622 1,512 0 1,512
Financing, guarantee, securities and derivatives commitments 159 (68) 92 111 (73) 38
Other 166 (503) (337) 162 (468) (307)
Total 2,813 (1,094) 1,719 2,522 (1,029) 1,493
H1 2017 H1 2016
In millions of euros

Financial Data 5 Interim consolidated financial statements and notes
Natixis Update to the 2016 Registration Document 134
The premium paid to BPCE in respect of the guarantee given against former GAPC assets classified as “Loans and receivables” and “Available-for-sale financial assets” is recognized in expenses pro rata to the write-back of the provisions and the discounts recognized in respect of reclassifications during the period. At June 30, 2017, the expense in respect of the premium as recognized under guarantee commissions was €0.2 million versus -€0.2 million at June 30, 2016. 4.3 Gains and losses on financial instruments at fair value through profit or loss This item includes gains and losses on financial assets and liabilities at fair value through profit and loss, whether held for trading or designated at fair value through profit and loss, including interest. Hedging derivatives and revaluation of hedged items include changes in the fair value of derivatives classified as fair value hedges, including interest, plus the symmetrical revaluation of the items hedged. They also include the “ineffective” portion of cash flow hedges.
In millions of euros H1 2017H1 2016
Restated (*)
Net gains/(losses) on financial assets and liabilities excluding hedging
derivatives1,785 904
Net gains/(losses) on financial assets and liabilities held for trading (2) 1,219 1,394
Net gains/(losses) on other financial assets and liabilities under the fair value option through
profit or loss582 (518)
Other (3) (15) 28
Hedging instruments and revaluation of hedged items (6) 0
Ineffective portion of cash flow hedges (CFH) 1 0
Ineffective portion of fair value hedges (FVH) (7) 1
Changes in fair value of fair value hedges 9 (181)
Changes in fair value of hedged items (16) 182
Total (1) 1,779 904
(*) Data restated for the impact of the early application of the provisions of IFRS 9 “Financial instruments” on financial liabilities at fair value through profit or loss as from January 1, 2016.
(1) Insofar as the expenses and income presented in the income statement are classified by type and not by function, the net income of activities on financial instruments at fair value through profit and loss should be considered as a whole. The results presented above do not include the refinancing cost of these financial instruments, which is recorded in interest income or expenses.
(2) “Net gains/(losses) on financial assets and liabilities held for trading” include:
- Impairments taken against the fair value of CDS entered into with monoline insurers, which decreased cumulative impairments by €9.6 million in first-half 2017, versus an expense of €17 million at June 30, 2016 (excluding the currency impact and the impact of the BPCE guarantee), bringing cumulative impairments to €61.3 million at June 30, 2017 versus €111.7 million at June 30, 2016;
- A reversal of the full portfolio-based provision recorded on exposures in respect of CDPCs (Credit Derivative Product Companies) was recorded at June 30, 2017 in the amount of €0.6 million. At June 30, 2016, a €0.1 million reversal was carried out, bringing the cumulative balance to €4.3 million.
- At June 30, 2017, recognized own credit risk adjustments to derivatives (debit valuation adjustments or DVA) stood at -€50.3 million versus an expense of -€22.2 million at June 30, 2016. Furthermore, credit risk adjustments related to the valuation of counterparty risk (credit valuation adjustments or CVA) on financial assets amounted to €65.9 million (income) at June 30, 2017 versus an expense of -€40.8 million at June 30, 2016.
- The Funding Valuation Adjustment (FVA) used on uncollateralized derivatives or imperfectly collateralized derivatives is also recognized on this line in the amount of €24.6 million (income) at June 30, 2017 versus income of €48.4 million at June 30, 2016.
(3) Income of €47.1 million was recorded at June 30, 2016 corresponding to the recycling of foreign exchange gains and losses arising on the reimbursement by certain entities of capital in foreign currencies or equity items treated as capital.
4.4 Net gains or losses on available-for-sale financial assets Net gains or losses on available-for-sale financial assets principally comprise gains or losses on sales of securities, and permanent losses in value on variable-income securities.

Financial Data 5 Interim consolidated financial statements and notes
Natixis Update to the 2016 Registration Document 135
Variable-income securities classified as available-for-sale are tested for impairment whenever their carrying value exceeds their recoverable value. Impairment of fixed-income securities is charged to the “Provision for credit losses”. This line item also includes dividends payable on variable-income securities.
In millions of euros H1 2017 H1 2016
Dividends 79 78
Gains or losses on disposals 242 87
Impairment of variable-income securities (8) (36)
Discounts on syndicated loans 0 1
Total 313 130
4.5 Other income and expenses Income and expenses from other operations mainly comprise income and expenses relating to finance leases and investment property. This item also includes income and expenses relating to insurance and reinsurance activities, in particular life insurance premium income, paid benefits and claims, and changes in insurance liabilities.
Income Expenses Net Income Expenses Net
Finance leases 167 (214) (46) 165 (179) (14)
Investment property 64 (21) 44 90 (44) 46
Sub-total real estate activities 232 (234) (3) 255 (223) 31
Insurance income and expenses (1) 5,760 (6,151) (391) 15,783 (15,385) 398
Operating leases 46 (36) 10 42 (31) 11
Other related income and expenses (2) 155 (194) (39) 215 (117) 98
Total 6,193 (6,616) (424) 16,294 (15,756) 538
H1 2017 H1 2016In millions of euros
(1) The share in insurance income and expenses relating to the partnership with CNP Assurances regarding receivables
arising on reinsurance activities linked to reinsured policies amounted to €11.7 billion at June 30, 2016.
(2) Including an expense of €25 million recorded in respect of an ongoing legal dispute concerning formula-based investment funds, taking the total provision recognized for this dispute to €35 million at June 30, 2017.
4.6 Operating expenses Operating expenses mainly comprise payroll costs, including wages and salaries net of rebilled expenses, social security expenses and employee benefits such as pensions (defined benefit plans), and expenses relating to share-based payment recognized in accordance with IFRS 2. This item also includes all administrative expenses and external services.

Financial Data 5 Interim consolidated financial statements and notes
Natixis Update to the 2016 Registration Document 136
H1 2017 H1 2016
Payroll costs Wages and salaries (1) (1,333) (1,251)
o/w share-based payments (2) (41) (12)
Pensions and other long-term employee benefits (135) (116)
Social security expenses (327) (290)
Incentive and profit-sharing plans (80) (81)
Payroll-based taxes (78) (78)
Other (5) (6)
Total payroll costs (1,958) (1,823)
Other operating expenses Taxes, levies and regulatory contributions (3) (4) (273) (224)
External services (985) (923)
Other (29) (44)
Total other operating expenses (1,287) (1,191)
Total (3,245) (3,014)
In millions of euros
(1) Of which €4.4 million in respect of the Competitiveness and Employment Tax Credit at June 30, 2017 versus €3.2 million at
June 30, 2016; (2) The amount recognized in H1 2017 in respect of retention and performance plans includes an expense of -€34.3 million
(versus -€11.7 million at June 30, 2016) for the portion of compensation paid in cash and indexed to the Natixis share price and an additional expense of -€6.8 million (versus -€0.1 million at June 30, 2016) for the portion of compensation settled in Natixis shares.
(3) Taxes, levies and regulatory contributions include the systemic risk tax for €24.3 million at June 30, 2017 (versus €29.1 million at June 30, 2016) and regulatory contributions mostly including the contribution to the SRF (Single Resolution Fund) for €121.3 million at June 30, 2017 (versus €114.1 million at June 30, 2016).
(4) Including the Social Security and Solidarity Contribution (C3S) for €47.6 million at June 30, 2017 (€27.8 million at June 30, 2016), of which a non-recurrent additional expense of €19 million for the Investment Solutions division linked to a partnership with CNP Assurances.
4.7 Provision for credit losses This line item mainly reflects net risk recorded on lending transactions: net provisions for reversals of individual and collective provisions, loans and receivables written off during the period and recoveries on bad debts written off. It also includes any impairments recorded in respect of proven default risks associated with counterparties of OTC instruments.
ChargesNet
reversals
Write-offs
not covered
by provisions
Recoveries of
bad debts
written off
Net ChargesNet
reversals
Write-offs
not covered
by provisions
Recoveries of
bad debts
written off
Net
Contingency reserves (44) 5 (0) (40) (5) 11 7
Financing commitments (26) 5 (21) (3) 6 3
Other (18) (0) (0) (18) (1) 6 4
(196) 116 (21) 3 (98) (268) 97 (30) 18 (183)
Provision for credit losses (240) 121 (21) 3 (138) (273) 109 (30) 18 (176)
o/w Reversals of surplus impairment provisions 121 109
Reversals of utilized impairment
provisions161 191
Sub-total reversals Sub-total reversals: 282 300
Write-offs covered by provisions 161 - 191 -
Total net reversals Total net reversals: 121 109
H1 2016H1 2017
In millions of euros
Provisions for impairments of
financial assets

Financial Data 5 Interim consolidated financial statements and notes
Natixis Update to the 2016 Registration Document 137
4.8 Gains or losses on other assets This item comprises capital gains and losses on the disposal of property, plant and equipment and intangible assets used in operations, as well as capital gains and losses on the disposal of investments in consolidated companies.
In millions of euros
Investments
in
consolidated
companies (1)
Property, plant and
equipment and
intangible assets (2)
TOTAL
Investments in
consolidated
companies (3)
Property, plant and
equipment and
intangible assets (4)
TOTAL
Net capital gains/(losses) on disposals 31 (4) 27 30 30 60
Total 31 (4) 27 30 30 60
06.30.2017 06.30.2016
(1) Including +€21.5 million on the disposal of Ellisphère and IJCOF, and +€9.9 million on the disposal of the two Caspian
private equity companies; (2) Including -€4.5 million following the decommissioning of software; (3) Including +€10.9 million on the disposal of HCP NA LLC and Altus, +€17.5 million on the disposal of Capital Growth
Management, +€2.3 million on the disposal of Snyder and -€0.6 million relating to the dissolution of Kobrick Funds LLC; (4) Including a capital gain of +€31.5 million (+€20.6 million net of tax) on the sale of a building in the first half of 2016.
4.9 Reconciliation of the tax expense in the financial statements and the theoretical tax
expense
H1 2017 H1 2016 (*)
+ Net income/(loss) Group share 768 608
+ Net income/(loss) attributable to non-controlling interests 57 6
+ Income tax charge 469 398
+ Impairment of goodwill 0 75
- Share in income of associates (13) (14)
1,281 1,073
+/- Permanent differences (1) 203 148
= Consolidated taxable income/(loss) 1,484 1,221
x Theoretical tax rate 33.33% 33.33%
= Theoretical tax charge (495) (407)
+ Contributions and minimum annual tax charges (4) (5)
+ Income taxed at reduced rates (1) 0
+ Losses for the period not recognized for deferred tax purposes (17) (14)
+ Impact of tax consolidation 19 0
+ Differences in foreign subsidiary tax rates 30 (1)
+ Tax credits 18 20
+ Prior year tax (2) (13) 49
+ Other items (3) (6) (40)
= Tax charge for the period (469) (398)
o/w taxes payable (369) (166)
deferred tax (100) (232)
In millions of euros
= Consolidated net income/(loss) before tax, goodwill amortization and share in income
of associates
(*) Data restated for the impact of the early application of the provisions of IFRS 9 “Financial instruments” on financial liabilities at fair value through profit or loss as from January 1, 2016. (1) Permanent differences include the impacts of the SBT (systemic banking tax) and SRF (single resolution), both of which
are non-deductible expenses. (2) Including in 2016: +€42.5 million in tax income from previous years arising from legal decisions (in particular the
decision of the French Constitutional Council of February 3, 2016 and the favorable conclusions of the Council of State’s legal advisor), which led to a correction of the tax treatment of dividend income received and taxed in 2012.
(3) Of which: +€59.3 million on the use of previously unrecognized tax losses (€3.3 million in June 2016) and -€32.5 million in taxes on dividend income (-€20.9 million at June 30, 2016).

Financial Data 5 Interim consolidated financial statements and notes
Natixis Update to the 2016 Registration Document 138
NOTE 5 STATEMENT OF CHANGES IN GAINS AND LOSSES RECORDED DIRECTLY IN OTHER COMPREHENSIVE INCOME
In millions of euros H1 2017H1 2016
Restated (*)
Revaluation adjustments on defined-benefit plans 16 (54)
Other changes 16
Revaluation of own credit risk on financial liabilities at fair value through profit or loss (59) (42)
Other changes (59)
Share of gains and losses recognized directly in the equity of associates not recyclable to income
Other changes
Items not recyclable to income (43) (96)
Translation adjustments (392) (157)
Reclassification to income (10) (43)
Other changes (382) (114)
Revaluation of available-for-sale financial assets (14) 228
Reclassification to income (74) (11)
Other changes 61 239
Revaluation of hedging derivatives 102 (95)
Reclassification to income 97 42
Other changes 5 (138)
(1) 3
(0) 0
(0) 2
Items recyclable to income (304) (21)
Tax (8) (6)
TOTAL (354) (124)
Share of gains and losses recognized directly in the equity of associates recyclable to income
Reclassification to income
Other changes
(*) Data restated for the impact of the early application of the provisions of IFRS 9 “Financial instruments” on financial liabilities
at fair value through profit or loss as from January 1, 2016. The impact on items not recyclable to income was -€42 million gross (no impact was reported in the financial statements at June 30, 2016). Taxes relating from this restatement amounted to +€14.5 million.

Financial Data 5 Interim consolidated financial statements and notes
Natixis Update to the 2016 Registration Document 139
NOTE 6 SEGMENT REPORTING In 2012, in light of regulatory constraints and the persistently uncertain economic environment, Natixis forged ahead with its transformation policy. In particular, in terms of Corporate and Investment Banking, its organization was adapted to place customer relations at the center of its development and, as a result, the division previously named Wholesale Banking is now known as “Corporate & Investment Banking”. The entity has since been organized around three core businesses:
- Corporate and Investment Banking, which advises businesses, institutional investors, insurance companies, banks and public sector entities and offers them a diversified line of financing solutions as well as access to the capital markets. Its duties are threefold: to strengthen the bank’s customer orientation, to serve as a meeting place between issuers and investors and to roll out the “Originate to Distribute” model to optimize the rotation of the bank’s balance sheet via active management of the loan book;
- Investment Solutions, which includes Asset Management, Insurance, Private Banking and the Private Equity business line for third party clients that resulted from the spin-off of Natixis Private Equity in 2010;
- Specialized Financial Services, which includes Factoring, Lease Financing, Consumer Credit, Guarantees, Film Industry Finance, Employee Benefits Planning, and Payment and Securities Services. These services are the key growth drivers for the retail banking business of Groupe BPCE.
This organizational structure was confirmed as part of Natixis’ 2014-2017 Strategic Plan, “New Frontier”.
Coface, Corporate Data Solutions, Private Equity businesses (proprietary funds and share of sponsored funds) and Natixis Algérie are managed as financial holdings as they have fewer synergies with Natixis’ other businesses. In 2011, Coface refocused on its core business lines (credit insurance and factoring in Germany and Poland), grouped under Coface. Non-strategic activities (primarily service activities) stemming from Coface were grouped under Corporate Data Solutions and were managed directly by Natixis’ Finance Department. These activities had been entirely sold off as of June 30, 2017 (see Note 6.5). Based on this new organization, Management monitors divisional performance, draws up business plans and manages the business from an operational perspective. In accordance with IFRS 8 “Operating Segments”, this is the segmentation used by Natixis to define its operating segments. 6.1 Corporate and Investment Banking Corporate & Investment Banking advises businesses, institutional investors, insurance companies, banks and public sector entities and offers them a diversified line of customized financing solutions as well as access to the capital markets. Building on the technical expertise of its teams, combined with its widely recognized, award-winning research capabilities, Natixis designs tailored solutions for its customers incorporating the most recent market developments. In 2016, its organizational structure was adapted to better support its customers, by strengthening strategic dialog, and to accelerate the implementation of the “Originate to Distribute” model. This led to the creation of two new business lines:

Financial Data 5 Interim consolidated financial statements and notes
Natixis Update to the 2016 Registration Document 140
- Investment Banking, whose mission is to develop strategic dialog with customers and
incorporates the business lines “Acquisition & Strategic Finance”, Capital & Rating Advisory, Equity Capital Markets, Strategic Equity Transactions and Corporate Loan Structuring. It also includes Bond origination;
- Global Finance which combines all the players in the “Originate to Distribute” chain:
Loan origination;
Loan syndication;
Portfolio Management. The Equities, Fixed Income, Credit, Forex, Commodities and “Global Structured Credit and Solutions” businesses remain part of the Global Markets business line and the Trade Finance and the developing of the flow offering are part of “Global Transaction Banking”. 6.2 Specialized Financial Services This business line combines a number of service-oriented businesses primarily serving the Caisse d’Epargne and Banque Populaire networks, as well as Natixis customers:
- Factoring: provides companies with credit management solutions such as financing, insurance, and collection. Natixis Factor uses the Banque Populaire and Caisse d’Epargne networks, which account for a significant portion of its business;
- Sureties & Financial Guarantees: this business line is operated by Compagnie Européenne
de Garanties et Cautions (CEGC). It notably includes: guarantees for mortgage loans granted to retail and business customers by the Caisse d’Epargne Network, and more recently the Banque Populaire network, along with legal guarantees and financial guarantees;
- Consumer finance: this Natixis business line includes a broad range of activities across the
entire value chain for revolving loans (marketing, origination, administrative management, out-of-court collection, etc.) and administrative management services for personal loans. These activities are operated by Natixis Financement, which manages revolving loans granted by the Groupe BPCE networks and manages personal loans granted by the Caisses d’Epargne and by the Banque Populaire banks;
- Leasing: this business line provides financing solutions for real estate and non-real estate
assets under finance leases or other long-term leasing arrangements;
- Employee Benefits Planning: this business line offers a comprehensive range of B2B employee benefits planning products based on employee savings (administration of employee accounts, fund administration and accounting) and securities services;
- Securities Services: this business line offers back and middle office services for retail
securities custody (account administration, back office outsourcing, office services, depositary control) for the BPCE networks and external clients;
- Payments: this business line provides payments tools, infrastructure and services, including
electronic banking, issuance and collection of high-volume electronic transfers and check processing;
- Film Industry Financing: this business line is operated via Coficiné, a subsidiary specializing
in structured loans for film and audiovisual activities in France and Europe.

Financial Data 5 Interim consolidated financial statements and notes
Natixis Update to the 2016 Registration Document 141
6.3 Investment Solutions
- Asset Management: asset management activities are combined within Natixis Global Asset Management. They cover all asset categories and are carried out mainly in the US and France. These activities are performed by autonomous entities (specialized asset management companies and specialized distribution units) coordinated by a holding company that ensures the organization’s consistency by overseeing its strategic direction. These companies are thus able to focus on their core business and on achieving robust performance while retaining the option of developing their own institutional clientele and drawing on the business line’s other support functions, based on appropriate economic models. A number of them have forged a strong reputation, such as Loomis Sayles, Harris Associates, AEW, DNCA and Natixis Asset Management. Together, these specialized asset management companies enable the Group to provide a full range of expertise meeting demand from all customer segments. Coverage of the various customer segments is optimized by the organization of distribution around the NGAM Distribution platform and the business franchises developed over the long term by the Asset Management companies, mainly with various client groups. The management companies continue to handle distribution via the shareholder retail banking networks in France;
- Insurance: Natixis Assurances is a holding company for various operating insurance
subsidiaries. In March 2014, in accordance with the plan to develop the bancassurance model, Natixis Assurance acquired the PPI and casualty insurance subsidiary BPCE Assurances. It offers a comprehensive range of individual and collective life insurance, personal protection insurance and property and casualty insurance solutions. These diversified, customized solutions are designed for retail and small business customers, farmers, companies and associations;
- Private Banking: this business line encompasses wealth management activities in France
and Luxembourg, financial planning solutions, and services for independent wealth management advisors (IWMAs). Banque Privée 1818, created from the merger between Banque Privée Saint Dominique (BPSD) and La Compagnie 1818, has taken its place as a major player on the French market. The bank mainly develops its customer base from the clientele of the Caisses d’Epargne and Banque Populaire banks, and to a lesser extent from that of Natixis. Private Banking offers advisory services, financial planning and expertise, and fund management solutions;
- Private Equity for third party clients: at the start of 2014, NCI’s asset management
companies were transferred to Natixis Global Asset Management and a sponsoring vehicle was set up to monitor Natixis’ commitments in the funds. The teams have extensive expertise in equity financing for generally unlisted, small and medium-sized enterprises in France and Europe via sponsored equity holdings. This business line covers the Private Equity segments for third party investors, such as Private Equity deals (top-line funding for mature companies), venture capital (new, innovative companies) and funds of funds.
6.4 Coface Coface's main activities are credit insurance, international factoring solutions, business information and ratings (credit and marketing), receivables management (from issuance through to collection), and management of public procedures on behalf of the French State. Most of Coface’s revenue is derived from its international operations. Since 2011, Coface has refocused on its core business lines (credit insurance and factoring in Germany and Poland). Natixis carried out an initial public offering on 58.65% of Coface’s share capital in June 2014.

Financial Data 5 Interim consolidated financial statements and notes
Natixis Update to the 2016 Registration Document 142
6.5 Other Financial Investments Other Financial Investments notably include:
- The Private Equity business (non-core activities), covering proprietary private equity transactions and Natixis’ share of certain sponsored funds not held by Natixis. Since the October 2010 sale to AXA Private Equity of the majority of the proprietary operations in France, the international segment (divided into several small teams of investors) has been gradually divested, with the most recent divestment carried out in the second quarter of 2015. The teams have extensive expertise in equity financing for generally unlisted, small and medium-sized enterprises outside France via equity holdings;
- Corporate Data Solutions: Coface’s non-core activities (service activities mainly) were grouped under Corporate Data Solutions at the beginning of 2013. As of 30 June 2017, following the disposal of Ellisphère and IJCOF Corporate in the first half of 2017 (see Note 2.3), Corporate Data Solutions no longer held any entities;
- Natixis’ subsidiary in Algeria. 6.6 Corporate Center The Corporate Center operates alongside the operating divisions. It recognizes the central funding mechanisms and income from Natixis’ asset and liability management. To this end, it includes all Treasury activities, including the short-term Treasury business, which has been part of Natixis’ Finance department since the start of 2017 (it was previously part of Corporate & Investment Banking). It also records income on the bank’s portfolio of equity investments not belonging to a division. In terms of costs, the Corporate Center recognizes the bank’s structural costs, certain restructuring costs not allocated to the businesses and the contribution to the Single Resolution Fund.

Financial Data 5 Interim consolidated financial statements and notes
Natixis Update to the 2016 Registration Document 143
6.7 Segment reporting in the income statement
06.30.2017
Corporate and
Investment
Banking
Investment
Solutions
(*)
Specialized
Financial
Services
Coface
Other
Financial
investments
Corporate
Center (**)Total
In millions of euros [1] [2] [3] [4] [5] [7]
Net revenues 1,945 1,811 691 277 32 1 4,756
2016/2017 change 17% 9% 1% -4% -35% -101% 11%
Expenses -1,082 -1,266 -459 -265 -33 -261 -3,365
2016/2017 change 9% 8% 3% -3% -22% 28% 8%
Gross operating income 864 545 232 13 -2 -260 1,392
2016/2017 change 28% 12% -3% -24% -126% -6% 21%
Provision for credit losses -78 1 -35 -4 -6 -15 -138
2016/2017 change -37% 900% 20% 31% -70% -1025% -22%
Net operating income 786 545 197 9 -8 -275 1,254
2016/2017 change 43% 12% -6% -36% -49% 0% 29%
Associates 5 7 0 0 13
2016/2017 change -31% 22% -7%
Other 8 0 22 -3 27
2016/2017 change -48% -100% -100% 100% -294% -281%
Pre-tax profit 791 561 197 10 14 -278 1,294
2016/2017 change 42% 10% -18% -116% -424% 2% 33%
Net income (Group share) 545 312 134 2 29 -255 768
2016/2017 change 45% 3% -15% -106% -1070% 14% 32% (*) o/w for asset management: Net revenues: €1,363 million
Expenses: -€965 million Gross operating income: €398 million Provision for credit losses: €0 million Pre-tax profit: €397 million
(**) o/w for short-term treasury: Net revenues: €71 million Expenses: -€33 million Gross operating income: €38 million Provision for credit losses: €0 million Pre-tax profit: €38 million
Breakdown of net revenues
In millions of euros Net revenues (1) 2016/2017 change
Corporate and Investment Banking 1,945 16.6%
Capital Markets (1) 1,090 19.3%
Global Finance and Investment Banking 872 13.5%
Other -18 26.2%
Investment Solutions 1,811 9.3%
Asset Management 1,363 9.2%
Insurance 364 12.9%
Private Banking 64 -5.5%
Other 20 10.7%
Specialized Financial Services 691 1.0%
Specialized Financing 437 2.6%
Financial Services 254 -1.6%
Coface 277 -4.1%
Other Financial investments 32 -34.7%
Corporate Center 1 -102.7%
Total 4,756 11% (1) Including €1,138 million excluding the net revenues of the XVA desks, which break down into €758 million in net revenues for
FICT and €380 million for Equities.

Financial Data 5 Interim consolidated financial statements and notes
Natixis Update to the 2016 Registration Document 144
In millions of euros
Corporate and
Investment
Banking (*)
Investment
Solutions
(**)
Specialized
Financial
Services
Coface
Other
Financial
investments
Corporate
Center
(***)
Total
Net revenues 1,669 1,656 684 289 48 -30 4,316
Expenses -994 -1,169 -446 -272 -43 -204 -3,127
Gross operating income 675 487 238 17 6 -234 1,189
Provision for credit losses -124 0 -29 -3 -21 2 -176
Net operating income 550 487 209 14 -16 -232 1,013
Associates 8 6 0 0 14
Other 16 31 -75 11 2 -15
Pre-tax profit 558 509 240 -61 -4 -230 1,012
Net income (Group share) 376 304 157 -30 -3 -196 608
06.30.2016 - pro forma
(*) o/w for short-term treasury: Net revenues: €50 million
Expenses: -€30 million Gross operating income: €20 million Provision for credit losses: €0 million Pre-tax profit: €19 million
(**) o/w for asset management: Net revenues: €1,249 million
Expenses: -€909 million Gross operating income: €339 million Provision for credit losses: €0 million Pre-tax profit: €358 million (amount restated against 06.30.2016)
(***) Data restated for the impact of the early application of the provisions of IFRS 9 “Financial instruments” on financial liabilities at fair value through profit or loss as from January 1, 2016. The impact on the Corporate center was as follows: +€42 million on net revenues and +€27.5 million on net income (group share).

Financial Data 5 Interim consolidated financial statements and notes
Natixis Update to the 2016 Registration Document 145
Breakdown of pro forma net revenues at 06.30.2016
In millions of eurosNet revenues
(1) (*)2015/2016 change
Corporate and Investment Banking 1,669 1%
Capital Markets (1) 914 10%
Global Finance and Investment Banking 769 -6%
Other -14 -14%
Investment Solutions 1,656 -1%
Asset Management 1,249 -2%
Insurance 322 9%
Private Banking 67 -4%
Other 18 -42%
Specialized Financial Services 684 4%
Specialized Financing 425 8%
Financial Services 258 -2%
Coface 289 -17%
Other Financial investments 48 -36%
Corporate Center -30 -133%
Total 4,316 -4% (*) These data are presented for the new organization of Corporate & Investment Banking business lines, which has been in place since the second half of 2016. The data have also been restated for the impact of the early application of the provisions of IFRS 9 “Financial instruments” on financial liabilities at fair value through profit or loss as from January 1, 2016. The impact on the Corporate center was +€42 million. (1) Including €888 million excluding net revenues of the XVA desks, which break down into €610 million in net revenues for FICT and €278 million for Equities.
06.30.2016 reported
Corporate and
Investment
Banking (*)
Investment
Solutions (**)
Specialized
Financial
Services
CofaceFinancial
Investments
Corporate
CenterTotal
In millions of euros [1] [2] [3] [4] [5] [7]
Net revenues 1,669 1,656 684 289 48 -72 4,274
2015/2016 change 1% -1% 4% -17% -36% -179% -5%
Expenses -994 -1,169 -446 -272 -43 -204 -3,127
2015/2016 change 4% 1% 4% -2% -37% 104% 5%
Gross operating income 675 487 238 17 6 -276 1,147
2015/2016 change -3% -4% 4% -76% -28% 3189% -24%
Provision for credit losses -124 0 -29 -3 -21 2 -176
2015/2016 change 18% -115% -13% -8% 531% -66% 25%
Pre-tax profit 558 509 240 -61 -4 -272 970
2015/2016 change -7% -2% 22% -190% -82% 388986% -29%
Net income (Group share) 376 304 157 -30 -3 -224 581
2015/2016 change -6% -7% 25% -331% -89% 125% -21% (*) o/w for short-term treasury: Net revenues: €50 million
Expenses: -€30 million Gross operating income: €20 million Provision for credit losses: €0 million Pre-tax profit: €19 million
(**) o/w for asset management: Net revenues: €1,249 million
Expenses: -€909 million Gross operating income: €339 million Provision for credit losses: €0 million Pre-tax profit: €358 million (amount restated against 06.30.2016)

Financial Data 5 Interim consolidated financial statements and notes
Natixis Update to the 2016 Registration Document 146
Breakdown of net revenues
In millions of euros Net revenues 2015/2016 change
Corporate and Investment Banking 1,669 1%
Capital Markets 969 10%
Structured Financing 551 -6%
Commercial Banking 163 -14%
Other -14 100%
Investment Solutions 1,656 -1%
Asset Management 1,249 -2%
Insurance 322 9%
Private Banking 67 -4%
Other 18 -42%
Specialized Financial Services 684 4%
Specialized Financing 425 8%
Financial Services 258 -2%
Coface 289 -17%
Other Financial investments 48 -36%
Corporate Center -72 -179%
Total 4,274 -5% (2) Including €943 million excluding the net revenues of the XVA desks, which break down into €633 million in net revenues for
FICT and €310 million for Equities.

Financial Data 5 Interim consolidated financial statements and notes
Natixis Update to the 2016 Registration Document 147
NOTE 7 RISK MANAGEMENT 7.1 Gross exposure to credit risk The following table sets out the exposure of all of Natixis’ financial assets to credit risk. This exposure does not take into account guarantees, sureties, credit default swaps, collateral on OTC financial instruments, the impact of netting agreements and other credit enhancements. It corresponds to the net value of the financial assets on the balance sheet, after taking all impairments into account (individually or collectively assessed).
In millions of euros Performing loansNon-performing
loansWrite-downs
Net
outstandings
06.30.2017
Net
outstandings
12.31.2016
Financial assets at fair value through profit or loss (excluding variable-
income securities) 135,686 0 0 135,686 142,499
Hedging derivatives 1,242 0 0 1,242 1,220
Available-for-sale financial assets (excluding variable-income securities) 47,679 87 (53) 47,713 48,140
Loans and receivables due from banks 39,668 68 (70) * 39,666 58,783
Customer loans and receivables 125,884 4,054 (2,040) * 127,898 140,303
Held-to-maturity financial assets (1) 1,943 0 (2) 1,941 2,066
Financing commitments given 67,102 156 (2) 67,256 62,631
Financial guarantee commitments given 22,581 158 (69) 22,670 22,307
TOTAL GROSS EXPOSURE 441,785 4,523 (2,236) 444,072 477,949
(1) Including accrued interest (*) Including collective provisions.
7.2 Breakdown by geographic area of individual and collective provisions relating to loans
and advances to banks and customers
In millions of euros Individual Collective Total Write-downs Write-downs Total Individual Collective Total Write-downs Write-downs Total
Geographic areas risks risks risks Individual risks Collective risks Write-downs risks risks risks Individual risks Collective risks Write-downs
France 1,428 8,772 10,199 712 104 816 1,523 8,875 10,398 729 104 833
Other Western European countries 1,200 8,579 9,778 530 88 618 1,430 9,438 10,868 559 84 643
Eastern Europe 137 1,340 1,477 46 10 56 176 1,949 2,125 50 11 61
North America 522 5,374 5,896 124 72 196 852 5,758 6,609 123 81 204
Central and Latin America 243 2,692 2,935 98 22 120 216 1,853 2,069 125 17 141
Africa and the Middle East 557 3,779 4,336 193 53 246 518 4,412 4,930 187 64 251
Asia and Oceania 349 3,809 4,158 65 24 89 395 4,114 4,509 79 24 103
TOTAL 4,436 34,344 38,780 1,769 372 2,142 5,110 36,399 41,509 1,851 384 2,236
06.30.2017 12.31.2016

Financial Data 5 Interim consolidated financial statements and notes
Natixis Update to the 2016 Registration Document 148
7.3 Breakdown of collective provisions by business sector
Business sectors (% breakdown) 06.30.2017 12.31.2016
Oil & gas 18.8% 24.1%
Real estate 12.0% 12.2%
Base industries 7.9% 8.9%
Retail/trade 7.3% 7.7%
Electricity 6.9% 6.4%
Holding companies and conglomerates 6.7% 4.9%
International trade, commodities 4.7% 4.0%
Services 4.5% 3.1%
Media 3.4% 3.1%
Finance 3.0% 2.8%
Transportation 3.0% 2.7%
Pharmaceuticals/Healthcare 2.9% 2.7%
Utilities 2.7% 2.6%
Technology 2.5% 2.5%
Food 2.3% 2.5%
Construction 2.1% 2.0%
Tourism/Hotels/Leisure 2.0% 1.9%
Consumer goods 1.4% 1.7%
Other 1.3% 1.3%
Telecommunications 1.3% 1.2%
Automotive 1.2% 0.8%
Mechanical and electrical engineering 1.1% 0.7%
Administrations 0.9% 0.2%
Aerospace/Arms 0.0% 0.0%
TOTAL 100.0% 100.0% 7.4 Change in collective provisions
In millions of eurosProvisions as
at 12.31.2016
Additions (+)
Reversals (-)
Translation
adjustments
Provisions as
at 06.30.2017
By sector 302 (7) (8) 288
By region 82 4 (2) 84TOTAL 384 (3) (9) 372
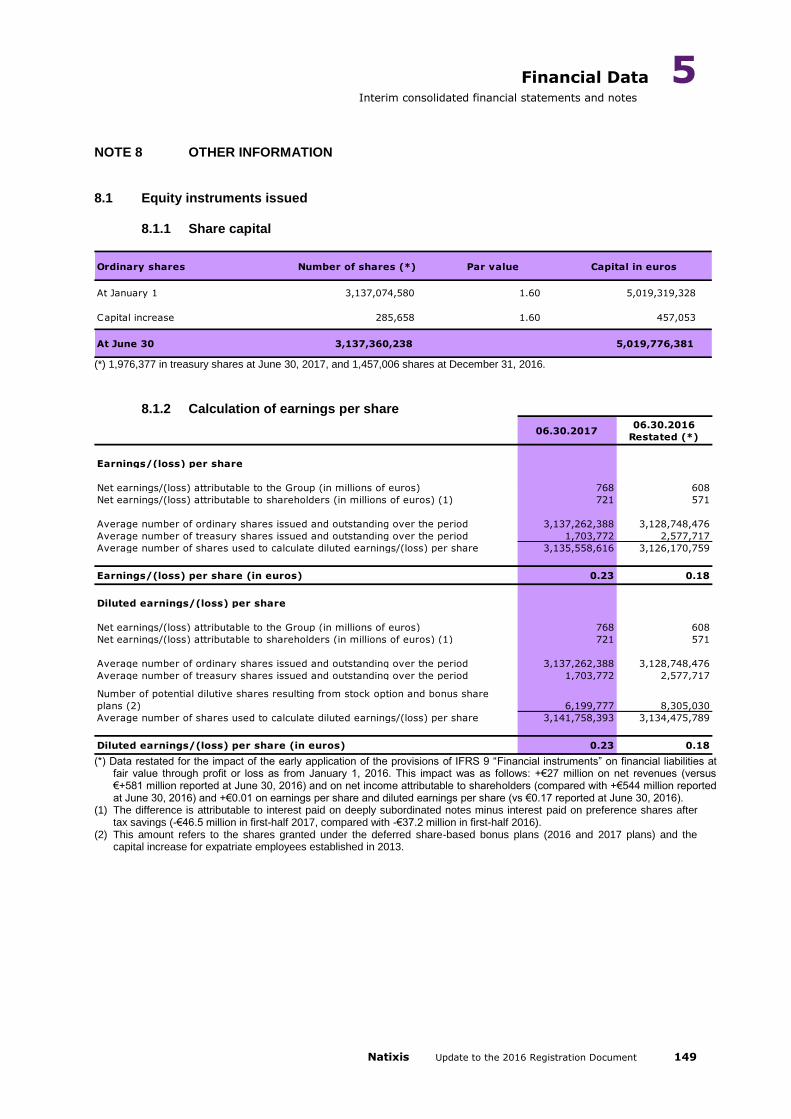
Financial Data 5 Interim consolidated financial statements and notes
Natixis Update to the 2016 Registration Document 149
NOTE 8 OTHER INFORMATION 8.1 Equity instruments issued
8.1.1 Share capital
Ordinary shares Number of shares (*) Par value Capital in euros
At January 1 3,137,074,580 1.60 5,019,319,328
Capital increase 285,658 1.60 457,053
At June 30 3,137,360,238 5,019,776,381
(*) 1,976,377 in treasury shares at June 30, 2017, and 1,457,006 shares at December 31, 2016.
8.1.2 Calculation of earnings per share
06.30.201706.30.2016
Restated (*)
Earnings/(loss) per share
Net earnings/(loss) attributable to the Group (in millions of euros) 768 608
Net earnings/(loss) attributable to shareholders (in millions of euros) (1) 721 571
Average number of ordinary shares issued and outstanding over the period 3,137,262,388 3,128,748,476
Average number of treasury shares issued and outstanding over the period 1,703,772 2,577,717
Average number of shares used to calculate diluted earnings/(loss) per share 3,135,558,616 3,126,170,759
Earnings/(loss) per share (in euros) 0.23 0.18
Diluted earnings/(loss) per share
Net earnings/(loss) attributable to the Group (in millions of euros) 768 608
Net earnings/(loss) attributable to shareholders (in millions of euros) (1) 721 571
Average number of ordinary shares issued and outstanding over the period 3,137,262,388 3,128,748,476
Average number of treasury shares issued and outstanding over the period 1,703,772 2,577,717
Number of potential dilutive shares resulting from stock option and bonus share
plans (2) 6,199,777 8,305,030
Average number of shares used to calculate diluted earnings/(loss) per share 3,141,758,393 3,134,475,789
Diluted earnings/(loss) per share (in euros) 0.23 0.18 (*) Data restated for the impact of the early application of the provisions of IFRS 9 “Financial instruments” on financial liabilities at
fair value through profit or loss as from January 1, 2016. This impact was as follows: +€27 million on net revenues (versus €+581 million reported at June 30, 2016) and on net income attributable to shareholders (compared with +€544 million reported at June 30, 2016) and +€0.01 on earnings per share and diluted earnings per share (vs €0.17 reported at June 30, 2016).
(1) The difference is attributable to interest paid on deeply subordinated notes minus interest paid on preference shares after tax savings (-€46.5 million in first-half 2017, compared with -€37.2 million in first-half 2016).
(2) This amount refers to the shares granted under the deferred share-based bonus plans (2016 and 2017 plans) and the capital increase for expatriate employees established in 2013.

Financial Data 5 Interim consolidated financial statements and notes
Natixis Update to the 2016 Registration Document 150
8.1.3 Other equity instruments issued
Undated deeply subordinated notes and preference shares In accordance with IAS 32, issued financial instruments are classified as debt or equity depending on whether or not they incorporate a contractual obligation to deliver cash to the holder. Since December 31, 2009, issues of undated deeply subordinated securities and preference shares have been recognized as equity instruments issued in accordance with a clause concerning dividend payments which has become discretionary, and have been booked to “Share capital and reserves” in the consolidated balance sheet. Deeply Subordinated Notes amounted to €2,085 million, compared with €1,611 million at December 31, 2016, an increase of €474 million corresponding to issues made during the first half of 2017. Note that the gross amount of exchange rate fluctuations in deeply subordinated notes in foreign currencies recorded in income at June 30, 2017 amounted to -€60 million, or -€39 million after tax, compared with -€7 million at June 30, 2016, or -€5 million after tax. 8.2 Impact of IFRIC 21 The interpretation of IFRIC 21 “Levies”, applicable since January 1, 2015, aims to clarify the date used for the accounting recognition of levies in the financial statements. This interpretation had the following impact:
- the recognition of a full provision as of the first quarter for taxes calculated based on obligating events arising at January 1 - these taxes were previously recorded progressively on a quarterly basis, in accordance with past accounting treatment. This mainly applies to the tax on systemic banking risks and the contribution to the single resolution fund; and
- for revenue-based taxes payable during the following fiscal year, the recognition of the full amount of taxes at January 1 of the year in which the tax is payable - these taxes were previously recorded pro rata to revenues for the period. This mainly concerns the Social Security and Solidarity Contribution (C3S).
As at June 30, 2017, the impact of the new accounting treatment on net income (group share) amounted to €89 million compared with €78 million at June 30, 2016. 8.3 Related parties
8.3.1 Relationships among the group’s consolidated companies The main transactions between Natixis and related parties (BPCE and its subsidiaries, the Banque Populaire banks, the Caisses d’Epargne and all financial investments accounted for by the equity method) are detailed below:

Financial Data 5 Interim consolidated financial statements and notes
Natixis Update to the 2016 Registration Document 151
In millions of euros
BPCE
Banque
Populaire
Group
Caisse
d’Epargne
Group
BPCE
Banque
Populaire
Group
Caisse
d’Epargne
Group
BPCE
Banque
Populaire
Group
Caisse
d’Epargne
Group
ASSETS
Assets at fair value through profit or loss 14,925 3,445 5,187 12,679 3,780 6,735 14,407 3,416 5,817
Available-for-sale financial assets 634 185 4 2,219 280 29 969 210 33
Loans and receivables due from banks 21,135 445 107 33,344 664 103 38,281 573 137
Customer loans and receivables 10,644 163 149 105 10,974 105
Held-to-maturity financial assets
LIABILITIES
Financial liabilities at fair value through profit
and loss5,811
781 74010,579
1,151 1,0808,534
984 842
Due to banks 66,111 797 849 70,087 1,263 894 56,083 1,392 985
Customer deposits 345 8 563 8 69 497 8 21
Debt securities
Subordinated debt 2,355 3,350 2,355 2
Equity (DSNs) 1,379 956 927 (0)
INCOME
Interest and similar income 93 10 3 122 13 2 232 25 4
Interest and similar expenses (270) (4) (11) (273) (5) (9) (525) (10) (56)
Net fee and commission income 8 (149) (43) 9 (151) (17) 21 (310) (20)
Net gains or losses on financial instruments at
fair value through profit or loss(199) (49) (158) (1,289) 345 911 (587) 314 833
Net gains or losses on available-for-sale
financial assets 0 0 2 (0)
0 1
Income and expenses from other activities 1 5 (5) (6) 4 (10) (20) 9 (11)
Operating expenses (29) 1 (3) (134) (11) (54) 0 (21)
COMMITMENTS
Commitments given 3,222 45 55 421 75 83 1,311 52 63Commitments received 8,133 2,398 2,188 5,491 2,224 1,851 9,650 2,315 2,123
12.31.201606.30.201606.30.2017
Relations with associates and joint-ventures are not material. 8.4 Insurance company results The insurance industry companies within Natixis’ scope of consolidation are: Coface and its subsidiaries, Natixis Assurances and its subsidiaries (life insurance, personal protection insurance, property and casualty insurance) and CEGC (Compagnie Européenne de Garanties et Cautions). The following table shows a reconciliation between insurance companies’ financial statements as presented and how they would translate into the banking format. It also shows the consolidated contribution by insurance companies in banking format. The main reclassifications concern general operating expenses, which are reported by function in the insurance format and by type in the banking format.
- As regards net revenues, in the interest of consistency, insurance income and expenses that are similar to banking income and expenses (principally interest and fees and commissions) are reclassified under the corresponding line items in the banking format. Technical reserves and claims expenses are charged to net revenues rather than recognized as provisions for credit losses;
- Balance sheet reclassifications are not material. Most of the balance sheet line items specific to insurance companies are shown under “insurance company investments” on the asset side and under “insurance companies’ technical reserves” on the liabilities side. Receivables and related payables, shown under accrued income, prepaid expenses and other assets or deferred income, accrued charges and other liabilities in the insurance format are reclassified in the same lines as the principal in the banking format.

Financial Data 5 Interim consolidated financial statements and notes
Natixis Update to the 2016 Registration Document 152
06.30.2017
06.30.2017
Banking format
Insurance formatNet
revenuesExpenses
Gross
operating
income
Provision
for credit
losses
Tax Other items Net income
Total
Premiums written 7,437 7,437 7,437 7,437
Change in unearned premium income (248) (248) (248) (248)
Earned premiums 7,190 7,190 7,190 7,190
Banking operating income 36 36 36 36
Revenues and income from other activities 95 95 95 95
Other operating income 9 2 7 9 9
Investment income 891 891 891 891
Investment expenses (95) (89) (4) (95) (95)
Capital gains and losses on disposal of investments (net of
reversals, write-downs and amortization)226 250 250 (24) 226
Change in fair value of investments carried at fair value
through profit or loss490 490 490 490
Change in write-downs on investments (7) (7) (7) (7)
Investment income (net of expenses) 1,505 1,533 (4) 1,529 (24) 1,505
Policy benefit expenses (7,524) (7,467) (58) (7,524) (7,524)
Reinsurance transfer income 1,636 1,636 1,636 1,636
Reinsurance transfer expenses (1,671) (1,671) (1,671) (1,671)
Income and expenses net of reinsurance transfers (35) (35) (35) (35)
Provision for credit losses (1) (1) (1)
Banking operating expenses (7) (7) (7) (7)
Policy acquisition costs (499) (365) (133) (499) (499)
Amortization of portfolio values and related items
Administrative costs (353) (176) (177) (353) (353)
Other recurring operating income and expenses (157) (23) (132) (156) (1) (157)
Other operating income and expenses (4) (4) (0) (4) (4)
OPERATING INCOME (LOSS) 255 785 (504) 281 (3) (23) 255
Finance expenses (17) (17) (17) (17)
Share in income of associates 7 7 7
Income taxes (83) (1) (1) (82) (83)
After-tax income from discontinued activities
Non-controlling interests (12) (12) (12)
CONSOLIDATED NET INCOME 150 768 (505) 263 (3) (82) (28) 150
06.30.2017
(In millions of euros)
06.30.2016
06.30.2016
Insurance formatNet
revenuesExpenses
Gross
operating
income
Provision
for credit
losses
Tax Other items Net income
Total
Premiums written 16,661 16,661 16,661 16,661
Change in unearned premium income (183) (183) (183) (183)
Earned premiums 16,477 16,477 16,477 16,477
Banking operating income 35 35 35 35
Revenues and income from other activities 121 121 121 121
Other operating income 12 2 10 12 12
Investment income 838 838 838 838
Investment expenses (210) (205) (4) (210) (210)
Capital gains and losses on disposal of investments (net of
reversals, write-downs and amortization)80 76 76 4 80
Change in fair value of investments carried at fair value
through profit or loss(12) (12) (12) (12)
Change in write-downs on investments (29) (29) (29) (29)
Investment income (net of expenses) 666 667 (4) 662 4 666
Policy benefit expenses (16,062) (16,016) (47) (16,062) (16,062)
Reinsurance transfer income 926 926 926 926
Reinsurance transfer expenses (924) (924) (924) (924)
Income and expenses net of reinsurance transfers 1 1 1 1
Provision for credit losses (2) (2) (2)
Banking operating expenses (7) (0) (7) (7) (7)
Policy acquisition costs (456) (341) (116) (456) (456)
Amortization of portfolio values and related items (1) (75) (75) (75)
Administrative costs (338) (154) (183) (337) (1) (338)
Other recurring operating income and expenses (149) (34) (115) (149) (0) (0) (149)Other operating income and expenses (2) 30 1 (2) (1) 31 30
OPERATING INCOME (LOSS) 253 759 (464) 296 (3) (40) 253
Finance expenses (21) (21) (21) (21)
Share in income of associates 4 4 4
Income taxes (106) (1) (1) (105) (106)
After-tax income from discontinued activitiesNon-controlling interests 15 15 15
CONSOLIDATED NET INCOME 144 738 (465) 273 (3) (105) (21) 144
06.30.2016
Banking format
(In millions of euros)
(1) Corresponding to the impairment of goodwill on Coface; (2) Including €31 million in income from the sale of buildings by CEGC (recorded under Gains or losses on other assets).

Financial Data 5 Interim consolidated financial statements and notes
Natixis Update to the 2016 Registration Document 153
8.5 Financing and guarantee commitments
8.5.1 Guarantee commitments A financial guarantee is a contract that requires the issuer to compensate the holder of the contract for any loss that the holder incurs because a debtor fails to make payment when due. The exercise of these rights is subject to the occurrence of an uncertain future event. The amounts shown represent the nominal value of the commitment undertaken:
Guarantee commitments given
To banks 2,551 2,790
- Confirmation of documentary credits 1,601 1,638
- Other guarantees 949 1,152
To customers 20,188 19,566
- Real estate guarantees 203 226
- Administrative and tax bonds 327 347
- Other bonds and endorsements given 8,478 8,915
- Other guarantees 11,179 10,077
Total guarantees commitments given 22,739 22,356
Guarantee commitments received from banks 12,182 10,861
In millions of euros 06.30.2017 12.31.2016
8.5.2 Financing commitments In accordance with IAS 39 (paragraph 2), financing commitments outside the scope of IAS 39 are recognized in accordance with IAS 37 “Provisions, Contingent Liabilities and Contingent Assets”. The following financing commitments fall within the scope of IAS 39:
- commitments classified as financial liabilities at fair value through profit or loss. If an entity has a practice of reselling or securitizing loans immediately after they are issued, these loans are accounted for in accordance with IAS 39 as from the date the loan commitment is undertaken;
- commitments which are settled net (i.e. sold); - commitments which result in a loan granted at below-market interest rates.
Other financing commitments falling within the scope of IAS 37 A financing commitment given is a contingent liability, defined by IAS 37 as:
- a potential obligation arising from past events whose existence will be confirmed only by the occurrence or non-occurrence of one or more uncertain future events not wholly within the control of the entity; or
- a present obligation arising as a result of past events but not recognized because:
it is not likely that an outflow of economic benefits will be required to settle the obligation, or
the amount of the obligation cannot be measured with sufficient reliability.

Financial Data 5 Interim consolidated financial statements and notes
Natixis Update to the 2016 Registration Document 154
Financing commitments given
To banks 7,392 1,933
To customers 59,866 60,700
- Documentary credits 3,954 4,444
- Other confirmed lines of credit 49,538 51,787
- Other commitments 6,373 4,470
Total financing commitments given 67,258 62,633
Financing commitments received
- from banks 7,400 9,289
- from customers 3,428 4,209
Financing commitments received 10,829 13,498
In millions of euros 06.30.2017 12.31.2016

Financial Data 5 Interim consolidated financial statements and notes
Natixis Update to the 2016 Registration Document 155
NOTE 9 POST-CLOSING EVENTS No post-closing events have taken place since June 30, 2017.

Financial Data 5 Statutory Auditors’ report
Natixis Update to the 2016 Registration Document 156
5.2 Statutory Auditors’ report on the condensed consolidated financial information
DELOITTE & ASSOCIES PricewaterhouseCoopers Audit MAZARS 185, avenue Charles De Gaulle 92524 Neuilly-sur-Seine Cedex
63, Rue de Villiers, 92208 Neuilly-sur-Seine
61, rue Henri Regnault 92075 Paris La Défense Cedex
Statutory Auditors’ report on 2017 interim financial information
Period from January 1, 2017 to June 30, 2017
NATIXIS
30 avenue Pierre Mendès France
75013 Paris
To the Shareholders,
In compliance with the assignment entrusted to us by your Annual General Meeting and in accordance with the requirements of Article L. 451-1-2 III of the French Monetary and Financial Code (Code monétaire et financier), we hereby report to you on:
- the review of the accompanying condensed consolidated interim financial statements of Natixis, for the period January 1 to June 30, 2017;
- the verification of the information contained in the interim management report.
These condensed consolidated interim financial statements were prepared under the responsibility of the Board of Directors. Our role is to express a conclusion on these financial statements based on our review.
I - Conclusion on the financial statements
We conducted our review in accordance with professional standards applicable in France. A review of interim financial information consists of making inquiries, primarily of persons responsible for financial and accounting matters, and applying analytical and other review procedures. A review is substantially less extensive in scope than an audit conducted in accordance with professional standards applicable in France and consequently does not enable us to obtain assurance that we would become aware of all significant matters that might be identified in an audit.
Based on our review, nothing has come to our attention that causes us to believe that the condensed consolidated interim financial statements are not prepared in all material respects in accordance with IFRS standard IAS 34, as adopted by the European Union, applicable to interim financial information.

Financial Data 5 Statutory Auditors’ report
Natixis Update to the 2016 Registration Document 157
II - Specific verification
We have also verified the information presented in the interim management report in respect of
the condensed consolidated interim financial statements subject to our review. We have no
matters to report as to its fair presentation and its consistency with the condensed consolidated
interim financial statements.
French original signed in Neuilly-sur-Seine and Paris-La-Défense, on August 3, 2017,
The Statutory Auditors
DELOITTE & ASSOCIES
PricewaterhouseCoopers Audit MAZARS
Jean-Marc Mickeler
Charlotte Vandeputte
Agnès Hussherr
Patrice Morot
Charles de Boisriou

Legal Information 7 General information on Natixis’ capital
Natixis Update to the 2016 Registration Document 158
V SECTION 7: LEGAL INFORMATION
7.1 Natixis by-laws
NATIXIS
A joint stock company (société anonyme) with a Board of Directors with share capital of €5,019,776,380.80 Registered office: 30 avenue Pierre Mendès France – 75013 Paris 542 044 524 RCS PARIS
BY-LAWS
Article 11.1, paragraph 1 of the by-laws relating to meetings of the Board of Directors was amended by the Combined Shareholders’ Meeting of May 23, 2017, to introduce the option of convening Board meetings by email.
This article is now written as follows:
Article 11.1 (paragraph 1) – Meetings of the Board of Directors
11.1, paragraph 1: The Board of Directors convenes as often as the Company’s interests and legal and regulatory provisions so require, upon notice from its Chairman, either at the registered office or at any other location indicated in the notice, which may be sent via e-mail. "
The rest of the article remains unchanged.
7.3 Distribution of share capital and voting rights
7.3.1 Distribution of share capital at July 31, 2017
At July 31, 2017, Natixis’ main shareholders were as follows:
% capital % voting rights
BPCE 70.99% 71.02 %
Employee shareholding (a)
2.38 % 2.38 %
Treasury stock 0.05 % 0.00 %
Free float 26.58 % 26.60 %
(a) of which 0.95% held through capital increases reserved for employees.
of which 0.72% held under the BPCE Actions Natixis employee share ownership plan, including bearers of Groupe BPCE
shares.
of which 0.71% held outside of employee savings plans by employees and former employees.
As far as Natixis is aware, there are no shareholders, other than those listed in the above table, who own more than 5% of the capital or voting rights.
7.3.4 Employee shareholding
Free share awards:
On May 23, 2017, based on the positive opinion of the Compensation Committee, and as authorized by Natixis' General Shareholders' Meeting held on May 24, 2016 in its 19th resolution, Natixis' Board of Directors granted 49,458 performance shares (which may give rise to the acquisition of a maximum of 54,403 securities in accordance with the application of the performance conditions) to the members of the Senior Management Committee. 29,911 performance shares were granted to the Chief Executive Officer of Natixis, which may give rise to the acquisition of a maximum of 32,902 securities in accordance with the application of the performance conditions.

Legal Information 7 General information on Natixis’ capital
Natixis Update to the 2016 Registration Document 159
The purpose of this allocation is to strengthen the alignment over time between shareholders' interests and those of senior management. The shares will only be vested at the end of a four-year period and subject to performance and presence conditions. The performance conditions have been defined based on the relative performance (Total Shareholder Return) of Natixis’ share against that of other banking institutions making up the Euro Stoxx Banks index. Furthermore, 30% of the shares delivered to the Chief Executive Officer at the end of the vesting period will be subject to a lock-in period ending upon the termination of his office as Chief Executive Officer of Natixis. On April 10, 2017, based on the positive opinion of the Compensation Committee, and as authorized by Natixis' General Shareholders' Meeting held on May 24, 2016 in its 20th resolution, Natixis' Board of Directors granted 2,958,466 free shares to certain categories of employees, including 53,841 shares for the Chief Executive Officer of Natixis, for which it is specified that as a person listed in Article L.511-45 of the French Monetary and Financial Code, 17,947 of the securities will be vested in March 2019 and 35,894 securities will be vested in March 2020, subject to fulfillment of the performance conditions after variable compensation and after Natixis’ cost of risk, as well as Natixis’ compliance with its regulatory capital obligations, accompanied by a lock-in period of six months. Furthermore, 30% of the shares delivered to the Chief Executive Officer at the end of the vesting period will be subject to a lock-in period ending upon the termination of his office as Chief Executive Officer of Natixis.
Issues of share capital reserved for employees of companies enrolled in the Natixis’ employee savings plans:
No capital increases reserved for employees of companies enrolled in the Natixis’ employee savings plans are to take place in 2017.

Additional Information 8 Statement by the person responsible
Natixis Update to the 2016 Registration Document 160
VI SECTION 8: ADDITIONAL INFORMATION 8.1 Statement by the person responsible for this update of the 2016 Registration
Document
“I hereby declare that, to the best of my knowledge after having taken all reasonable measure to this end, the information contained in this registration document update is true and accurate, and contains no omissions liable to impair its significance. To the best of my knowledge, the condensed financial statements for the past half-year were prepared in accordance with applicable accounting standards, and proude a true and fair image of the assets and liabilities, financial position and earnings of the company and the consolidated group, and the attached half-year management report accurately reflects the key events in the first half and their impact on the financial statements, the major related party transactions and a description of the major risks and uncertainties in the second half. I have obtained a letter from the Statutory Auditors certifying the completion of their work, in which they indicate that they have examined the information on the financial position and the financial statements given in this update and have read the whole of the update. " Paris, France, August 9, 2017 Laurent Mignon Chief Executive Officer of Natixis 8.2 Documents available to the public Copies of this document are available free of charge at the registered office of Natixis, 30 avenue Pierre Mendès France, 75013 Paris. This document may also be consulted on the websites of the French Financial Supervisory Authority (www.amf-france.org) and of Natixis (www.natixis.com).

Additional Information 8 Person responsible for auditing the financial statements
Natixis Update to the 2016 Registration Document 161
8.3 Cross-reference table of registration document In order to make this document more easily readable, the following cross-reference table outlines the main headings required by Annex 1 of EC regulation no. 809/2004 of April 29, 2004, implementing the so-called “Prospectus” directive.
Heading 2016 Registration
document
page number
Update
of August 9,
2017
1. Persons responsible 484 160
2. Statutory Auditors 334 170
3. Selected financial information
3.1. Selected historical financial information regarding the issuer for
each financial year
10-11
3.2 Selected historical financial information for interim periods N/A
4. Risk factors 112 to 118 43
5. Information about the issuer
5.1. History and development of the Company 6 to 9
5.2. Investments 188 to 191 ; 326
6. Business overview
6.1. Main activities 14 to 27
6.2. Main markets 302 to 306
6.3. Exceptional events N/A
6.4. Extent to which the issuer is dependent on patents or licenses,
industrial, commercial or financial contracts or new
manufacturing processes
178
6.5. The basis for any statements made by the issuer regarding its
competitive position
14 to 26
7. Organizational structure
7.1. Brief description of the Group 6-7 ; 9
7.2. List of significant subsidiaries 224 to 228 ; 335 to 348
8. Property, plant and equipment
8.1. Existing or planned material tangible fixed assets 246-247
8.2. Environmental issues that may affect the issuer’s utilization of
the tangible fixed assets
393 to 407 ; 419 to 423
9. Income and Financial position
9.1. Financial position 112 to 118 ; 124 to 154 ; 159 to 172 ; 188 to 202
43 to 50; 69 to 90
9.2. Operating results 10 ; 192-193 ; 206 77-78; 93
10. Treasury and Capital resources
10.1. Information concerning the issuer’s capital resources 124 to 132 ; 208-209
10.2. Sources and amounts of the issuer’s cash flows 210-211
10.3. Information on the issuer’s borrowing conditions and funding
structure
160 to 163
10.4. Information regarding any restrictions on the use of capital
resources that have materially affected, or could materially
affect, the issuer’s operations
N/A
10.5. Information regarding the anticipated sources of funds needed
to fulfill commitments referred to in items 5.2. and 8.1
162-163 ; 205 57-58; 92
11. Research and development, patents and licenses 178
12. Trend information 14 to 27 ; 112 to 118 ; 326
13. Profit forecasts or estimates N/A

Additional Information 8 Person responsible for auditing the financial statements
Natixis Update to the 2016 Registration Document 162
Heading 2016 Registration
document
page number
Update
of August 9,
2017
14. Administrative, management, and supervisory bodies and
executive management
14.1. Administrative bodies 34 to 80 34 to 41
14.2. Administrative, management, and supervisory bodies and
executive management conflicts of interest
80
15. Remuneration and benefits
15.1. Amount of remuneration and benefits in kind 81 to 96
15.2. Total amounts paid accrued by the issuer to provide pension,
retirement or similar benefits
328-329
16. Administrative and management bodies practices
16.1. Date of expiration of current terms of office 36 to 60
16.2. Service contracts with members of the administrative bodies 80
16.3. Information about the issuer’s Audit Committee and
Compensation Committee
71 to 75 41-42
16.4. Statement as whether or not the issuer complies with the
corporate governance regime
61
17. Employees
17.1. Number of employees 411
17.2. Directors’ shareholdings and stock options 93 ; 447-448
17.3. Arrangements for involving employees in the issuer’s capital 250-251
18. Major shareholders
18.1. Shareholders owning more than 5% of the share capital or
voting rights
449 158
18.2. Different voting rights of the aforementioned shareholders 451
18.3. Control of the issuer 451
18.4. Arrangements, known to the issuer, the operation of which may
at a subsequent date result in a change in its control
452
19. Related-party transactions N/A
20. Financial information concerning the issuer’s assets and
liabilities, financial position and profits and losses
20.1. Historical financial information 204 to 348 ; 351 to 355 91 to 155
20.2. Pro forma financial information 10-11 ; 304 to 306 143 to 146
20.3. Financial statements 204 to 348 ; 315 to 355 91 to 155
20.4. Auditing of historical annual financial information 349-350 ; 391-392 156-157
20.5. Age of latest financial information 349-350 ; 391-392 156-157
20.6. Interim financial and other information N/A
20.7. Dividend policy 28 ; 442 ; 453
20.8. Legal and arbitration procedures 175 to 178 60 to 62
20.9. Significant changes in the issuer’s financial or commercial
situation
200
21. Additional information
21.1. Share capital 379 ; 448 158
21.2. Memorandum and by-laws 438 to 443 158
22. Material contracts N/A
23. Third party information and statement by experts and
declarations of any interest
N/A
24. Documents available to the public 485 160
25. Information on holdings 335 to 341

Additional Information 8 Person responsible for auditing the financial statements
Natixis Update to the 2016 Registration Document 163
8.4 Cross-reference table for the half-year financial report In application of Article 212-13 of the AMF’s (French Financial Markets Authority) General Regulations, the present update contains the information of the Interim Financial Report referred to in Article L. 451-1-2 of the French Monetary and Financial Code and Article 222-4 of the AMF’s General Regulations. Half-year financial report Update of August
9, 2017
Page number
1. Consolidated financial statements at June 30, 2017 91 to 155
2. Interim management report 69 to 90
2.1. Major events that have occurred during the first 6 months of the financial year and their impact on the first-half financial statements
69 to 76
2.2. Description of the main risks and uncertainties over the next six months 43
2.3 Transactions between related parties 150-151
3. Statement of the person responsible 160
4. Statutory Auditors’ Review Report on the first-half yearly financial information for 2017 156-157

Additional Information 8 Person responsible for auditing the financial statements
Natixis Update to the 2016 Registration Document 164
8.5 Cross-reference table between articles of the CRR, Basel Committee/ EBA tables and statements, and the Pillar III report
CRR Article Basel Committee/EBA tables and statements
Reference in Pillar III report
Page of Pillar III
report
Page of Registration
document
Page of Pillar III
report update
Page of Registration
document update
Risk governance and management
Article 435 (1) (EBA) EU OVA - Bank risk management approach
2.1 Governance & 2.2 Risk management organization
12-13 119-121
2.4 Risk appetite 14 120
2.7 Stress tests 24 121
Article 435 (1) (EBA) CRA - General information about credit risk
5.1. Credit risk control organization
48 133
5.2. Credit policy 48 133
Article 435 (1) (EBA) CCRA - Qualitative disclosure related to counterparty credit risk
6.1. Counterparty risk management
74 134
Article 435 (1) (EBA) MRA - Qualitative disclosure requirements related to market risk
8.1. Market risk management
88 148
Linkages between financial statements and regulatory exposures
Article 436 (b)
EU LI1 - Differences between accounting and regulatory scopes of consolidation and mapping of financial statements with regulatory risk categories
Table 1 27-28 125-126
Article 436(b) EU LIA – Explanations of differences between accounting and regulatory exposure amounts
3.2 Prudential consolidation scope
26
Macro-prudential supervisory measures
Article 458
(BCBS March 2016) CCyB1 – Geographical distribution of credit exposures used in the countercyclical buffer
Table 5 35 N/A 9
Leverage ratio
Article 451 (BCBS March 2016) LR1 – Comparison of accounting exposures and leverage exposures
Table 52 103 166 39 58
(BCBS March 2016) LR2 – Leverage ratio
Appendix 3 164 N/A 50
Capital requirements
Article 438 (c) (f) (EBA) EU OV1A - Overview of RWA Table 9 41 13
Article 438 last paragraph
(EBA) EU CR10 - IRB - Specialized lending and equities
Table 30 72 24
Art. 438 c), d), e) and f)
NX01 - EAD, RWA and EFP by approach and by Basel exposure class
Table 8 40 142 12 48
Art. 442 c) NX03 - Exposures and EAD and by Basel exposure class
Table 10 42
Art. 442 d), e) and f)
NX05 - EAD by geography and by exposure class
Table 11 43 14
Art. 444 a), b) and c)
NX11BIS - EAD by exposure class and by agency – Standardized approach
Table 12 44
Art. 453 d) NX17 - Secured exposure by rating and by type of guarantor
Table 13 44
Art. 453 f) and g) NX18 - EAD by credit risk mitigation technique
Table 14 45
Credit risk and credit risk mitigation techniques
Article 442 (a) and (b)
CRBA - Additional disclosure related to the credit quality of assets
239-259
Article 442 (c), (g) and (h)
(EBA) EU CR1 - Credit quality of assets
Table 17 54 17

Additional Information 8 Person responsible for auditing the financial statements
Natixis Update to the 2016 Registration Document 165
Article 453 (a) (e) (EBA) EU CRC - Qualitative disclosure requirements related to credit risk mitigation techniques
5.5. Credit risk mitigation techniques
50-51 139-140
Article 453 (f) and (g)
(EBA) EU CR3 - Credit risk mitigation techniques – Overview
Table 15 52 15
Article 442 (c) (EBA) EU CRB-B - Total and average net amount of exposures
Table 18 55
Article 442 (d) (EBA) EU CRB-C - Geographical breakdown of exposures
Table 19 56
Article 442 (e) (EBA) EU CRB-D - Concentration of exposures by industry or counterparty type
Table 20 57
Article 442(f) (EBA) EU CRB-E - Maturity of exposures
Table 21 58
Credit risk and credit risk mitigation – Standardized approach
Article 444 (a) (d)
(EBA) EU CRD - Qualitative disclosures on banks’ use of external credit ratings under the standardized approach for credit risk
5.6. Credit risk: standardized approach
59 135-136
Article 453 (f) and (g)
(EBA) EU CR4 - Standardized approach – credit risk exposure and Credit Risk Mitigation (CRM) effects
Table 23 61 18
Article 444 (e) (EBA) EU CR5 - EAD by asset class and risk weight
Table 24 61 135 18
Credit risk and credit risk mitigation – IRB
Article 452 (a) (c) (EBA) EU CRE - Qualitative disclosures related to IRB models
5.7. Credit risk: internal ratings-based approach
62 134-139
Article 452 (e)(h) and (j)
(EBA) EU CR6 - IRB – Credit risk exposures by portfolio and PD range
Table 29 68 20
Article 453 (g) (EBA) EU CR7 - Internal rating – Effect on RWA of credit derivatives used as CRM techniques
Table 16 53 16
Article 92 (3) and 438 (d)
(EBA) EU CR8 - RWA flow statements of credit risk exposures under IRB
Table 28 67 19
Art. 452(j) NX16 - Average weighted PD and average weighted LGD by geography
Table 26 63
Counterparty risk
Article 439(e), (f) and (i)
(EBA) EU CCR1 - Analysis of counterparty credit risk (CCR) exposure by approach
Table 34 75 25
Article 439 (e) and (f)
(EBA) EU CCR2 - Credit valuation adjustment (CVA) capital charge
Table 38 80 29
Article 444 (e) (EBA) EU CCR3 - Standardized approach of CCR exposures by regulatory portfolio and risk weight
Table 35 76 26
Article 452 (e) (EBA) EU CCR4 - CCR exposures by portfolio and PD scale
Table 36 77 27
Article 439 (g) and (h)
(EBA) EU CCR6 - Credit derivative exposures
Table 37 79 29
Securitization
Article 449 (BCBS) SECA – Qualitative disclosure requirements related to securitization exposures
7.2. Management of risks related to securitization transactions
82-83 147
(BCBS) SEC1 - Securitization exposures in the banking book
Table 40 84 30
(BCBS) SEC2 - Securitization exposures in the trading book
Table 41 84 30
(BCBS) SEC3 - Securitization exposures in the banking book and associated regulatory capital requirements – bank acting as originator or as sponsor
Table 45 86 32

Additional Information 8 Person responsible for auditing the financial statements
Natixis Update to the 2016 Registration Document 166
(BCBS) SEC4 - Securitization exposures in the banking book and associated regulatory capital requirements – bank acting as originator or as investor
Table 46 86 33
Art. 449( k) NX33BIS - Banking book EAD by agency
Table 39 83
Market risk
Art. 445 (EBA) EU MR1 - Market risk own funds requirements
Table 47 92 34
Article 105 and article 455 (c)
(EBA) EU MRB A - Qualitative disclosures for banks using the Internal Models Approach (IMA)
8.3 Methodology for measuring market risk
90-91 148-151
Article 455 (a) and (b)
(EBA) EU MRB B - Qualitative disclosures for banks using the Internal Models Approach (IMA)
8.3 Methodology for measuring market risk
90-91 148-151
Article 455 (e) (EBA) EU MR2 – A - Market risk under internal models approach
Table 50 93 35
Article 455 (d) (EBA) EU MR3 - IMA values for trading portfolios
Table 48 92 151-154 34
Article 455 (g) (EBA) EU MR4 - Comparison of VaR estimates with gains/losses
Table 49 93 153 34
Operational risk
Article 446 (BCBS) ORA – General qualitative data on operational risk management
10. Operational risk
112-115 155-158
(BCBS) OR1 – Historical losses used for SMA calculation
Table 59 114
(BCBS) OR3 – Historical losses Table 60 114 158
Interest rate risk (IRRBB)
Article 448 (BCBS) Table A – IRRBB management policies and objectives
9.4. Management of structural interest rate risk
105-106 166-168
(BCBS) Table B – NII sensitivity Table 62 (IRRBB – Table B)
106 168
Remuneration
Article 450 (BCBS) REMA – Remuneration policy 12. Disclosures on remuneration
125-144 81-96

Additional Information 8 Person responsible for auditing the financial statements
Natixis Update to the 2016 Registration Document 167
8.6 Table Index
Subject Title of table Page of Pillar III
report
Page of Registration
document
Page of Pillar III report update
Page of Registration
document update
Capital management and capital adequacy
Table 1 : (EU LI1): Differences between accounting and regulatory scopes of consolidation and the mapping of financial statements categories with regulatory risk categories
27-28 125-126
Table 2 : Transition from accounting capital to regulatory capital after application of phase-in arrangements
30 128 8 43
Table 3 : Regulatory capital Appendix VI
31 na
Table 4 : Total capital ratio 34 129
Table 5 : (CCyB1 ) : Geographical distribution of credit exposures used in contracyclic buffer
35 na 9
Table 6 : Changes in regulatory capital after application of phase-in arrangements over the period
35 130 10 45
Table 7 : Risk-weighted assets at December 31, 2016
37 131 11 46
Credit and counterparty risks
Table 8 (NX01): EAD, RWA and EFP by approach and by Basel exposure class
40 142 12 48
Table 9 : (EU OV1): Overview of RWA 41 13
NX02 : RWA Basel III by Natixis main business line
132 47
Table 10 : (NX03): Exposures and EAD and by Basel exposure class
42 144
Table 11 : (NX05): EAD by geography and by exposure class
43 145 14 49
NX06 : EAD by geography 146
Table 12 : (NX11 BIS): EAD by exposure class and by agency – Standardized approach
44
NX12 : EAD by internal rating (S&P Equivalent)
146 50
Table 13 : (NX17): Secured exposures by rating and by type of guarantor
44
Table 14 : (NX18): EAD by credit risk mitigation technique
45
Credit risk Table 15 : (EU CR3): Credit risk mitigation techniques – Overview
52 15
Table 16 : (EU CR7) : IRB – Effect on RWA of credit derivatives used as CRM techniques
53 16
Table 17 : (EU CR1): Credit quality of assets
54 17
Table 18 : (EU CRB – B): Total and average net amount of exposures
55
Table 19 : (EU CRB – C): Geographical breakdown of exposures
56
Table 20 : (EU CRB – D): Concentration of exposures by industry or counterparty type
57
Table 21 : (EU CRB – E): Maturity of exposures
58
Table 22 : (CRD-D): Risk weights under SA exposures by asset class and byrating agency
60

Additional Information 8 Person responsible for auditing the financial statements
Natixis Update to the 2016 Registration Document 168
Table 23 : (EU CR4): Standardized approach – credit risk exposure and credit risk mitigation
61 18
Table 24 : (EU CR5): Standardized approach – EAD by asset class and risk weight
61 18
Table 25 : (EDTF 15): Indicative correspondences between internal ratings based on expert judgment and external agency ratings (corporates, banks, specialized financing institutions)
63
Table 26 : (NX16): Average weighted PD and average weighted LGD by geography
63
Table 27 : (CRE): Main internal models: PD, LGD and CFF
66
Table 28 : (EU CR8): RWA flow statements of credit risk exposures under IRB
67 19
Table 29 : (EU CR6): IRB – Credit risk exposures by portfolio and PD range
68 20
Table 30 : (EU CR10): IRB (specialized lending and equities)
72 24
Table 31 : (NX23): Breakdown of equity exposures by Natixis main business line
72
Table 32 : (NX24): Equity EAD by type and nature of exposure
72 24
Table 33 : (NX25): Equity RWA by approach
72 24
Counterparty risk
Table 34 : (EU CCR1): Analysis of counterparty credit risk (CCR) exposure by approach
75 25
Table 35 : (EU CCR3): Standardized approach of CCR exposures by regulatory portfolio and risk weight
76 26
Table 36 : (EU CCR4): IRB – CCR exposures by portfolio and PD scale
77 27
Table 37 : (EU CCR6): Credit derivative exposures
79 29
Table 38 : (EU CCR2): Credit valuation adjustment (CVA) capital charge
80 29
Securitization Table 39 : (NX33 BIS): Banking book EAD by agency
83
Table 40 : (SEC1): Securitization exposures in the banking book
84 30
Table 41 : (SEC2): Securitization exposures in the trading book
84 30
Table 42 : (NX31-A): On- and off-balance sheet EAD according to Natixis’ role in the banking book
85 31
Table 43 : (NX31-B): EAD according to Natixis’ role in the trading book
85 31
Table 44 : (NX34): Resecuritization positions before and after substitution
85
Table 45 : (SEC3): Securitization exposures in the banking book and associated regulatory capital requirements – bank acting as originator or as sponsor
86 32
Table 46 : (SEC4): Securitization exposures in the banking book and associated capital requirements – bank acting as investor
86 33
Market risk Table 47 : (EU MR1): Market risk own funds requirements
92 34
Table 48 : (EU MR3): IMA values for trading portfolios
92 34

Additional Information 8 Person responsible for auditing the financial statements
Natixis Update to the 2016 Registration Document 169
Table 49 : (EU MR4): Comparison of VaR estimates with gains/losses
93 34
Table 50 : (EU MR2-A): Market risk under internal models approach
93 35
Liquidity risk Table 51 : Liquidity ratio (LCR) at 12/31/2016
102 164
Table 52 (LR1): Comparison of accounting exposures and leverage exposures
103 166 39 58
Structural foreign exchange risk
Table 53 : Impact on CET1 ratio 104 166
Overall interest rate risk
Table 54 : Measure of sensitivity to +1% variation in interest rates, by maturity at December 31, 2016
105 167
Table 55 : Interest rate gap by maturity at December 31, 2016
106 167
Table 56 (IRRBB – Table B): NII sensitivity
106 168
Other disclosures
Table 57 : Encumbered and unencumbered assets at 12/31/2016 (in millions of euros)
107 169
Table 58 : Breakdown of financial liabilities by contractual maturity
108 170-171
Operational risk Table 59 : (OR1): Historical losses used for SMA calculation
114
Table 60 : (OR3): Historical losses 114
At-risk exposures
Table 61 : Exposure to monoline insurers
146 184 44 67
Table 62 : European RMBS 146 184 44 67
Table 63 : CMBS 146 185 45 67
Table 64 : Exposures to countries subject to a rescue plan
147 185-186 45 68
Appendices
Appendix 1: Transition from the accounting balance sheet to the regulatory balance sheet at December 31, 2016
154 49
Appendix 2 : Issuance of capital instruments at December 31, 2016
156
Appendix 3 : Leverage ratio (LR2) 164 50

Additional Information 8 Person responsible for auditing the financial statements
Natixis Update to the 2016 Registration Document 170
8.7 Persons responsible for auditing the financial statements Persons responsible for auditing the financial statements Principal Statutory Auditors
Deloitte & Associés (represented by signatory partners Charlotte Vandeputte and Jean-Marc Mickeler) - 185 avenue Charles-de-Gaulle - 92524 Neuilly-sur-Seine Cedex;
PriceWaterhouseCoopers Audit (represented by signatory partners Agnès Hussherr and Patrice Morot), 63, rue de Villiers – 92208 Neuilly-sur-Seine Cedex;
Mazars (represented by signatory partners Charles de Boisriou), 61 rue Henri Regnault - 92075 La Défense Cedex.
Deloitte & Associés, PriceWaterhouseCoopers Audit and Mazars are registered as Statutory Auditors with the « Compagnie Régionale des Commissaires aux Comptes of Versailles » and under the supervision of the « Haut Conseil du Commissariat aux Comptes ». Alternate Auditors: • BEAS, 7-9, Villa Houssay - 92200 Neuilly-sur-Seine, represented by partner, Mireille Berthelot; • Mr. Jean-Baptiste Deschryver, 63, rue de Villiers – 92208 Neuilly-sur-Seine Cedex; • Mr. Franck Boyer, Immeuble Exaltis, 61 rue Henri Regnault - 92075 La Défense Cedex.

30, avenue Pierre Mendès France
75013 Paris
Tél. : +33 1 58 32 30 00
www.natixis.com