up or out? residential building height regulations in ... · residential building height...
TRANSCRIPT

WORK IN PROGRESS – PRELIMINARY ANALYSIS NOT TO BE RELIED UPON. DO NOT QUOTE WITHOUT AUTHOR’S PERMISSION
Up or out? Residential building height regulations in Auckland - understanding the effects and implications
Working Paper June 2014
Presented to the New Zealand Association of Economists Annual Conference, Auckland
2-4 July 2014.

WORK IN PROGRESS – PRELIMINARY ANALYSIS NOT TO BE RELIED UPON. DO NOT QUOTE WITHOUT AUTHOR’S PERMISSION
© 2014 Auckland Council
This publication is provided strictly subject to Auckland Council’s copyright and other intellectual property rights (if any) in the publication. Users of the publication may only access, reproduce and use the publication, in a secure digital medium or hard copy, for responsible genuine non-commercial purposes relating to personal, public service or educational purposes, provided that the publication is only ever accurately reproduced and proper attribution of its source, publication date and authorship is attached to any use or reproduction. This publication must not be used in any way for any commercial purpose without the prior written consent of Auckland Council. Auckland Council does not give any warranty whatsoever, including without limitation, as to the availability, accuracy, completeness, currency or reliability of the information or data (including third party data) made available via the publication and expressly disclaim (to the maximum extent permitted in law) all liability for any damage or loss resulting from your use of, or reliance on the publication or the information and data provided via the publication. The publication, information, and data contained within it are provided on an "as is" basis.

WORK IN PROGRESS – PRELIMINARY ANALYSIS NOT TO BE RELIED UPON. DO NOT QUOTE WITHOUT AUTHOR’S PERMISSION
Up or out? Residential building height regulations in Auckland - understanding the effects and implications
Melanie Luen, Economist
Auckland Council
Disclaimer
This working paper shows preliminary analysis and is presented to the 2014 New Zealand Association of Economists conference to stimulate discussion and critical comment. This working paper contains analysis which is subject to a review process and should not be relied upon in any way until issued as final. The analysis and opinions expressed in this report are the author’s own and do not necessarily reflect, and should not be reported as, the view of Auckland Council.
Do not quote without the express permission of the author.
Acknowledgements
The author is grateful for comments and assistance from Peter Nunns, Andrew Coleman, Geoff Cooper and Rachael Logie. Any errors remain the author’s own responsibility.

WORK IN PROGRESS – PRELIMINARY ANALYSIS NOT TO BE RELIED UPON. DO NOT QUOTE WITHOUT AUTHOR’S PERMISSION
Table of Contents
1.0 Introduction ................................................................................................................ 1
2.0 Background information ............................................................................................. 2
2.1 Current height restrictions and the Proposed Auckland Unitary Plan .................. 2
2.2 Literature review – effects of residential building height regulations ................... 3
2.2.1 Benefits .................................................................................................... 3
2.2.2 Costs ....................................................................................................... 5
3.0 A regulatory tax for Auckland? ................................................................................. 10
3.1 Underlying theory .............................................................................................. 10
3.2 The Auckland context ....................................................................................... 11
3.2.1 Auckland’s construction industry............................................................ 16
3.2.2 Technological barriers to construction ................................................... 17
3.3 Auckland data ................................................................................................... 17
3.4 Marginal cost of construction ............................................................................ 19
3.5 Results .............................................................................................................. 21
3.6 Caveats and limitations ..................................................................................... 22
4.0 Discussion/Conclusion ............................................................................................. 24
5.0 References ................................................................................................................. 1
Appendix A .......................................................................................................................... 1
Appendix B .......................................................................................................................... 3
_____________________________________________________________________________________ Up or out? Residential building height regulations in Auckland - understanding the effects and implications
i

WORK IN PROGRESS – PRELIMINARY ANALYSIS NOT TO BE RELIED UPON. DO NOT QUOTE WITHOUT AUTHOR’S PERMISSION
1.0 Introduction
Interest in Auckland’s housing market is greater than ever. Recent headlines such as “House prices rise $100 a day”1, “Asking price for homes at record levels”2 and “House values soar in tight Auckland property market”3 attracts discussion from homeowners, would-be homeowners and policymakers. Auckland policymakers are interested in Auckland’s housing market and housing affordability in the context of becoming the world’s most liveable city and the Auckland Plan.
There is widespread acknowledgement that there is a shortage of housing in Auckland which has contributed in part to the rapid price appreciation observed over the last few years. Consenting levels have been low, relative to population growth which has resulted in a shortage of housing. There is no consensus on the exact figure of the shortage, but it is likely to be somewhere between one and two years’ worth of supply, at current levels of consenting activity.
Agreeing to policy tools to increase the supply of housing is also less clear cut.
Some argue that Auckland Council should release more land for residential development to ease supply constraints and reduce the pressure on prices, pointing to studies by Grimes and Liang (2007) and Zheng (2013), which indicate that the Metropolitan Urban Limit has put upward pressure on land prices within urban areas. This is one option that would make more land at the urban periphery available to developers.
An alternative and complementary option is to increase the supply of housing units by building up. This is an area which, up until recently, has not been a focus of New Zealand policy and economic research circles. Unlike expanding the urban limit, increasing supply by building up means developers are not limited to land geographically remote from the CBD, centres of employment or urban amenities.
This paper aims to contribute to the evidence base on the effect of building height regulations in Auckland. First, it outlines the current height restrictions in Auckland and reviews the literature on the effects of building height restrictions. There is a reasonable body of work on estimating the costs but less literature quantifying the benefits of building height restrictions. Second, it sets out the method developed by Glaeser et al (2005) to estimate the effects of regulations that restrict the supply of housing units vertically. Third, it attempts to employ the method developed by Glaeser et al (2005) with Auckland data. Last, the paper concludes with potential areas for further work and policy considerations.
1 NZHerald 14 June 2014 2 NZHerald 13 June 2014 3 NZHerald 11 June 2014
______________________________________________________________________________________ [Title] 1

WORK IN PROGRESS – PRELIMINARY ANALYSIS NOT TO BE RELIED UPON. DO NOT QUOTE WITHOUT AUTHOR’S PERMISSION
2.0 Background information
2.1 Current height restrictions and the Proposed Auckland Unitary Plan
Height restrictions are often misunderstood. As a control in Auckland, height restrictions have restricted discretionary status. This means that in an area with a height restriction of 12m (and no other relevant controls), a developer could build up to 12m without notification. Importantly, the developer could seek permission to build even higher, through the costly and time consuming building consent process, but there is no guarantee of success.
Box 1: The Proposed Auckland Unitary Plan (PAUP)
Auckland currently operates under four regional and seven district plans and one regional policy statement. These planning documents were developed when Auckland was made up of Auckland Regional, Auckland City, Franklin District, Manukau City, North Shore City, Papakura District, Rodney District and Waitakere City councils.
From 1 November 2010, the Auckland Council became a unitary authority through the amalgamation of the regional council and seven territorial authorities. The PAUP will be the first planning rulebook for Auckland Council.
The Auckland Regional Policy Statement, four regional plans and seven district plans will continue to be operative until the PAUP takes effect. The PAUP is currently notified but not operational - the process to deliver the first combined plan for Auckland Council will take place over the next three years.
Under the current operative plans in Auckland, height restrictions range from as little as 8m tall to unlimited in some areas. Additional restrictions on density, view protection planes and special character overlays also influence building height. Building height regulations, view protection planes and density constraints all influence the shape of Auckland’s skyline.
The PAUP aims to ensure Auckland’s growth is balanced with maintaining the characteristics of an area. The height restrictions in the PAUP have been developed with certain principles at the forefront, including taking into account the status of the centre/area in the Auckland Plan hierarchy, public transport and future transport projects, current building heights, landscape features, historic heritage, among other principles.4
4 Refer to Auckland’s centres: building heights/Proposed Auckland Unitary Plan: Fact Sheet available here: http://www.aucklandcouncil.govt.nz/EN/planspoliciesprojects/plansstrategies/unitaryplan/Documents/Key%20topics%20in%20detail/upkeytopicsbuildingheights.pdf
______________________________________________________________________________________ [Title] 2

WORK IN PROGRESS – PRELIMINARY ANALYSIS NOT TO BE RELIED UPON. DO NOT QUOTE WITHOUT AUTHOR’S PERMISSION
The PAUP, as it currently stands, increases height limits in some areas, while in many others, does not change the height limit. It also imposes a height limit in some areas, where there is no current limit in place (for example, parts of Manukau and Henderson currently have an unlimited height limit).
A consultative process was adopted when preparing the PAUP. A draft Unitary Plan was released for public consultation in March 2013, after which amendments were made and incorporated into the PAUP. Following feedback from the community, some height limits were reduced from the March 2013 draft Unitary Plan, a few were increased.
See Appendix B for a summary of the change in height controls across Auckland in the PAUP, along with the changes from the draft Unitary Plan.
2.2 Literature review – effects of residential building height regulations
There is a growing body of literature investigating the effects of land use regulations, analysing a wide range of city planning and land use issues. This literature review has limited its scope to the studies which have sought to quantitatively analyse the effects of residential building height regulations, which is the aim of this study. The literature favours quantitative analysis of the costs of building height regulations, an easier task than quantitative analysis of the benefits of building height regulations. As such, the positive effects of imposing residential building height regulations are outlined below for completeness, but are not the focus of the literature review.
In city planning, building heights can be regulated in many different ways. Heights can be controlled directly by designating a maximum number of storeys (e.g. 4 storeys) or meters for a building (e.g. 12 meters). Building heights can also be controlled by floor area ratio maximums (e.g. 4). The floor area ratio (FAR) is the ratio of the total floor area of the building to the size of the lot (and is measured across multiple units on a single site). The wider literature regards the floor area ratio as tool to regulate heights as well as site intensity and density, but in the literature reviewed for this study, any application of floor area ratios has been regarded as a tool for restricting height, rather than intensity or density. Finally, sightlines and view protection planes are also used to regulate heights. This literature review has not differentiated between the tools for regulating height.
2.2.1 Benefits
This literature review starts with an assessment of the benefits of building height regulations. Anecdotal evidence from conversations with city planners suggests that the major benefit of residential building height regulations is certainty. It is proposed that imposing building height regulations provides certainty to existing residents that buildings
______________________________________________________________________________________ [Title] 3

WORK IN PROGRESS – PRELIMINARY ANALYSIS NOT TO BE RELIED UPON. DO NOT QUOTE WITHOUT AUTHOR’S PERMISSION
in their neighbourhoods will not likely exceed a certain height.5 This is a private benefit accruing to residents of an existing neighbourhood (that is, close enough to be affected by the building height regulation).
Turning to the literature, the reported benefits of building height regulations are stated below in Table 2-1. The benefits are also categorised as a private or social benefit. Here, social benefit means the benefit accruing to Auckland as a whole, rather than to an individual (private benefit).
Table 2-1 Benefits of residential building height restrictions
Benefit Private or social benefit? Source
Certainty for residents on the urban form of their
neighbourhood
Private Informal discussions with city planners
Improved access to light and air at street level / preservation of
environmental quality (less trapped air pollution, less
shading)
Social Arnott and MacKinnon (1977) and Ding (2013)
Aesthetical value / historical preservation benefits
Social Arnott and MacKinnon (1977) and Ding (2013)
Fewer wind tunnel effects Social Arnott and MacKinnon (1977)
More social interactions between humans in shorter buildings
Private Arnott and MacKinnon (1977)
Urban amenity benefits Social Ding (2013)
Existing private views are protected
Private Glaeser et al (2005)
Less pressure on urban infrastructure
Social Ding (2013)
5 Developers can apply for a building consent to exceed stated height limits in the current operative plans.
______________________________________________________________________________________ [Title] 4

WORK IN PROGRESS – PRELIMINARY ANALYSIS NOT TO BE RELIED UPON. DO NOT QUOTE WITHOUT AUTHOR’S PERMISSION
Aesthetical value and historical preservation benefits are intrinsically linked. Here, we assume that the urban form or shape of a city is something that is desired and valued by residents of a city, thus protection of the ‘look’ of the city and any historical or heritage characteristics drives the benefit.
Neither Arnott and MacKinnon (1977) nor Ding (2013) attempt to quantify the size of the benefits of building height regulations, but both note that this process is a difficult and often fraught task. However, an understanding of the costs of building height regulations can assist with making decisions over whether the benefits of height restrictions can justify the costs. This is ultimately how this study proceeds.
2.2.2 Costs
2.2.2.1 Increased travel costs – time and money Turning to the costs of building height restrictions, the major effect of imposing height restrictions is that the city sprawls. Residents are pushed to live further out, which increases their travel costs in terms of time and money from their place of employment.
Several studies have been conducted on quantifying the costs of building height regulations.6 These are summarised below in Table 2-2.
6 Many of the studies listed below employ a monocentric city model. The summary in Kulish, Richards and Gillitzer (2011) provides useful background material on the model.
______________________________________________________________________________________ [Title] 5

WORK IN PROGRESS – PRELIMINARY ANALYSIS NOT TO BE RELIED UPON. DO NOT QUOTE WITHOUT AUTHOR’S PERMISSION
Table 2-2 Costs of residential building height restrictions
Study City Key findings
Arnott and MacKinnon (1977)
Stylised Toronto • A city-wide height restriction of 10 storeys could cost each household 0.15% of their annual income.
• A city-wide height restriction of 5 storeys could cost each household 0.57% of their annual income.
Ding (2013) Beijing • Beijing’s building height restrictions in its CBD are associated with a decrease in housing output of 70%, a decrease in land prices of 60% and a decrease in land investment of 85%.
• To accommodate the decrease in housing output:
o The city sprawls by 12%.
o House prices rise by 20%.
Brueckner and Sridhar (2012)
Bangalore • The city sprawls by 10% to overcome the decrease in housing output.
• The price per square foot of housing increases in the restricted city.
• Dwellings are smaller in the restricted city as households reduce their consumption of floor space.
______________________________________________________________________________________ [Title] 6

WORK IN PROGRESS – PRELIMINARY ANALYSIS NOT TO BE RELIED UPON. DO NOT QUOTE WITHOUT AUTHOR’S PERMISSION
Kulish, Richards and Gillitzer (2011)
Stylised Australian city
• House prices are higher in the scenario with building height restrictions than without.
• Dwellings are smaller in the scenario with building height restrictions than without.
• Buildings are shorter closer to the CBD, but taller farther away from the CBD (to accommodate all the people who can no longer live close to the CBD) with building height restrictions.
• Accordingly, density is lower closer to the CBD but higher farther away from the CBD with building height restrictions.
• Land prices fall closer to the CBD but rise farther away from the CBD with building height restrictions.
• The city sprawls by almost 5km.
______________________________________________________________________________________ [Title] 7

WORK IN PROGRESS – PRELIMINARY ANALYSIS NOT TO BE RELIED UPON. DO NOT QUOTE WITHOUT AUTHOR’S PERMISSION
Kulish, Richards and Gillitzer’s findings are presented graphically below in Figure 2-1.
Figure 2-1 Effects of a four-storey building height restriction in a stylised Australian city. Vertical axis labels are as follows: Housing prices graph – dollars per square meter of living space per year; dwelling size – square meters of living space; building height – housing floor space per unit of land (roughly corresponds to storeys); density – persons per square km; price of land – the rental price of land in thousands of dollars per hectare per year; population – in thousands of people.
Source: Kulish, Richards and Gillitzer (2011)
2.2.2.2 Impact on housing prices As noted above, an increase in housing prices has been established following the imposition of building height regulations. Glaeser et al (2005) also use house price data to provide evidence for the effects of regulations.
Glaeser et al (2005) do not analyse building height regulations, per se, but investigate the suite of regulations in Manhattan and its impact on house prices.
In the neo-classical world, developers continue to supply housing units until profits can no longer be reaped. The authors argue that real increases in house prices should lead to more new housing output in a free market. In Manhattan, where vacant lots are scarce, the critical assumption is that there are no other barriers (such as technology barriers) to building another housing unit up.
______________________________________________________________________________________ [Title] 8

WORK IN PROGRESS – PRELIMINARY ANALYSIS NOT TO BE RELIED UPON. DO NOT QUOTE WITHOUT AUTHOR’S PERMISSION
The authors compare the sale price (per square foot) of apartments in Manhattan and compare this to the marginal cost of building another unit. Where land is in short supply, the marginal cost of building another unit is the cost of building a housing unit vertically,
Using historical sales data and publically available construction cost estimates, the authors found that the price-to-construction cost ratio (PCC) has increased over the last two decades. In 2002, the PCC was just over 2 in Manhattan. The difference between the two is coined as a “regulation tax”. The authors purport that house prices are inflated due to the inability of developers to continue to supply housing units to the point where price is equal to marginal costs.
Due to the relative ease of estimating the costs of building height regulations as well as data availability, this paper adopts the approach of Glaeser et al (2005).
______________________________________________________________________________________ [Title] 9

WORK IN PROGRESS – PRELIMINARY ANALYSIS NOT TO BE RELIED UPON. DO NOT QUOTE WITHOUT AUTHOR’S PERMISSION
3.0 A regulatory tax for Auckland?
In this section, we apply the method developed in Glaeser et al (2005) to identify whether there is any evidence of a regulatory tax in Auckland.
3.1 Underlying theory
The underlying assumption that drives the analysis by Glaeser et al (2005) is that land use restrictions stop the market from supplying housing units to meet meeting equilibrium. Standard economic theory predicts that housing supply meets housing demand in equilibrium when price is equal to marginal cost. That is, without any regulatory barriers, housing units will continue to be built until the cost of construction exceeds the market price.
Box 2: Profit maximising behaviour of developers and observed building heights
A developer faces many decisions when considering a new residential development. They must decide what type of development to build (e.g. standalone dwellings or a multi-unit building, the height of the building, the size of the housing units) within the planning regulations. Developers trade off the expected sale price (aggregate sale price of each individual housing unit sold) with the expected cost of development and act to maximise the potential profit of the development. Note developers will work at different price points in the market and will seek to maximise profits in their given price and quality bracket.
A developer is likely to have more certainty over expected construction costs but less certainty over the sale price per housing unit. The sale price is likely to reflect a host of factors, including characteristics of the development itself i.e. the scale and type of the development and its height, as well as the attractiveness of the area.
The results of developers’ profit maximising expectations are the developments and buildings we observe.
In Manhattan, land available for residential development is scarce but developers can build up. Thus, the marginal cost of a new housing unit is the marginal cost of an additional storey.
The theory is not able to differentiate between different types of regulation (e.g. a height regulation or a density regulation or a view protection plane) which prohibits further development. This is why it is coined a regulatory tax, rather than a specific cost of height regulations. Formally, the “regulatory tax” is the differential between the market price for an apartment (per square meter) and the marginal construction cost.
______________________________________________________________________________________ [Title] 10
WORK IN PROGRESS – PRELIMINARY ANALYSIS NOT TO BE RELIED UPON. DO NOT QUOTE WITHOUT AUTHOR’S PERMISSION
Box 3: A regulatory tax or a height tax?
The theory set out in Glaeser et al (2005) is that land use restrictions are a natural explanation for the gap in the price of housing and the supply costs. The authors argue that the limited supply response following house price growth is due to the result of an increasingly restrictive regulatory environment, which is coined a regulatory tax.
Regulation in this analysis refers to the regulations that affect the supply of housing (including, but not limited to, height regulations, zoning rules, density constraints, height to boundary ratios) on existing sites.
The approach in this paper does not capture standalone dwellings well because the cost of land needs to be included in the analysis. As such, the analysis pertains to regulations which restrict the supply of housing units vertically. This is because if a developer is considering a three storey building, the marginal cost of building a fourth storey is fairly independent of land.
There are several assumptions which need to be met, in order for the theory to hold. These are:
• The construction industry is competitive. An explanation for the price differential would be if construction companies are able to exploit higher than normal, competitive profits. Therefore, the assumption of a competitive construction market is required.
• There are no technology barriers to building up. A second explanation for the
price differential would be the inability of construction firms to continue to build apartments vertically due to technological constraints.
Due to the strength of the assumptions needed, only large differences are interpreted as evidence for a regulatory tax. The regulatory tax could be overestimated if the market is not competitive or true marginal cost is higher than data suggests.
3.2 The Auckland context
Auckland is not Manhattan but there could be similarities between the housing situation in the Auckland isthmus and Manhattan. In Auckland, there is also a shortage of vacant land for development in the isthmus7 where house prices have been increasing faster than non-isthmus areas in recent years.
Figure 3-1 and Table 3-1 below show house price inflation in isthmus suburbs and a weighted average composite for non-isthmus suburbs. In this sample, house price inflation
7 At May 2012, there were approximately 5,007 parcels of zoned residential land that were vacant within Auckland’s urban area (Fredrickson and Balderston, 2013). Fredrickson and Balderston (2013) refer to the urban area as within the Metropolitan Urban Limit at May 2012, an area broader than the isthmus.
______________________________________________________________________________________ [Title] 11

WORK IN PROGRESS – PRELIMINARY ANALYSIS NOT TO BE RELIED UPON. DO NOT QUOTE WITHOUT AUTHOR’S PERMISSION
has been strongest in Mt Eden/Epsom since June 2009. There has been some house price inflation in non-isthmus suburbs, but this is typically lower than the isthmus suburbs.
As can be seen below, with the exception of the City/Point Chevalier group, house price inflation has been positive since June 2009, the post-GFC low for median house prices in Auckland.
Figure 3-1 House price inflation since 2009 (post-recession low) in isthmus suburbs and non-isthmus. Source: REINZ
______________________________________________________________________________________ [Title] 12

WORK IN PROGRESS – PRELIMINARY ANALYSIS NOT TO BE RELIED UPON. DO NOT QUOTE WITHOUT AUTHOR’S PERMISSION
Table 3-1 House price inflation since 2009 in isthmus suburbs and for the non-isthmus weighted average composite
Annual average real sale price
Year to June 2009
Annual average real sale price
Year to June 2013
Percentage change
Mt Roskill $454,745 $593,382 30.5%
Mt Albert $521,788 $660,787 26.6%
City/Point Chevalier $362,810 $355,289 -2.1%
Mt Eden/Epsom $629,911 $841,473 33.6%
Eastern Suburbs $781,998 $927,835 18.6%
Ellerslie/Panmure $477,582 $568,365 19.0%
Onehunga/Penrose $411,063 $489,406 19.1%
Non-isthumus $481,400 $533,790 10.9%
Source: Author’s calculations using REINZ and Statistics NZ data. Prices adjusted to $2013 December quarter Continued house price inflation should stimulate construction of new housing units, so that supply of housing units increases. The three figures below (Figure 3-2, Figure 3-3 and Figure 3-4) show the total number of housing units consented, the number of standalone dwellings consented and the number of flats and apartments consented plotted against house price appreciation (over all housing types) in the previous year.
______________________________________________________________________________________ [Title] 13

WORK IN PROGRESS – PRELIMINARY ANALYSIS NOT TO BE RELIED UPON. DO NOT QUOTE WITHOUT AUTHOR’S PERMISSION
Figure 3-2 Annual house price growth (lagged one year) and annual consents Source: REINZ and Statistics New Zealand
______________________________________________________________________________________ [Title] 14

WORK IN PROGRESS – PRELIMINARY ANALYSIS NOT TO BE RELIED UPON. DO NOT QUOTE WITHOUT AUTHOR’S PERMISSION
Figure 3-3 Annual house price growth (lagged one year, all dwellings) and annual consents for detached housing Source: REINZ and Statistics New Zealand
Figure 3-4 Annual house price growth (lagged one year, all dwellings) and annual consents for flats and apartments Source: REINZ and Statistics New Zealand Economic theory predicts that house price growth should stimulate construction of more housing units to satisfy the demand, in the absence of barriers. We expect to see a positive relationship between the two variables and we do observe a trendline which is upward sloping in all three figures above. However, these relationships are not statistically significant (p-values 0.217, 0.248 and 0.1244 respectively).
So far the evidence base suggests that a housing supply response has not followed house price growth. There could be several reasons why we do not observe a relationship here. Some reasons include, but are not limited to, a requirement for sustained house price growth (the above graphs only look at the annual relationship between house price growth and new consents, not over a longer timeframe) before there is a supply response from developers; house price growth reflects consumer demand for land, rather than a dwelling; developers would like to build housing units but are unable to for various reasons (e.g. lack of access to finance).
______________________________________________________________________________________ [Title] 15
WORK IN PROGRESS – PRELIMINARY ANALYSIS NOT TO BE RELIED UPON. DO NOT QUOTE WITHOUT AUTHOR’S PERMISSION
3.2.1 Auckland’s construction industry
The first assumption made by Glaeser et al (2005) is that the construction industry is competitive. If this assumption is not held, an estimation of the proposed regulatory tax is likely to be too high.
The construction industry spans from firms that provide inputs to the construction sector (e.g. building materials) to draughters to subcontractors.
The Productivity Commission (March 2012) looked into the competition among manufacturers of building materials. Public submissions to the Housing affordability inquiry suggested that as there was a lack of competition in the sector. These claims arose because submitters noted the relatively high price of building materials and linked this with sector characteristics - there are only two major manufacturers of building materials in New Zealand.
There are several reasons why construction costs are described as high in New Zealand. One factor is New Zealand’s size. A small population makes it more difficult to create economics of scale in the construction and building industry. The Productivity Commission notes that while New Zealand is open to import competition, New Zealand’s distance from markets mean that importing building materials is less likely to occur. These are both reasons why there has been a lack of productivity growth in the sector.
Additionally, transporting building materials within New Zealand is challenging (compared to Australia) due to lack of transport infrastructure, the terrain and shipping materials between the North and South Island, making building more costly than Australia.
The Productivity Commission (2012) concluded that:
• A small number of market players do not necessarily mean that the firms engage in anti-competitive behaviour. The Productivity Commission reports that the Commerce Commission has investigated materials suppliers in the past, but no breaches of the Commerce Act have been found.
• The Productivity Commission found evidence of poor productivity, but poor productivity need not be synonymous with anti-competitive behaviour.
The Commerce Commission found evidence of anti-competitive behaviour in tendering processes in the construction sector (Productivity Commission, 2012). Their research found that some firms engage in ‘cover pricing’ and will submit a high-priced tender which is not intended to win. Firms know that their bid is higher than a friendly competitor and do not expect to win.
There has been more recent activity by the Commerce Commission since the Productivity Commission released its final report in 2012. In March 2014, the High Court ordered Carter Holt Harvey to pay a penalty of $1.85m after it engaged in price fixing behaviour with Fletcher Distribution for sales of structural timber to commercial customers in Auckland (Commerce Commission, 2014).
______________________________________________________________________________________ [Title] 16

WORK IN PROGRESS – PRELIMINARY ANALYSIS NOT TO BE RELIED UPON. DO NOT QUOTE WITHOUT AUTHOR’S PERMISSION
The Commerce Commission is also investigating Fletcher’s arrangements with building supplies distributors for its plasterboard product. This is investigation is still underway (NZHerald, 2014).
In the following analysis, we assume the construction industry is competitive, though it may not be.
3.2.2 Technological barriers to construction
Technological barriers could be one explanation for an observed gap between the sales price for a housing unit and the marginal cost of construction.
3.3 Auckland data
In this section, we explore the data which is used in the subsequent analysis.
This analysis uses Auckland Council’s dwelling sales audit file data, retrieved in March 2014. This rich dataset includes all dwelling sales in the Auckland region and has good data between 2003 and the present. It includes many variables including sale price (gross and net of chattels), building floor area, site coverage, number of off-street carparks, approximate building age, building construction material, building condition, sales group8, among others (refer to Appendix A for a full list of variables included in the dataset).
The data was cleaned, removing observations from 2014 and prior to 2003 (as the data did not look complete prior to 2003), as well as removing sales records with incomplete information. Only sales recorded at arm’s length were retained. Observations were sense checked and any dubious observations were excluded e.g. observations which reported a building floor area of greater than zero but building site coverage of zero were excluded. For each sale, the sale price (net of chattels) was converted to December 2013 prices using the consumer price index (all groups) from Statistics New Zealand. A price per square meter variable was created to be used in the analysis:
Price per square meter = Real sale price (net of chattels) / Building total floor area (in sqm)
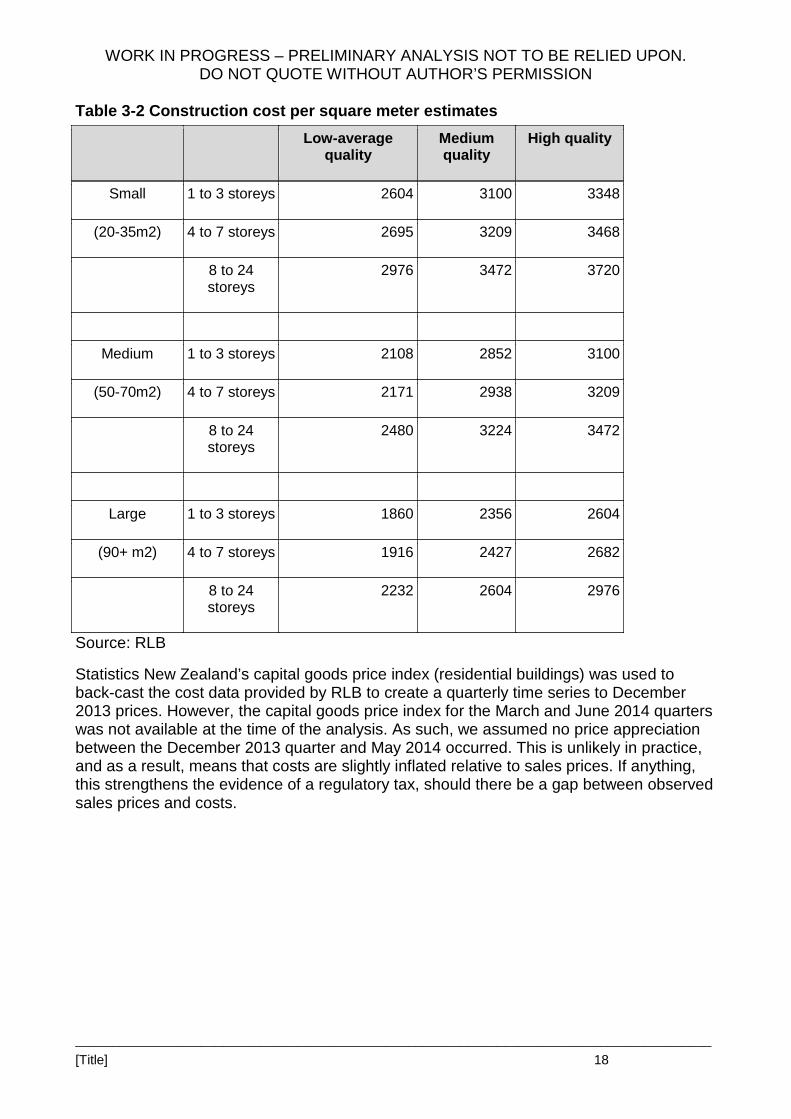
The construction cost data was kindly provided by property and construction practice Rider Levett Bucknall in May 2014. Construction cost data is available in public sources, but importantly we could not ascertain the relationship between construction cost and the number of storeys from public sources. We approached RLB to seek quantity surveyor estimates on this, in order to construct the marginal cost curve. RLB were able to provide the cost per square meter for small, medium and large apartments for three levels of quality for apartments of 1-3 storeys, 4-7 storeys and 8-24 storeys. A summary of the data provided by RLB is included in Table 3-2 below.
8 Sales group is a rough locational indicator, which we use and interpret broadly as suburb.
______________________________________________________________________________________ [Title] 17
WORK IN PROGRESS – PRELIMINARY ANALYSIS NOT TO BE RELIED UPON. DO NOT QUOTE WITHOUT AUTHOR’S PERMISSION
Table 3-2 Construction cost per square meter estimates
Low-average quality
Medium quality
High quality
Small 1 to 3 storeys 2604 3100 3348
(20-35m2) 4 to 7 storeys 2695 3209 3468
8 to 24 storeys
2976 3472 3720
Medium 1 to 3 storeys 2108 2852 3100
(50-70m2) 4 to 7 storeys 2171 2938 3209
8 to 24 storeys
2480 3224 3472
Large 1 to 3 storeys 1860 2356 2604
(90+ m2) 4 to 7 storeys 1916 2427 2682
8 to 24 storeys
2232 2604 2976
Source: RLB
Statistics New Zealand’s capital goods price index (residential buildings) was used to back-cast the cost data provided by RLB to create a quarterly time series to December 2013 prices. However, the capital goods price index for the March and June 2014 quarters was not available at the time of the analysis. As such, we assumed no price appreciation between the December 2013 quarter and May 2014 occurred. This is unlikely in practice, and as a result, means that costs are slightly inflated relative to sales prices. If anything, this strengthens the evidence of a regulatory tax, should there be a gap between observed sales prices and costs.
______________________________________________________________________________________ [Title] 18

WORK IN PROGRESS – PRELIMINARY ANALYSIS NOT TO BE RELIED UPON. DO NOT QUOTE WITHOUT AUTHOR’S PERMISSION
Figure 3-5 Back-cast construction cost (per m2) for construction on a third storey Source: RLB and Statistics New Zealand The sales data were filtered by dwelling size and then grouped into three categories:
1. Small: Less than 50 sqm 2. Medium: Between 50 and 90 sqm 3. Large: Greater than 90 sqm
Individual dwelling sales were averaged over each month to generate an average sale price per square meter, per month and then matched to the construction cost estimates for the relevant quarter.
3.4 Marginal cost of construction
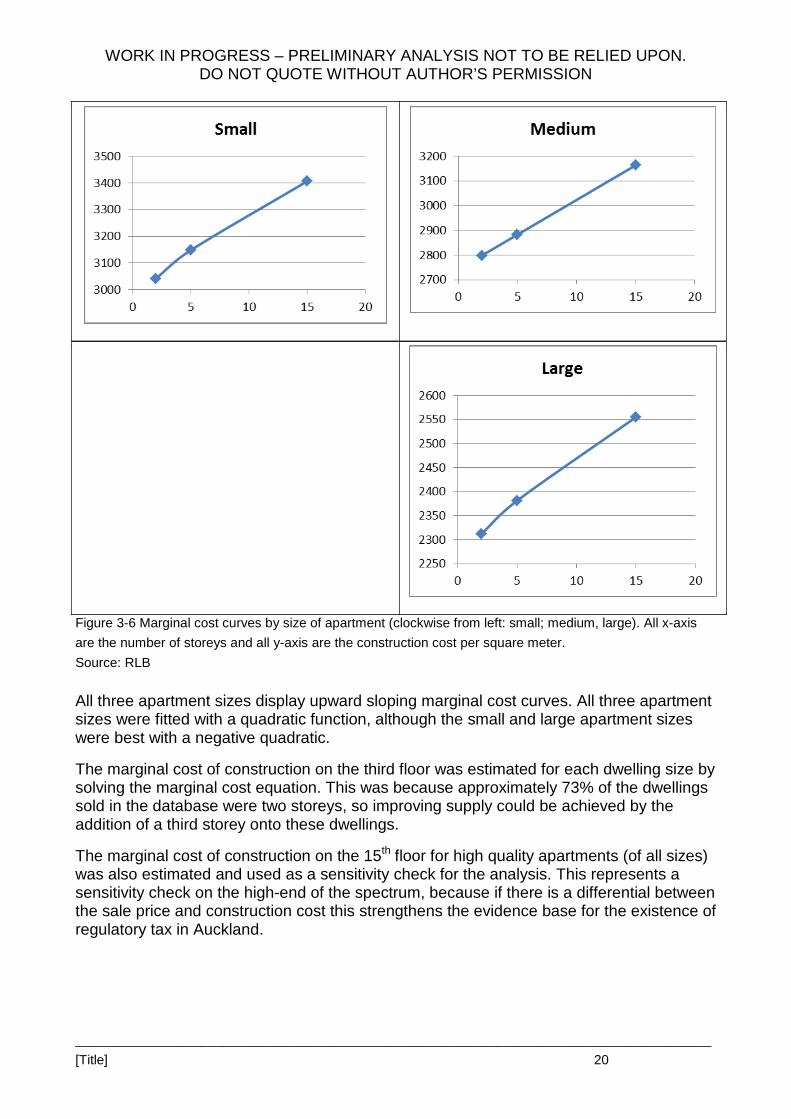
For each apartment size, the medium quality estimates were used as the benchmark and the mid-point between each height bracket was used, providing coordinates along a marginal cost curve to be solved. The cost curves are below in Figure 3-6.
______________________________________________________________________________________ [Title] 19
WORK IN PROGRESS – PRELIMINARY ANALYSIS NOT TO BE RELIED UPON. DO NOT QUOTE WITHOUT AUTHOR’S PERMISSION
Figure 3-6 Marginal cost curves by size of apartment (clockwise from left: small; medium, large). All x-axis are the number of storeys and all y-axis are the construction cost per square meter. Source: RLB All three apartment sizes display upward sloping marginal cost curves. All three apartment sizes were fitted with a quadratic function, although the small and large apartment sizes were best with a negative quadratic.
The marginal cost of construction on the third floor was estimated for each dwelling size by solving the marginal cost equation. This was because approximately 73% of the dwellings sold in the database were two storeys, so improving supply could be achieved by the addition of a third storey onto these dwellings.
The marginal cost of construction on the 15th floor for high quality apartments (of all sizes) was also estimated and used as a sensitivity check for the analysis. This represents a sensitivity check on the high-end of the spectrum, because if there is a differential between the sale price and construction cost this strengthens the evidence base for the existence of regulatory tax in Auckland.
______________________________________________________________________________________ [Title] 20

WORK IN PROGRESS – PRELIMINARY ANALYSIS NOT TO BE RELIED UPON. DO NOT QUOTE WITHOUT AUTHOR’S PERMISSION
3.5 Results
Figure 3-7 below shows the results of comparing sale price to construction cost (of a third storey) for small, medium and large apartments. As indicated below, the sale price well exceeds the construction cost resulting in a price to construction cost ratio in excess of 1.7 over the last ten years for all three dwelling sizes. The price to construction cost ratio appears to have increased since 2009 for medium and large apartments.
Key:
Figure 3-7 Price to construction cost ratio (marginal cost of third storey). All left hand axis: $2013 prices, all right hand axis: ratio of price to construction cost. At the end of 2013, the price to construction cost ratio was 2.64 for small dwellings, 2.47 for medium dwellings and 2.59 for large dwellings, figures all well above 1. Note that the small dwelling size series appears more volatile, because of fewer sales in this category. Table 3-3 below shows the minimum and maximum price to construction cost ratios across the sample timeframe.
______________________________________________________________________________________ [Title] 21

WORK IN PROGRESS – PRELIMINARY ANALYSIS NOT TO BE RELIED UPON. DO NOT QUOTE WITHOUT AUTHOR’S PERMISSION
Table 3-3 Price to construction cost ratios (range: 2003-2013)
Minimum Maximum
Small 1.78 5.77
Medium 1.97 2.86
Large 2.14 3.19
Sensitivity testing was performed using high end cost estimates. The high-quality cost estimates were used and the price to construction cost ratio for all three size brackets are shown below in Figure 3-8. The PCC ratio is still in excess of 1.5 for all three apartment sizes.
Figure 3-8 Sensitivity testing: price to construction cost ratio for marginal cost of 15th storey, high quality cost estimates. As indicated above, there is evidence that the supply of housing is constrained relative to demand. One reason for this could be the inability to build up. Constructing an extra dwelling upwards requires no extra land, although it is noted that this would impose additional demand on existing infrastructure.
3.6 Caveats and limitations
This analysis is not a specific height analysis, as such attributing the entire difference between the sale price and construction cost to the height regulations is incorrect. A wide range of height regulations (explicit height regulations, viewshafts, floor area ratios) could
______________________________________________________________________________________ [Title] 22

WORK IN PROGRESS – PRELIMINARY ANALYSIS NOT TO BE RELIED UPON. DO NOT QUOTE WITHOUT AUTHOR’S PERMISSION
be factors in why dwellings stop at two storeys, but also other regulations, such as density regulations or height to boundary ratios, could be other reasons why dwellings are not built taller. Additionally, there could be consumer preference for dwellings no taller than two storeys.
It should be noted that there is the ability to build higher than the rules allow, by applying for a building consent. In other words, the regulations can be circumvented and more height can be achieved. However, developments may still not proceed due to non-regulatory factors (such as the inability to obtain financing).
______________________________________________________________________________________ [Title] 23

WORK IN PROGRESS – PRELIMINARY ANALYSIS NOT TO BE RELIED UPON. DO NOT QUOTE WITHOUT AUTHOR’S PERMISSION
4.0 Discussion/Conclusion
The analysis presented in this report provides some insight into the effects of regulating building heights.
We find evidence of a regulation tax in Auckland. Recent consenting levels have been low relative to population growth but additional demand for housing has not translated to more housing units being built. Instead it has translated into an increase in housing prices.
We find that the price to construction cost ratio was 2.64 for small dwellings, 2.47 for medium dwellings and 2.59 for large dwellings at the end of 2013 in Auckland. These ratios are large. The ratio for medium dwellings and large dwellings increased over the last few years. These ratios are likely to widen with population growth unless sufficient housing is built to play catch up to pent up demand.
We purport that the large gap between the price of selling a housing unit and the marginal cost of building a unit is due, in part, to a suite of regulation which restricts the new supply of housing units. The incentive for developers to build an extra unit of housing vertically is clear – but this is not occurring. One reason for this is that regulation restricts developers from building the marginal unit of housing.
It is acknowledged that this gap is not wholly attributable to regulation, nor is it directly attributable to height restrictions. Consumer preferences for land as well as developers’ inability to obtain finance for development are two possible and plausible reasons why we observe the gap between the price of selling a new housing unit and the marginal cost of producing a new housing unit vertically.
However, this gap is large with sales prices more than double the cost of construction. The suite of policy controlling development is one explanation for this gap. This implies that regulations could have a far greater role to play in housing markets than has been thought with primary implications for housing supply and secondary implications for housing affordability.
Two key conclusions are as follows:
The suite of planning regulations which control height are likely to have restricted the supply of new housing more than is realised.
The reduced supply of housing units impacts housing affordability.
What would happen if height restrictions were relaxed? First, it is likely that the supply of housing units would increase. We expect that development would occur in locations that match demand. Demand is likely to be high in areas close to employment opportunities, transport links, urban amenities as well as natural amenities such as parks or beaches.
Second, we expect there would be a price effect and housing affordability could improve. The price effect would likely only occur if developers read demand signals correctly and increase supply in line with demand. If developers increase supply and develop where demand is not sufficiently strong, there may not be changes to overall affordability.
______________________________________________________________________________________ [Title] 24

WORK IN PROGRESS – PRELIMINARY ANALYSIS NOT TO BE RELIED UPON. DO NOT QUOTE WITHOUT AUTHOR’S PERMISSION
It is acknowledged that existing infrastructure may have to be upgraded to increase capacity which would also have cost implications.
The social costs of not having height restrictions Removing height restrictions could also have other implications. It could generate uncertainty throughout a community as to whether a new development would pop up next door. Developers currently have the ability to exceed current height restrictions by applying for a building consent. The consenting process allows a community to provide input on a proposed development.9
There would be other effects of removing height restrictions, including:
• Potential disruption to sightlines/vista to natural and cultural landmarks (social cost) • Blocked private views (private cost) • Potential shading problems/loss of natural light (social cost10 and private cost)
Auckland’s trade-off – up or out? Auckland is planning for growth. Compounded with the current housing shortage, additional people will continue to demand housing units in places which are close to employment opportunities, schools, transport links as well as urban and natural amenities.
One way to increase the supply of housing units is release more land by expanding the urban limit. Another way to improve the supply of housing units is to allow more height.
There are obvious benefits to allowing more height to increase housing supply. No new land is required, there is less environmental impact (i.e. sprawl is contained). Housing can be built in areas where people want to live, meaning shorter aggregate commute times to places of employment and urban amenities.
However, this is not cost-less for Auckland. A significant social cost would be the loss of sightlines to natural and cultural landmarks and a change in Auckland’s urban form. Not all views would be affected in the same way; others are not likely to be affected at all.
Auckland needs to decide whether it is prepared to increase height limits to increase the supply of housing and improve housing affordability. This is not the only way to improve housing supply and affordability, but the analysis suggests that the market is likely to take up the option, if it were available.
Further work The analysis and observations in this report pose additional questions which lend itself to further consideration. However, given the large observed gap between prices and
9 Consultation could still occur if other development controls were breached or height regulations were not removed entirely, but relaxed (e.g. to 10 storeys or 15 storeys). 10 For example, a protection plane protects Aotea square from surrounding development that would create shadows over the square.
______________________________________________________________________________________ [Title] 25

WORK IN PROGRESS – PRELIMINARY ANALYSIS NOT TO BE RELIED UPON. DO NOT QUOTE WITHOUT AUTHOR’S PERMISSION
construction costs, the first step will be to get some robustness around the construction cost estimates.
Areas for future work could include understanding the role of land in the analysis as well as understanding whether the price to construction cost ratio changes spatially across Auckland.
______________________________________________________________________________________ [Title] 26

WORK IN PROGRESS – PRELIMINARY ANALYSIS NOT TO BE RELIED UPON. DO NOT QUOTE WITHOUT AUTHOR’S PERMISSION
5.0 References
Arnott, R.J. and MacKinnon, J.G. Measuring the costs of height restrictions with a general equilibrium model. Regional Science and Urban Economics. 7 (1977): 359-375
Bertaud, A. and Brueckner, J.K. Analysing building-height restrictions: predicted impacts and welfare costs. Regional Science and Urban Economics. 35 (2005): 109-125
Brueckner, J.K. and Sridhar, KS. Measuring welfare gains from relaxation of land-use restrictions: The case of India’s building-height limits. Regional Science and Urban Economics. 42(2012): 1061-1067
Caliendo, M. and Kopeinig, S. Some practical guidance for the implementation of propensity score matching. IZA Discussion paper no. 1588
Commerce Commission (2014) Carter Holt Harvey fined for “classic” price fixing breaches. Media release, Wellington, 26 March 2014, available at https://www.comcom.govt.nz/the-commission/media-centre/media-releases/2014/carter-holt-harvey-fined-for-classic-price-fixing-breaches/
Ding, C. Building height restrictions, land development and economic costs. Land Use Policy. 30 (2013): 485-495
Frolich, M. Propensity score matching without conditional independence assumption – with an application to the gender wage gap in the United Kingdom. Econometrics Journal. 10: (2007): 359-407
Fredrickson, C. and Balderston, K. 2013. Capacity for growth 2012: results, Auckland
Glaeser. E., Gyourko, J and Saks, R. Why is Manhattan so expensive? Journal of Law and Economics. (2005) 331-369
Gibson, A. 2014. Fletcher defends market dominance. New Zealand Herald. 21 January 2014 available at http://www.nzherald.co.nz/business/news/article.cfm?c_id=3&objectid=11189400
Kulish, M., Richards, A. and Gillitzer, C. Urban Structure and Housing Prices: Some evidence from Australian cities. Reserve Bank of Australia Research Discussion Paper 2011-3
Leuven, E. and Sianesi, B. PSMATCH2: Stata module to perform full Mahalanobis and propensity score matching, common support graphing, and covariate imbalance testing. Available at: http://ideas.repec.org/c/boc/bocode/s432001.html
New Zealand Productivity Commission. 2012. Final Report Housing affordability inquiry. Wellington
Rosenbaum, P.R. and Rubin, D.B. The central role of the propensity score in observational studies for causal effects. Biometrika. 7:1 (1983) 41-55
______________________________________________________________________________________ [Title] 1

WORK IN PROGRESS – PRELIMINARY ANALYSIS NOT TO BE RELIED UPON. DO NOT QUOTE WITHOUT AUTHOR’S PERMISSION
Appendix A A full list of variables in the sales audit file is below. See http://www.linz.govt.nz/valuation/rules-and-regulations/DocumentSummary.aspx%3Fdocument%3D296 for explanations of the variables.
Field text Field # Field name Start End Type* Length Dec†
Valuation No. Roll 1 VNROLS 1 5 S 5 0
Valuation No. Assessment 2 VNABRS 6 16 S 11 0
Valuation No. Suffix 3 VNSUFS 17 18 A 2
Sale Date 4 SLDATS 19 26 S 8 0
District (Territorial Authority) Code
5 DISTCS 27 28 S 2 0
Sale Type 6 SLTYPS 29 29 A 1
Sales Group 7 SLGRPS 30 33 S 4^ 0
Sale Tenure 8 SLTENS 34 34 S 1 0
Price/Value Relationship 9 BSRELS 35 35 S 1 0
Sale Price Gross 10 SLPGRS 36 46 S 11 0
Sale Price Net 11 SLPNTS 47 57 S 11 0
Sale Price Chattels 12 SLPCTS 58 68 S 11 0
Sale Price Other 13 SLPOTS 69 79 S 11 0
Capital Value 14 CPTVLS 80 90 S 11 0
Land Value 15 LNDVLS 91 101 S 11 0
Current Effective Valuation Date
16 COLDDS 102 109 S 8 0
Situation Number 17 SITNOS 110 113 S 4 0
Additional Situation Number 18 SETNOS 114 117 A 4
Situation Name 19 SITSTS 118 147 A 30
Certificate of Title 20 CTRFRS 148 159 A 12
Land Area† 21 LNDARS 160 171 S 12 4
Zoning 22 LUZONS 172 173 A 2
Actual Property Use 23 LNDUSS 174 175 S 2 0
Units Of Use 24 UNITPS 176 178 S 3 0
______________________________________________________________________________________ [Title] 1

WORK IN PROGRESS – PRELIMINARY ANALYSIS NOT TO BE RELIED UPON. DO NOT QUOTE WITHOUT AUTHOR’S PERMISSION
Field text Field # Field name Start End Type* Length Dec†
Off-street Parking 25 GARPAS 179 181 S 3 0
Building Age Indicator 26 BLDAGS 182 184 A 3
Building Condition Indicator 27 BLDCDS 185 186 A 2
Building Construction Indicator 28 BLDCNS 187 188 A 2
Building Site Coverage 29 BLDSCS 189 194 S 6 0
Building Total Floor Area 30 BLDFRS 195 200 S 6 0
Property Category 31 CATGYS 201 206 A 6
Legal Description 32 LDESCS 207 244 A 38
Mass Contour 33 MACTRS 245 246 A 2
Mass View 34 MAVEWS 247 247 A 1
Mass Scope of View 35 MASCPS 248 248 A 1
Mass Total Floor Area 36 MATFRS 249 251 S 3 0
Mass Deck 37 MADEKS 252 252 A 1
Mass Workshop Laundry 38 MALANS 253 253 A 1
Mass Other Improvements 39 MAIMPS 254 254 A 1
Mass Garage Under Main Roof 40 MAGR2S 255 255 S 1 0
Mass Garage Freestanding 41 MAGR1S 256 256 S 1 0
Production 42 PRODNS 257 263 S 7 0
Valuer’s Remarks 43 SLREMS 264 298 A 35
Vendor/Purchaser names 44 SLVENS 299 320 A 22
* 'Type' means alpha (A) or numeric (S)
† 'Dec' means the number of decimal places allowed in a numeric field and, in the case of land area, this must be recorded in hectares
^ 'Length' of the 'Sales Group' field has been expanded from two to four characters to accommodate Auckland Super City Sales Group codes. The 'Sales Group' field is still able to be held and received electronically as a two character field for other areas of New Zealand.
Source: LINZ
______________________________________________________________________________________ [Title] 2

WORK IN PROGRESS – PRELIMINARY ANALYSIS NOT TO BE RELIED UPON. DO NOT QUOTE WITHOUT AUTHOR’S PERMISSION
Appendix B – Current and height regulations in Proposed Auckland Unitary Plan
______________________________________________________________________________________ [Title] 3

WORK IN PROGRESS – PRELIMINARY ANALYSIS NOT TO BE RELIED UPON. DO NOT QUOTE WITHOUT AUTHOR’S PERMISSION
______________________________________________________________________________________ [Title] 4

WORK IN PROGRESS – PRELIMINARY ANALYSIS NOT TO BE RELIED UPON. DO NOT QUOTE WITHOUT AUTHOR’S PERMISSION
______________________________________________________________________________________ [Title] 5

WORK IN PROGRESS – PRELIMINARY ANALYSIS NOT TO BE RELIED UPON. DO NOT QUOTE WITHOUT AUTHOR’S PERMISSION
______________________________________________________________________________________ [Title] 6