up in smoke?: tobacco production’s effect on stunting...
TRANSCRIPT

Up in Smoke?: Tobacco Production’s Effect onStunting in Malawi
Benjamin [email protected]
April 1, 2011
Abstract
Growing attention on the developing world’s potential for export led growth hasnaturally flowed into the agricultural sector. I examine the effects of Malawian cropadoption on childhood health to determine the effects of transitioning to cash crops inrisky food markets. Preliminary results indicate that cash crop households had higherlevels of childhood stunting, which may suggest providing additional support for food cropproduction.
1

1 Introduction
Cash crops have played a prominent and contentious role in the push toward growth and
food security in the developing world (Maxwell & Fernando, 1989). Numerous studies
advocate economic growth through market liberalization, cash crop exportation, and food
purchases (Kherallah et al., 2002). Johnston & Mellor (1961) use Japanese silk worms as a
classic example of increasing food security through cash crop production. In their attempts
to guarantee the availability and accessibility of food, especially in relation to the recent food
price crises, food-first proponents generally support increasing domestic food production (Deb
et al., 2009). Representative data sets now allow for more thorough examinations of the effects
of agricultural commercialization on health in the developing world, which should help with
prioritizing agricultural production.
While widespread international encouragement exists for cash crop production (Harrigan,
2008), numerous questions remain concerning the impact of this commercialization on the
health of smallholders. Cash crop cultivation is often coupled with an increased dependence
on food imports (Morgan & Solarz, 1994). In the case of Malawi, recent governmental
policies promote increasing domestic food production in the face of longterm aid dependence
and national food deficits (Levy et al., 2004). Even still, previous research has documented
that greater food production does not necessarily translate into improved nutritional health
(Pelletier et al., 1995). The government, non-governmental organizations (NGOs) and the
donor community in Malawi remain divided over focusing on maize self-sufficiency versus
cash crop production (Harrigan, 2003).
My paper explores how crop choice affects the height of children in Malawi. Using the
World Bank’s 2004-2005 Malawian data, individuals are categorized by crop production, house-
2

hold characteristics and geographic location. I determine the effect of cash crop production
on childhood malnutrition by examining crop choice in relation to height for age (stunting)
while controlling for a number of external factors. Stunting is an ethnically robust long-term
measurement of childhood malnutrition that compares a child’s height and age to a globally
representative World Health Organization (WHO) reference population (Habicht et al., 1974).
Abnormally short children are typically defined as having a z-score of two standard deviations
or more below this WHO reference population (Waterlow et al., 1977 and Dibley et al., 1987).
A wide range of literature has demonstrated that malnutrition in general (Belli, 1971), and
height in particular, affects long term wage, health and education attainment opportunities in
the developing world (Strauss & Thomas, 1998).
Figure 1: Malawi HAZ statistics
3

Stunting has been shown to accurately measure longterm childhood nutrition levels (Briend
et al., 1989). Figure 1 demonstrates that a significant number of Malawian tobacco and non-
tobacco households had stunted children. This finding is consistent with past surveys, which
have consistently shown high percentages of stunted children in Malawi (WHO, 2009). In
comparison to standard reference populations, stunted children experience greater probabilities
of early mortality, decreased physical capabilities and diminished mental capacity (Grantham-
McGregor et al., 2007 and Fawzi et al., 1997). Stunting is identifiable within the child’s first
year, with children from six to sixty months of age typically being measured in surveys (Duflo,
2003). Researchers attribute a large number of childhood deaths in Africa to malnutrition and
have called for future Malawian health interventions to focus on stunting (Espo et al., 2007).
By examining the effect of agricultural commercialization on stunting, this research will
clarify the impact of cash crops on health in a development context. Recent emphasis on
alternative agricultural options in the developing world, be it herbs, hot peppers or tobacco,
may leave smallholders exposed to commodity price volatility and lump-sum payment is-
sues. These cropping decisions are being made in the context of dramatic commodity price
spikes, particularly in numerous staple foods. Minot (2010) provides in-depth analysis of
four Malawian staple food price spikes, all of which happened since 1998. Examination of
Malawian production choices will provide a greater understanding of the effects of agricultural
commercialization on household food security during times of food price instability.
2 Malawian Agricultural Commercialization
Malawi is a small landlocked country in Southern Africa. As one of the poorest countries in the
world (World Bank, 2009), ranking 160 of 182 on the UN’s Human Development Index (United
4

Nations Development Programme, 2009), many deem agricultural commercialization essential
for Malawian growth (Republic of Malawi, 2000). In general, international organizations have
argued for the importance of agricultural commercialization in Sub-Saharan Africa (World
Bank, 1989). For Malawi specifically, researchers have mostly focused on the potential of
burley tobacco production (Peters, 1996 and Tobin & Knausenberger, 1998).
Burley tobacco has evolved, since first introduction in the 1940s, into Malawi’s most
significant cash crop (Orr, 2000). It is often used as a low-cost filler tobacco for international
cigarette production. Malawi is well-suited for growing tobacco, which has typically accounted
for the majority of its exports (Tsonga, 2004). Tobacco production, with its delicate cultivation
and harvesting requirements, exhibits few economies of scale (Jaffee, 2003). Additionally,
burley tobacco’s air-curing process is not capital intensive, further lending itself to small
scale production (Takane, 2008). The government only opened burley tobacco production
to smallholders in the mid 1990s. Even still, smallholders currently produce around 70% of
Malawi’s tobacco (Lea & Hanmer, 2009).
Malawi, thanks to the existence of a comprehensive, regionally representative survey and
its particular climatic conditions, is apt for this study. Its one rainy season leads to well
documented seasonal hunger patterns (Ogbu, 1973). Multiple droughts between 2000 and 2004
increased general Malawian food insecurity, thus providing a natural simulation of the effect of
crop choice on childhood malnutrition in times of economic hardship. Additionally, the World
Bank’s Integrated Household Survey from 2004-2005 (IHS) provides household information
on crop production, family characteristics, income, assets and children’s health. These data
allow for detailed analysis of crop choice and its effect on childhood stunting.
Numerous studies have investigated the impact of smallholder adoption of burley tobacco
in Malawi, but each is constrained to individual villages or sub-regions within the country.
5

Although Kennedy (1994) finds little difference in the malnutrition rates for children of tobacco
and non-tobacco growers, she deems agricultural commercialization to be an income generating
activity that increases household food security. Masanjala (2006) argues that tobacco adopters
are oftentimes asset poor and that off-farm income should be emphasized instead of cash crop
production in growth assessments.
Masanjala (2006) specifically examines the effect of smallholder Malawian tobacco market
liberalization on poverty alleviation. He finds that tobacco adoption significantly increases total
household income while simultaneously significantly decreasing nonfarm household income.
Additionally, he determines that tobacco farming significantly decreases food security while
having no effect on total food purchases. Masanjala speculates that lump sum tobacco payments
inhibit consumption smoothing, leaving these households particularly vulnerable to food price
shocks. He determines that 68% of the children in the 85 tobacco producing households in his
sample are stunted. He argues that increasing nonfarm income positively influences caloric
intake, while concluding that tobacco farming fails to significantly alter food consumption
levels.
Orr et al. (2009) postulate that increasing tobacco production is a poor survival strategy
in Malawi. They explain that the southern region of Malawi, with its high population and
small land holdings, is considered extremely vulnerable to food price fluctuations. But, during
Malawi’s famine of 2001-2002, this section of Malawi mostly avoided hunger related fatalities
by following their normal livelihood strategies. Comparatively, the central region of Malawi’s
strong dependence on tobacco sales proved disastrous in the face of dramatic increases in maize
prices. Although Southern farmers are often classified as poorer, their traditional livelihood
strategies provide a cushion against food price volatility.
Most of the literature on crop choice is limited to small areas within Malawi. Additionally,
6

studies using data from the mid 1990s might be significantly limited, as Malawi had only
just legalized smallholder tobacco farming at this point (Kees van Donge, 2002). Harrigan
(2003) calls for greater analysis of national tobacco production trends to determine if burley
has replaced maize farming, and if so, what implications may arise in terms of food security.
Tobacco’s importance in Malawi cannot be understated, as it accounts for the majority of
Malawi’s exports and substantially supports a large portion of Malawi’s population (Jaffee,
2003).
3 Malawian Tobacco History
Tobacco has played a prominent role in Malawi’s economy for the past century. While fired and
flue-cured production has steadily declined over the last few decades, burley currently accounts
for more than 90% of Malawi’s tobacco production. Burley reigns not only as Malawi’s most
important cash crop but also represents the majority of all Malawian exports. European settlers
initially created vast tobacco estates throughout the Southern Province of Nyasaland in the late
1800s, which predated Malawi’s existence (Jaffee, 2003). The growers used colonial tools,
most notably taxes, to restrict smallholder tobacco production and force peasants into laborer
and tenancy situations on the estates. Native farmers, who averaged approximately two acres
of land by 1934, grew a mixture of food crops mostly focused on maize but including sweet
potatoes, bananas and cassava (Green, 2008).
Malawi’s independence in 1964 brought much hope but little actual reform to the agricul-
tural sector. Various laws, from Tobacco Ordinance Number 39 of 1952 to the Special Crops
Acts of 1968 and 1972 restricted cash crop production to estates (Takane, 2008). Malawi’s
post-independence leaders expanded upon the systematic tobacco estate bias as a means to
7

reward political allies (Jaffee, 2003). With World Bank and USAID encouragement, Malawi
began liberalizing their tobacco industry in the early 1990s. Smallholders first legally sold
tobacco on the Malawian auction floor, under a quota, in 1991 (Tobin & Knausenberger, 1998).
In 1994 Malawi officially repealed the Special Crops Acts and smallholders quickly rushed
into tobacco production (Tsonga, 2004). Eventually smallholder tobacco restrictions, in the
forms of quota systems, control boards and grower’s clubs, were abolished. By 1998 almost 20%
of Malawian households, including over 400,000 smallholders, produced tobacco (Kadzandira
et al., 2004). Almost all of the smallholders who entered the market chose to produce burley
tobacco, which has arguably displaced maize and other food crop production throughout the
country (Tobin & Knausenberger, 1998).
All legally sold tobacco in Malawi goes through the auction floors. The original Limbe
floor is in Southern Malawi, but a floor opened in the Central region in 1979 and in the Northern
region in 1993. While tobacco production initially concentrated itself in the South, growth has
spread throughout the country. The Central region, around the capital, now houses the busiest
tobacco floor and the most registered tobacco clubs, although hundreds of thousands of clubs
exist in each of Malawi’s three geographic regions (Jaffee, 2003 and Tsonga, 2004). Most
smallholders continue to sell their crop through burley clubs, but recent legal changes allows
them to sell directly to the floors if so desired. The clubs typically include 10 to 20 farmers,
with a labeling systems that allows for money from crops sold at auction to reach the individual
growers. All producers must sell at least one bale of tobacco to be eligible for the auctions, thus
farmers on small plots may resort to selling to intermediary buyers at reduced rates (Takane,
2008). Malawi’s burley production has somewhat plateaued over the last decade, with reports
of illegal exporting to neighboring countries and lower auction prices because of contamination
through small pieces of plastic and possible collusion amongst tobacco purchasers (Kadzandira
8

et al., 2004).
Tobacco liberalization through structural adjustment was deemed as an empowerment
tool for Malawi’s smallholder farmers. But fears remain as to the effect of smallholder
commercialization on maize production and the health of poor Malawian households (Sahn
& Arulpragasam, 1991). With smallholders now producing the majority of Malawi’s tobacco
crop, expected gains to these cash crop households remain elusive. Prowse (2009) provides
one possible explanation, where his small-scale study shows a significant number of tobacco
producers engaging in irrational conspicuous consumption when collecting their tobacco
earnings. These one-time payments are oftentimes significantly delayed. Some tobacco
producers appear to spend their profits on beer, clothes, or bicycles instead of saving for future
food shortages. Concerns also exist over the tobacco transportation network, as all tobacco
must travel to one of the three auction houses for sale. Some smallholders report paying 70%
more than their large-scale competitors for tobacco transportation, while others discuss tobacco
disappearing during transport (Jaffee, 2003). Additionally, the illeteracy of many smallholders
may constrain their ability to impliment new production techniques (Tsonga, 2004).
4 Data and Definitions
This paper uses the World Bank and Government of Malawi’s 2004-2005 IHS data set. The
survey is regionally diverse, cross-sectional and captures significantly larger sample sizes than
the previously discussed Malawian literature. Upon examination, I chose to limit smallholders
to seven acres or less of cropped land. The boxplots in Figure 2 demonstrate the diversity present
in Malawian agriculture. By progressively removing the largest households, a clearer picture
of Malawian smallholder production emerges. As seen in Figure 2, a number of households
9

Figure 2: Malawi IHS Agricultural Acres by Household
10

control estates, which undoubtedly face different production decisions than smallholders. I
chose a seven acre cutoff, at the upper whisker of the third boxplot, in hopes of capturing farms
with similar objective functions. In examining the data I limit cash crops to burley tobacco, as
it dominates Malawi’s non-food crop agricultural production.
After concentrating the sample on smallholders, I checked the data for representativeness in
terms of age of children within all of the households and specifically within stunted households
depending on tobacco and non-tobacco production. Figure 3 demonstrates strong data quality,
Figure 3: Age Check
with the age of children in burley and non-burley households appearing quite random. Basic
summary statistics for all respondents are presented in Table 1, splitting the households into
non-farmers, estates and smallholders. Households are deemed agricultural if they report
11

cropping any land in the IHS survey. As previously discussed, smallholders are farmers who
crop less than 7 acres of land.
Table 1: Median Summary Statistics by Household Type
Variable Non-Farmer Estate Smallholder TotalHousehold Size 5 7 5 5
[4,6] [5,9] [4,7] [4,7]Age of Household Head 32 42 35 35
[28,40] [33,55] [29,46] [29,46]Ag Income 0 112 9 6
[0,0] [24,563] [0,54] [0,51]Non-Ag Income 6 0 2 2
[0,30] [-4,13] [0,11] [-1,13]Value of Assets 91 327 113 116
[26,461] [119,1342] [49,263] [48,290]Stunted (%) 37 48 44 44Food Price Shock (%) 64 86 80 79
Observations 602 304 5744 66501 The agricultural and non-agricultural income, along with the asset category are in the
average United States Dollar value during the survey.2 Agricultural income is crop sales, animal sales and agricultural wages.3 Non-agricultural income is household enterprises, non-agricultural wages, net gifts and
safety net transfers.4 Assets include the value of durable goods, household animals and housing.5 The survey asked participants if they had experienced household shocks over the past
five years, and if so, to recount the three most significant events. Shocks represents thepercentage of household reporting a significant shock due to food price increases withinthe last five years.
6 The interquartile range is in brackets.
These initial median summary statistics show estates to generally have larger households,
with older household heads, than the other types of households. Due to the presence of outliers,
robust measures of location and scale are used for the summary statistics. Unsurprisingly,
estates report the most agricultural income, while non-farmers record no agricultural income at
all. It is important to note that smallholders show some non-agricultural income at the median,
12

in comparison to estates that do not. Estates also report greater assets, which may reflect the
ability of large scale farmers to accumulate durable goods. Farmers show higher levels of
stunting and food price sensitivity. As I am specifically examining crop choice, the rest of the
analysis will focus on the smallholder agricultural households within the sample.
Next, I break the agricultural households into tobacco and non-tobacco growers. Due to
food necessities and risk reduction through diversification, few Malawian farmers monocrop
tobacco. Thus tobacco producing farming households in this study oftentimes grow additional
crops. Regardless, by choosing to plant and tend to this labor intensive crop, smallholder
tobacco growing is a significant production decision.
The summary statistics in Table 2 show smallholder tobacco farmers with higher crop
income and asset values than their non-tobacco producing counterparts. Regardless of income
and assets, these same tobacco growing households have larger levels of stunting. Additionally,
almost all tobacco households had experienced a food price shock within the last five years.
The quality of the data become important when assessing stunting. To check the accuracy of
the nutritional observations, Mei & Grummer-Strawn (2007) suggest checking for the number
of unrealistic height for age measurements below six deviations or above five deviations from
the mean. From this nutritional perspective, these data look very accurate with the number of
unrealistic individual measures around 1%.
As geographic variation exists within Malawian stunting levels (Pelletier & Msukwa, 1991),
it is important to account for regions within any stunting analysis. Figure 4 breaks Malawi into
its typically defined Northern, Central and Southern regions (United Nations, 2010). These
areas are geographically and ethnically diverse, and may be thought of as distinct populations
Orr et al. (2009). It is necessary to control for these regions when assessing the effects of
agricultural commercialization.
13
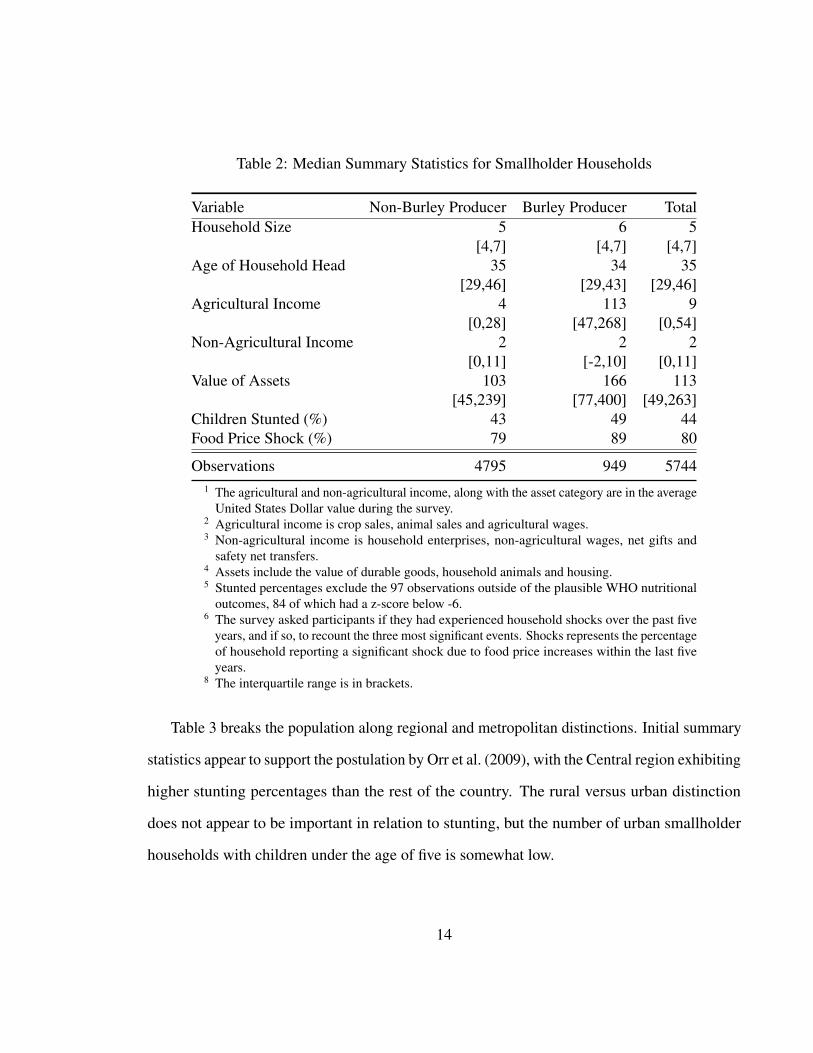
Table 2: Median Summary Statistics for Smallholder Households
Variable Non-Burley Producer Burley Producer TotalHousehold Size 5 6 5
[4,7] [4,7] [4,7]Age of Household Head 35 34 35
[29,46] [29,43] [29,46]Agricultural Income 4 113 9
[0,28] [47,268] [0,54]Non-Agricultural Income 2 2 2
[0,11] [-2,10] [0,11]Value of Assets 103 166 113
[45,239] [77,400] [49,263]Children Stunted (%) 43 49 44Food Price Shock (%) 79 89 80
Observations 4795 949 57441 The agricultural and non-agricultural income, along with the asset category are in the average
United States Dollar value during the survey.2 Agricultural income is crop sales, animal sales and agricultural wages.3 Non-agricultural income is household enterprises, non-agricultural wages, net gifts and
safety net transfers.4 Assets include the value of durable goods, household animals and housing.5 Stunted percentages exclude the 97 observations outside of the plausible WHO nutritional
outcomes, 84 of which had a z-score below -6.6 The survey asked participants if they had experienced household shocks over the past five
years, and if so, to recount the three most significant events. Shocks represents the percentageof household reporting a significant shock due to food price increases within the last fiveyears.
8 The interquartile range is in brackets.
Table 3 breaks the population along regional and metropolitan distinctions. Initial summary
statistics appear to support the postulation by Orr et al. (2009), with the Central region exhibiting
higher stunting percentages than the rest of the country. The rural versus urban distinction
does not appear to be important in relation to stunting, but the number of urban smallholder
households with children under the age of five is somewhat low.
14

Figure 4: Malawi by Region and Traditional Authority
Table 3: Stunted Household Characteristics
Variable % Stunted ObservationsOverall 44 5744Regions
Northern 39 928Central 49 2288Southern 41 2528
Household LocationRural 44 5387Urban 44 357
1 See Figure 4 for regional definitions.2 All of Malawi is considered rural outside of households
living in Blantyre, Lilongwe, Mzuzu and Zomba.
15

5 Identification, Estimation
Previous work on health outcomes in relation to household characteristics provide a wealth
of information on significant contributing factors to reducing nutritional deficiencies. Recent
literature has expanded past results to further clarify the factors linking health with development.
Deaton (2003) disputes previous studies purporting to discover a casual relationship between
income or income inequality and health. He argues for future research to greater develop the
role income and other factors play in health.
In evaluating the effects of tobacco production on childhood stunting, I control for signifi-
cant factors at the child, household, community and regional levels. The well developed health
literature continues to provide extensive references for understanding the relationship between
each of these levels and stunting. My analysis include variables that account for many of the
previously identified casual factors of stunting in the developing world.
I am particularly interested in the effect of recent shocks on chronic malnutrition. As
explained earlier, Malawi experienced numerous food price shocks, mostly because of droughts,
before these 2005 data. Two International Food Policy Research Institute papers examine
shocks in relation to childhood stunting and malnutrition. Carter & Maluccio (2002) looks at
the effects of economics shocks on stunting, while Alderman et al. (2003) determine droughts
and wars have significant negative effects on childhood stunting.
My two-stage generalized method of moments (GMM) estimation of burley adoption’s
effect on children’s health uses crop production choice in the first stage. In the second
stage, after instrumenting for the adoption decision, I estimate tobacco production’s effect on
children’s z-score. A number of control variables, along with the household’s burley production
decision and two instruments, are used to derive the predicted probability of household burley
16

adoption. This efficient prediction, which Woolridge identifies as the optimal instrument in this
binary regression situation, then instruments for burley production when estimating the second
stage concerning children’s health (Wooldridge, 2011).
I created two instruments to address the potential endogeneity of the burley production
decision. To increase the accuracy of my estimation, I implement a two-stage technique with
z-scores as my dependent variable. Z-scores capture the general health of children, and I am
Figure 5: Distribution of Childhood Z-Scores
specifically interested in the affect of crop choice on children’s health, not on the probability
of being above or below a stunting line. As seen in Figure 5, underweight children is a major
problem within Malawi, with two standard deviations below zero being the internationally
recognized threshold for stunting.
17

To avoid endogeneity concerns I developed district level instruments from the first Malawian
IHS survey from 1998. I use the number of tobacco growing households by district and the
average maize price by district as my instruments. While the pairwise correlation between
each instrument and burley adoption is stronger for the number of tobacco growers variable,
both instruments’ first stage significance at the .1% level denotes the appropriateness of their
inclusion. Exogeniety tests further support the use of these specific instruments. With a C
statistic of 0.172 and a p-value of 0.678, the failure to reject the null hypothesis provides
additional evidence of orthogonality with the error term.
While the 1998 survey is less precise than its 2003 counterpart, I managed to extract
a number of variables that help to capture the characteristics of Malawian districts. This
information is before any of the children in question were born, which further strengthens the
argument concerning any potential correlation with children under the age of five’s current
health outcomes. The first instrument counts the number of farmers growing tobacco in the
1998 survey at the district level. While the second instrument calculates lagged maize prices by
district to capture variation in prices that may alter the production decisions of farmers but not
affect the current health of household members.
Table 4: Endogenous Burley Estimations
Variable 98 Tobac & Maize Maize Only OLS
Burley -1.000*** -0.471 -0.158*(0.263) (0.306) (0.0635)
Sex 0.213*** 0.209*** 0.206***(0.0395) (0.0391) (0.0390)
Age of household head -0.00266 -0.00203 -0.00165Continued on Next Page. . .
18
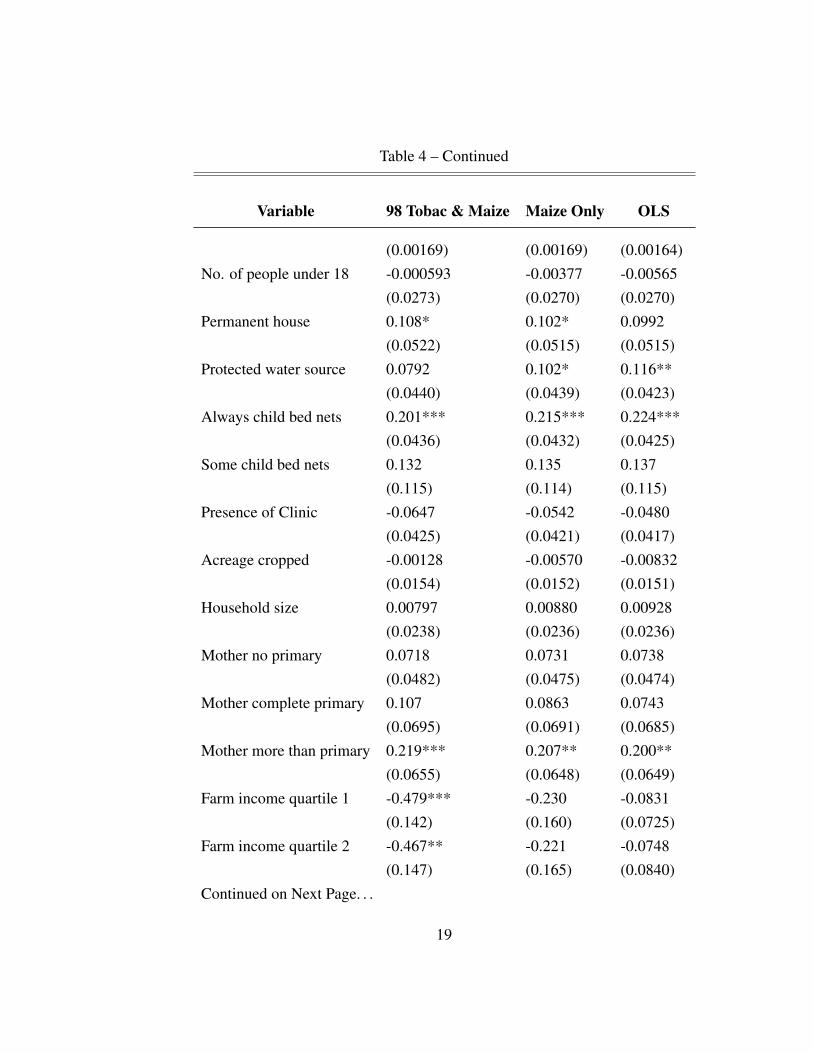
Table 4 – Continued
Variable 98 Tobac & Maize Maize Only OLS
(0.00169) (0.00169) (0.00164)No. of people under 18 -0.000593 -0.00377 -0.00565
(0.0273) (0.0270) (0.0270)Permanent house 0.108* 0.102* 0.0992
(0.0522) (0.0515) (0.0515)Protected water source 0.0792 0.102* 0.116**
(0.0440) (0.0439) (0.0423)Always child bed nets 0.201*** 0.215*** 0.224***
(0.0436) (0.0432) (0.0425)Some child bed nets 0.132 0.135 0.137
(0.115) (0.114) (0.115)Presence of Clinic -0.0647 -0.0542 -0.0480
(0.0425) (0.0421) (0.0417)Acreage cropped -0.00128 -0.00570 -0.00832
(0.0154) (0.0152) (0.0151)Household size 0.00797 0.00880 0.00928
(0.0238) (0.0236) (0.0236)Mother no primary 0.0718 0.0731 0.0738
(0.0482) (0.0475) (0.0474)Mother complete primary 0.107 0.0863 0.0743
(0.0695) (0.0691) (0.0685)Mother more than primary 0.219*** 0.207** 0.200**
(0.0655) (0.0648) (0.0649)Farm income quartile 1 -0.479*** -0.230 -0.0831
(0.142) (0.160) (0.0725)Farm income quartile 2 -0.467** -0.221 -0.0748
(0.147) (0.165) (0.0840)Continued on Next Page. . .
19
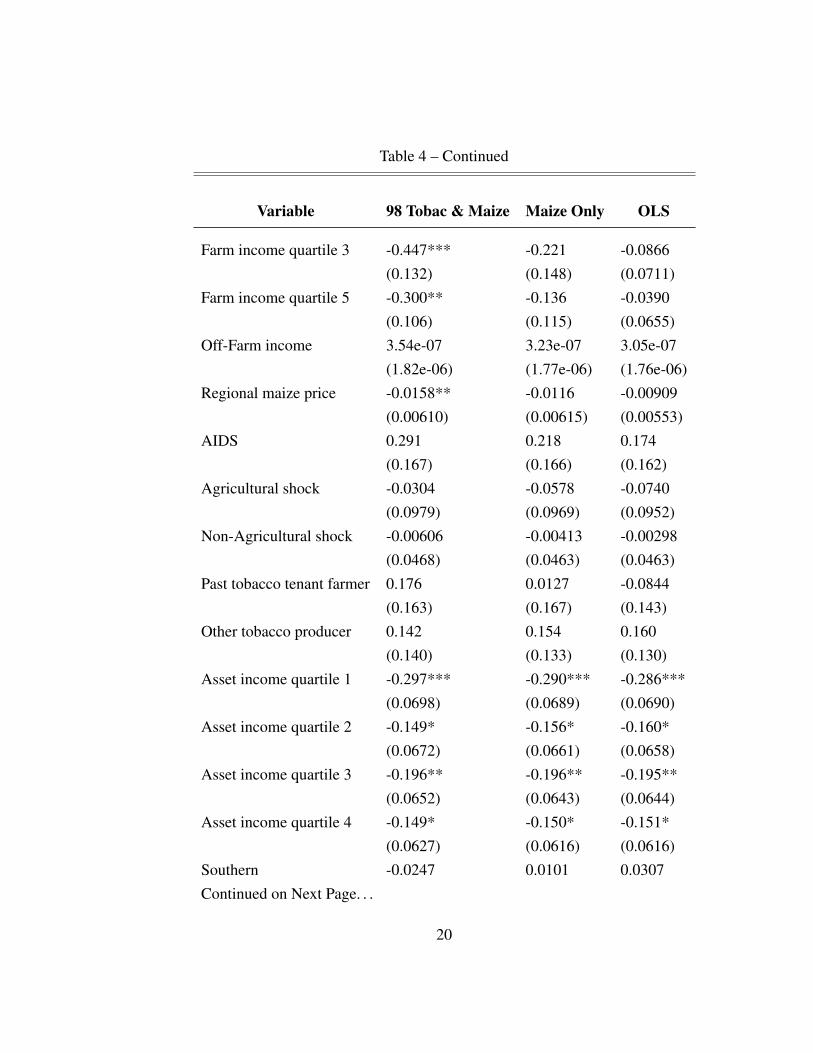
Table 4 – Continued
Variable 98 Tobac & Maize Maize Only OLS
Farm income quartile 3 -0.447*** -0.221 -0.0866(0.132) (0.148) (0.0711)
Farm income quartile 5 -0.300** -0.136 -0.0390(0.106) (0.115) (0.0655)
Off-Farm income 3.54e-07 3.23e-07 3.05e-07(1.82e-06) (1.77e-06) (1.76e-06)
Regional maize price -0.0158** -0.0116 -0.00909(0.00610) (0.00615) (0.00553)
AIDS 0.291 0.218 0.174(0.167) (0.166) (0.162)
Agricultural shock -0.0304 -0.0578 -0.0740(0.0979) (0.0969) (0.0952)
Non-Agricultural shock -0.00606 -0.00413 -0.00298(0.0468) (0.0463) (0.0463)
Past tobacco tenant farmer 0.176 0.0127 -0.0844(0.163) (0.167) (0.143)
Other tobacco producer 0.142 0.154 0.160(0.140) (0.133) (0.130)
Asset income quartile 1 -0.297*** -0.290*** -0.286***(0.0698) (0.0689) (0.0690)
Asset income quartile 2 -0.149* -0.156* -0.160*(0.0672) (0.0661) (0.0658)
Asset income quartile 3 -0.196** -0.196** -0.195**(0.0652) (0.0643) (0.0644)
Asset income quartile 4 -0.149* -0.150* -0.151*(0.0627) (0.0616) (0.0616)
Southern -0.0247 0.0101 0.0307Continued on Next Page. . .
20

Table 4 – Continued
Variable 98 Tobac & Maize Maize Only OLS
(0.0725) (0.0723) (0.0685)Central -0.329** -0.298** -0.279**
(0.111) (0.109) (0.106)Constant -0.0439 -0.719 -1.119
(0.709) (0.731) (0.600)
Observations 5,740 5,740 5,740R-squared 0.003 0.028 0.033
Robust standard errors in parentheses*** p<0.001, ** p<0.01, * p<0.05
The results are consistent throughout Table 4. Z-scores are used as the dependent variable
in all of the estimations, thus the lower the score the worse the health outcome. In the
first two columns instruments are used to obtain efficient two step generalized method of
moment estimates due to the presence of significant heteroskedasticity. Column one uses both
instruments, while the second column only instruments with 1998 maize prices. The final
column presents the ordinary least squares results to demonstrate the direction of bias on the
burley variable.
A series of weak identification tests were performed for the excluded instruments. When
the full instrument set was used, the value of the F-statistic was 359, which is significantly
larger than the standard critical value of 16. The F-statistic drops to 254 in the second columns,
which continue to reject a weak instruments argument. These significant F-statistics, all with
21

p-values of 0, demonstrate the robustness of my instruments.
To examine the suspected endogenous burley variable, an endogeneity test was performed
after the estimations. In each of these tests, the null hypothesis was that burley is an exogenous
variable. This hypothesis was rejected in both of the two step gmm estimations. These results
indicate a strong presence of endogeneity in the burley variable, further justifying the use of
alternative characteristics to instrument for tobacco adoption.
A number of control variables are used to isolate the burley affect on child’s nutrition.
These variables roughly fall into individual, household and community categories. I looked to
the literature to account for variables that would exogenously affect nutritional status.
The only true individual characteristic is sex of the child. Somewhat surprisingly, male
children are significantly healthier than their female counterparts. Some other commonly
referenced individual level factors, like birth size and immunization history, are unfortunately
unavailable.
Numerous household level control variables account for health practices and status. General
information like, age of the household head, number of people in the household below the age of
18, household size, off-farm income and non-agricultural household shocks proved insignificant.
Farm related matters like acreage cropped, agricultural shocks, former tobacco tenant farmer
and households producing non-burley tobacco also lacked significance. Household health
control variables include if the household resides in a permanent dwelling, if they obtain water
from a protected water source, their usage of bed nets for children under the age of 5, and the
presence of AIDS in the household. Always having young children sleep under a bed nets
significantly increased z-scores. Additionally, consistent with the seminal work of Lundberg
et al. (1997), higher educated mothers significantly increased health outcomes. Finally, lower
levels of asset or farm income significantly decreased z-scores.
22
A few regional characteristics were also incorporated as control. Higher regional maize
prices, recovered with the help of Nick Minot, significantly decreased health outcomes. Also,
households in the Central region had significantly lower z-scores in comparison to the Northern
region.
To ensure that smallholder tobacco producers from the previous year accurately captures
long term adoption patterns, I generated a density graph of the number of years of tobacco
production over the last five years. It appears that tobacco and non-tobacco producers are fairly
consistent in their planting patterns. A large percentage of producers grew tobacco all of the
last five years, and the majority of tobacco farmers grew tobacco in at least three of the last five
years. The vast majority of non-tobacco producer had not produced tobacco in any of the last
five years. Figure 6 confirms my decision to separate tobacco and non-tobacco farmers based
on their previous year’s planting, due to the general consistency in their planting practices.
6 Future Work
I’m currently working on incorporating interaction effects into the model, to understand more
specifically how farm income affects children’s health. I plan to tie my research in with the
previous findings from the World Bank (2007). Finally, I would like to strengthen the causality
argument.
23

Figure 6: Years of Tobacco Farming
24

ReferencesAlderman, H., Hoddinott, J., & Kinsey, B. (2003). Long-term consequences of early childhood
malnutrition. Technical Report FCND discussion paper No. 168, International Food PolicyResearch Institute. 16
Belli, P. (1971). The economic implications of malnutrition: The dismal science revisited.Economic Development and Cultural Change, 20(1), 1–23. 3
Briend, A., Hasan, K., Aziz, K., Hoque, B., & Henry, F. (1989). Measuing change in nutritionalstatus: A comparion of different anthropometric indicies and the samples sizes required.European Journal of Clinical Nutrition, 43(11), 769–778. 4
Carter, M. & Maluccio, J. (2002). Social capital and coping with economic shocks: An analysisof stunting in South African children. Technical Report FCND discussion paper No. 142,International Food Policy Research Institute. 16
Deaton, A. (2003). Health, inequality, and economic development. Journal of EconomicLiterature, 41(1), 113–158. 16
Deb, U. J., Hossain, M., & Jones, S. (2009). Rethinking food security strategy: Self-sufficiencyor self-reliance. UK Department for International Development. 2
Dibley, M., Goldsby, J., Staehling, N., & Trowbridge, F. (1987). Development of normalizedcurves for the international growth reference: historical and technical considerations. TheAmerican Journal of Clinical Nutrition, 46, 736–748. 3
Duflo, E. (2003). Grandmothers and granddaughters: Old-age pensions and intrahouseholdallocation in South Africa. The World Bank Economic Review, 17, 1–25. 4
Espo, M., Kulmala, T., Maleta, K., Cullinan, T., Salin, M.-L., & Ashorn, P. (2007). Determi-nants of linear growth and predictors of severe stunting during infancy in rural Malawi. ActaPaediatrica, 91(12), 1364–1370. 4
Fawzi, W., Herrera, M. G., Spiegelman, D., Amin, A. E., Nestel, P., & Mohamed, K. (1997). Aprospective study of malnutrition in relation to child mortality in Sudan. American Journalof Clinical Nutrition, 65, 1065–9. 4
Grantham-McGregor, S., Cheung, Y. B., Cueto, S., Glewwe, P., Richter, L., Strupp, B., & theInternational Child Development Steering Group (2007). Developmental potential in the first 5 years for children in developing countries. Lancet, 369, 60–70. 4
25

Green, E. (2008). Diversification of de-agrarianization? income diversification, labor, andprocesses of agrarian change in southern and northern Malawi, mid-1930s to mid-1950s.The Agricultural History Society, 82(2), 164–192. 7
Habicht, J.-P., Yarbrough, C., Martorell, R., Malina, R., & Klein, R. (1974). Height and weightstandards for preschool children: How relevant are ethnic differences in growth potential?Lancet, 611–614. 3
Harrigan, J. (2003). U-turns and full circles: Two decades of agriculture reform in Malawi1981-2000. World Development, 31(5), 847–863. 2, 7
Harrigan, J. (2008). Food insecurity, poverty and the Malawian starter pack: Fresh start or falsestart? Food Policy, 33, 237–249. 2
Jaffee, S. (2003). Malawi’s tobacco sector: Standing on one strong leg is better than on none.Africa Region Working Paper, 55, 1–58. World Bank Working Paper Series. 5, 7, 8, 9
Johnston, B. & Mellor, J. (1961). The role of agriculture in economic development. TheAmerican Economic Review, 51(4), 566–593. 2
Kadzandira, J., Phiri, H., & Zakeyo, B. (2004). Malawi tobacco sector performance audit: Theperceptions and views of smallholder tobacco farmers on the state of play in the tobaccosector. Technical report, The World Bank. 8
Kees van Donge, J. (2002). Disordering the market: The liberalisation of burley tobacco inMalawi in the 1990s. Journal of Southern African Studies, 28(1), 89–115. Special Issue:Malawi. 7
Kennedy, E. (1994). Agricultural Commercialization, Economic Development and Nutrition,chapter Health and Nutrition Effects of Commercialization of Agriculture, (pp. 79–99).International Food Policy Research Institute. 6
Kherallah, M., Delgado, C., Gabre-Madhin, E., Minot, N., & Johnson, M. (2002). ReformingAgriculture Markets in Africa. International Food Policy Research Institute. 2
Lea, N. & Hanmer, L. (2009). Constraints to growth in Malawi. Policy Research WorkingPaper. 5
Levy, S., Barahona, C., & Chinsinga, B. (2004). Food security, social protection, growthand poverty reduction synergies: The starter pack programme in Malawi. The OverseasDevelopment Institute Natural Resource Perspectives. Number 95. 2
26

Lundberg, S., Pollak, R., & Wales, T. (1997). Do husbands and wives pool their resources?Evidence from the United Kingdom child benefit. The Journal of Human Resources, 32(3),463–480. 22
Masanjala, W. H. (2006). Cash crop liberalization and poverty alleviation in Africa: Evidencefrom Malawi. Agricultural Economics, 35, 231–240. 6
Maxwell, S. & Fernando, A. (1989). Cash crops in developing countries: The issues, the facts,the policies. World Development, 17(11), 1677–1708. 2
Mei, Z. & Grummer-Strawn, L. (2007). Standard deviation of anthropometric z-scores as adata quality assessment tool using the 2006 who growth standards: A cross country analysis.Bulletin of the World Health Organization, 85(6), 441–448. 13
Minot, N. (2010). Staple food prices in Malawi. In Food Security Collaborative WorkingPapers, AAMP. 4
Morgan, W. & Solarz, J. (1994). Agricultural crisis in Sub-Saharan Africa: Developmentconstraints and policy problems. The Geographical Journal, 160(1), 57–73. 2
Ogbu, J. (1973). Seasonal hunger in Tropical Africa as a cultural phenomenon. the OnichaIbo of Nigeria and Chakaka Poka of Malawi examples. Africa: Journal of the InternationalAfrican Institute, 43(4), 317–332. 5
Orr, A. (2000). ‘Green gold’?: Burley tobacco, smallholder agriculture, and poverty alleviationin Malawi. World Development, 28(2), 347–363. 5
Orr, A., Mwale, B., & Saiti-Chitsonga, D. (2009). Exploring seasonal poverty traps: The‘six-week window’ in southern Malawi. Journal of Development Studies, 45, 227–255. 6,13, 14
Pelletier, D., Deneke, K., Kidane, Y., Haile, B., & Negussie, F. (1995). The food-first bias andnutrition policy: Lessons from Ethiopia. Food Policy, 20(4), 279–298. 2
Pelletier, D. & Msukwa, L. (1991). The use of national sample surveys for nutritional surveil-lance: Lessons from Malawi’s national sample survey of agriculture. Social Science Medicine,32(8), 887–898. 13
Peters, P. E. (1996). Failed Magic or Social Context? Market Liberalisation and the RuralPoor in Malawi. Cambridge, MA : Harvard University. Harvard Institute for InternationalDevelopment. 5
Prowse, M. (2009). Becoming a bwana and burley tobacco in the central region of Malawi.The Journal of Modern African Studies, 47, 575–602. 9
27
Republic of Malawi (2000). Interim poverty reduction and growth strategy paper - a road map.Technical report, Republic of Malawi. 5
Sahn, D. & Arulpragasam, J. (1991). The stagnation of smallholder agriculture in malawi: Adecade of structural adjustment. Food P, 16(3), 219–234. 9
Strauss, J. & Thomas, D. (1998). Health, nutrition, and economic development. Journal ofEconomic Literature, 36, 766–817. 3
Takane, T. (2008). African Rural Livelihoods under Stress: Economic Liberalization andSmallholder Farmers in Malawi. Institute of Developing Economics, JETRO. 5, 7, 8
Tobin, R. & Knausenberger, W. (1998). Dilemmas of development: Burley tobacco, theenvironment and economics growith in Malawi. Journal of Southern African Studies, 24(2),405–424. 5, 8
Tsonga, E. (2004). An analysis of the performance of Malawi’s tobacco production and exports.Technical report, Malawian Ministry of Agriculture, Irrigation and Food Security. 5, 8, 9
United Nations (2010). Regional map of Malawi. 13
United Nations Development Programme (2009). Human development report 2009. Technicalreport, The United Nations. 4
Waterlow, J. C., Buzina, R., Keller, W., Land, J. M., Nichaman, M. Z., & Tanner, J. M. (1977).The presentation and use of height and weight data for comparing the nutritional status ofgroups of children under the age of 10 years. Bulletin of the World Health Organization,55(4), 489–498. 3
WHO (2009). WHO global database on child growth and malnutrition. Malawi. 4
Wooldridge, J. (2011). Econometric Analysis of Cross Section and Panel Data (Second ed.).The MIT Press. 17
World Bank (1989). Sub-Saharan Africa From Crisis to Sustainable Growth: A Long-TermPerspective Study. World Bank. 5
World Bank (2007). Malawi poverty and vulnerability assessment: Investing in our future. FullReport 36546-MW, World Bank. 23
World Bank (2009). Gross national income per capita 2008, Atlas method and PPP. WorldDevelopment Indicators Database. 4
28