untitled - minnesota state legislature
TRANSCRIPT


2012 Annual Report
Introduction
From the Executive Director ......................................................................... 3
How Lottery Dollars Benefit Minnesota ....................................................... 4
Games and Winners ............................................................................................. 6
Retailers .............................................................................................................. 12
Commitment to Social Responsibility ............................................................... 13
Financials
Independent Auditor’s Report .................................................................... 14
Management Discussion and Analysis ........................................................ 15
Summary Results of Operations .................................................................. 16
Notes to the Financial Statements .............................................................. 22
Certificate of Achievement for Excellence in Financial Reporting ........... 29
Certification of Executive Director and Chief Financial Officer ................ 30
Contact Information .......................................................................................... 31
This document is made available electronically by the Minnesota Legislative Reference Library as part of an ongoing digital archiving project. http://www.leg.state.mn.us/lrl/lrl.asp

Dear Readers:
The Minnesota State Lottery continued its record-setting pace in fiscal year 2012. For the fifth consecutive year, ticket sales set a record, coming in at $520 million. The money raised for the state beneficiaries also set a new record of $123.6 million.
The sales mark of $520 million is an increase of $15.6 million from FY11. Scratch game sales set a new record of $355.3 million. Sales of lotto games totaled $164.8 million, which is up $15.2 million over the previous year. The record $656 million Mega Millions® jackpot that was won on March 30 contributed to this increase.
Prize payments to players were a record $320.6 million, while the Lottery’s hard-working retail partners earned a record $31.6 million in commissions and incentives for selling lottery products. This is an average of $10,100 per business.
Strong increases in our lotto-style games, especially $2 Powerball® and Mega Millions, as well as continued success with scratch game sales, were the main drivers toward the sales record. These games also helped to make up the $32 million in sales lost during the state shutdown in July 2011. We have seen sales increase each of the last five years, a feat that only a handful of U.S. lotteries can claim. This has helped us to meet our important mission of raising revenue for the state of Minnesota. The Lottery’s retail partners and staff have worked tirelessly to pull off this monumental feat.
Important state programs and projects gained $123.6 million from lottery ticket sales. Among the beneficiaries, the Environment and Natural Resources Trust Fund earned $31 million for critical environmental projects, while the Game & Fish Fund and Natural Resources Fund each received $12.2 million. Programs supported by the state’s General Fund netted $68.2 million.
We will continue to work hard to grow sales and maximize the contributions to state programs that benefit all Minnesotans.
Sincerely,
Ed Van Petten Executive Director
3

HOW LOTTERY DOLLARS BENEFIT MINNESOTA
Sales of lottery products reached a record $520 million in fiscal year 2012. This is the fifth consecutive year of record-setting sales and the second year in a row sales exceeded $500 million.
The money raised for the state beneficiaries also set a new record of $123.6 million.
Revenues from the Lottery are divided between the state’s General Fund and several environmental programs. The Minnesota Constitution requires that 40 percent of net proceeds — the amount remaining after all expenses have been paid — go to the Environment and Natural Resources Trust Fund through the year 2024. The remaining 60 percent is appropriated at the discretion of the legislature and is currently dedicated to the General Fund, including a specific appropriation to problem gambling programs.
In addition, a 6.5 percent in-lieu-of-sales tax (collected by the Lottery rather than individual retailers) on lottery tickets is also available for legislative appropriation. Under current law, these proceeds are divided between the Game and Fish Fund (36.2 percent), the Natural Resources Fund (36.2 percent) and the General Fund (27.8 percent). The Natural Resources Fund appropriation is further divided between state parks and trails (16.3 percent), metropolitan parks and trails (16.3 percent), local parks (2.2 percent), and the state’s three zoos (1.4 percent).
Prizes not claimed after one year also benefit the General Fund. In fiscal year 2012, the General Fund received $68.3 million from the Lottery (including $2.1 million for problem gambling programs), the Environment and Natural Resources Trust Fund received $31 million and the Game and Fish Fund and Natural Resources Fund received $12.2 million each.
4

Visit mnlottery.com to learn about projects funded by the Environment & Natural Resources Trust Fund.
$120 million
$90 million
$60 million
$30 million
1990 1991 1992 1993 1994 1995 1996 1997 1998 1999 2000 2001 2002 2003 2004 2005 2006 2007 2008 2009 2010 2011 2012
YEARLY LOTTERY CONTRIBUTIONS TO THE STATE OF MINNESOTA SINCE INCEPTION
5

GAMES & WINNERS
Scratch games continue to be popular in Minnesota. The Lottery introduced 75 new scratch games in FY12, including Million $$ Match, the first $30 ticket with a $1 million top prize.
Rodney Hegna of Hayfield, pictured with his wife Jen, bought gasoline and a Million $$ Match scratch ticket. He thought “that’s not possible” after he uncovered the $1 million prize.
The artwork of Jim Hansel, one of Minnesota’s premier wildlife, nature and landscape artists, was featured on the Wildlife Winning$ game book. Players could also enter non-winning tickets into a drawing to win a Jim Hansel print.
Wade Kutzera of St. Joseph won $300,000 on a Wildlife Winning$ ticket.
Players had the opportunity to win one of four trips to Hollywood for the chance to play a Lottery-only edition of Wheel of Fortune® with Pat Sajak and Vanna White through the Wheel of Fortune scratch game and second-chance promotion.
Edith Bodie of Gilbert, a huge fan of Wheel of Fortune, won the opportunity to play the game with Pat Sajak. She won $6,100 on the show.
6
© 2013 Califon Productions, Inc. Wheel of Fortune is a registered trademark of Califon Productions, Inc. All rights reserved. www.wheeloffortune.com

The Lottery teamed up with three Minnesota-based companies and Explore Minnesota Tourism to promote fishing within the state of Minnesota. The fishing family of games offered second-chance prizes that included two 1875 Pro-V Lund boats with a Mercury motor and trailer; $2,500 Gander Mountain gift cards; $500 Rapala gift cards; and Minnesota vacations.
Scratch game winners Narda Bates of St. Paul, Cathy Paquette & Valerie Weaver of Coon Rapids, Abraham Wolf of Cohasset and Julie Munson of Montrose.
7

Minnesota saw its jackpot winner counts increase in FY12!
Thomas and Kathleen Morris of Burnsville made Minnesota State Lottery history on Aug. 10, 2011 when they became Minnesota’s 21st Powerball jackpot winners and the winners of Minnesota’s largest jackpot when they won the $228.9 million Powerball jackpot. The couple selected the cash option of $123.6 million.
SuperAmerica, 16161 Cedar Ave. in Lakeville, received a $50,000 bonus for selling the winning ticket. Acting Lottery Director Jenny Canfield (back row, left) presented a ceremonial check to Kirk Ellis, regional manager for SuperAmerica (front row, 2nd from left). Nick Green (back row, 4th from left) sold the winning ticket.
Two Hot Lotto® jackpots were also won in Minnesota. Don Conrad of Grand Rapids won a $2.61 million jackpot on Jan. 14, 2012. He selected the $1.98 million cash option. Two months to the day later, a family from North Mankato became Minnesota’s tenth Hot Lotto jackpot winners when they won the $2.99 million jackpot on March 14. They opted for the $2.21 million cash option payment.
Minnesota’s 9th and 10th Hot Lotto jackpot winners: Don Conrad and his wife Sandy and Thomas H. Browne, his son Lee Browne and his daughter Elaine Pleiss.
8

Some enhancements were made to Powerball, the Lottery’s most well-known game, in January 2012. The changes resulted in more $1 million winners, bigger starting jackpots and better overall odds of winning a prize. The Match 5 prize was increased to $1 million (from $200,000); Match 5 winners who add Power Play® to their ticket automatically win $2 million. The starting jackpot is now $40 million, up from $20 million. The pool of numbers the Powerball number is drawn from decreased from 39 to 35, resulting in better odds of winning the jackpot (now 1 in 175.2 million, down from 1 in 195.2 million) and better overall odds of winning a prize (from 1 in 35.1 to 1 in 31.8). The ticket price went from $1 to $2 to fund these bigger prizes.
Mega Millions, which is a relatively new game in Minnesota, got a huge boost in March when the jackpot grew to a record $656 million. As a result of the jackpot run (January 24, 2012 through March 30, 2012), $5.2 million was generated for the state of Minnesota. This run, in part, helped set a new monthly sales record of $61.6 million in March.
Russicha Deloach of New Hope won $250,000 when the first five numbers on her ticket matched the numbers drawn!
David Froats of Vadnais Heights added the Megaplier® option to his ticket for an extra $1; his $10,000 prize became $40,000!
Minnesota Millionaire Raffle continues to be a favorite game among Minnesota State Lottery players. All 600,000 tickets were sold in 49 days this year, a new record. Mike Snyder of Wadena was one of two lucky players to win the $1 million top prize. He claimed the prize with his wife, Lea, at his side.
$1 million Raffle winner Mike Snyder of Wadena, with his wife Lea, is introduced to the media at Holiday in Wadena, where he bought his winning ticket.
®
9

The Lottery’s other lotto games continued to produce winners throughout the fiscal year.
Lotto game winners Sharon Strle of Britt, Benjamin Ramos of Wells, Robert “Gerb” Bruce of Sauk Centre, Gloria Banks of St. Paul and Hau Doan of New Brighton.
Northstar CashNorthstar Cash
10

Lottery players can win cash and prizes throughout the year by entering second-chance contests. During FY12, ten players who entered non-winning Million $$ Match tickets on LuckyMN.com played Match 3 for the chance to win $10,000, $15,000, $20,000 or $100,000. These events were held on Twin Cities Live, at a Minnesota Twins game and during halftime at a Minnesota Timberwolves game.
Clayton Bleske of South St. Paul won $10,000 playing Match 3 on Twin Cities Live!
Helen Price of Elk River played Match 3 at a Minnesota Twins game at Target Field and won $10,000!
11

RETAILERS
More than 3,100 authorized lottery retailers, located throughout Minnesota, play a crucial role in the success of the Lottery.
Retailers receive 5.5 cents for each $1 of ticket sales at their business, as well as 1 percent of the amount of each winning ticket cashed at their store (retailers pay prizes up to $599). Retailers also receive a bonus for selling qualifying top prizes or jackpot-winning tickets after the prize has been claimed. Winning ticket bonuses were paid to retailers during the fiscal year ranging from $130 to $50,000.
In fiscal year 2012, lottery retailers earned a record $31.6 million in commission and incentives — an average of $10,100 per store.
TOP 10 RETAILERS IN FISCAL YEAR 2012
1. Airport Foundation, MSP Airport, St. Paul
2. M & H Gas, Moorhead
3. Orton’s Moorhead Food Mart, Moorhead
4. Holiday, St. Paul (Rice St.)
5. East Grand Station, East Grand Forks
6. Rainbow Foods, Minneapolis (26th Ave. S.)
7. Cub Foods, Brooklyn Center
8. M & H Gas, St. Paul
9. Cub Foods, Maple Grove
10. Cub Foods, Crystal
12

COMMITMENT TO SOCIAL RESPONSIBILITY
As an agency of the state of Minnesota, the Lottery is held to a high standard. It is not only expected to raise money for good causes, but to do so with integrity and regard to the best interest of its customers and the citizens of Minnesota. The goal is to be recognized as a leader in the United States and throughout the world in the area of social responsibility.
The social responsibility programs are wide ranging, covering all aspects of the Lottery’s operations. It includes the commitment to business, player protection policies and programs to help understand, prevent and treat problem gambling.
BUSINESS INTEGRITY
The Lottery strives to conduct its operations in a manner that is open, transparent and accountable. An annual independent financial audit and periodic outside audits of the Lottery’s security and technology systems are completed. Lottery staff regularly communicates with the office of the governor, the legislature and other government agencies about lottery finances and operations. The Lottery’s security department works closely with law enforcement agencies to vigorously investigate any allegations of wrongdoing relating to the Lottery. All lottery products are extensively tested before putting them on sale and the drawing systems are tested daily to ensure that every ticket stands an equal chance of winning.
PLAYER COMMITMENT
Lottery customers are entitled to lottery games that can be purchased with complete confidence regarding their security and integrity. To this end the Lottery has adopted a Player Commitment Statement that outlines the policies for achieving these aims. The Lottery has also initiated a retailer compliance program that ensures retailers follow the rules and regulations outlined in their contract when interacting with players and when paying winners. Additional efforts have been made to encourage players to sign tickets and self-service terminals have been introduced at many retail locations that allow players to check their own tickets.
FRAUD PROTECTION
Too many Minnesotans have been victimized by scam artists seeking to convince the vulnerable that they have won a prize in a lottery that they have not entered. To combat these fraudulent activities, the Lottery has joined with many other public agencies, non-profit organizations and private businesses in a cooperative effort to combat lottery and sweepstakes fraud.
RESPONSIBLE GAMBLING AND PROBLEM GAMBLING
For most people, playing the lottery is nothing more than an enjoyable diversion. For a few, however, lottery play can become excessive. They may play beyond their means or even develop an addiction to gambling. The Minnesota State Lottery is committed to maintaining its status as a world leader in the promotion of responsible gambling and the prevention of problem gambling. To this end the Lottery will continue to make responsible choices, including providing complete information about the odds of winning, the process of selecting winners and information about problem gambling services should the need arise.
The Minnesota State Lottery will also continue its partnerships with organizations that work to treat and prevent problem gambling, including the National Council on Problem Gambling, Northstar Problem Gambling Alliance and the Minnesota Department of Human Services. Lottery staff is also working with the World Lottery Association on the development of worldwide standards for lottery responsible gambling programs and plans to seek certification at the highest level once this program is in place. Minnesota State Lottery staff were asked to participate in several problem gambling conferences throughout North America and the Lottery has donated the resources of its advertising agency to help develop materials that aid in this effort.
In fiscal year 2012, $2.1 million was appropriated to the Department of Human Services for problem gambling treatment and prevention, bringing the Lottery’s contributions for these efforts to more than $35 million since 1990. Lottery contributions to problem gambling are determined by the Legislature.
Visit mnlottery.com for information on problem gambling treatment and
prevention.
13

Schechter Dokken Kanter Andrews & Selcer Ltd
Suite 1600
100 Washington Avenue South
Minneapolis, MN
55401-2192
Phone 612-332-5500
Fax 612-332-1529
E-mail [email protected]
www.sdkcpa.com
The Director Minnesota State Lottery Roseville, Minnesota
We have audited the accompanying balance sheets of the Minnesota State Lottery as of and for the years ended June 30, 2012 and 2011, as listed in the table of contents. These financial statements are the responsibility of the Minnesota State Lottery’s management. Our responsibility is to express an opinion on these financial statements based on our audits.
We conducted our audits in accordance with auditing standards generally accepted in the United States of America and the standards applicable to financial audits contained in Government Auditing Standards, issued by the Comptroller General of the United States. Those standards require that we plan and perform the audit to obtain reasonable assurance about whether the financial statements are free of material misstatement. An audit includes examining, on a test basis, evidence supporting the amounts and disclosures in the financial statements. An audit also includes assessing the accounting principles used and significant estimates made by management, as well as evaluating the overall financial statement presentation. We believe that our audits provide a reasonable basis for our opinion.
As discussed in Note 1, the financial statements present only the Minnesota State Lottery, an Enterprise Fund of the State of Minnesota, and do not purport to, and do not, present the financial statements of the State of Minnesota.
In our opinion, the financial statements referred to above present fairly, in all material respects, the financial position of the Minnesota State Lottery as of June 30, 2012 and 2011, and the results of its operations and cash flows for the years then ended in conformity with accounting principles generally accepted in the United States of America.
In accordance with Government Auditing Standards, we have also issued separately our report dated October 9, 2012, on our consideration of the Minnesota State Lottery’s internal control over financial reporting and on our tests of its compliance with certain provisions of laws, regulations, contracts, and grant agreements, and other matters. The purpose of that report is to describe the scope of our testing of internal control over financial reporting and compliance and the results of that testing, and not to provide an opinion on the internal control over financial reporting or on compliance. That report is an integral part of an audit performed in accordance with Government Auditing Standards and should be considered in assessing the results of our audits.
Accounting principles generally accepted in the United States of America require that the management’s discussion and analysis on pages 2 through 6 be presented to supplement the basic financial statements. Such information, although not a part of the basic financial statements, is required by the Governmental Accounting Standards Board, who considers it to be an essential part of financial reporting for placing the basic financial statements in an appropriate operational, economic, or historical context. We have applied certain limited procedures to the required supplementary information in accordance with auditing standards generally accepted in the United State of America, which consisted of inquiries of management about the methods of preparing the information and comparing the information for consistency with management’s responses to our inquires, the basic financial statements, and other knowledge we obtained during our audit of the basic financial statements. We do not express an opinion or provide any assurance on the information because of the limited procedures do not provides us with sufficient evidence to express an opinion or provide any assurance.
Our audit was conducted for the purpose of forming an opinion on the financial statements as a whole. The introductory section and statistical section are presented for purposes of additional analysis and are not a required part of the financial statements. The introductory and statistical sections have not been subjected to the auditing procedures applied in the audit of the basic financial statements and, accordingly, we do not express an opinion or provide any assurance on them.
October 9, 2012
INDEPENDENT AUDITOR’S REPORT
14

MANAGEMENT DISCUSSION AND ANALYSIS
OVERVIEW OF THE FINANCIAL STATEMENTS
This discussion and analysis includes an overview of financial activities regarding the financial performance of the Minnesota State Lottery for the fiscal year ended June 30, 2012 and should be read in conjunction with the transmittal letter and supplementary information included in this report. This report consists of three parts: management’s discussion and analysis, the basic financial statements and the notes to the financial statements. Included below and on the following pages are the financial highlights, summary of contributions to the State, summary results of operations for years ended June 30, 2012, 2011 and 2010 and a condensed version of the balance sheets as of June 30, 2012, 2011 and 2010.
FINANCIAL HIGHLIGHTS
The Minnesota State Lottery achieved record operating revenue of $520.1 million in fiscal year 2012. Lotto ticket sales led the way increasing $15.1 million over the previous year while scratch ticket sales were mostly unchanged. Lottery Powerball sales were a significant factor in the increased sales in fiscal year 2012 contributing $11.5 million over fiscal year 2011. Much of the increase in Powerball revenue was the result of the change in price point from $1 to $2 as well as the consistently high jackpots: a direct result of the new Powerball game structure. Gopher 5 and Mega Millions sales also contributed significantly in the Lottery’s record sales together providing an increase $9.8 million in sales.
Compulsive Gambling$34,740,539 • 2%
Game & Fish Fund$129,455,539 • 6%
Natural Resources Fund$129,455,539 • 6%
General Fund$1,227,570,401 • 57%
Other$38,418,030 • 2%
Environmental & NaturalResources Trust Fund$583,229,064 • 27%
SUMMARY OF CONTRIBUTIONS TO STATE
The Lottery contributed $123.8 million to the State in fiscal year 2012. This was a slight increase from the $121.9 million contributed in 2011 and the $122.2 million contributed in fiscal year 2010. The following table provides detail on the total amounts transferred to the State as well as the source of the transfers provided to the state in the last three fiscal years.
The Lottery has contributed over $2 billion to the State since inception
CONTRIBUTIONS TO THE STATE 2012 2011 2010
Net proceeds to the State $77,524,634 $77,110,501 $78,374,378
In-lieu-of-sales tax $33,802,180 $32,778,367 $32,432,967
Compulsive gambling contribution $2,230,000 $2,230,000 $2,230,000
Unclaimed prizes to the State $10,250,589 $9,759,269 $9,211,142
Total paid to State $123,807,403 $121,888,137 $122,248,487
15

2012 2011 2010
Gross receipts $486,284,810 $471,736,178 $466,575,526
Prizes, commissions and ticket costs $370,218,586 $357,892,568 $351,471,062
Gross profit $116,066,224 $113,843,610 $115,104,464
Operating expenses $26,371,872 $24,865,261 $25,554,707
Operating income $89,694,352 $88,978,349 $89,549,757
Non-operating revenues (expense):
Interest earned on investments $155,819 $121,421 $265,763
Unused Compulsive Gambling $155,052 0 0
Payments to State (not including sales tax) ($90,005,223) ($89,099,770) ($89,815,520)
Total non-operating revenue (expense) ($89,694,352) ($88,978,349) ($89,549,757)
Net Income $0 $0 $0
SUMMARY RESULTS OF OPERATIONS
OPERATING INCOME
A steady increase in operating revenue in the last three years is largely due to the emphasis on marketing scratch games as well as changes in the price of a Powerball ticket increasing from one to two dollars. Other factors contributing to the increase in revenue include the Lottery’s concentrated efforts on increasing the number of retail locations as well as improving web based exposure through our Luckymn web site and Facebook. Operating revenue increased $15.6 million or 3.1 percent in fiscal year 2012 over fiscal year 2011 and increased $5.5 million or 1.1 percent in fiscal year 2011 over fiscal year 2010.
OPERATING EXPENSES
Operating expenses increased in fiscal year 2012 by $1.5 million or 6.1 percent from fiscal year 2011 largely due to an increase in marketing and promotion expenses. Operating expenses decreased in fiscal year 2011 by $689 thousand or 2.7 percent over fiscal year 2010 due to a decrease in marketing, promotion and salary expenses.
16

GROSS RECEIPTS BY GAME 2012 2011 2010
Scratch ticket sales $355,260,670 $354,813,430 $338,114,154
Lotto ticket sales:
Daily 3® $12,844,327 $13,258,715 $12,939,238
Gopher 5® $19,611,685 $16,457,217 $15,451,880
Powerball® $70,516,182 $59,028,789 $82,252,717
Power Play® $3,141,464 $3,816,815 $4,997,806
Mega Millions® $24,678,710 $17,995,480 $5,900,573
Megaplier® $1,563,907 $1,545,180 $582,425
Hot Lotto® $8,604,488 $12,250,143 $13,805,414
Sizzler® $823,377 $1,065,828 $1,096,382
Northstar Cash® $9,941,086 $10,872,164 $11,899,536
Minnesota Millionaire Raffle $5,993,670 $5,999,710 $4,998,520
Progressive Print-N-Play® $7,053,971 $7,332,938 $6,930,076
Total Lotto Ticket Sales $164,772,867 $149,622,979 $160,854,567
Operating revenue $520,033,537 $504,436,409 $498,968,721
Other income $53,453 $88,136 $39,772
Total operating revenue $520,086,990 $504,524,545 $499,008,493
Less in-lieu-of-sales tax $33,802,180 $32,788,367 $32,432,967
Gross Receipts $486,284,810 $471,736,178 $466,575,526
SCRATCH GAMES
Scratch game sales accounted for 68.3 percent, 70.3 percent and 67.8 percent of sales respectively for fiscal years 2012, 2011 and 2010. Scratch sales remain mostly unchanged in fiscal year 2012 over fiscal year 2011. Fiscal year 2011 scratch sales were up 4.9 percent over fiscal year 2010. Total scratch sales were $355.3 million in fiscal year 2012, $354.8 million in fiscal year 2011 and $338.1 million in fiscal year 2010.
LOTTO GAMES
Total Lotto Game sales increased in fiscal year 2012 largely due to the $11.5 million increase in Powerball sales. Other contributing factors include the increased price of a Powerball ticket as well as the $640 million Mega Millions jackpot run in fiscal year 2012. All other Lotto games in the aggregate have remained very consistent with sales of $69.6 million, $72.6 million and $72.7 million in the last three fiscal years 2012, 2011 and 2010.
17

BALANCE SHEET SUMMARY
CONDENSED BALANCE SHEETS 2012 2011 2010
Assets:
Cash and cash equivalents $21,756,782 $16,539,449 $13,981,238
Receivables $4,720,077 $4,957,153 $7,569,329
Inventory and prepaid expenses $1,164,238 $1,112,825 $1,827,037
Capital assets $1,535,356 $2,151,282 $2,265,672
Total assets $29,176,453 $24,760,709 $25,643,276
Liabilities and net assets:
Due to State and State Agencies $16,043,053 $15,624,368 $14,132,066
Accounts payable & current accrued expenses $8,089,692 $7,480,960 $5,309,656
Current accrued prizes $4,348,289 $896,399 $5,471,136
Long-term accrued expenses $695,419 $758,982 $730,418
Unrestricted net assets ($1,535,356) ($2,151,282) ($2,265,672)
Net assets invested in capital assets $1,535,356 $2,151,282 $2,265,672
Net assets 0 0 0
Total liabilities and net assets $29,176,453 $24,760,709 $25,643,276
The Lottery is required to advance net proceeds to the State of Minnesota and therefore, net assets remains unchanged from year to year. In general, short term assets and liabilities will fluctuate with the activity of games being played and the timing of the year end cut-off related to our business cycle.
CASH AND CASH EQUIVALENTS AND RECEIVABLES
Cash and cash equivalents and receivables have increased with a $5.0 million variance from fiscal year 2012 to 2011. This is a direct result of the higher sales at the end of the year relative to the prior year.
CAPITAL ASSETS AND OTHER ASSETS
Net capital assets decreased by over $615 thousand in fiscal year 2012 due mainly to less purchases in 2012 compared to 2011 when $500 thousand of express point machines were purchased. Purchases of capital assets included office equipment and vehicles which accounted for $226 thousand of the $277 thousand in total purchases of capital assets. Net of depreciation, total retirements were $0.
Other assets slightly increased in fiscal year 2012 from fiscal year 2011 due mainly to scratch ticket inventory which increased from $597 thousand in fiscal year 2011 to $785 thousand in fiscal year 2012.
DUE TO STATE AND STATE AGENCIES
The fiscal year 2012 increase of $419 thousand was due to the increase in unclaimed prizes due to the state.
CURRENT ACCRUED PRIZES
Current accrued prizes increased by $3.5 million in fiscal year 2012 mainly due to high jackpots and winning tickets that remain uncashed at the end of the fiscal year. $1 million winning Powerball tickets from the April 21st and June 30th drawings were still unclaimed at the end of the fiscal year. Also, a $250 thousand winning Mega Millions ticket from February 7th and $230 thousand in winning tickets from the $640 million jackpot run remains unclaimed at the end of the fiscal year. Gopher 5 and Progressive Print-N-Play’s jackpot at the end of the fiscal year was $665 thousand and $135 thousand, respectively. A Progressive Print-N-Play ticket sold on June 25th won the $182 thousand jackpot and remains unclaimed at the end of the year.
ACCOUNTS PAYABLE AND CURRENT ACCRUED EXPENSES
Accounts payable and current accrued expenses are up $609 thousand from 2011 to 2012 due to a $1.2 million increase in payables for invoices received in June but not paid until the following fiscal year. The majority of the payables are invoices from our advertising and online vendors. This was offset by a $704 thousand decrease in accrued salaries and deferred revenue. For salaries, the number of days accrued in fiscal year 2012 was 8 days compared to 17 days in fiscal year 2011. The decrease in deferred revenue is due to the fiscal year ending on a draw date for Powerball/Power Play and Hot Lotto/Sizzler.
18
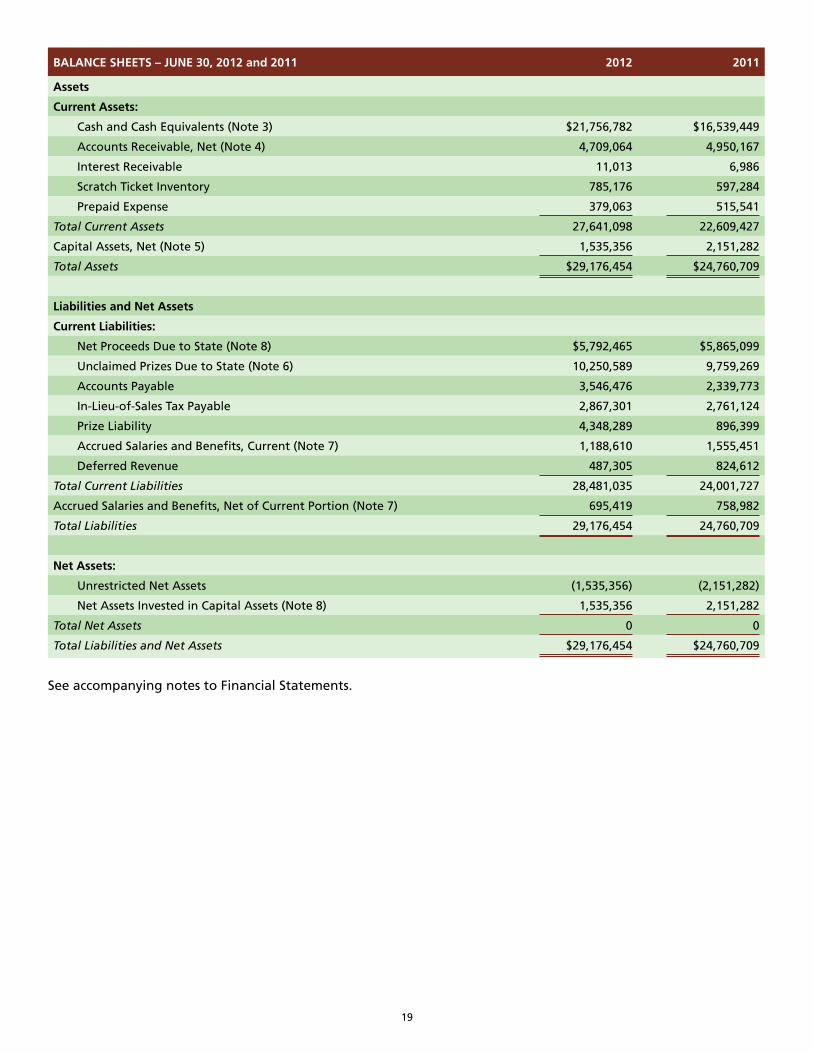
BALANCE SHEETS – JUNE 30, 2012 and 2011 2012 2011
Assets
Current Assets:
Cash and Cash Equivalents (Note 3) $21,756,782 $16,539,449
Accounts Receivable, Net (Note 4) 4,709,064 4,950,167
Interest Receivable 11,013 6,986
Scratch Ticket Inventory 785,176 597,284
Prepaid Expense 379,063 515,541
Total Current Assets 27,641,098 22,609,427
Capital Assets, Net (Note 5) 1,535,356 2,151,282
Total Assets $29,176,454 $24,760,709
Liabilities and Net Assets
Current Liabilities:
Net Proceeds Due to State (Note 8) $5,792,465 $5,865,099
Unclaimed Prizes Due to State (Note 6) 10,250,589 9,759,269
Accounts Payable 3,546,476 2,339,773
In-Lieu-of-Sales Tax Payable 2,867,301 2,761,124
Prize Liability 4,348,289 896,399
Accrued Salaries and Benefits, Current (Note 7) 1,188,610 1,555,451
Deferred Revenue 487,305 824,612
Total Current Liabilities 28,481,035 24,001,727
Accrued Salaries and Benefits, Net of Current Portion (Note 7) 695,419 758,982
Total Liabilities 29,176,454 24,760,709
Net Assets:
Unrestricted Net Assets (1,535,356) (2,151,282)
Net Assets Invested in Capital Assets (Note 8) 1,535,356 2,151,282
Total Net Assets 0 0
Total Liabilities and Net Assets $29,176,454 $24,760,709
See accompanying notes to Financial Statements.
19

STATEMENTS OF REVENUES, EXPENSES AND CHANGES IN NET ASSETS YEARS ENDED JUNE 30, 2012 AND 2011 2012 2011
Operating Revenues:
Scratch Ticket Sales $355,260,670 $354,813,430
Lotto Ticket Sales 164,772,867 149,622,979
Other Income 53,453 88,136
Total Operating Revenues 520,086,990 504,524,545
Less: In-Lieu-of-Sales Tax 33,802,180 32,788,367
Gross Receipts 486,284,810 471,736,178
Direct Costs:
Scratch Ticket Prizes 240,023,798 236,881,984
Lotto Ticket Prizes 80,584,939 73,977,591
Online Vendor Expense 9,505,892 9,077,683
Ticket Costs 8,635,277 7,608,118
Retailer Commissions and Incentives (Note 11) 31,468,680 30,347,192
Total Direct Costs 370,218,586 357,892,568
Gross Profit 116,066,224 113,843,610
Operating Expenses (Note 12):
Advertising (Note 12) 7,475,199 6,475,905
Salaries and Benefits (Note 7, 13) 10,264,453 10,649,595
Promotion 1,882,002 1,525,612
Purchased Services 1,750,921 1,442,811
Communication 552,099 472,423
Occupancy Costs (Note 9) 1,394,649 1,363,918
Supplies and Materials 947,940 1,164,920
Computer and Omnipoint Maintenance 422,769 321,110
Depreciation 892,802 913,304
Other Expense 789,038 535,663
Total Operating Expenses 26,371,872 24,865,261
Operating Income 89,694,352 88,978,349
Nonoperating Revenue (Expense):
Interest Earned on Investments 155,819 121,421
Unused Compulsive Gambling Contribution 155,052
Payments to State:
Compulsive Gambling Contribution from Prize Fund (Note 10) (2,230,000) (2,230,000)
Unclaimed Prizes to State (Note 6) (10,250,589) (9,759,269)
Net Proceeds to State (Note 8) (77,524,634) (77,110,501)
Total Nonoperating Expense (89,694,352) (88,978,349)
Net Income 0 0
Net Assets at Beginning of Year (Note 8) 0 0
Net Assets at End of Year (Note 8) $0 $0
See accompanying notes to Financial Statements.
20

STATEMENTS OF CASH FLOWS – YEARS ENDED JUNE 30, 2012 AND 2011 2012 2011
Cash Flows from Operating Activities:
Cash Received from Customers $519,937,333 $507,654,266
Cash Received from Other Income 53,453 92,196
Payments to State (In-Lieu-of-Sales Tax) (33,696,003) (30,108,973)
Payments to Employees (10,694,857) (10,514,560)
Payments to Suppliers (32,238,190) (30,422,248)
Payments to Retailers (31,468,680) (30,439,388)
Payments to Prize Winners (317,156,847) (315,434,312)
Net Cash Provided by Operating Activities 94,736,209 90,826,981
Cash Flows from Capital and Non-Capital Financing Activities:
Net Proceeds Paid to State (77,597,268) (76,166,326)
Compulsive Gambling Contribution Transfer (2,230,000) (2,230,000)
Unused Compulsive Gambling Contribution 155,052
Unclaimed Prizes Transfer (9,759,269) (9,211,142)
Net Cash Used by Non-Capital Financing Activities (89,431,485) (87,607,468)
Cash Flows from Capital and Related Financing Activities:
Purchases of Capital Assets (276,876) (800,378)
Proceeds on sale of Capital Assets 37,693 11,478
Net Cash Used by Capital Financing Activities (239,183) (788,900)
Cash Flows from Investing Activities:
Investment Income 151,792 127,598
Net Cash Provided by Investing Activities 151,792 127,598
Net Increase in Cash and Cash Equivalents 5,217,333 2,558,211
Beginning of Year Cash and Cash Equivalents 16,539,449 13,981,238
End of Year Cash and Cash Equivalents $21,756,782 $16,539,449
Reconciliation of Operating Income to Net Cash Provided by Operating Activities:
Operating Income $89,694,352 $88,978,349
Adjustments to Reconcile Operating Income to Net Cash provided by Operating Activities:
Depreciation 892,802 913,304
Gain on the disposal of capital assets (37,693) (10,014)
Net Change in Assets and Liabilities:
Scratch ticket inventory (187,892) 778,644
Accounts receivable 241,103 2,605,999
Prepaid expenses 136,478 (64,432)
Other liabilities 545,169 2,199,868
Prize liability 3,451,890 (4,574,737)
Net Cash Provided by Operating Activities $94,736,209 $90,826,981
See accompanying notes to Financial Statements.
21

NOTES TO THE FINANCIAL STATEMENTS JUNE 30, 2012 AND 2011
1. ORGANIZATION OF THE MINNESOTA STATE LOTTERY
In 1988, Minnesotans voted to amend their Constitution to authorize a state-run lottery. In 1989, the Legislature approved and the Governor signed Minnesota Statutes Chapter 349A into law, officially creating the Minnesota State Lottery, the 33rd lottery in the country.
The Minnesota State Lottery (the Lottery), an Enterprise Fund of the State of Minnesota, is under the supervision and control of the Director of the Lottery, who is appointed by the Governor with the advice and consent of the Senate. The Lottery net proceeds and proceeds from the in-lieu-of-sales tax on tickets sales are dedicated to the General Fund, the Environment and Natural Resources Trust Fund, the Game and Fish Fund and the Natural Resources Fund. The funds are used to enhance the state’s natural resources as well as public education, local government assistance and public safety.
The financial statements present only the Minnesota State Lottery, an Enterprise Fund of the State of Minnesota and do not purport to, and do not, present the financial statements of the State of Minnesota.
Lottery revenue is generated by sales of scratch games and lotto games that include: Daily 3®, Northstar Cash®, Progressive Print-N-Play®, Gopher 5®, Powerball®, Power Play®, Mega Millions®, Megaplier®, Hot Lotto®, Sizzler® and the Minnesota Millionaire Raffle game.
2. SUMMARY OF SIGNIFICANT ACCOUNTING POLICIES
The Lottery is an agency of the State of Minnesota using proprietary type enterprise accounting. The financial statements are prepared in accordance with generally accepted accounting principles as applicable to governmental units. Following are the significant accounting policies:
(a) Basis of Accounting
The financial statements of the Lottery have been prepared on the accrual basis of accounting. Revenues are recorded when they are earned and expenses are recognized as incurred.
Governmental Accounting Standards Board (GASB) Statement No. 20, Accounting and Financial Reporting for Proprietary Funds and Other Governmental Entities that use Proprietary Fund Accounting, provides that proprietary and similar trust funds should apply all GASB pronouncements, as well as the following pronouncements issued on or before November 30, 1989, unless those pronouncements conflict with or contradict GASB Pronouncements: Statements and Interpretations of the Financial Accounting Standards Board (FASB), Accounting Principles Board Opinions (APB), and Accounting Research Bulletins (ARB).
As permitted by GASB Statement No. 20, the Lottery has elected not to apply FASB statements or interpretations issued on or after November 30, 1989, unless the GASB specifically adopts such statements or interpretations.
(b) Accounting Standard: GASB No. 34
In June 1999, the Governmental Accounting Standards Board (GASB) issued Statement No. 34, Basic Financial Statements and Management’s Discussion and Analysis for State and Local Governments. This Statement established updated financial reporting requirements for state and local governments. This statement also requires budgetary comparison schedules to be presented as supplementary information. The Lottery is not legally required to adopt a budget and therefore budgetary comparison schedules are not included as supplementary information.
(c) Measurement Focus
A proprietary fund is accounted for using the “economic resources” measurement focus. This means that all assets and liabilities associated with its activity are included on its balance sheet. The proprietary fund type operating statement presents increases (revenues) and decreases (expenses) in net total assets.
(d) Operating Revenue and Expenses
Operating revenue and expenses for a proprietary fund such as the Lottery are revenues and expenses that result from providing services and producing and delivering goods and/or services. Operating revenues are derived from providing various types of games. Operating expenses include commissions, prize costs, other direct costs of providing lottery games, and administrative expenses.
Packs of Scratch tickets are consigned to retail sales outlets and revenue is recognized upon settlement of ticket packs by retailers and are recorded at the sale price to the consumer. Sales of lotto tickets are recognized as operating revenue on the date of the draw for which the tickets were purchased. Revenues from future lotto ticket draw sales are deferred until the date of the draw for which the tickets were purchased.
(e) Cash and Cash Equivalents
Cash and cash equivalents include an amount in demand deposits as well as funds held in the State Treasury and invested by the State Board of Investment.
(f) Prizes and Reserves
Scratch ticket prize expense is recognized in accordance with the predetermined prize structure for each game and is accrued when revenue is recognized. High tier prizes for certain Scratch ticket games may also be structured and paid as an annuity.
22

Prize expense for Daily 3 is recorded based upon the actual winners on the date of the draw. Prize expense for Progressive Print-N-Play games are based on actual winners and are recorded at the time of sale. The prize expense for Northstar Cash is recorded at 53.3 percent of draw sales. The prize expense for Gopher 5 is recorded at 55 percent of draw sales.
Included in the Lottery Prize Liability at June 30, 2012 is a $1,057,100 prize reserve which reflects funds due to the State Treasury that have been set aside in the Lottery prize fund by the Director in accordance with Minnesota Statutes, Section 349A.10, subdivision 2(b) to assure proper funding for future lottery prizes. The prize reserve at June 30, 2011 was $986,802.
Prize expenses for Powerball, Power Play, Hot Lotto and Sizzler are recorded at 50 percent of draw sales; Mega Millions and Megaplier are recorded at 51.5 percent of draw sales. All Multi-State Lottery Association (MUSL) games are recorded in accordance with the MUSL prize structure. The Powerball, Power Play, Hot Lotto, Sizzler, Mega Millions and Megaplier prizes are paid with funds held by MUSL. MUSL has established separate prize pool reserves for Powerball, Power Play, Hot Lotto, Sizzler, Mega Millions and Megaplier to support payment of prizes in light of the remote possibility of claims greatly exceeding the expected amounts. In the event that the Lottery ceases to participate in one of these games, the Lottery may make claim to assets, if any, in the related prize pool reserve. The Lottery’s share of these prize reserves as of June 30, 2012 was as follows:
Powerball/Power Play $4,211,582
Mega Millions/Megaplier 537,184
Hot Lotto/Sizzler 1,522,488
Total $6,271,214
These reserves held by MUSL are not included in these financial statements.
The Lottery participates in joint marketing campaigns for various events in order to maximize its marketing dollar and the exposure to the Lottery. In doing so, other entities may donate various prizes which are given out by the Lottery to its players. The Lottery recognizes Other Income when the donated prize is received and records Prize Expense when the prize is given to the player. The Lottery received $45,194 and $19,134 in donated prizes in fiscal year 2012 and 2011 respectively which were subsequently given to players.
(g) Scratch Ticket Inventory
Scratch ticket inventories are carried at cost using the specific identification method. Tickets are charged to operating expense over the estimated life of each scratch game.
(h) Capital Assets
Assets costing $5,000 or more are capitalized and are carried at cost less accumulated depreciation. Depreciation is computed on the straight-line basis using estimated useful lives from three to seven years. Computer equipment, printers, and software costs are depreciated over three years. Vehicles, other than the warehouse truck, are depreciated over four years. Office equipment, lotto drawing equipment and signs are depreciated over five years. Office furniture and the warehouse truck and equipment are depreciated over seven years. Leasehold improvements are depreciated on a straight-line basis over the shorter of the useful life or length of the lease. When assets are retired or otherwise disposed of, the cost and related accumulated depreciation are removed from the accounts and any resulting gain or loss is recognized.
(i) In-Lieu-of-Sales Tax
From every dollar in Lottery sales, the Lottery sets aside six and one-half cents as in-lieu-of-sales tax and remits that amount monthly to the Commissioner of Revenue as required by Minnesota Statutes, Section 297A.65. Minnesota Statutes, Section 297A.94(e), provides that 27.57% of the in-lieu-of-sales-tax is credited to the General Fund and the remaining 72.43% is credited equally between the Game and Fish Fund and the Natural Resources Fund to be used for natural resources projects as specified by law.
(j) Income Taxes
The Lottery, as an agency of the State of Minnesota, is exempt from federal and state income taxes. Accordingly, the Lottery makes no provision for income taxes.
(k) Use of Estimates in the Preparation of Financial Statements
The preparation of financial statements in conformity with accounting principles generally accepted in the United States of America requires management to make estimates and assumptions that affect the reported amounts of assets and liabilities and disclosure of contingent assets and liabilities at the date of the financial statements and the reported amounts of revenues and expenses during the reporting period. Actual results could differ from those estimates.
23

3. CASH AND CASH EQUIVALENTS
Minnesota Statutes, Section 349A.10, subdivision 7(a), requires the Lottery transfer all funds to a Lottery cash flow account in the State Treasury. Funds necessary to cover cash needs are transferred as needed from State Treasury to the Lottery fund. Funds in this account earn interest, which is credited monthly to the Lottery’s account. Cash on deposits in the State Treasury and with financial institutions are insured. Cash on deposit is covered up to $250,000 per institution by the Federal Depository Insurance Corporation (FDIC). At times, cash balances may be in excess of the FDIC insurance limit. As a result, the financial institutions are required to pledge securities as collateral to the Lottery in an amount equal to the funds in excess of the FDIC insurance limit. The securities are held in the name of the Lottery.
Table 1 summarizes the Lottery’s cash and cash equivalents at June 30, 2012 and 2011.
Available cash in the State Treasury is invested by the State Board of Investment. In accordance with Minnesota Statutes, Section 11A.24, the State Board of Investment must invest in obligations and stocks of U.S. and Canadian governments, their agencies and their registered corporations, short-term obligations of specified high quality, restricted participation as a limited partner in venture capital, real estate, or resource equity investments, and restricted participation in registered mutual funds. Lottery funds on deposit in the State Treasury cannot be tied to specific investment securities.
4. ACCOUNTS RECEIVABLE – ALLOWANCE FOR DOUBTFUL ACCOUNTS
Table 2 summarizes the Lottery’s accounts receivable at June 30, 2012 and 2011.
5. CAPITAL ASSETS
Tables 3 and 4 (next page) show the summary of changes in capital assets for the years ended June 30, 2012 and 2011.
TABLE 1CASH AND CASH EQUIVALENTS AT JUNE 30, 2012 AND 2011 2012 2011
Cash (checks issued but not yet presented for payment) $(399,509) $(2,062,144)
Cash on Deposit 22,156,291 18,601,593
Total Cash and Cash Equivalents $21,756,782 $16,539,449
TABLE 2ACCOUNTS RECEIVABLE AT JUNE 30, 2012 AND 2011 2012 2011
Accounts Receivable $5,161,261 $5,383,724
Allowance for Doubtful Accounts (452,197) (433,557)
Accounts Receivable, Net $4,709,064 $4,950,167
24

TABLE 3 - CAPITAL ASSETS 2012 JULY 1, 2011 ADDITIONS DELETIONS TRANSFERS JUNE 30, 2012
Depreciable Capital Assets:
Office Equipment & Furniture $1,869,415 $48,878 ($63,787) $1,854,506
Software Costs 855,223 40,087 895,310
Leasehold Improvements 1,444,364 1,444,364
Vehicles 956,488 177,201 (130,912) 1,002,777
Computer Equipment 936,342 10,710 947,052
Lotto Drawing Equipment 775,528 775,528
Express Point Machines 1,495,438 1,495,438
Signs 79,151 79,151
Warehouse Equipment 236,121 236,121
Total 8,648,070 276,876 (194,699) 0 8,730,247
Less - accumulated depreciation:
Office Equipment & Furniture (1,571,382) (121,391) 63,787 (1,628,986)
Software Costs (488,544) (228,411) (716,955)
Leasehold Improvements (1,361,510) (13,728) (1,375,238)
Vehicles (657,126) (129,922) 130,912 (656,136)
Computer Equipment (683,389) (86,023) (769,412)
Lotto Drawing Equipment (710,221) (24,941) (735,162)
Express Point Machines (749,366) (272,827) (1,022,193)
Signs (69,579) (9,574) (79,153)
Warehouse Equipment (205,671) (5,985) (211,656)
Total accumulated depreciation (6,496,788) (892,802) 194,699 0 (7,194,891)
Net Capital Assets $2,151,282 ($615,926) $0 $0 $1,535,356
TABLE 4 - CAPITAL ASSETS 2011 JULY 1, 2010 ADDITIONS DELETIONS TRANSFERS JUNE 30, 2011
Depreciable Capital Assets:
Office Equipment & Furniture $1,786,438 $106,573 $(23,596) $1,869,415
Software Costs 809,907 27,822 $17,494 855,223
Leasehold Improvements 1,443,304 1,060 1,444,364
Vehicles 848,968 141,536 (34,016) 956,488
Computer Equipment 941,036 12,800 (17,494) 936,342
Lotto Drawing Equipment 775,528 775,528
Express Point Machines 1,013,375 482,063 1,495,438
Signs 79,151 79,151
Warehouse Equipment 207,597 28,524 236,121
Total 7,905,304 800,378 (57,612) 0 8,648,070
Less - accumulated depreciation:
Office Equipment & Furniture (1,476,909) (116,605) 22,132 (1,571,382)
Software Costs (250,040) (237,335) (1,169) (488,544)
Leasehold Improvements (1,344,808) (16,702) (1,361,510)
Vehicles (561,457) (129,685) 34,016 (657,126)
Computer Equipment (595,539) (89,019) 1,169 (683,389)
Lotto Drawing Equipment (684,924) (25,297) (710,221)
Express Point Machines (471,938) (277,428) (749,366)
Signs (59,148) (10,431) (69,579)
Warehouse Equipment (194,869) (10,802) (205,671)
Total accumulated depreciation (5,639,632) (913,304) 56,148 0 (6,496,788)
Net Capital Assets $2,265,672 ($112,926) ($1,464) $0 $2,151,282
25

6. UNCLAIMED PRIZES
Effective July 1, 2003 pursuant to Minnesota Statutes 349A.08, subdivision 5, all unclaimed prizes will be transferred to the General Fund at the end of the fiscal year. The unclaimed prizes due to the State are $10,250,588 and $9,759,269 on June 30, 2012 and June 30, 2011, respectively.
7. ACCRUED SALARIES AND BENEFITS
A liability is recognized for accrued salaries, post employment benefit obligations, unpaid vacation, compensatory hours, vested severance and anticipated severance pay when earned. Non-vested severance pay is estimated based upon historical trends and current demographics. A schedule of the accrued salaries and benefits is shown in Tables 5 and 6.
TABLE 5 – ACCRUED SALARIES BENEFIT 2012 2011
Accrued Salary and Benefits:
Salaries Payable $350,875 $686,011
Compensated Absences 837,735 848,440
Post Employee Obligations 0 21,000
Total Current Accrued Salaries and Benefits $1,188,610 $1,555,451
Compensated Absences Payable $586,419 $649,982
Post Employee Obligations 109,000 109,000
Total Non-Current Accrued Salaries and Benefits $695,419 $758,982
TABLE 6 – COMPENSATED ABSENCES PAYABLE BEGINNING ADDITIONS RETIREMENTS ENDING
2012 $1,498,422 $981,019 $(1,055,287) $1,424,154
2011 $1,433,090 $1,095,041 $(1,029,709) $1,498,422
8. NET ASSETS
Within 30 days after the end of each month, the Lottery is required by Minnesota Statutes, Section 349A.10, and subdivision 5 to deposit the net proceeds in the State Treasury. The monthly transfer of net proceeds leaves a zero balance in Net Assets. Net Proceeds Due to State on the accompanying balance sheets for the month ended June 30, 2012 and 2011 were $5,792,465 and $5,865,099, respectively. Net assets invested in capital assets consist of capital assets, net of accumulated depreciation.
9. COMMITMENTS AND CONTINGENCIES
(a) Risk Management
The Lottery is exposed to various risks of loss related to torts, checking, theft, damage to and destruction of assets, errors and omissions, injuries to employees and natural disasters.
The Lottery participates in the State’s Risk Management Fund for property, liability, crime and automobile insurance coverage. The Lottery pays annual premiums for this coverage. The State’s Risk Management Fund covers all claims above the deductible. The Lottery has not experienced any settlements in excess of coverage in the past three years.
The Lottery participates in the State’s workers’ compensation program. The Workers’ Compensation Alternative Cost Allocation Account (WCACAA) funds
approximately 15% of the total workers’ compensation costs annually. Funds are collected up-front through a premium based on each agency’s unique exposure and experience. The Lottery paid a premium of $32,014 in fiscal year 2012 and $27,032 in fiscal year 2011.
The Lottery purchased twenty lifetime annuities from various insurance companies. If these insurance companies were to default on those obligations these policies would be covered under a “Guaranty Fund Law” which is administered by the State of Minnesota. The amount guaranteed per annuity is $300,000. The Lottery may be ultimately responsible for the lifetime annuities; however, management feels that the possibility of these insurance companies defaulting on its obligations in a material sum in excess of the $300,000 guaranteed by the State is remote.
The areas of insurance coverage, limits and deductibles as of June 30, 2012 are shown in Table 7 (next page).
26

(b) Operating Leases
The Lottery is committed under various operating leases for building and office space. For the years ended June 30, 2012 and 2011, the lease expense was $1,159,137 and $1,135,761, respectively. This is net of sublease rental income of $336,371 and $341,312 in 2012 and 2011, respectively. Sublease rental income is included within occupancy costs in the financial statements. Future minimum lease payments for existing lease agreements are shown in Table 8 above.
10. COMPULSIVE GAMBLING TREATMENT CONTRIBUTION PROVIDED FROM PRIZE FUND
Minnesota Laws 1998, Chapter 407, Article 8, Section 11 directed the Lottery to pay $340,000 annually from the prize fund to a special Indian Gaming account in the State Treasury. Funds in this account are transferred to the Department of Human Services for compulsive gambling treatment programs.
Minnesota Laws 2011, 1st Special Session, Chapter 9, Article 10, section 3, subdivision 1 appropriated $1,665,000 for Fiscal Year 2012 from the prize fund
TABLE 7 - COVERAGE LIMITS DEDUCTIBLES
Property $8,583,126 $1,000
Auto
Bodily Injury & Property Damage $500,000/$1,500,000 $500
Primary Crime
Employee Dishonesty, Money & Securities $25,000 $1,000
General Liability $500,000/$1,500,000 None
Excess Crime
Employee Theft $1,000,000 $25,000
Forgery or Alteration $1,000,000 $25,000
Theft of Money & Securities $75,000 $25,000
Robbery, Safe Burglary–Other Prop. $75,000 $25,000
Outside Premises $75,000 $25,000
Computer Fraud $1,000,000 $25,000
Funds Transfer $1,000,000 $25,000
Money Orders & Counterfeit Paper Currency $1,000,000 $25,000
of the Department of Human Services for statewide compulsive gambling treatment programs.
Minnesota Laws 2009, Chapter 79, Article 13, section 3, 1st Special Session, Chapter 1, Article 25, section 3 appropriated $1,586,000 for Fiscal Year 2011 from the prize fund to the Department of Human Services.
Minnesota Laws 2011, Chapter 101, Article 1, section 36 appropriated $225,000 for Fiscal Year 2012 from the prize fund to the Gambling Control Board for a grant to the state affiliate recognized by the National Council of Problem Gambling to be used for public awareness, education, training of treatment providers, and research (of this appropriation $50,000 each year is contingent on contribution of non-state matching funds).
Minnesota Laws 2009, Chapter 101, Article 1, section 31, appropriated $225,000 for Fiscal Year 2011 from the prize fund to the Gambling Control Board.
11. RETAILER COMMISSIONS
Retailer commission is set by Minnesota Rule 7856.4030, subpart 1 as 5.5% of the price of each lottery ticket sold by a retailer and 1% of the amount of each winning lottery ticket cashed by a retailer.
TABLE 8 - OPERATING LEASES YEAR ENDING JUNE 30 LEASE AMOUNT LESS SUB-LEASE AMOUNT NET
2013 $1,404,529 $205,227 $1,199,302
2014 370,508 0 370,508
2015 376,664 0 376,664
2016 372,722 0 372,722
2017 328,294 0 328,294
Thereafter 211,439 0 211,439
Total $3,064,156 $205,227 $2,858,929
27

12. STATUTORY LIMITATION ON OPERATING AND ADVERTISING EXPENSES
Gross revenue is defined in law as ticket sales and all other income less in-lieu-of-sales tax. Direct costs are expenses that are a direct function of lottery sales, which include all prize payouts, retailer commissions and incentives, amounts paid to produce and deliver scratch lottery tickets, and amounts paid to an outside vendor to operate and maintain an on-line gaming system. Operating costs include all other expenses of the Lottery.
Minnesota Statutes, Section 349A.10, subdivision 3 limits the Lottery’s advertising costs to 2.75 percent and operating costs to 9 percent of gross revenue. Minnesota Laws 2011 1st Special Session, Chapter 10, Article 1, section 33 and Minnesota Laws 2009, Chapter 101, Article 1, section 18 provides that notwithstanding Minnesota Statutes, section 349A.10, subdivision 3, the operating budget must not exceed $29,000,000 in fiscal year 2012 and $28,740,000 in fiscal year 2011, respectively.
The Lottery is in compliance with the statutory limits on advertising and operating costs. Advertising costs as a percentage of gross revenue were 1.54 percent and 1.37 percent for the years ended June 30, 2012 and 2011, respectively. Operating costs as a percentage of gross revenue were 5.42 percent and 5.27 percent for the years ended June 30, 2012 and 2011, respectively.
13. RETIREMENT PLANS AND POST RETIREMENT BENEFITS
The Lottery is involved in two pension programs as follows:
(a) General Plan – Defined Benefit Pension Plan – Statewide:
Plan Description
The Lottery contributes to the Minnesota State Retirement System (MSRS), which is a cost-sharing multiple-employer defined benefit pension plan administered by the MSRS. The plan provides retirement and disability benefits, annual cost of living adjustments, and death benefits to qualifying plan members and beneficiaries. Benefit provisions are established and may be amended by state statute and vest after three years of credited service. MSRS issues a publicly available financial report that includes financial statements and required supplementary information for MSRS. That report may be obtained by contacting MSRS at 651-296-2761 or www.msrs.state.mn.us.
Funding Policy
Plan members are required to contribute 5.0% of their annual covered salary and the Lottery is required to contribute at an actuarially-determined rate. The Lottery’s current rate is 5.0% of annual covered
payroll. The contribution requirements of plan members and the Lottery are established and may be amended by state statute. See Table 9.
(b) Unclassified Plan – Defined Contribution Plan – Statewide:
Plan Description
The Lottery contributes to the MSRS, which is a multiple-employer defined contribution plan administered by the MSRS. The plan provides retirement and disability benefits and death benefits to qualifying plan members and beneficiaries. Benefit provisions are established and may be amended by state statute and vest immediately. MSRS issues a publicly available financial report that includes financial statements and required supplementary information for MSRS. That report may be obtained by contacting MSRS at 651-296-2761 or www.msrs.state.mn.us.
Funding Policy
Plan members are required to contribute 5.0% of their annual covered salary and the Lottery is required to contribute 6.0% of the annual covered payroll. The contribution requirements of plan members and the Lottery are established and may be amended by state statute. See Table 10.
The Lottery provides other postemployment benefits (OPEB) as part of its total employee compensation package. GASB statement No. 45 “Accounting and Financial Reporting by Employers for Postemployment Benefits Other than Pensions” requires the Lottery to report OPEB on the face of its financial statements. The Lottery implemented GASB Statement No. 45 in Fiscal Year 2008. Total expenses related to OPEB for fiscal years 2012, 2011 and 2010 were $21,000, $24,000 and $35,235, respectively.
TABLE 9 – DEFINED BENEFIT PENSION PLANCONTRIBUTIONS TO MSRS – YEAR ENDING JUNE 30
2012 2011 2010
$363,195 $376,714 $365,152
TABLE 10 – DEFINED CONTRIBUTION PLANCONTRIBUTIONS TO MSRS – YEAR ENDING JUNE 30
2012 2011 2010
$34,131 $35,403 $40,132
28
29
Certificate ofAchievementfor Excellence
in FinancialReporting
Presented to
Minnesota State Lottery
For its Comprehensive Annual
Financial Report
for the Fiscal Year Ended
JUlie ]0, 2011
A Ccnifkate ofAchievement for Excellence in FinancialReporting is presented by tI1e Government Finance Officers
Association of the United Slates and Canada togovenunenl units and public employt"e ~tirvnem
systems ....hO'lc comprehemive annual finandalreports (CAFRs) lithic\'(: the higheststandards in governmem a<:coonting
and financial reponing.
Presidem
Executive DifCCtor

30
@--
CERTIFICATION OF EXECUTIVE DIRECTOR AND CHIEF FINANCIAL OFFICER
I, Ed Van Petten. Executive Director of the Minnesota State Lottery and Joseph PaIlI,Chief Financial Officer of the Minncsota State Lottery, certify that:
I. I have revie"'ed these: Financial StatementS for the fi$Cal year ended June 30, 2012 ofthe Minnesota State Lottery;
2. Ilased on my knowledge, these: statements do not contain any untrue statement ofamaterial fact or omit to state a material fael necessary to make the statements made. inlight of the circumstances ullder which such statements were made, not misleading withrespect to the period covered by these statements;
3. Based on my knowledge, the financial statements. and other financial infonnationincluded in this rc:port, fairly present in all matcrial respects the financial condition,results ofoperations and cash flows of the Minnesota State Lonery as of, and for, theperiods presented in these Financial Statements;
4. The Minnesota State Lonery's other certifying offittr and I have disclosed, based onour most recent review of internal control over financial ",porting, to tlte Minnesota StateLottery's auditors:
a) All significant deficiencies and material weaknesses in the design or nperationof internal control over financial reporting which are reasonably likely toadversely affect tile Minnesota State lottery's ability to record, process,summarize and report financial infonnation: andb) Any fraud, whether or not material, that involves management or otheremployees who have a significant role in tile Minnesota State l.ottery's internalcontrol over financial reporting.
Date: October 9, 2012 QBy~#W~ _,ltkEd Van Penen, Ex'l'""'-':
Jose: h ahl, Chief Financial Officer

CONTACT INFORMATION
LOTTERY HEADQUARTERS 2645 Long Lake Road Roseville, MN 55113 (651) 635-8273 (651) 635-8268 TTY
WINNING NUMBERS HOTLINE (651) 634-1111
E-MAIL [email protected]
WEBSITE mnlottery.com
REGIONAL OFFICES Detroit Lakes 1641 Highway 10 West Detroit Lakes, MN 56501 (218) 846-0700
Marshall 750 West College Drive Marshall, MN 56258 (507) 537-6041
Owatonna 205 Cedardale Drive Owatonna, MN 55060 (507) 444-2400
Virginia 130 Chestnut Street Virginia, MN 55792 (218) 748-2450
EXECUTIVE STAFF
EXECUTIVE DIRECTOR Ed Van Petten
GENERAL COUNSEL Dana Banwer
DIRECTOR FOR OPERATIONS Jenny Canfield
DIRECTOR FOR MARKETING AND SALES John Mellein
CHIEF FINANCIAL OFFICER Joe Pahl
CHIEF OF SECURITY Doug Wills
RESEARCH AND PLANNING DIRECTOR Don Feeney
PUBLIC RELATIONS MANAGER Debbie Hoffmann
31