unsupervised learning: statistical and computational perspectives werner stuetzle
DESCRIPTION
Unsupervised learning: Statistical and computational perspectives Werner Stuetzle Professor and Chair, Statistics Adjunct Professor, Computer Science and Engineering University of Washington, Seattle - PowerPoint PPT PresentationTRANSCRIPT

1
Unsupervised learning: Statistical and computational perspectives
Werner Stuetzle
Professor and Chair, StatisticsAdjunct Professor, Computer Science and EngineeringUniversity of Washington, Seattle
Supported by NSF grant DMS-9803226 and NSA grant 62-1942. Work performed while on sabbatical at AT&T Labs - Research.
2
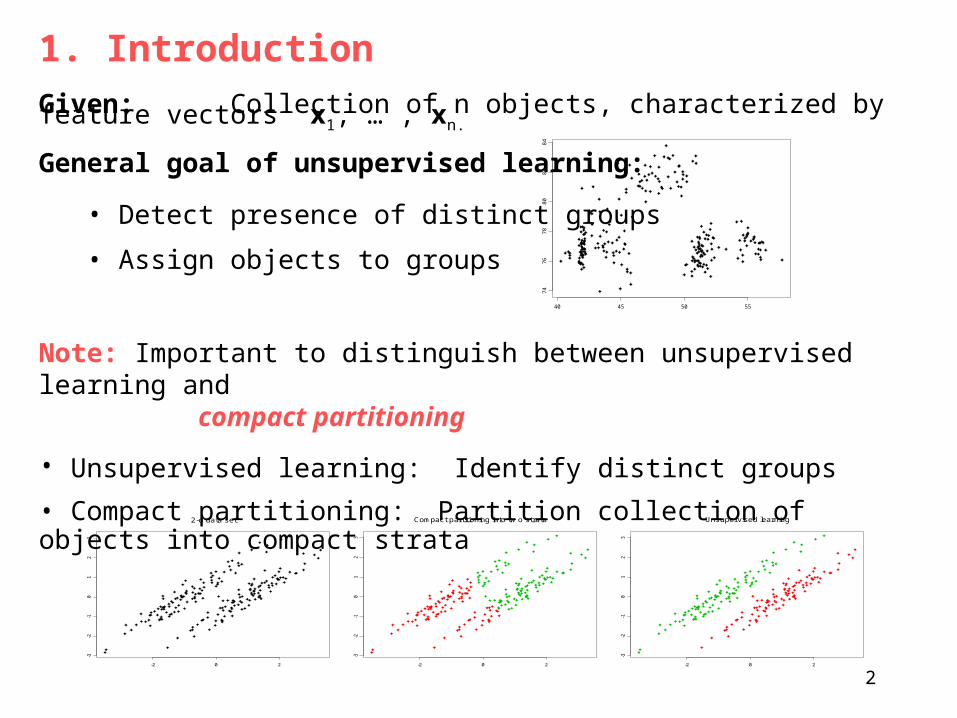
1. Introduction
Given: Collection of n objects, characterized by feature vectors x1, … , xn.
General goal of unsupervised learning:
• Detect presence of distinct groups
• Assign objects to groups
40 45 50 55
74
76
78
80
82
84
Note: Important to distinguish between unsupervised learning and compact partitioning
• Unsupervised learning: Identify distinct groups
• Compact partitioning: Partition collection of objects into compact strata
-2 0 2
-3-2
-10
12
3
2-d data set
-2 0 2
-3-2
-10
12
3
Compact partitioning into tw o strata
-2 0 2
-3-2
-10
12
3
Unsupervised learning
3
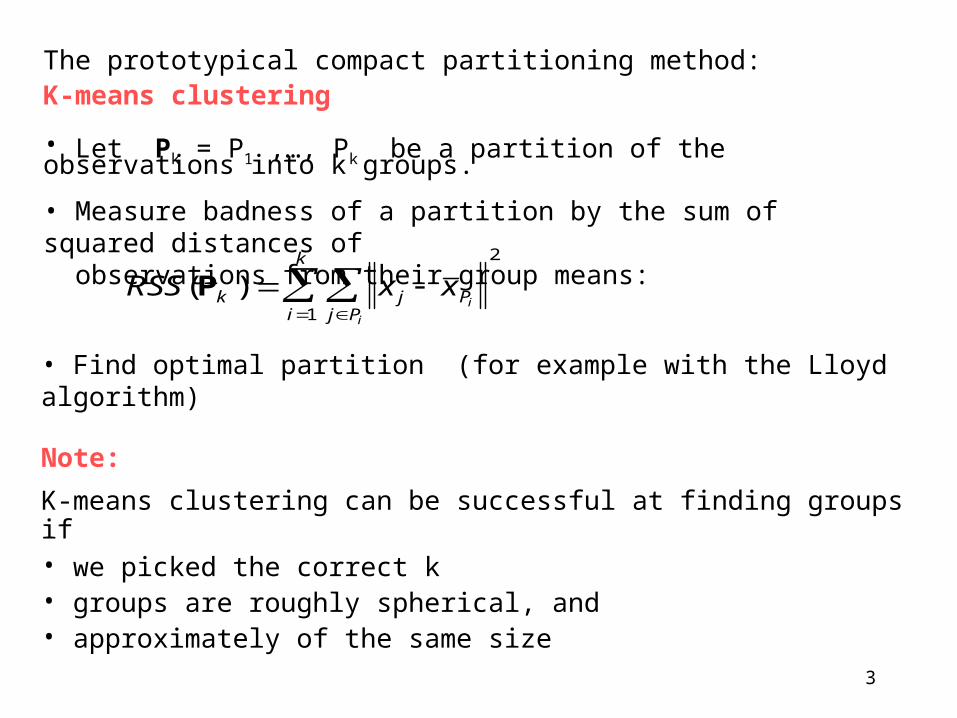
The prototypical compact partitioning method:K-means clustering
• Let Pk = P1 ,…, Pk be a partition of the observations into k groups.
• Measure badness of a partition by the sum of squared distances of observations from their group means:
RSS x xk j Pj Pi
k
i
i
( )P
1
2
• Find optimal partition (for example with the Lloyd algorithm)
Note:
K-means clustering can be successful at finding groups if• we picked the correct k• groups are roughly spherical, and• approximately of the same size
For the remainder of the talk, will focus on unsupervised learning

4
2. Approaches to Unsupervised Learning
Regard feature vectors x1, … , xn as sample from some density p(x)
Parametric approach: (Cheeseman, McLachlan, Raftery)
• Based on premise that each group g is represented by density pg that is a
member of some parametric family => p(x) is a mixture
• Estimate the parameters of the group densities, the mixing proportions, and the number of groups from the sample.
Nonparametric approach: (Wishart, Hartigan)
• Based on the premise that distinct groups
manifest themselves as multiple modes of p(x)
• Estimate modes from sample
Will pursue nonparametric approach
-2 0 2 4 6 8 100
100
200
300
Feature histogram
5
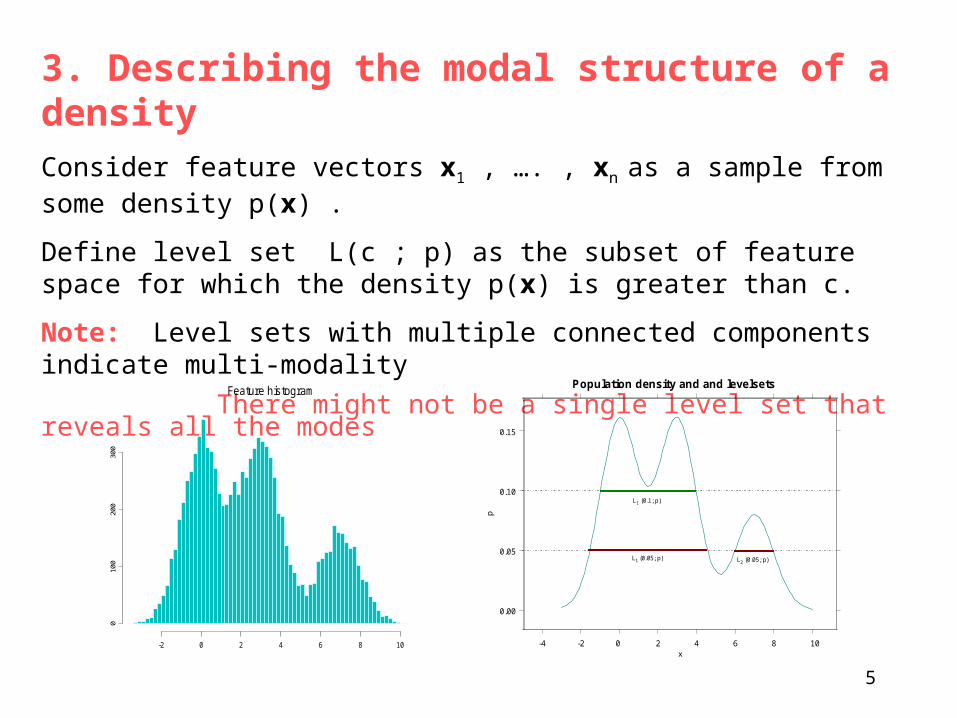
3. Describing the modal structure of a densityConsider feature vectors x1 , …. , xn as a sample from some density p(x) .
Define level set L(c ; p) as the subset of feature space for which the density p(x) is greater than c.
Note: Level sets with multiple connected components indicate multi-modality
There might not be a single level set that reveals all the modes
ClusteringasastatisticalproblemAssumethatfeaturevectorsx1;:::;xniid»p(x).DenelevelsetL(;p)byL(;p)=fxjp(x)gLetL1(;p);L2(;p);:::betheconnectedcomponentsofL(;p).If2>1thenforanyi;jeither²Li(2;p)½Lj(1;p),or²theyaredisjoint.ThereforethetotalcollectionofsetscanbearrangedintoamodetreeLeavesofmodetreecorrespondtonodesofp(x).
Considerfeaturevectorsx1;:::;xnasarandomsamplefromsome(innite)population.Letp(x)bethepopulationdensity.(Think"histogramwithinnitesimallysmallbins")DenelevelsetL(;p)byL(;p)=fxjp(x)gLetL1(;p);L2(;p);:::betheconnectedcomponentsofL(;p).If2>1thenforanyi;jeither²Li(2;p)½Lj(1;p),or²theyaredisjoint.Thereforethetotalcollectionofsetscanbearrangedintoatree,theclustertreeofthedensity.Leavesofclustertreecorrespondtomodesofp(x).
-2 0 2 4 6 8 10
010
020
030
0
Feature histogram
-4 -2 0 2 4 6 8 10x
0.00
0.05
0.10
0.15
p
L2 (0.05; p)
L1 (0.1; p)
Population density and and levelsets
L1 (0.05; p)
6
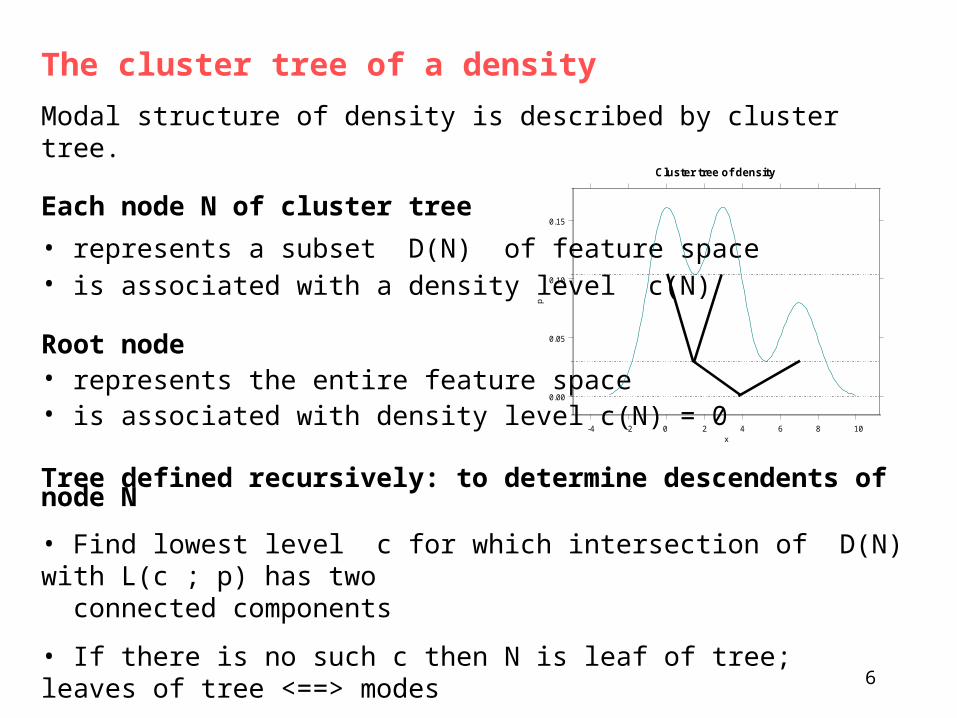
The cluster tree of a density
Modal structure of density is described by cluster tree.
Each node N of cluster tree
• represents a subset D(N) of feature space• is associated with a density level c(N)
Root node• represents the entire feature space• is associated with density level c(N) = 0
Tree defined recursively: to determine descendents of node N
• Find lowest level c for which intersection of D(N) with L(c ; p) has two connected components
• If there is no such c then N is leaf of tree; leaves of tree <==> modes
• Otherwise, create daughter nodes representing the connected components, with associated level c
ClusteringasastatisticalproblemAssumethatfeaturevectorsx1;:::;xniid»p(x).DenelevelsetL(;p)byL(;p)=fxjp(x)gLetL1(;p);L2(;p);:::betheconnectedcomponentsofL(;p).If2>1thenforanyi;jeither²Li(2;p)½Lj(1;p),or²theyaredisjoint.ThereforethetotalcollectionofsetscanbearrangedintoamodetreeLeavesofmodetreecorrespondtonodesofp(x).
Considerfeaturevectorsx1;:::;xnasarandomsamplefromsome(innite)population.Letp(x)bethepopulationdensity.(Think"histogramwithinnitesimallysmallbins")DenelevelsetL(;p)byL(;p)=fxjp(x)gLetL1(;p);L2(;p);:::betheconnectedcomponentsofL(;p).If2>1thenforanyi;jeither²Li(2;p)½Lj(1;p),or²theyaredisjoint.Thereforethetotalcollectionofsetscanbearrangedintoatree,theclustertreeofthedensity.Leavesofclustertreecorrespondtomodesofp(x).
-4 -2 0 2 4 6 8 10x
0.00
0.05
0.10
0.15
p
Cluster tree of density
7
Goal:
Estimate the cluster tree of the underlying density p(x) from the sample feature
vectors x1 , …. , xn
First step: Estimate p(x) by density estimate p*(x) (see below)
Second step: Compute cluster tree of p* (maybe approximately)ClusteringasastatisticalproblemAssumethatfeaturevectorsx1;:::;xniid»p(x).DenelevelsetL(;p)byL(;p)=fxjp(x)gLetL1(;p);L2(;p);:::betheconnectedcomponentsofL(;p).If2>1thenforanyi;jeither²Li(2;p)½Lj(1;p),or²theyaredisjoint.ThereforethetotalcollectionofsetscanbearrangedintoamodetreeLeavesofmodetreecorrespondtonodesofp(x).
Considerfeaturevectorsx1;:::;xnasarandomsamplefromsome(innite)population.Letp(x)bethepopulationdensity.(Think"histogramwithinnitesimallysmallbins")DenelevelsetL(;p)byL(;p)=fxjp(x)gLetL1(;p);L2(;p);:::betheconnectedcomponentsofL(;p).If2>1thenforanyi;jeither²Li(2;p)½Lj(1;p),or²theyaredisjoint.Thereforethetotalcollectionofsetscanbearrangedintoatree,theclustertreeofthedensity.Leavesofclustertreecorrespondtomodesofp(x).
8
4. Density estimationConsider feature vectors x1 , …. , xn as a sample from some density p(x).
Goal: Estimate p(x)
Simplest idea:
Let S(x, r) denote a sphere in feature space with radius r, centered at x.
Assuming density is roughly constant over S(x, r), the expected number of sample points in S(x, r) is
k ~ n * Volume ( S(x, r) ) * p(x), giving
p(x) ~ k / (n * Volume ( S(x, r) )
Kernel estimate: Fix radius r ; k = # of sample feature vectors in S(x, r)
K-near-neighbor estimate: Fix count k; r = smallest radius for which S(x, r) contains k sample feature vectors
Many refinements have been suggested
ClusteringasastatisticalproblemAssumethatfeaturevectorsx1;:::;xniid»p(x).DenelevelsetL(;p)byL(;p)=fxjp(x)gLetL1(;p);L2(;p);:::betheconnectedcomponentsofL(;p).If2>1thenforanyi;jeither²Li(2;p)½Lj(1;p),or²theyaredisjoint.ThereforethetotalcollectionofsetscanbearrangedintoamodetreeLeavesofmodetreecorrespondtonodesofp(x).
Considerfeaturevectorsx1;:::;xnasarandomsamplefromsome(innite)population.Letp(x)bethepopulationdensity.(Think"histogramwithinnitesimallysmallbins")DenelevelsetL(;p)byL(;p)=fxjp(x)gLetL1(;p);L2(;p);:::betheconnectedcomponentsofL(;p).If2>1thenforanyi;jeither²Li(2;p)½Lj(1;p),or²theyaredisjoint.Thereforethetotalcollectionofsetscanbearrangedintoatree,theclustertreeofthedensity.Leavesofclustertreecorrespondtomodesofp(x).
9
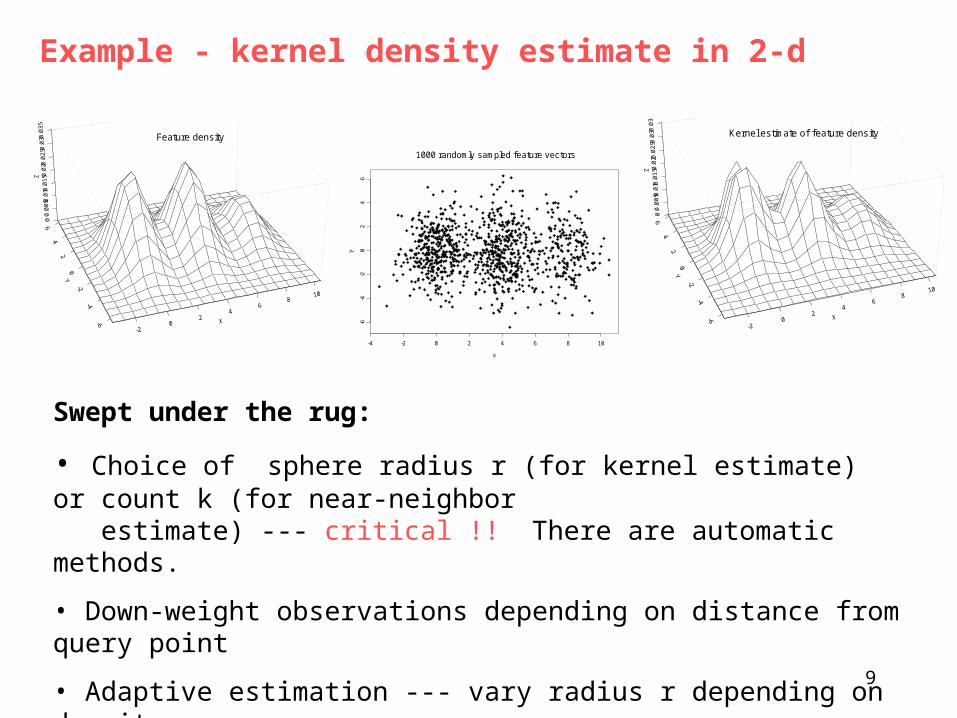
Example - kernel density estimate in 2-d
ClusteringasastatisticalproblemAssumethatfeaturevectorsx1;:::;xniid»p(x).DenelevelsetL(;p)byL(;p)=fxjp(x)gLetL1(;p);L2(;p);:::betheconnectedcomponentsofL(;p).If2>1thenforanyi;jeither²Li(2;p)½Lj(1;p),or²theyaredisjoint.ThereforethetotalcollectionofsetscanbearrangedintoamodetreeLeavesofmodetreecorrespondtonodesofp(x).
Considerfeaturevectorsx1;:::;xnasarandomsamplefromsome(innite)population.Letp(x)bethepopulationdensity.(Think"histogramwithinnitesimallysmallbins")DenelevelsetL(;p)byL(;p)=fxjp(x)gLetL1(;p);L2(;p);:::betheconnectedcomponentsofL(;p).If2>1thenforanyi;jeither²Li(2;p)½Lj(1;p),or²theyaredisjoint.Thereforethetotalcollectionofsetscanbearrangedintoatree,theclustertreeofthedensity.Leavesofclustertreecorrespondtomodesofp(x).
Feature density
xy
-4 -2 0 2 4 6 8 10
-6-4
-20
24
6
1000 randomly sampled feature vectors
Kernel estimate of feature density
Swept under the rug:
• Choice of sphere radius r (for kernel estimate) or count k (for near-neighbor estimate) --- critical !! There are automatic methods.
• Down-weight observations depending on distance from query point
• Adaptive estimation --- vary radius r depending on density
• Other types of estimates, etc, etc, etc (extensive literature)

10
Computational complexity
Computing kernel or near-neighbor estimate at query point x requires finding nearest neighbors of x in sample x1 , …. , xn.
Can find k nearest neighbors of x in time ~ log n using spatial partitioning schemes such as k-d trees, after n log n pre-processing
However
• Spatial partitioning most effective if n large relative to d.
• Theoretical analysis shows that number of nearest neighbors should increase with n and decrease with dimensionality d: k ~ n ^ (4 / (d + 4)). Relevance ?
In low dimensions (d <= 4) can use histogram or average shifted histogram density estimates based on regular binning.
Evaluation for query point in constant time, after pre-processing ~ n
High dimensionality may present problem
ClusteringasastatisticalproblemAssumethatfeaturevectorsx1;:::;xniid»p(x).DenelevelsetL(;p)byL(;p)=fxjp(x)gLetL1(;p);L2(;p);:::betheconnectedcomponentsofL(;p).If2>1thenforanyi;jeither²Li(2;p)½Lj(1;p),or²theyaredisjoint.ThereforethetotalcollectionofsetscanbearrangedintoamodetreeLeavesofmodetreecorrespondtonodesofp(x).
Considerfeaturevectorsx1;:::;xnasarandomsamplefromsome(innite)population.Letp(x)bethepopulationdensity.(Think"histogramwithinnitesimallysmallbins")DenelevelsetL(;p)byL(;p)=fxjp(x)gLetL1(;p);L2(;p);:::betheconnectedcomponentsofL(;p).If2>1thenforanyi;jeither²Li(2;p)½Lj(1;p),or²theyaredisjoint.Thereforethetotalcollectionofsetscanbearrangedintoatree,theclustertreeofthedensity.Leavesofclustertreecorrespondtomodesofp(x).
11
5. Recursive algorithms for constructing a cluster treeFor most density estimates p*(x), computing level sets and finding their connected components is a daunting problem --- especially in high dimensions.
Idea: Compute sample cluster tree instead
Each node N of sample cluster tree
• represents a subset X(N) of the sample• is associated with a density level c(N)
Root node• represents the entire sample• is associated with density level c(N) = 0
ClusteringasastatisticalproblemAssumethatfeaturevectorsx1;:::;xniid»p(x).DenelevelsetL(;p)byL(;p)=fxjp(x)gLetL1(;p);L2(;p);:::betheconnectedcomponentsofL(;p).If2>1thenforanyi;jeither²Li(2;p)½Lj(1;p),or²theyaredisjoint.ThereforethetotalcollectionofsetscanbearrangedintoamodetreeLeavesofmodetreecorrespondtonodesofp(x).
Considerfeaturevectorsx1;:::;xnasarandomsamplefromsome(innite)population.Letp(x)bethepopulationdensity.(Think"histogramwithinnitesimallysmallbins")DenelevelsetL(;p)byL(;p)=fxjp(x)gLetL1(;p);L2(;p);:::betheconnectedcomponentsofL(;p).If2>1thenforanyi;jeither²Li(2;p)½Lj(1;p),or²theyaredisjoint.Thereforethetotalcollectionofsetscanbearrangedintoatree,theclustertreeofthedensity.Leavesofclustertreecorrespondtomodesofp(x).

12
To determine descendents of node N
• Find lowest level c for which the intersection of X(N) with L(c ; p*) falls into two connected components Note: Intersection of X(N) with L(c ; p*) consists of those feature vectors in the node N for which estimated density p*(xi) > c. @
• If there is no such c then N is leaf of tree;
• Otherwise, create daughter nodes representing the “connected components”, with associated level c.
Note:
• @ is the critical step. Will in general have to rely on heuristic.
• Daughters of a node N do not define a partition of X(N). Assigning low density observations in X(N) to one of the daughters is supervised learning problem
ClusteringasastatisticalproblemAssumethatfeaturevectorsx1;:::;xniid»p(x).DenelevelsetL(;p)byL(;p)=fxjp(x)gLetL1(;p);L2(;p);:::betheconnectedcomponentsofL(;p).If2>1thenforanyi;jeither²Li(2;p)½Lj(1;p),or²theyaredisjoint.ThereforethetotalcollectionofsetscanbearrangedintoamodetreeLeavesofmodetreecorrespondtonodesofp(x).
Considerfeaturevectorsx1;:::;xnasarandomsamplefromsome(innite)population.Letp(x)bethepopulationdensity.(Think"histogramwithinnitesimallysmallbins")DenelevelsetL(;p)byL(;p)=fxjp(x)gLetL1(;p);L2(;p);:::betheconnectedcomponentsofL(;p).If2>1thenforanyi;jeither²Li(2;p)½Lj(1;p),or²theyaredisjoint.Thereforethetotalcollectionofsetscanbearrangedintoatree,theclustertreeofthedensity.Leavesofclustertreecorrespondtomodesofp(x).

13
Illustration
0 5 10
-6-4
-20
24
6
Feature vectors Kernel density estimate
0 5 10
-6-4
-20
24
6
0 . 0 0 5 8 1 3 9
Feature vectors with p*(x) > 0.2
0 5 10
-6-4
-20
24
6
0 . 0 0 8 7 2 0 8 5
0 . 0 0 8 7 2 0 8 5
Feature vectors with p*(x) > 0.3
0 5 10
-6-4
-20
24
6
0 . 0 1 7 4 4 1 7
0 . 0 1 7 4 4 1 7
Feature vectors with p*(x) > 0.5
leve
l
4.0
4.5
5.0
5.5
6.0
Sample c luster tree
14
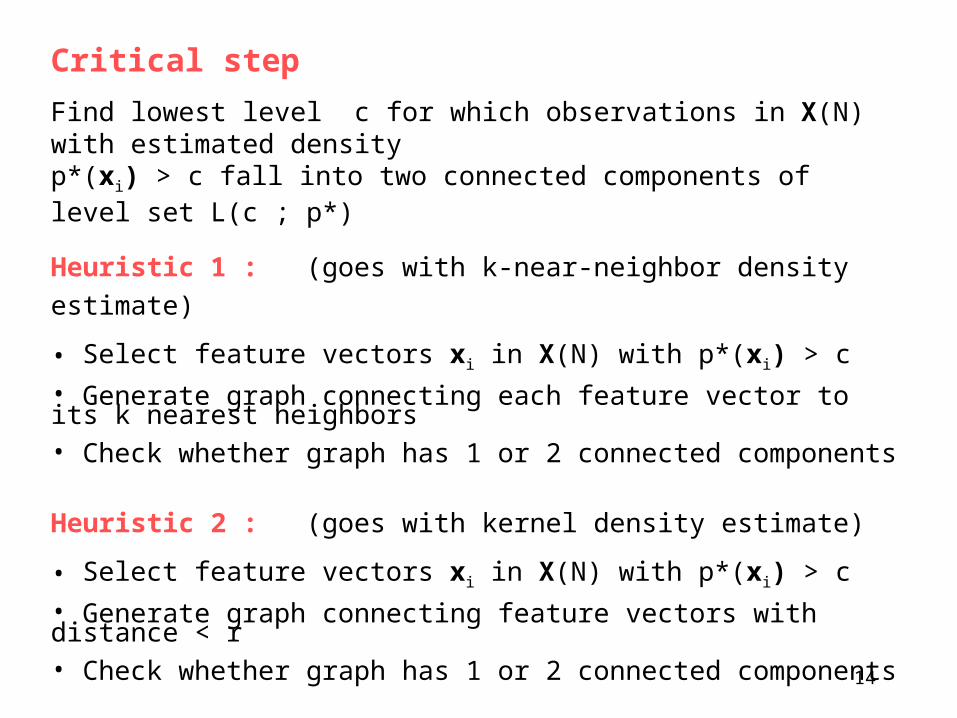
Critical step
Find lowest level c for which observations in X(N) with estimated density p*(xi) > c fall into two connected components of level set L(c ; p*)
Heuristic 1 : (goes with k-near-neighbor density estimate)
• Select feature vectors xi in X(N) with p*(xi) > c
• Generate graph connecting each feature vector to its k nearest neighbors• Check whether graph has 1 or 2 connected components
Heuristic 2 : (goes with kernel density estimate)
• Select feature vectors xi in X(N) with p*(xi) > c
• Generate graph connecting feature vectors with distance < r• Check whether graph has 1 or 2 connected components
15
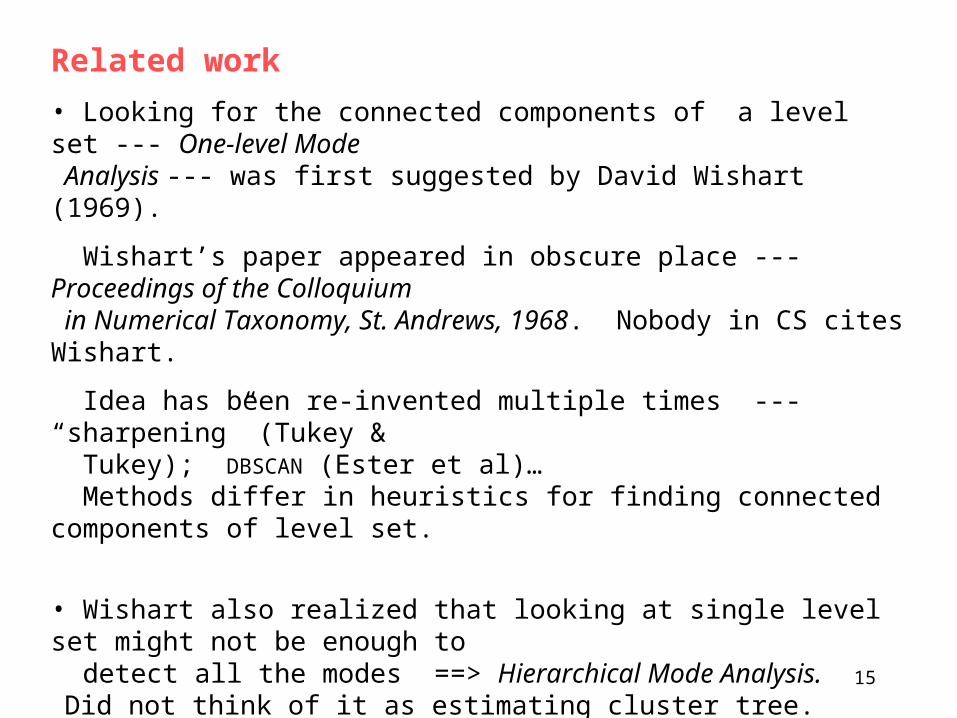
Related work
• Looking for the connected components of a level set --- One-level Mode Analysis --- was first suggested by David Wishart (1969).
Wishart’s paper appeared in obscure place --- Proceedings of the Colloquium in Numerical Taxonomy, St. Andrews, 1968. Nobody in CS cites Wishart.
Idea has been re-invented multiple times --- “sharpening” (Tukey & Tukey); DBSCAN (Ester et al)… Methods differ in heuristics for finding connected components of level set.
• Wishart also realized that looking at single level set might not be enough to detect all the modes ==> Hierarchical Mode Analysis. Did not think of it as estimating cluster tree. Algorithm awkward --- based on iterative merging instead of recursive partitioning. OPTICS method of Ankerst et al also considers level sets for different levels.
16
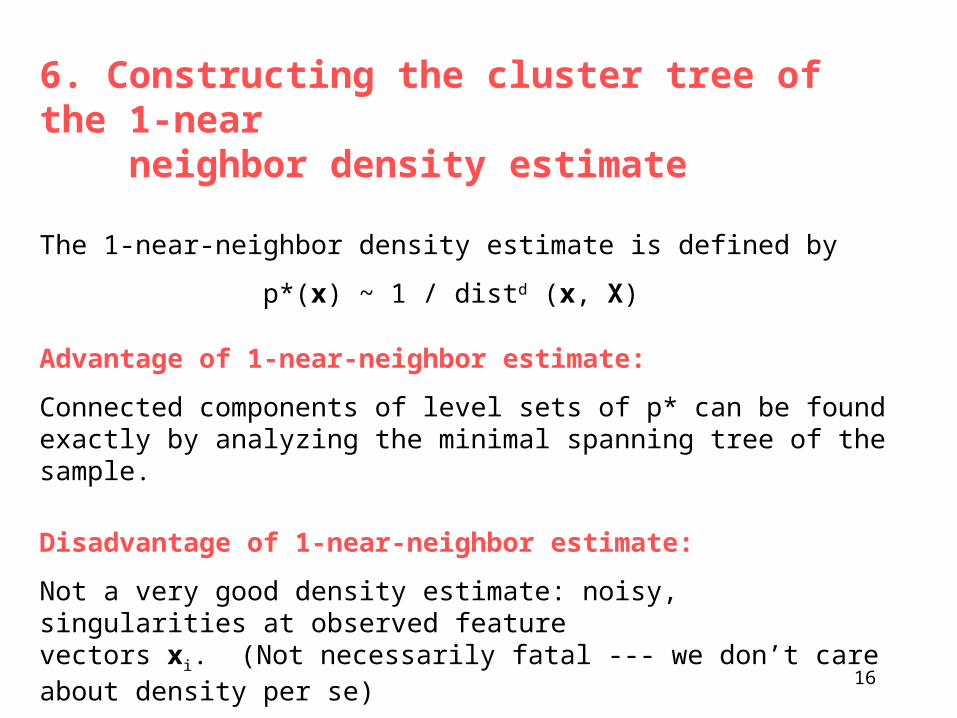
6. Constructing the cluster tree of the 1-near neighbor density estimate
The 1-near-neighbor density estimate is defined by
p*(x) ~ 1 / distd (x, X)
Advantage of 1-near-neighbor estimate:
Connected components of level sets of p* can be found exactly by analyzing the minimal spanning tree of the sample.
Disadvantage of 1-near-neighbor estimate:
Not a very good density estimate: noisy, singularities at observed feature vectors xi. (Not necessarily fatal --- we don’t care about density per se)
Noise and singularities produce spurious nodes => specify a minimum cluster size
ClusteringasastatisticalproblemAssumethatfeaturevectorsx1;:::;xniid»p(x).DenelevelsetL(;p)byL(;p)=fxjp(x)gLetL1(;p);L2(;p);:::betheconnectedcomponentsofL(;p).If2>1thenforanyi;jeither²Li(2;p)½Lj(1;p),or²theyaredisjoint.ThereforethetotalcollectionofsetscanbearrangedintoamodetreeLeavesofmodetreecorrespondtonodesofp(x).
Considerfeaturevectorsx1;:::;xnasarandomsamplefromsome(innite)population.Letp(x)bethepopulationdensity.(Think"histogramwithinnitesimallysmallbins")DenelevelsetL(;p)byL(;p)=fxjp(x)gLetL1(;p);L2(;p);:::betheconnectedcomponentsofL(;p).If2>1thenforanyi;jeither²Li(2;p)½Lj(1;p),or²theyaredisjoint.Thereforethetotalcollectionofsetscanbearrangedintoatree,theclustertreeofthedensity.Leavesofclustertreecorrespondtomodesofp(x).
17
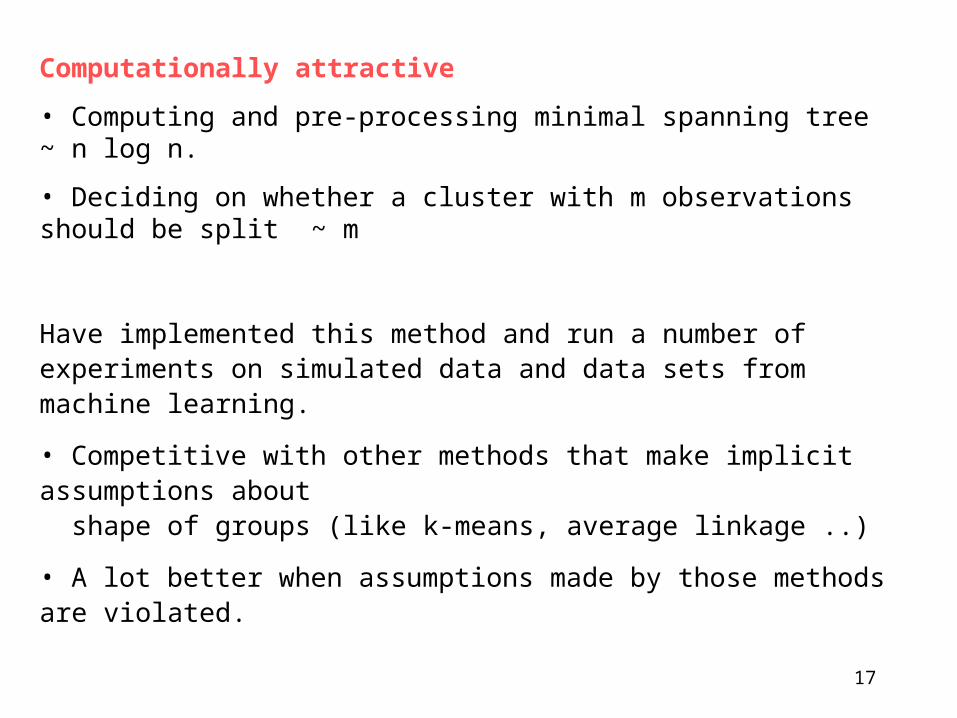
Computationally attractive
• Computing and pre-processing minimal spanning tree ~ n log n.
• Deciding on whether a cluster with m observations should be split ~ m
Have implemented this method and run a number of experiments on simulated data and data sets from machine learning.
• Competitive with other methods that make implicit assumptions about shape of groups (like k-means, average linkage ..)
• A lot better when assumptions made by those methods are violated.
ClusteringasastatisticalproblemAssumethatfeaturevectorsx1;:::;xniid»p(x).DenelevelsetL(;p)byL(;p)=fxjp(x)gLetL1(;p);L2(;p);:::betheconnectedcomponentsofL(;p).If2>1thenforanyi;jeither²Li(2;p)½Lj(1;p),or²theyaredisjoint.ThereforethetotalcollectionofsetscanbearrangedintoamodetreeLeavesofmodetreecorrespondtonodesofp(x).
Considerfeaturevectorsx1;:::;xnasarandomsamplefromsome(innite)population.Letp(x)bethepopulationdensity.(Think"histogramwithinnitesimallysmallbins")DenelevelsetL(;p)byL(;p)=fxjp(x)gLetL1(;p);L2(;p);:::betheconnectedcomponentsofL(;p).If2>1thenforanyi;jeither²Li(2;p)½Lj(1;p),or²theyaredisjoint.Thereforethetotalcollectionofsetscanbearrangedintoatree,theclustertreeofthedensity.Leavesofclustertreecorrespondtomodesofp(x).

18
7. Summary and future work• The term “clustering” is ambiguous --- need to distinguish between compact partitioning and unsupervised learning.
• Goal of unsupervised learning: detect presence of distinct groups.
• Assumption: groups ~ modes --- connected components of level sets --- of feature density.
• This definition accommodates elongated and non-linear groups.
• Modal structure of density is described by cluster tree.
• Cluster tree is defined recursively --- suggests recursive partitioning.
• Potentially many variations on basic algorithm, differing in
(1) estimate of feature density (2) heuristic for deciding when to split a node
• Attractive choice: 1-near-neighbor density estimate. Level sets and their connected components can be found exactly by analyzing minimal spanning tree of sample
19
Future work
• Principled method for deciding on number of groups --- hard!
• Sampling or aggregation methods for dealing with large data sets
• Visualization: Link cluster tree with other displays such as histograms,
scatterplots, etc, to understand location and shape of clusters in feature space
• Quantitative evaluation and comparison of methods
20
21
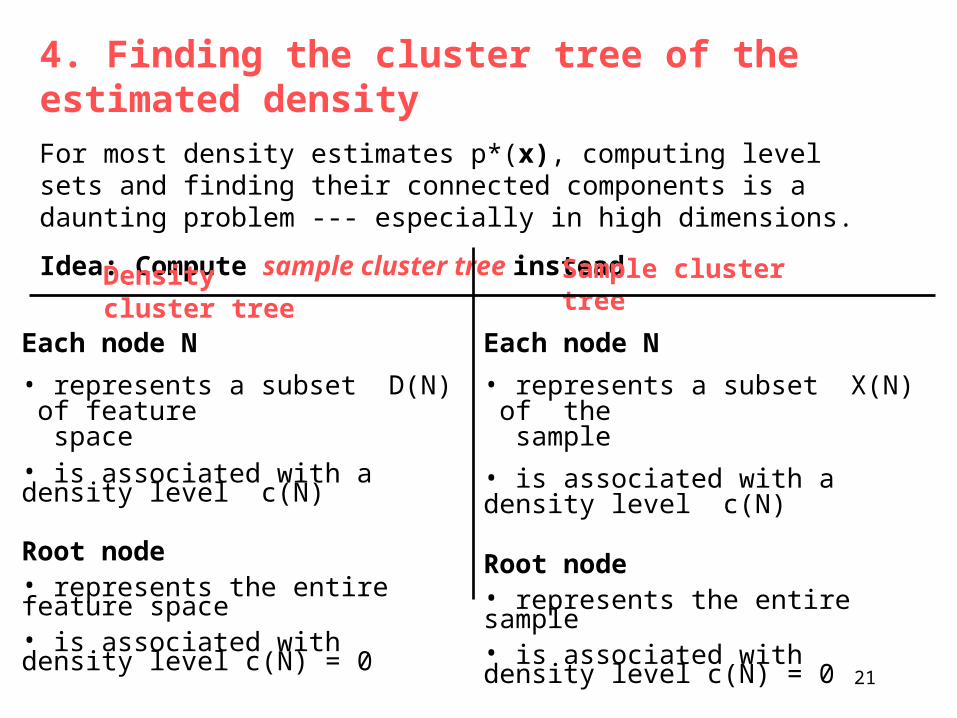
4. Finding the cluster tree of the estimated densityFor most density estimates p*(x), computing level sets and finding their connected components is a daunting problem --- especially in high dimensions.
Idea: Compute sample cluster tree instead
ClusteringasastatisticalproblemAssumethatfeaturevectorsx1;:::;xniid»p(x).DenelevelsetL(;p)byL(;p)=fxjp(x)gLetL1(;p);L2(;p);:::betheconnectedcomponentsofL(;p).If2>1thenforanyi;jeither²Li(2;p)½Lj(1;p),or²theyaredisjoint.ThereforethetotalcollectionofsetscanbearrangedintoamodetreeLeavesofmodetreecorrespondtonodesofp(x).
Considerfeaturevectorsx1;:::;xnasarandomsamplefromsome(innite)population.Letp(x)bethepopulationdensity.(Think"histogramwithinnitesimallysmallbins")DenelevelsetL(;p)byL(;p)=fxjp(x)gLetL1(;p);L2(;p);:::betheconnectedcomponentsofL(;p).If2>1thenforanyi;jeither²Li(2;p)½Lj(1;p),or²theyaredisjoint.Thereforethetotalcollectionofsetscanbearrangedintoatree,theclustertreeofthedensity.Leavesofclustertreecorrespondtomodesofp(x).
Each node N
• represents a subset D(N) of feature space• is associated with a density level c(N)
Root node• represents the entire feature space• is associated with density level c(N) = 0
Each node N
• represents a subset X(N) of the sample
• is associated with a density level c(N)
Root node• represents the entire sample• is associated with density level c(N) = 0
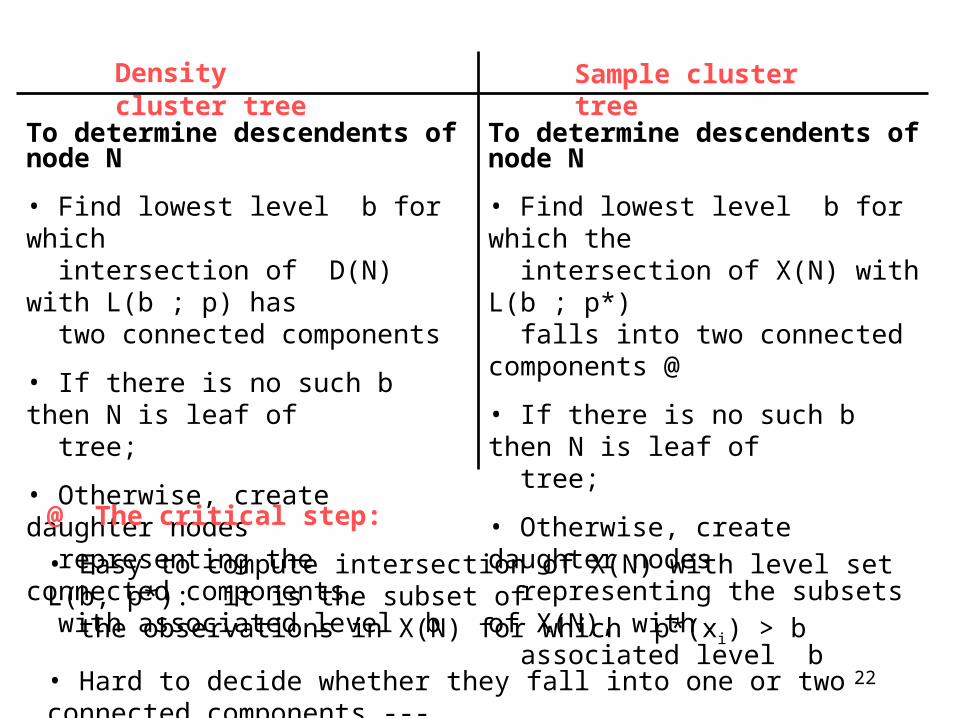
Density cluster tree Sample cluster tree
22
ClusteringasastatisticalproblemAssumethatfeaturevectorsx1;:::;xniid»p(x).DenelevelsetL(;p)byL(;p)=fxjp(x)gLetL1(;p);L2(;p);:::betheconnectedcomponentsofL(;p).If2>1thenforanyi;jeither²Li(2;p)½Lj(1;p),or²theyaredisjoint.ThereforethetotalcollectionofsetscanbearrangedintoamodetreeLeavesofmodetreecorrespondtonodesofp(x).
Considerfeaturevectorsx1;:::;xnasarandomsamplefromsome(innite)population.Letp(x)bethepopulationdensity.(Think"histogramwithinnitesimallysmallbins")DenelevelsetL(;p)byL(;p)=fxjp(x)gLetL1(;p);L2(;p);:::betheconnectedcomponentsofL(;p).If2>1thenforanyi;jeither²Li(2;p)½Lj(1;p),or²theyaredisjoint.Thereforethetotalcollectionofsetscanbearrangedintoatree,theclustertreeofthedensity.Leavesofclustertreecorrespondtomodesofp(x).
To determine descendents of node N
• Find lowest level b for which the intersection of X(N) with L(b ; p*) falls into two connected components @
• If there is no such b then N is leaf of tree;
• Otherwise, create daughter nodes representing the subsets of X(N), with associated level b
To determine descendents of node N
• Find lowest level b for which intersection of D(N) with L(b ; p) has two connected components
• If there is no such b then N is leaf of tree;
• Otherwise, create daughter nodes representing the connected components, with associated level b
Density cluster tree Sample cluster tree
@ The critical step:
• Easy to compute intersection of X(N) with level set L(b, p*): it is the subset of the observations in X(N) for which p*(xi) > b
• Hard to decide whether they fall into one or two connected components --- usually need heuristic

23