unsuccessful candidate survey 2011 - elections revie · their attitudes about reforming the...
TRANSCRIPT

DME 70237 Local Government Elections Survey 1
LOCAL GOVERNMENT ELECTIONS 2010
UNSUCCESSFUL CANDIDATE SURVEY
2011 Conducted by Dean Jaensch AO Professor Flinders University Commissioned by the Local Government Association of South Australia
DME 70237 Local Government Elections Survey 2
INTRODUCTION The survey was commissioned by the Local Government Association, and was conducted in March 2011. Its focus was unsuccessful candidates at the 2010 election. This survey was conducted in parallel with a survey of successful candidates - newly elected Members - at the 2010 election. This survey is the subject of a separate report. The questionnaire was designed with advice from the Local Government Association. It was structured to establish a range of issues arising from the 2010 Local Government elections. The key purposes were to inquire into the profiles of the 2010 candidates, the natures of their campaigns, and their attitudes to aspects of the electoral process. The range of questions included six themes:
a profile of the candidates under a range of sub-headings of personal characteristics and backgrounds, including family, gender, education, occupation, employment, and identity;
the nature and extent of the candidates’ involvement in their communities; the patterns and styles of recruitment, with a focus on the factors which
influenced their decisions to nominate for the elections; the nature of their campaigns; their judgements about the election processes in 2006; and their attitudes about reforming the electoral process.
Anonymous questionnaires were posted to all 564 unsuccessful candidates, with a covering letter, and a reply-paid envelope. Responses were received from 192 candidates, a response rate of 34%, a satisfactory level in the light of previous self-administered mail surveys. There were a number of open-ended questions, especially in the sections concerning attitudes. The “quality” of the responses covered a wide range. Some respondents, especially those with strong feelings, provided very short answers. Others expanded on some issues, with considerable thought and insight. The question of representativeness of the survey needed to be addressed. To what extent did the sample allow the extrapolation of data to the total number of candidates? Some tests were possible. The gender content of the respondents was an almost perfect “mirror” of the total. The gender breakdown of all unsuccessful candidates was 70 percent male, 30 per cent female. The final survey sample included 71 per cent male, 29 per cent female. A second test was based on Council categories.
Council Type Actual % Survey % metropolitan 38 48 regional City 15 17 Rural 51 35
There was an over-representation of metropolitan Councils, an equivalent under-representation of rural Councils. The analyses therefore take this caveat into account.

DME 70237 Local Government Elections Survey 3
Data Presentation The data from the survey presented in this report include different levels of analysis. The standard form is based on the total responses of the 192 candidates. These tables are then further analysed on the bases of sub-sets of the data. Again, a caveat is necessary. In some cases the sub-set cells contain small numbers, hence extrapolations must be made with caution. The standard basis of presentation of data and analyses is tabular, and the standard form is percentages (%). In each table, the numbers of respondents or responses on which the percentages are calculated are provided in the form (n = ), rounded to whole numbers. Some totals of percentages in rows/columns may not add to 100 due to rounding. In some tables, especially those based on open-ended questions, the data are presented on the basis of numbers of responses, not respondents, and not percentages. This form has been used as the questions allowed multiple answers. Each table shows the number of respondents and the number of responses. The report also includes comparative data. The main focus of a survey conducted in 2006 was on all candidates at the 2006 Council elections, the first such survey to be conducted in South Australia. As with the 2011 survey, the data were the basis of an examination and interpretation of the nature, attitudes and activities of the aspirants for election. In some cases, the comparisons are made with the data from the 2006 survey of candidates. Analysis requires a caveat: the 2006 survey was based on all candidates; the 2011 survey was based on unsuccessful candidates. The 2011 unsuccessful candidate data, in some questions, has been amalgamated with the relevant data from the 2011 survey of newly elected Members (NEM) (see separate report), thus providing a more representative sample. The results of the surveys allowed for the analysis of the characteristics, attitudes and behaviour of the candidates as a group, and for analyses of sub-sets: geographic and demographic types of Councils, and first contestants and incumbents. The sub-samples were generally large enough to be representative.
DME 70237 Local Government Elections Survey 4
EXECUTIVE SUMMARY Profiles of the Candidates The proportion of female members in 1973 was only 3%. This increased to 25% 1997, but then plateaued, with 26% in 2004. The 2006 survey found almost 29% of the candidates were female, as were 29% of the elected members. Hence there had been a slight increase. This was essentially brought about by a significant increase in the number of female candidates in the metropolitan area – up to 35%. But there has not been an equivalent increase elsewhere. The combined 2010 surveys found 32% of the sample were female, an increase from 2006. Of the successful candidates, 36% were females; of the unsuccessful candidates, 29% were females. The most constant trend in Local Government has been the “aging” of the membership. In 2004 only 5% of the members were below 45 years of age, and 44% were over 60. Attracting young people has been a priority. In the 2006 survey, there was an important change: 32% of the 1st contestants were below 45 years of age. The extent of the change is shown by the fact that only 5% of the incumbents were below 45 years. On the other hand, the elected membership after 2006, while “younger” that 2004, still showed that only 18% were below 45 years of age. That is, the “age problem” had improved, but it could be better. In 2010, only 13% were below 45 years of age. The family structures of the candidates varied little from previous surveys: 67 per cent married, seven per cent de facto, 10% single, 12% separated or divorced. A total of 27% had dependant children. The secondary education level reached continued to show a steady rise over previous surveys: 52% completed year 12. This pattern was most evident in the metropolitan area and least in the rural Councils. The proportion with post-secondary qualifications was also higher: 31% with a first degree; 18% with post-graduate qualifications. 34% of the candidates were in the paid work force, with 22% full-time; 29% were employers or self-employed; 26% were categorised as professionals, and 27% had retired. The occupational profile was skewed, as would be expected, to primary industry among the country candidates, and with a significantly higher proportion of managerial, executive, professional and white collar candidates in the metropolitan Councils. There was a continuing rise in the proportions of managerial, executive and professional occupations. Candidates from the trade/manual occupations still constitute only a miniscule proportion of Council candidates and members. 78% were employed in the private sector. Relations with the Community As with previous member surveys, the 2010 unsuccessful candidates showed a broad involvement with the community: of the 192 candidates, 84% were involved with work-related organizations, 72% with school, hospital and advisory groups, 75% with service organizations, and 81% with sports and arts. A surprising result in the 2006 survey was that while 48% of all candidates were involved in political organizations, only 31% of the 1st contestants were. The 2011 survey data suggested that the unsuccessful candidates were also less involved in organisations. Of the 192 candidates, only 45 stated they were a member of a political party. These included 14 Labor members, 27 Liberal, and four from minor parties.
DME 70237 Local Government Elections Survey 5
Recruitment There were few significant differences in the patterns of recruitment between previous surveys and the 2010 candidates. It is notable that only 4% stated that they had nominated as a result of official campaigns. There was a kaleidoscope of issues named, with 34% being issues related to governance. Impact of Allowances Only 52% of the respondents stated that they were aware of the maximum allowances before deciding to nominate for election. Only 15 respondents stated that the increase had been a factor in their decision. Election involvement There were no significant variations in patterns of spending on the elections from previous surveys. The repeated pattern is that very high proportions of the candidates spent very small amounts on their campaigns: 47% spent less than $250. Expenditures were at a much higher level in the metropolitan Councils. 26 of the 148 candidates who responded spent only one day per week on the campaign, and almost half of the sample spent only one or two days per week. At the other end of the scale, 44 of the 148 candidates claimed to spend five or more days per week campaigning. These data virtually replicated the 2006 results Assessments of Materials The questionnaire asked candidates to rate six sources of information: “So you want to be on Council?” (LGA booklet); Briefing session (LGA/Council); Candidate Handbook (SEO); Nomination Kit (SEO); and information from discussions with Council/Councillors. There were very positive reactions across all sub-sets of the sample. The positive reactions about the three publications and the briefing sessions were above 80%, and about the “discussions” at 70%. On the other hand, the level of “did not use” was higher than would be expected. Campaign Methods In the metropolitan contests, there was a much higher use of letter-boxing, doorknocking, and street signs than in the country areas. This is an expected result due to the logistics of the areas. Overall, however, a comparison with the 2006 data indicates a significant decrease in the 2010 sample of unsuccessful candidates. Resources 83% of the candidates stated they had sufficient resources to run their campaigns, compared to 75% in 2006. Of the 28 respondents who stated they did not have sufficient resources, the majority replied “more money”. Opinions The survey asked candidates a number of questions about issues which were either controversial in the campaign or were important in Local Council elections. “Are you aware of any action taken by the Council to inform voters about candidates?” 65% stated they were aware, a standard response over the sub-sets of the sample. The majority of a small number of responses about effectiveness were negative, with most of these suggesting that “Councils could do more”. “Do you believe that the ‘specifications’ outlined in the Local Government (Elections) Act 1999, including the ‘illegal practices’ section, were effective in the election in your Council area?” Of the total candidates, 52% stated that they were effective, a decrease from 63% in 2006. The majority of those who believed the provision was not effective mentioned “too

DME 70237 Local Government Elections Survey 6
complex”, “laws not strong enough”, and “too restrictive”, and “Council unable to deal with the problem”. “Do you believe the ‘specifications’ relating to the placement of election signs were clear and consistent?” 84% of the respondents were satisfied, a level consistent across all sub-sets of the sample. But only 72% were satisfied with the enforcement of the policy, compared with 87% in 2006. “Would you stand in a supplementary election or the next general elections for your Council?” A total of 47% stated that they would stand again. Of those who would not, a high proportion explained “too old; time to retire”. “Do you have any suggestions which might encourage more people to stand for election to Local Government?” 76 respondents made suggestions, which included more publicity, more communication, shorter terms, more money/higher allowances, and more education about Councils. “Do you have any suggestions which might encourage more people to vote in Local Government elections?” Of the 160 responses, 55 suggested compulsory voting, and 42 wanted more education and information. Seven respondents demanded that political parties should “keep out”, six called for incentives for participation, including a lottery ticket and discounts on rates. Assessments of Participants The survey included a major section seeking opinions about the roles played by some key participants in the elections. Four of the 10 participants drew a very low response rate, and a majority of negative comments. State Public Service/Agencies drew 6 comments, all of which can be summaries as “were not helpful”. All of the eleven comments regarding trades unions stated they should “keep out”. Business/Community Organisations (15 responses) drew equal positive and negative comments The majority response concerning State MPs/Ministers (23 respondents) was negative. Residents’/Ratepayers Associations drew 29 responses, of which 18 were positive and 11 negative – both sets vehement in their opinions. The Returning Officer/State Electoral Office (45 responses) received 40 positive comments, most of which noted “efficient, helpful, excellent”. The Local Government Association received 47 responses about its role, of which the majority were very positive. Political Parties (52 responses) drew vehement comments: 29 said parties should “stay out”; 23 said that parties were too strong and/or should be more open about their involvement. The Council received 65 responses, with equal numbers positive and negative. The role of the Media drew the most comments (93), with the responses leaning towards the negative, and strongly put. The major divide was between those who claimed “bias” in some form and those who considered the media was unbiased and fair.
DME 70237 Local Government Elections Survey 7
PROFILE OF THE CANDIDATES
Over the past 25 years, there have been discussions about the profile of the elected membership of Councils, often in terms of an alleged or actual over-representation of males, people of Anglo-Celtic origin, business people, and older people. These issues have been analysed through surveys of members, especially in surveys conducted in 1997, and 2004. The 2006 survey, for the first time, was extended to all candidates for the elections. The major purpose of the profile questions was to establish the characteristics of people who stood as candidates for the Local Government elections in 2010. Q. Was 2010 your first electoral contest for Local Government? Yes 51 No 49 (n=192) In 2006, 41% of the candidates were first contest. Analysis by type of Council indicates that the ratio of first contest candidates in 2011 was significantly higher in the metropolitan Councils. First contest Metropolitan 60 (n=85) Regional 38 (n=29) Rural/Urban 44 (n=25) Rural 43 (n=35) The gender breakdown identified 65% of males and 64% of females were “first contest”. Gender In 1973, females constituted a meagre three per cent of the total elected membership of Local Government in South Australia. By 1987, this had increased to 16 per cent, and by 1997 to 25 per cent. This was a remarkable rise, evidence of an increasing interest among women about a role in Local Government, of possible increased opportunities to be involved, and of the success of a series of campaigns to encourage women. After the 2004 elections, however, the proportion of women elected to Local Councils had increased only marginally to 26 per cent. This prompted further efforts to increase the proportion but, on the results of the survey, with little success. Male 71 Female 29 (n=189) This disparity was evident across the range of types of Councils. Male Female Metropolitan 74 26 (n=86) Regional 72 28 (n=29) Urban/rural 60 40 (n=25) Rural 74 26 (n=35)

DME 70237 Local Government Elections Survey 8
There was also a significant difference in terms of gender. First contest Incumbent Male 64 69 Female 36 21 (n=91 (n=87) There was one positive component: the first contest candidates contained 36% females, compared to only 21% of the candidates seeking re-election. Age The most consistent trend for a quarter of a century has been the “aging” of the membership of Councils. In 1987, only one quarter of the members were under 40 years of age; in 1997, the proportion was less than 12%. In the 2004 member survey, only 5% of the respondents were under 45 years of age, and the over-60 group had exploded to 44%, with 76% of the members older than 55. There was clear evidence of the “ageing” of the membership of Councils, a trend evident across the State, but most evident in rural Councils. Attracting younger people to stand as candidates was clearly a top priority. The 2011 survey data showed little change in age patterns. 18-24 1 25-34 4 35-44 8 45-54 19 55-64 38 65+ 30 (n=189) In 2010, the profile of candidates had shifted further to “ageing”. The table below summarises four recent surveys. Age 2006 2008 2010 2010 Candidate New Members Candidate Candidate ( + NEM) 18-34 9 10 5 5 35-54 48 37 27 25 55+ 43 53 68 70 If the data are subdivided into first contest and re-nominating candidates, the aging pattern is further emphasised, although, as noted above, there was an improvement in the first candidates. Age First Contest Re-nominating 18-34 7 2 35-44 32 18 55+ 62 79 There is some evidence that the first contestants show a younger profile than the re-nominating candidates. But the 55+ category is still well above the 50 per cent line.

DME 70237 Local Government Elections Survey 9
The breakdown by type of Council emphases a trend noted in earlier reports: the age “problem” crosses all types, but is especially strong in the rural Councils. 18-34 35-54 55+ Metropolitan 8 23 65 (n=86) Regional - 21 79 (n=29) Urban/Rural 4 40 56 (n=25) Rural - 17 83 (n=35) Family Structure A disincentive to an involvement in Local Government is a young family, with parental responsibilities, and a single-parent even more so. Further, the necessity in the modern economy for both, or the only parent, to have employment, is equally an important factor. This may also be a partial explanation of the proportion of older people. Of the 2011 respondents, 67% were married, and a further 7% were in a de facto relationship. 10% were single; 12% were separated or divorced; 4% were widowed. A total of 27% had dependent children. These data reinforce comments made in previous surveys: that one policy area with the potential to increase the proportion of younger people offering themselves as candidates for Local Government would include provision of child care facilities, and any other means which could make the role of an elected member with family responsibilities more attractive. Education The 2011 survey asked three questions about education.
what level was the final year of full-time secondary education? which type of tertiary institution was attended? what post-secondary qualification(s) were achieved?
A total of 8% of respondents left before year 10; 40% completed year 11; and 52% completed year 12. Education Level Reached Year 8 5 9 3 10 18 11 22 12 52 (n=182) These data are partially linked to the age of candidates. Those over 50 years of age, and especially the over 60s, would be less likely to have continued to Years 11 or 12. These data also mirror the general trend in society toward more children completing Year 12. Of the total of 192 respondents, 131 attended a tertiary education institution. CAE 8 TAFE 27 University 65 (n=131)
DME 70237 Local Government Elections Survey 10
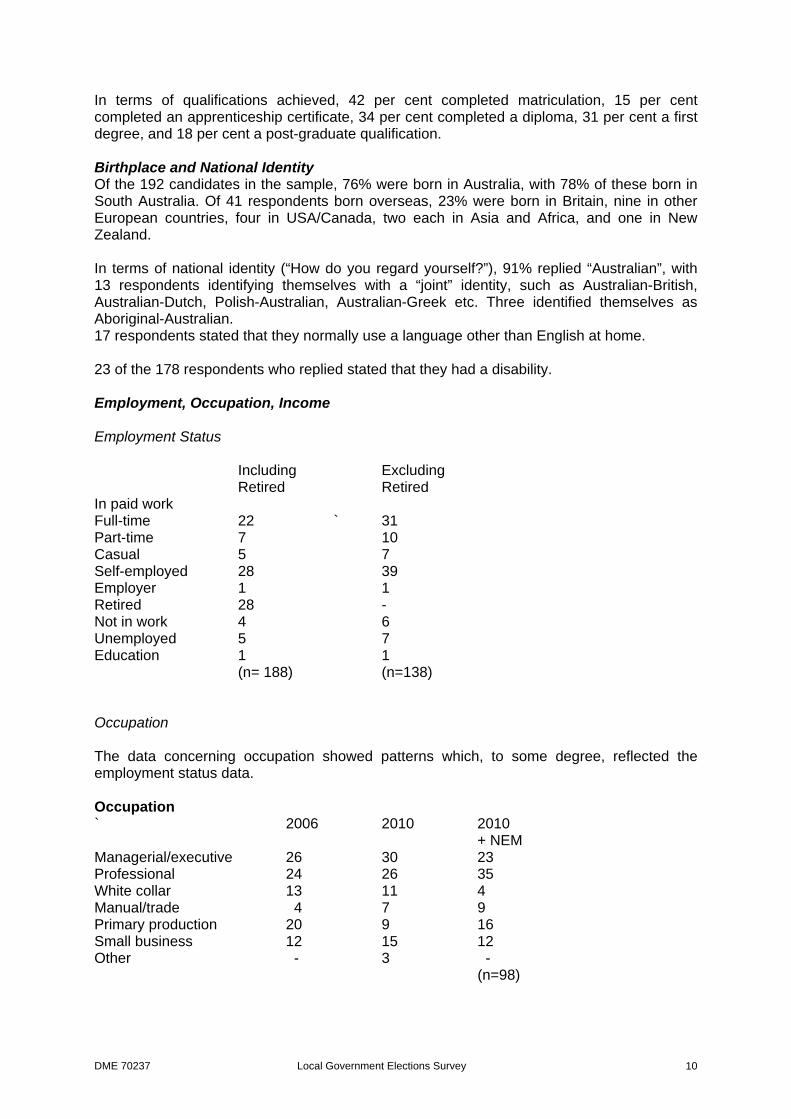
In terms of qualifications achieved, 42 per cent completed matriculation, 15 per cent completed an apprenticeship certificate, 34 per cent completed a diploma, 31 per cent a first degree, and 18 per cent a post-graduate qualification. Birthplace and National Identity Of the 192 candidates in the sample, 76% were born in Australia, with 78% of these born in South Australia. Of 41 respondents born overseas, 23% were born in Britain, nine in other European countries, four in USA/Canada, two each in Asia and Africa, and one in New Zealand. In terms of national identity (“How do you regard yourself?”), 91% replied “Australian”, with 13 respondents identifying themselves with a “joint” identity, such as Australian-British, Australian-Dutch, Polish-Australian, Australian-Greek etc. Three identified themselves as Aboriginal-Australian. 17 respondents stated that they normally use a language other than English at home. 23 of the 178 respondents who replied stated that they had a disability. Employment, Occupation, Income Employment Status Including Excluding Retired Retired In paid work Full-time 22 ` 31 Part-time 7 10 Casual 5 7 Self-employed 28 39 Employer 1 1 Retired 28 - Not in work 4 6 Unemployed 5 7 Education 1 1 (n= 188) (n=138) Occupation The data concerning occupation showed patterns which, to some degree, reflected the employment status data. Occupation ` 2006 2010 2010 + NEM Managerial/executive 26 30 23 Professional 24 26 35 White collar 13 11 4 Manual/trade 4 7 9 Primary production 20 9 16 Small business 12 15 12 Other - 3 - (n=98)

DME 70237 Local Government Elections Survey 11
The candidates in all three samples were dominated by managerial, professional and white collar occupations. As in previous surveys, the proportion of “blue collar” people who nominate is very small. Sector Private 78 Public Commonwealth 3 State 16 Local 3 (n=105) Private sector employment was dominant. Income The income of the candidates encompassed a wide range, and reflected the patterns in the 2006 survey.
2006 2010
$ ‘000 Less than 15 11 13 15-25 13 13 26-35 13 12 36-45 12 13 46-55 12 13 56-65 8 9 66-75 6 8 76-85 6 3 86-100 7 5 100+ 11 10 n=156

DME 70237 Local Government Elections Survey 12
INVOLVEMENT WITH THE COMMUNITY There are two different components in the relationship of an elected member with the local community. First, the member will be involved in the process of representation of the citizens. This is a two-way process. The citizens will approach the member for advice, assistance, an argument, a request, or a range of other reasons; and the member will seek to retain contacts with the community to establish what are the issues of the moment, and as a canvassing tactic for the next election. Second, elected members will usually be involved with many local organizations. In many cases, this would have preceded election to the Council, and reflect the personal interests of the individuals. But there is also pressure on members to widen their involvement. Some local groups will seek to have members of the Council involved with them in the hope of better understanding and, perhaps for some, a hope that such involvement may improve the “benefits” flowing to the group from the Council. The respondents in the 2010 election were asked to state their membership in a range of organizations. There was the opportunity to name more than one organization, hence the basis is the % of responses.
Work Organisations 2006 2010 Business 23 30 Professional 32 38 Rural 15 9 Trade Union 30 30 (for all rows n=192) Public Bodies School 54 33 Hospital 16 19 Advisory 29 30 (n for all rows= 192) These data show a significantly reduced involvement in 2010 Political organisations Political party 22 26 Labor (14) Liberal (27)
other (4) Pressure group 2 5 Residents group 14 22 Other 1 2 (n for all rows=192) There has been much debate over time about the involvement of political parties in Local Government. Unlike the eastern states, South Australia has not seen the formal involvement of parties in local elections and in local affairs as disciplined blocs. But there have been party members in Local Government for decades.

DME 70237 Local Government Elections Survey 13
In recent years, however, there has been a growing tendency for some political parties to use Local Government as a “cadetship” for potential candidates for state and federal elections, and some suggestions that party is playing a more powerful role in Local Government affairs. The data above show that 48 of the 192 unsuccessful candidates (26%) in the 2010 election were members of parties, compared to 22% in 2006. In 2010, 14 were Labor members and 27 Liberal. The analysis by type of Council shows an expected division: the metropolitan areas is the “home” of the Labor party involvement, while the Liberal members, in the majority, are in the rural area in a majority. Again, there is evidence of a lower level of involvement in political groups other than political parties. Service group 2006 2010 APEX 11 10 Lions 18 16 Rotary 19 22 Red Cross 5 7 CFS 18 12 SES 6 3 Other 25 16 (n for all rows = 192) The answers to the question, which allowed for membership of more than one organization, mentioned 19 separate service organizations. A number had only one mention, for example: Zonta, Soroptomists, Kiwanis, JCEES, and Neighbourhood Watch. The dominant organizations in terms of numbers were CFS, Rotary, Lions, and Apex. The involvement of unsuccessful candidates in service groups in 2010 was lower for some groups than of candidates in 2006. This is an important index, as a wide involvement in local groups and community affairs can be taken as a “positive” in terms of winning support in elections. On the other hand, there was strong evidence that candidates considered their “key” service to be directed to the community. Of the 192 respondents in 2011, 118 (61%) stated that they were members of a community organisation, Other group 2006 2010 Sports 66 49 Arts 14 17 Music 12 10 Other 7 1 (n for all rows=192) The responses indicated the “national character” of involvement with sport, with 94 of the 192 candidates nominating it.

DME 70237 Local Government Elections Survey 14
RECRUITMENT Attraction to Stand Q. What first aroused your interest in becoming a Councillor? 2006 2010 Family tradition 6 10 Friends 29 30 Business 4 11 Recruitment campaign 3 4 Sitting Member(s) 33 24 Organisation 3 6 Specific issue 16 29 (n for each row = 181) 54% of the responses named “friends” or “councillor” as the basis for the decision to stand. This was in line with results in the surveys of 1997, 2004, and 2006. On the other hand, the low proportion (4%) who stated that they were influenced by Local Government recruitment campaigns suggests that there could be more effort put into these exercises. In comparison with 2006, the only significant difference relates to the “sitting Member” category. Q. Which issues? As in the 2006 survey, a substantial proportion of the respondents stated that their decision to stand was based on an issue. A total of 47 responses named a specific issue. A number of the latter were idiosyncratic, and 16 of the responses involved only one respondent. Summary responses: 47 respondents, 77 responses Governance, Council does not function, More transparency (40) Better financial management (5) DPA (4) Roads (4) Too much party influence (4) Oppose infill housing (2) Tourism (2) Other, including environment issues, aged care, youth, gardens, library, (16) The analysis of the answers identified a number of specific issues, offered by almost one quarter if the sample, some of which were idiosyncratic and/or related to a specific local area or Council. However, there was a high proportion of issues named which fell into more general categories. Over half of the responses named an issue which could be subsumed under the heading of governance within the Council.

DME 70237 Local Government Elections Survey 15
Allowances Prior to the 2006 elections, the members of Local Councils had been awarded a significant increase in allowances. The 2006 questionnaire explored any impact of this on the candidates. Surprisingly, only 52 per cent of the respondents stated that they were aware of the increase before they decided to nominate. The 2011 survey replicated this pattern. Q. Were you aware of the maximum allowance levels for Councillors when you decided to nominate? Yes: 52 No: 48 (n=190) Only 15 respondents, 16% of those who stated they were aware of the allowance levels, stated that the allowance “made a difference” in their decision.
DME 70237 Local Government Elections Survey 16
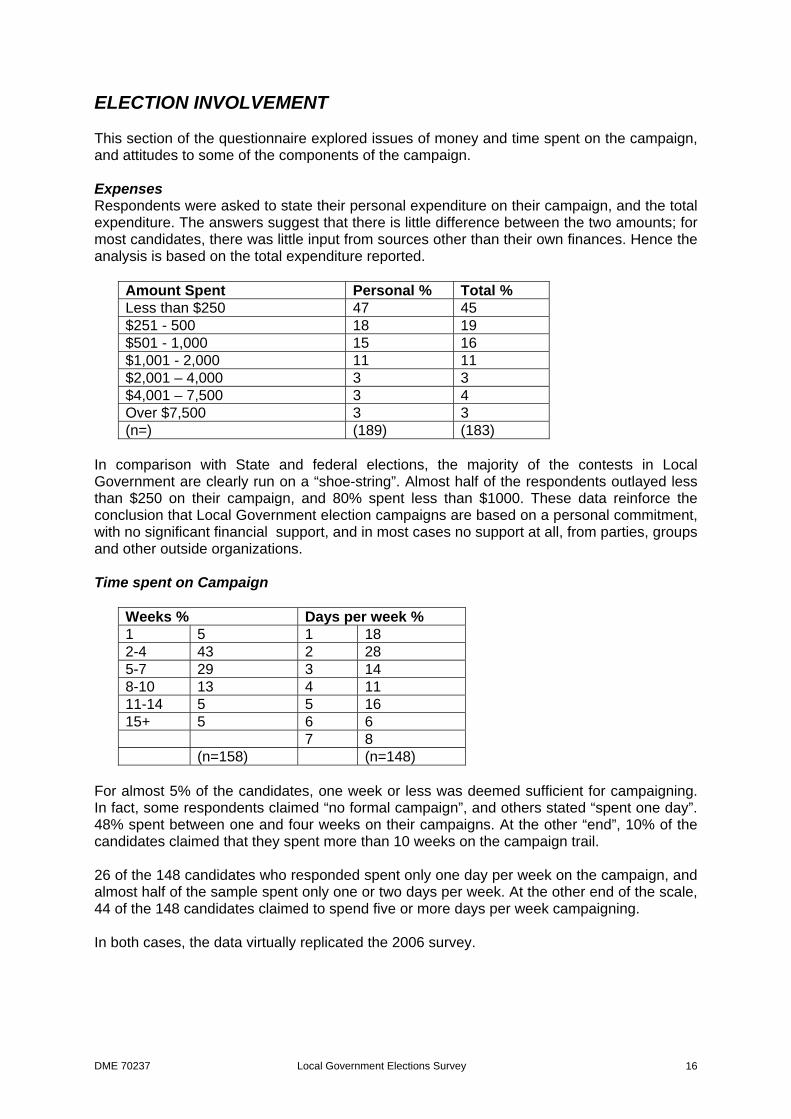
ELECTION INVOLVEMENT This section of the questionnaire explored issues of money and time spent on the campaign, and attitudes to some of the components of the campaign. Expenses Respondents were asked to state their personal expenditure on their campaign, and the total expenditure. The answers suggest that there is little difference between the two amounts; for most candidates, there was little input from sources other than their own finances. Hence the analysis is based on the total expenditure reported.
Amount Spent Personal % Total % Less than $250 47 45 $251 - 500 18 19 $501 - 1,000 15 16 $1,001 - 2,000 11 11 $2,001 – 4,000 3 3 $4,001 – 7,500 3 4 Over $7,500 3 3 (n=) (189) (183)
In comparison with State and federal elections, the majority of the contests in Local Government are clearly run on a “shoe-string”. Almost half of the respondents outlayed less than $250 on their campaign, and 80% spent less than $1000. These data reinforce the conclusion that Local Government election campaigns are based on a personal commitment, with no significant financial support, and in most cases no support at all, from parties, groups and other outside organizations. Time spent on Campaign
Weeks % Days per week % 1 5 1 18 2-4 43 2 28 5-7 29 3 14 8-10 13 4 11 11-14 5 5 16 15+ 5 6 6 7 8 (n=158) (n=148)
For almost 5% of the candidates, one week or less was deemed sufficient for campaigning. In fact, some respondents claimed “no formal campaign”, and others stated “spent one day”. 48% spent between one and four weeks on their campaigns. At the other “end”, 10% of the candidates claimed that they spent more than 10 weeks on the campaign trail. 26 of the 148 candidates who responded spent only one day per week on the campaign, and almost half of the sample spent only one or two days per week. At the other end of the scale, 44 of the 148 candidates claimed to spend five or more days per week campaigning. In both cases, the data virtually replicated the 2006 survey.
DME 70237 Local Government Elections Survey 17
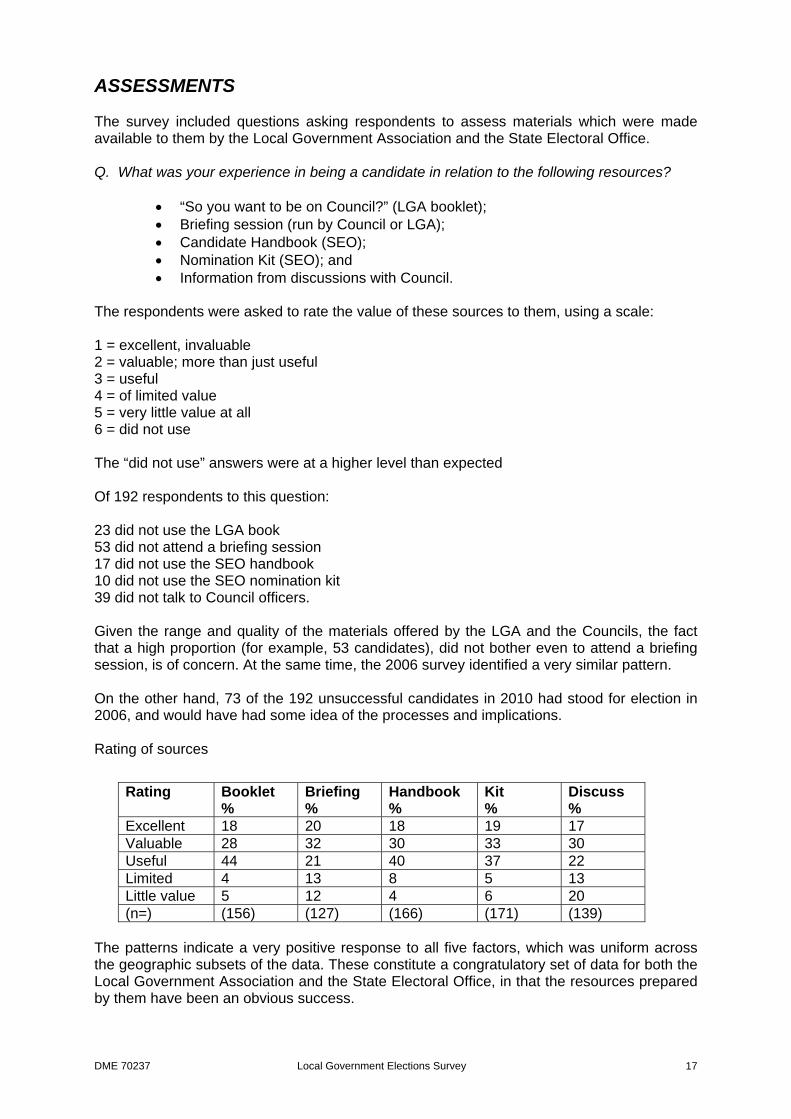
ASSESSMENTS The survey included questions asking respondents to assess materials which were made available to them by the Local Government Association and the State Electoral Office. Q. What was your experience in being a candidate in relation to the following resources?
“So you want to be on Council?” (LGA booklet); Briefing session (run by Council or LGA); Candidate Handbook (SEO); Nomination Kit (SEO); and Information from discussions with Council.
The respondents were asked to rate the value of these sources to them, using a scale: 1 = excellent, invaluable 2 = valuable; more than just useful 3 = useful 4 = of limited value 5 = very little value at all 6 = did not use The “did not use” answers were at a higher level than expected Of 192 respondents to this question: 23 did not use the LGA book 53 did not attend a briefing session 17 did not use the SEO handbook 10 did not use the SEO nomination kit 39 did not talk to Council officers. Given the range and quality of the materials offered by the LGA and the Councils, the fact that a high proportion (for example, 53 candidates), did not bother even to attend a briefing session, is of concern. At the same time, the 2006 survey identified a very similar pattern. On the other hand, 73 of the 192 unsuccessful candidates in 2010 had stood for election in 2006, and would have had some idea of the processes and implications. Rating of sources
Rating Booklet
% Briefing %
Handbook %
Kit %
Discuss %
Excellent 18 20 18 19 17 Valuable 28 32 30 33 30 Useful 44 21 40 37 22 Limited 4 13 8 5 13 Little value 5 12 4 6 20 (n=) (156) (127) (166) (171) (139)
The patterns indicate a very positive response to all five factors, which was uniform across the geographic subsets of the data. These constitute a congratulatory set of data for both the Local Government Association and the State Electoral Office, in that the resources prepared by them have been an obvious success.
DME 70237 Local Government Elections Survey 18
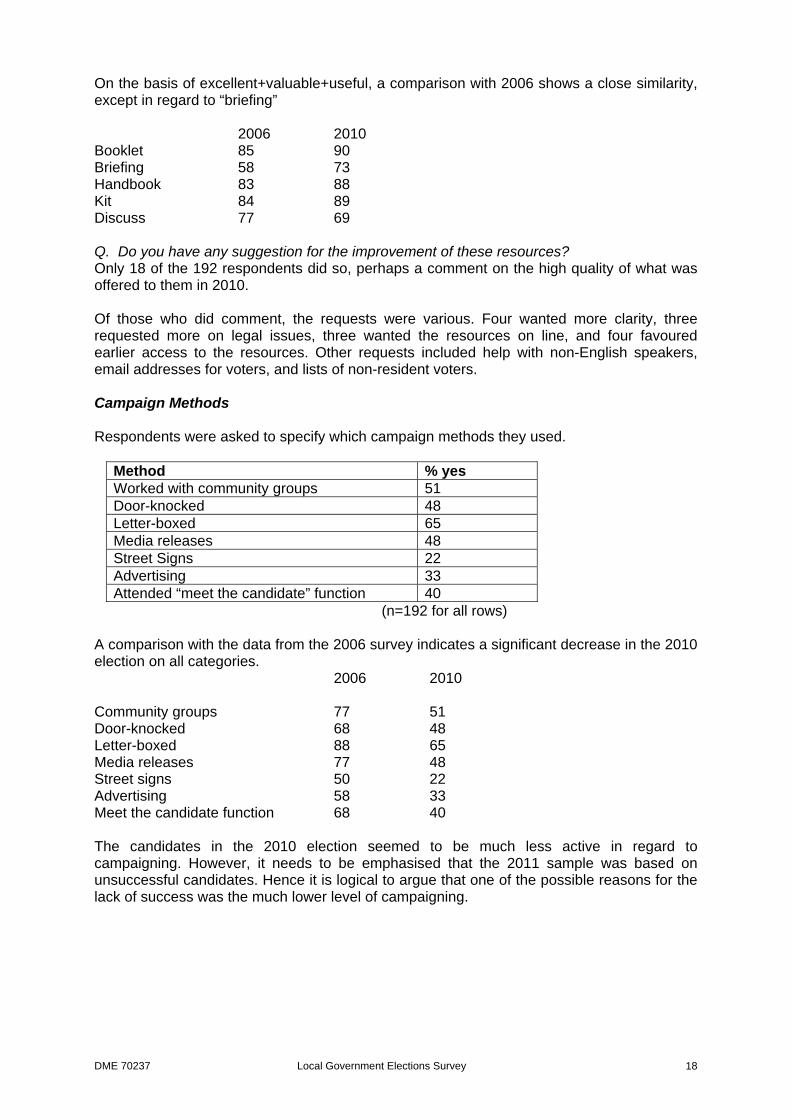
On the basis of excellent+valuable+useful, a comparison with 2006 shows a close similarity, except in regard to “briefing” 2006 2010 Booklet 85 90 Briefing 58 73 Handbook 83 88 Kit 84 89 Discuss 77 69 Q. Do you have any suggestion for the improvement of these resources? Only 18 of the 192 respondents did so, perhaps a comment on the high quality of what was offered to them in 2010. Of those who did comment, the requests were various. Four wanted more clarity, three requested more on legal issues, three wanted the resources on line, and four favoured earlier access to the resources. Other requests included help with non-English speakers, email addresses for voters, and lists of non-resident voters.
Campaign Methods Respondents were asked to specify which campaign methods they used.
Method % yes Worked with community groups 51 Door-knocked 48 Letter-boxed 65 Media releases 48 Street Signs 22 Advertising 33 Attended “meet the candidate” function 40
(n=192 for all rows) A comparison with the data from the 2006 survey indicates a significant decrease in the 2010 election on all categories. 2006 2010 Community groups 77 51 Door-knocked 68 48 Letter-boxed 88 65 Media releases 77 48 Street signs 50 22 Advertising 58 33 Meet the candidate function 68 40 The candidates in the 2010 election seemed to be much less active in regard to campaigning. However, it needs to be emphasised that the 2011 sample was based on unsuccessful candidates. Hence it is logical to argue that one of the possible reasons for the lack of success was the much lower level of campaigning.
DME 70237 Local Government Elections Survey 19
Such a conclusion is supported by comparing the unsuccessful candidates in both 2006 and 2010. 2006 2010 Groups 42 51 Doorknock 42 48 Letter 71 65 Media 51 48 Signs 22 22 Advertising 29 33 Function 37 40 The patterns are similar. Resources It was noted above that Local Government election candidates spend significantly less on their campaigns that State election candidates. Respondents were asked: Q. Did you have enough resources to inform the community well?” 2006 2010 Yes 75 83 No 25 17 (n=165) Of the 28 respondents who stated that they did not have sufficient resources, only 17 gave an answer to the question: “what did you need?” The most common request was for more money (5 respondents), and two complained about the lack of media coverage for their campaigns. Other requests included public funding, truth in advertising, more time, and assistance from the Council. Information provided Q. Are you aware of any action taken by the council to inform voters about candidates? 2006 2010 Yes 63 65 No 37 35 (n=189) These data mirrored the responses in 2006. Q. If yes, do you think it was effective? Ten of the 44 candidates who replied stated that the action was very good/OK, and three praised the websites. But 31 candidates were convinced that their Council did not “do enough”.

DME 70237 Local Government Elections Survey 20
“Illegal Practices” Q. Do you believe that the ‘specifications’ outlined in the Local Government (Elections) Act 1999, including the ‘illegal practices’ section, were effective in the election in your Council area? 2006 2010 Yes 63 52 No 37 48 (n= 184) Of 184 responses, 52% agreed that the “specifications” were effective. This compares with 63% in the 2006 survey. Of the 85 respondents (110 responses) who were not satisfied, the complaints were: Hard to follow, confusing (27) Too restrictive (28) Unable to deal with illegal practices (55) The last comment relates more to the “effectiveness” of policing the “specifications”, and the data suggest significant dissatisfaction. Signage Q. Do you believe that the ‘specifications’ relating to the placement of election signs were clear and consistent? 2006 2010 Yes 87 84 No 13 16 (n= 184) The 16 negative responses included: confusing (3), too many abuses (4), rules were not upheld (5), abuses ignored (2). Q. Do you believe the enforcement by your Council of policies relating to the control of election signs was timely and impartial? 2006 2010 Yes 87 72 No 13 28 (n=167) Of the 167 who replied, 72 per cent were satisfied by Council actions. Of those who were not satisfied (30 respondents), the comments included: no action, not policed, too slow to enforce, signs left up, signs favoured incumbents, and four respondents stated signs should be banned. Overall, there was evidence from both the 2006 ( in which 87% were satisfied) and 2011 surveys that the clear majority of the candidates were satisfied with both the policy and the manner it was enforced.

DME 70237 Local Government Elections Survey 21
Q. Councils were subject to ‘caretaker’ policies similar to ‘caretaker conventions’ for other government agencies about what a Council may or may not do during the elections period. Do you consider these policies advantaged sitting members of Council in the election?
2006 2010 Yes 27 35 No 73 65 (n=167) In the 2006 survey, 27% of the respondents answered that the caretaker policies advantaged incumbents. In the 2011 survey, 35% stated that there had been an advantage. Only 23 of the respondents explained their answers. Incumbents ignored the convention, took advantage 17 Convention not policed 2 Should go into caretaker earlier 2 Too complicated 2
DME 70237 Local Government Elections Survey 22
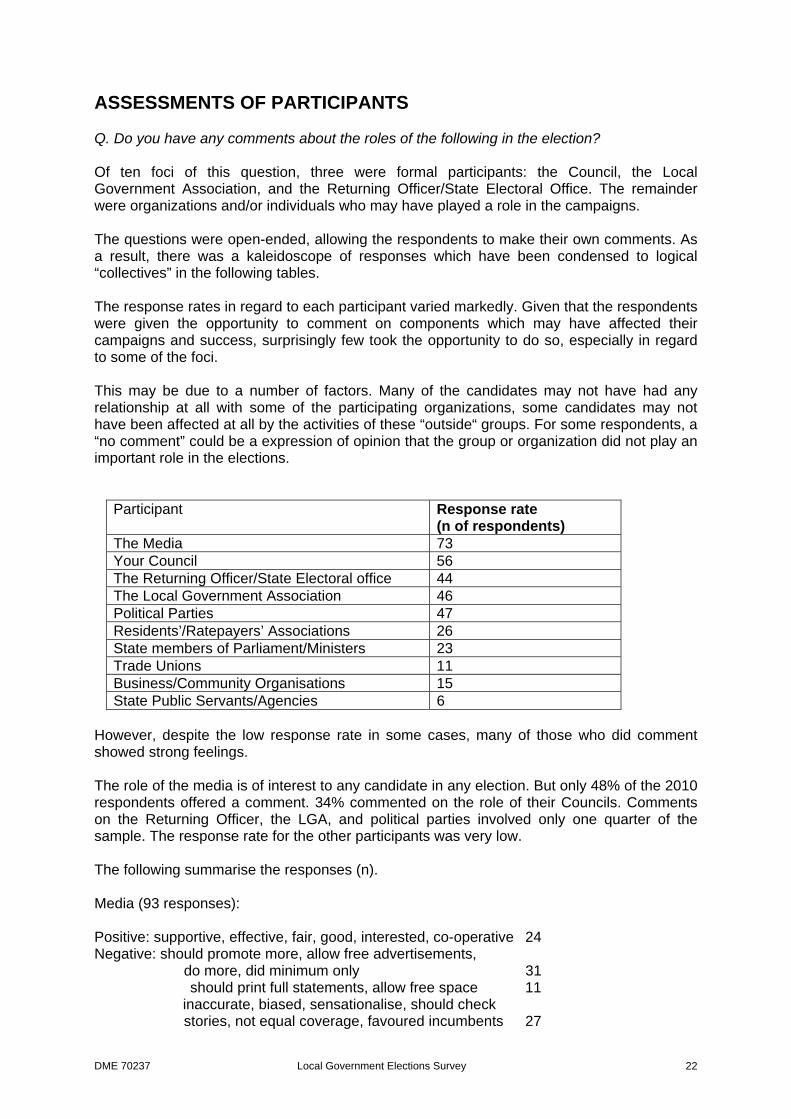
ASSESSMENTS OF PARTICIPANTS Q. Do you have any comments about the roles of the following in the election? Of ten foci of this question, three were formal participants: the Council, the Local Government Association, and the Returning Officer/State Electoral Office. The remainder were organizations and/or individuals who may have played a role in the campaigns. The questions were open-ended, allowing the respondents to make their own comments. As a result, there was a kaleidoscope of responses which have been condensed to logical “collectives” in the following tables. The response rates in regard to each participant varied markedly. Given that the respondents were given the opportunity to comment on components which may have affected their campaigns and success, surprisingly few took the opportunity to do so, especially in regard to some of the foci. This may be due to a number of factors. Many of the candidates may not have had any relationship at all with some of the participating organizations, some candidates may not have been affected at all by the activities of these “outside“ groups. For some respondents, a “no comment” could be a expression of opinion that the group or organization did not play an important role in the elections.
Participant Response rate (n of respondents)
The Media 73 Your Council 56 The Returning Officer/State Electoral office 44 The Local Government Association 46 Political Parties 47 Residents’/Ratepayers’ Associations 26 State members of Parliament/Ministers 23 Trade Unions 11 Business/Community Organisations 15 State Public Servants/Agencies 6
However, despite the low response rate in some cases, many of those who did comment showed strong feelings. The role of the media is of interest to any candidate in any election. But only 48% of the 2010 respondents offered a comment. 34% commented on the role of their Councils. Comments on the Returning Officer, the LGA, and political parties involved only one quarter of the sample. The response rate for the other participants was very low. The following summarise the responses (n). Media (93 responses): Positive: supportive, effective, fair, good, interested, co-operative 24 Negative: should promote more, allow free advertisements, do more, did minimum only 31 should print full statements, allow free space 11 inaccurate, biased, sensationalise, should check stories, not equal coverage, favoured incumbents 27
DME 70237 Local Government Elections Survey 23
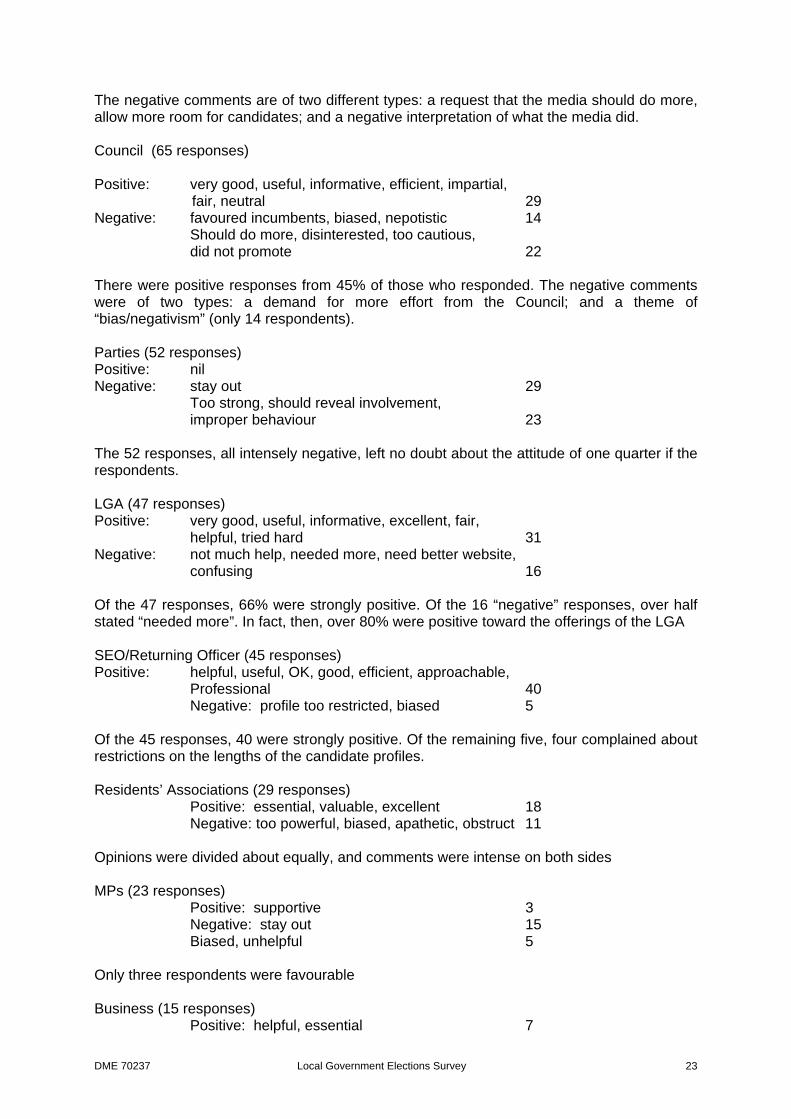
The negative comments are of two different types: a request that the media should do more, allow more room for candidates; and a negative interpretation of what the media did. Council (65 responses) Positive: very good, useful, informative, efficient, impartial, fair, neutral 29 Negative: favoured incumbents, biased, nepotistic 14 Should do more, disinterested, too cautious, did not promote 22 There were positive responses from 45% of those who responded. The negative comments were of two types: a demand for more effort from the Council; and a theme of “bias/negativism” (only 14 respondents). Parties (52 responses) Positive: nil Negative: stay out 29 Too strong, should reveal involvement, improper behaviour 23 The 52 responses, all intensely negative, left no doubt about the attitude of one quarter if the respondents. LGA (47 responses) Positive: very good, useful, informative, excellent, fair, helpful, tried hard 31 Negative: not much help, needed more, need better website, confusing 16 Of the 47 responses, 66% were strongly positive. Of the 16 “negative” responses, over half stated “needed more”. In fact, then, over 80% were positive toward the offerings of the LGA SEO/Returning Officer (45 responses) Positive: helpful, useful, OK, good, efficient, approachable,
Professional 40 Negative: profile too restricted, biased 5 Of the 45 responses, 40 were strongly positive. Of the remaining five, four complained about restrictions on the lengths of the candidate profiles. Residents’ Associations (29 responses) Positive: essential, valuable, excellent 18 Negative: too powerful, biased, apathetic, obstruct 11 Opinions were divided about equally, and comments were intense on both sides MPs (23 responses) Positive: supportive 3 Negative: stay out 15 Biased, unhelpful 5 Only three respondents were favourable Business (15 responses) Positive: helpful, essential 7

DME 70237 Local Government Elections Survey 24
Negative: self-interested, biased, stay out 8 Trades Unions (11 responses) Positive: nil Negative: stay out, biased 11 As with political parties, there were no positive comments. Public servants (6 responses) Positive: nil Negative: no help, stay out 6

DME 70237 Local Government Elections Survey 25
THE FUTURE .Q. Would you stand in a supplementary election or the next general elections for your Council Yes 47 No 53 (n=192) 22 respondents explained their “yes” comment; 43 explained their “no”. Yes: incumbents are poor (9) Community needs better (4) Better governance, end factions (3) Environment (2) If parties banned (2) Need business people (2) No: too old (20) Parties too strong ( 8) Lack of money ( 5) Vote system biased/wrong ( 5) Incumbents too strong ( 3) 4 years too long ( 2) Q. Do you have any suggestions which might encourage more people to stand for election to Local Government? 76 respondents answered this question, with 94 responses. Educate more about Councils, teach in schools, motivate people more 29 Need more transparency/honesty in Councils, need truth in election advertising, better governance 9 Two-term limit, higher allowances, 5 Media has responsibility 6 No parties 5 Encourage women more 3 Bring back business vote 2 Public funding, limit election spending, no election advertising, tax deduction for expenses, car expenses no private money, 12 More resident association effort 3 Information meetings 3 Two-term limit, set age limit for members 5 Change election system, full preferences, Robson rotation, no preferences, shorter campaigns 8 Other 4 This kaleidoscope of responses contained 94 suggestions to lift turnout, ranging from more education about Local Government to a range of issues concerning money, such as increased allowances, public funding, and tax deductions. Comments about the electoral system contained contradictory elements, for example: some wanted to abolish preferences, others wanted full preferences.

DME 70237 Local Government Elections Survey 26
Q. Do you have any suggestions which might encourage more people to vote in Local Government elections? 111 respondents, 160 responses Compulsory voting 55 More publicity, better image, more education, Media responsibility, more information to voters 42 Public funding for campaigns 18 Ban parties 7 Better advice to non-English speakers 9 On line voting 6 End postal votes, end property votes 6 First past the post 4 Incentives – a prize for voting, cut in rates for voting, 6 Other 7 Of the 111 respondents, 50% had the simple answer – compulsory voting. 42 respondents put positive suggestions, such as more education, more information, and a better image for Local Government.