unmasking the interplay between technology evolution and · pdf filearticle history: received...
TRANSCRIPT

Ucm
RT
a
ARRAA
KTRSIT
1
guirrbus11tRD
c
p
0h
Research Policy 43 (2014) 555– 569
Contents lists available at ScienceDirect
Research Policy
jou rn al hom epage: www.elsev ier .com/ locate / respol
nmasking the interplay between technology evolution and R&Dollaboration: Evidence from the global semiconductoranufacturing industry, 1990–2010
ahul Kapoor ∗, Patia J. McGrath1
he Wharton School, University of Pennsylvania, Philadelphia, PA 19104, United States
r t i c l e i n f o
rticle history:eceived 8 March 2012eceived in revised form 5 August 2013ccepted 5 August 2013vailable online 19 September 2013
eywords:echnology evolution&D collaboration
a b s t r a c t
Technological progress in an industry is enabled by the collective R&D efforts of suppliers, users andresearch organizations. In this study, we explore how the pattern of R&D collaboration within the industrycommunity evolves over the technology life cycle. We propose that as the technology evolves from aninitial emergence stage to subsequent stages of growth and maturity, there is a corresponding changein the opportunities and challenges confronting industry participants. This results in a shift not only inthe relative propensities for internal and collaborative R&D, but also in the distribution of the differenttypes of collaborative interactions involving research organizations, suppliers and users. The context forthe study is the global semiconductor manufacturing industry from 1990 to 2010. During this period,
emiconductor industryndustry–science linksechnology integration
the industry experienced exponential technological progress that was fueled by the deep ultraviolet(DUV) manufacturing technology. We draw upon a comprehensive archival dataset of more than 12,000articles presented in industry technical conferences to analyze the pattern of collaborative R&D during theemergence, growth and maturity stages of the DUV technology. The observed trends in the semiconductormanufacturing industry point to intriguing shifts in the efforts and interactions among suppliers, usersand research organizations as they collectively push the technology envelope forward.
. Introduction
Technological progress is an important driver of economicrowth. The trajectory of progress has often been conceptualizedsing a life cycle model in which a technology evolves from an
nitial period of infancy and experimentation, through a stage ofapid and cumulative growth, and into a period of relative matu-ity where performance approaches technical limits. This model haseen effectively used to characterize evolutionary processes thatnderlie technological progress and derive implications for firmtrategies and industry evolution (Sahal, 1981; Dosi, 1982; Foster,986; Anderson and Tushman, 1990; Nelson, 1994; Utterback,994). Within this literature stream, focal firms are typically por-rayed as the locus of innovation such that it is their autonomous&D efforts that drive progress over the technology life cycle (e.g.,
osi, 1982; Foster, 1986; Christensen, 1992; Schilling, 2008).In parallel, the literature stream on networks of innovators hasonsidered the industry’s locus of innovation as being significantly
∗ Corresponding author. Tel.: +1 215 898 6458.E-mail addresses: [email protected] (R. Kapoor),
[email protected] (P.J. McGrath).1 Tel.: +1 215 898 3560.
048-7333/$ – see front matter © 2013 Elsevier B.V. All rights reserved.ttp://dx.doi.org/10.1016/j.respol.2013.08.002
© 2013 Elsevier B.V. All rights reserved.
broader, and comprised of a collaborative network of suppliers,users and research organizations, who offer distinct but comple-mentary resources to push the technology forward (Freeman, 1991;Rosenberg and Nelson, 1994; Hagedoorn, 1995). While scholarshave generated valuable insights regarding the motivations andimplications of such collaborations (see Powell and Grodal (2005)for an extensive review of this literature), they have devoted lessattention to the evolutionary processes over the course of the tech-nology’s life cycle that shape the context for R&D collaboration(Ahuja et al., 2011). Hence, these related literature streams on theirown have focused on different aspects of the phenomenon of tech-nological innovation and typically treated the focal innovators andthe innovation context in general terms. As a result, they have beenunable to offer any specific guidance concerning how the indus-try’s locus of innovation, comprised of a multiplicity of actors andtheir collaborative interactions, evolves over the technology lifecycle.
One possible reason for this gap is the nature of empirical evi-dence that has been used to study R&D collaboration. As notedby Hagedoorn (2002), a large proportion of empirical research hasrelied upon survey-based cross-sectional data, and this has severely
limited our ability to generate longitudinal insights. Moreover,while efforts to develop longitudinal databases, such as the widelycited MERIT-CATI database, have resulted in a detailed account of
5 search
iiltmwi
acatsiris(GamcnRr
twnT(tShitcco
aptsRoticatoviicmsswf
up
Collaborations involving universities and dedicated researchinstitutes are often aimed at solving problems of a more funda-mental nature and involve basic research (Rosenberg and Nelson,
3 Our focus is squarely on the technology life cycle, rather than on the product lifecycle or the industry life cycle which operate at different levels of analysis (product
56 R. Kapoor, P.J. McGrath / Re
ntertemporal trends on industry-level differences, international-zation, and the different forms of contracting, these databases areimited to the formal inter-firm arrangements that are reported inhe popular or industry press. Hence, they do not capture infor-
al arrangements among firms or between firms and universities,hich represent a large proportion of R&D collaboration within an
ndustry (Link and Bauer, 1989; Freeman, 1991; Hall et al., 2003).2
The primary contribution of this study is to draw upon a newlyssembled dataset based on articles presented in industry techni-al conferences to identify how the pattern of collaborative R&Dmong suppliers, users and research organizations evolves overhe technology’s life cycle. Following the extant literature, we con-ider three distinct types of collaborative interactions within thendustry’s R&D network: science-based collaborations involvingesearch organizations (i.e., universities and dedicated researchnstitutes), technology integration-based collaborations betweenuppliers and users, and co-opetitive collaborations among rivalsMiotti and Sachwald, 2003; Belderbos et al., 2004; Powell androdal, 2005). We propose that as the technology evolves fromn initial emergence stage to subsequent stages of growth andaturity, there is a corresponding change in the opportunities and
hallenges confronting industry participants. This results in a shiftot only in the relative propensities for internal and collaborative&D, but also in the distribution of the different types of collabo-ative interactions.
The context for the study is the global semiconductor manufac-uring industry from 1990 to 2010. During this period, the industryitnessed rapid economic growth and achieved remarkable expo-ential progress along the trajectory referred to as Moore’s Law.his progress was fueled by the emergence of deep ultravioletDUV) manufacturing technology in the late 1980s and its evolu-ion over the subsequent two decades (Iansiti, 1998; Martin andalomon, 2003; Kapoor and Adner, 2007). We draw upon a compre-ensive archival dataset of more than 12,000 articles presented in
ndustry technical conferences. The dataset not only characterizeshe R&D efforts expended toward the DUV technology over its lifeycle, but also captures the collaborative interactions among semi-onductor manufacturers (i.e., users), their suppliers and researchrganizations.
The findings point to intriguing shifts in the efforts and inter-ctions among the different types of actors as they try to keepace with Moore’s Law. During the emergence stage of the DUVechnology, R&D efforts within the industry community had aomewhat stronger internal orientation and the collaborative&D efforts were directed mainly toward science-based collab-ration with research organizations. As the technology evolvedhrough the growth and maturity stages, the R&D efforts becamencreasingly collaborative and, while science-based collaborationsontinued to be prevalent, the distribution of collaborative inter-ctions evolved from predominantly science-based to increasinglyechnology integration-based. Moreover, the industry’s technol-gy integration-based collaborative efforts shifted from principallyertical collaboration between upstream suppliers of technologicalnputs and downstream semiconductor manufacturers to increas-ngly horizontal collaboration between upstream suppliers ofomplementary technological inputs (e.g., between suppliers ofanufacturing materials and equipment). While the relative inten-
ity of co-opetitive collaboration among rivals remained somewhat
table, an exploration of the structure of the collaboration net-ork suggested a gradual evolution in co-opetitive collaborationrom a learning orientation (i.e., using collaboration to learn and
2 For example, Link and Bauer (1989) found that among their sample of U.S. man-facturing firms that were active in R&D collaboration, over 90% of the collaborativeartnerships were based on informal arrangements.
Policy 43 (2014) 555– 569
accumulate knowledge) to an increasingly resource poolingorientation (i.e., sharing R&D resources to generate economic effi-ciencies).
Although we are cautious in generalizing our findings in light ofexamining a specific industry, the study illustrates how technolog-ical progress is sculpted by a multiplicity of innovation actors, andhow the pattern of R&D collaboration among these actors evolvesover the technology’s life cycle. In doing so, it provides an exampleof how the literature streams of technology evolution and networksof innovators inform one another, and makes a case that theirjoint consideration presents a valuable line of inquiry for innova-tion scholars. Our analyses offer important guidance for managersconcerning the need to reconfigure their collaborative R&D efforts,both over the course of the technology’s life cycle and when theindustry transitions from an old to a new technology. The resultsalso reinforce the significance of universities and suppliers in facil-itating technological progress in addition to the focal innovators(e.g., semiconductor manufacturers), and suggest an ongoing needto adjust policies so as to ensure that progress within an industryor a region is not stifled by misaligned incentives that may hinderdifferent types of R&D collaboration.
2. Technology evolution and the pattern of R&Dcollaboration
Technological progress is often characterized by an S-curvetrajectory, through which improvement in a technology’s perfor-mance is depicted as being a function of cumulative R&D effortexpended (Foster, 1986; Christensen, 1992). Early in the life cycle,technological uncertainty is at its apex; the ensuing experimen-tation and exploration leads to performance progress that is slowand unpredictable (Tushman and Rosenkopf, 1992). As the tech-nology is better understood and more widely diffused, the lifecycle subsequently shifts to a period of rapid growth that is kin-dled by cumulative and incremental innovation (Dosi, 1982; Sahal,1981). Life cycle maturity, while still a vital phase in a technol-ogy’s progress (Harley, 1971; Henderson, 1995; Utterback, 1994),is often marked by diminishing performance returns to the R&Defforts expended.3
Progress within a technology trajectory is shaped by a multi-plicity of innovation actors. These actors, who include suppliers,users, and research organizations, provide varied and complemen-tary responses to move the technology forward (e.g., Dosi, 1988;Rosenberg and Nelson, 1994; Henderson, 1995). Correspondingly,this underscores the importance of collaboration among theseactors (e.g., Freeman, 1991; Hagedoorn, 2002; Powell and Grodal,2005). While the overarching principle guiding the R&D collabora-tion is to achieve technical advances, the diversity of actors withinthe industry community points to important differences in themotivation underlying a given R&D collaboration (Belderbos et al.,2004; Hagedoorn et al., 2000; Miotti and Sachwald, 2003).4
life cycles are nested within technology life cycles, which in turn are part of industrylife cycles).
4 We define R&D collaboration as any voluntarily initiated collaborative exchangebetween organizations that involves finding solution to a known problem within agiven technological context (e.g., Gulati, 1999; Hagedoorn, 2002). Our measure ofR&D collaboration is based on the affiliation of authors of articles presented in indus-try technical conferences. As we elaborate in the methods section, this approachoffers several advantages over traditional data sources to explore how the patternof collaborative R&D efforts within an industry evolves over the technology’s lifecycle.

R. Kapoor, P.J. McGrath / Research Policy 43 (2014) 555– 569 557
Type
R
TV
TH
C
Descript io
Science-ba
R&D orga
Vertical te
based coll
users and
Horizonta
integ ration
between su
complem e
inputs (e.g
complem e
Co-o petiti
between fi
same pro d
on
ased co llabor
anizat ions
echnology in
laborat ion be
supplier s
al technology
n-based coll a
uppliers of
entary techn o
g., between su
entary inputs
ive coll abor a
firms competi
duct mar ket (
ration with
teg ration-
etween
y
aboratio n
ological
uppliers of
1 and 2)
atio n
ing in the
(sup pliers
labora
1fitMaaoj1
ictbbacfdtCfoRbK
t(caSaHa1nd
st
The emergence stage of the technology represents a period ofhigh technological uncertainty. Internal R&D efforts during thisstage are likely to be critical in helping organizations develop
6 Our categorization for the different types of collaborations is primarily based onthe roles of the collaborating entities as shown in Fig. 1 in the paper. This is a typ-ical approach in the R&D collaboration literature (e.g., Miotti and Sachwald, 2003;Belderbos et al., 2004; Powell and Grodal, 2005). The reference to collaborations
Fig. 1. Stylized representation of the types of R&D col
994; Pisano, 1988). Such science-based collaborations providerms with complementary research capabilities and opportunitieso radically advance the technological frontier (Cohen et al., 1998;
eyer-Krahmer and Schmoch, 1998). Not only do universities offerccess to basic scientific knowledge, but strategically structuredgreements may also provide the university’s partners with a firstption on the rights to new discoveries made in the course of theiroint R&D effort (Arora and Gambardella, 1990; Ham and Mowery,998).
Collaborations between users and suppliers are aimed atmproving the technology’s performance through coordinatinghanges to the suppliers’ components and resolving technical bot-lenecks for the users to realize the performance improvement. Forrevity, we refer to these collaborations as technology-integrationased collaborations as they entail the collaborative developmentnd integration of components within the broader technologi-al system (Hughes, 1983). Such collaborations could take theorm of “vertical” collaboration between upstream suppliers andownstream users who work together to develop and integratehe components for the specific user (Clark and Fujimoto, 1991;hesbrough, 1999; Appleyard, 2002). They could also take the
orm of “horizontal” collaboration between upstream suppliersf complementary components who coordinate their component&D efforts so as to ensure that the technological components cane seamlessly integrated by the users (Mitchell and Singh, 1996;apoor, 2013a).5
Besides collaborating with research organizations and actors inhe value chain, competing firms also collaborate with each otherHamel et al., 1989). Co-opetitive collaboration is facilitated whenompetitors share an exceptionally strong interest in a researchrena that is far upstream from commercialization (Miotti andachwald, 2003). Underlying such co-opetitive R&D collaborationsre typically two distinct types of motivations (Sakakibara, 1997;agedoorn et al., 2000). First, firms may cooperate in order to learnnd accumulate knowledge (e.g., Powell et al., 1996; Mowery et al.,
996). Second, firms may also partner in order to generate eco-omic efficiencies (i.e., economies of scale, sharing costs, avoidinguplicate investments etc.) by pooling R&D related resources. Fig. 15 We note that firms may face important tradeoffs regarding efforts to maximizeystem performance and their own performance. These tradeoffs may affect bothhe intensity of efforts and the choice of the collaborating partner.
or users)
tions among suppliers, users and R&D organizations.
uses a simplified schema to illustrate these different types of col-laborative relationships within an industry’s R&D network.6
During the early emergence stage of the technology, the envi-ronment is characterized by high technological uncertainty, andR&D efforts are aimed at building absorptive capacity, accumulat-ing knowledge and pursuing technical or scientific breakthroughs(e.g., Sahal, 1981; Dosi, 1982; Pisano, 1988; Cohen and Levinthal,1990; Jiang et al., 2011). As experience is gained and the technol-ogy trajectory is solidified, R&D efforts during the growth stageevolve toward achieving cumulative advances in technical per-formance through improvements within the technological system(Rosenberg, 1982; Hughes, 1983; Christensen, 1992; Murmann andFrenken, 2006). Finally, as the limits to the technology’s perfor-mance approach during the maturity stage, R&D efforts take theform of extending the performance of the technology in a highlyresource constrained environment with compelling substitutes(Utterback, 1994; Henderson, 1995).
How might such an evolutionary process of technologicalchange shape the pattern of collaborative R&D within the industry?Given the sustained intensity of interest surrounding collaborativeR&D, it is easy to overlook the importance of in-house R&D effortsautonomously undertaken by organizations (e.g., Gambardella,1992). Hence, we first consider the relative prevalence of internaland collaborative R&D, and we then elaborate on the changes inthe different types of R&D collaborations over the technology’s lifecycle.7
involving research organizations (universities and dedicated research institutes)as science-based, and those between users and suppliers and between suppliersof complementary technological inputs as technology integration-based, have anintended functional characterization that is again guided by the literature (Hughes,1983; Rosenberg and Nelson, 1994) – but is not the source of categorization.
7 Note that in this study, due to data unavailability, we do not explicitly considerthe firm’s make-or-buy choice with respect to R&D (Pisano, 1990; Cassiman andVeugelers, 2006). Rather, our focus is on understanding how the pattern of collab-orative R&D among the different types of actors evolves over the technology’s lifecycle.
5 search Policy 43 (2014) 555– 569
an(ebealP
itLeaooipdrs
ncap
Hi
RRaiclbpclcePtaSfio
staidaruta
itp
0%
20%
40%
60%
80%
100%
19
Mar
ket S
hare
987 19
DUV lithography equipment Market Share
Minimum
91 19 9
m Feature Siz
5 1999
e (nm) ach ie
2003
eved using DU
2007
UV technol og
04080120160200240280320360400
gy
Min
imum
Fea
ture
Size
(nm
)
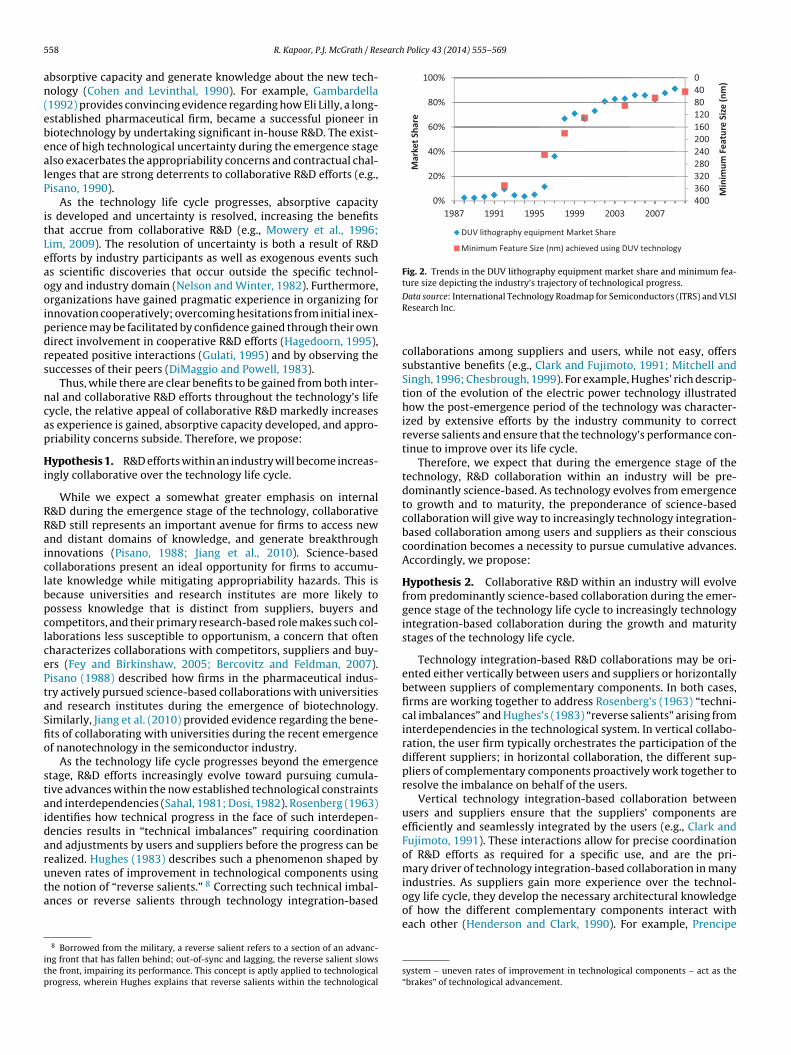
Fig. 2. Trends in the DUV lithography equipment market share and minimum fea-ture size depicting the industry’s trajectory of technological progress.
58 R. Kapoor, P.J. McGrath / Re
bsorptive capacity and generate knowledge about the new tech-ology (Cohen and Levinthal, 1990). For example, Gambardella1992) provides convincing evidence regarding how Eli Lilly, a long-stablished pharmaceutical firm, became a successful pioneer iniotechnology by undertaking significant in-house R&D. The exist-nce of high technological uncertainty during the emergence stagelso exacerbates the appropriability concerns and contractual chal-enges that are strong deterrents to collaborative R&D efforts (e.g.,isano, 1990).
As the technology life cycle progresses, absorptive capacitys developed and uncertainty is resolved, increasing the benefitshat accrue from collaborative R&D (e.g., Mowery et al., 1996;im, 2009). The resolution of uncertainty is both a result of R&Dfforts by industry participants as well as exogenous events suchs scientific discoveries that occur outside the specific technol-gy and industry domain (Nelson and Winter, 1982). Furthermore,rganizations have gained pragmatic experience in organizing fornnovation cooperatively; overcoming hesitations from initial inex-erience may be facilitated by confidence gained through their ownirect involvement in cooperative R&D efforts (Hagedoorn, 1995),epeated positive interactions (Gulati, 1995) and by observing theuccesses of their peers (DiMaggio and Powell, 1983).
Thus, while there are clear benefits to be gained from both inter-al and collaborative R&D efforts throughout the technology’s lifeycle, the relative appeal of collaborative R&D markedly increasess experience is gained, absorptive capacity developed, and appro-riability concerns subside. Therefore, we propose:
ypothesis 1. R&D efforts within an industry will become increas-ngly collaborative over the technology life cycle.
While we expect a somewhat greater emphasis on internal&D during the emergence stage of the technology, collaborative&D still represents an important avenue for firms to access newnd distant domains of knowledge, and generate breakthroughnnovations (Pisano, 1988; Jiang et al., 2010). Science-basedollaborations present an ideal opportunity for firms to accumu-ate knowledge while mitigating appropriability hazards. This isecause universities and research institutes are more likely toossess knowledge that is distinct from suppliers, buyers andompetitors, and their primary research-based role makes such col-aborations less susceptible to opportunism, a concern that oftenharacterizes collaborations with competitors, suppliers and buy-rs (Fey and Birkinshaw, 2005; Bercovitz and Feldman, 2007).isano (1988) described how firms in the pharmaceutical indus-ry actively pursued science-based collaborations with universitiesnd research institutes during the emergence of biotechnology.imilarly, Jiang et al. (2010) provided evidence regarding the bene-ts of collaborating with universities during the recent emergencef nanotechnology in the semiconductor industry.
As the technology life cycle progresses beyond the emergencetage, R&D efforts increasingly evolve toward pursuing cumula-ive advances within the now established technological constraintsnd interdependencies (Sahal, 1981; Dosi, 1982). Rosenberg (1963)dentifies how technical progress in the face of such interdepen-encies results in “technical imbalances” requiring coordinationnd adjustments by users and suppliers before the progress can beealized. Hughes (1983) describes such a phenomenon shaped by
neven rates of improvement in technological components usinghe notion of “reverse salients.” 8 Correcting such technical imbal-nces or reverse salients through technology integration-based8 Borrowed from the military, a reverse salient refers to a section of an advanc-ng front that has fallen behind; out-of-sync and lagging, the reverse salient slowshe front, impairing its performance. This concept is aptly applied to technologicalrogress, wherein Hughes explains that reverse salients within the technological
Data source: International Technology Roadmap for Semiconductors (ITRS) and VLSIResearch Inc.
collaborations among suppliers and users, while not easy, offerssubstantive benefits (e.g., Clark and Fujimoto, 1991; Mitchell andSingh, 1996; Chesbrough, 1999). For example, Hughes’ rich descrip-tion of the evolution of the electric power technology illustratedhow the post-emergence period of the technology was character-ized by extensive efforts by the industry community to correctreverse salients and ensure that the technology’s performance con-tinue to improve over its life cycle.
Therefore, we expect that during the emergence stage of thetechnology, R&D collaboration within an industry will be pre-dominantly science-based. As technology evolves from emergenceto growth and to maturity, the preponderance of science-basedcollaboration will give way to increasingly technology integration-based collaboration among users and suppliers as their consciouscoordination becomes a necessity to pursue cumulative advances.Accordingly, we propose:
Hypothesis 2. Collaborative R&D within an industry will evolvefrom predominantly science-based collaboration during the emer-gence stage of the technology life cycle to increasingly technologyintegration-based collaboration during the growth and maturitystages of the technology life cycle.
Technology integration-based R&D collaborations may be ori-ented either vertically between users and suppliers or horizontallybetween suppliers of complementary components. In both cases,firms are working together to address Rosenberg’s (1963) “techni-cal imbalances” and Hughes’s (1983) “reverse salients” arising frominterdependencies in the technological system. In vertical collabo-ration, the user firm typically orchestrates the participation of thedifferent suppliers; in horizontal collaboration, the different sup-pliers of complementary components proactively work together toresolve the imbalance on behalf of the users.
Vertical technology integration-based collaboration betweenusers and suppliers ensure that the suppliers’ components areefficiently and seamlessly integrated by the users (e.g., Clark andFujimoto, 1991). These interactions allow for precise coordinationof R&D efforts as required for a specific use, and are the pri-mary driver of technology integration-based collaboration in manyindustries. As suppliers gain more experience over the technol-
ogy life cycle, they develop the necessary architectural knowledgeof how the different complementary components interact witheach other (Henderson and Clark, 1990). For example, Prencipesystem – uneven rates of improvement in technological components – act as the“brakes” of technological advancement.

R. Kapoor, P.J. McGrath / Research Policy 43 (2014) 555– 569 559
F ry. Ort
(ratsnc
m(clctdeTalof
Hwubn
bcupe(pp1iootcsr
Underlying the industry’s technological progress are R&D effortsby the different types of actors as illustrated in Fig. 3 (e.g.,Henderson, 1995; Linden et al., 2000; Adner and Kapoor, 2010).
ig. 3. Different sources of innovation in the semiconductor manufacturing industhe industry.
2000), Takeishi (2002) and Lee and Veloso (2008) provide evidenceegarding component suppliers acquiring architectural knowledgebout new technologies in the aerospace and the automotive sec-ors. These authors argue that architectural knowledge allowsuppliers to assume some of the responsibilities underlying tech-ology integration from users (e.g., car manufacturers), and toreate greater value from their efforts.
The rewards for collaborating with other suppliers of comple-entary components toward technology integration are palpable
Mitchell and Singh, 1996; Kapoor, 2013a). The more seamless theomponents are within the focal technology, the fewer the chal-enges for the user in adopting it – which in turn enhances theompetitiveness of the participating firms. Furthermore, once theechnology moves beyond the emergence stage, the prevalence of aominant design and industry standards makes it easier for suppli-rs of complementary components to collaborate with each other.herefore, while collaboration between users and suppliers will be
key driver of technology integration throughout the technologyife cycle, we expect a gradual increase in the relative intensityf collaboration between suppliers of complementary componentsrom the emergence stage to the maturity stage of the technology:
ypothesis 3. Technology integration-based R&D collaborationill evolve from predominantly vertical collaboration betweensers and suppliers to increasingly horizontal collaborationetween suppliers of complementary components over the tech-ology life cycle.
Finally, besides science-based and technology integration-ased collaboration, the industry’s R&D network also compriseso-opetitive collaboration among competitors. The motivationnderlying co-opetitive collaborations may include learning fromartners’ distinct or complementary capabilities and generatingconomic efficiencies by pooling R&D resources with the partnersSakakibara, 1997; Hagedoorn et al., 2000). Such collaborationsrovide an important strategic alternative for firms to managerogress throughout the technology’s evolution (Powell et al.,996; Hagedoorn, 2002). Hence, we do not expect the relative
mportance of co-opetitive collaboration to change over the coursef the technology life cycle. However, given the distinct motivationsf learning and resource pooling, it is possible that the motiva-
ion underlying co-opetitive collaboration may evolve over theourse of the technology life cycle. We explore this pattern throughupplementary network-based analysis after presenting our mainesults.ganization names listed in parentheses are only representative of organizations in
3. Collaborative R&D in the semiconductor manufacturingindustry
We explore the interplay between technology evolution andthe pattern of R&D collaboration in the context of the semicon-ductor manufacturing industry from 1990 to 2010. The industry’seconomic prominence, high R&D intensity, and the presence ofa well-defined technological trajectory combine to present anideal setting in which to examine the pattern of collaborativeR&D over the technology life cycle. Technological progress inthis industry is one of the most robust in the modern economy,with semiconductor manufacturers persistently reducing thesize of the circuit and doubling the number of transistors in asemiconductor chip approximately every two years (Moore, 1995).From 1990 to 2010, the smallest circuit dimension (also referredto as minimum feature size) that semiconductor manufacturerscould print decreased from 500 nanometers (nm) to 45 nm. Thiswas enabled by the emergence of Deep Ultraviolet (DUV) lithog-raphy technology for semiconductor manufacturing in the late1980s as a superior alternative to the existing I-line technology,and its subsequent evolution over the next two decades (Iansiti,1998; Martin and Salomon, 2003; Kapoor and Adner, 2007). Fig. 2plots the trend in the annual market share of DUV lithographyequipment and the minimum feature size achieved by semicon-ductor manufacturers through using DUV technology.9 While DUVlithography equipment was introduced in 1988, the technologywas first implemented in production in 1992 to manufacturesemiconductors with a minimum feature size of 350 nm. It wasonly in the timeframe of 1996 that the technology, now with aminimum feature size of 250 nm, started to gain market share.Since then, DUV technology has achieved rapid market growthand has continued to maintain its industry dominance. Morerecently, the industry has been transitioning from a matured DUVtechnology to Extreme Ultraviolet (EUV) technology that promisesa minimum feature size smaller than 20 nm (Williamson, 2000; Lin,2006). The EUV manufacturing equipment was introduced in 2010.
9 The information on minimum feature size using DUV technology was obtainedfrom regularly published industry technology roadmaps by ITRS (www.itrs.net). Theinformation on DUV lithography equipment market share data was obtained fromVLSI Research Inc., a prominent industry consulting firm.

5 search
CoausastshibccieisrmcLS
3
ciesswlpTaStcobeh
epsotct
Ik
niC(oads
d
60 R. Kapoor, P.J. McGrath / Re
omplementary technological inputs from upstream suppliersf manufacturing equipment, materials and electronic designutomation (EDA) software are integrated by semiconductor man-facturers into their production processes. Among the equipmentuppliers are suppliers of lithography alignment equipment, as wells suppliers of metrology and processing equipment. The materialuppliers include resist and mask suppliers. An attractive feature ofhe industry for the purpose of our study is that, due to the diver-ity and complexity of technological inputs, suppliers tend to beighly specialized (i.e., they manufacture a specific technological
nput such as the resist or the mask). This clear separation of firmoundaries with respect to technological inputs allowed us to makelear inferences regarding horizontal technology integration-basedollaboration between suppliers of complementary technologicalnputs. In addition to suppliers and semiconductor manufactur-rs, R&D organizations are another important source of innovationn the industry. R&D organizations encompass both universities,uch as University of California (Berkeley), as well as dedicatedesearch institutes such as IMEC in Belgium. Finally, semiconductoranufacturers – in spite of their status as competitors – actually
ooperate with each other through co-development alliances (e.g.,eiblein and Madsen, 2009) or through research consortia such asEMATECH in the United States and SELETE in Japan.
.1. Data
To investigate the pattern of collaborative R&D in the semi-onductor industry, we assembled a novel dataset based onnformation in technical articles presented at industry confer-nces sponsored by SPIE, the primary professional association foremiconductor manufacturing.10 Between 1990 and 2010, SPIEponsored 147 global conferences in which a total of 12,834 articlesere included. The technical conferences organized by SPIE have
ong served as an important avenue for actors in the industry toresent outcomes of their technology development initiatives.hese conferences are keenly followed by industry participantsnd are often discussed at length in trade journals (such as Solidtate Technology and EE Times) and the business press. Moreover,he technical articles that are presented are typically updates onurrent projects; hence, this data source provides a contemporane-us account of industry’s R&D efforts. The strong correspondenceetween SPIE conference data and the firms’ collaborative R&Dfforts was also confirmed to us by three industry veterans, whoave also served as editors of the SPIE conference proceedings.11
This dataset affords significant, unusual advantages for ourxploration of the interplay between technology evolution and theattern of R&D efforts within an industry. To start, we are able toimultaneously identify both internal and collaborative R&D effortsver the DUV technology life cycle. We use the authors’ affilia-
ion information on an SPIE article to identify whether an articleorresponds to internal or collaborative R&D, and to identify theype of collaboration.12 While scholars have regularly used publicly10 SPIE is a defunct acronym that originally stood for the Society of Photographicnstrumentation Engineers upon the group’s formation in 1955. The society is nownown as SPIE.11 There are a number of other technical conferences that are attended by engi-eers and scientists in the semiconductor industry. These conferences vary widely
n their focus. Some are very broad in their scope. For example, the Internationalonference on Electron, Ion and Photon Beam Technology and NanofabricationEIPBM) addresses a variety of technologies and applications (ranging from biol-gy to solar energy) associated with the three primary energy beams (electron, ionnd photon). Much more targeted are the technical conferences that focus on theomain of IC Design and semiconductor systems, which are dominated by IEEE. Theemiconductor manufacturing domain is dominated by the SPIE conference.12 We note that several studies in the biopharmaceutical industry have alsorawn on information on authors’ affiliations in articles published in scientific
Policy 43 (2014) 555– 569
reported alliance announcements (or databases such as SDC Plat-inum or MERIT-CATI that are created using these announcements)to identify pattern of collaborative R&D (e.g., Hagedoorn, 1995;Powell et al., 1996; Ahuja, 2000), this approach is particularly prob-lematic for our analysis for two key reasons. First, a large proportionof R&D collaboration between firms as well as between firms anduniversities is not subject to public announcements (Hagedoornet al., 2000). Second, public announcements seldom include infor-mation on the termination of alliances. Thus, while numerousscholars have skillfully leveraged alliance databases in their studiesof R&D collaboration, the SPIE data offers us industry-wide com-prehensiveness, and a contemporaneous account of internal andcollaborative R&D efforts that these sources cannot provide.
Given the newness of the SPIE dataset, we took care to ensure itsvalidity to answer our research question. We began by addressingthe industry representativeness of the firms themselves, and con-firmed through interviews with industry experts and throughindustry directories that all semiconductor manufacturers, theirsuppliers and research organizations pursuing R&D in lithogra-phy technology participate in SPIE conferences. We further verifiedwith the experts that the technical articles presented at the SPIEconferences properly portrayed firms’ internal and collaborativeR&D activities. Although all SPIE submissions undergo a peer reviewprocess, rejections occur only infrequently (as confirmed to us ininterviews with SPIE conference proceedings editors) and wouldresult from clear violations of basic requirements, such as technicalsoundness, originality of research content, and being of a non-commercial nature.13 To this end, it is also noteworthy that our SPIEdataset is unhindered by a “success bias” as it includes both arti-cles that were presented and those that were displayed in the lessadvanced poster sessions at each SPIE conference included in ourtimeframe. As an important check regarding the appropriatenessof SPIE conference articles as meaningful indicators of firms’ R&Defforts, we compared, on an annual basis for several of the leadingmanufacturers and suppliers, the count of articles each firm pre-sented with both their R&D expenditures, and also the number oftheir successful U.S. patent applications. Although these indicatorsare known to be noisy due to time lags and firm-level idiosyncrasies,we still found a very high correlation between them. For exam-ple, the correlation between the count of SPIE articles and R&Dexpenditures between 1990 and 2008 is 0.86 for Intel, a leadingsemiconductor manufacturer and is 0.94 for KLA-Tencor, a lead-ing supplier of semiconductor manufacturing equipment. Similarly,the correlation between the count of SPIE articles and successfulpatent applications between 1990 and 2008 is 0.65 for Intel andis 0.80 for KLA-Tencor.14 Lastly, as a final validity check regardingthe use of the data to study industry’s collaborative R&D efforts,we compared the inter-organizational collaborations indicated bythe affiliation of authors of SPIE conference articles with the alliancerelationships captured by SDC Platinum for three key industry play-ers: ASML, Intel, and KLA-Tencor. For each of these firms, all of the
SDC reported collaborations were captured by the SPIE conferencedataset and, perhaps even more importantly, these collaborationswere only a small subset of the collaborations identified in thejournals to identify biopharmaceutical firms’ R&D collaborations (e.g., Cockburn andHenderson, 1998; Gittelman and Kogut, 2003). In contrast to the scientists in the bio-pharmaceutical industry, engineers employed by the semiconductor manufacturersand suppliers frequently present at SPIE conferences but only seldom publish in thescientific journals.
13 The details regarding SPIE’s manuscript polices and review process are availableat http://spie.org/x14099.xml (accessed 12.04.13).
14 The somewhat lower correlation for Intel can be explained by the fact that SPIEconference articles represent Intel’s R&D efforts in semiconductor manufacturingwhereas patents represent Intel’s R&D efforts in both semiconductor manufacturingand Integrated Circuit (IC) design.
R. Kapoor, P.J. McGrath / Research Policy 43 (2014) 555– 569 561
UV tec
So
tast6rbSs
eaedDUs(biooptsrt
3
3
r1zHlt
pua
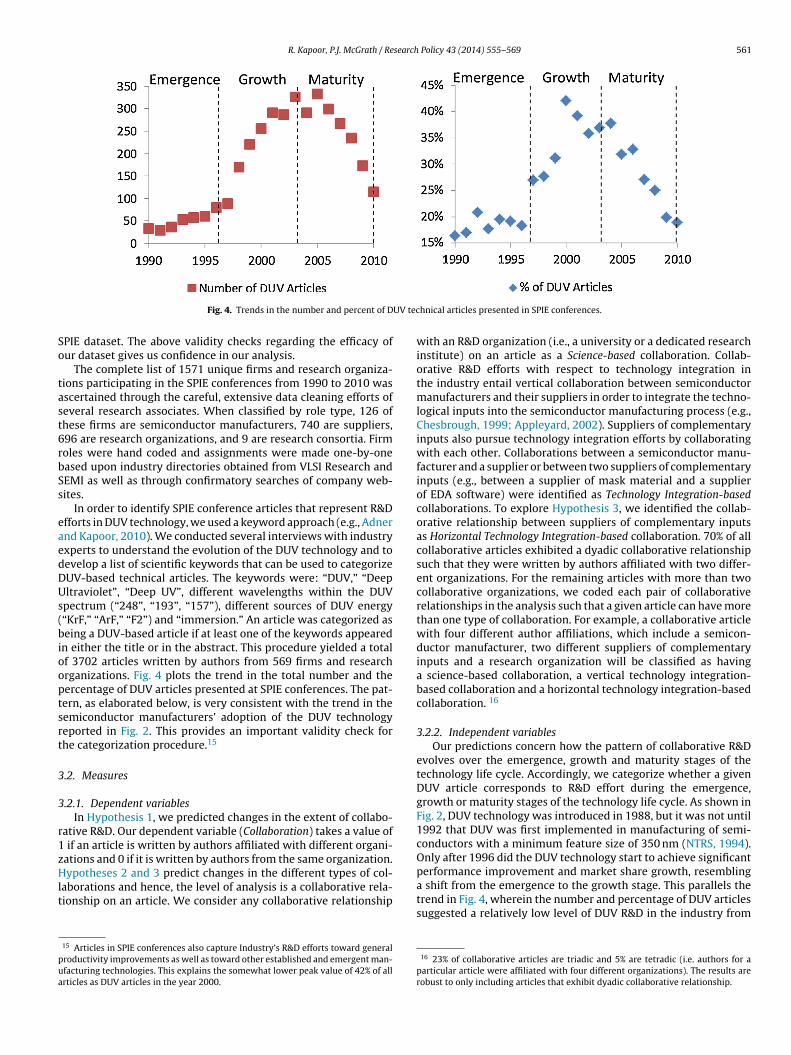
Fig. 4. Trends in the number and percent of D
PIE dataset. The above validity checks regarding the efficacy ofur dataset gives us confidence in our analysis.
The complete list of 1571 unique firms and research organiza-ions participating in the SPIE conferences from 1990 to 2010 wasscertained through the careful, extensive data cleaning efforts ofeveral research associates. When classified by role type, 126 ofhese firms are semiconductor manufacturers, 740 are suppliers,96 are research organizations, and 9 are research consortia. Firmoles were hand coded and assignments were made one-by-oneased upon industry directories obtained from VLSI Research andEMI as well as through confirmatory searches of company web-ites.
In order to identify SPIE conference articles that represent R&Dfforts in DUV technology, we used a keyword approach (e.g., Adnernd Kapoor, 2010). We conducted several interviews with industryxperts to understand the evolution of the DUV technology and toevelop a list of scientific keywords that can be used to categorizeUV-based technical articles. The keywords were: “DUV,” “Deepltraviolet”, “Deep UV”, different wavelengths within the DUV
pectrum (“248”, “193”, “157”), different sources of DUV energy“KrF,” “ArF,” “F2”) and “immersion.” An article was categorized aseing a DUV-based article if at least one of the keywords appeared
n either the title or in the abstract. This procedure yielded a totalf 3702 articles written by authors from 569 firms and researchrganizations. Fig. 4 plots the trend in the total number and theercentage of DUV articles presented at SPIE conferences. The pat-ern, as elaborated below, is very consistent with the trend in theemiconductor manufacturers’ adoption of the DUV technologyeported in Fig. 2. This provides an important validity check forhe categorization procedure.15
.2. Measures
.2.1. Dependent variablesIn Hypothesis 1, we predicted changes in the extent of collabo-
ative R&D. Our dependent variable (Collaboration) takes a value of if an article is written by authors affiliated with different organi-ations and 0 if it is written by authors from the same organization.
ypotheses 2 and 3 predict changes in the different types of col-aborations and hence, the level of analysis is a collaborative rela-ionship on an article. We consider any collaborative relationship
15 Articles in SPIE conferences also capture Industry’s R&D efforts toward generalroductivity improvements as well as toward other established and emergent man-facturing technologies. This explains the somewhat lower peak value of 42% of allrticles as DUV articles in the year 2000.
hnical articles presented in SPIE conferences.
with an R&D organization (i.e., a university or a dedicated researchinstitute) on an article as a Science-based collaboration. Collab-orative R&D efforts with respect to technology integration inthe industry entail vertical collaboration between semiconductormanufacturers and their suppliers in order to integrate the techno-logical inputs into the semiconductor manufacturing process (e.g.,Chesbrough, 1999; Appleyard, 2002). Suppliers of complementaryinputs also pursue technology integration efforts by collaboratingwith each other. Collaborations between a semiconductor manu-facturer and a supplier or between two suppliers of complementaryinputs (e.g., between a supplier of mask material and a supplierof EDA software) were identified as Technology Integration-basedcollaborations. To explore Hypothesis 3, we identified the collab-orative relationship between suppliers of complementary inputsas Horizontal Technology Integration-based collaboration. 70% of allcollaborative articles exhibited a dyadic collaborative relationshipsuch that they were written by authors affiliated with two differ-ent organizations. For the remaining articles with more than twocollaborative organizations, we coded each pair of collaborativerelationships in the analysis such that a given article can have morethan one type of collaboration. For example, a collaborative articlewith four different author affiliations, which include a semicon-ductor manufacturer, two different suppliers of complementaryinputs and a research organization will be classified as havinga science-based collaboration, a vertical technology integration-based collaboration and a horizontal technology integration-basedcollaboration. 16
3.2.2. Independent variablesOur predictions concern how the pattern of collaborative R&D
evolves over the emergence, growth and maturity stages of thetechnology life cycle. Accordingly, we categorize whether a givenDUV article corresponds to R&D effort during the emergence,growth or maturity stages of the technology life cycle. As shown inFig. 2, DUV technology was introduced in 1988, but it was not until1992 that DUV was first implemented in manufacturing of semi-conductors with a minimum feature size of 350 nm (NTRS, 1994).Only after 1996 did the DUV technology start to achieve significantperformance improvement and market share growth, resembling
a shift from the emergence to the growth stage. This parallels thetrend in Fig. 4, wherein the number and percentage of DUV articlessuggested a relatively low level of DUV R&D in the industry from16 23% of collaborative articles are triadic and 5% are tetradic (i.e. authors for aparticular article were affiliated with four different organizations). The results arerobust to only including articles that exhibit dyadic collaborative relationship.

562 R. Kapoor, P.J. McGrath / Research Policy 43 (2014) 555– 569
Table 1Variables and their descriptions.
Variables Description
Dependent variablesCollaboration Indicates whether the article was written by authors from different organizations (=1) or the same
organization (=0). Used with Hypothesis 1.Science-based collaboration Set equal to 1 when the collaboration involves an R&D organization. Used with Hypothesis 2.Technology integration-based collaboration Set equal to 1 when the collaboration is between a semiconductor manufacturer and a supplier or
between two suppliers of complementary inputs. Used with Hypothesis 2.Horizontal technology integration-based collaboration Set equal to 1 when the collaboration is between two suppliers of complementary inputs. Used with
Hypothesis 3.Independent variablesEmergence stage Set equal to 1 if the article was presented in a conference during the emergence stage of the DUV
technology life cycle (1990–1996)Growth stage Set equal to 1 if the article was presented in a conference during the growth stage of the DUV technology
life cycle (1997–2003)Maturity stage Set equal to 1 if the article was presented in a conference during the maturity stage of the DUV technology
life cycle (2004–2010)Control variablesNumber of R&D organizations Number of R&D organizations active in DUV technology in a given yearNumber of suppliers Number of suppliers active in DUV technology in a given yearNumber of manufacturers Number of semiconductor manufacturers active in DUV technology in a given year
any o any o
1sRTmdgoEpMime
3
atTOatUwEaor
1e
nfiiDt
ebT
by authors from the same organization, these internally orientedR&D efforts still represent more than half of all articles. Hence,while firms are increasingly pursuing collaborative R&D, they con-tinue to invest in their internal R&D efforts. Such efforts not only
Table 2Trends in the extent of collaboration on DUV articles.
% of articles that are collaborative (total articles)
Emergence stage Growth stage Maturity stage
Industry 33% (352) 43% (1637) 48% (1713)Manufacturers 32% (192) 50% (762) 59% (780)
US affiliation Set equal to 1 whenEurope affiliation Set equal to 1 when
990 to 1996 followed by a period of rapid growth. Hence, we con-ider the articles presented from 1990 to 1996 as corresponding to&D efforts during the Emergence Stage of the DUV technology.17
he relative stabilization of technology’s performance improve-ent as measured by minimum feature size in combination with a
ecreasing percentage of DUV technology articles after 2004 sug-ests an onset of the DUV technology’s maturity and a reorientationf the industry’s R&D efforts toward the new emerging technology,UV. We therefore categorized articles presented during the 7-yeareriod from 2004 to 2010 as corresponding to efforts during theaturity Stage of the DUV technology life cycle.18 Articles presented
n the intermediate period (1997–2003) between emergence andaturity stages were considered as evidence of industry’s R&D
fforts during the Growth Stage.19
.2.3. Control variablesWe included a number of industry- and firm-level control vari-
bles. The observed pattern of collaboration may be influenced byhe collaboration opportunity within the industry at a given period.o account for this possibility, we control for the Number of R&Drganizations, Number of Suppliers, and Number of Manufacturersctive in the DUV technology in a given year. We also control forhe geographic location of each article’s authoring organizations.S Affiliation takes a value of 1 if any of the authors is affiliatedith an organization headquartered in the United States; likewise,
urope Affiliation is set to 1 if any of the authors is affiliated with
n organization headquartered in Europe. Given the high densityf manufacturers, suppliers, and research organization in theseegions, we expect that organizations located in the US and Europe17 Ideally, we would have preferred to also include DUV articles presented before990. However, our dataset was limited by the availability of information for thearlier conferences in the SPIE digital library.18 We note that while we characterize this period as the maturity stage, we doot imply that maturity corresponds to technology’s stagnation. We expect andnd that the maturity stage is indeed characterized by significant R&D efforts by
ndustry participants which have enabled them to extend the performance of theUV technology. In that respect, the maturity stage could perhaps be better referred
o as the “post-growth” stage.19 While we identified three symmetric 7-year SPIE conference windows to studymergence, growth and maturity stages, we explored the robustness of our findingsy first shrinking and then expanding each of the temporal windows by two years.he results of these robustness checks were very similar to our reported findings.
f the organizations associated with the observation are headquartered in the USf the organizations associated with the observation are headquartered in Europe
to have a greater propensity to collaborate. Table 1 provides a briefsummary of the variables using in the analysis.
3.3. Descriptive trends
Table 2 provides the trend in the percentage of collaborativearticles during the emergence, growth and maturity stages of theDUV technology. During the emergence stage, 33% of all articleswere a result of collaborative efforts between two or more orga-nizations. This ratio increased to 43% during the growth stageand to 48% during the maturity stage. Hence, the trend providessome suggestive evidence that R&D efforts within the semicon-ductor manufacturing industry become increasingly collaborativeover the DUV technology life cycle (Hypothesis 1). Note that whilewe observe a decreasing trend in the proportion of articles written
Suppliers 43% (134) 56% (882) 58% (1077)
Table 3Trends in the type of collaboration on DUV articles.
% of collaborative articlesa
Emergencestage
Growthstage
Maturitystage
Science 64% 41% 39%Technology integration 28% 51% 55%Vertical technology integration 27% 42% 41%Horizontal technology integration 2% 15% 20%Co-opetitive 21% 21% 17%
a Note that the totals for the respective collaboration categories within a stage arein excess of what may be expected. This is because of articles that had more than twocollaborating organizations and that may represent different types of collaborations(e.g., Science and Technology Integration) within the same article.

R. Kapoor, P.J. McGrath / Research Policy 43 (2014) 555– 569 563
Table 4Descriptive statistics and correlations for (a) all DUV articles and (b) for DUV collaborative articles.
(a)
Mean SD 1 2 3 4 5 6 7
1 Collaboration 0.46 0.502 Growth stage 0.44 0.50 −0.013 Maturity stage 0.46 0.50 0.06* −0.83*
4 No. R&D org. 35.21 9.33 0.07* 0.08* 0.37*
5 No. suppliers 61.57 18.48 0.07* 0.16* 0.27* 0.86*
6 No. manufacturers 27.24 6.01 0.08* 0.28* 0.16* 0.85* 0.87*
7 US affiliation 0.49 0.50 0.31* 0.07* −0.08* −0.04* −0.02 −0.028 Europe affiliation 0.36 0.48 0.13* −0.08* 0.10* 0.05* 0.04* 0.03* −0.25*
(b)
Mean SD 1 2 3 4 5 6 7 8 9
1 Science 0.41 0.492 Technology integration 0.52 0.50 −0.55*
3 Horizontal technology integration 0.16 0.37 −0.22* 0.42*
4 Growth stage 0.44 0.50 −0.01 −0.01 −0.035 Maturity stage 0.50 0.50 −0.05* 0.06* 0.08* −0.88*
6 No. R&D org. 35.91 8.38 −0.07* 0.11* 0.06* 0.03 0.30*
7 No. suppliers 62.90 17.00 −0.11* 0.13* 0.08* 0.14* 0.16* 0.83*
8 No. manufacturers 27.72 5.41 −0.10* 0.12* 0.08* 0.26* 0.04 0.81* 0.85*
9 US affiliation 0.66 0.47 0.03 0.10* 0.01 0.06* −0.12* −0.10* −0.08* −0.07*
10 Europe affiliation 0.42 0.49 0.09* 0.08* 0.12* −0.09* 0.10* 0.00 −0.01 −0.00 −0.11*
((
ht1pmfotlfi
TL
M
a) *p < 0.05, N = 3702 articles.b) *p < 0.05, N = 1717 articles.
elp firms develop knowledge but also build absorptive capacityo learn from their collaborative R&D efforts (Cohen and Levinthal,990; Mowery et al., 1996). We also explored the differences in theattern of internal and collaborative R&D between semiconductorsanufacturers and suppliers. Of the articles written by authors
rom semiconductor manufacturing firms, the proportion of collab-rative articles increased from 32% in the emergence stage to 50% inhe growth stage to 59% in the maturity stage. The proportion of col-
aborative articles written by authors from supplier firms increasedrom 43% in the emergence stage to 56% in the growth stage to 58%n the maturity stage. Hence, the evolution in the relative emphasisable 5ogistic regression results for the effect of DUV technology life cycle on the extent and pa
(1) (2)
Dependent variable
Collaboration (H1) Science-basedcollaboration (H2)
Growth stage 0.447** −1.088***
(0.218) (0.317)
Maturity stage 0.633*** −1.479***
(0.227) (0.327)
# R&D organizations −0.005 0.056***
(0.010) (0.014)
# Suppliers −0.002 −0.015**
(0.005) (0.007)
# Manufacturers 0.024 −0.039*
(0.015) (0.022)
US affiliation 1.756*** 0.002
(0.104) (0.129)
Europe affiliation 1.519*** 0.530***
(0.111) (0.128)
Constant −2.677*** 0.786**
(0.227) (0.331)
Log likelihood −2050.62 −1001.16
Chi-square 868.96*** 242.85***
Articles 3604 1652
odels 1–3 include manufacturer fixed effects. Model 4 includes fixed effects for the typea The omitted category is the emergence stage.* Significant at 10%.
** Significant at 5%.*** Significant at 1%
toward collaborative R&D seems to be more pronounced for semi-conductor manufacturers than for suppliers.
Beyond the observed trend of increasing collaboration, wealso observed changes in the pattern of collaboration. Table 3provides a distribution of the different types of collaborationsduring the emergence, growth and maturity stages of the DUV tech-nology. Science-based collaborations dominate the collaborativeR&D efforts in the industry during the emergence stage of the tech-
nology, with 64% of all collaborative articles on DUV technologyinvolving R&D organizations. As argued in Hypothesis 2, the distri-bution of collaboration shifts from predominantly science-basedttern of R&D collaboration.a
(3) (4)
Technology integration-basedcollaboration (H2)
Horizontal technologyintegration-based collaboration(H3)
0.765** 2.398***
(0.327) (0.855)1.014*** 2.767***
(0.335) (0.852)−0.020 −0.043**
(0.014) (0.022)0.015** 0.001(0.007) (0.011)0.015 0.022(0.022) (0.035)0.418*** 0.090(0.127) (0.191)0.395*** 0.019(0.126) (0.192)−2.042*** −3.981***
(0.346) (0.894)−1036.24 −423.22185.56*** 259.65***
1629 891
of supplier. Standard errors in parentheses.

564 R. Kapoor, P.J. McGrath / Research Policy 43 (2014) 555– 569
co-op
ibmc5lt
Fig. 5. Semiconductor manufacturers’
n the emergence stage to increasingly technology integration-ased between manufacturers and suppliers during the growth andaturity stages. The proportion of technology integration-based
ollaborations increased from 28% during the emergence stage to5% during the maturity stage. Note that the science-based col-
aborations still constitute about 39% of all collaborations withinhe maturity stage, suggesting the continuing important role of
etitive collaboration network for DUV.
universities and research institutes even during the later stages ofthe technology life cycle (cf. Lim, 2009).
As the technology evolved from the emergence stage to the
maturity stage, we also find that the nature of technology inte-gration efforts evolved from predominantly vertical collaborationbetween manufacturers and suppliers to also include horizontalcollaboration between suppliers of complementary technological
search
ildol2ic
3
mctornRotoivf
dMTbdfimafDci3wmttcei(
bcaaobddsHc
aptosfi
R. Kapoor, P.J. McGrath / Re
nputs (Hypothesis 3). The proportion of articles involving such col-aboration increased from 2% during the emergence stage to 20%uring the maturity stage. Finally, we also explored the proportionf collaborative articles between competitors.20 Co-opetitive col-aborations exhibit a fairly stable pattern across the three stages (at1%, 21%, and 17% of all collaborative articles for each period), which
s suggestive of their importance throughout the technology’s lifeycle.
.4. Regression analysis
Since our dependent variables are dichotomous, we use Logitodels for our analysis. Table 4 shows the descriptive statistics and
orrelations for the variables and Table 5 reports the results fromhe regression analysis. The high correlation between the numberf R&D organizations, suppliers and manufacturers is expected andeflective of the trend for the number of DUV articles. Greater theumber of DUV articles in a given year, greater is the number of&D organizations, suppliers and manufacturers. Different typesf collaborations are likely influenced by the number of differentypes of organizations rather than the aggregate number of allrganizations. Hence, we use the three different control variablesn our analysis. As a test of robustness, we substituted the threeariables with a single aggregate number of all organizations andound the results to be qualitatively similar.
Model 1 is used to test Hypothesis 1 with Collaboration as theependent variable and is estimated using data on all DUV articles.odels 2–4 are used to test Hypotheses 2 and 3 with Science-based,
echnology Integration-based and Horizontal Technology Integration-ased collaboration as dependent variables and are estimated usingata on DUV articles that are collaborative. Semiconductor manu-acturers are the main drivers of R&D efforts in the semiconductorndustry, and there is significant heterogeneity among the different
anufacturers’ R&D strategies. For example, Chesbrough (2003)nd Brown and Linden (2009) discuss how semiconductor manu-acturers such as IBM, Intel, Texas Instruments and Advanced Microevices differed in the extent to which they pursued internal andollaborative research. In order to account for such differences, wenclude manufacturer fixed effects in Models 1–3. In Hypothesis, we argue that technology integration-based R&D collaborationsill evolve from predominantly vertical collaboration betweenanufacturers and suppliers to increasingly horizontal collabora-
ion between suppliers of complementary inputs. This prediction isested in Model 4 using data on only technology integration-basedollaborations. Since different types of suppliers may have differ-
nt opportunities to collaborate with complementary suppliers, wenclude fixed effects for the different types of suppliers in this modele.g., EDA suppliers, mask suppliers, resist suppliers, etc.).2120 These include collaborations between semiconductor manufacturers oretween suppliers of the same technological input (e.g., resist). Given that researchonsortia are by themselves co-opetitive organizational entities, we also considerrticles written solely by authors affiliated with research consortia or by authorsffiliated with semiconductor manufacturer and research consortia as being co-petitive collaboration efforts among semiconductor manufacturers. We note thatecause of the high concentration of the different supplier segments (typically twoominant firms in each supplier category) and greater rivalry (due to lower productifferentiation), co-opetitive R&D collaborations between suppliers were relativelycarce and included less than 5% of all co-opetitive collaborations in the dataset.ence, we do not report suppliers’ and semiconductor manufacturers’ co-opetitiveollaborations separately.21 Ideally, we would have preferred to also include supplier fixed effects in ournalysis. However, we faced two challenges. First, by definition, supplier fixed effectserfectly explain technology integration-based collaboration. Hence, we are unableo use it for testing Hypothesis 2. Second, our sample of 891 articles with technol-gy integration-based collaboration for testing Hypothesis 3 included 210 differentuppliers, thus significantly reducing the degrees of freedom and making it very dif-cult to achieve precise estimates. Note also that we cannot use manufacturer fixed
Policy 43 (2014) 555– 569 565
Consistent with the descriptive trend, the estimated coefficientsfor the Growth Stage and Maturity Stage are each positive and sig-nificant in Model 1. Translating the coefficients to odds ratio, theestimates correspond to an article being 1.56 times more likely to becollaborative (versus internal) in the growth stage than in the emer-gence stage, and 1.88 times more likely to be collaborative in thematurity stage than in the emergence stage. The difference betweenthe coefficients is also significant as tested using the Wald test(p = 0.038). Hence, we find strong statistical support for Hypothesis1 that the likelihood of collaborative R&D increases over the lifecycle such that it is lowest during the emergence stage and high-est during the maturity stage. The coefficients for US Affiliation, andEurope Affiliation were each positive and significant suggesting thatfirms within these geographical clusters are more likely to pursueR&D collaboration.
In estimating the life cycle dynamics with respect toscience-based and technology integration-based collaborations,the coefficients for Growth Stage and Maturity Stage are nega-tive and significant for science-based collaboration and they arepositive and significant for technology integration-based collabo-ration. The difference between the coefficients is also significant(p = 0.002; p = 0.043). Specifically, the science-based collaborationmodel (Model 2) suggests that the odds of a collaboration beingscience-based decrease by a factor of 0.34 in the growth stageversus the emergence stage, and decrease by a factor of 0.23 inthe maturity stage versus the emergence stage. The estimatesfrom technology integration-based model (Model 3) suggestthat collaboration is 2.15 times more likely to be a technologyintegration-based collaboration in the growth stage than in theemergence stage, and is 2.76 times more likely to be a technol-ogy integration-based collaboration in the maturity stage than inthe emergence stage. The findings from Models 2 and 3 jointlysupport Hypothesis 2 that the collaborative R&D efforts evolvefrom predominantly science-based during the emergence stageto increasingly technology integration-based during the growthand maturity stages of the technology life cycle. The estimatesfor the control variables were as expected. The likelihood ofscience-based collaboration increases with the number of R&Dorganizations. The likelihood of technology integration-based col-laboration increases with the number of suppliers Given that, onaverage, suppliers and manufacturers tend to have a lower countfor science-based collaboration articles, the likelihood of science-based collaboration decreases with the number of suppliers andmanufacturers. The effect of US and Europe affiliation is positive butthe coefficient for US affiliation is insignificant for science-basedcollaboration.
In Model 4, the coefficients for Growth Stage and Maturity Stageare positive and significant. The difference between the coefficientsis also significant (p = 0.06). The estimates suggest that a technologyintegration-based collaboration is 11 times more likely to be of ahorizontal type involving suppliers of complementary inputs in thegrowth stage than in the emergence stage, and is 15.91 times morelikely to be of a horizontal type in the maturity stage than in theemergence stage. These results regarding the increasing prevalenceof horizontal technology integration-based collaboration betweensuppliers of complementary inputs are dramatic, but as expected,in Hypothesis 3.
3.5. Evolution of co-opetitive collaboration
In contrast to science-based and technology integration-based collaborations and as reported in Table 3, co-opetitive
effects in Model 4 as they perfectly explain vertical technology integration-basedcollaboration.

5 search
ctcter1ploasoaaMlricttfocillrta(p
metattulkekecnsciOim
wFeDdioc1io
66 R. Kapoor, P.J. McGrath / Re
ollaborations exhibited a relatively stable trend throughouthe DUV technology’s life cycle. This observed persistence ofo-opetitive collaborations, while emphasizing their importanceoward industry’s technological progress, potentially masks thevolutionary shift in the different motivations of learning andesource pooling that underlie such collaborations (Sakakibara,997; Hagedoorn et al., 2000). For example, firms in theharmaceutical industry have extensively pursued co-opetitive
earning-based collaborations during the emergence of biotechnol-gy (e.g., Powell et al., 1996; Baum et al., 2000). As firms learnnd accumulate knowledge, they may pool similar resources tohare costs, avoiding duplicate investments and achieve economiesf scale in R&D. Indeed, the great leaps in performance benefitsttained early in the technology’s evolution inescapably contract,nd achieving even minimal progress requires ever-greater efforts.oreover, as competitors continue to gain experience during the
ife cycle’s evolution, any initial heterogeneity in their capabilitieseduces. The increasing similarity amongst competitors’ capabil-ty stocks further boosts the efficiency of pooling resources, as bothompetitors are then positioned to immediately and equitably con-ribute to the collaboration (Sakakibara, 1997). Hence, it is likelyhat the motivation underlying co-opetitive collaboration evolvesrom a learning orientation to an increasingly resource poolingrientation over the course of the technology life cycle. A pre-ise exploration of such a pattern would ideally require detailednformation through a survey instrument about the nature of col-aboration between firms over the course of the DUV technologyife cycle (cf. Sakakibara, 1997). This was beyond the scope of theesearch project. Instead, we leverage our collaboration dataseto identify the structural properties of the co-opetitive network,nd we draw upon the literature on inter-organizational networksAhuja, 2000; Powell et al., 1996, 2005; Uzzi, 1997) to offer somereliminary insights.
A fundamental distinction in the networks literature has beenade between “open” and “closed” networks (Ahuja, 2000; Walker
t al., 1997). An extreme example of an open network is onehat is highly centralized, oftentimes referred to as a star or hub-nd-spoke structure (Wasserman and Faust, 1994). In this case,he central node is the quintessential broker, collecting informa-ion and accumulating knowledge from the peripheral, otherwisenconnected participants. The central player is well positioned to
earn and innovate, since its position allows it to gather diversenowledge; the peripheral players, however, also stand to ben-fit by their indirect access to these multitudinous sources ofnowledge while maintaining only one direct tie to the center. Forxample, Powell et al.’s (1996, 2005) networks of learning are wellharacterized by these centralized structures. In contrast, closedetworks, which are decentralized and have densely connectedtructures, provide a platform for the exchange and sharing ofomplex and valued resources that is facilitated through the partic-pants’ direct ties (e.g. Coleman, 1988; Hansen, 1999; Uzzi, 1996).f course, such network structures come with the potential learn-
ng disadvantages of receiving redundant information in return andaintaining additional ties.Given that co-opetitive collaboration among suppliers was rare,
e focused on only semiconductor manufacturers for this analysis.ig. 5 presents network graphs of the semiconductor manufactur-rs’ co-opetitive R&D network for each of the three stages of theUV technology. Each node in the network represents a semicon-uctor manufacturer or research consortium. Every line, or “tie,”
ndicates the presence of a collaborative relationship between tworganizations. During the emergence stage, the network is highly
entralized. IBM, a pioneer in the DUV technology (Holmes et al.,997), is the core hub at the center of this star-shaped network. Dur-ng the growth stage, the network becomes less centralized as otherrganizations encroach on IBM’s former dominance of the network
Policy 43 (2014) 555– 569
core. Taking a more central role are the manufacturers Motorolaand Intel, as well as the industry consortium SEMATECH, whichwas established to facilitate the pooling of semiconductor manu-facturers’ resources. Finally, during the maturity stage, the networkbecomes significantly decentralized with a much broader “core,”consequently suggesting even greater resource pooling amongsemiconductor manufacturers toward DUV technology develop-ment. This evolution of the co-opetitive network offers somepreliminary evidence regarding the evolutionary shift in the moti-vating driver of co-opetitive collaboration between semiconductormanufacturers from learning in the emergence stage to increas-ingly resource pooling in the growth and maturity stages of theDUV technology life cycle.
4. Discussion and conclusions
The study offers a rich characterization of how the patternof R&D efforts among the industry community evolves over thetechnology life cycle. It provides an explicit consideration of thediversity of actors including research organizations, suppliers andusers that contribute to the technological progress, and illustrateshow the industry’s locus of innovation interacts with the differentevolutionary stages of the technology. In doing so, it unpacks thecomplexities that underlie a seemingly smooth S-shaped trajec-tory of technological progress and shows that technical advancesare sculpted by a multiplicity of innovation actors who offer dis-tinct but complementary responses toward pushing the technologyforward.
The empirical exploration is conducted in the context of thesemiconductor manufacturing industry from 1990 to 2010. Dur-ing this period, the industry witnessed exponential technologicalprogress that was fueled by the emergence of Deep Ultraviolet(DUV) manufacturing technology in the late 1980s and its subse-quent evolution over the next two decades (Iansiti, 1998; Martinand Salomon, 2003; Kapoor and Adner, 2007). We draw upon acomprehensive archival dataset of 12,000 technical articles pre-sented at 147 industry conferences, to capture the pattern ofcollaborative R&D pursued by semiconductor manufacturers (i.e.,users), suppliers, universities and dedicated research institutesover the course of the DUV technology life cycle.
The early emergence stage of the technology is accompanied byhigh technological uncertainty during which firms build absorp-tive capacity, accumulate new knowledge and pursue technicalor scientific breakthroughs (Sahal, 1981; Dosi, 1982; Cohen andLevinthal, 1990; Jiang et al., 2011). These motivations translated toR&D efforts having a somewhat stronger internal orientation andthe externally oriented collaborative R&D efforts being channeledmainly through science-based collaborations involving universitiesand research institutes.
As the technology trajectory solidifies and experience is gained,R&D efforts during the growth stage evolve toward pursuingcumulative advances within the now established technologicalconstraints and interdependencies. This changed the distributionof R&D collaboration from predominantly science-based duringthe emergence stage to increasingly technology integration-basedinvolving users and suppliers during the growth and maturitystages of the technology. Technology integration-based collabora-tions come in two distinct flavors – the often emphasized verticalcollaboration between users and suppliers (e.g., Clark and Fujimoto,1991), and the somewhat less emphasized horizontal collabora-tion between suppliers of complementary components in whichsuppliers take a more active role in coordinating technological
inputs (e.g., Mitchell and Singh, 1996; Kapoor, 2013a). As suppli-ers gain experience over the course of the technology life cycle,they develop the necessary architectural knowledge to assumesome of the responsibilities underlying technology integration and
search
clpec
aoabiReosmlrc
pdn2ftpetgirhi1cca
ttaanhttel2ptoaideat1
Wbthr
R. Kapoor, P.J. McGrath / Re
reate greater value from their efforts. This resulted in the evo-ution of technology integration-based R&D collaboration fromredominantly vertical collaboration between users and suppli-rs to increasingly horizontal collaboration between suppliers ofomplementary components.
Finally, besides collaborating with research organizations andctors in the supply chain, focal firms also collaborate with eachther. This was most evident in the co-opetitive collaborationsmong semiconductor manufacturers. Such collaborations coulde motivated by firms learning from each other and accumulat-
ng knowledge as well as firms generating economic efficiencies in&D by pooling their resources (e.g., Sakakibara, 1997; Hagedoornt al., 2000). The evolution in the structure of co-opetitive collab-ration from a highly centralized network during the emergencetage to increasingly decentralized network during the growth andaturity stages offered some initial evidence that co-opetitive col-
aborations evolve from a learning orientation to an increasinglyesource pooling orientation over the course of the technology lifeycle.
Taken together, these findings reinforce that technologicalrogress in an industry is enabled by a collaborative network ofiverse innovators including suppliers, users and research orga-izations (Freeman, 1991; Hagedoorn, 2002; Powell and Grodal,005). Beyond the recognition that the locus of innovation is indeedound in the network of collaborative relationships, we disen-angle the different types of collaborative interactions that takelace within the network and show how their relative importancevolves over the technology life cycle. In so doing, we contributeo the literature on interorganizational collaboration by not onlyenerating dynamic insights, but also providing clarity on themportance and relevance of the different types of collaborativeelationships (Ahuja et al., 2011). Given that technology life cycleas been a critical anchor for scholars studying the link between
ndustry evolution and firm strategy (Tushman and Anderson,986; Nelson, 1994; Utterback, 1994), the study offers a novelharacterization of how an innovating firm may reconfigure itsooperative R&D strategy as it pursues technical advances withinn existing or a new technological regime.
Another important contribution of the study entails the use ofechnical conferences to examine the pattern of R&D collabora-ion. There are many industries and technological domains such aserospace, automotive and energy where technical conferences aren important medium through which information regarding tech-ology development and progress is disseminated. While scholarsave successfully leveraged public announcements of alliances inhe popular or industry press, such sources are severely limited inheir ability to capture the broad spectrum of R&D collaborations,specially if they involve research organizations or if they tend to beess formal (Link and Bauer, 1989; Freeman, 1991; Hagedoorn et al.,000; Hall et al., 2003). Technical conferences, on the other hand,rovide a first-hand account of the R&D activities carried out byhe firms’ engineers and scientists. Technical conferences thereforeffer scholars a much more comprehensive and contemporaneousccount of firms’ in-house and collaborative research efforts. Whilet is possible that a firm’s reliance on secrecy can preclude the publicisclosure of some of its R&D activities, the reputational and knowl-dge sharing benefits often offset these appropriability concernsnd thus generate strong incentives for both firms and employeeso participate in technical conferences (e.g., Hicks, 1995; Appleyard,996).
The findings have important implications for policy makers.hile we expected that R&D collaboration within the industry will
e predominantly science-based during the emergence stage ofhe technology, we were somewhat surprised to see a relativelyigh level of science-based collaboration even during the matu-ity stage (39% of all collaborative articles). This clearly suggests
Policy 43 (2014) 555– 569 567
that universities and dedicated research institutes continue to bean important source of learning for firms throughout the technol-ogy’s evolution. Hence, financing industry-relevant public researchand facilitating collaborations between industry and research orga-nizations are likely to be critical in shaping the competitivenessof regions and firms. Given the importance of suppliers especiallyduring the growth and maturity stages of the technology life cycle,policy makers may need to ensure that technological advances arenot halted by the suppliers’ inability to invest in and undertakecollaborative R&D. Finally, policies geared toward antitrust andcooperative research may explicitly need to account for the chang-ing motivations for competitors to collaborate over the course ofthe technology life cycle.
The empirical evidence presented in the study also comple-ments the recent study by Epicoco (2012); using network-basedbibliometric techniques and drawing on patent citations informa-tion, she identified the key technological inventions and knowledgedomains that underlie the evolution of the semiconductor industry.While Epicoco’s emphasis was on integrated circuit (IC) and systemdesign rather than on semiconductor manufacturing, her findingsreinforced the importance of a broad set of actors that contributedto the technological advances in the semiconductor industry and,in particular, the critical role played by research organizations ingenerating some of the core inventions and initiating new knowl-edge domains. Our analysis of the evolutionary pattern of R&Dcollaboration among semiconductor manufacturers, their suppliersand research organizations also parallels another important evolu-tionary pattern in the semiconductor industry over the past twodecades – the shift toward greater specialization with respect tosemiconductor design and manufacturing activities (e.g., Macheret al., 1999; Brown and Linden, 2009; Kapoor, 2013b). This shift hasnot only resulted in an increased globalization of semiconductormanufacturing (Leachman and Leachman, 2004), but also providedfirms with different strategic alternatives (i.e., make, buy or ally)for governing their manufacturing activities (Leiblein et al., 2002;Leiblein and Madsen, 2009). We note, however that our analysisand their interpretation are indifferent to whether the semicon-ductor manufacturer is a vertically integrated firm or a specializedmanufacturing firm. They are both users of the DUV technology.
Although we have taken care in our examination, the study has anumber of limitations. Our examination focuses on a specific tech-nology in a given industry. Much more needs to be done to establishthe generalizability of our findings in other contexts. For example,our findings may be more applicable in contexts where technologi-cal capabilities are broadly distributed among industry participants(i.e., users, suppliers, R&D organizations). Similarly, an impor-tant boundary condition for our findings related to technologyintegration-based collaboration (Hypotheses 2 and 3) is that thesewould be most applicable in contexts characterized by technolog-ical systems (Rosenberg, 1982; Hughes, 1983). Second, in relyingon a unique dataset that draws on technical articles presented inindustry conferences, we have assumed that these articles havea strong correspondence between internal and collaborative R&Defforts in the industry. While we have attempted to establish thevalidity of our data through interviews and comparisons with otherdata sources, it is likely that the dataset suffers from incomplete ordelayed information for some internal R&D projects and for somecollaborative R&D projects. For example, it is possible that engi-neers and scientists in the industry may have different incentivesto participate in these conferences. It is also possible that differentfirms and R&D organizations may provide varying levels of encour-agement to their employees to present their research in the indus-
try conferences and maintain links with the wider scientific com-munity (e.g., Henderson and Cockburn, 1994). Finally, our infer-ences regarding the evolution of co-opetitive collaboration froma learning orientation to increasingly resource pooling orientation
5 search
atcp
awctstprnpe
A
tgeJnWSrsRm
R
A
A
A
A
A
A
A
B
B
B
B
C
C
C
C
C
68 R. Kapoor, P.J. McGrath / Re
re at best preliminary. We expect that such an evolutionary shifto have important implications for how firms manage co-opetitiveollaborations over time, and hope that future research can morerecisely identify this pattern and its resulting implications.
Despite these and other limitations, the study, drawing on novel dataset, uncovers how the pattern of collaborative R&Dithin the industry community evolves over the technology life
ycle. By viewing technological progress as shaped by the collec-ive efforts of suppliers, users and research organizations, and byituating their internal and collaborative efforts in the context ofhe technology’s evolution, it offers a rich characterization of howrogress within an industry is sustained. In doing so, it offers aare bridge between the literatures on technology evolution andetworks of innovators, and shows why their joint considerationromises valuable insights for scholars, managers and policy mak-rs.
cknowledgements
We would like to express our sincere appreciation to Edi-or Martin Kenney and the anonymous reviewers for the veryenerous feedback and valuable guidance. We gratefully acknowl-dge the helpful comments of Bruno Cassiman, Kwanghui Lim,ohn Paul MacDuffie, Peter Murmann, Lori Rosenkopf and semi-ar participants at Drexel University, Stanford University and theharton School. Dheeraj Chandrashekhar, Oluwemimo Oladapo,
onal Verma, Michael Wei and Yingnan Xu provided excellentesearch assistance. Rahul would like to acknowledge the financialupport provided by the Dean’s Research Fund, Global Initiativesesearch Program and the Mack Institute for Innovation Manage-ent at The Wharton School. All errors are our own.
eferences
dner, R., Kapoor, R., 2010. Value creation in innovation ecosystems: how thestructure of technological interdependence affects firm performance in newtechnology generations. Strategic Management Journal 31 (3), 306–333.
huja, G., 2000. Collaboration networks, structural holes, and innovation: a longi-tudinal study. Administrative Science Quarterly 45 (3), 425–455.
huja, G., Sosa, G., Zaheer, A., 2011. The genesis and dynamics of organizationalnetworks. Organization Science 19, 2011, Published online before print October.
ppleyard, M., 1996. How does knowledge flow? Interfirm patterns in the semicon-ductor industry. Strategic Management Journal 17, 137–154.
nderson, P., Tushman, M., 1990. Technological discontinuities and dominantdesigns: A cyclical model of technological change. Administrative Science Quar-terly 35 (4), 604–633.
ppleyard, M., 2002. Cooperative knowledge creation: the case of buyer–supplierco-development in the semiconductor industry. In: Contractor, F., Lorange,P. (Eds.), Cooperative Strategies and Alliances. Elsevier Science, London, pp.381–418.
rora, A., Gambardella, A., 1990. Complementarity and external linkages: the strate-gies of large firms in biotechnology. Journal of Industrial Economics 38 (4),361–379.
aum, J., Calabrese, T., Silverman, B., 2000. Don’t go it alone: alliance networkcomposition and startups’ performance in Canadian biotechnology. StrategicManagement Journal 21, 267–294.
elderbos, R., Carree, M., Lokshin, B., 2004. Cooperative R&D and firm performance.Research Policy 33, 1477–1492.
ercovitz, J., Feldman, M., 2007. Fishing upstream: firm innovation strategy anduniversity research alliances. Research Policy 36, 930–948.
rown, C., Linden, G., 2009. Chips and Change: How Crisis Reshapes the Semicon-ductor Industry. MIT Press, Cambridge, MA.
assiman, B., Veugelers, R., 2006. In search of complementarity in innovation strat-egy: internal R&D and external knowledge acquisition. Management Science 52(1), 68–82.
hesbrough, H., 1999. The organizational impact of technological change: a compar-ative theory of national institutional factors. Industrial and Corporate Change 8(3), 447–485.
hesbrough, H., 2003. Open Innovation: the New Imperative for Creating and Prof-iting from Technology. Harvard Business School Press, Boston, MA.
hristensen, C., 1992. Exploring the limits of the technology S-curve, Parts I and II.Production and Operations Management 1 (4), 334–366.
lark, K., Fujimoto, T., 1991. Product Development Performance: Strategy, Organi-zation and Management in the World Auto Industry. Harvard Business SchoolPress, Boston, MA.
Policy 43 (2014) 555– 569
Cockburn, I.M., Henderson, R.M., 1998. Absorptive capacity, coauthoring behavior,and the organization of research in drug discovery. Journal of Industrial Eco-nomics 46 (2), 157–182.
Cohen, W., Levinthal, D., 1990. Absorptive capacity: a new perspective on learningand innovation. Administrative Science Quarterly 35 (1), 128–152.
Cohen, W., Florida, R., Randazzese, L., Walsh, J., 1998. Industry and the academy:uneasy partners in the cause of technological advance. In: Noll, R. (Ed.), Chal-lenges to the Research University. Brookings Institution Press, Washington, DC,pp. 171–199, Chapter 7.
Coleman, J., 1988. Social capital in the creation of human capital. American Journalof Sociology 94 (Suppl.), S95–S120.
DiMaggio, P., Powell, W., 1983. The iron cage revisited: institutional isomorphismand collective rationality in organizational fields. American Sociological Review48 (2), 147–160.
Dosi, G., 1982. Technological paradigms and technological trajectories: a suggestedinterpretation of the determinants and directions of technical change. ResearchPolicy 11, 147–162.
Dosi, G., 1988. Sources, procedures, and micro-economic effects of innovation. Jour-nal of Economic Literature 36, 1126–1171.
Epicoco, M., 2012. Knowledge patterns and sources of leadership: mapping the semi-conductor miniaturization trajectory. Research Policy, Available online 24 July2012.
Fey, C., Birkinshaw, J., 2005. External sources of knowledge, governance mode, andR&D performance. Journal of Management 31 (4), 597–621.
Foster, R., 1986. Innovation: The Attacker’s Advantage. Summit Books, New York.Freeman, C., 1991. Networks of innovators: a synthesis of research issues. Research
Policy 20, 499–514.Gambardella, A., 1992. Competitive advantages from in-house scientific research:
the US pharmaceutical industry in the 1980s. Research Policy 21, 391–407.Gittelman, M., Kogut, B., 2003. Does good science lead to valuable knowledge?
Biotechnology firms and the evolutionary logic of citation patterns. Manage-ment Science 49 (4), 366–382.
Gulati, R., 1995. Does familiarity breed trust? The implications of repeated ties forcontractual choice in alliances. The Academy of Management Journal 38 (1),85–112.
Gulati, R., 1999. Network location and learning: the influence of network resourcesand firm capabilities on alliance formation. Strategic Management Journal 20(5), 397–420.
Hagedoorn, J., 1995. Strategic technology partnering during the 1980s: trends,networks and corporate patterns in non-core technologies. Research Policy 24,207–231.
Hagedoorn, J., 2002. Inter-firm R&D partnerships: an overview of major trends andpatterns since 1960. Research Policy 31, 477–492.
Hagedoorn, J., Link, A., Vonortas, N., 2000. Research partnerships. Research Policy29, 567–586.
Hall, B., Link, A., Scott, J., 2003. Universities as research partners. The Review ofEconomics and Statistics 85, 485–491.
Ham, R., Mowery, C., 1998. Improving the effectiveness of public–private R&Dcollaboration: case studies at a US weapons laboratory. Research Policy 26,661–675.
Hamel, G., Doz, Y., Prahalad, C., 1989. Collaborate with your competitors—and win.Harvard Business Review 67 (1), 133–139.
Hansen, M., 1999. The search-transfer problem: the role of weak ties in sharingknowledge across organization subunits. Administrative Science Quarterly 44,82–111.
Harley, C., 1971. The shift from sailing ships to steamships, 1850–1890: a studyin technological change and its diffusion. In: McCloskey, D. (Ed.), Essays on aMature Economy: Britain After 1840. Princeton University Press, Princeton, NJ,p. 439.
Henderson, R., 1995. Of life cycles real and imaginary: the unexpectedly long oldage of optical lithography. Research Policy 24, 631–643.
Henderson, R., Clark, K., 1990. Architectural innovation: the reconfiguration of exist-ing product technologies and the failure of established firms. AdministrativeScience Quarterly 35 (1), 9–31.
Henderson, R., Cockburn, I., 1994. Measuring competence? Exploring firm effects inpharmaceutical research. Strategic Management Journal 15, 63–84.
Hicks, D., 1995. Published papers, tacit competencies and corporate management ofthe public/private character of knowledge. Industrial and Corporate Change 4,401–424.
Holmes, S., Mitchell, P., Hakey, M., 1997. Manufacturing with DUV lithography. IBMJournal of Research and Development 41 (1/2), 7–19.
Hughes, T., 1983. Networks of Power: Electric Supply Systems in the US, Englandand Germany, 1880–1930. The John Hopkins University Press, Baltimore.
Iansiti, M., 1998. Technology Integration. Harvard Business School Press, Boston, MA.Jiang, R., Tao, Q., Santoro, M., 2010. Alliance portfolio diversity and firm performance.
Strategic Management Journal 31 (10), 1136–1144.Jiang, L., Tan, J., Thursby, M., 2011. Incumbent firm invention in emerging fields:
evidence from the semiconductor industry. Strategic Management Journal 32(1), 55–75.
Kapoor, R., 2013a. Collaborating with complementors: what do firms do? Advancesin Strategic Management 30, 3–26.
Kapoor, R., 2013b. Persistence of integration in the face of specialization: how firmsnavigated the winds of disintegration and shaped the architecture of the semi-conductor industry. Organization Science 24 (4), 1195–2013.
Kapoor, R., Adner, R., 2007. Technology interdependence and the evolution of semi-conductor lithography. Solid State Technology 50 (11), 51–54.

search
L
L
L
L
L
L
L
L
M
M
M
M
M
M
M
M
N
N
R. Kapoor, P.J. McGrath / Re
eachman, R., Leachman, C., 2004. Globalization of semiconductors: do real menhave fabs or virtual fabs? In: Kenney, M., Florida, R. (Eds.), In Locating GlobalAdvantage: Industry Dynamics in a Globalizing Economy. Stanford UniversityPress, Stanford, CA, pp. 203–231.
ee, J., Veloso, F., 2008. Interfirm innovation under uncertainty: empirical evidencefor strategic knowledge partitioning. Journal of Product Innovation Management25 (5), 418–435.
eiblein, M., Madsen, T., 2009. Unbundling competitive heterogeneity: incentivestructures and capability influences on technological innovation. Strategic Man-agement Journal 30, 711–735.
eiblein, M., Reuer, J., Dalsace, F., 2002. Do make or buy decisions matter? Theinfluence of organizational governance on technological performance. StrategicManagement Journal 23 (9), 817–833.
im, K., 2009. The many faces of absorptive capacity: spillovers of copper intercon-nect technology for semiconductor chips. Industrial and Corporate Change 18(6), 1249–1284.
in, B., 2006. Sober view on extreme ultraviolet lithography. Journal of Microlithog-raphy, Microfabrication, and Microsystems 5 (3), 033005-033005-12.
inden, G., Mowery, D., Ziedonis, R., 2000. National technology policy in global mar-kets: developing next-generation lithography in the semiconductor industry.Business and Politics 2 (2), 93.
ink, A., Bauer, L., 1989. Cooperative Research in U.S. Manufacturing: AssessingPolicy Initiatives and Corporate Strategies. Lexington Books, Lexington,MA.
acher, J., Mowery, D., Hodges, D., 1999. In: Mowery, D.C. (Ed.), Semiconductors inU.S. Industry in 2000: Studies in Competitive Performance. National AcademyPress, Washington, DC.
artin, X., Salomon, R., 2003. Tacitness, learning, and international expansion: astudy of foreign direct investment in a knowledge-intensive industry. Organi-zation Science 14 (3), 297–311.
eyer-Krahmer, F., Schmoch, U., 1998. Science-based technologies:university–industry interactions in four fields. Research Policy 27,835–851.
iotti, L., Sachwald, F., 2003. Co-operative R&D: why and with whom? An integratedframework of analysis. Research Policy 32, 1481–1499.
itchell, W., Singh, K., 1996. Survival of businesses using collaborative relation-ships to commercialize complex goods. Strategic Management Journal 17 (3),169–195.
oore, G., 1995. Lithography and the future of Moore’s law. Optical/LaserMicrolithography VIII: Proceedings of the SPIE 2440, 2–17.
owery, D., Oxley, J., Silverman, B., 1996. Strategic alliances and interfirm knowl-edge transfer. Strategic Management Journal 17, 77–91.
urmann, J., Frenken, K., 2006. Toward a systematic framework for research ondominant designs, technological innovations, and industrial change. Research
Policy 35 (7), 925–952.elson, R., Winter, S., 1982. An Evolutionary Theory of Economic Change. HarvardUniversity Press, Cambridge, MA.
elson, R., 1994. The co-evolution of technology, industrial structure, and supportinginstitutions. Industrial and Corporate Change 3, 47–63.
Policy 43 (2014) 555– 569 569
NTRS, 1994. The National Technology Roadmap for Semiconductors. SemiconductorIndustry Association, San Jose, CA.
Pisano, G., 1988. Innovation through markets, hierarchies and joint ventures: tech-nology strategy and collaborative arrangements in the biotechnology industry.University of California, Berkeley, CA (unpublished Ph.D. dissertation).
Pisano, G., 1990. The R&D boundaries of the firm: an empirical analysis. Adminis-trative Science Quarterly 35 (1), 153–176.
Powell, W., Grodal, S., 2005. Networks of innovators. In: Fagerberg, J., Mowery, D.,Nelson, R. (Eds.), The Oxford Handbook of Innovation. Oxford University Press,Oxford, pp. 56–85.
Powell, W., Koput, K., Smith-Doerr, L., 1996. Interorganizational collaboration andthe locus of innovation: networks of learning in biotechnology. AdministrativeScience Quarterly 41 (1), 116–145.
Powell, W., White, D., Koput, K., Owen-Smith, J., 2005. Network dynamics and fieldevolution: the growth of interorganizational collaboration in the life sciences.American Journal of Sociology 110 (4), 1132–1205.
Prencipe, A., 2000. Breadth and depth of technological capabilities in CoPS: the caseof the aircraft engine control system. Research Policy 29, 895–911.
Rosenberg, N., 1963. Technological change in the machine tool industry, 1840–1910.The Journal of Economic History 23 (4), 414–443.
Rosenberg, N., 1982. Inside the Black Box: Technology and Economics. CambridgeUniversity Press, Cambridge, MA.
Rosenberg, N., Nelson, R., 1994. American universities and technical advance inindustry. Research Policy 23, 323–348.
Sahal, D., 1981. Patterns of Technological Innovation. Addison-Wesley, Reading, MA.Sakakibara, M., 1997. Heterogeneity of firm capabilities and cooperative research
and development: an empirical examination of motives. Strategic ManagementJournal 18, 143–164.
Schilling, M., 2008. Strategic Management of Technological Innovation. McGrawHill/Irwin, New York, NY.
Takeishi, A., 2002. Knowledge partitioning in the interfirm division of labor: the caseof automotive product development. Organization Science 13 (3), 321–338.
Tushman, M., Anderson, P., 1986. Technological discontinuities and organizationalenvironments. Administrative Science Quarterly 3, 439–465.
Tushman, M., Rosenkopf, L., 1992. Organizational determinants of technologicalchange: towards a sociology of technological evolution. Research in Organiza-tional Behavior 14, 311–347.
Utterback, J., 1994. Mastering the Dynamics of Innovation. Harvard Business SchoolPress, Cambridge, MA.
Uzzi, B., 1996. The sources and consequences of embeddedness for the economicperformance of organizations. American Sociological Review 61, 674–698.
Uzzi, B., 1997. Social structure and competition in interfirm networks: the paradoxof embeddedness. Administrative Science Quarterly 42, 35–67.
Walker, G., Kogut, B., Shan, W., 1997. Social capital, structural holes and the forma-
tion of an industry network. Organization Science 8, 109–125.Wasserman, S., Faust, K., 1994. Social Network Analysis: Methods and Applications.Cambridge University Press, Cambridge, England.
Williamson, D., 2000. DUV or EUV, that is the question. Proceedings of the SPIE 4146,1.