unlocking our future - sypris solutions, inc
TRANSCRIPT

2011 Annual Report
Unlocking Our Future
101 Bullitt Lane, Suite 450 Louisville, Kentucky 40222Phone: (502) 329-2000 Fax: (502) 329-2036www.sypris.com
Subsidiary Headquarters:
Sypris Technologies Inc.101 Bullitt Lane, Suite 205 Louisville, Kentucky 40222Phone: (502) 420-1222 Fax: (502) 420-1232
Sypris Electronics LLC10901 North McKinley Drive Tampa, Florida 33612Phone: (813) 972-6000 Fax: (813) 972-6704
Last year, we discussed the significant restructuring plan we undertook in the fall of 2008 to improve the liquidity of the Company’s balance sheet through the reduction of debt, to dramatically reduce the fixed cost structure of the Company, to strengthen our organization through the recruitment of experienced individuals with proven track records, to greatly improve our operational effectiveness in terms of productivity, quality, scrap and on-time delivery, and to create a growing, profitable enterprise of which we all could be proud.
We are pleased to report that the outstanding efforts of our employees enabled us not only to weather the worst economic storm in recent history, but to emerge stronger than ever. These efforts, combined with the rebound of the economy generally and the commercial vehicle market specifically, contributed to the Company restoring its profitability to levels not seen in many years, with a positive, commensurate improvement in financial strength and operational effectiveness.
FINANCIAL HIGHLIGHTS
Revenue increased 26% to $336 million from $267 million in 2010. The increase was driven by a 43% growth in revenue from our Industrial Group, which benefited from the continued recovery of the commercial vehicle and trailer markets. This gain was offset by lower sales in the Electronics Group partially as a result of appropriation delays from the Department of Defense that dramatically slowed the flow and timing of orders during the year.
Net income increased to $7.9 million, reflecting an $18.1 million improvement over 2010 that was driven principally by the vastly improved operational effectiveness and increased productivity in our rapidly growing Industrial Group. As a result, earnings advanced to $0.40 per diluted share from a loss of $0.55 per share in 2010.
Cash flow from operations increased to $17.0 million, up from $1.7 million for 2010, while free cash flow increased to $10.1 million, or $0.53 per diluted share. The improvement was fueled by an $18.5 million increase in our Industrial Group’s cash flow from operations, and represented a very important accomplishment for the Company, especially since the improve-ment was achieved during a period of rapid revenue growth.
In addition, our Industrial Group successfully managed to respond to escalating customer demand while establishing new records for quality and on-time delivery. Our team’s unrelenting focus on preventive maintenance during the robust rebound resulted in a dramatic improvement in equipment uptime and positioned our Industrial Group to convert the increased sales volumes into higher profits.
With our much improved financial foundation, operational momentum and expanding market opportunities, we are
optimistic about the future. Our objective, however, remains unchanged: to deliver results that exceed expectations by consistently growing our earnings and cash flows.
OUR INITIATIVES
We have made significant progress over the past few years, and while much work remains, we will continue to invest in technology, processes, programs and people to maintain our core leadership positions for each of the products and services we provide. Let us provide a brief review of these efforts.
OPERATIONAL EFFECTIVENESS
Driving excellence in everything we do has moved beyond isolated pilots to being part of the DNA in each of our production facilities. The intensive application of continuous improvement, in the form of tools such as LEAN and Six Sigma, has become part of the way we do business, resulting in the elimination of waste and the improvement of workflow, thereby reducing the cost per unit for each product produced.
In our Industrial Group, continuous improvement efforts have been focused on reduced setup times, reduced equipment downtime and higher manufacturing throughput. In our Louisville, KY operation, we now have over 60 robots installed to manage a variety of production cells on a highly automated basis. In our Morganton, NC operation, we have applied LEAN tools to reduce direct production costs by 15% on our largest line. And finally, in our Toluca, Mexico operation, we’ve achieved a 10% reduction in the year-over-year cost for certain of our forged products.
The results of these efforts drove significant balance sheet efficiency as well. Even as sales within our Industrial Group expanded by 43%, or $82.2 million, from the prior year, inventory turns improved by 12%.
The year 2011 was challenging for our Electronics Group, as the Obama Administration and Congress remained engaged in extended discussions regarding budgetary spending measures. The delayed approval of the 2011 Defense Appropriations Bill resulted in slower funding across our product platforms and resulted in lower than expected revenue for 2011. As a result, we have made the necessary adjustments to realign the cost structure of this group to ensure profitability in this ongoing, dynamic environment. We believe that the fourth quarter of 2011 will turn out to be the trough for this segment, and we expect to see a return to growth and profitability as we move through 2012.
We anticipate that the upcoming rationalization of defense spending will result in more opportunities to leverage our products across common government platforms, lead to increased demand for our cyber defense products and services and to modernization opportunities for extending the life of
Dear Fellow Stockholders:
Sypris Solutions Inc. 2011 Annual Report

currently deployed equipment. As a result, we believe it to be prudent to continue to support higher levels of investment in R&D during 2012 and into the future.
HEALTHCARE COST IMPROVEMENT
The Company continued to make important changes to its healthcare plans with both a strong focus on user education and the implementation of a wide range of wellness initiatives. We now have full-time nurses on site at each of our operating locations. We provide biometric screenings, flu shots, weight management programs, smoking cessation programs and regular wellness communications and consultations to employees and their families. It is worth noting that the biometric screenings for several individuals identified the existence of potentially life-threatening diseases and, as a result, may have been a lifesaving event.
ORGANIZATIONAL CAPABILITY
The real story of any business starts with its people and Sypris is no exception. Over the past several years, the organizational leadership at all levels of both business units has been substantially changed and greatly improved. The successful results of the Company’s restructuring efforts, in many regards, reflect the positive impact of these investments in seasoned, professional talent.
LOOKING FORWARD
With the restructuring well behind us and the results for 2011 firmly in place, we are acutely focused on driving execution on a daily basis throughout our organization as the essential means for unlocking the vast potential of our Company’s future. Our objective in doing so is straightforward and easy to understand, for we believe that the ability to deliver consistent growth in earnings and cash flow over time will be of great benefit to all of the Company’s stakeholders. The strategies deployed by each of our business units to achieve this objective vary, but can best be summarized as follows:
Electronics Group
Key Management Leadership. We are leveraging our established position and 45 years of expertise in key management to expand product offerings and drive new market opportunities. The successful launch of our RASKL product has reinforced our strong position in the military key-loading market. We are adapting our key management software products for the U.S. Army and other key customers to facilitate the seamless migration in the future to the leading communication protocols. We are developing products in the rapidly expanding secure mobile device segment to integrate our proven expertise in designing high assurance devices into a common platform with the potential to host a variety of user applications, thereby saving money and reducing complexity.
New Markets. With the increased attention to advanced cyber threats, the opportunity to provide customers with the required tools to defend their systems from attack is expanding rapidly. We are driving the adoption of our technologies into broader areas of cyber-security for network defense and for cyber-physical systems, which address the security of tightly coupled computing, communications and control systems that operate power plants, aircraft and other such systems that represent complex, critical infrastructure. We believe that our experience configuring secure systems and networks has put us in a unique position to take advantage of our capabilities and partnerships to provide Cyber Range product offerings to fill critical security training gaps for domestic and international customers.
New Technologies. We are continuing to expand our capabilities for growth in new product and services offerings. Our partnerships with key cyber-security research groups, such as Purdue University’s CERIAS and Carnegie Mellon University’s Cylab, have resulted in breakthroughs, allowing us to capture energy sector opportunities as well as positioning us to pursue emerging cyber-physical opportunities. Our coalition of best-of-breed information security companies, which we call a “Cyber Pack,” enables us to rapidly address new customer opportunities. The combination of these key partners with the Company’s expertise has led to multiple new innovative technologies, which in turn have led to a growing patent portfolio.
Increase Growth in EDMS High Reliability. We continue to see growth potential in our Space and other High Reliability/Severe Environment application markets. During 2011, we secured new programs with ITT, Tyco, L-3 Communications, Lockheed Martin and Northrop Grumman that are expected to serve as a solid foundation for future expansion and growth opportunities.
Mature Our High Performing Culture. We are institutionalizing the Sypris Enterprise System to align our organization, reinforce our culture and drive performance. This initiative will effectively integrate all of the LEAN and Six Sigma transformational improvements we have made to date. We believe that the Sypris Enterprise System will serve to differentiate us from the competition, create a lasting competitive advantage and provide the foundation from which to profitably scale the business in the future.
Industrial Group
In our Industrial segment, Sypris Technologies continues to be among the largest suppliers to Dana and Meritor. During the year, we entered into new multi-year supply contracts with Dana, Eaton, Meritor, Sisamex and others to add an estimated $30 million annually to the Company’s top line beginning in 2012, thereby positioning the business to grow faster than the markets it serves. The Company is one of the leading suppliers of driveline components for use in commercial vehicles in North
Sypris Solutions Inc. 2011 Annual Report

Sypris Solutions Inc. 2011 Annual Report
America, and with the continuing recovery of the commercial vehicle and trailer markets, sales are expected to increase significantly over the next several years.
Drive LEAN. We will continue our efforts to persistently eliminate waste everywhere, within both administrative and manufacturing processes, so as to increase flexibility and responsiveness. We will continue to find ways to simplify standard work and are continuously expanding the use of visual management to make anomalies evident and measure execution. Organizational Development. We will continue to invest in proven talent to further enhance our maintenance processes and will additionally expand the utilization of electronic monitoring. We are committed to investing in our talent through stretch assignments and metric-driven objectives. Drive Profitable Growth; Expansion. We are focused on expanding our forging and machining manufacturing services with existing and new customers and on gaining access to emerging markets to grow our customer base.
Expand Niche Products. We have made investments in new equipment to add production capacity for our oil and gas products in order to take advantage of the dynamic energy market for which we produce specialty closures and other piping components for use in transmission, offshore exploration and high pressure vessel applications.
The efficient cost structure and ongoing commercial truck and trailer market recovery in our Industrial Group, combined with our ongoing R&D investments in our Electronics Group, cause us to believe that we are well positioned for a strong future. We remain confident in our ability to deliver another year of revenue growth, improved profitability and market share gains.
THANK YOU
As always, we close with a note of thanks. We appreciate the dedication and commitment of our fellow employees, many of whom are also stockholders. We count on their passion for excellence in all that they do to help Sypris grow and evolve into an increasingly successful company.
We also want to thank our customers and shareholders, both of whom place their trust in Sypris and count on us to meet our commitments for quality, delivery and performance. We sincerely appreciate your confidence and encourage you to contact us. We welcome your comments and would be pleased to answer your questions.
Sincerely,
Jeffrey T. Gill Robert E. GillPresident & CEO Chairman of the Board
* Reconciliation of non-GAAP financial measures is available following the Form 10-K. Please also refer to the “Risk Factors” Section of our Form 10-K for a discussion of relevant risks.

UNITED STATES SECURITIES AND EXCHANGE COMMISSION Washington, D.C. 20549
FORM 10-K (Mark one) Annual report pursuant to Section 13 or 15(d) of the Securities Exchange Act of 1934. For the fiscal year
ended December 31, 2011. Transition report pursuant to Section 13 or 15(d) of the Securities Exchange Act of 1934. For the
transition period from ________ to ________.
Commission file number 0-24020
SYPRIS SOLUTIONS, INC. (Exact name of registrant as specified in its charter)
Delaware 61-1321992 (State or other jurisdiction (I.R.S. Employer of incorporation or organization) Identification No.)
101 Bullitt Lane, Suite 450 Louisville, Kentucky 40222 (502) 329-2000 (Address of principal executive (Registrant’s telephone number, offices, including zip code) including area code)
Securities registered pursuant to Section 12(b) of the Act: (Title of Each Class)
(Name of each exchange on which registered)
Common Stock, $.01 par value
The NASDAQ Stock Market LLC Securities registered pursuant to Section 12(g) of the Act:
None Indicate by check mark if the registrant is a well-known seasoned issuer, as defined in Rule 405 of the Securities Act.
Yes No Indicate by check mark if the registrant is not required to file reports pursuant to Section 13 or Section 15(d) of the Act.
Yes No Indicate by check mark whether the registrant (1) has filed all reports required to be filed by Sections 13 or 15(d) of the Securities Exchange Act of 1934 during the preceding 12 months (or for such shorter period that the registrant was required to file such reports), and (2) has been subject to such filing requirements for the past 90 days. Yes No Indicate by check mark whether the registrant has submitted electronically and posted on its corporate Web site, if any, every Interactive Data File required to be submitted and posted pursuant to Rule 405 of Regulation S-T (§232.405 of this chapter) during the preceding 12 months (or for such shorter period that the registrant was required to submit and post such files). Yes No Indicate by check mark if disclosure of delinquent filers pursuant to Item 405 of Regulation S-K is not contained herein, and will not be contained, to the best of the registrant’s knowledge, in definitive proxy or information statements incorporated by reference in Part III of this Form 10-K or any amendment to this Form 10-K. Indicate by check mark whether the registrant is a large accelerated filer, an accelerated filer, a non-accelerated filer or a smaller reporting company. See the definitions of “large accelerated filer,” “accelerated filer” and “smaller reporting company” in Rule 12b-2 of the Exchange Act. (Check one):
Large accelerated filer Accelerated filer Non-accelerated filer Smaller reporting companyIndicate by check mark whether the registrant is a shell company (as defined in Rule 12b-2 of the Exchange Act). Yes No The aggregate market value of the voting and non-voting common equity held by non-affiliates computed by reference to the price at which the common equity was last sold as of the last business day of the registrant’s most recently completed second fiscal quarter (July 3, 2011) was $41,099,513. There were 19,878,407 shares of the registrant’s common stock outstanding as of March 5, 2012.
DOCUMENTS INCORPORATED BY REFERENCE Portions of the definitive Proxy Statement to be delivered to shareholders in connection with the Annual Meeting of Stockholders to be held May 8, 2012 are incorporated by reference into Part III to the extent described therein.

Table of Contents Page Part I
Item 1. Business ....................................................................................................................................... 1
Item 1A. Risk Factors ................................................................................................................................. 8
Item 1B. Unresolved Staff Comments ....................................................................................................... 14
Item 2. Properties ..................................................................................................................................... 15
Item 3. Legal Proceedings ....................................................................................................................... 16
Item 4. Mine Safety Disclosures.............................................................................................................. 17
Part II
Item 5. Market for the Registrant’s Common Equity, Related Stockholder Matters and
Issuer Purchases of Equity Securities .................................................................................. 18
Item 6. Selected Financial Data ............................................................................................................... 18
Item 7. Management’s Discussion and Analysis of Financial Condition and Results of Operations ... 19
Item 7A. Quantitative and Qualitative Disclosures about Market Risk ............................................... 28
Item 8. Financial Statements and Supplementary Data .......................................................................... 29
Item 9. Changes in and Disagreements with Accountants on Accounting and Financial Disclosure ... 60
Item 9A. Controls and Procedures.............................................................................................................. 60
Item 9B. Other Information ........................................................................................................................ 60
Part III
Item 10. Directors, Executive Officers and Corporate Governance ......................................................... 61
Item 11. Executive Compensation ............................................................................................................. 61
Item 12. Security Ownership of Certain Beneficial Owners and Management and Related Stockholder Matters ............................................................................................................. 61
Item 13. Certain Relationships and Related Transactions and Director Independence ........................... 62
Item 14. Principal Accountant Fees and Services ..................................................................................... 62
Part IV
Item 15. Exhibits and Financial Statement Schedules .............................................................................. 63
Signature Page ........................................................................................................................................................... 67
In this Annual Report on Form 10-K, “Sypris,” “SYPR,” “the Company,” “we,” “us” and “our” refer to Sypris Solutions, Inc. and its subsidiaries and predecessors, collectively. “Sypris Solutions” and “Sypris” are our trademarks. All other trademarks, servicemarks or trade names referred to in this Annual Report on Form 10-K are the property of their respective owners.

1
PART I
Item 1. Business
General
We were formed as a Delaware corporation in 1997. We are a diversified provider of outsourced services and specialty products. We perform a wide range of manufacturing, engineering, design and other technical services, typically under multi-year, sole-source contracts with corporations and government agencies principally in the markets for industrial manufacturing and aerospace and defense electronics.
We focus on those markets where we believe we have the expertise, qualifications and leadership position to sustain a competitive advantage. We target our resources to support the needs of industry participants that embrace multi-year contractual relationships as a strategic component of their supply chain management. These contracts, many of which are sole-source by part number and are for terms of up to five years, enable us to invest in leading-edge processes or technologies to help our customers remain competitive. The productivity, flexibility and economies of scale that can result offer an important opportunity for differentiating ourselves from the competition when it comes to cost, quality, reliability and customer service.
Industrial Manufacturing Group (the Industrial Group). Through our Industrial Group, we are a significant supplier of forged and machined components, serving the commercial vehicle, off highway vehicle, light truck and energy markets in North America. We produce drive train components including axle shafts, gear sets, differential cases, steer axle forgings, and other components under multi-year, sole-source contracts with Meritor, Inc. (Meritor) and Dana Holding Corporation (DHC), the two primary providers of drive train assemblies for use by the leading truck manufacturers, including Ford Motor Company (Ford), Freightliner LLC (Freightliner), Mack Trucks, Inc. (Mack), Navistar International Corporation (Navistar), PACCAR, Inc. (PACCAR) and Volvo Truck Corporation (Volvo). We also supply Meritor with trailer axle beams for use by the leading trailer manufacturers, including Great Dane Limited Partnership (Great Dane), Hyundai Motor Company (Hyundai), Stoughton Trailers, LLC (Stoughton), Utility Trailer Manufacturing Company (Utility) and Wabash National Corporation (Wabash). We continue to support our customers’ strategies to outsource non-core operations by supplying additional components and providing additional value added operations for drive train assemblies. Over the past several years, we have implemented a restructuring plan that has allowed us to adjust our overhead and infrastructure to be in line with current and projected levels of customer demand and market requirements. The plan has been successful, resulting in significant and permanent cost reductions that have lowered our operating breakeven level. The plan also included a diversification strategy which has resulted in the recent addition of long-term agreements with Eaton Corporation and American Axle, under which we supply forgings. We expect to benefit from these actions in the future as global economic conditions and the strength of the commercial vehicle industry continue to improve.
Aerospace & Defense Electronics Group (the Electronics Group). Our Electronics Group is organized around two primary business lines: Information Security Solutions (ISS) and Electronic Manufacturing Services (EMS).
Information Security Solutions (ISS). Our ISS business provides solutions in cyber security,
secure communications, global electronic key management, Sypris Data Systems branded products, and product design and development to the United States Government, both defense and civilian agencies, international government agencies, as well as worldwide defense and aerospace prime organizations. This group has several long-term contracts with the Department of Defense to design and build information assurance products, including link encryptors, data recording products and electronic key fill devices. Electronic Manufacturing Services (EMS). Our EMS business is focused on circuit card and full
box build manufacturing, dedicated space and high reliability manufacturing, integrated design and engineering services, systems assembly and integration, design for manufacturability, and design to

2
specification work. A sampling of our customers includes Lockheed Martin Corporation (Lockheed), Northrop Grumman Corporation (Northrop Grumman) and Raytheon Company (Raytheon).
Our industry’s business environment continues to be shaped by policy and budget decisions and the
economic conditions of the U.S. Government. Recent actions of Congress and the Administration indicate an ongoing emphasis on federal budget deficit reduction. Near-term budget decisions by the Administration and Congress may considerably reduce discretionary spending, of which defense constitutes the majority share. However, defense spending is still expected to remain a national priority within future federal budgets. Our aerospace and defense electronics business accounted for approximately 19% of net revenue in 2011.
Our Markets
Industrial Group. The industrial manufacturing markets include truck components and assemblies, trailer components and specialty closures. The truck components and assemblies market which consists of the original equipment manufacturers, or OEMs, including Chrysler Group LLC, Ford, Freightliner, General Motors Company, Mack, Navistar, PACCAR and Volvo, and an extensive supply chain of companies of all types and sizes that are classified into different levels or tiers. The trailer market consists of OEMs including Great Dane, Wabash, Utility, Hyundai, Vanguard and Stoughton. Tier I companies represent the primary suppliers to the OEMs and include Meritor, DHC, Delphi Automotive LLP, Eaton Corporation and Visteon Corporation (Visteon), among others. Below this group of companies reside numerous suppliers that either supply the OEMs directly or supply the Tier I companies. In all segments of the truck components and assemblies and the trailer markets, however, suppliers are under intense competitive pressure to improve product quality and to reduce capital expenditures, production costs and inventory levels. The specialty closures market consists primarily of oil and gas pipelines, which are also facing significant pressures to improve quality, reduce costs and defer capital expenditures.
Although general economic and industry specific conditions have begun to stabilize, there continues to be concern about the sustainability of a continued economic recovery as a result of mixed trends surrounding unemployment levels, the housing sector and fuel prices. While improvements in the overall market contributed to consumer confidence levels improving near the end of 2011, these factors continue to pose some risk and uncertainty to near term vehicle production levels. Production levels in North America for light, medium and heavy duty truck production have steadily increased over the past three years from the depressed economic environment of 2008 and early 2009. We continue to expect modest growth in production levels within our Industrial Manufacturing Group through 2012 and 2013.
Electronics Group. The U.S. Government continues to focus on developing and implementing spending, tax and other initiatives to reduce the deficit, create jobs and stimulate the economy. This process and the spending reductions to defense programs have the potential to significantly impact our portfolio of business, which is dependent upon discretionary appropriations for defense programs. Although we believe that our products and programs are well aligned with national defense and other priorities, shifts in domestic and international spending and tax policy, changes in security, defense and intelligence priorities, the affordability of our products and services, general economic conditions and other factors may affect the level of funding for existing or proposed programs. Uncertainty over budget plans and national security spending may prove challenging for our customer community, as well as the defense industry.
Market conditions for our ISS business are expected to be favorable over the long term, given the growing cyber security and intelligence markets. However, our EMS business, dedicated to the aerospace and defense market, faces various market conditions. The nature of providing outsourced manufacturing services to the aerospace and defense electronics industry differs substantially from the traditional commercial outsourced manufacturing services industry. The cost of failure can be extremely high, the manufacturing requirements are typically complex and products are produced in relatively small quantities. Companies that provide these manufacturing services are required to maintain and adhere to a number of strict and comprehensive certifications, security clearances and traceability standards.

3
Our Business Strategy
Our objective is to improve our position in each of our core markets by increasing the number of multi-year contracts with customers and investing in highly automated production capacity to remain competitive on a global scale. We intend to serve our customers and achieve this objective by continuing to:
Concentrate on our Core Markets. We are a significant supplier of forged and machined components, serving the commercial vehicle, off highway vehicle, light truck and energy markets in North America. We have been an established supplier of manufacturing and technical services to major aerospace and defense companies and agencies of the U.S. Government for over 40 years. We will continue to focus on those markets where we have the expertise, qualifications and opportunity for market share to sustain a competitive advantage.
Dedicate our Resources to Support Strategic Partnerships. We will continue to dedicate our resources to support the needs of industry leaders that embrace multi-year contractual relationships as a strategic component of their supply chain management and have the potential for long-term growth. We prefer contracts that are sole-source by part number so we can work closely with the customer to the mutual benefit of both parties. DHC and Meritor have awarded us with sole-source supply agreements for certain parts that run through 2014 and 2015, respectively. Historically, we entered into multi-year manufacturing services agreements with Lockheed Martin, Northrop Grumman and Raytheon. Our success in establishing outsourcing partnerships with key customers has historically led to additional contracts, and we believe that if we continue to successfully perform on current contracts, we should have additional growth opportunities with these and other customers.
Pursue the Strategic Acquisition of Assets. Over the long term, we will continue to target the strategic acquisition of assets that serve to consolidate our position in our core markets, expand our presence outside the U.S., create or strengthen our relationships with leading companies and expand our range of value-added services in return for multi-year supply agreements. We intend to acquire assets that can be integrated with our core businesses and that can be used to support other customers, thereby improving asset utilization and achieving greater productivity, flexibility and economies of scale.
Grow Through the Addition of New Value-Added Services. We hope to grow through the addition of new value-added manufacturing capabilities and the introduction of additional components in the supply chain that enable us to provide a more complete solution by improving quality and reducing product cost, inventory levels and cycle times for our customers. In many instances, we offer a variety of state-of-the-art machining capabilities to our customers in the industrial manufacturing markets that enable us to reduce labor and shipping costs and minimize cycle times for our customers over the long-term, providing us with additional growth opportunities in the future. Successfully migrating from design and manufacturing of complex circuit card assemblies to box builds would increase product content with our customers and would allow us to be a more significant player in the aerospace and defense market.
We believe that the number and duration of our strategic relationships enable us to invest in our business with greater certainty and with less risk than others that do not benefit from the type of longer term contractual commitments we receive from many of our major customers. The investments we make in support of these contracts are targeted to provide us with the productivity, flexibility, technological edge and economies of scale that we believe will help to differentiate us from the competition in the future when it comes to cost, quality, reliability and customer service.
Our Services and Products
We are a diversified provider of outsourced services and specialty products. Our services consist of manufacturing, technical and other services and products that are delivered as part of our customers’ overall supply chain management. We provide our customers with services that include software licensing and development, design services, prototype development, product re-engineering, feature enhancement, product ruggedization, cost reduction, product miniaturization and electro-magnetic interference and shielding. We also apply our core technologies to the development and production of our own product line of high assurance security components, including cryptographic key management programs and data encryption and recording products for our U.S. Government and defense customers. The information below is representative of the types of products we manufacture, services we provide and the customers and industries for which we provide such products or services.

4
Industrial Group:
DHC ...........................................................Drive train components (including axle shafts, differential cases, gear sets, full float tubes) and steer axle components for use in light, medium and heavy-duty trucks.
Meritor .......................................................Axle shafts and drive train components for medium and heavy-duty trucks as well as axle beams for trailers.
Eaton ..........................................................Transmission shafts for heavy-duty trucks. Jamison Products .......................................Specialty closures for oil and gas pipelines.
Electronics Group:
Northrup Grumman ....................................Circuit card assembly and sub-assembly design and build for electronic sensors and systems ranging from radar and targeting systems to tactical ground stations, navigation systems and integrated avionics.
U.S. Government .......................................Secure communications equipment, global key management solutions and data recording systems.
Raytheon ....................................................Complex circuit cards for use in a missile guidance system and an integrated air defense network.
Manufacturing Services
Our manufacturing services typically involve the fabrication or assembly of a product or subassembly according to specifications provided by our customers. We purchase raw materials or components from our customers and independent suppliers in connection with performing our manufacturing services. We strive to enhance our manufacturing capabilities by advanced quality and manufacturing techniques, lean manufacturing, just-in-time procurement and continuous flow manufacturing, statistical process control, total quality management, stringent and real-time engineering change control routines and total cycle time reduction techniques.
Industrial Manufacturing Services. We provide our customers with a wide range of capabilities, including automated forging, extruding, machining, induction hardening, heat-treating and testing services to meet the exacting requirements. We also design and fabricate production tooling, manufacture prototype products and provide other value-added services for our customers. Our manufacturing services contracts for the truck components and assemblies markets are generally sole-source by part number. Part numbers may be specified for inclusion in a single model or a range of models. Where we are the sole-source provider by part number, we are the exclusive provider to our customer of the specific parts and for any replacements for these parts that may result from a design or model change for the duration of the manufacturing contract.
Electronics Manufacturing Services. We provide our customers with a broad variety of solutions, from low-volume prototype assembly to high-volume turnkey manufacturing. We employ a multi-disciplined engineering team that provides comprehensive manufacturing and design support to customers. The manufacturing solutions we offer include design conversion and enhancement, materials procurement, system assembly, testing and final system configuration. Our manufacturing services contracts for the aerospace and defense electronics market are generally sole-source by part number.
Products
In addition to our outsourced services, we provide some of our customers with specialized products including digital and analog data systems and encryption devices used in military applications and specialty closures and joints used in pipeline and chemical systems. As we look to grow our business, emphasis will be placed on funding of new products to broaden our portfolio and meet the needs of our customers.
Our Customers
Our customers include large, established companies and agencies of the federal government. We provide some customers with a combination of outsourced services and products, while other customers may be in a single category of our service or product offering. Our five largest customers in 2011 were DHC, Meritor, Sistemas,

5
Northrop Grumman and Eaton, which in the aggregate accounted for 77% of net revenue in 2011. Our five largest customers in 2010 were DHC, Meritor, Honeywell International Inc. (Honeywell), Lockheed Martin and Sistemas, which in the aggregate accounted for 73% of net revenue in 2010. In 2011, DHC and Meritor represented approximately 54% and 13% of our net revenue, respectively. In 2010, DHC and Meritor represented approximately 49% and 13% of our net revenue, respectively. In addition, U.S. governmental agencies accounted for 9% and 12% of net revenue in 2011 and 2010, respectively.
Geographic Areas
Our operations are located in the U.S., Mexico and Denmark. Our Mexican subsidiaries and affiliates are a part of our Industrial Group and manufacture and sell a number of products similar to those the Industrial Group produces in the U.S. Our Denmark subsidiary is a sales office and is part of our Electronics Group. In addition to normal business risks, operations outside the U.S. may be subject to a greater risk of changing political, economic and social environments, changing governmental laws and regulations, currency revaluations and market fluctuations. Fluctuations in foreign currency exchange rates have historically impacted our earnings only to the extent of remeasurement gains or losses related to U.S. dollar denominated accounts of our foreign subsidiaries, because the vast majority of our transactions are denominated in U.S. dollars. For the year ended December 31, 2011, other income, net, includes foreign currency translation gains of $2.6 million. For 2010, other income, net, included foreign currency translation losses of $0.7 million.
Consolidated net revenues from Mexican operations were $99.1 million, or 30%, and $63.8 million, or 24%, of our consolidated net revenues in 2011 and 2010, respectively. In 2011, net income from our Mexican operations was $11.2 million as compared to a consolidated income from continuing operations of $8.4 million. In 2010, net income from our Mexican operations was $6.8 million as compared to a consolidated loss from continuing operations of $9.7 million. You can find more information about our regional operating results, including our export sales, in “Note 24 Segment Information” in Item 8 of this Annual Report on Form 10-K.
Sales and Business Development
Our principal sources of new business originate from the expansion of existing relationships, referrals and direct sales through senior management, direct sales personnel, domestic and international sales representatives, distributors and market specialists. We supplement these selling efforts with a variety of sales literature, advertising in numerous trade media and participating in trade shows. We also utilize engineering specialists extensively to facilitate the sales process by working with potential customers to reduce the cost of the service they need. Our specialists achieve this objective by working with the customer to improve their product’s design for ease of manufacturing, reducing the amount of set-up time or material that may be required to produce the product or by developing software that can automate the test and/or certification process. The award of contracts or programs can be a lengthy process, which in some circumstances can extend well beyond 12 months. Upon occasion, we commit resources to potential contracts or programs that we ultimately do not win.
Our objective is to increase the value of the services we provide to the customer on an annual basis beyond the contractual terms that may be contained in a supply agreement. To achieve this objective, we commit to the customer that we will continuously look for ways to reduce the cost, improve the quality, reduce the cycle time and improve the life span of the products and/or services we supply the customer. Our ability to deliver on this commitment over time is expected to have a significant impact on customer satisfaction, loyalty and follow-on business.
Competition
The markets that we serve are highly competitive, and we compete against numerous domestic companies in addition to the internal capabilities of some of our customers. In the truck components and assemblies market, we compete primarily against companies including Mid-West Forge, Inc., Spencer Forge and Machine, Inc. and Traxle, which serve as suppliers to many Tier I and smaller companies. In the aerospace and defense electronics market, we compete primarily against companies including Celestica Inc., Jabil Circuit, Inc., LaBarge, Inc. and Safenet, Inc. We may face new competitors in the future as the outsourcing industry evolves and existing or start-up companies develop capabilities similar to ours. In addition, we will face new competitors as we continue to increase and expand our business.

6
We believe that the principal competitive factors in our markets include the availability of capacity, technological capability, flexibility, financial strength and timeliness in responding to design and schedule changes, price, quality and delivery. Although we believe that we generally compete favorably with respect to each of these factors, some of our competitors are larger and have greater financial and operating resources than we possess. Some of our competitors, as compared to us, have a greater geographic breadth and range of services. We also face competition from manufacturing operations of our current and potential customers that continually evaluate the relative benefits of internal manufacturing compared to outsourcing. We believe our competitive position to be good, and the barriers to entry to be high in a significant portion of the markets we serve.
Suppliers
For significant portions of our business, we purchase raw materials and component parts from our customers or from suppliers chosen by our customers, at prices negotiated by our customers. When these suppliers increase their prices, cause delays in production schedules or fail to meet our customers’ quality standards, our customers have contractually agreed to reimburse us for the costs associated with such price increases and not to charge us for costs caused by such delays or quality issues. Accordingly, our risks are largely limited to accurate inspections of such materials, timely communications and the collection of such reimbursements or charges, along with any additional costs incurred by us due to delays in, interruptions of, or non-optimal scheduling of, production schedules. However, for a growing part of our business, we arrange our own suppliers and assume the additional risks of price increases, quality concerns and production delays.
Raw steel and fabricated steel parts are a major component of our cost of sales and net revenue for the truck components and assemblies business. We purchase a significant portion of our steel for use in this business at the direction of our customers, with any periodic changes in the price of steel being reflected in the prices we are paid for our services. Increases in the costs of steel or other supplies can increase our working capital requirements, scrap expenses and borrowing costs.
There can be no assurance that supply interruptions or price increases will not slow production, delay shipments to our customers or increase costs in the future, any of which could adversely affect our financial results. Delays, interruptions or non-optimal scheduling of production related to interruptions in raw materials supplies can be expected to increase our costs.
Research and Development
Our research and development activities are mainly related to our product lines that serve the aerospace and defense electronics market. Process improvement expenditures related to our outsourced services are not reflected in research and development expense. Accordingly, our research and development expense represents a relatively small, but growing, percentage of our net revenue. We invested $3.4 million and $3.2 million in research and development in 2011 and 2010, respectively.
Patents, Trademarks and Licenses
We own and are licensed under a number of patents and trademarks, however our business as a whole is not materially dependent upon any one patent, trademark, license or technologically related group of patents or licenses.
We regard our manufacturing processes and certain designs as proprietary trade secrets and confidential information. We rely largely upon a combination of trade secret laws, non-disclosure agreements with customers, suppliers and consultants, and our internal security systems, confidentiality procedures and employee confidentiality agreements to maintain the trade secrecy of our designs and manufacturing processes.
Government Regulation
Our operations are subject to compliance with regulatory requirements of federal, state and local authorities, both in the U.S. and in Mexico, including regulations concerning financial reporting and controls, labor relations, minimum pension funding levels, export and import matters, health and safety matters and protection of the environment. While compliance with applicable regulations has not adversely affected our operations in the

7
past, there can be no assurance that we will continue to be in compliance in the future or that these regulations will not change or that the costs of compliance will not be material to us.
We must comply with detailed government procurement and contracting regulations and with U.S. Government security regulations, certain of which carry substantial penalty provisions for nonperformance or misrepresentation in the course of negotiations. Our failure to comply with our government procurement, contracting or security obligations could result in penalties or our suspension or debarment from government contracting, which would have a material adverse effect on our consolidated results of operations.
We are required to maintain U.S. Government security clearances in connection with certain activities of our Electronics Group. These clearances could be suspended or revoked if we were found not to be in compliance with applicable security regulations. Any such revocation or suspension would delay our delivery of products to customers. Although we have adopted policies directed at ensuring our compliance with applicable regulations, and there have been no suspensions or revocations at our facilities, there can be no assurance that the approved status of our facilities or personnel will continue without interruption.
We are also subject to comprehensive and changing federal, state and local environmental requirements, both in the U.S. and in Mexico, including those governing discharges to air and water, the handling and disposal of solid and hazardous wastes and the remediation of contamination associated with releases of hazardous substances. We use hazardous substances in our operations and, as is the case with manufacturers in general, if a release of hazardous substances occurs on or from any properties that we may own or operate, we may be held liable and may be required to pay the cost of remedying the condition. The amount of any resulting liability could be material.
Employees
As of December 31, 2011, we had a total of 1,360 employees, of which 1,078 of our employees are engaged in manufacturing and providing our technical services, 19 are engaged in sales and marketing, 106 are engaged in engineering and 157 engaged in administration. Approximately 627 of our employees are covered by collective bargaining agreements with various unions that expire on various dates through 2013. Excluding certain Mexico employees covered under an annually ratified agreement, there are no collective bargaining agreements expiring within the next 12 months. Although we believe overall that our relations with our labor unions are positive, there can be no assurance that present and future issues with our unions will be resolved favorably, that negotiations will be successful or that we will not experience a work stoppage, which could adversely affect our consolidated results of operations.
Internet Access
Copies of our Annual Report on Form 10-K, Quarterly Reports on Form 10-Q, Current Reports on Form 8-K, and amendments to these reports filed or furnished pursuant to Section 13(a) or 15(d) of the Securities Exchange Act of 1934 are available free of charge through our website (www.sypris.com) as soon as reasonably practicable after we electronically file the material with, or furnish it to, the Securities and Exchange Commission.

8
Item 1A. Risk Factors
Risks Related to Our Business and Forward-Looking Statements
This annual report, and our other oral or written communications, may contain “forward-looking” statements. These statements may include our expectations or projections about the future of our industries, business strategies, potential acquisitions or financial results and our views about developments beyond our control including domestic or global economic conditions, trends and market forces. These statements are based on management’s views and assumptions at the time originally made and we undertake no obligation to update these statements, even if, for example, they remain available on our website after our outlook has changed. There can be no assurance that our expectations, projections or views will come to pass, and you should not place undue reliance on these forward-looking statements.
A number of significant risk factors could materially affect our specific business operations, and cause our performance to differ materially from any future results projected or implied by our prior statements, including those described below. Many of these risk factors are also identified in connection with the more specific descriptions contained throughout this report.
Customers
We need to generate new business revenues supported by a sustainable competitive advantage.
Our businesses generally require a higher level of new business revenues in order to operate profitably. Unless we can develop and offer new products and services with a sustainable competitive advantage, we may be unable to maintain the critical mass of capital investments or talented employees that are needed to succeed in our chosen markets. In the truck components and assemblies markets, our revenues are highly dependent upon the overall demand for new vehicles. In the aerospace and defense markets, our revenues are highly dependent upon new product development, effective marketing and sales activities, the development of additional profitable capacity (especially in our space engineering programs) and the profitable management of our legacy products and services.
Customer contracts could be less profitable than expected.
We generally bear the risk that our contracts could be unprofitable or less profitable than planned, despite our estimates of revenues and future costs to complete such contracts.
A material portion of our business is conducted under multi-year contracts, which generally include fixed prices or periodic price reductions without minimum purchase requirements. Over time, our revenues may not cover our increasing operating costs which could adversely impact our results. Our financial results are at greater risk when we accept contractual responsibility for raw material or component prices, when we cannot offset price reductions and cost increases with operating efficiencies or other savings, when we must submit contract bid prices before all key design elements are finalized or when we are subjected to other competitive pressures which erode our margins. The profitability of our contracts also can be adversely affected by unexpected start-up costs on new programs, operating inefficiencies, ineffective capital investments, inflationary pressures or inaccurate forecasts of future unit costs.
In the past, we have signed long-term supply agreements with DHC and Meritor and acquired their facilities in Morganton, North Carolina and Toluca, Mexico, among other manufacturing assets. Although most of these acquired facilities have well-established product markets, these customers or their products may not continue to be successful, product enhancements may not be made in a timely fashion, our long-term pricing agreements could generate lower margins than anticipated and there can be no assurance that we will successfully restructure or integrate these operations. Our efforts to restructure, relocate and consolidate a significant number of the operations in these plants could cause certain of these facilities to operate at underutilized levels which could materially adversely affect our business, results of operations and financial condition.
Unexpected changes in our customers’ demand levels have harmed our operating results in the past and could do so in the future. Many of our customers will not commit to firm production or delivery schedules. Disagreements over pricing, quality, delivery, capacity, exclusivity or trade credit terms could disrupt order
9
schedules. Orders also fluctuate due to changing global capacity and demand, new products, changes in market share, reorganizations or bankruptcies, material shortages, labor disputes or other factors that discourage outsourcing. These forces could increase, decrease, accelerate, delay or cancel our delivery schedules.
Inaccurate forecasting of our customers’ requirements can disrupt the efficient utilization of our manufacturing capacity, inventories or workforce. If we lose anticipated revenues, we might not succeed in redeploying our substantial capital investment and other fixed costs, potentially forcing additional plant closures, impairments of long-lived and other assets or increased losses. If we receive unanticipated orders or rapid increases in demand, these incremental volumes could be unprofitable due to the higher costs of operating above our optimal capacity.
We depend on a few key customers in challenging industries for most of our revenues.
Our five largest customers in 2011 were DHC, Meritor, Sistemas, Northrup Grumman and Eaton, collectively accounting for 77% of net revenue. Our five largest customers in 2010 were DHC, Meritor, Honeywell, Lockheed Martin and Sistemas, collectively accounting for 73% of net revenue. In addition, U.S. governmental agencies accounted for 9% and 12% of net revenue in 2011 and 2010, respectively. The truck components and assemblies industry has experienced credit risk, highly cyclical market demand, labor unrest, rising steel costs, bankruptcy and other obstacles, while the aerospace and defense electronics industry has seen consolidation, increased competition, disruptive new technologies and uncertain funding.
We depend on the continued growth and financial stability of these customers and our core markets, as well as general economic conditions. Adverse changes affecting these customers, markets or general conditions could harm our operating results. The truck components and assemblies market is highly cyclical, due in part to regulatory deadlines, the availability or scarcity of available credit, fluctuations in oil prices and pent-up demand for replacement vehicles.
Rising costs of steel or component parts could increase our inventory and working capital levels and present challenges to our customers who seek to pass those costs on to their customers. Many of our customers’ labor disputes, financial difficulties and restructuring needs have created rising uncertainty and risk, which could increase our costs or impair our business model.
The aerospace and defense industry is pressured by cyclicality, rapid technological change, shortening product life cycles, decreasing margins, unpredictable funding levels and government procurement and certification processes. Our aerospace and defense business faces an aging portfolio of legacy products and services which must be replenished with new technologies if we are to successfully maintain or expand our market shares. Our failure to address any of these factors, particularly in our secured electronic communications or space engineering programs, could impair our business model.
There can be no assurance that any of our customers will not default on, delay or dispute payment of, or seek to reject our outstanding invoices in bankruptcy or otherwise.
Congressional budgetary constraints or reallocations can reduce our government sales.
Our Electronics Group sells manufacturing services and products to a number of U.S. government agencies, which in the aggregate represented approximately 9% and 12% of our net revenue in 2011 and 2010, respectively. We also serve as a contractor for large aerospace and defense companies such as Lockheed Martin, Northrop Grumman and Raytheon, typically under federally funded programs, which represented approximately 4% and 6% of net revenue in 2011 and 2010, respectively.
Our government contracts have many inherent risks that could adversely impact our financial results. These contracts depend upon the continuing availability of Congressional appropriations. The budget appropriations process in the United States Congress has at times become highly politicized and unpredictable, including the growing use of “continuing resolutions” as a temporary approach to the resolution of disputes over funding levels. Future levels of governmental spending, including delays, declines or reallocations in the funding of certain programs could adversely affect our financial results, if we are unable to offset these changes with new business or cost reductions.

10
Suppliers
Interruptions in the supply of key components could disrupt production.
Some of our manufacturing services or products require one or more components that are available from a limited number of providers or from sole-source providers. In the past, some of the materials we use, including steel, certain forgings or castings, capacitors and memory and logic devices, have been subject to industry-wide shortages or capacity allocations. As a result, suppliers have been forced to allocate available quantities among their customers, and we have not been able to obtain all of the materials desired. Some of our suppliers have struggled to implement reliable quality control systems which can negatively impact our operating efficiency and financial results. In downward business cycles, the tightening of credit markets has threatened the financial viability of an increasing number of suppliers of key components and raw materials, and forced unanticipated shutdowns. Our inability to reliably obtain these or any other materials when and as needed could slow production or assembly, delay shipments to our customers, impair the recovery of our fixed costs and increase the costs of recovering to customers’ schedules, including overtime, expedited freight, equipment maintenance, operating inefficiencies, higher working capital and the obsolescence risks associated with larger buffer inventories. Each of these factors could reduce operating results.
Shortages or increased costs of utilities could harm our business and our customers.
We and our customers depend on a constant supply of electricity and natural gas from utility providers for the operation of our respective businesses and facilities. In the past, we have experienced power outages which reduced our ability to deliver products and meet our customers’ demand for those products. If we or our customers experience future interruptions in service from these providers, our production and/or delivery of products could be negatively affected. Additionally, due to the heavy consumption of energy in our production process and the businesses of our customers, if the cost of energy significantly increases, our results of operations, and those of our customers, could be negatively impacted.
Execution
Contract terminations or delays could harm our business.
We often provide manufacturing services and products under contracts that contain detailed specifications, quality standards and other terms. If we are unable to perform in accordance with such terms, our customers might seek to terminate such contracts, demand price concessions or other financial consideration or downgrade our past performance rating, an increasingly critical factor in federal procurement competitions. Moreover, many of our contracts are subject to termination for convenience or upon default. These provisions could provide only limited recoveries of certain incurred costs or profits on completed work, and could impose liability for our customers’ costs in procuring undelivered items from another source. If any of our significant contracts were to be terminated or not renewed, we would lose substantial revenues and our operating results as well as prospects for future business opportunities could be adversely affected. For example our supply agreement with DHC represented approximately 54% of our revenues in 2011, and this agreement currently provides for its expiration on January 1, 2015, unless renewed by the parties.
We are subject to various audits, reviews and investigations, including private party “whistleblower” lawsuits, relating to our compliance with federal and state laws. Should our business be charged with wrongdoing, or determined not to be a “presently responsible contractor,” we could be temporarily suspended or debarred for up to three or more years from receiving new government contracts or government-approved subcontracts.
We must operate more efficiently, or our results could suffer.
If we are unable to improve the cost, efficiency and yield of our operations, our costs could increase and our financial results could suffer. A number of major obstacles could include: the loss of substantial revenues due to a sluggish economic recovery; inflationary pressures; increased borrowing due to declining sales, changes in anticipated product mix and the associated variances in our profit margins; efforts to increase our manufacturing capacity and launch new programs; efforts to migrate, restructure or move business operations from one location to another; the breakdown of critical machinery or equipment; the need to identify and eliminate our root causes of scrap; our ability to achieve expected annual savings or other synergies from past and future business combinations;

11
inventory risks due to shifts in market demand; obsolescence; price erosion of raw material or component parts; shrinkage, or other factors affecting our inventory valuations; and an inability to successfully manage growth, contraction or competitive pressures in our primary markets.
Our management or systems could be inadequate to support our existing or future operations, especially as we downsize our operating staff to reduce expenses in any extended economic downturn. Growth in our business could require us to invest in additional equipment to improve our efficiency. We may have limited experience or expertise in installing or operating such equipment, which could negatively impact our ability to deliver products on time or with acceptable costs. In addition, a material portion of our manufacturing equipment requires significant maintenance to operate effectively and we may experience maintenance and repair issues. Our efforts to restructure, relocate and consolidate a significant number of the operations, especially in our truck component manufacturing plants, could cause certain of these facilities to operate at underutilized levels, which could materially adversely affect our business, results of operations and financial condition. In our electronics business, the risk of technical failures, nonconformance with customer specifications, an inability to deliver next generation products or other quality concerns could materially impair our operating results.
Our growth strategies could be ineffective due to the risks associated with further acquisitions.
Our growth strategy has included acquiring complementary businesses. We could fail to identify, finance or complete suitable acquisitions on acceptable terms and prices. Acquisition efforts could increase a number of risks, including: diversion of management’s attention; difficulties in integrating systems, operations and cultures; potential loss of key employees and customers of the acquired companies; lack of experience operating in the geographic market of the acquired business; an increase in our expenses and working capital requirements; risks of entering into markets or producing products where we have limited or no experience, including difficulties in integrating purchased technologies and products with our technologies and products; our ability to improve productivity and implement cost reductions; our ability to secure collective bargaining agreements with employees; and exposure to unanticipated liabilities.
Our discovery of, or failure to discover, material issues during due diligence investigations of acquisition targets, either before closing with regard to potential risks of the acquired operations, or after closing with regard to the timely discovery of breaches of representations or warranties, or of certain indemnified environmental conditions, could seriously harm our business.
Competition
Increasing competition could limit or reduce our market share.
We operate in highly competitive environments that include our customers’ internal capabilities. We believe that the principal competitive factors in our markets include the availability of manufacturing capacity, technological strength, speed and flexibility in responding to design or schedule changes, price, quality, delivery, cost management and financial strength. Our earnings could decline if our competitors or customers can provide comparable speed and quality at a lower cost, or if we fail to adequately invest in the range and quality of manufacturing services and products our customers require.
Some of our competitors have greater financial and organizational resources, customer bases and brand recognition than we do. As a result, our competitors may respond more quickly to technological changes or customer needs, consume lower fixed and variable unit costs, negotiate reduced component prices, and obtain better terms for financing growth. If we fail to compete in any of these areas, we may lose market share and our business could be seriously harmed. There can be no assurance that we will not experience increased competition or that we will be able to maintain our profitability if our competitive environment changes.
Our technologies could become obsolete, reducing our revenues and profitability.
The markets for our products and services are characterized by changing technology and continuing process development. The future of our business will depend in large part upon the continuing relevance of our technological capabilities. We could fail to make required capital investments, develop or successfully market services and products that meet changing customer needs and anticipate or respond to technological changes in a cost-effective and timely manner. Our inability to successfully launch or sustain new or next generation programs

12
or product features, especially in accordance with budgets or committed delivery schedules could materially adversely affect our financial results. We could encounter competition from new or revised technologies that render our technologies and equipment less profitable or obsolete in our chosen markets, and our operating results may suffer.
Access to Capital
An inability to obtain favorable financing could impair our growth.
Our operating results could be materially adversely impacted by the costs and supply of debt, equity capital or insurance. Our future liquidity and capital requirements are difficult to predict because they depend on numerous factors, including the pace at which we grow our business and acquire new facilities or the loss of anticipated revenues due to the effects of any extended economic downturn. One method we have used to obtain multi-year supply agreements is to buy a customer’s non-core manufacturing assets and produce products for them. We may need to raise substantial additional funds in order to grow this business. We cannot be certain that we will be able to obtain additional financing on favorable terms or at all. Additional equity financing could result in dilution to existing holders. If additional financing is obtained in the form of debt, the terms of the debt could place restrictions on our ability to operate or increase the financial risk of our capital structure. Our ability to borrow under our current credit facility is conditioned upon our compliance with various financial covenants. We could lose our access to such financing if we experience adverse changes in our operations, poor financial results, increased risk profiles of our businesses, declines in our credit ratings, any actual or alleged breach of our debt covenants, insurance conditions or similar agreements or any adverse regulatory developments. In any extended economic downturn, we may need to raise capital through the sale of core or non-core assets or businesses and our inability to successfully do so could materially adversely impact our operating results or access to sufficient capital.
Any inability to raise additional funds as needed could impair our ability to operate and grow our business. Such financing could be subject to a number of factors, including market conditions, our operating performance and investor sentiment. These factors may make the timing, amount, terms and conditions of additional financing unattractive for us.
We may be unable to comply with the covenants in our Credit Facility.
The financial covenants in our Credit Facility require us to achieve certain financial covenants regarding cumulative quarterly fixed charge coverage ratios. The Credit Facility also contains a number of covenants that, among other things, limit or restrict our ability to dispose of assets, incur additional indebtedness, incur guarantee obligations, engage in sale and leaseback transactions, prepay other indebtedness, modify organizational documents and certain other agreements, create restrictions affecting subsidiaries, make dividends and other restricted payments, create liens, make investments, make acquisitions, engage in mergers, change the nature of our business and engage in certain transactions with affiliates. No assurances can be given that changing business, regulatory or economic conditions might not cause the Company to violate one or more covenants which could result in default or acceleration of any debt under the Facility.

13
Labor Relations
We must attract and retain qualified employees while successfully managing related costs.
Our future success in a changing business environment, including during rapid changes in the size, complexity or skills required of our workforce, will depend to a large extent upon the efforts and abilities of our executive, managerial and technical employees. The loss of key employees, especially in a recovering economic environment, could have a material adverse effect on our operations. Our future success will also require an ability to attract and retain qualified employees, especially those with engineering or production expertise in our core business lines. Labor disputes or changes in the cost of providing pension and other employee benefits, including changes in health care costs, investment returns on plan assets and discount rates used to calculate pension and related liabilities or other requirements to accelerate the level of our pension fund contributions to reduce or eliminate underfunded liabilities, could lead to increased costs or disruptions of operations in any of our business units.
Disputes with labor unions could disrupt our business plans.
We currently have collective bargaining agreements covering approximately 627 employees, or approximately 46% of total employees. We could experience a work stoppage or other disputes which could disrupt our operations or the operations of our customers and could harm our operating results.
Regulatory
Environmental, health and safety risks could expose us to potential liability.
We are subject to a variety of environmental regulations relating to the use, storage, discharge and disposal of hazardous chemicals and substances used in our operations. If we fail to comply with present or future regulations, we could be forced to alter, suspend or discontinue our manufacturing processes, and pay substantial fines or penalties.
Groundwater and other contamination has occurred at certain of our current and former facilities during the operation of those facilities by their former owners, and this contamination may occur at future facilities we operate or acquire. There is no assurance that environmental indemnification agreements we have secured from former owners of these properties will be adequate to protect us from liability.
Our Marion, Ohio facility is subject to soil and groundwater contamination involving petroleum compounds, semi-volatile and volatile organic compounds, certain metals, PCBs and other contaminants, some of which exceed the state voluntary action program standards applicable to the site. We continue to test and assess this site to determine the extent of this contamination by the prior owners of the facility. Under our purchase agreement for this facility, DHC has agreed to indemnify us for, among other things, certain environmental conditions that existed on the site as of closing and as to which we notified Dana prior to December 31, 2002, subject to certain other conditions involving Dana’s release of, or continuing right to seek indemnity from, Eaton Corporation, from which Dana acquired the property. On April 2, 2011 we filed suit alleging contamination by Whirlpool Corporation of the groundwater beneath the Marion property. Under the Resource Conservation and Recovery Act (“RCRA”), we believe that Whirlpool is responsible for significant environmental remediation at the Marion site.
We previously acquired certain business assets formerly located at a leased facility in Littleton, Colorado, where chlorinated solvents had been disposed of on site by a prior owner of the business at the site, contaminating the groundwater at and around the site. The seller of the assets to us is operating a remediation system on the site approved by the State of Colorado and has entered into a consent order with the EPA providing for additional investigation at the site. In addition, Sypris has been contractually indemnified by the prior owners of the facility.
Our Morganton, North Carolina facility is subject to soil and groundwater contamination involving petroleum compounds, certain metals and other contaminants, some of which may exceed the State of North Carolina standards applicable to the site. The Company is aware of no current litigation, material remediation claims or other proceedings with respect to this facility.
14
Our Toluca, Mexico facility is subject to soil and groundwater contamination involving petroleum compounds and volatile organic compounds, among other concerns. We continue to test and assess this site to determine the extent of any contamination by the prior owners of the facility. Under our purchase agreement for this facility, DHC has agreed to indemnify us for, among other things, environmental conditions that existed on the site as of closing and as to which we notified Dana prior to June 30, 2006, subject to certain other conditions involving Dana’s release of, or continuing right to seek indemnity from, Eaton Corporation, from which Dana acquired the property.
Our Kenton, Ohio facility is subject to soil and groundwater contamination involving petroleum compounds, volatile organic compounds, certain metals, PCBs and other contaminants. Under our purchase agreement for this facility, Meritor Heavy Vehicle Systems agreed to indemnify us for, among other things, environmental conditions that existed on the site as of closing and as to which we notified Meritor prior to May 2, 2006. The facility was subsequently sold in January of 2012.
Our business is also subject to potential liabilities with respect to health and safety matters. We are required to comply with federal, state, local and foreign laws and regulations governing the health and safety of our workforce, and we could be held liable for damages arising out of human exposure to hazardous substances or other dangerous working conditions. Health and safety laws and regulations are complex and change frequently. As a result, our future costs to comply with such laws or the liabilities incurred in the event of any violations may increase significantly.
Adverse regulatory developments or litigation could harm our business.
Our businesses operate in heavily regulated environments. We must successfully manage the risk of changes in or adverse actions under applicable law or in our regulatory authorizations, licenses and permits, governmental security clearances or other legal rights to operate our businesses, to manage our work force or to import and export goods and services as needed. Our business activities expose us to the risks of litigation with respect to our customers, suppliers, creditors, stockholders or from product liability, environmental or asbestos-related matters. Potential liabilities associated with discontinued operations, including post-closing indemnifications or claims related to business or asset dispositions could adversely affect our financial results. We also face the risk of other adverse regulatory actions, compliance costs or governmental sanctions, as well as the costs and risks related to our ongoing efforts to design and implement effective internal controls.
Other Risks
We face other factors which could seriously disrupt our operations.
Many other risk factors beyond our control could seriously disrupt our operations, including: risks relating to war, future terrorist activities, computer hacking or other cyber attacks, political uncertainties or natural disasters which could shut down our domestic or foreign facilities, disrupt transportation of products or supplies, increase the costs under our self insurance program or change the timing and availability of funding in our aerospace and defense electronics markets; risks inherent in operating abroad, including foreign currency exchange rates, adverse regulatory developments, and miscommunications or errors due to inaccurate foreign language translations or currency exchange rates; risks relating to natural disasters or other casualties; or our failure to anticipate or to adequately insure against other risks and uncertainties present in our businesses including unknown or unidentified risks.
Item 1B. Unresolved Staff Comments
None.

15
Item 2. Properties
Our principal manufacturing services operations are engaged in electronics manufacturing services for our aerospace and defense customers and industrial manufacturing services for our truck components and assemblies customers. The following chart indicates the significant facilities that we own or lease, the location and size of each such facility and the manufacturing certifications that each facility possesses. The facilities listed below (other than the corporate office) are used principally as manufacturing facilities.
Location Market Served Own or Lease (Expiration)
Approximate Square Feet Certifications
Corporate Office:
Louisville, Kentucky Lease (2014) 21,600
Manufacturing and Service Facilities:
Louisville, Kentucky Truck Components & Assemblies;
Specialty Closures
Own 450,000 QS 9000 TS 16949
Morganton, North Carolina Truck Components & Assemblies
Own 360,000 TS 16949 ISO 14001
Tampa, Florida Aerospace & Defense Electronics
Lease (2016) 318,000 ISO 9001 ISO 14001 AS 9100
NASA-STD-8739 IPC-A-610, Rev D,
Class 3 J-STD-001, Rev D,
Class 3 CMMI Level 3
Toluca, Mexico Truck Components & Assemblies
Own 217,000 TS 16949
In addition, we lease space in one other facility in Copenhagen, Denmark, which is utilized as a sales office for our Electronics Group.
Below is a listing and description of the various manufacturing certifications or specifications that we utilize at our facilities.
Certification/Specification Description
AS 9100 ............................ A quality management system developed by the aerospace industry to measure supplier conformance with basic common acceptable aerospace quality requirements.
IPC-A-610 ........................ A certification process for electronics assembly manufacturing which describes materials, methods and verification criteria for producing high quality electronic products. Class 3 specifically includes high performance or performance-on-demand products where equipment downtime cannot be tolerated, end-use environment may be uncommonly harsh, and the equipment must function when required.
J-STD-001 ........................ A family of voluntary standards of industry-accepted workmanship criteria for electronics assemblies.

16
CMMI Level-3 ................. An internationally recognized measure of an organization’s engineering process maturity.
ISO 9001 .......................... A certification process comprised of quality system requirements to ensure quality in the areas of design, development, production, installation and servicing of products.
ISO 14001 ........................ A family of voluntary standards and guidance documents defining specific requirements for an Environmental Management System.
NASA-STD-8739 ............. A specification for space programs designated by the National Aeronautics and Space Administration.
QS 9000 ............................ A certification process developed by the nation’s major automakers that focuses on continuous improvement, defect reduction, variation reduction and elimination of waste.
TS 16949 ……………….A quality certification system developed within the automotive sector. Using ISO 9001:2000 as its foundation, ISO/TS 16949:2002 specifies the quality management system (QMS) requirements for the design, development, production, installation and servicing of automotive related products.
Item 3. Legal Proceedings
We are involved from time to time in routine litigation and other legal or environmental proceedings incidental to our business. There are currently no material pending legal proceedings to which we are a party. Ongoing environmental matters include the following:
Our Marion, Ohio facility is subject to soil and groundwater contamination involving petroleum compounds, semi-volatile and volatile organic compounds, certain metals, PCBs and other contaminants, some of which exceed the State of Ohio voluntary action program standards applicable to the site. Under our purchase agreement for this facility, DHC has agreed to indemnify us for, among other things, environmental conditions that existed on the site as of closing and as to which we notified Dana prior to December 31, 2002, to the extent of any indemnification owed to DHC by Eaton Corporation (Eaton) or any other matters for which DHC has released Eaton. On April 2, 2011 we filed suit alleging contamination by Whirlpool Corporation of the groundwater beneath the Marion property, under Resource Conservation and Recovery Act (“RCRA”). We seek injunctive relief, declaratory relief, damages, costs, expenses, and attorneys’ fees as a result of Whirlpool’s RCRA violation.
In December 1992, we acquired certain business assets formerly located at a leased facility in Littleton, Colorado. Certain chlorinated solvents disposed of on the site by Honeywell, a previous owner of the business, have contaminated the groundwater at and around the site. Alliant Techsystems, from which we acquired the business assets, operates a remediation system approved by the State of Colorado and has also entered into a consent order with the EPA providing for additional investigation at the site. Alliant Techsystems has agreed to indemnify us with respect to these matters.
Our Morganton, North Carolina facility is subject to soil and groundwater contamination involving petroleum compounds, certain metals and other contaminants, some of which exceed the State of North Carolina notification standards applicable to the site. No litigation or other proceedings are underway with respect to this site.
Our Toluca, Mexico facility is subject to soil and groundwater contamination involving petroleum compounds and volatile organic compounds, among other concerns. Under our purchase agreement for this facility, DHC has agreed to indemnify us for, among other things, environmental conditions that existed on the site as of closing and as to which we notified Dana prior to June 30, 2006, to the

17
extent of any indemnification owed to DHC by Eaton or any other matters for which DHC has released Eaton.
Our Kenton, Ohio facility is subject to soil and groundwater contamination involving petroleum compounds, volatile organic compounds, certain metals, PCBs and other contaminants. Under our purchase agreement for this facility, Meritor Heavy Vehicle Systems has agreed to indemnify us for, among other things, environmental conditions that existed on the site as of closing and as to which we notified Meritor prior to May 2, 2006. The facility was subsequently sold in January of 2012.
Item 4. Mine Safety Disclosures
Not applicable.
18
PART II
Item 5. Market for the Registrant’s Common Equity, Related Stockholder Matters and Issuer Purchases of Equity Securities
We are a smaller reporting company as defined in Item 10(f)(1) of Regulation S-K and thus are not required to provide the Performance graph required in paragraph (e) of Item 201 of Regulation S-K.
Our common stock is traded on the NASDAQ Global Market under the symbol “SYPR.” The following table sets forth, for the periods indicated, the high and low closing sale prices per share of our common stock as reported by the NASDAQ Global Market.
High Low Year ended December 31, 2010:
First Quarter ...................................................................................... $ 3.37 $ 2.55 Second Quarter ................................................................................. 4.87 3.40 Third Quarter .................................................................................... 4.19 3.05 Fourth Quarter .................................................................................. 4.37 3.06
Year ended December 31, 2011: First Quarter ...................................................................................... $ 5.63 $ 3.74 Second Quarter ................................................................................. 5.04 3.56 Third Quarter .................................................................................... 4.25 2.90 Fourth Quarter .................................................................................. 4.21 2.85
As of March 5, 2012, there were 773 holders of record of our common stock. No cash dividends were declared during 2011 or 2010.
Dividends may be paid on common stock only when, as and if declared by our Board of Directors in its sole discretion. The Company’s Credit Facility contains restrictions related to dividend payments, as further described in “Management’s Discussion and Analysis of Financial Condition and Results of Operations–Liquidity” below.
Item 6. Selected Financial Data
We are a smaller reporting company as defined in Item 10(f)(1) of Regulation S-K and thus are not required to report the selected financial data in Item 301 of Regulation S-K.

19
Item 7. Management’s Discussion and Analysis of Financial Condition and Results of Operations
The following discussion of our consolidated results of operations and financial condition should be read together with the other financial information and consolidated financial statements included in this Annual Report on Form 10-K. This discussion contains forward-looking statements that involve risks and uncertainties. Our actual results could differ materially from the results anticipated in the forward-looking statements as a result of a variety of factors, including those discussed in “Risk Factors” and elsewhere in this Annual Report on Form 10-K.
Overview
We are a diversified provider of outsourced services and specialty products. We perform a wide range of manufacturing, engineering, design, testing and other technical services, typically under multi-year, sole-source contracts with major companies and government agencies in the markets for industrial manufacturing and aerospace and defense electronics.
We are organized into two business groups, the Industrial Group and the Electronics Group. The Industrial Group is comprised of Sypris Technologies, Inc. and its subsidiaries, which generates revenue primarily from the sale of manufacturing services to customers in the market for truck components and assemblies and from the sale of products to the energy and chemical markets. The Electronics Group is comprised of Sypris Electronics, LLC and its subsidiary, which generates revenue primarily from the sale of manufacturing services, technical services and products to customers in the market for aerospace and defense electronics.
We focus on those markets where we have the expertise, qualifications and leadership position to sustain a competitive advantage. We target our resources to support the needs of industry leaders that embrace multi-year contractual relationships as a strategic component of their supply chain management. These contracts, many of which are sole-source by part number and are for terms of up to five years, enable us to invest in leading-edge processes or technologies to help our customers remain competitive. The productivity, flexibility and economies of scale that can result offer an important opportunity for differentiating ourselves from the competition when it comes to cost, quality, reliability and customer service.
During the past three years, we have significantly improved our financial condition by reducing fixed costs, accelerating integration efficiencies, exiting certain unprofitable product lines, selling idle assets, reducing debt and entering into a new, more favorable debt facility.
While the commercial vehicle and trailer markets continue to rebound from historic lows within our Industrial Group, we continue to face challenges within our Electronics Group, such as the uncertainty in the worldwide macroeconomic climate and its impact on aerospace and defense spending patterns globally, as well as federal government spending in the U.S.
The U.S. Government's continued focus on addressing federal budget deficits and the growing national debt suggests a changing environment for the Electronics Group. Although defense spending is expected to remain a national priority within the federal budget, a fiscally constrained environment could prompt the government to seek additional deficit reduction by moderating discretionary spending, of which defense constitutes the majority share.
The Administration and Congress are engaged in vigorous discussion over alternative approaches to reduce the federal deficit and curtail spending. Some revision to current national security spending could emerge in forthcoming budget plans and appropriations as these negotiations continue. There can be no assurance at this time regarding when and how this matter will be resolved or its effects on the overall U.S. economy or federal budgets. In this context, the Department of Defense is currently conducting a strategic review intended to guide its budgeting decisions. Our Company awaits the results of this review, as well as the outcomes of the broader federal budget discussion, as these decisions are expected to shape planning directions across the industry.

20
Critical Accounting Policies and Estimates
The preparation of the consolidated financial statements and accompanying notes in conformity with U.S. generally accepted accounting principles requires that we make estimates and assumptions that affect the amounts reported. Changes in facts and circumstances could have a significant impact on the resulting estimated amounts included in our consolidated financial statements. We believe the following critical accounting policies affect our more complex judgments and estimates. We also have other policies that we consider to be key accounting policies, such as our policies for revenue recognition in the Industrial Group, including cost of sales; however, these policies do not meet the definition of critical accounting policies because they do not generally require us to make estimates or judgments that are difficult or subjective.
Allowance for Doubtful Accounts. We establish reserves for uncollectible accounts receivable based on overall receivable aging levels, a specific evaluation of accounts for customers with known financial difficulties and evaluation of customer chargebacks, if any. These reserves and corresponding write-offs could significantly increase if our customers experience deteriorating financial results or in the event we receive a significant chargeback, which is deemed uncollectible.
Goodwill. Goodwill is tested for impairment annually as of December 31 or more frequently if events occur or circumstances change that would warrant such a review. The Company assesses recoverability using a discounted cash flow analysis and comparisons of multiples of enterprise values to earnings before interest, taxes, depreciation and amortization (EBITDA). The analysis is based upon available information regarding expected future cash flows of each reporting unit discounted at rates consistent with the cost of capital specific to the reporting unit. A growth rate is used to calculate the terminal value of the reporting unit and is added to the present value of the forecasted cash flows. The growth rate is the expected rate at which a reporting unit’s cash flow is projected to grow beyond the period covered by the long-range plan. The cash flow analysis requires significant judgment in our evaluation of the business and establishing an appropriate discount rate and terminal value to apply in the calculation. In selecting these and other assumptions for each business, we consider historical performance, forecasted operating results, expected changes in product mix, general market conditions and industry considerations specific to the business. We make significant assumptions and estimates about the extent and timing of future cash flows, growth rates and discount rates. The cash flows are estimated over a future period of time, which makes those estimates and assumptions inherently subject to a high degree of potential uncertainty. The sum of the calculated fair values of each reporting unit is then reconciled and compared to our total market capitalization, allowing for a reasonable control premium. If the discounted cash flow analysis yields a fair value estimate less than the reporting unit’s carrying value, we proceed to step two of the impairment process. In the second step, the implied fair value of the reporting unit’s goodwill is determined by allocating the reporting unit’s fair value to all of the assets and liabilities of the reporting unit.
As a result of the first step of the goodwill impairment analysis performed as of December 31, 2011, the fair value estimate for the Electronics Group, which is our only reporting unit with goodwill, exceeded its carrying value by approximately 27%. Therefore the second step was not necessary. Key assumptions used to determine the fair value estimate of our Electronics Group were the expected after-tax cash flows for the period from 2012 to 2014, which include projected improvements in operating margins, a terminal growth rate of 3.0% and a weighted average cost of capital of 17.0%. The terminal rate is consistent with the prior year growth rate of 3.0%. Our analysis included a comparison of our market capitalization to the fair value of the entire enterprise. These and other estimates and assumptions are impacted by economic conditions and expectations of management and may change in the future based on period-specific facts and circumstances.
We believe that the assumptions and estimates used to determine the fair value of our reporting unit were reasonable. However, different assumptions could materially affect the results. If the Electronics Group’s future cash flows are different than those projected by management, future impairment charges may be required. The Company will continue to monitor the performance of the Electronics Group, the performance of the overall aerospace and defense industry and the Company’s market capitalization.
Net Revenue and Cost of Sales. Net revenue of products and services under commercial terms and conditions are recorded upon delivery and passage of title, or when services are rendered. Related shipping and handling costs, if any, are included in costs of sales.

21
Net revenue under long-term, fixed-price contracts with aerospace and defense companies and agencies of the U.S. Government is recognized upon shipment. Contract profits are taken into earnings based on actual cost of sales for units shipped. Amounts representing contract change orders or claims are included in revenue when such costs are invoiced to the customer.
Long-lived asset impairment. We perform periodic impairment analysis on our long-lived amortizable assets whenever events or circumstances indicate that the carrying amount of such assets may not be recoverable. When indicators are present, we compare the estimated future undiscounted net cash flows of the operations to which the assets relate to their carrying amount. If the operations are determined to be unable to recover the carrying amount of their assets, the long-lived assets are written down to their estimated fair value. Fair value is determined based on discounted cash flows, third party appraisals or other methods that provide appropriate estimates of value. A considerable amount of management judgment and assumptions are required in performing the impairment test, principally in determining whether an adverse event or circumstance has triggered the need for an impairment review. We recorded immaterial amounts of impairment charges in 2010 and 2011. While we believe our judgments and assumptions were reasonable, changes in assumptions underlying these estimates could result in a material impact to our consolidated financial statements in any given period.
Pension Plan Funded Status. The calculation of pension assets and liabilities involve complex estimation processes dependent on assumptions developed by us in consultation with our outside advisors such as actuaries. The assumptions used, including discount rates and return on plan assets, have a significant impact on plan expenses and obligations. Changes in these rates could significantly impact the actuarially determined amounts recorded in the statements of financial position. If actual experience differs from expectations, our financial position and results of operations in future periods could be affected. See Note 18 to the consolidated financial statements for further details.
A change in the assumed pension discount rate of 25 basis points would result in a change in our pension obligation as of December 31, 2011 of approximately $1.1 million. A 25 basis point change in the assumed rate of return would change the estimated 2012 pension expense by approximately $0.1 million.
Discount rates are based upon the construction of a theoretical bond portfolio, adjusted according to the timing of expected cash flows for the future obligations. A yield curve is based on a subset of these fixed income investments. The projected cash flows are matched to this yield curve and a present value is developed which is then calibrated to develop a single equivalent discount rate. Pension benefits are funded through deposits with trustees that satisfy, at a minimum, the applicable funding regulations. Expected investment rates of return are based upon input from the plan’s investment advisors and actuary regarding our expected investment portfolio mix, historical rates of return on those assets, projected future asset class returns and long-term market conditions and inflation expectations. We believe that the long-term asset allocation on average will approximate the targeted allocation, and we regularly review the actual asset allocation to periodically rebalance the investments to the targeted allocation when appropriate.
Actuarial gains or losses may result from changes in assumptions or when actual experience is different from that expected. Under applicable standards, those gains and losses are not required to be immediately recognized as expense, but instead may be deferred as part of accumulated other comprehensive income and amortized into expense over future periods.
Reserve for Excess, Obsolete and Scrap Inventory. We record inventory at the lower of cost, determined under the first-in, first-out method, or market, and we reserve for excess, obsolete or scrap inventory. These reserves are primarily based upon management’s assessment of the salability of the inventory, historical usage of raw materials, historical demand for finished goods and estimated future usage and demand. An improper assessment of salability or improper estimate of future usage or demand, or significant changes in usage or demand could result in significant changes in the reserves and a positive or a negative impact on our consolidated results of operations in the period the change occurs.
Stock-based Compensation. We account for stock-based compensation in accordance with the fair value recognition provisions using the Black-Scholes option-pricing method, which requires the input of several subjective assumptions. These assumptions include estimating the length of time employees will retain their vested stock options before exercising them (expected term), the estimated volatility of our common stock price over the

22
expected term and the number of options that will ultimately not complete their vesting requirements (forfeitures). Changes in the subjective assumptions can materially affect the fair value estimate of stock-based compensation and consequently, the related expense recognized in the consolidated statements of operations.
Income Taxes. We account for income taxes as required by the provisions of ASC 740, Income Taxes, under which deferred tax assets and liabilities are recognized for the tax effects of temporary differences between the financial reporting and tax bases of assets and liabilities measured using enacted tax rates.
Management judgment is required in determining income tax expense and the related balance sheet amounts. In addition, under ASC 740-10, Accounting for Uncertainty in Income Taxes, judgments are required concerning the ultimate outcome of uncertain income tax positions. Actual income taxes paid may vary from estimates, depending upon changes in income tax laws, actual results of operations and the final audit of tax returns by taxing authorities. Tax assessments may arise several years after tax returns have been filed. We believe that our recorded income tax liabilities adequately provide for the probable outcome of these assessments.
Deferred tax assets are also recorded for operating losses and tax credit carryforwards. However, ASC 740 requires that a valuation allowance be recorded when it is more likely than not that some portion or all of the deferred tax assets will not be realized. This assessment is largely dependent upon projected near-term profitability including the effects of tax planning. Deferred tax assets and liabilities are determined separately for each tax jurisdiction in which we conduct our operations or otherwise incur taxable income or losses. We have recorded valuation allowances against deferred tax assets in the U.S. and Mexico where realization has been determined to be uncertain. However, our Mexican operation, which has historically generated taxable income and expects to continue to be profitable for the foreseeable future, also has certain deferred tax assets that are expected to be realized and therefore no valuation allowance has been recorded against such assets as of December 31, 2011. Since future financial results may differ from previous estimates, periodic adjustments to our valuation allowance may be necessary.

23
Results of Operations
We operate in two segments, the Industrial Group and the Electronics Group. The table presented below, which compares our segment and consolidated results of operations from one year to another, presents the results for each year, the change in those results from one year to another in both dollars and percentage change and the results for each year as a percentage of net revenue. The first two data columns in the table show the absolute results for each year presented. The columns entitled “Year Over Year Change” and “Year Over Year Percentage Change” show the change in results, both in dollars and percentages. These two columns show favorable changes as positive and unfavorable changes as negative. For example, when our net revenue increases from one year to the next, that change is shown as a positive number in both columns. Conversely, when expenses increase from one year to the next, that change is shown as a negative number in both columns. The last two columns in the table show the results for each period as a percentage of net revenue. In these two columns, the cost of sales and gross profit for each segment are given as a percentage of that segment’s net revenue. These amounts are shown in italics. In addition, as used in this table, “NM” means “not meaningful.”
Year Ended December 31, 2011 Compared to Year Ended December 31, 2010
Year Over Results as Percentage of Year Over Year Net Revenue for the Years Ended Year Percentage Years Ended December 31, Change Change December 31, Favorable Favorable 2011 2010 (Unfavorable) (Unfavorable) 2011 2010 (in thousands, except percentage data) Net revenue: Industrial Group .......................................................... $ 273,305 $ 191,154 $ 82,151 43.0% 81.4% 71.7% Electronics Group ....................................................... 62,320 75,500 (13,180) (17.5) 18.6 28.3 Total net revenue ...................................................... 335,625 266,654 68,971 25.9 100.0 100.0
Cost of sales: Industrial Group .......................................................... 245,962 182,152 (63,810) (35.0) 90.0 95.3 Electronics Group ....................................................... 54,434 59,607 5,173 8.7 87.3 78.9 Total cost of sales ..................................................... 300,396 241,759 (58,637) (24.3) 89.5 90.7
Gross profit: Industrial Group .......................................................... 27,343 9,002 18,341 203.7 10.0 4.7 Electronics Group ....................................................... 7,886 15,893 (8,007) (50.4) 12.7 21.1 Total gross profit ....................................................... 35,229 24,895 10,334 41.5 10.5 9.3
Selling, general and administrative ............................... 28,315 26,749 (1,566) (5.9) 8.4 10.0 Research and development ........................................... 3,397 3,150 (247) (7.8) 1.0 1.2 Amortization of intangible assets .................................. 102 113 11 9.7 0.0 0.0 Nonrecurring (income) expense .................................... (3,000) — 3,000 NM (0.9) — Restructuring expense, net ............................................ 231 2,296 2,065 89.9 0.1 0.9
Operating income (loss) ................................................ 6,184 (7,413) 13,597 183.4 1.9 (2.8)
Interest expense, net ...................................................... 1,732 2,379 647 27.2 0.5 0.9 Other (income) expense, net ......................................... (6,604) (1,088) 5,516 507.0 (2.0) (0.4) Income (loss) from continuing operations before
income taxes ........................................................... 11,056 (8,704) 19,760 NM 3.3 (3.3)
Income tax expense ....................................................... 2,621 1,004 (1,617) (161.1) 0.8 0.4
Income (loss) from continuing operations .................... 8,435 (9,708) 18,143 NM 2.5 (3.6) Loss from discontinued operations, net of tax .............. (528) (496) (32) (6.5) (0.1) (0.2) Net income (loss) .......................................................... $ 7,907 $ (10,204) $ 18,111 NM 2.4% (3.8)%

24
Net Revenue. The Industrial Group derives its revenue from manufacturing services and product sales. Net revenue in the Industrial Group increased $82.2 million from the prior year to $273.3 million for the year ended December 31, 2011. Increased volumes for medium and heavy-duty commercial truck components contributed to increased revenue of approximately $61.4 million. Increased volumes for trailer axle beams resulted in an $8.0 million net revenue increase. Manufacturing services for a new commercial vehicle customer resulted in increased revenue of $5.4 million. Increased sales volumes for the off-highway business contributed to increased revenue of $1.5 million. Additionally, sales of our specialty closure products increased $1.8 million. Increased steel prices, which are contractually passed through to customers under certain contracts, and pricing adjustments also contributed to increased revenue of approximately $4.1 million in 2011.
The Electronics Group derives its revenue from product sales and technical outsourced services. Net revenue in the Electronics Group decreased $13.2 million to $62.3 million in 2011. The decrease from the prior year is due in part to the completion of certain electronic manufacturing and engineering services programs and changes in product mix within our space business. The completed programs primarily consisted of circuit board assembly services provided to certain contractors for the U.S. government. Although the Electronics Group continues to provide electronic manufacturing services to U.S. prime government contractors and other subcontractors, we are pursuing those programs which align with our high reliability capabilities for aerospace and defense customers and typically involve manufacturing lower volume, higher mix components. Additionally, the Electronics Group was affected by the delayed approval by Congress of the fiscal 2011 Defense Appropriations Bill. Partially offsetting this was an increase of $5.8 million in product sales due to an increase in sales to foreign governments. Revenues for our Electronics Group are expected to remain relatively flat in 2012.
Gross Profit. The Industrial Group’s gross profit increased $18.3 million to $27.3 million in 2011 as compared to $9.0 million in the prior year. The increase in sales volume resulted in an increase in gross profit of approximately $14.3 million. Price increases resulted in an increase in gross profit of $1.4 million over the prior year. The Industrial Group also realized an increase in gross profit of $3.3 million as a result of productivity improvements. Partially offsetting this was a $0.7 million cost increase due to the strengthening of the Mexican peso as compared to the prior year and other inflationary items.
The Electronics Group’s gross profit decreased $8.0 million to $7.9 million in 2011 primarily as a result of the decline in revenue, particularly in the higher margin electronic manufacturing services business and additional engineering charges allocated to improvements in our product portfolio. The Electronics Group’s gross profit as a percentage of revenue for 2011 decreased to 12.7% from 21.1% in 2010.
Selling, General and Administrative. Selling, general and administrative expense increased $1.6 million in 2011. However, selling, general and administrative expense decreased as a percentage of revenue to 8.4% in 2011 from 10.0% in 2010. The Company has continued to limit increases in controllable general and administrative expenses as revenues have increased in its Industrial Group.
Research and Development. Research and development costs were $3.4 million and $3.2 million for the years ended December 31, 2011 and 2010, respectively, in support of the Electronics Group’s self-funded product and technology development activities.
Restructuring Expense, Net. As a result of the Company’s restructuring program, we recorded $0.2 million and $2.3 million related to these initiatives during 2011 and 2010, respectively. The charge for the year ended December 31, 2011 consisted of $0.6 million in equipment relocation costs and $0.5 million in other various charges, primarily related to mothball costs, partially offset by a $0.9 million gain on the sale of assets that had previously been impaired. The charge for the year ended December 31, 2010 consisted of $0.4 million for employee severance and benefit costs, $0.2 million in equipment relocation costs and $1.7 million in other various charges, primarily related to mothball costs associated with closed or partially closed facilities and charges related to the consolidation of two Electronics Group locations. The restructuring program is substantially complete as of December 31, 2011, and we do not expect to incur any material costs in 2012 under this restructuring program. See Note 6 to the consolidated financial statements included in this Annual Report on Form 10-K.
Nonrecurring (Income) Expense. During 2011, the Company recognized a gain of $3.0 million in connection with a settlement regarding prior year volumes with one of its customers.

25
Interest Expense, Net. Interest expense for the year ended December 31, 2011 decreased $0.6 million due to a decrease in the weighted average debt outstanding and a decrease in the weighted average interest rate, partially offset by the write-off of $0.3 million in unamortized loan costs and additional fees paid in conjunction with the repayment of our former Revolving Credit Agreement and Senior Notes. Our weighted average debt outstanding decreased to $18.1 million during 2011 from $20.2 million during 2010. The weighted average interest rate decreased to 5.6% in 2011 from 9.3% in 2010.
Other (Income) Expense, Net. Other (income) expense, net increased $5.5 million to $6.6 million for 2011 from $1.1 million in 2010. Other income for the year ended December 31, 2011 includes a gain of $3.6 million from the sale of idle assets within the Industrial Group. The Company also recognized foreign currency translation gains of $2.6 million in 2011 related to the net U.S. dollar denominated monetary asset position of our Mexican subsidiary for which the Mexican peso is the functional currency. Other income, net for the year ended December 31, 2010 includes a gain of $1.3 million from the sale of idle equipment within the Industrial Group partially offset by foreign currency translation losses of $0.7 million.
Income Taxes. The 2011 income tax provision consists of current and deferred tax expense of $2.1 million and $0.5 million, respectively. The 2010 income tax provision consists of current and deferred tax expense of $0.4 million and $0.6 million, respectively. The current tax expense in both years is primarily attributable to taxes paid by our Mexican subsidiary. Included in deferred tax expense in both years is an increase in the valuation allowance on U.S. deferred tax assets, including the transfer in 2010 of a liability and related deferred tax asset from our Mexican subsidiary to a U.S. subsidiary. Our Mexican subsidiary recognized a deferred tax benefit in both years related to the recovery of certain deferred tax assets that were previously reserved for by a valuation allowance.
Discontinued Operations. On October 26, 2009, the Company sold all of the outstanding stock of its wholly owned subsidiary, Sypris Test & Measurement, for approximately $39.0 million. In accordance with requirements of ASC 205-20-45, the results of the Test & Measurement segment have been reported as discontinued operations for all periods presented. During 2010, the Company was made aware of a potential indemnification claim from the purchaser of Sypris Test & Measurement. As of December 31, 2011, the Company estimates that its total liability arising from this claim will not exceed $1.0 million, of which $0.4 million and $0.5 million was charged to loss from discontinued operations, net of tax for the years ended December 31, 2011 and 2010, respectively. The loss from discontinued operations for the year ended December 31, 2011 also includes charges of $0.1 million for legal expenses incurred in connection with the claim. There can be no assurance that relevant facts and circumstances will not change, necessitating future changes to the estimated liability.

26
Quarterly Results
The following table presents our unaudited condensed consolidated statements of operations data for each of the eight quarters in the two-year period ended December 31, 2011. The quarterly results are presented on a 13-week period basis. We have prepared this data on the same basis as our audited consolidated financial statements and, in our opinion, have included all normal recurring adjustments necessary for a fair presentation of this information. You should read these unaudited quarterly results in conjunction with our consolidated financial statements and related notes included elsewhere in this Annual Report on Form 10-K. The consolidated results of operations for any quarter are not necessarily indicative of the results to be expected for any subsequent period.
2011 2010 First Second Third Fourth First Second Third Fourth
(in thousands, except per share data) Net revenue: Industrial Group ..................... $ 59,550 $ 68,885 $ 72,647 $ 72,223 $ 44,106 $ 46,571 $ 52,738 $ 47,739 Electronics Group .................. 16,260 16,173 18,530 11,357 18,797 16,535 20,674 19,494 Total net revenue .................... 75,810 85,058 91,177 83,580 62,903 63,106 73,412 67,233 Cost of sales: Industrial Group ..................... 54,418 61,805 65,716 64,023 41,653 44,285 50,404 45,810 Electronics Group .................. 13,244 15,142 15,198 10,850 15,482 14,229 15,783 14,113 Total cost of sales ................... 67,662 76,947 80,914 74,873 57,135 58,514 66,187 59,923 Gross profit: Industrial Group ..................... 5,132 7,080 6,931 8,200 2,453 2,286 2,334 1,929 Electronics Group .................. 3,016 1,031 3,332 507 3,315 2,306 4,891 5,381 Total gross profit .................... 8,148 8,111 10,263 8,707 5,768 4,592 7,225 7,310 Selling, general and
administrative ...................... 6,863 6,810 7,232 7,410 6,332 6,740 6,877 6,800 Research and development ....... 616 924 1,097 760 153 320 496 2,181 Amortization of
intangible assets ................... 28 28 24 22 28 28 29 28 Nonrecurring
(income) expense ................. (3,000) — — — — — — — Restructuring expense, net ....... (253) 130 356 (2) 413 1,002 626 255 Operating income (loss) ........... 3,894 219 1,554 517 (1,158) (3,498) (803) (1,954) Interest expense, net ................. 729 726 153 124 601 583 612 583 Other expense (income), net ..... 231 275 (6,489) (621) 466 (688) (177) (689) Income (loss) from continuing
operations, before tax ........... 2,934 (782) 7,890 1,014 (2,225) (3,393) (1,238) (1,848) Income tax expense (benefit) ... 432 768 1,808 (387) 199 571 457 (223) Income (loss) from continuing
operations ............................ 2,502 (1,550) 6,082 1,401 (2,424) (3,964) (1,695) (1,625) Loss from discontinued operations, net of tax ............ (450) — — (78) — (300) (196) — Net income (loss) ..................... $ 2,052 $ (1,550) $ 6,082 $ 1,323 $ (2,424) $ (4,264) $ (1,891) $ (1,625) Basic income (loss) per share:
Income (loss) per share from continuing operations ......... $ 0.13 $ (0.08) $ 0.30 $ 0.07 $ (0.13) $ (0.21) $ (0.09) $ (0.09) Loss per share from discontinued operations ..... (0.02) — — (0.00) — (0.02) (0.01) — Net income (loss) per share .. $ 0.11 $ (0.08) $ 0.30 $ 0.07 $ (0.13) $ (0.23) $ (0.10) $ (0.09)
Diluted income (loss) per share: Income (loss) per share from continuing operations ......... $ 0.12 $ (0.08) $ 0.30 $ 0.07 $ (0.13) $ (0.21) $ (0.09) $ (0.09) Loss per share from discontinued operations ..... (0.02) — — (0.00) — (0.02) (0.01) — Net income (loss) per share .. $ 0.10 $ (0.08) $ 0.30 $ 0.07 $ (0.13) $ (0.23) $ (0.10) $ (0.09)

27
Liquidity and Capital Resources
On May 12, 2011, the Company entered into a new credit facility (Credit Facility) providing total availability up to $50.0 million that supports short-term funding needs and letters of credit, which replaced the Company’s Revolving Credit Agreement and Senior Notes scheduled to mature in January 2012. Loans made under the Credit Facility will mature and the commitments thereunder will terminate in May 2016. The Credit Facility provides for an option, subject to certain conditions, to increase total availability to $60.0 million in the future.
Borrowing availability under the Credit Facility is determined by a monthly borrowing base collateral calculation that is based on specified percentages of the value of eligible accounts receivable, inventory and machinery and equipment, less certain reserves and subject to certain other adjustments. At December 31, 2011, we had total excess availability under the Credit Facility of $24.8 million along with an unrestricted cash balance of $18.2 million, which provides for total cash and available borrowing capacity of $43.0 million. Approximately $7.3 million of the unrestricted cash balance relates to our Mexican subsidiaries. Standby letters of credit up to a maximum of $5.0 million may be issued under the Credit Agreement of which $1.0 million were issued at December 31, 2011.
We also had purchase commitments totaling approximately $14.2 million at December 31, 2011, primarily for inventory and manufacturing equipment.
Obligations under the Credit Facility are guaranteed by all of our U.S. subsidiaries and are secured by a first priority lien on substantially all domestic assets of the Company.
The Credit Facility contains a number of covenants that, among other things, limit or restrict our ability to dispose of assets, incur additional indebtedness, incur guarantee obligations, engage in sale and leaseback transactions, prepay other indebtedness, modify organizational documents and certain other agreements, create restrictions affecting subsidiaries, make dividends and other restricted payments, create liens, make investments, make acquisitions, engage in mergers, change the nature of our business and engage in certain transactions with affiliates.
There are numerous risks and uncertainties relating to the global economy and the commercial vehicle and aerospace and defense industries that could materially affect our financial condition, future results of operations and liquidity. These risks and uncertainties could result in decreased sales, limited access to credit, rising costs, increased competition, customer or supplier bankruptcies, delays in customer payment terms and acceleration of supplier payments, growing inventories and failure to meet debt covenants.
As a result of a decline in the overall economy, we took significant actions throughout 2009, 2010 and 2011 to reduce our cost base and improve profitability, including various plant shutdowns and other workforce reductions. Based on our current forecast for 2012, we expect to be able to meet the financial covenants of our Credit Facility and have sufficient liquidity to finance our operations. However, changing business, regulatory and economic conditions may mean that actual results will vary from our forecasts. For more information, please refer to “Risk Factors” in Item 1A of this Annual Report on Form 10-K.
Our ability to service our indebtedness will require a significant amount of cash. Our ability to generate this cash will depend largely on future operations. Based upon our current level of operations and our 2012 business plan, we believe that cash flow from operations, available cash and available borrowings under our Credit Facility will be adequate to meet our liquidity needs for at least the next twelve months.
Financial Condition
Operating Activities. Net cash provided by operating activities of continuing operations was $17.0 million in 2011, as compared to $1.9 million in 2010. The cash flow associated with our accounts receivable and inventory during 2011 reflects the change in net revenue mix between our Industrial and Electronics Groups. The Industrial Group’s net revenue increase of $82.2 million resulted in cash investments in accounts receivable and inventory of $11.8 million and $3.3 million, respectively. The Electronics Group’s net revenue decrease of $13.2 million contributed to a decrease in accounts receivable of $10.3 million. However, inventory within the Electronics Group increased primarily as a result of the timing of shipments and used $1.0 million of cash. Accounts payable increased

28
during 2011 and provided $11.7 million primarily due to increased purchases by our Industrial Group and the timing of payments to our suppliers.
Investing Activities. Net cash used by investing activities was $1.8 million in 2011 as compared to net cash used of $0.7 million in 2010. Net cash used in investing activities included $6.8 million of capital expenditures. Additionally, the Industrial Group sold certain idle equipment during the year, which generated $5.0 million of cash. If revenues continue to increase within the Industrial Group, the Company expects capital expenditures will increase in future periods to support the growth. Net cash used in investing activities in 2010 includes capital expenditures of $2.2 million partially offset by proceeds from the sale of assets of $1.4 million.
Financing Activities. Net cash used in financing activities was $13.6 million for the year ended December 31, 2011 due to the repayment of debt under the Company’s former Revolving Credit Agreement and Senior Notes partially offset by borrowings of $10.0 million under the new Credit Facility. The Company also paid $0.4 million of deferred loan costs during the year in conjunction with the new Credit Facility. The Company’s financing activities were cash neutral in 2010.
Off-Balance Sheet Arrangements
We do not have any material off-balance sheet arrangements that have or are reasonably likely to have a current or future effect on our financial condition, changes in financial condition, revenues or expenses, results of operations, liquidity, capital expenditures or capital resources.
Recent Accounting Pronouncements
See Note 1 to our consolidated financial statements for a full description of recent accounting pronouncements, including the respective dates of adoption and effects on our results of operations and financial condition.
Item 7A. Quantitative and Qualitative Disclosures about Market Risk
We are a smaller reporting company as defined in Item 10(f)(1) of Regulation S-K and thus are not required to report the quantitative and qualitative measures of market risk specified in Item 305 of Regulation S-K.

29
Item 8. Financial Statements and Supplementary Data
SYPRIS SOLUTIONS, INC.
INDEX TO CONSOLIDATED FINANCIAL STATEMENTS
Management’s Report on Internal Control Over Financial Reporting ...................................................................... 30
Report of Independent Registered Public Accounting Firm ..................................................................................... 31
Report of Independent Registered Public Accounting Firm ..................................................................................... 32
Consolidated Statements of Operations .................................................................................................................... 33
Consolidated Balance Sheets .................................................................................................................................... 34
Consolidated Statements of Cash Flows ................................................................................................................... 35
Consolidated Statements of Stockholders’ Equity .................................................................................................... 36
Notes to Consolidated Financial Statements............................................................................................................. 37

30
MANAGEMENT’S REPORT ON INTERNAL CONTROL OVER FINANCIAL REPORTING
The management of Sypris Solutions, Inc. is responsible for establishing and maintaining adequate internal control over financial reporting, as such term is defined in Exchange Act Rules 13a-15(f) and 15d-15(f). Our internal control system was designed to provide reasonable assurance to Sypris management and its Board of Directors regarding the preparation and fair presentation of published consolidated financial statements.
All internal control systems, no matter how well designed, have inherent limitations. Therefore, even those systems determined to be effective can only provide reasonable assurance with respect to the accuracy of consolidated financial statement preparation and presentation.
Under the supervision and with participation of our management, including the Chief Executive Officer and Chief Financial Officer, we assessed the effectiveness of Sypris Solutions, Inc.’s internal control over financial reporting as of December 31, 2011. In making our assessment, we used the criteria set forth by the Committee of Sponsoring Organizations of the Treadway Commission in Internal Control – Integrated Framework. Based on our assessment, we concluded that as of December 31, 2011, Sypris’ internal control over financial reporting is effective based on these criteria.
Ernst & Young LLP, our independent auditors and a registered public accounting firm, has audited and reported on the consolidated financial statements of Sypris Solutions, Inc. and on the effectiveness of our internal controls over financial reporting. The reports of Ernst & Young LLP are contained in this Annual Report on Form 10-K.

31
REPORT OF INDEPENDENT REGISTERED PUBLIC ACCOUNTING FIRM
Board of Directors and Stockholders Sypris Solutions, Inc.
We have audited Sypris Solutions, Inc.’s internal control over financial reporting as of December 31, 2011, based on criteria established in Internal Control—Integrated Framework issued by the Committee of Sponsoring Organizations of the Treadway Commission (the COSO criteria). Sypris Solutions, Inc.’s management is responsible for maintaining effective internal control over financial reporting, and for its assessment of the effectiveness of internal control over financial reporting included in the accompanying “Management’s Report on Internal Control Over Financial Reporting.” Our responsibility is to express an opinion on the Company’s internal control over financial reporting based on our audit.
We conducted our audit in accordance with the standards of the Public Company Accounting Oversight Board (United States). Those standards require that we plan and perform the audit to obtain reasonable assurance about whether effective internal control over financial reporting was maintained in all material respects. Our audit included obtaining an understanding of internal control over financial reporting, assessing the risk that a material weakness exists, testing and evaluating the design and operating effectiveness of internal control based on the assessed risk, and performing such other procedures as we considered necessary in the circumstances. We believe that our audit provides a reasonable basis for our opinion.
A company’s internal control over financial reporting is a process designed to provide reasonable assurance regarding the reliability of financial reporting and the preparation of financial statements for external purposes in accordance with generally accepted accounting principles. A company’s internal control over financial reporting includes those policies and procedures that (1) pertain to the maintenance of records that, in reasonable detail, accurately and fairly reflect the transactions and dispositions of the assets of the company; (2) provide reasonable assurance that transactions are recorded as necessary to permit preparation of financial statements in accordance with generally accepted accounting principles, and that receipts and expenditures of the company are being made only in accordance with authorizations of management and directors of the company; and (3) provide reasonable assurance regarding prevention or timely detection of unauthorized acquisition, use, or disposition of the company’s assets that could have a material effect on the financial statements.
Because of its inherent limitations, internal control over financial reporting may not prevent or detect misstatements. Also, projections of any evaluation of effectiveness to future periods are subject to the risk that controls may become inadequate because of changes in conditions, or that the degree of compliance with the policies or procedures may deteriorate.
In our opinion, Sypris Solutions, Inc. maintained, in all material respects, effective internal control over financial reporting as of December 31, 2011, based on the COSO criteria.
We also have audited, in accordance with the standards of the Public Company Accounting Oversight Board (United States), the consolidated balance sheets of Sypris Solutions, Inc. as of December 31, 2011 and 2010, and the related consolidated statements of operations, stockholders’ equity, and cash flows for the years then ended, and our report dated March 13, 2012 expressed an unqualified opinion thereon.
/s/ ERNST & YOUNG LLP
Louisville, Kentucky March 13, 2012

32
REPORT OF INDEPENDENT REGISTERED PUBLIC ACCOUNTING FIRM
Board of Directors and Stockholders Sypris Solutions, Inc.
We have audited the accompanying consolidated balance sheets of Sypris Solutions, Inc. (the Company) as of December 31, 2011 and 2010, and the related consolidated statements of operations, stockholders’ equity, and cash flows for the years then ended. These financial statements are the responsibility of the Company’s management. Our responsibility is to express an opinion on these financial statements based on our audits.
We conducted our audits in accordance with the standards of the Public Company Accounting Oversight Board (United States). Those standards require that we plan and perform the audit to obtain reasonable assurance about whether the financial statements are free of material misstatement. An audit includes examining, on a test basis, evidence supporting the amounts and disclosures in the financial statements. An audit also includes assessing the accounting principles used and significant estimates made by management, as well as evaluating the overall financial statement presentation. We believe that our audits provide a reasonable basis for our opinion.
In our opinion, the financial statements referred to above present fairly, in all material respects, the consolidated financial position of Sypris Solutions, Inc. at December 31, 2011 and 2010, and the consolidated results of their operations and their cash flows for the years then ended, in conformity with U.S. generally accepted accounting principles.
We also have audited, in accordance with the standards of the Public Company Accounting Oversight Board (United States), Sypris Solutions, Inc.’s internal control over financial reporting as of December 31, 2011, based on criteria established in Internal Control-Integrated Framework issued by the Committee of Sponsoring Organizations of the Treadway Commission and our report dated March 13, 2012 expressed an unqualified opinion thereon.
/s/ ERNST & YOUNG LLP
Louisville, Kentucky March 13, 2012

33
SYPRIS SOLUTIONS, INC. CONSOLIDATED STATEMENTS OF OPERATIONS
(in thousands, except for per share data) Years ended December 31, 2011 2010 Net revenue:
Outsourced services ...................................................................................................... $ 283,189 $ 221,587 Products ........................................................................................................................ 52,436 45,067
Total net revenue ....................................................................................................... 335,625 266,654
Cost of sales: Outsourced services ...................................................................................................... 254,998 207,359 Products ........................................................................................................................ 45,398 34,400
Total cost of sales ...................................................................................................... 300,396 241,759
Gross profit ................................................................................................................ 35,229 24,895
Selling, general and administrative ................................................................................... 28,315 26,749 Research and development ............................................................................................... 3,397 3,150 Amortization of intangible assets ..................................................................................... 102 113 Nonrecurring (income) expense ....................................................................................... (3,000) — Restructuring expense, net ................................................................................................ 231 2,296
Operating income (loss) ............................................................................................ 6,184 (7,413)
Interest expense, net ......................................................................................................... 1,732 2,379 Other (income) expense, net ............................................................................................. (6,604) (1,088)
Income (loss) from continuing operations before income taxes ................................ 11,056 (8,704)
Income tax expense .......................................................................................................... 2,621 1,004
Income (loss) from continuing operations ................................................................ 8,435 (9,708)
Loss from discontinued operations, net of tax .................................................................. (528) (496)
Net income (loss) ....................................................................................................... $ 7,907 $ (10,204)
Basic income (loss) per share: Income (loss) per share from continuing operations ................................................. $ 0.43 $ (0.52) Loss per share from discontinued operations ............................................................ (0.03) (0.03) Net income (loss) per share ....................................................................................... $ 0.40 $ (0.55)
Diluted income (loss) per share: Income (loss) per share from continuing operations ................................................. $ 0.43 $ (0.52) Loss per share from discontinued operations ............................................................ (0.03) (0.03) Net income (loss) per share ....................................................................................... $ 0.40 $ (0.55)
Cash dividends per common share ................................................................................... $ — $ —
The accompanying notes are an integral part of the consolidated financial statements.

34
SYPRIS SOLUTIONS, INC. CONSOLIDATED BALANCE SHEETS
(in thousands, except for share data) December 31, 2011 2010
ASSETS Current assets:
Cash and cash equivalents ............................................................................................. $ 18,173 $ 16,592 Accounts receivable, net ............................................................................................... 42,984 41,434 Inventory, net ................................................................................................................ 33,621 30,264 Other current assets ....................................................................................................... 3,468 5,717 Assets held for sale ....................................................................................................... 1,739 — Total current assets ....................................................................................................... 99,985 94,007
Restricted cash .................................................................................................................. 3,000 3,000 Investment in marketable securities .................................................................................. 1,749 — Property, plant and equipment, net ................................................................................... 56,891 68,590 Goodwill ........................................................................................................................... 6,900 6,900 Other assets ....................................................................................................................... 7,200 7,195 Total assets ................................................................................................................ $ 175,725 $ 179,692
LIABILITIES AND STOCKHOLDERS’ EQUITY Current liabilities:
Accounts payable .......................................................................................................... $ 51,303 $ 39,488 Accrued liabilities ......................................................................................................... 23,569 22,763 Current portion of long-term debt ................................................................................. — 2,000
Total current liabilities .............................................................................................. 74,872 64,251
Long-term debt ................................................................................................................. 10,000 21,305 Other liabilities ................................................................................................................. 30,385 34,338
Total liabilities ........................................................................................................... 115,257 119,894
Stockholders’ equity: Preferred stock, par value $0.01 per share, 975,150 shares authorized; no shares
issued ......................................................................................................................... — — Series A preferred stock, par value $0.01 per share, 24,850 shares authorized; no
shares issued .............................................................................................................. — — Common stock, non-voting, par value $0.01 per share, 10,000,000 shares
authorized; no shares issued ...................................................................................... — — Common stock, par value $0.01 per share, 30,000,000 shares authorized;
20,108,635 shares issued and 19,995,401 outstanding in 2011 and 19,964,348 shares issued and 19,663,229 outstanding in 2010 .................................................... 201 199
Additional paid-in capital .............................................................................................. 149,160 148,555 Retained deficit ............................................................................................................. (66,722) (74,629) Accumulated other comprehensive loss ........................................................................ (22,170) (14,324) Treasury stock, 113,234 and 301,119 shares in 2011 and 2010, respectively............... (1) (3)
Total stockholders’ equity ......................................................................................... 60,468 59,798
Total liabilities and stockholders’ equity ................................................................... $ 175,725 $ 179,692
The accompanying notes are an integral part of the consolidated financial statements.

35
SYPRIS SOLUTIONS, INC. CONSOLIDATED STATEMENTS OF CASH FLOWS
(in thousands) Years ended December 31, 2011 2010 Cash flows from operating activities:
Net income (loss) .......................................................................................................... $ 7,907 $ (10,204) Loss from discontinued operations ............................................................................... (528) (496) Income (loss) from continuing operations .................................................................... 8,435 (9,708) Adjustments to reconcile net income (loss) to net cash provided by operating activities: Depreciation and amortization ................................................................................... 14,216 14,724 Deferred income taxes ............................................................................................... 508 604 Non-cash compensation ............................................................................................. 979 1,062 Deferred revenue recognized ..................................................................................... (6,884) (6,112) Deferred loan costs recognized .................................................................................. 172 382 Write-off of debt issuance costs ................................................................................ 277 — Gain on sale of assets ................................................................................................ (4,523) (902) Provision for excess and obsolete inventory ............................................................. 945 (1,871) Other noncash items .................................................................................................. (2,545) 1,631 Contributions to pension plans .................................................................................. (753) (821) Changes in operating assets and liabilities: Accounts receivable ................................................................................................. (1,509) (3,261) Inventory .................................................................................................................. (4,302) 660 Other current assets ................................................................................................. 564 3,626 Accounts payable ..................................................................................................... 11,747 3,138 Accrued and other liabilities .................................................................................... (335) (1,231)
Net cash provided by operating activities - continuing operations ........................ 16,992 1,921 Net cash used in operating activities - discontinued operations ............................. — (196) Net cash provided by operating activities .............................................................. 16,992 1,725
Cash flows from investing activities: Capital expenditures ...................................................................................................... (6,848) (2,233) Proceeds from sale of assets .......................................................................................... 5,032 1,446 Changes in nonoperating assets and liabilities .............................................................. 33 46
Net cash used in investing activities ...................................................................... (1,783) (741)
Cash flows from financing activities: Repayment of former Revolving Credit Agreement ..................................................... (10,000) — Repayment of former Senior Notes ............................................................................... (13,305) — Net proceeds from Credit Facility ................................................................................. 10,000 — Payments for deferred loan costs .................................................................................. (387) — Proceeds from issuance of common stock .................................................................... 64 —
Net cash used in financing activities ...................................................................... (13,628) — Net increase in cash and cash equivalents ........................................................................ 1,581 984 Cash and cash equivalents at beginning of year ............................................................... 16,592 15,608 Cash and cash equivalents at end of year ......................................................................... $ 18,173 $ 16,592
The accompanying notes are an integral part of the consolidated financial statements.

36
SYPRIS SOLUTIONS, INC. CONSOLIDATED STATEMENTS OF STOCKHOLDERS’ EQUITY
(in thousands, except for share data) Accumulated Other Additional Retained Comprehensive Common Stock Paid-In (Deficit) Income Treasury Shares Amount Capital Earnings (Loss) Stock January 1, 2010 balance .................................... 19,472,499 $ 200 $ 147,644 $ (64,434) $ (17,187) $ (5)
Net loss ............................................................. — — — (10,204) — — Employee benefit related .................................. — — — — 103 — Foreign currency translation adjustment ........... — — — — 2,760 — Comprehensive (loss) income ........................... — — — (10,204) 2,863 —
Restricted common stock grant ......................... 302,000 — (5) — — 3 Noncash compensation ..................................... 31,200 — 1,053 9 — — Treasury stock ................................................... (91,690) — — — — (1) Retire treasury stock ......................................... (50,780) (1) (137) — — — December 31, 2010 balance .............................. 19,663,229 199 148,555 (74,629) (14,324) (3)
Net income ........................................................ — — — 7,907 — — Unrealized gain on marketable securities.......... — — — — 1,685 — Employee benefit related .................................. — — — — (4,668) — Foreign currency translation adjustment ........... — — — — (4,863) — Comprehensive income (loss) ........................... — — — 7,907 (7,846) —
Restricted common stock grant ......................... 413,500 2 1 — — 2 Noncash compensation ..................................... 31,200 — 979 — — — Exercise of stock options .................................. 14,185 — 64 — — — Treasury stock ................................................... (35,000) — — — — — Retire treasury stock ......................................... (91,713) — (439) — — —
December 31, 2011 balance .............................. 19,995,401 $ 201 $ 149,160 $ (66,722) $ (22,170) $ (1)
The accompanying notes are an integral part of the consolidated financial statements.

SYPRIS SOLUTIONS, INC. NOTES TO CONSOLIDATED FINANCIAL STATEMENTS
December 31, 2011 and 2010
37
(1) Organization and Significant Accounting Policies
Consolidation Policy
The accompanying consolidated financial statements include the accounts of Sypris Solutions, Inc. and its wholly-owned subsidiaries (collectively, “Sypris” or the “Company”) and have been prepared by the Company in accordance with the rules and regulations of the Securities and Exchange Commission. The Company’s operations are domiciled in the United States (U.S.), Mexico and Denmark and serve a wide variety of domestic and international customers. All significant intercompany accounts and transactions have been eliminated.
Nature of Business
Sypris is a diversified provider of outsourced services and specialty products. The Company performs a wide range of manufacturing, engineering, design and other technical services, typically under multi-year, sole-source contracts with corporations and government agencies in the markets for truck components and assemblies and aerospace and defense electronics. The Company provides such services through its Industrial and Electronics Groups (Note 24).
Use of Estimates
The preparation of the consolidated financial statements and accompanying notes in conformity with U.S. generally accepted accounting principles requires management to make estimates and assumptions that affect the amounts reported. Changes in facts and circumstances could have a significant impact on the resulting estimated amounts included in our consolidated financial statements. Actual results could differ from these estimates.
Discontinued Operations
The Company classifies a business component that either has been disposed of or is classified as held for sale as a discontinued operation if the cash flows of the component have been or will be eliminated from ongoing operations and the Company will no longer have any significant continuing involvement in the component. The results of operations related to the discontinued operations are aggregated and presented on one line on the statement of operations. See Note 2 for additional information regarding discontinued operations.
Cash Equivalents and Restricted Cash
Cash equivalents include all highly liquid investments with a maturity of three months or less when purchased. Restricted cash includes money held in escrow pursuant to the sale of Sypris Test & Measurement in 2009 in connection with certain customary representations, warranties, covenants and indemnifications of the Company.
Inventory
Inventory is stated at the lower of cost or estimated net realizable value. Costs for raw materials, work in process and finished goods is determined under the first-in, first-out method. Indirect inventories, which include perishable tooling, repair parts and other materials consumed in the manufacturing process but not incorporated into finished products are classified as raw materials.
The Company’s reserve for excess and obsolete inventory is primarily based upon forecasted demand for its product sales, and any change to the reserve arising from forecast revisions is reflected in cost of sales in the period the revision is made.

SYPRIS SOLUTIONS, INC. NOTES TO CONSOLIDATED FINANCIAL STATEMENTS – CONTINUED
38
Investment in Marketable Securities
Securities are carried at fair value based on quoted market prices. Increases and decreases in fair value are recorded as unrealized gains and losses in other comprehensive income (loss). Management evaluates its marketable securities for other-than-temporary impairment when the fair value of the investment is lower than its book value. Factors that are considered when evaluating for other-than-temporary impairment include the length of time and the extent to which market value has been less than cost, the financial condition and near-term prospects of the issuer, credit risk, and the Company’s intent and ability to hold the investment for a period of time sufficient to allow for any anticipated recovery in the market.
Property, Plant and Equipment
Property, plant and equipment is stated at cost. Depreciation of property, plant and equipment is generally computed using the straight-line method over their estimated economic lives. For land improvements, buildings and building improvements, the estimated economic life is generally 40 years. Estimated economic lives range from three to fifteen years for machinery, equipment, furniture and fixtures. Leasehold improvements are amortized over the shorter of their economic life or the respective lease term using the straight-line method. Expenditures for maintenance, repairs and renewals of minor items are expensed as incurred. Major rebuilds and improvements are capitalized.
Plant assets classified as Assets held for sale are initially measured at the lesser of the assets’ carrying amount or the fair value less costs to sell. Gains or losses are recognized for any subsequent changes in the fair value less cost to sell; however, gains are only recognized to the extent of cumulative losses previously recognized. Plant assets classified as assets held for sale are not depreciated.
Long-lived Assets
The Company reviews the carrying value of amortizable long-lived assets whenever events or changes in circumstances indicate that the carrying amount of an asset may not be recoverable. Recoverability of assets to be held for sale and held for use is measured by a comparison of the carrying amount of the asset to the undiscounted future net cash flows expected to be generated by the asset. If facts and circumstances indicate that the carrying value of an asset or groups of assets, as applicable, is impaired, the long-lived asset or groups of long-lived assets are written down to their estimated fair value.
Goodwill
Goodwill is tested for impairment during the fourth quarter or more frequently if events occur or circumstances change that would warrant such a review. The Company assesses recoverability using a discounted cash flow analysis and comparisons of multiples of enterprise values to earnings before interest, taxes, depreciation and amortization (EBITDA). The analysis is based upon available information regarding expected future cash flows of each reporting unit discounted at rates consistent with the cost of capital specific to the reporting unit. A growth rate is used to calculate the terminal value of the reporting unit and is added to the present value of the forecasted cash flows. The growth rate is the expected rate at which a reporting unit’s cash flow is projected to grow beyond the period covered by the long-range plan. The cash flow analysis requires significant judgment in our evaluation of the business and establishing an appropriate discount rate and terminal value to apply in the calculation. In selecting these and other assumptions for each business, we consider historical performance, forecasted operating results, expected changes in product mix, general market conditions and industry considerations specific to the business. We make significant assumptions and estimates about the extent and timing of future cash flows, growth rates and discount rates. The cash flows are estimated over a future period of time, which makes those estimates and assumptions inherently subject to a high degree of potential uncertainty. The sum of the calculated fair values of each reporting unit is then reconciled and compared to our total market capitalization, allowing for a reasonable control premium. If the discounted cash flow analysis yields a fair value estimate less than the reporting unit’s carrying value, we proceed to step two of the impairment process. In the second step, the implied fair value of the reporting unit’s goodwill is determined by allocating the reporting unit’s fair value to all of the assets and liabilities of the reporting unit.

SYPRIS SOLUTIONS, INC. NOTES TO CONSOLIDATED FINANCIAL STATEMENTS – CONTINUED
39
As a result of the first step of the goodwill impairment analysis performed as of December 31, 2011, the fair value estimate for the Electronics Group, which is the only reporting unit with goodwill, exceeded its carrying value by approximately 27%. Therefore the second step was not necessary. Key assumptions used to determine the fair value estimate of our Electronics Group during the fourth quarter were the expected after-tax cash flows for the period from 2012 to 2014, which include projected improvements in operating margins, a terminal growth rate of 3.0% and a weighted average cost of capital of 17.0%. The terminal rate is consistent with the prior year growth rate of 3.0%. Our analysis included a comparison of our market capitalization to the fair value of the entire enterprise. These and other estimates and assumptions are impacted by economic conditions and expectations of management and may change in the future based on period-specific facts and circumstances
We believe that the assumptions and estimates used to determine the fair value of our reporting unit were reasonable. However, different assumptions could materially affect the results. If the Electronics Group’s future cash flows are different than those projected by management, future impairment charges may be required. The Company will continue to monitor the performance of the Electronics Group, the performance of the overall aerospace and defense industry and the Company’s market capitalization.
Precontract Costs
Costs incurred on projects as pre-contract costs are deferred as assets when the Company has been requested by the customer to begin work under a new arrangement prior to contract execution. The Company records pre-contract costs when formal contracts have not yet been executed, and it is probable that the Company will recover the costs through the issuance of a contract. If we determine it is probable that we will be awarded the specific anticipated contract, we capitalize the precontract costs we incur, excluding start-up costs which are expensed as incurred. Capitalized precontract costs of $1.1 million at December 31, 2011 are included in other assets, in the accompanying Consolidated Statements of Financial Position. There were no capitalized precontract costs as of December 31, 2010.
Deferred Revenue
Deferred revenue for the Electronics Group is recorded when payments are received in advance for service agreements and extended warranties on certain products and is amortized into revenue on a straight-line basis over the contractual term. Deferred revenue for the Industrial Group is generally associated with the Dana Holding Corporation (DHC) settlement (Note 5) and will be amortized into income on a units-of-production basis over the term of the related supply agreement. See Notes 14 and 15 for the amount of deferred revenue included in accrued liabilities and other liabilities.
Income Taxes
The Company uses the liability method in accounting for income taxes. Deferred tax assets and liabilities are recorded for temporary differences between the tax basis of assets and liabilities and their reported amounts in the consolidated financial statements, using the statutory tax rates in effect for the year in which the differences are expected to reverse. A valuation allowance is recorded to reduce the carrying amounts of deferred tax assets unless it is more likely than not that such assets will be realized. The Company recorded an increase to the valuation allowance of $3,486,000 through income tax expense for its domestic operations in 2010 (Note 22). There was no increase to the valuation allowance recorded through income tax expense for its domestic operations in 2011.
In the ordinary course of business there is inherent uncertainty in quantifying the Company’s income tax positions. The Company assesses its income tax positions and records tax benefits for all years subject to examination based upon management’s evaluation of the facts, circumstances, and information available at the reporting dates. For those tax positions where it is more-likely-than-not that a tax benefit will be sustained, the Company has recorded the largest amount of tax benefit with a greater than 50% likelihood of being realized upon ultimate settlement with a taxing authority that has full knowledge of all relevant information. For those income tax positions where it is not more-likely-than-not that a tax benefit will be sustained, no tax benefit has been recognized in the financial statements. Where applicable, associated interest has also been recognized.
The Company recognizes liabilities or assets for the deferred tax consequences of temporary differences between the tax bases of assets or liabilities and their reported amounts in the financial statements in accordance

SYPRIS SOLUTIONS, INC. NOTES TO CONSOLIDATED FINANCIAL STATEMENTS – CONTINUED
40
with ASC 740, Income Taxes. The Company recognizes interest accrued related to unrecognized tax benefits in income tax expense. Penalties, if incurred, would be recognized as a component of income tax expense.
Net Revenue and Cost of Sales
Net revenue of products and services under commercial terms and conditions are recorded upon delivery and passage of title, or when services are rendered. Related shipping and handling costs, if any, are included in costs of sales.
Net revenue under long-term, fixed-price contracts with aerospace and defense companies and agencies of the U.S. Government is recognized upon shipment. Contract profits are taken into earnings based on actual cost of sales for units shipped. Amounts representing contract change orders or claims are included in revenue when such costs are invoiced to the customer.
Product Warranty Costs
The provision for estimated warranty costs is recorded at the time of sale and is periodically adjusted to reflect actual experience. The Company’s warranty liability, which is included in accrued liabilities in the accompanying balance sheets, as of December 31, 2011 and 2010, was $914,000 and $866,000, respectively. The Company’s warranty expense for the years ended December 31, 2011 and 2010 was $460,000 and $525,000, respectively.
Additionally, the Company sells three and five-year extended warranties for certain link encryption products. The revenue from the extended warranties is deferred and recognized ratably over the contractual term. As of December 31, 2011 and 2010, the Company had deferred $2,536,000 and $2,076,000, respectively, related to extended warranties. At December 31, 2011, $802,000 is included in accrued liabilities and $1,734,000 is included in other liabilities in the accompanying balance sheets. At December 31, 2010, $491,000 is included in accrued liabilities and $1,585,000 is included in other liabilities in the accompanying balance sheets.
Concentrations of Credit Risk
Financial instruments which potentially expose the Company to concentrations of credit risk consist of accounts receivable. The Company’s customer base consists of a number of customers in diverse industries across geographic areas, primarily in North America and Mexico, various departments or agencies of the U.S. Government, and aerospace and defense companies under contract with the U.S. Government. The Company performs periodic credit evaluations of its customers’ financial condition and does not require collateral on its commercial accounts receivable. Credit losses are provided for in the consolidated financial statements and consistently have been within management’s expectations. Approximately 74% and 54% of accounts receivable outstanding at December 31, 2011 and 2010, respectively, are due from the Company’s two largest customers. More specifically, Dana Holding Corporation (DHC) and Meritor, Inc. (Meritor) comprise 56% and 18%, respectively, of December 31, 2011 outstanding accounts receivables. Similar amounts at December 31, 2010 were 36% and 18%, respectively.
The Industrial Group’s largest customers for the year ended December 31, 2011 were DHC and Meritor, which represented approximately 54% and 13%, respectively, of the Company’s total net revenue. DHC and Meritor were the Company’s largest customers for the year ended December 31, 2010, which represented approximately 49% and 13%, respectively, of the Company’s total net revenue. The Company recognized revenue from contracts with the U.S. Government and its agencies approximating 9% and 12% of net revenue for the years ended December 31, 2011 and 2010, respectively. No other single customer accounted for more than 10% of the Company’s total net revenue for the years ended December 31, 2011 or 2010.
Risks and Uncertainties
There are numerous risks and uncertainties relating to the global economy, weakened capital markets and the automotive industry that could materially affect the Company’s future financial performance and liquidity. These risks and uncertainties could result in decreased sales, limited access to credit, rising costs, increased competition, customer or supplier bankruptcies, delays in customer payment terms and acceleration of supplier payments, growing inventories and failure to meet debt covenants.

SYPRIS SOLUTIONS, INC. NOTES TO CONSOLIDATED FINANCIAL STATEMENTS – CONTINUED
41
Foreign Currency Translation
The functional currency for the Company’s Mexican subsidiary is the Mexican peso. Assets and liabilities are translated at the period end exchange rate, and income and expense items are translated at the weighted average exchange rate. The resulting translation adjustments are recorded in comprehensive income (loss) as a separate component of stockholders’ equity. Remeasurement gains or losses for U.S. dollar denominated accounts of the Company’s Mexican subsidiary are included in other expense, net.
Collective Bargaining Agreements
Approximately 627, or 46% of the Company’s employees, all of which are in the Industrial Group, are covered by collective bargaining agreements. Excluding certain Mexico employees covered under an annually ratified agreement, there are no collective bargaining agreements expiring within the next 12 months. Certain Mexico employees are covered by an annually ratified collective bargaining agreement and represent approximately 436 employees, or 32% of the Company’s workforce.
Adoption of Recently Issued Accounting Standards
In June 2011, the FASB issued ASU 2011-05, “Comprehensive Income (Topic 220): Presentation of Comprehensive Income,” which is effective for annual reporting periods beginning after December 15, 2011. ASU 2011-05 will become effective for the Company on January 1, 2012. This guidance eliminates the option to present the components of other comprehensive income as part of the statement of changes in stockholders’ equity. In addition, items of other comprehensive income that are reclassified to profit or loss are required to be presented separately on the face of the financial statements. This guidance is intended to increase the prominence of other comprehensive income in financial statements by requiring that such amounts be presented either in a single continuous statement of income and comprehensive income or separately in consecutive statements of income and comprehensive income. The adoption of ASU 2011-05 is not expected to have a material impact on our consolidated financial position, results of operations or cash flows.
In September 2011, the Financial Accounting Standards Board (FASB) issued Accounting Standards Update (ASU) No. 2011-08, Intangibles – Goodwill and Other (Topic 350): Testing Goodwill for Impairment. The guidance in ASU 2011-08 is intended to reduce complexity and costs by allowing an entity the option to make a qualitative evaluation about the likelihood of goodwill impairment to determine whether it should calculate the fair value of a reporting unit. The amendments also improve previous guidance by expanding upon the examples of events and circumstances that an entity should consider between annual impairment tests in determining whether it is more likely than not that the fair value of a reporting unit is less than its carrying amount. Also, the amendments improve the examples of events and circumstances that an entity having a reporting unit with a zero or negative carrying amount should consider in determining whether to measure an impairment loss, if any, under the second step of the goodwill impairment test. The amendments in this ASU are effective for annual and interim goodwill impairment tests performed for fiscal years beginning after December 15, 2011. Early adoption is permitted, including for annual and interim goodwill impairment tests performed as of a date before September 15, 2011, if an entity’s financial statements for the most recent annual or interim period have not yet been issued. The adoption of this guidance is not expected to have a material impact on the Company’s consolidated financial position or results of operations.
Reclassifications
Certain amounts in the Company’s 2010 consolidated financial statements have been reclassified to conform to the 2011 presentation.

SYPRIS SOLUTIONS, INC. NOTES TO CONSOLIDATED FINANCIAL STATEMENTS – CONTINUED
42
(2) Discontinued Operations
On October 26, 2009, the Company sold all of the stock of its wholly owned subsidiary, Sypris Test & Measurement, Inc. for $39,000,000, of which $3,000,000 was deposited in an escrow account in connection with certain customary representations, warranties, covenants and indemnifications of the Company. During 2010, the Company was made aware of a potential indemnification claim from the purchaser of Sypris Test & Measurement. The Company estimates that its total liability arising from this claim will not exceed $946,000, of which $450,000 and $496,000 was recorded during the years ended December 31, 2011 and 2010, respectively. The Company has also incurred legal expenses of $78,000 during 2011 in connection with the claim. These charges are included in loss from discontinued operations, net of tax in the consolidated statement of operations. The Company has paid $196,000 related to the claim as of December 31, 2011. The remaining amount of $750,000 has been reserved in accrued liabilities on the Company’s consolidated balance sheets. There can be no assurance that relevant facts and circumstances will not change, necessitating future changes to the estimated liability.
(3) Nonrecurring (Income) Expense
During the year ended December 31, 2011, the Company recognized a gain of $3,000,000 in connection with a settlement regarding prior year volumes with one of its customers within the Industrial Group.
(4) Other (Income) Expense, Net
During the year ended December 31, 2011, the Company recognized net gains of $3,636,000 related to the disposition of idle assets. Additionally, the Company recognized foreign currency translation gains of $2,640,000 for the year ended December 31, 2011, respectively, related to the net U.S. dollar denominated monetary asset position of our Mexican subsidiary for which the Mexican peso is the functional currency. For the year ended December 31, 2010, the Company recognized net gains of $1,262,000 related to the disposition of idle assets and foreign currency translation losses of $652,000. These gains and losses are included in other (income) expense, net on the consolidated statements of operations.
(5) Dana Settlement Agreement
On March 3, 2006, the Company’s largest customer, Dana Corporation (“Dana”), and 40 of its U.S. subsidiaries, filed voluntary petitions for reorganization under Chapter 11 of the U.S. Bankruptcy Code in the U.S. Bankruptcy Court for the Southern District of New York. On August 7, 2007, the Company entered into a comprehensive settlement agreement with Dana (the “Settlement Agreement”) to resolve all outstanding disputes between the parties, terminate previously approved arbitration payments and replace three existing supply agreements with a single, revised contract running through 2014. In addition, Dana provided the Company with an allowed general unsecured non-priority claim in the face amount of $89,900,000 (the “Claim”).
The Claim provided to Sypris was agreed to by Sypris and Dana as consideration for the aggregate economic impact of the various elements the two parties were negotiating. After the aggregate Claim value of $89,900,000 was established, Sypris recorded the claim at the estimated fair value of $76,483,000 and allocated the estimated fair value to each commercial issue negotiated. The revenues and resulting net income associated with each of those issues requiring the Company’s continued involvement was deferred and will be recognized over the applicable period of the involvement. For the years ended December 31, 2011 and 2010, the Company recognized into revenue $6,884,000 and $6,112,000, respectively, related to the Claim.
On August 31, 2011, the Company received 143,966 shares of Dana common stock, representing the final distribution to be received in conjunction with the settlement. At December 31, 2011, the cost basis and fair value of the Company’s holdings of Dana common stock amounted to $64,000 and $1,749,000, respectively. In accordance with ASC 320-10-25, the $1,685,000 increase in value was recorded as an unrealized holding gain in other comprehensive loss for the year ended December 31, 2011.

SYPRIS SOLUTIONS, INC. NOTES TO CONSOLIDATED FINANCIAL STATEMENTS – CONTINUED
43
(6) Restructuring, Impairments and Nonrecurring Charges
As announced during the fourth quarter of 2008, the Company committed to a restructuring program, which included the closure of its Kenton, Ohio facility, significant reductions in the workforce in its Marion, Ohio facility and the integration of its Electronics Group subsidiaries. The purpose of the restructuring program is to reduce fixed costs, accelerate integration efficiencies, exit certain unprofitable product lines and significantly improve operating earnings on a sustained basis. As a result of these initiatives, the Company recorded restructuring charges of $231,000, and $2,296,000, in 2011 and 2010, respectively. All of the $231,000 recorded was within the Industrial Group. Of these costs, $623,000 related to equipment relocation costs, and $495,000 represented other costs, primarily related to mothball costs associated with closed or partially closed facilities. Partially offsetting this was an $887,000 gain on the sale of assets that had previously been impaired. Of the aggregate $55,309,000 of pre-tax costs for the total program, $16,692,000 will be cash expenditures, the majority of which has been spent at December 31, 2011.
A summary of the pre-tax restructuring charges is as follows (in thousands):
Total Costs Incurred Program 2011
Severance and benefit-related costs ................................. $ 4,038 $ (8) Asset impairments ........................................................... 12,634 (887) Deferred contract costs write-offs ................................... 17,798 — Inventory related charges ................................................ 7,895 — Equipment relocation costs ............................................. 2,714 623 Asset retirement obligations ............................................ 1,501 — Contract termination costs ............................................... 3,209 — Other ................................................................................ 5,520 503
$ 55,309 $ 231
A summary of restructuring activity and related reserves at December 31, 2011 is as follows (in thousands): Accrued Cash Accrued Balance at Payments Balance at Dec. 31, 2011 or Asset Dec. 31, 2010 Charge Write-Offs 2011
Severance and benefit related costs ................................. $ 267 $ (8) $ (94) $ 165 Asset impairments ........................................................... — (887) 887 — Equipment relocation costs ............................................. — 623 (623) — Asset retirement obligations ............................................ 1,173 — (783) 390 Contract termination costs ............................................... 459 — (459) — Other ................................................................................ — 503 (503) — $ 1,899 $ 231 $ (1,575) $ 555
A summary of total charges by reportable segment is as follows (in thousands):
Industrial Electronics Group Group Total
Severance and benefit-related costs ............................. $ 2,554 $ 1,484 $ 4,038 Asset impairments ....................................................... 12,634 — 12,634 Deferred contract costs write-offs ............................... — 17,798 17,798 Inventory related charges ............................................ — 7,895 7,895 Equipment relocation costs ......................................... 2,692 22 2,714 Asset retirement obligations ........................................ 1,501 — 1,501 Contract termination costs ........................................... 1,868 1,341 3,209 Other ............................................................................ 1,889 3,631 5,520
$ 23,138 $ 32,171 $ 55,309

SYPRIS SOLUTIONS, INC. NOTES TO CONSOLIDATED FINANCIAL STATEMENTS – CONTINUED
44
(7) Accounts Receivable
Accounts receivable consists of the following (in thousands): December 31, 2011 2010
Commercial .......................................................................................... $ 42,860 $ 35,389 U.S. Government .................................................................................. 480 6,598
43,340 41,987 Allowance for doubtful accounts .......................................................... (356) (553)
$ 42,984 $ 41,434
Accounts receivable from the U.S. Government includes amounts due under long-term contracts, all of which are billed at December 31, 2011 and 2010, of $480,000 and $6,598,000 respectively.
(8) Inventory
Inventory consists of the following (in thousands):
December 31, 2011 2010
Raw materials ....................................................................................... $ 19,719 $ 20,910 Work in process .................................................................................... 13,093 10,287 Finished goods...................................................................................... 7,451 6,051 Reserve for excess and obsolete inventory ........................................... (6,642) (6,984)
$ 33,621 $ 30,264
(9) Other Current Assets
Other current assets consist of the following (in thousands):
December 31, 2011 2010
Prepaid expenses .................................................................................. $ 1,426 $ 1,444 Deferred contract costs ......................................................................... — 1,094 Other ..................................................................................................... 2,042 3,179 $ 3,468 $ 5,717
Included in other current assets are deferred taxes for the Company’s Mexican subsidiary, income taxes refundable and other items, none of which exceed 5% of total current assets.
(10) Investment in Marketable Securities
The Company’s investment in marketable securities consists exclusively of shares in Dana common stock. The Company’s investment in Dana common stock is classified as an available-for-sale security in accordance with ASC 320-10-25 and measured at fair value as determined by a quoted market price (a level 1 valuation under ASC 820-10). The related unrealized holding gains are excluded from operations and recorded in accumulated other comprehensive loss on the consolidated balance sheets. At December 31, 2011, the Company owned 143,966 common shares of Dana with a market value of $12.15 per share. At December 31, 2011, the gross unrealized gain was approximately $1,685,000. There were no unrealized gains or losses at December 31, 2010. Realized gains and losses and declines in value judged to be other-than-temporary will be included in other income or expense, if and when recorded. In accordance with ASC 820-10, the fair value of the shares was valued based on quoted market prices in active markets for identical shares at December 31, 2011.

SYPRIS SOLUTIONS, INC. NOTES TO CONSOLIDATED FINANCIAL STATEMENTS – CONTINUED
45
The following table summarizes marketable securities as of December 31, 2011 (in thousands): Fair Value At Quoted Prices Gross Gross in Active Unrealized Realized Markets Basis Gain/(Loss) Gain/(Loss) (Level 1)
Marketable securities .......................................................... $ 64 $ 1,685 $ — $ 1,749
(11) Property, Plant and Equipment
Property, plant and equipment consists of the following (in thousands):
December 31, 2011 2010
Land and land improvements ............................................................... $ 3,337 $ 3,906 Buildings and building improvements .................................................. 24,704 26,528 Machinery, equipment, furniture and fixtures ...................................... 156,595 167,580 Construction in progress ....................................................................... 5,985 2,093 190,621 200,107 Accumulated depreciation .................................................................... (133,730) (131,517)
$ 56,891 $ 68,590
Depreciation expense totaled approximately $14,113,000 and $14,611,000 for the years ended December 31, 2011 and 2010, respectively. In addition, there were capital expenditures of approximately $266,000 and $152,000 included in accounts payable or accrued liabilities at December 31, 2011 and 2010, respectively.
(12) Other Assets
Other assets consist of the following (in thousands): December 31, 2011 2010
Intangible assets: Gross carrying value: Industrial Group ............................................................................ $ 800 $ 800 Electronics Group .......................................................................... — 125 Total gross carrying value ...................................................... 800 925 Accumulated amortization: Industrial Group ............................................................................ (681) (593) Electronics Group .......................................................................... — (110) Total accumulated amortization ............................................. (681) (703) Intangible assets, net .............................................................. 119 222 Deferred tax assets, net ......................................................................... 4,482 4,854 Deferred pre-contract costs .................................................................. 1,113 — Other ..................................................................................................... 1,486 2,119 $ 7,200 $ 7,195
Intangible assets at December 31, 2011 consists of a long-term supply agreement in the Industrial Group. Intangible assets at December 31, 2010 also included software rights in the Electronics Group. The weighted average amortization period for intangible assets was 9 and 8 years at December 31, 2011 and 2010, respectively. Deferred tax assets, net relate to the Company’s Mexico operations and resulted primarily from deferred revenue related to the DHC settlement agreement. Other assets at December 31, 2011 and 2010 includes unamortized loan costs of approximately $343,000 and $405,000, respectively. Amortization expense for intangible assets is expected to be $89,000 and $30,000 in each of the two fiscal years subsequent to December 31, 2011, respectively, at which point the assets will be fully amortized.

SYPRIS SOLUTIONS, INC. NOTES TO CONSOLIDATED FINANCIAL STATEMENTS – CONTINUED
46
(13) Assets Held for Sale
During 2011, the Company entered into agreements to sell certain assets and liabilities within the Industrial Group. These assets were subsequently sold during 2012 for $4,081,000, and the Company recorded a gain of $2,262,000. The following assets and liabilities have been segregated and included in assets held for sale in the consolidated balance sheets (in thousands):
December 31, 2011 2010
Land and land improvements ............................................................ $ 313 $ — Buildings and building improvements .............................................. 1,575 — Machinery, equipment, furniture and fixtures .................................. 1,721 — Accumulated depreciation ................................................................ (1,687) — Other assets ....................................................................................... 192 — Accrued liabilities ............................................................................. (375) — $ 1,739 $ —
(14) Accrued Liabilities
Accrued liabilities consist of the following (in thousands):
December 31, 2011 2010
Salaries, wages, employment taxes and withholdings .......................... $ 7,144 $ 5,615 Employee benefit plans ........................................................................ 1,343 1,747 Income, property and other taxes ......................................................... 1,013 457 Deferred revenue .................................................................................. 9,497 8,097 Restructuring accruals .......................................................................... 239 1,899 Other ..................................................................................................... 4,333 4,948
$ 23,569 $ 22,763
Included in other accrued liabilities are accrued operating expenses, accrued warranty expenses, accrued interest and other items, none of which exceed 5% of total current liabilities. Deferred revenue at December 31, 2011 and 2010 includes $7,892,000 and $6,884,000, respectively, related to the Dana settlement.
(15) Other Liabilities
Other liabilities consist of the following (in thousands):
December 31, 2011 2010
Deferred revenue .................................................................................. $ 16,657 $ 26,134 Noncurrent pension liability ................................................................. 11,724 7,730 Other ..................................................................................................... 2,004 474
$ 30,385 $ 34,338
Included in other liabilities are accrued long-term warranty expenses and other items, none of which exceed 5% of total liabilities. Deferred revenue at December 31, 2011 and 2010 includes $16,657,000 and $24,549,000, respectively, related to the Dana settlement and will be amortized through 2014.
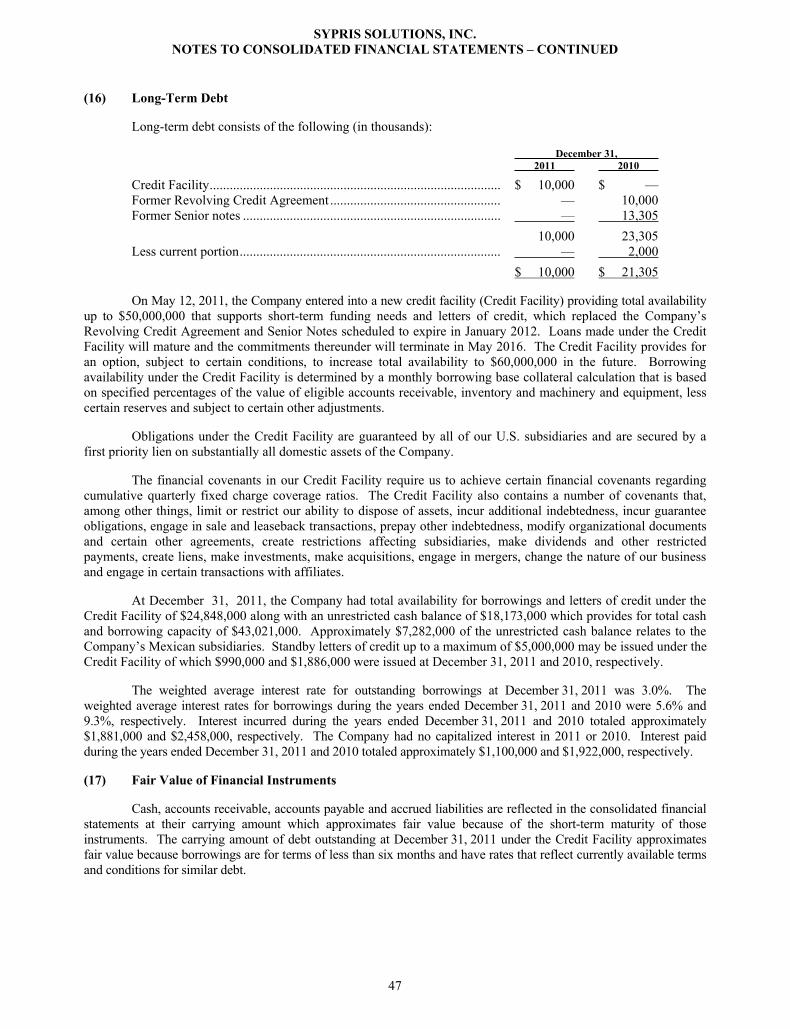
SYPRIS SOLUTIONS, INC. NOTES TO CONSOLIDATED FINANCIAL STATEMENTS – CONTINUED
47
(16) Long-Term Debt
Long-term debt consists of the following (in thousands):
December 31, 2011 2010
Credit Facility ....................................................................................... $ 10,000 $ — Former Revolving Credit Agreement ................................................... — 10,000 Former Senior notes ............................................................................. — 13,305
10,000 23,305 Less current portion .............................................................................. — 2,000
$ 10,000 $ 21,305
On May 12, 2011, the Company entered into a new credit facility (Credit Facility) providing total availability up to $50,000,000 that supports short-term funding needs and letters of credit, which replaced the Company’s Revolving Credit Agreement and Senior Notes scheduled to expire in January 2012. Loans made under the Credit Facility will mature and the commitments thereunder will terminate in May 2016. The Credit Facility provides for an option, subject to certain conditions, to increase total availability to $60,000,000 in the future. Borrowing availability under the Credit Facility is determined by a monthly borrowing base collateral calculation that is based on specified percentages of the value of eligible accounts receivable, inventory and machinery and equipment, less certain reserves and subject to certain other adjustments.
Obligations under the Credit Facility are guaranteed by all of our U.S. subsidiaries and are secured by a first priority lien on substantially all domestic assets of the Company.
The financial covenants in our Credit Facility require us to achieve certain financial covenants regarding cumulative quarterly fixed charge coverage ratios. The Credit Facility also contains a number of covenants that, among other things, limit or restrict our ability to dispose of assets, incur additional indebtedness, incur guarantee obligations, engage in sale and leaseback transactions, prepay other indebtedness, modify organizational documents and certain other agreements, create restrictions affecting subsidiaries, make dividends and other restricted payments, create liens, make investments, make acquisitions, engage in mergers, change the nature of our business and engage in certain transactions with affiliates.
At December 31, 2011, the Company had total availability for borrowings and letters of credit under the Credit Facility of $24,848,000 along with an unrestricted cash balance of $18,173,000 which provides for total cash and borrowing capacity of $43,021,000. Approximately $7,282,000 of the unrestricted cash balance relates to the Company’s Mexican subsidiaries. Standby letters of credit up to a maximum of $5,000,000 may be issued under the Credit Facility of which $990,000 and $1,886,000 were issued at December 31, 2011 and 2010, respectively.
The weighted average interest rate for outstanding borrowings at December 31, 2011 was 3.0%. The weighted average interest rates for borrowings during the years ended December 31, 2011 and 2010 were 5.6% and 9.3%, respectively. Interest incurred during the years ended December 31, 2011 and 2010 totaled approximately $1,881,000 and $2,458,000, respectively. The Company had no capitalized interest in 2011 or 2010. Interest paid during the years ended December 31, 2011 and 2010 totaled approximately $1,100,000 and $1,922,000, respectively.
(17) Fair Value of Financial Instruments
Cash, accounts receivable, accounts payable and accrued liabilities are reflected in the consolidated financial statements at their carrying amount which approximates fair value because of the short-term maturity of those instruments. The carrying amount of debt outstanding at December 31, 2011 under the Credit Facility approximates fair value because borrowings are for terms of less than six months and have rates that reflect currently available terms and conditions for similar debt.

SYPRIS SOLUTIONS, INC. NOTES TO CONSOLIDATED FINANCIAL STATEMENTS – CONTINUED
48
(18) Employee Benefit Plans
The Industrial Group sponsors noncontributory defined benefit pension plans (the Pension Plans) covering certain of its employees. The Pension Plans covering salaried and management employees provide pension benefits that are based on the employees’ highest five-year average compensation within ten years before retirement. The Pension Plans covering hourly employees and union members generally provide benefits at stated amounts for each year of service. All of the Company’s pension plans are frozen to new participants and certain plans are frozen to additional benefit accruals. The Company’s funding policy is to make the minimum annual contributions required by the applicable regulations. The Pension Plans’ assets are primarily invested in equity securities and fixed income securities. The following table details the components of pension (income) expense (in thousands):
Years ended December 31, 2011 2010
Service cost .......................................................................................... $ 36 $ 44 Interest cost on projected benefit obligation ......................................... 2,068 2,204 Net amortizations and deferrals ............................................................ 585 532 Expected return on plan assets ............................................................. (2,554) (2,594)
$ 135 $ 186 The following are summaries of the changes in the benefit obligations and plan assets and of the funded
status of the Pension Plans (in thousands):
December 31, 2011 2010
Change in benefit obligation: Benefit obligation at beginning of year ............................................ $ 42,094 $ 41,423 Service cost ....................................................................................... 36 44 Interest cost ....................................................................................... 2,068 2,204 Actuarial loss .................................................................................... 3,041 1,255 Benefits paid ..................................................................................... (3,095) (2,832) Benefit obligation at end of year ...................................................... $ 44,144 $ 42,094
Change in plan assets: Fair value of plan assets at beginning of year ................................... $ 34,364 $ 32,898 Actual return on plan assets .............................................................. 398 3,477 Company contributions ..................................................................... 753 821 Benefits paid ..................................................................................... (3,095) (2,832) Fair value of plan assets at end of year ............................................. $ 32,420 $ 34,364
Underfunded status of the plans ........................................................... $ (11,724) $ (7,730)
Balance sheet assets (liabilities): Other assets ....................................................................................... $ — $ — Accrued liabilities ............................................................................. — — Other liabilities ................................................................................. (11,724) (7,730) Net amount recognized ..................................................................... $ (11,724) $ (7,730)
Pension plans with accumulated benefit obligation in excess of plan assets:
Projected benefit obligation .............................................................. $ 44,144 $ 42,094 Accumulated benefit obligation ........................................................ 44,121 42,068 Fair value of plan assets .................................................................... 32,420 34,364

SYPRIS SOLUTIONS, INC. NOTES TO CONSOLIDATED FINANCIAL STATEMENTS – CONTINUED
49
December 31, 2011 2010
Projected benefit obligation and net periodic pension cost assumptions: Discount rate ....................................................................................... 4.40% 5.70 % Rate of compensation increase ........................................................... 4.00 4.00 Expected long-term rate of return on plan assets ................................ 7.75 8.25
Weighted average asset allocation: Equity securities.................................................................................. 61 % 63 % Debt securities .................................................................................... 39 37 Total .................................................................................................... 100 % 100 %
Investments in our defined benefit plans are stated at fair value. The fair values of our pension plan assets as of December 31, 2011, are as follows (in thousands): Significant Quoted Prices Other In Active Observable Markets Inputs (Level 1) (Level 2)
Asset categories: Cash and cash equivalents .................................................................. $ 480 $ — Equity investments:
U.S. Large Cap ................................................................................ — 14,041 U.S. Mid Cap .................................................................................. 1,162 — U.S. Small Cap ................................................................................ 1,023 — World Equity ................................................................................... 3,521 —
Fixed income securities ...................................................................... 12,193 — Total Plan Assets ................................................................................ $ 18,379 $ 14,041
The Company uses December 31 as the measurement date for the Pension Plans. Total estimated contributions expected to be paid to the plans during 2012 ranges from $1,500,000 to $1,700,000, which represents the minimum funding amounts required by federal law. The expected long-term rates of return on plan assets for determining net periodic pension cost for 2011 and 2010 were chosen by the Company from a best estimate range determined by applying anticipated long-term returns and long-term volatility for various assets categories to the target asset allocation of the plan. The target asset allocation of plan assets is equity securities ranging 55-65% and fixed income securities ranging 35-45% of total investments.
Accumulated other comprehensive loss at December 31, 2011 includes $19,012,000 of unrecognized actuarial losses that have not yet been recognized in net periodic pension cost: The actuarial loss included in accumulated other comprehensive loss and expected to be recognized in net periodic pension cost during the fiscal year ended December 31, 2012 is $806,000.
At December 31, 2011, the benefits expected to be paid in each of the next five fiscal years, and in aggregate for the five fiscal years thereafter are as follows (in thousands):
2012 ............................................................................................................................... 3,272 2013 ............................................................................................................................... 3,224 2014 ............................................................................................................................... 3,234 2015 ............................................................................................................................... 3,236 2016 ............................................................................................................................... 3,245 2017-2021 ..................................................................................................................... 15,467
$ 31,678

SYPRIS SOLUTIONS, INC. NOTES TO CONSOLIDATED FINANCIAL STATEMENTS – CONTINUED
50
The Company sponsors a defined contribution plan (the Defined Contribution Plan) for substantially all employees of the Company. The Defined Contribution Plan is intended to meet the requirements of Section 401(k) of the Internal Revenue Code. The Defined Contribution Plan allows the Company to match participant contributions and provide discretionary contributions. Effective March 2009, the Company suspended the participant match for all participants other than those covered by a union contract. Effective October 2010, the Company reinstated a 1% match for those same participants. Effective July 2011, the Company increased the match to 2% for those same participants. Contributions to the Defined Contribution Plan in 2011 and 2010 totaled approximately $446,000 and $332,000, respectively.
The Company has self-insured medical plans (the Medical Plans) covering substantially all domestic employees. The number of employees participating in the Medical Plans was approximately 715 and 693 at December 31, 2011 and 2010, respectively. The Medical Plans limit the Company’s annual obligations to fund claims to specified amounts per participant. The Company is adequately insured for amounts in excess of these limits. Employees are responsible for payment of a portion of the premiums. During 2011 and 2010, the Company charged approximately $3,979,000 and $4,771,000, respectively, to operations related to medical claims incurred and estimated, reinsurance premiums, and administrative costs for the Medical Plans.
In addition, certain of the Company’s non-U.S. employees are covered by various defined benefit and defined contribution plans. The Company’s expenses for these plans related to continuing operations totaled approximately $262,000 and $225,000 in 2011 and 2010, respectively. The aggregate benefit plan assets and accumulated benefit obligation of these plans are not significant.
(19) Commitments and Contingencies
The Company leases certain of its real property and certain equipment, vehicles and computer hardware under operating leases with terms ranging from month-to-month to ten years and which contain various renewal and rent escalation clauses. Future minimum annual lease commitments under operating leases that have initial or remaining noncancelable lease terms in excess of one year as of December 31, 2011 are as follows (in thousands):
2012 ............................................................................................................................... 2,025 2013 ............................................................................................................................... 1,861 2014 ............................................................................................................................... 1,594 2015 ............................................................................................................................... 1,461 2016 ............................................................................................................................... 1,461 2017 and thereafter ........................................................................................................ 1,461
$ 9,863
Rent expense for the years ended December 31, 2011 and 2010 totaled approximately $2,332,000 and $2,494,000, respectively.
As of December 31, 2011, the Company had outstanding purchase commitments of approximately $14,154,000 primarily for the acquisition of inventory and manufacturing equipment.
The Company bears insurance risk as a member of a group captive insurance entity for certain general liability, automobile and workers’ compensation insurance programs, a self-insured worker’s compensation program and a self-insured employee health program. The Company records estimated liabilities for its insurance programs based on information provided by the third-party plan administrators, historical claims experience, expected costs of claims incurred but not paid, and expected costs to settle unpaid claims. The Company monitors its estimated insurance-related liabilities on a quarterly basis. As facts change, it may become necessary to make adjustments that could be material to the Company’s consolidated results of operations and financial condition. The Company believes that its present insurance coverage and level of accrued liabilities are adequate.
The Company is involved in certain litigation and contract issues arising in the normal course of business. While the outcome of these matters cannot, at this time, be predicted in light of the uncertainties inherent therein, management does not expect that these matters will have a material adverse effect on the consolidated financial position or results of operations of the Company. For example, the Company has purchased certain plants with

SYPRIS SOLUTIONS, INC. NOTES TO CONSOLIDATED FINANCIAL STATEMENTS – CONTINUED
51
various potential environmental issues under purchase agreements which include indemnification provisions for, among other things, environmental conditions that existed on the sites at closing.
(20) Stock Option and Purchase Plans
The Company’s stock compensation program provides for the grant of restricted stock (including performance-based restricted stock), unrestricted stock, stock options and stock appreciation rights. A total of 3,000,000 shares of common stock were reserved for issuance under the 2004 Equity Plan. On May 11, 2010, the 2004 Equity Plan was replaced with the 2010 Sypris Omnibus Plan. A total of 3,655,088 shares of common stock were registered for issuance under the Plan. Additionally, awards under the 2004 Plan that are cancelled without having been fully exercised or vested are available again for new awards under the Omnibus Plan. The aggregate number of shares available for future grant as of December 31, 2011 and 2010 was 2,854,024 and 3,356,731, respectively.
The 2004 Equity Plan provides for restrictions which lapse after one, two, three or four years for certain grants or for certain other shares, one-third of the restriction is removed after three, five and seven years, respectively. The 2010 Omnibus Plan provides for restrictions which lapse after three years. During the restricted period, which is commensurate with each vesting period, the recipient has the right to receive dividends and voting rights for the shares. Generally, if a recipient leaves the Company before the end of the restricted period or if performance requirements, if any, are not met, the shares will be forfeited.
The Company has certain stock compensation plans under which options to purchase common stock may be granted to officers, key employees and non-employee directors. Options may be granted at not less than the market price on the date of grant. Stock option grants under the 2004 Equity Plan include both six and ten year lives along with graded vesting over three, four and five years of service. Stock option grants under the 2010 Omnibus Plan include a five year life along with vesting after three years of service.
Compensation expense is measured based on the fair value at the date of grant and is recognized on a straight-line basis over the vesting period. Fair value for restricted shares is equal to the stock price on the date of grant, while the fair value of each stock option grant is estimated on the date of grant using the Black-Scholes option-pricing method. The Company uses historical Company and industry data to estimate the expected price volatility, the expected option life, the expected forfeiture rate and the expected dividend yield. The risk-free rate is based on the U.S. Treasury yield curve in effect at the time of grant for the estimated life of the option.
The following weighted average assumptions were used to estimate the fair value of options granted using the Black-Scholes option-pricing model:
Years ended December 31, 2011 2010
Expected life (years) ................................................................................. 4.0 4.0 Expected volatility .................................................................................... 91.3 % 90.7 % Risk-free interest rates .............................................................................. 2.24 % 2.22 % Expected dividend yield ........................................................................... — —
On March 2, 2010, the Company granted 302,000 restricted stock awards under a long-term incentive program, with cliff vesting at three years of service. The Company also granted 131,889 options on March 2, 2010 with a five year life and cliff vesting at three years of service. The Company also granted 27,500 options through administrative grants during 2010.
On April 1, 2011, the Company granted 317,500 restricted stock awards under a long-term incentive program, with cliff vesting at three years of service. The Company also granted 96,000 restricted stock awards on September 1, 2011 under a retention agreement, with cliff vesting on January 1, 2015. The Company also granted 200,000 options on April 1, 2011 with a five year life and cliff vesting at three years of service.
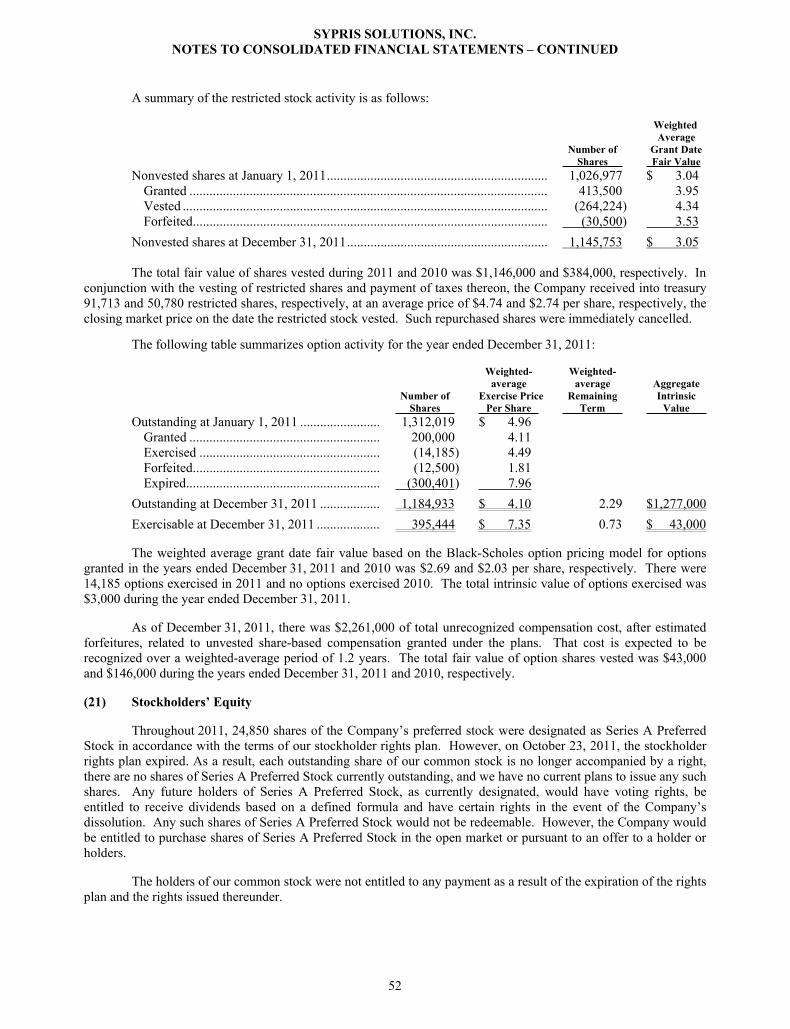
SYPRIS SOLUTIONS, INC. NOTES TO CONSOLIDATED FINANCIAL STATEMENTS – CONTINUED
52
A summary of the restricted stock activity is as follows:
Weighted Average Number of Grant Date Shares Fair Value
Nonvested shares at January 1, 2011 .................................................................. 1,026,977 $ 3.04 Granted ........................................................................................................... 413,500 3.95 Vested ............................................................................................................. (264,224) 4.34 Forfeited .......................................................................................................... (30,500) 3.53
Nonvested shares at December 31, 2011 ............................................................ 1,145,753 $ 3.05
The total fair value of shares vested during 2011 and 2010 was $1,146,000 and $384,000, respectively. In conjunction with the vesting of restricted shares and payment of taxes thereon, the Company received into treasury 91,713 and 50,780 restricted shares, respectively, at an average price of $4.74 and $2.74 per share, respectively, the closing market price on the date the restricted stock vested. Such repurchased shares were immediately cancelled.
The following table summarizes option activity for the year ended December 31, 2011:
Weighted- Weighted- average average Aggregate Number of Exercise Price Remaining Intrinsic Shares Per Share Term Value
Outstanding at January 1, 2011 ........................ 1,312,019 $ 4.96 Granted ......................................................... 200,000 4.11 Exercised ...................................................... (14,185) 4.49 Forfeited ........................................................ (12,500) 1.81 Expired.......................................................... (300,401) 7.96
Outstanding at December 31, 2011 .................. 1,184,933 $ 4.10 2.29 $1,277,000 Exercisable at December 31, 2011 ................... 395,444 $ 7.35 0.73 $ 43,000
The weighted average grant date fair value based on the Black-Scholes option pricing model for options granted in the years ended December 31, 2011 and 2010 was $2.69 and $2.03 per share, respectively. There were 14,185 options exercised in 2011 and no options exercised 2010. The total intrinsic value of options exercised was $3,000 during the year ended December 31, 2011.
As of December 31, 2011, there was $2,261,000 of total unrecognized compensation cost, after estimated forfeitures, related to unvested share-based compensation granted under the plans. That cost is expected to be recognized over a weighted-average period of 1.2 years. The total fair value of option shares vested was $43,000 and $146,000 during the years ended December 31, 2011 and 2010, respectively.
(21) Stockholders’ Equity
Throughout 2011, 24,850 shares of the Company’s preferred stock were designated as Series A Preferred Stock in accordance with the terms of our stockholder rights plan. However, on October 23, 2011, the stockholder rights plan expired. As a result, each outstanding share of our common stock is no longer accompanied by a right, there are no shares of Series A Preferred Stock currently outstanding, and we have no current plans to issue any such shares. Any future holders of Series A Preferred Stock, as currently designated, would have voting rights, be entitled to receive dividends based on a defined formula and have certain rights in the event of the Company’s dissolution. Any such shares of Series A Preferred Stock would not be redeemable. However, the Company would be entitled to purchase shares of Series A Preferred Stock in the open market or pursuant to an offer to a holder or holders.
The holders of our common stock were not entitled to any payment as a result of the expiration of the rights plan and the rights issued thereunder.

SYPRIS SOLUTIONS, INC. NOTES TO CONSOLIDATED FINANCIAL STATEMENTS – CONTINUED
53
The Company’s accumulated other comprehensive loss consists of employee benefit related adjustments and foreign currency translation adjustments.
The components of comprehensive income (loss), net of tax, are as follows for the periods indicated (in thousands):
Years ended December 31, 2011 2010
Net income (loss) ................................................................................ $ 7,907 $ (10,204)
Other comprehensive income (loss): Foreign currency translation adjustments ......................................... (4,863) 2,760 Unrealized gain on available-for-sale securities ............................... 1,685 — Pension adjustments – U.S. ............................................................... (4,611) 160 Pension adjustments – Mexico ......................................................... (57) (57)
Total comprehensive income (loss) ...................................................... $ 61 $ (7,341)
Accumulated other comprehensive loss consisted of the following (in thousands):
December 31, 2011 2010
Foreign currency translation adjustments ............................................. $ (6,807) $ (1,944) Unrealized gain on available-for-sale securities .................................. 1,685 — Employee benefit related adjustments, net of tax of $2,512 – U.S. ..... (16,500) (11,889) Employee benefit related adjustments – Mexico .................................. (548) (491)
Accumulated other comprehensive loss ............................................... $ (22,170) $ (14,324)
(22) Income Taxes
The Company accounts for income taxes under the liability method. Accordingly, deferred income taxes have been provided for temporary differences between the recognition of revenue and expenses for financial and income tax reporting purposes and between the tax basis of assets and liabilities and their reported amounts in the consolidated financial statements.
The components of income (loss) from continuing operations before taxes are as follows (in thousands):
Years ended December 31, 2011 2010
Domestic ............................................................................................. $ (2,770) $ (13,307) Foreign ................................................................................................ 13,826 4,603
$ 11,056 $ (8,704)

SYPRIS SOLUTIONS, INC. NOTES TO CONSOLIDATED FINANCIAL STATEMENTS – CONTINUED
54
The components of income tax expense (benefit) applicable to continuing operations are as follows (in thousands):
Years ended December 31, 2011 2010
Current: Federal ................................................................................................ $ 176 $ (219) State .................................................................................................... 11 (64) Foreign ................................................................................................ 1,926 683
Total current income tax expense .................................................. 2,113 400
Deferred: Federal ................................................................................................ — 3,067 State .................................................................................................... — 419 Foreign ................................................................................................ 508 (2,882)
Total deferred income tax expense ................................................ 508 604 $ 2,621 $ 1,004
The Company files a consolidated federal income tax return which includes all domestic subsidiaries. State income taxes paid in the U.S. during 2011 and 2010 totaled $78,000 and $591,000, respectively. Foreign income taxes paid during 2011 and 2010 totaled $1,230,000 and $1,313,000, respectively. There were no foreign refunds received in 2011, and refunds of $3,200,000 were received in 2010. The 2010 foreign refund included $724,000 of interest and inflationary adjustments. There were no federal taxes paid in 2011 and 2010, and there were no federal refunds received in 2011. The Company received federal refunds of $261,000 in 2010. At December 31, 2011, the Company had $96,352,000 of federal net operating loss carryforwards available to offset future federal taxable income, which will expire in various amounts from 2024 to 2031.
At December 31, 2011, the Company had $31,212,000 of state net operating loss carryforwards available to offset future state taxable income, the majority of which relates to Florida. Such carryforwards reflect income tax losses incurred which will expire on December 31 of the following years (in thousands):
2018 ............................................................................................................................... $ 464 2026 ............................................................................................................................... 627 2027 ............................................................................................................................... 3,520 2028 ............................................................................................................................... 8,316 2029 ............................................................................................................................... 2,784 2030 ............................................................................................................................... 7,621 2031 ............................................................................................................................... 7,880 $ 31,212

SYPRIS SOLUTIONS, INC. NOTES TO CONSOLIDATED FINANCIAL STATEMENTS – CONTINUED
55
The following is a reconciliation of income tax expense applicable to continuing operations to that computed by applying the federal statutory rate to loss from continuing operations before income taxes (in thousands):
Years ended December 31, 2011 2010
Federal tax expense (benefit) at the statutory rate ................................ $ 3,665 $ (3,046) Current year permanent differences ..................................................... (500) (251) State income taxes, net of federal tax impact ....................................... (562) (519) Dividend from foreign subsidiary ........................................................ 2,593 — Mexican minimum taxes ...................................................................... — 252 Effect of tax rates of foreign subsidiaries ............................................. (758) (1,395) Currency translation effect on temporary differences .......................... 123 (364) Valuation allowance ............................................................................. (2,172) 6,639 Prior year adjustment............................................................................ 208 — Other ..................................................................................................... 24 (312)
$ 2,621 $ 1,004
Deferred income tax assets and liabilities are as follows (in thousands):
December 31, 2011 2010
Deferred tax assets: Compensation and benefit accruals .................................................... $ 2,900 $ 2,884 Inventory valuation ............................................................................. 3,318 3,436 Federal and state net operating loss carryforwards ............................. 39,198 39,133 Deferred revenue ................................................................................ 4,520 6,789 Accounts receivable allowance .......................................................... 138 215 Defined benefit pension plan .............................................................. 3,769 2,427 Foreign deferred revenue and other provisions .................................. 7,096 11,190 AMT credits ....................................................................................... 185 185 Other ................................................................................................... 1,457 668 62,581 66,927 Domestic valuation allowance ............................................................ (51,215) (50,756) Foreign valuation allowance ............................................................... (1,492) (4,320)
Total deferred tax assets ................................................................ 9,874 11,851
Deferred tax liabilities: Depreciation ....................................................................................... (4,270) (4,981)
Total deferred tax liabilities .......................................................... (4,270) (4,981)
Net deferred tax asset ........................................................................... $ 5,604 $ 6,870
ASC 740, Income Taxes, requires that a valuation allowance be established when it is more likely than not that all or a portion of a deferred tax asset will not be realized. The domestic loss incurred in the year ended December 31, 2011, and the net cumulative loss for the current and prior two years, represents negative evidence under the provisions of ASC 740 requiring the Company to establish a valuation allowance against domestic deferred tax assets. This valuation allowance offsets assets associated with future tax deductions and carryforward items. Until an appropriate level and characterization of profitability is attained, the Company expects to continue to maintain a valuation allowance on its net deferred tax assets related to future U.S. and certain non-U.S. tax benefits.
The gross deferred tax asset for the Company’s Mexican subsidiary was $7,096,000 and $11,190,000 as of December 31, 2011 and 2010, respectively. Included in this balance is a deferred tax asset associated with the impairment of marketable securities, which was the result of losses recorded for book purposes on the portion of such marketable securities allocated to the Mexican subsidiary. A full valuation allowance of $1,492,000 and $4,320,000 was applied to this specific deferred tax asset as of December 31, 2011 and 2010, respectively.

SYPRIS SOLUTIONS, INC. NOTES TO CONSOLIDATED FINANCIAL STATEMENTS – CONTINUED
56
The net deferred tax asset balances of $5,604,000 and $6,870,000 at December 31, 2011 and 2010, respectively, are attributable to the Mexican subsidiary. The Company has been profitable in Mexico in the past and anticipates continuing profitability in the future.
The ASC Income Tax topic includes guidance for the accounting for uncertainty in income taxes recognized in an enterprise’s financials. Specifically, the guidance prescribes a recognition threshold and measurement attribute for the financial statement recognition and measurement of a tax position taken or expected to be taken in a tax return and also provides guidance on derecognition, classification, interest and penalties, accounting in interim periods, disclosure, and transition. The total amount of gross unrecognized tax benefits as of December 31, 2011 and 2010 was $200,000. There were no changes to the unrecognized tax benefit balance during the years ended December 31, 2011 and December 31, 2010.
If the Company’s positions are sustained by the taxing authority in favor of the Company, the entire balance at December 31, 2011 would reduce the Company’s effective tax rate. The Company does not expect its unrecognized tax benefits to change significantly over the next 12 months. The Company recognizes accrued interest and penalties related to uncertain tax positions in income tax expense. As of December 31, 2011 and 2010, the Company does not have an accrual for the payment of tax-related interest and penalties.
The Company files income tax returns in the U.S. federal jurisdiction, and various state and foreign jurisdictions. The Internal Revenue Service (IRS) is not currently examining the Company’s U.S. income tax returns for 2008 through 2011, for which the statute has yet to expire. In addition, open tax years related to state and foreign jurisdictions remain subject to examination.
No provision has been made for U.S. federal and state income taxes or foreign taxes that may result from future remittances of the undistributed earnings of foreign subsidiaries because it is expected that such earnings will be reinvested outside the U.S. indefinitely. The cumulative amount of unremitted income for which income taxes have not been provided totaled $8.0 million at December 31, 2011. Determination of the amount of any unrecognized deferred income tax liability on these unremitted earnings is not practicable.
(23) Earnings (Loss) Per Common Share
The Company computes earnings per share using the two-class method, which is an earnings allocation formula that determines earnings per share for common stock and participating securities. Restricted stock granted by the Company is considered a participating security since it contains a non-forfeitable right to dividends.
Our potentially dilutive securities include potential common shares related to our stock options and restricted stock. Diluted earnings per share considers the impact of potentially dilutive securities except in periods in which there is a loss because the inclusion of the potential common shares would have an anti-dilutive effect. Diluted earnings per share excludes the impact of common shares related to our stock options in periods in which the option exercise price is greater than the average market price of our common stock for the period. There were 652,000 potential common shares excluded from diluted earnings per share for the year ended December 31, 2011, because the effect of inclusion would be anti-dilutive. All potential common shares were excluded from earnings per share for the year ended December 31, 2010 because the effect of inclusion would be anti-dilutive.
A reconciliation of the weighted average shares outstanding used in the calculation of basic and diluted earnings (loss) per common share is as follows (in thousands): Years ended December 31, 2011 2010 Earnings attributable to stockholders:
Income (loss) from continuing operations attributable to stockholders. ......... $ 8,435 $ (9,708) Discontinued operations, net of tax ................................................................. (528) (496) Net income (loss) ............................................................................................ $ 7,907 $ (10,204) Less distributed and undistributed earnings allocable to restricted award holders ................................................................................................ (399) —
Net income (loss) allocable to common stockholders ........................................ $ 7,508 $ (10,204)

SYPRIS SOLUTIONS, INC. NOTES TO CONSOLIDATED FINANCIAL STATEMENTS – CONTINUED
57
Years ended December 31, 2011 2010 Basic earnings (loss) per common share attributable to stockholders:
Continuing operations. .................................................................................... $ 0.43 $ (0.52) Discontinued operations .................................................................................. (0.03) (0.03) Net income (loss) ............................................................................................ $ 0.40 $ (0.55)
Diluted earnings (loss) per common share attributable to stockholders: Continuing operations. .................................................................................... $ 0.43 $ (0.52) Discontinued operations .................................................................................. (0.03) (0.03) Net income (loss) ............................................................................................ $ 0.40 $ (0.55)
Weighted average shares outstanding – basic. ................................................ 18,823 18,605 Weighted average additional shares assuming conversion of potential common shares ........................................................ 185 —
Weighted average shares outstanding – diluted. ............................................. 19,008 18,605
(24) Segment Information
The Company is organized into two business groups, the Industrial Group and the Electronics Group. The segments are each managed separately because of the distinctions between the products, services, markets, customers, technologies, and workforce skills of the segments. The Industrial Group provides manufacturing services for a variety of customers that outsource forged and finished steel components and subassemblies. The Industrial Group also manufactures high-pressure closures and other fabricated products. The Electronics Group provides manufacturing and technical services as an outsourced service provider and manufactures complex data storage systems. Revenue derived from outsourced services for the Industrial Group accounted for 77% and 67% of total net revenue in 2011 and 2010, respectively. Revenue derived from outsourced services for the Electronics Group accounted for 7% and 16% of total net revenue in 2011 and 2010, respectively. There was no intersegment net revenue recognized for any year presented.
The following table presents financial information for the reportable segments of the Company (in thousands):
Years ended December 31, 2011 2010
Net revenue from unaffiliated customers: Industrial Group ................................................................................ $ 273,305 $ 191,154 Electronics Group ............................................................................. 62,320 75,500 $ 335,625 $ 266,654 Gross profit: Industrial Group ................................................................................ $ 27,343 $ 9,002 Electronics Group ............................................................................. 7,886 15,893 $ 35,229 $ 24,895 Restructuring expense, net: Industrial Group ................................................................................ $ 231 $ 964 Electronics Group ............................................................................. — 1,332 $ 231 $ 2,296

SYPRIS SOLUTIONS, INC. NOTES TO CONSOLIDATED FINANCIAL STATEMENTS – CONTINUED
58
Years ended December 31, 2011 2010
Operating income (loss): Industrial Group ................................................................................ $ 20,599 $ (1,083) Electronics Group ............................................................................. (5,785) 1,965 General, corporate and other ............................................................. (8,630) (8,295) $ 6,184 $ (7,413) Depreciation and amortization: Industrial Group ................................................................................ $ 12,191 $ 12,477 Electronics Group ............................................................................. 1,856 2,048 General, corporate and other ............................................................. 169 199 $ 14,216 $ 14,724
Capital expenditures: Industrial Group ................................................................................ $ 5,319 $ 1,255 Electronics Group ............................................................................. 1,382 978 General, corporate and other ............................................................. 147 — $ 6,848 $ 2,233
December 31, 2011 2010
Total assets: Industrial Group ................................................................................ $ 128,386 $ 127,432 Electronics Group ............................................................................. 32,277 42,910 General, corporate and other ............................................................. 15,062 9,350 $ 175,725 $ 179,692
Total liabilities: Industrial Group ................................................................................ $ 90,669 $ 78,056 Electronics Group ............................................................................. 8,336 13,036 General, corporate and other ............................................................. 16,252 28,802 $ 115,257 $ 119,894
The Company’s export sales from the U.S. totaled $37,914,000 and $28,488,000 in 2011 and 2010, respectively. Approximately $99,074,000 and $63,805,000 of net revenue in 2011 and 2010, respectively, and $17,527,000 and $21,298,000 of long lived assets at December 31, 2011 and 2010, respectively, and net assets of $16,697,000 and $28,874,000 at December 31, 2011 and 2010 relate to the Company’s international operations.
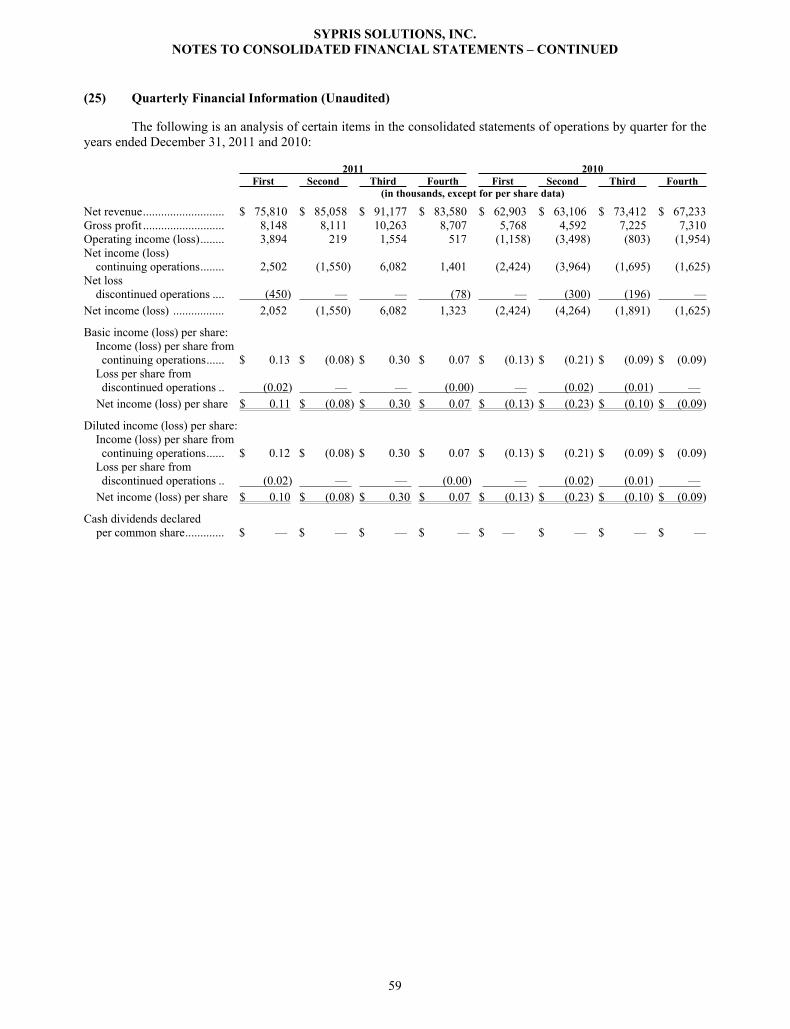
SYPRIS SOLUTIONS, INC. NOTES TO CONSOLIDATED FINANCIAL STATEMENTS – CONTINUED
59
(25) Quarterly Financial Information (Unaudited)
The following is an analysis of certain items in the consolidated statements of operations by quarter for the years ended December 31, 2011 and 2010:
2011 2010 First Second Third Fourth First Second Third Fourth
(in thousands, except for per share data) Net revenue ........................... $ 75,810 $ 85,058 $ 91,177 $ 83,580 $ 62,903 $ 63,106 $ 73,412 $ 67,233 Gross profit ........................... 8,148 8,111 10,263 8,707 5,768 4,592 7,225 7,310 Operating income (loss) ........ 3,894 219 1,554 517 (1,158) (3,498) (803) (1,954) Net income (loss) continuing operations ........ 2,502 (1,550) 6,082 1,401 (2,424) (3,964) (1,695) (1,625) Net loss discontinued operations .... (450) — — (78) — (300) (196) — Net income (loss) ................. 2,052 (1,550) 6,082 1,323 (2,424) (4,264) (1,891) (1,625)
Basic income (loss) per share: Income (loss) per share from continuing operations ...... $ 0.13 $ (0.08) $ 0.30 $ 0.07 $ (0.13) $ (0.21) $ (0.09) $ (0.09) Loss per share from discontinued operations .. (0.02) — — (0.00) — (0.02) (0.01) — Net income (loss) per share $ 0.11 $ (0.08) $ 0.30 $ 0.07 $ (0.13) $ (0.23) $ (0.10) $ (0.09)
Diluted income (loss) per share: Income (loss) per share from continuing operations ...... $ 0.12 $ (0.08) $ 0.30 $ 0.07 $ (0.13) $ (0.21) $ (0.09) $ (0.09) Loss per share from discontinued operations .. (0.02) — — (0.00) — (0.02) (0.01) — Net income (loss) per share $ 0.10 $ (0.08) $ 0.30 $ 0.07 $ (0.13) $ (0.23) $ (0.10) $ (0.09)
Cash dividends declared per common share ............. $ — $ — $ — $ — $ — $ — $ — $ —
60
Item 9. Changes in and Disagreements with Accountants on Accounting and Financial Disclosure
None.
Item 9A. Controls and Procedures
An evaluation was performed under the supervision and with the participation of the Company’s management, including the President and Chief Executive Officer (the CEO) and the Chief Financial Officer (the CFO), of the effectiveness of the design and operation of the Company’s disclosure controls and procedures, as defined in Rules 13a-15(e) and 15d-15(e) of the Securities Exchange Act of 1934. Based on that evaluation, the Company’s management, including the CEO and CFO, concluded that the Company’s disclosure controls and procedures were effective as of the end of the period covered by this report.
Management’s Report on Internal Control over Financial Reporting
The management of Sypris Solutions, Inc. is responsible for establishing and maintaining adequate internal control over financial reporting, as such term is defined in Exchange Act Rules 13a-15(f) and 15d-15(f). Management’s report on internal control over financial reporting is included in Part II, Item 8 of this Annual Report on Form 10-K. Additionally, Ernst & Young LLP, our independent auditors and a registered public accounting firm, has issued a report on Sypris Solutions, Inc.’s internal control over financial reporting, which is included in Part II, Item 8 of this Annual Report on Form 10-K.
Changes in Internal Control over Financial Reporting
There were no changes in our internal control over financial reporting that occurred during the quarter ended December 31, 2011, that have materially affected, or are reasonably likely to materially affect, our internal control over financial reporting.
Item 9B. Other Information
None.

61
PART III
Item 10. Directors, Executive Officers and Corporate Governance
The information required herein is incorporated by reference from sections of the Company’s Proxy Statement titled “Section 16(a) Beneficial Ownership Reporting Compliance,” “Governance of the Company –Committees of the Board of Directors,” “Governance of the Company – Audit and Finance Committee,” “Proposal One, Election of Directors,” and “Executive Officers,” which Proxy Statement will be filed with the Securities and Exchange Commission pursuant to instruction G(3) of the General Instructions to Form 10-K.
The Company has adopted a Code of Business Conduct that applies to all of its directors, officers (including its chief executive officer, chief financial officer, chief accounting officer and any person performing similar functions) and employees. The Company has made the Code of Business Conduct and any amendments and waivers available on its website at www.sypris.com.
Item 11. Executive Compensation
The information required herein is incorporated by reference from sections of the Company’s Proxy Statement titled “2011 Director Compensation,” “Governance of the Company,” “Summary Compensation Table,” and “Outstanding Equity Awards at Fiscal Year-End 2011,” which Proxy Statement will be filed with the Securities and Exchange Commission pursuant to instruction G(3) of the General Instructions to Form 10-K.
Item 12. Security Ownership of Certain Beneficial Owners and Management and Related Stockholder Matters
The information required herein is incorporated by reference from the section of the Company’s Proxy Statement titled “Stock Ownership of Certain Beneficial Owners” which Proxy Statement will be filed with the Securities and Exchange Commission pursuant to instruction G(3) of the General Instructions to Form 10-K.
Equity Compensation Plan Information
The following table provides information as of December 31, 2011 with respect to shares of Sypris common stock that may be issued under our equity compensation plans.
Plan Category
Number of Securities To be Issued Upon
Exercise of Outstanding Options
(a)
Weighted Average Exercise Price of
Outstanding Options (b)
Number of Securities Remaining Available For Future Issuance Under Equity Compensation
Plans (Excluding Securities Reflected in
Column (a)) (c) Equity Compensation Plans Approved by
Stockholders ............................................... 1,184,933(1) $ 4.10 2,854,024(2)Equity Compensation Plans Not Approved
by Stockholders .......................................... — — — Total ................................................................ 1,184,933 $ 4.10 2,854,024
(1) Consists of (a) 43,329 outstanding options under the 1994 Independent Directors’ Stock Option Plan, which
Plan expired on October 27, 2004, (b) 916,604 outstanding options under the 2004 Equity Plan, (c) and 225,000 outstanding options under the 2010 Omnibus Plan.
(2) Shares remaining available for issuance under the 2010 Omnibus Plan.

62
Item 13. Certain Relationships and Related Transactions and Director Independence
The information required herein is incorporated by reference from the sections of the Company’s Proxy Statement titled “Governance of the Company – Transactions with Related Persons” and “Governance of the Company – Independence” which Proxy Statement will be filed with the Securities and Exchange Commission pursuant to instruction G(3) of the General Instructions to Form 10-K.
Item 14. Principal Accountant Fees and Services
The information required herein is incorporated by reference from the section of the Company’s Proxy Statement titled “Relationship with Independent Public Accountants,” which Proxy Statement will be filed with the Securities and Exchange Commission pursuant to instruction G(3) of the General Instructions to Form 10-K.

63
PART IV
Item 15. Exhibits and Financial Statement Schedules
(a) The following documents are filed as part of this Annual Report on Form 10-K:
1. Financial Statements
The financial statements as set forth under Item 8 of this Annual Report on Form 10-K are included.
2. Exhibits
Exhibit Number Description
3.1 Certificate of Incorporation of the Company (incorporated by reference to Exhibit 3.1 to the Company’s Form 10-Q for the quarterly period ended June 30, 2004 filed on August 3, 2004 (Commission File No. 000-24020)).
3.2 Bylaws of the Company (incorporated by reference to Exhibit 4.2 to the Company’s Registration Statement on Form S-8 filed May 9, 2002 (No. 333-87880)).
3.3 Amended and Restated Bylaws of the Company (incorporated by reference to Exhibit 3.2 to the Company’s Form 8-K filed October 31, 2011 (Commission File No. 000-24020)).
4.1 Specimen common stock certificate (incorporated by reference to Exhibit 4.1 to the Company’s Form 10-K for the fiscal year ended December 31, 1998 filed on March 5, 1999 (Commission File No. 000-24020)).
10.1.1 Amended and Restated Loan Agreement dated as of April 6, 2007 between Sypris Solutions, Inc., Sypris Test & Measurement, Inc., Sypris Technologies, Inc., Sypris Electronics, LLC, Sypris Data Systems, Inc., Sypris Technologies Marion, LLC, Sypris Technologies Kenton, Inc., Sypris Technologies Mexican Holdings, LLC; and JP Morgan Chase Bank, N.A., LaSalle Bank National Association, and National City Bank (incorporated by reference to Exhibit 10.1 to the Company’s Form 8-K filed on April 11, 2007 (Commission File No. 000-24020)).
10.1.2 2007A Amendment to Loan Documents between JP Morgan Chase Bank, NA, Sypris Solutions, Inc., Sypris Test & Measurement, Inc., Sypris Technologies, Inc., Sypris Electronics, LLC, Sypris Data Systems, Inc., Sypris Technologies Marion, LLC and Sypris Technologies Kenton, Inc. dated September 17, 2007 (incorporated by reference to Exhibit 10.3 to the Company’s Form 10-Q filed on November 2, 2007 (Commission File No. 000-24020)).
10.1.3 2009A Amendment to Loan Documents between JP Morgan Chase Bank, NA, Sypris Solutions, Inc., Sypris Test & Measurement, Inc., Sypris Technologies, Inc., Sypris Electronics, LLC, Sypris Data Systems, Inc., Sypris Technologies Marion, LLC and Sypris Technologies Kenton, Inc. dated April 1, 2009 (incorporated by reference to Exhibit 10.1 to the Company’s Form 10-Q/A filed on November 20, 2009 (Commission File No. 000-24020)).
10.1.4 2009B Amendment to Loan Documents between JP Morgan Chase Bank, NA, Sypris Solutions, Inc., Sypris Technologies, Inc., Sypris Electronics, LLC, Sypris Data Systems, Inc., Sypris Technologies Marion, LLC and Sypris Technologies Kenton, Inc. dated October 26, 2009 (incorporated by reference to Exhibit 10.6.13 to the Company’s Form 10-K for the fiscal year ended December 31, 2009 filed on March 23, 2010 (Commission File No. 000-24020)).

64
Exhibit
Number Description
10.2 Note Purchase Agreement between The Guardian Life Insurance Company of America, Connecticut General Life Insurance Company, Life Insurance Company of North America, Jefferson Pilot Financial Insurance Company, Jefferson Pilot Life Insurance Company, Jefferson Pilot LifeAmerica Insurance Company, and Sypris Solutions, Inc. dated as of June 10, 2004 (incorporated by reference to Exhibit 10.2 to the Company’s Form 10-Q for the quarterly period ended June 30, 2004 filed on August 3, 2004 (Commission File No. 000-24020)).
10.2.1 First Amendment to Note Purchase Agreement between The Guardian Life Insurance Company of America, Connecticut General Life Insurance Company, Life Insurance Company of North America, Jefferson Pilot Financial Insurance Company, Jefferson Pilot Life Insurance Company, Jefferson Pilot LifeAmerica Insurance Company, and Sypris Solutions, Inc. dated as of August 3, 2005 (incorporated by reference to Exhibit 10.3 to the Company’s Form 10-Q filed on August 5, 2005 (Commission File No. 000-24020)).
10.2.2 Second Amendment to Note Purchase Agreement between The Guardian Life Insurance Company of America, Connecticut General Life Insurance Company, Life Insurance Company of North America, Jefferson Pilot Financial Insurance Company, Jefferson Pilot Life Insurance Company, Jefferson Pilot LifeAmerica Insurance Company, and Sypris Solutions, Inc. dated as of March 13, 2006 (incorporated by reference to Exhibit 10.7.2 to the Company’s Form 10-K for the fiscal year ended December 31, 2005 filed on March 15, 2006 (Commission File No. 000-24020)).
10.2.3 Third Amendment to the Note Purchase Agreement dated as of April 6, 2007 between Sypris Solutions, Inc., Sypris Test & Measurement, Inc., Sypris Technologies, Inc., Sypris Electronics, LLC, Sypris Data Systems, Inc., Sypris Technologies Marion, LLC, Sypris Technologies Kenton, Inc., Sypris Technologies Mexican Holdings, LLC; and The Guardian Life Insurance Company Of America, Connecticut General Life Insurance Company , Life Insurance Company of North America, Jefferson Pilot Financial Insurance Company, Lincoln National Life Insurance Company, Lincoln Life & Annuity Company of New York (incorporated by reference to Exhibit 10.2 to the Company’s Form 8-K filed on April 11, 2007(Commission File No. 000-24020)).
10.2.4 Fourth Amendment to the Note Purchase Agreement dated as of April 1, 2009 between Sypris Solutions, Inc., Sypris Test & Measurement, Inc., Sypris Technologies, Inc., Sypris Electronics, LLC, Sypris Data Systems, Inc., Sypris Technologies Marion, LLC, Sypris Technologies Kenton, Inc., Sypris Technologies Mexican Holdings, LLC; and The Guardian Life Insurance Company Of America, Connecticut General Life Insurance Company , Life Insurance Company of North America, Jefferson Pilot Financial Insurance Company, Lincoln National Life Insurance Company, Lincoln Life & Annuity Company of New York (incorporated by reference to Exhibit 10.2 to the Company’s Form 10-Q/A filed on November 20, 2009 (Commission File No. 000-24020)).
10.2.5 Security Interest Agreement dated April 6, 2007 (incorporated by reference to Exhibit 10.3 to the Company’s Form 8-K filed on April 11, 2007 (Commission File No. 000-24020)).
10.3 Revolving Credit and Security Agreement between PNC Bank, National Association, Sypris Solutions, Inc., Sypris Technologies, Inc., Sypris Electronics, LLC, Sypris Data Systems, Inc., Sypris Technologies Marion, LLC, Sypris Technologies Kenton, Inc. and Sypris Technologies Mexican Holdings, LLC dated as of May 12, 2011 (incorporated by reference to Exhibit 10.1 to the Company’s Form 10-Q filed on August 9, 2011 (Commission File No. 000-24020)).
10.4 Lease between John Hancock Mutual Life Insurance Company and Honeywell, Inc. dated April 27, 1979; related Notice of Assignment from John Hancock Mutual Life Insurance Company to Sweetwell Industrial Associates, L.P., dated July 10, 1986; related Assignment and Assumption of Lease between Honeywell, Inc. and Defense Communications Products Corporation (prior name of Group Technologies Corporation) dated May 21, 1989; and related Amendment I to Lease Agreement between Sweetwell Industries Associates, L.P. and Group Technologies Corporation dated October 25, 1991, regarding Tampa industrial park property (incorporated by reference to Exhibit 10.2 to the Company’s Registration Statement on Form S-1 filed May 18, 1994 (Registration No. 33-76326)).

65
Exhibit Number Description
10.4.1 Agreement related to Fifth Renewal of Lease between Sweetwell Industries Associates, L.P. and Group Technologies Corporation dated October 12, 2006, regarding Tampa industrial park property (incorporated by reference to Exhibit 10.8.2 to the Company’s Form 10-K for the fiscal year ended December 31, 2006 filed on March 14, 2007 (Commission File No. 000-24020)).
10.4.2 Agreement related to Sixth Renewal of Lease between Sweetwell Industries Associates, L.P. and Group Technologies Corporation dated August 13, 2008, regarding Tampa industrial park property (incorporated by reference to Exhibit 10.1 to the Company’s Form 10-Q for the quarterly period ended September 28, 2008 filed on November 5, 2008 (Commission File No. 000-24020)).
10.5* Sypris Solutions, Inc. Independent Directors’ Stock Option Plan as Amended and Restated effective February 26, 2002 (incorporated by reference to Exhibit 4.5 to the Company’s Form S-8 filed on May 9, 2002 (Registration No. 333-87882)).
10.6* Sypris Solutions, Inc., Directors Compensation Program As Amended and Restated Effective February 24, 2004 and as amended December 15, 2004, (incorporated by reference to Exhibit 10.1 to the Company’s Form 8-K filed on December 21, 2004 (Commission File No. 000-24020)).
10.7* Sypris Solutions, Inc. Directors Compensation Program adopted on September 1, 1995 Amended and Restated on December 17, 2008 (incorporated by reference to Exhibit 10.17 to the Company’s Form 10-K for the fiscal year ended December 31, 2008 filed on March 31, 2009 (Commission File No. 000-24020)).
10.8* Form of 2009 Sypris Three-Year Bonus Agreement, effective as of May 12, 2009. (incorporated by reference to Exhibit 10.1 to the Company’s Form 10-Q for the quarterly period ended July 5, 2009 filed on August 18, 2009 (Commission File No. 000-24020)).
10.9* 2004 Sypris Equity Plan effective as of April 27, 2004 (incorporated by reference to Exhibit 10.1 to the Company’s Form 10-Q for the quarterly period ended March 31, 2004 filed on April 30, 2004 (Commission File No. 000-24020)).
10.10* 2010 Sypris Omnibus Plan effective as of May 11, 2010 (incorporated by reference to Exhibit 10.1 to the Company’s Registration Statement on Form S-8 filed on May 19, 2010 (Commission File No. 333-166951)).
10.11* Amended Executive Long-Term Incentive Program and Alternate Form of Executive Long-Term Incentive Award Agreements for Grants to Executive Officers and Other Key Employees (incorporated by reference to Exhibit 10.10 to the Company’s Form 10-Q filed on August 5, 2005 (Commission File No. 000-24020)).
10.12* Amended 2010 Executive Long-Term Incentive Program and Alternate Form of Executive Long-Term Incentive Award Agreements for Grants to Executive Officers (incorporated by reference to Exhibit 10.1 to the Company’s Form 10-Q filed on May 18, 2010 (Commission File No. 000-24020)).
10.13* Form of Employment Agreement between Sypris Solutions, Inc. and participants in the Sypris Solutions, Inc. Executive Long-Term Incentive Program for 2010 dated March 2, 2010 (incorporated by reference to Exhibit 10.2 to the Company’s Form 10-Q filed on May 18, 2010 (Commission File No. 000-24020)).
10.14* Form of Employment Agreement between Sypris Solutions, Inc. and participants in the Sypris Solutions, Inc. Executive Long-Term Incentive Program for 2011 dated March 2, 2011 (incorporated by reference to Exhibit 10.39 to the Company’s Form 10-K filed on March 15, 2011 (Commission File No. 000-24020)).
10.15 Preliminary Settlement Agreement between Sypris Solutions, Inc, and Dana Corporation (Debtor in Possession) dated May 10, 2006 (incorporated by reference to Exhibit 10.1 to the Company’s Form 8-K filed on May 10, 2006 (Commission File No. 000-24020)).
10.16* Form of Standard Terms of Executive Awards Granted Under the 2008 Stock Option Exchange Program (incorporated by reference to Exhibit 10.1 to the Company’s Form 8-K filed on April 4, 2008 (Commission File No. 000-24020)).

66
Exhibit Number Description
10.17 Settlement Agreement with Dana Corporation signed on July 24, 2007 and effective as of August 7, 2007, replaces redacted copy of Settlement Agreement with Dana Corporation signed on July 24, 2007 and effective as of August 7, 2007 (incorporated by reference to Exhibit 10.1 to the Company’s Form 10-Q filed on August 7, 2008 (Commission File No. 000-24020)) .
10.18 Redacted copy of Supply Agreement with Dana Corporation signed on July 24, 2007 and effective as of August 7, 2007 (incorporated by reference to Exhibit 10.2 to the Company’s Form 10-Q filed on November 2, 2007 (Commission File No. 000-24020)).
10.19* Executive Equity Repurchase Agreement dated December 20, 2011.
21 Subsidiaries of the Company
23 Consent of Ernst & Young LLP
31.1 CEO certification pursuant to Section 302 of Sarbanes - Oxley Act of 2002.
31.2 CFO certification pursuant to Section 302 of Sarbanes - Oxley Act of 2002.
32 CEO and CFO certification pursuant to 18 U.S.C. Section 1350, as adopted pursuant to Section 906 of the Sarbanes - Oxley Act of 2002.
101.INS XBRL Instance Document
101.SCH XBRL Taxonomy Extension Schema Document
101.CAL XBRL Taxonomy Extension Calculation Linkbase Document
101.DEF XBRL Taxonomy Extension Definition Linkbase Document
101.LAB XBRL Taxonomy Extension Label Linkbase Document
101.PRE XBRL Taxonomy Extension Presentation Linkbase Document
* Management contract or compensatory plan or arrangement.
67
SIGNATURES
Pursuant to the requirements of Section 13 or 15(d) of the Securities Exchange Act of 1934, the registrant has duly caused this Annual Report to be signed on its behalf by the undersigned, thereunto duly authorized, on March 13, 2012.
SYPRIS SOLUTIONS, INC. (Registrant)
/s/ Jeffrey T. Gill (Jeffrey T. Gill) President and Chief Executive Officer
Pursuant to the requirements of the Securities Exchange Act of 1934, this report has been signed below by the following persons on behalf of the registrant and in the capacities indicated on March 13, 2012:
/s/ Robert E. Gill Chairman of the Board (Robert E. Gill)
/s/ Jeffrey T. Gill President, Chief Executive Officer and Director (Jeffrey T. Gill)
/s/ Brian A. Lutes Vice President and Chief Financial Officer (Brian A. Lutes) (Principal Financial Officer)
/s/ Rebecca R. Eckert Controller (Rebecca R. Eckert) (Principal Accounting Officer)
/s/ John F. Brinkley Director (John F. Brinkley)
/s/ William G. Ferko Director (William G. Ferko)
/s/ R. Scott Gill Director (R. Scott Gill)
/s/ William L. Healey Director (William L. Healey)
/s/ Sidney R. Petersen Director (Sidney R. Petersen)
/s/ Robert Sroka Director (Robert Sroka)

Use of Non-GAAP Financial Information:
To supplement our consolidated financial statements presented on a GAAP basis, Sypris Solutions, Inc. uses non-GAAP financial measures. We believe non-GAAP financial measures are appropriate to enhance an overall understanding of our past financial performance and also our prospects for the future. These adjustments to our current period GAAP results are made with the intent of providing both management and investors a more complete understanding of the Company’s underlying operational results and trends and our marketplace performance. The presentation of this additional information is not meant to be considered in isolation or as a substitute for financial measures prepared in accordance with generally accepted accounting principles in the United States.
RECONCILIATION OF FREE CASH FLOW (in thousands, except for per share data)
Year Ended Year Ended December 31, December 31, 2011 2010 (Unaudited)
Consolidated Cash Flow Statement:
Cash flows from operating activities: Net cash provided by operating activities................................................................... 16,992 1,725
Cash flows from investing activities: Capital expenditures...................................................................................................... (6,848) (2,233) Proceeds from sale of assets ........................................................................................ 5,032 1,446 Changes in nonoperating assets and liabilities.............................................................. 33 46
Net cash used in investing activities .......................................................................... (1,783) (741)
Cash flows from financing activities: Repayment of former Revolving Credit Agreement ....................................................... (10,000) — Repayment of former Senior Notes ............................................................................... (13,305) — Net proceeds from Credit Facility .................................................................................. 10,000 — Payments for deferred loan costs.................................................................................. (387) — Proceeds from issuance of common stock .................................................................... 64 —
Net cash used in financing activities .......................................................................... (13,628) —
Net increase in cash and cash equivalents ....................................................................... 1,581 984
Cash and cash equivalents at beginning of period............................................................ 16,592 15,608
Cash and cash equivalents at end of period ..................................................................... $ 18,173 $ 16,592
Free Cash Flow: Net cash provided by operating activities.......................................................................... $ 16,992 $ 1,725 Capital expenditures ......................................................................................................... (6,848) (2,233)
Free cash flow ............................................................................................................... $ 10,144 $ (508)
Free Cash Flow per Share: Free cash flow................................................................................................................... $ 10,144 $ (508) Diluted shares outstanding................................................................................................ 19,008 18,605
Free cash flow per share ............................................................................................... $ 0.53 $ (0.03)
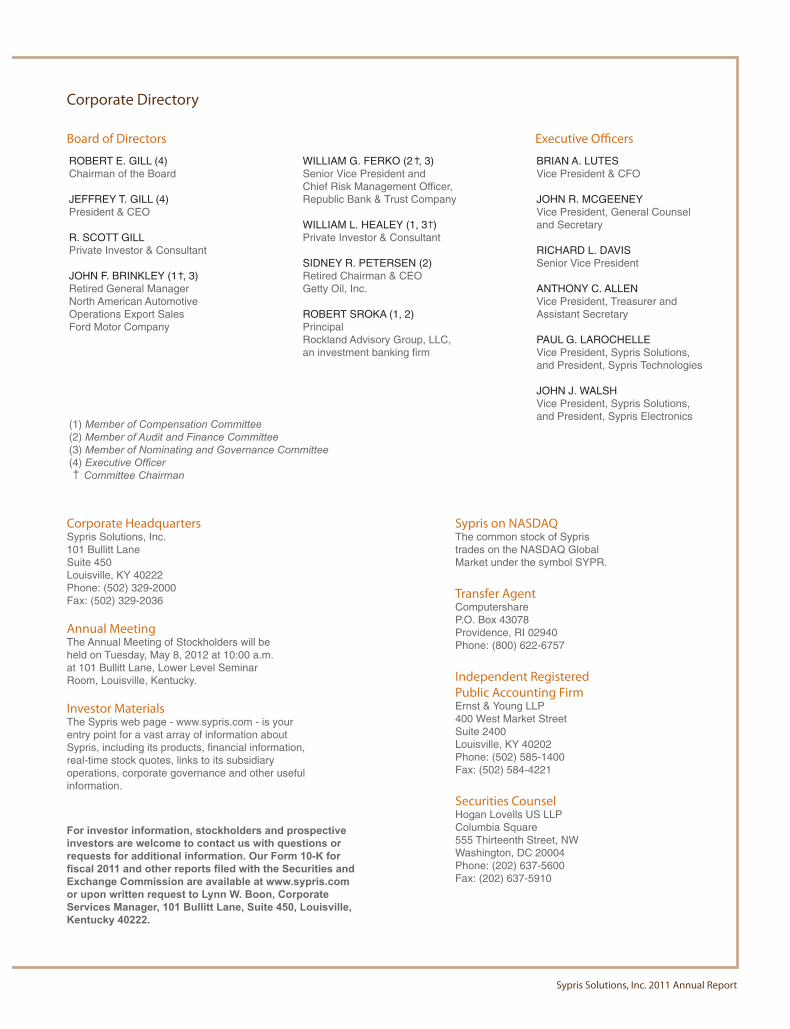
Corporate HeadquartersSypris Solutions, Inc.101 Bullitt LaneSuite 450Louisville, KY 40222Phone: (502) 329-2000Fax: (502) 329-2036
Annual MeetingThe Annual Meeting of Stockholders will beheld on Tuesday, May 8, 2012 at 10:00 a.m.at 101 Bullitt Lane, Lower Level SeminarRoom, Louisville, Kentucky.
Investor MaterialsThe Sypris web page - www.sypris.com - is your entry point for a vast array of information aboutSypris, including its products, financial information,real-time stock quotes, links to its subsidiaryoperations, corporate governance and other useful information.
For investor information, stockholders and prospectiveinvestors are welcome to contact us with questions or requests for additional information. Our Form 10-K forfiscal 2011 and other reports filed with the Securities andExchange Commission are available at www.sypris.comor upon written request to Lynn W. Boon, CorporateServices Manager, 101 Bullitt Lane, Suite 450, Louisville, Kentucky 40222.
Sypris on NASDAQThe common stock of Sypristrades on the NASDAQ GlobalMarket under the symbol SYPR.
Transfer AgentComputershareP.O. Box 43078Providence, RI 02940Phone: (800) 622-6757
Independent RegisteredPublic Accounting FirmErnst & Young LLP400 West Market StreetSuite 2400Louisville, KY 40202Phone: (502) 585-1400Fax: (502) 584-4221
Securities CounselHogan Lovells US LLPColumbia Square555 Thirteenth Street, NWWashington, DC 20004Phone: (202) 637-5600Fax: (202) 637-5910
Board of Directors Executive Officers
(1) Member of Compensation Committee(2) Member of Audit and Finance Committee(3) Member of Nominating and Governance Committee(4) Execu
Committee Chairman
BRIAN A. LUTESVice President & CFO
JOHN R. MCGEENEYVice President, General Counsel and Secretary
RICHARD L. DAVISSenior Vice President
ANTHONY C. ALLENVice President, Treasurer andAssistant Secretary
PAUL G. LAROCHELLEVice President, Sypris Solutions,and President, Sypris Technologies
JOHN J. WALSHVice President, Sypris Solutions,and President, Sypris Electronics
WILLIAM G. FERKO (2 , 3)Senior Vice President andChief Risk Management Officer,Republic Bank & Trust Company
WILLIAM L. HEALEY (1, 3 )Private Investor & Consultant
SIDNEY R. PETERSEN (2)Retired Chairman & CEOGetty Oil, Inc.
ROBERT SROKA (1, 2)PrincipalRockland Advisory Group, LLC,an investment banking firm
ROBERT E. GILL (4)Chairman of the Board
JEFFREY T. GILL (4)President & CEO
R. SCOTT GILLPrivate Investor & Consultant
JOHN F. BRINKLEY (1 , 3)Retired General ManagerNorth American AutomotiveOperations Export SalesFord Motor Company
Corporate Directory
Sypris Solutions, Inc. 2011 Annual Report

2011 Annual Report
Unlocking Our Future
101 Bullitt Lane, Suite 450 Louisville, Kentucky 40222Phone: (502) 329-2000 Fax: (502) 329-2036www.sypris.com
Subsidiary Headquarters:
Sypris Technologies Inc.101 Bullitt Lane, Suite 205 Louisville, Kentucky 40222Phone: (502) 420-1222 Fax: (502) 420-1232
Sypris Electronics LLC10901 North McKinley Drive Tampa, Florida 33612Phone: (813) 972-6000 Fax: (813) 972-6704