unlocking natural gas pipeline deployment …€¦ · 1 - compressor equation 2 - a flow equation...
TRANSCRIPT
1
UNLOCKING NATURAL GAS PIPELINE
DEPLOYMENT IN A LDC A note on rate-of-return regulation
Olivier MASSOL Florian PERROTTON
IAEE – Singapore – 19 June 2017
2
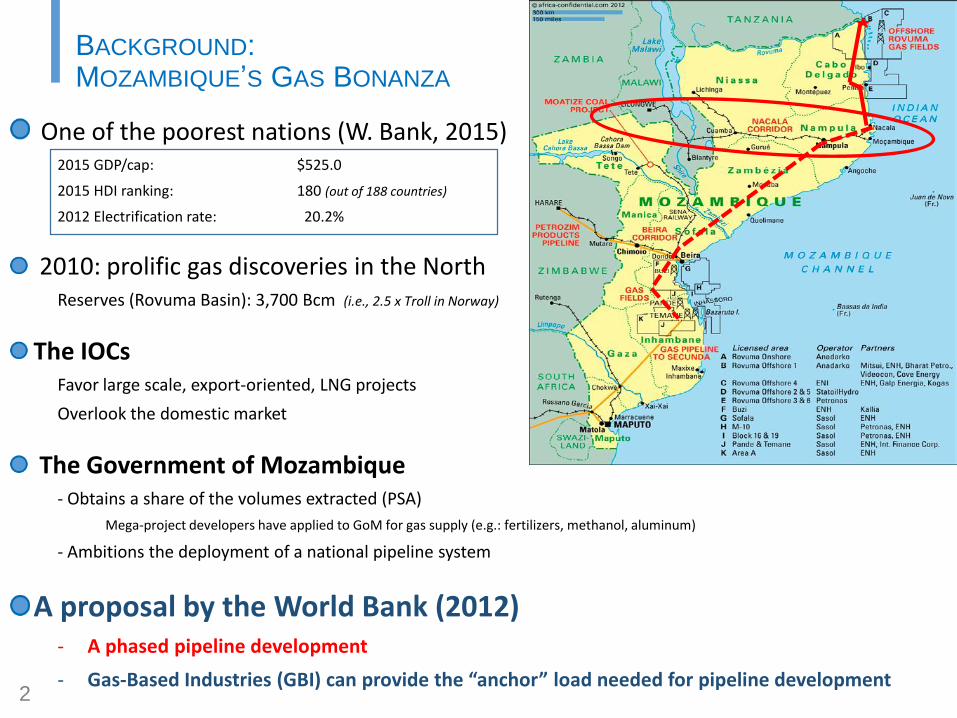
BACKGROUND: MOZAMBIQUE’S GAS BONANZA
One of the poorest nations (W. Bank, 2015)2015 GDP/cap: $525.0
2015 HDI ranking: 180 (out of 188 countries)
2012 Electrification rate: 20.2%
2010: prolific gas discoveries in the NorthReserves (Rovuma Basin): 3,700 Bcm (i.e., 2.5 x Troll in Norway)
The IOCs Favor large scale, export-oriented, LNG projects
Overlook the domestic market
The Government of Mozambique- Obtains a share of the volumes extracted (PSA)
Mega-project developers have applied to GoM for gas supply (e.g.: fertilizers, methanol, aluminum)
- Ambitions the deployment of a national pipeline system
A proposal by the World Bank (2012)- A phased pipeline development
- Gas-Based Industries (GBI) can provide the “anchor” load needed for pipeline development

3
BUILDING AHEAD OF DEMAND?
So, the GoM has to attract FDI in a gas pipeline system
Joskow (1999): simple regulatory instruments should be favored to attract FDI in the infrastructure
sectors of developing economies.
Mozambique has implemented a simple form of rate of return regulation
But foreign investors are reluctant to consider the potential of the domestic
market
they tend to solely consider the proven demand of large gas-based industries
Chenery (1952), Manne (1961): « build ahead of demand »
In case of investment irreversibility and pronounced economies of scale, it is justified to
install ex ante an appropriate degree of overcapacity to minimize the expected cost of
production over time if the future output trajectory is expected to rise over time.
Can planners/regulators leverage on the A-J effect to
adequately build “ahead of demand”?

4
RESEARCH QUESTIONS
How should the allowed rate of return be determined?
- to attract investment
- to achieve the installation of an "adequate" degree of overcapacity
ROADMAP
1 – Technology, an engineering economics approach
2 – Examine and characterize the ex ante behavior of the regulated firm
3 – Characterize the ex post behavior of the regulated firm in case of an ex-post expansion of the demand

5
1: TECHNOLOGY

6
TECHNOLOGY: AN APPROXIMATION
1 - Compressor equation
2 - A flow equation (Weymouth)
Q D ?
L
p2=p0p0+∆pH ?p0
01
0
. 1
b
p pH c Q
p
2
8/32 0 0
0
1c p p p
Q DpL
1
0
pc b Q
p
8/32 0
0
2c p pD
pL
2
2 0 16/9 1/33
1
2 c pQ D H
c bL

7
FURTHER ASSUMPTIONS
H1: The amount of energy E used for the compression is proportional to H
H2: The capital expenditures K is proportional to the weight of steel (i.e., to the volume of an open cylinder)
So, using the mechanical stability condition:
We obtain the Cobb-Douglas production function
with and
2 2
2 4S S
D DK P L W
2 2
3 3S SK P L D c c W
8/9 1/3Q M K E
1Q K E 8 11 9 11
8
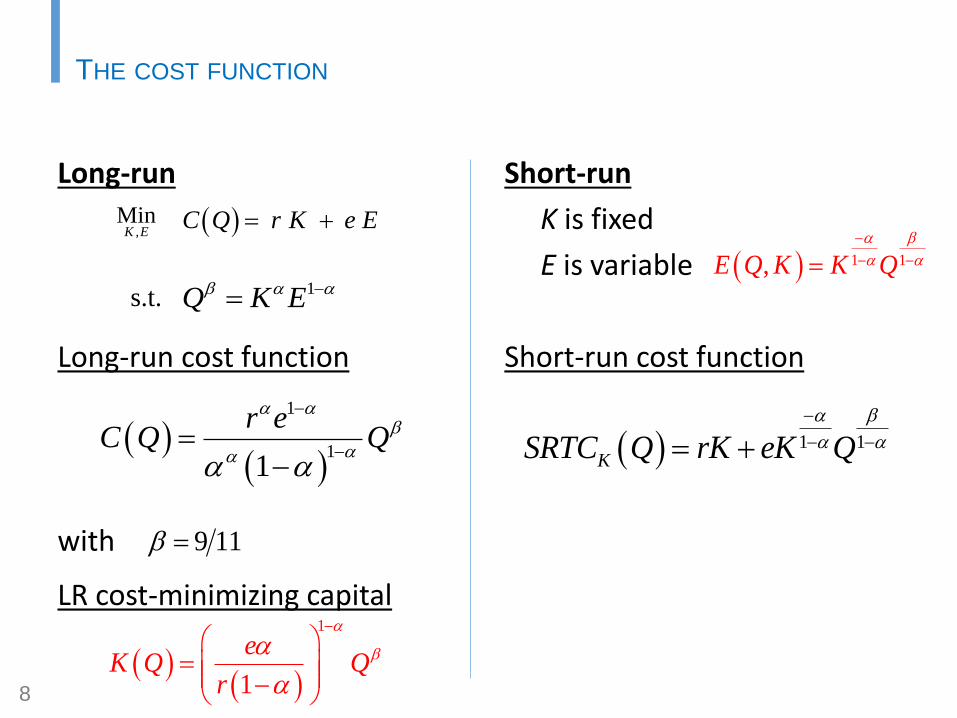
THE COST FUNCTION
Long-run
Long-run cost function
with
LR cost-minimizing capital
,Min
K E C Q r K e E
s.t. 1Q K E
1
11
r eC Q Q
9 11
Short-run
K is fixed
E is variable
Short-run cost function
1 1,E Q K K Q
1 1KSRTC Q rK eK Q
1
1
eK Q Q
r

9
2: THE EX ANTE BEHAVIOR OF THE
REGULATED FIRM

10
A REGULATED MONOPOLY
We assume a constant elasticity demand schedule
with
and examine the behavior of the regulated monopoly
s.t (1)
Solution: see Klevorick (1971).
P Q A Q
,QMax
K ,Q P Q Q r K e E Q K
, P Q Q e E Q K s K
1 ,1

11
STATIC COMPARISONS
We compare the solution (*) with two benchmarks:
(M) Monopoly
(a) Average cost pricing
Comparing metrics: output, capital, and cost ratios
These ratios are determined by: the ratio , the demand elasticity and the technology parameters.
*
M
Q
Q
*
*
K
K Q
*
*
C
C Q
s r
gradient wrt s r
<0 <0 <0
12
3: THE CASE OF AN EX-POST
EXPANSION OF THE DEMAND

13
THE EX-POST BEHAVIOR OF THE REGULATED FIRM
Ex ante:
The regulator sets s that will remain fixed hereafter
The regulated firm decides its investment and thus K*
Ex post:
A larger demand: with
Lemma: The regulated firm must adjust its output, and there are exactly two candidates:
1P Q P Q 0
Q
sK*
*, P Q Q eE Q K
*, P Q Q eE Q K
*Q*
cQ
*
eQ
We focus on the case of the
expanded output
This output is monotonically
increasing with λ
*
eQ
* **
c eQ Q Q

14
A COST EFFICIENT EX POST OUTPUT LEVEL
We now consider a cost-efficient capital-output combination …
where is the LR cost minimizing capital
… that also verifies the ex post rate-of-return constraint:
Solving, we obtain a closed form expression of
,ce ceK Q
,1 ce ce ce ce ceP Q Q eE Q K sK
ce ceK K Q
K Q
,ce ceK Q

15
QUESTION
Can we set s so that the ex post capital-output
combination is cost efficient?
Proposition: For any with
there exists a unique rate of return such that:
0,
, Ms r s
1 1 11
1
**
eK K Q

16
3: POLICY DISCUSSION
17
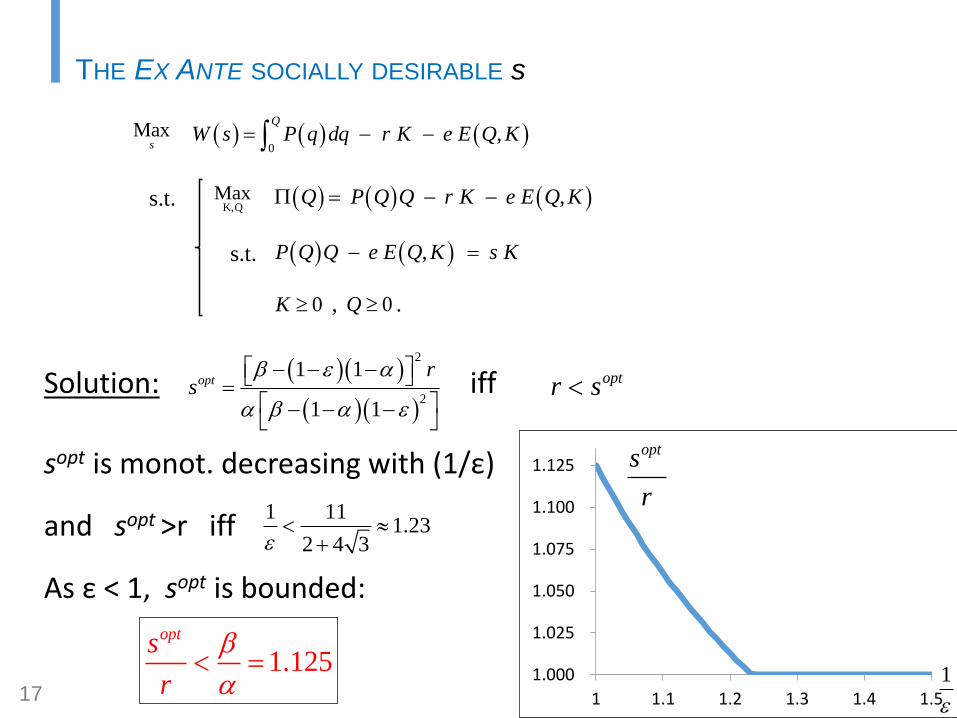
THE EX ANTE SOCIALLY DESIRABLE s
Maxs
0
,Q
W s P q dq r K e E Q K
s.t. K,Q
Max ,Q P Q Q r K e E Q K
s.t. , P Q Q e E Q K s K
0K , 0Q .
Solution: iff
sopt is monot. decreasing with (1/ε)
and sopt >r iff
As ε < 1, sopt is bounded:
2
2
1 1
1 1
optr
s
optr s
1.125opts
r
1 111.23
2 4 3
1
opts
r
1.000
1.025
1.050
1.075
1.100
1.125
1 1.1 1.2 1.3 1.4 1.5

18
APPLICATION AND DISCUSSION
This table details the range of λ for which it is possible to: (i) build ahead of demand while (ii) maintaining a fair rate of return s lower than the threshold βr/α.
For , one has to follow Joskow (1999) who points that regulators in developing economies often face possibly conflicting public policy goals and have to clearly define and prioritize these goals
1.05 0.251 0.287 2.053 2.498 0.723 0.990
1.15 0.170 0.200 1.547 1.757 0.727 0.980
1.30 0.106 0.131 1.337 1.440 0.738 0.964
1.50 0.063 0.082 1.223 1.274 0.748 0.937
1
*
*
eQ
Q
*
*
eQ
Q
* *
Min 1 ,a a
W W
W W
I
a
W
W
19
CONCLUSIONS
The technology of a natural gas pipeline can be approximated by a Cobb-Douglas production function that has two inputs K and E.
Discussion: relevance of the empirical analyses of the A-J effect that solely consider the relations between K and L?
Case λ=0: It can be justified to use a fair rate of return s larger than r the market price of capital in the gas pipeline industry.
Note: welfare maximization suggests that the ratio s/r has to be lower than β/α = 1.125
Case λ>0: It is possible to use the A-J effect to “build ahead of demand”
Note: the range of λ for which this strategy does not hamper the welfare obtained ex ante is quite narrow.