unloaded in new orleans grain transportation report … 10-15-15.pdfthe slow pace of sales and...
TRANSCRIPT

A weekly publication of the Agricultural Marketing Service
www.ams.usda.gov/GTR
October 15, 2015
Contents
Article/
Calendar
Grain
Transportation
Indicators
Rail
Barge
Truck
Exports
Ocean
Brazil
Mexico
Grain Truck/Ocean
Rate Advisory
Data Links
Specialists
Subscription
Information
--------------
The next
release is October 22, 2015
Preferred citation: U.S. Dept. of Agriculture, Agricultural Marketing Service. Grain Transportation Report. October 15, 2015.
Web: http://dx.doi.org/10.9752/TS056.10-15-2015
Grain Transportation Report
WEEKLY HIGHLIGHTS
Railroads Invest to Improve Intermodal Service through Southern California Ports
According to Bloomberg Business, BNSF Railways (BNSF) is 99 percent finished adding a parallel track between Los Angeles and
Chicago. The addition of the parallel track avoids the need for trains to yield to one another while using a single track, which means
greater operational velocity and more traffic. The article cited a predicted 26 percent increase in railcars per day along the line.
BNSF's goal with this expansion is to better compete with trucking, which is generally faster and more flexible, though more
expensive. Other railroads are also moving in this direction. According to Bloomberg, Union Pacific (UP) is only 150 miles away
from completing its parallel track from Los Angeles to El Paso, TX. In 2011, UP also completed a transload facility in Yermo, CA,
130 miles from the Port of Los Angeles. The service allows covered hopper cars of grain to be directly transloaded into marine
containers, which was intended to enable UP to meet growing demand from Asia for containerized dried distiller grains. More than
half of U.S. waterborne containerized grain exports this year have moved through the Los Angeles/Long Beach port complex.
WASDE Lowers Corn and Soybean Production, Soybean Exports Lowered.
According to the USDA’s October 9 World Agricultural Supply and Demand Estimates, 2015/16 corn production is projected at
13.555 billion bushels, making it the third largest corn crop on record. Soybean production is projected at 3.888 billion bushels. Both
projections are lowered from the previous month. Corn exports remain unchanged from the previous month at 1.850 billion bushels,
while soybean exports dropped from 1.725 billion bushels to 1.675 billion bushels. The slow pace of sales and increased competitor
supplies have caused a reduced soybean export projection. A sharp decline in the value of the Brazilian real in recent months and an
expected increase in Brazilian soybean production may adversely impact U.S. soybean exports. U.S. barge operators have reported a
current interest in barge services for soybean shippers, but recent decreases in freight rates indicated that more barges are available for
the current demand. In addition, future rates for barge services in November through January have declined since last week.
Corn and Soybeans Boost Total Inspections
For the week ending October 8, total inspections of grain (corn, wheat, soybeans) from all major export regions reached 2.75 million
metric tons (mmt), up 21 percent from the past week, down 7 percent from last year, and 12 percent above the 3-year average. Corn
and soybean inspections, respectively, were up 22 and 54 percent from the past week, helping the overall increase in total grain
inspections. Corn inspections increased in each of the three major export regions, and soybeans increased notably in both the
Mississippi Gulf and Pacific Northwest (PNW). Total wheat inspections, however, were down 48 percent due to smaller shipments to
Asia and Latin America. Total PNW grain inspections increased 81 percent while the Mississippi Gulf inspections increased 15
percent overall. Outstanding export sales of corn and soybeans were also up from the previous week, but were down for wheat.
Snapshots by Sector
Export Sales
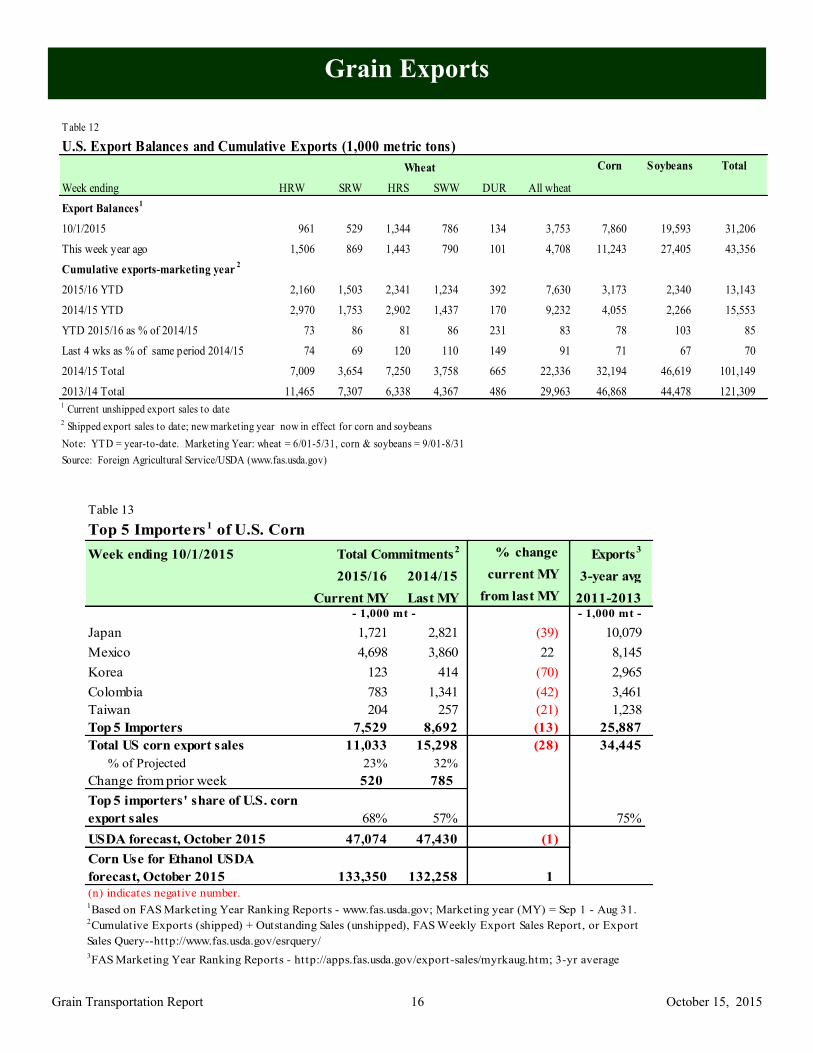
During the week ending October 1, unshipped balances of wheat, corn, and soybeans totaled 31.2 mmt, down 28 percent from the
same time last year. Net weekly wheat export sales of .288 mmt were up 274 percent from the prior week. Net corn export sales
were .520 mmt, down 30 percent from the prior week, and net soybean export sales of 1.29 mmt were down 45 percent from the past
week.
Rail
U.S. Class I railroads originated 25,029 carloads of grain during the week ending October 3, up 13 percent from last week, up 11
percent from last year, and up 36 percent from the 3-year average.
During the week ending October 8, average October shuttle secondary railcar bids/offers per car were $246 above tariff, down $101
from last week, and $3,942 lower than last year. Non-shuttle secondary railcar bids/offers were $100 below tariff, down $135 from
last week. There were no non-shuttle railcar bids/offers for October this week of last year.
Barge During the week ending October 10, barge grain movements totaled 882,900 tons, up 156 percent from last week, and up 35 percent
from the same period last year.
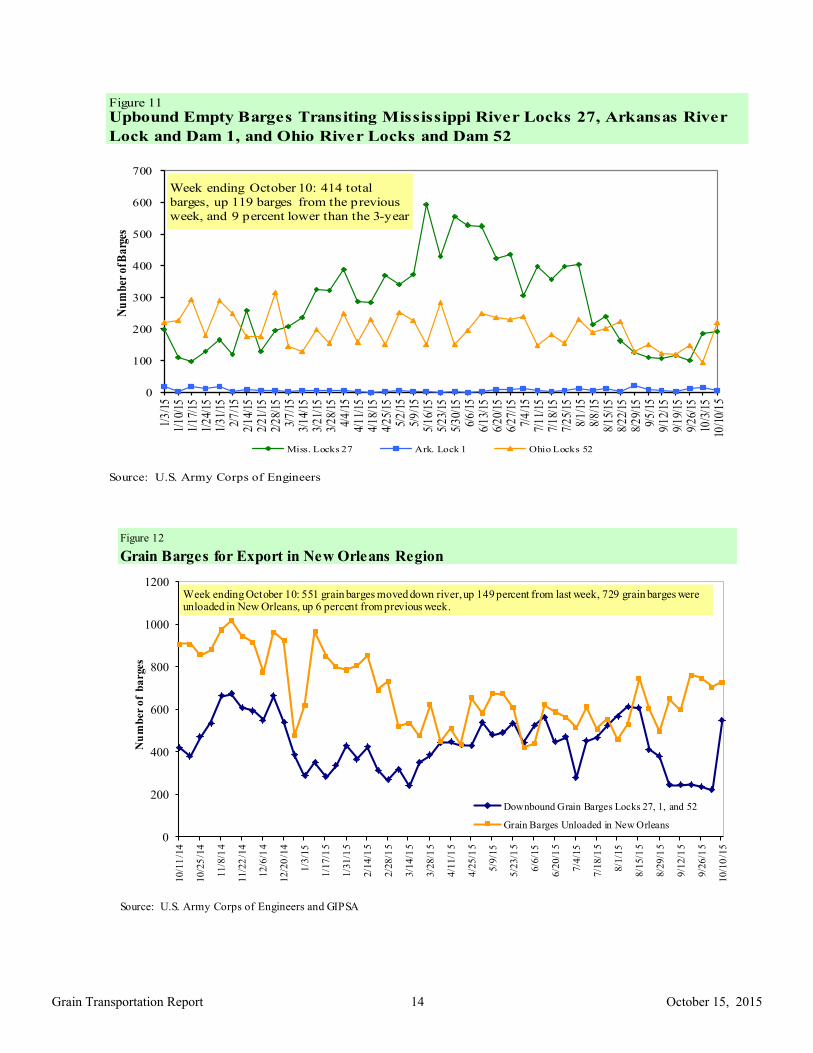
During the week ending October 10, 551 grain barges moved down river, up 149 percent from last week; 729 grain barges were
unloaded in New Orleans, up 6 percent from the previous week.
Ocean
During the week ending October 8, 39 ocean-going grain vessels were loaded in the Gulf, 5 percent less than the same period last
year. Seventy-five vessels are expected to be loaded within the next 10 days, 23 percent more than the same period last year.
During the week ending October 1, the ocean freight rate for shipping bulk grain from the Gulf to Japan was $33 per metric ton (mt),
unchanged from the previous week. The cost of shipping from the PNW to Japan was $17.75 per mt, unchanged from the previous
week.
Contact Us
October 15, 2015
Grain Transportation Report 2
Feature Article/Calendar
Grain Storage Capacity Affects Transportation Timing and Patterns
Grain production needs to move after it is harvested—a simple notion, but sometimes complex in practice. After
harvesting, grain is either sold or moved to storage. If stored, it is moved to on-farm storage until it is sold or fed
later, or moved to off-farm storage. If the grain is not sold locally at harvest, it is transported through an extensive
distribution system to processors, elevators, or other facilities that will eventually ship the grain to other domestic
destinations or export terminals. Upon completion of harvest, farmers with limited storage options will utilize any
available storage, but transport excess grain to facilities to be sold or stored for future sale. Storage capacity varies
considerably throughout the country. Adequate storage can lessen the immediate demand for transportation and
allow for maximizing marketing possibilities. In contrast to this, a lack of storage at harvest can increase the
demand for transportation and reduce marketing options. This article examines fall grain stocks and grain
production against permanent storage capacity to: (1) identify and describe potential storage capacity shortfalls
during the 2015 fall harvest, and (2) discuss the important considerations for transportation.
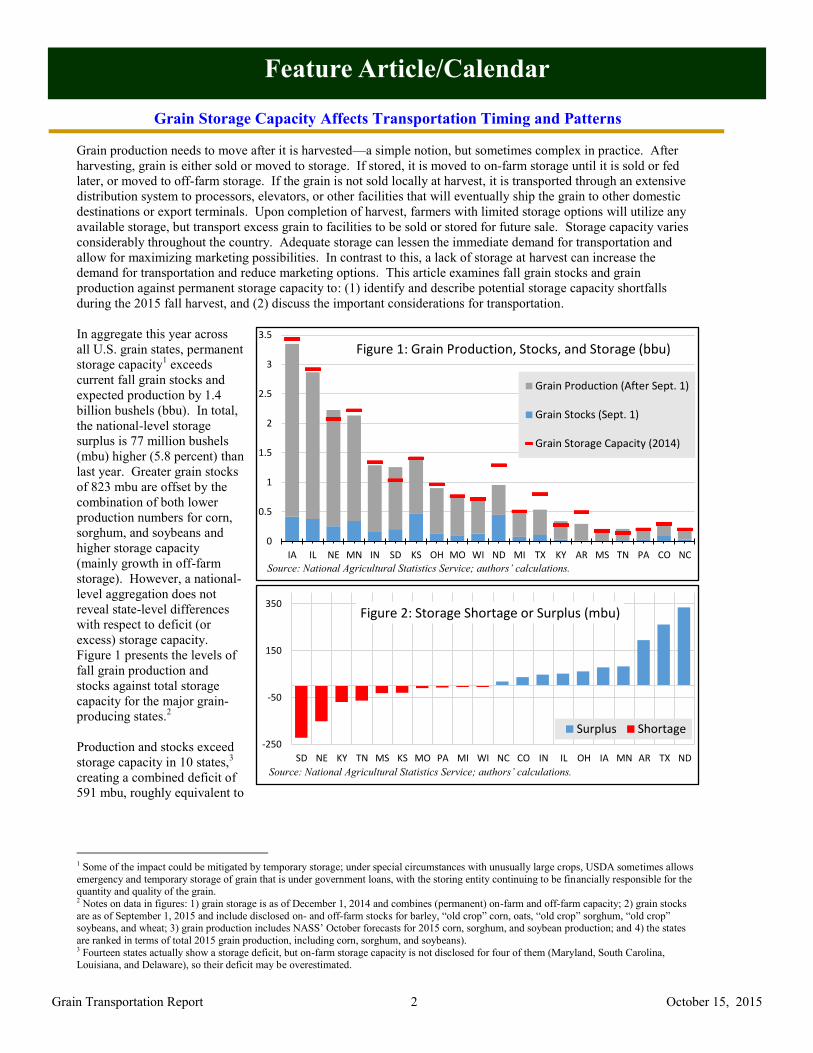
In aggregate this year across
all U.S. grain states, permanent
storage capacity1 exceeds
current fall grain stocks and
expected production by 1.4
billion bushels (bbu). In total,
the national-level storage
surplus is 77 million bushels
(mbu) higher (5.8 percent) than
last year. Greater grain stocks
of 823 mbu are offset by the
combination of both lower
production numbers for corn,
sorghum, and soybeans and
higher storage capacity
(mainly growth in off-farm
storage). However, a national-
level aggregation does not
reveal state-level differences
with respect to deficit (or
excess) storage capacity.
Figure 1 presents the levels of
fall grain production and
stocks against total storage
capacity for the major grain-
producing states.2
Production and stocks exceed
storage capacity in 10 states,3
creating a combined deficit of
591 mbu, roughly equivalent to
1 Some of the impact could be mitigated by temporary storage; under special circumstances with unusually large crops, USDA sometimes allows
emergency and temporary storage of grain that is under government loans, with the storing entity continuing to be financially responsible for the quantity and quality of the grain. 2 Notes on data in figures: 1) grain storage is as of December 1, 2014 and combines (permanent) on-farm and off-farm capacity; 2) grain stocks
are as of September 1, 2015 and include disclosed on- and off-farm stocks for barley, “old crop” corn, oats, “old crop” sorghum, “old crop” soybeans, and wheat; 3) grain production includes NASS’ October forecasts for 2015 corn, sorghum, and soybean production; and 4) the states
are ranked in terms of total 2015 grain production, including corn, sorghum, and soybeans). 3 Fourteen states actually show a storage deficit, but on-farm storage capacity is not disclosed for four of them (Maryland, South Carolina, Louisiana, and Delaware), so their deficit may be overestimated.
0
0.5
1
1.5
2
2.5
3
3.5
IA IL NE MN IN SD KS OH MO WI ND MI TX KY AR MS TN PA CO NC
Bill
ion
s
Figure 1: Grain Production, Stocks, and Storage (bbu)
Grain Production (After Sept. 1)
Grain Stocks (Sept. 1)
Grain Storage Capacity (2014)
-250
-50
150
350
SD NE KY TN MS KS MO PA MI WI NC CO IN IL OH IA MN AR TX ND
Mill
ion
s
Figure 2: Storage Shortage or Surplus (mbu)
Surplus Shortage
Source: National Agricultural Statistics Service; authors’ calculations.
Source: National Agricultural Statistics Service; authors’ calculations.

October 15, 2015
Grain Transportation Report 3
148,000 jumbo hopper railcars or 11,000 barges.1 The storage shortage is most substantial in South Dakota at 222
mbu, followed by Nebraska (151 mbu), Kentucky (68 mbu) Tennessee (63 mbu), Mississippi (42 mbu), Kansas (29
mbu), and others (see Figures 2 and 3). On-farm stocks is not disclosed in Tennessee and Mississippi so the storage
shortages are likely underestimated. All other things being equal, in areas where grain storage is relatively limited,
transportation is even more essential, because the harvest must be moved to other destinations immediately.
In addition, compared to a year ago, storage capacity is relatively tighter in several states, with grain stocks and
production occupying a larger share of total storage. For instance, Minnesota, Kansas, Iowa, and Nebraska show net
decreases of between 57 to 298 mbu in their storage surpluses compared to last year (primarily due to much larger
grain stocks being held despite more storage). In contrast, the estimated storage surplus has increased in many states
from the prior year, most notably Indiana (by 251 mbu), Illinois (by 205 mbu), Missouri (by 183 mbu), and Ohio (by
81 mbu). Historically, between 2004 and 2008, states like Iowa and Illinois had much more significant storage
shortages than South Dakota’s levels today.
Figure 3: Map of Grain Storage Shortages and Surpluses by State Going into 2015 Harvest2
Source: National Agricultural Statistics Service; authors’ calculations.
These results have important implications for grain transportation. In general, areas with a storage deficit will have
immediate demand for transportation, while areas with excess storage capacity may delay the demand for
transportation. Lower diesel fuel prices compared to last year benefit growers hauling their crop to buyers with
storage such as country elevators (see Grain Transportation Report 9/8/11 for more information on the importance
of their size and location), feed mills, ethanol plants, or other facilities. Furthermore, in the storage-limited states
such as South Dakota and Nebraska that cannot store or use all the crop locally (or ship it by barge), rail service is
particularly important to move excess production (beyond storage) to more distant markets. Conversely, states with
relatively limited storage but access to the river, like Kentucky and Tennessee, depend on a reliable barge network.
Currently, lower rainfall has dropped river levels at many locations causing restrictions on some down-bound traffic.
In addition, there have been nearly constant delays at Ohio River Locks 52 (near Brookport, IL) where repair work
has limited traffic for several weeks. In terms of rail service, train speeds are up slightly for U.S. Class I grain trains
compared to last week, but the number of backlogged grain cars were up 3,497, an increase of 1,517 cars. For more
information on current barge and rail transportation issues, see this week’s Harvest Progress update.
[email protected], [email protected]
1 Iowa Department of Transportation (http://www.iowadot.gov/compare.pdf). 2 Notes on Figure 3: 1) categories are displayed using the Jenks’ optimization method which minimizes the variation within groups and
maximizes variation between groups; 2) on-farm storage capacity numbers were not disclosed for Arizona, California, Delaware, Florida, Louisiana, Maryland, Nevada, New England, New Jersey, New Mexico, South Carolina, Utah, West Virginia, and Wyoming so these states were
excluded from the map; 3) on-farm grain stocks were not disclosed for Alabama, Georgia, Mississippi. New York, Tennessee, and Virginia, so
their storage surpluses/deficits are likely underestimated; and 4) corn production is not disclosed in Idaho and Montana, and sorghum production is not disclosed in Georgia, so the surpluses in these states may be slightly underestimated.

October 15, 2015
Grain Transportation Report 4
HARVEST PROGRESS
As of October 11, the National Agricultural Statistics Service reports that 42 percent of the U.S. corn crop is harvested, 15
percentage points more than last week and 1 percentage point behind the 5-year average pace. Illinois led all states and
advanced its corn harvest 21 percentage points over the past week, followed by Minnesota (20 percentage points), Ohio
(17 percentage points), and Indiana and Iowa (both 16 percentage points).
The soybean harvest is 42 percent complete, 8 percentage points ahead of the 5-year average and 20 percentage points
more than last week. The largest week-to-week changes occurred in Iowa (33 percentage points), Nebraska (26
percentage points), and South Dakota and Wisconsin (both 25 percentage points).
Fifty-one percent of the national sorghum crop is harvested, 8 percentage points more than last week and 7 percentage
points more than the 5-year average pace. Sorghum harvest in the major growing states of Kansas, Texas, Arkansas, and
Nebraska are 37, 69, 98, and 17 percent complete, respectively.
Current Transportation Status:
Barge. For the week ending October 10, 883 thousand tons of grain moved down-bound through the locking portions of
the Mississippi, Ohio, and Arkansas Rivers. This was a 156 percent increase compared to last week as favorable weather
has advanced the corn and soybean harvest. There were significant increases in the amount of soybeans moved, with 549
thousand moved down-bound, representing 62 percent of all weekly movements. Upper Mississippi River down-bound
grain traffic consists mostly of soybeans (69 percent), with 29 percent corn and minor amounts of wheat. There were 139
thousand tons of fertilizers moved up-bound on the Upper Mississippi River. For the week ending, October 10, Ohio
River grain movements consisted of 49 percent soybeans and 47 percent corn, with minor amount of wheat. Arkansas
River grain traffic consists of mostly soybeans (88 percent) with minor amounts of wheat and no corn.
Although the favorable weather conditions have helped the harvest pace, lower amounts of rainfall have dropped river
levels at many locations. On the lower Mississippi River near Providence, LA, the Coast Guard has restricted down-
bound traffic to daylight hours. There have been nearly constant delays at Ohio River Locks 52 (near Brookport, IL)
where repair work has limited traffic there for several weeks.
Rail. CSX and Norfolk Southern continue to restore rail service in the Carolinas following historic rainfall and flooding
after Hurricane Joaquin. More broadly across the network, week ending October 2 train speeds for U.S. Class I grain
trains were 0.8 percent faster compared to the prior week. As of October 3, the number of backlogged grain cars were
3,497, an increase of 1,517 cars compared to last week, but about half the amount this time last year (and all railroads were
not reporting at that time).

October 15, 2015
Grain Transportation Report 5
Grain Transportation Indicators
The grain bid summary illustrates the market relationships for commodities. Positive and negative adjustments in differential
between terminal and futures markets, and the relationship to inland market points, are indicators of changes in fundamental mar-
ket supply and demand. The map may be used to monitor market and time differentials.
Table 1
Grain Transport Cost Indicators1
Truck Barge Ocean
Week ending Unit Train Shuttle Gulf Pacific
10/14/15 172 249 219 278 148 1263 % - 3 8 6 % - 16 % 0 % 0 %
10/07/15 167 256 223 329 148 126
1Indicator: Base year 2000 = 100; Weekly updates include truck = diesel ($/gallon); rail = near-month secondary rail market bid and monthly tariff rate
with fuel surcharge ($/car); barge = Illinois River barge rate (index = percent of tariff rate); and ocean = routes to Japan ($/metric ton)
Source: Transportation & Marketing Programs/AMS/USDA
Rail
Table 2
Market Update: U.S. Origins to Export Position Price Spreads ($/bushel)
Commodity Origin--Destination 10/9/2015 10/2/2015
Corn IL--Gulf -0.64 -0.73
Corn NE--Gulf -0.79 -0.86
Soybean IA--Gulf -1.48 -1.50
HRW KS--Gulf -1.45 -1.50
HRS ND--Portland -2.15 -2.07
Note: nq = no quote
Source: Transportation & Marketing Programs/AMS/USDA
Figure 1
Grain bid Summary
October 15, 2015
Grain Transportation Report 6
Rail Transportation
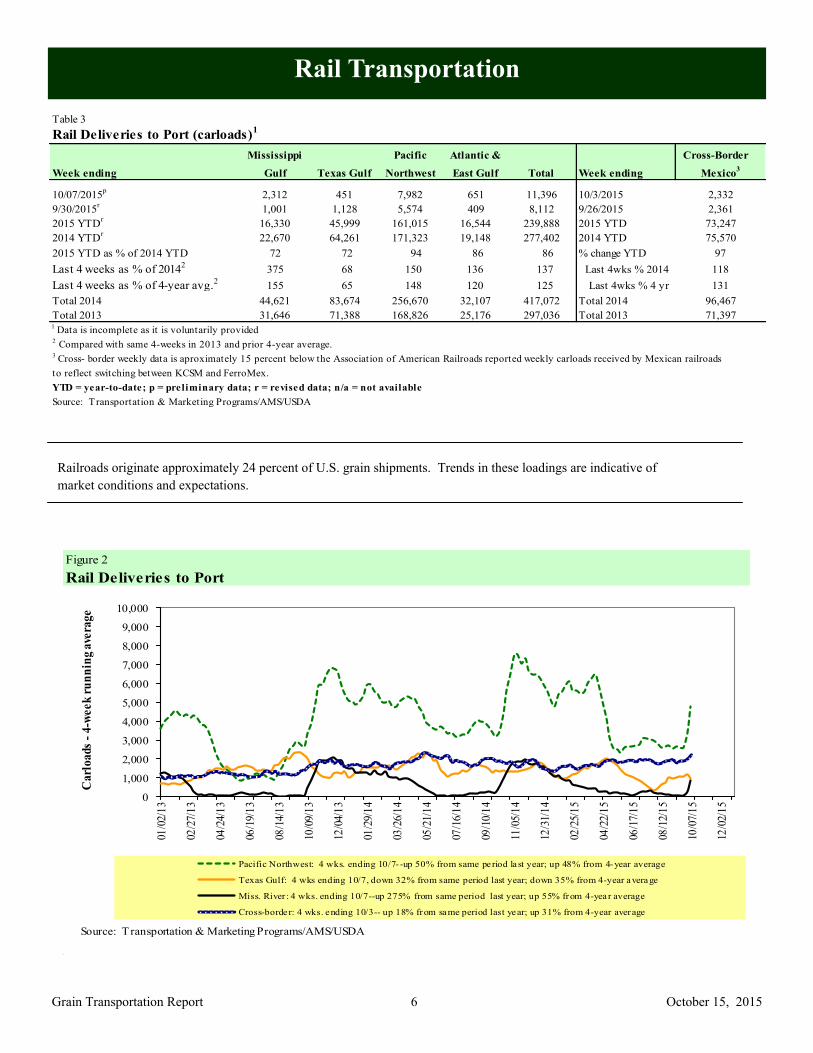
Railroads originate approximately 24 percent of U.S. grain shipments. Trends in these loadings are indicative of
market conditions and expectations.
Figure 2
Rail Deliveries to Port
0
1,000
2,000
3,000
4,000
5,000
6,000
7,000
8,000
9,000
10,000
01/0
2/1
3
02/2
7/1
3
04/2
4/1
3
06/1
9/1
3
08/1
4/1
3
10/0
9/1
3
12/0
4/1
3
01/2
9/1
4
03/2
6/1
4
05/2
1/1
4
07/1
6/1
4
09/1
0/1
4
11/0
5/1
4
12/3
1/1
4
02/2
5/1
5
04/2
2/1
5
06/1
7/1
5
08/1
2/1
5
10/0
7/1
5
12/0
2/1
5
Carl
oads
-4-w
eek
ru
nn
ing a
vera
ge
Pacific Northwest: 4 wks. ending 10/7- -up 50% from same period last year; up 48% from 4-year average
Texas Gulf: 4 wks ending 10/7, down 32% from same period last year; down 35% from 4-year average
Miss. River : 4 wks. ending 10/7--up 275% from same period last year; up 55% from 4-year average
Cross-border: 4 wks. ending 10/3-- up 18% from same period last year; up 31% from 4-year average
Source: Transportation & Marketing Programs/AMS/USDA
Table 3
Rail Deliveries to Port (carloads)1
Mississippi Pacific Atlantic & Cross-Border
Week ending Gulf Texas Gulf Northwest East Gulf Total Week ending Mexico3
10/07/2015p
2,312 451 7,982 651 11,396 10/3/2015 2,332
9/30/2015r
1,001 1,128 5,574 409 8,112 9/26/2015 2,361
2015 YTDr
16,330 45,999 161,015 16,544 239,888 2015 YTD 73,247
2014 YTDr
22,670 64,261 171,323 19,148 277,402 2014 YTD 75,570
2015 YTD as % of 2014 YTD 72 72 94 86 86 % change YTD 97
Last 4 weeks as % of 20142
375 68 150 136 137 Last 4wks % 2014 118
Last 4 weeks as % of 4-year avg.2
155 65 148 120 125 Last 4wks % 4 yr 131
Total 2014 44,621 83,674 256,670 32,107 417,072 Total 2014 96,467
Total 2013 31,646 71,388 168,826 25,176 297,036 Total 2013 71,3971 Data is incomplete as it is voluntarily provided2 Compared with same 4-weeks in 2013 and prior 4-year average.
3 Cross- border weekly data is aproximately 15 percent below the Association of American Railroads reported weekly carloads received by Mexican railroads
to reflect switching between KCSM and FerroMex.
YTD = year-to-date; p = preliminary data; r = revised data; n/a = not available
Source: Transportation & Marketing Programs/AMS/USDA

October 15, 2015
Grain Transportation Report 7
Table 4
Class I Rail Carrier Grain Car Bulletin (grain carloads originated)
U.S. total
Week ending CSXT NS BNSF KCS UP CN CP
10/03/15 2,562 2,758 12,771 1,255 5,683 25,029 4,535 5,058
This week last year 2,658 2,788 9,779 1,116 6,264 22,605 4,827 5,590
2015 YTD 76,534 111,791 388,636 35,243 199,388 811,592 154,918 174,267
2014 YTD 70,136 108,933 341,065 33,455 218,114 771,703 171,704 205,384
2015 YTD as % of 2014 YTD 109 103 114 105 91 105 90 85
Last 4 weeks as % of 20141
115 115 126 118 99 116 91 91
Last 4 weeks as % of 3-yr avg.2
129 112 113 147 109 115 89 82
Total 2014 103,331 153,771 482,431 47,510 297,969 1,085,012 242,616 276,322 1The past 4 weeks of this year as a percent of the same 4 weeks last year.
2The past 4 weeks as a percent of the same period from the prior 3-year average. YTD = year-to-date.
East West Canada
Figure 3
Total Weekly U.S. Class I Railroad Grain Car Loadings
Source: Association of American Railroads
15,000
17,000
19,000
21,000
23,000
25,000
27,000
29,000
11/1
/2014
11/2
9/2
01
4
12/2
7/2
01
4
1/2
4/2
015
2/2
1/2
015
3/2
1/2
015
4/1
8/2
015
5/1
6/2
015
6/1
3/2
015
7/1
1/2
015
8/8
/201
5
9/5
/201
5
10/3
/2015
Carl
oads
-4-w
eek
ru
nn
ing a
vg.
4-week period ending4-week average 3-year average
For 4 weeks ending October 3: grain carloadings were up 8 percent from last week; up 16 percent from last year; and up 20 percent from the 3-year average.
Table 5
Railcar Auction Offerings1
($/car)2
Week ending
10/8/2015 Oct-15 Oct-14 Nov-15 Nov-14 Dec-15 Dec-14 Jan-16 Jan-15
BNSF3
COT grain units no bids no offer no bids no offer no bids no offer no bids 2382
COT grain single-car5
no bids no offer no bids no offer no bids no offer no bids 1553 . . 1851
UP4
GCAS/Region 1 no bids no offer no bids no offer no bids no offer n/a n/a
GCAS/Region 2 no bids no offer no bids no offer no bids no offer n/a n/a1Auction offerings are for single-car and unit train shipments only.2Average premium/discount to tariff, last auction3BNSF - COT = Certificate of Transportation; north grain and south grain bids were combined effective the week ending 6/24/06.
4UP - GCAS = Grain Car Allocation System
Region 1 includes: AR, IL, LA, MO, NM, OK, TX, WI, and Duluth, MN.
Region 2 includes: CO, IA, KS, MN, NE, WY, and Kansas City and St. Joseph, MO.5Range is shown because average is not available. Not available = n/a.
Source: Transportation & Marketing Programs/AMS/USDA.
Delivery period
October 15, 2015
Grain Transportation Report 8
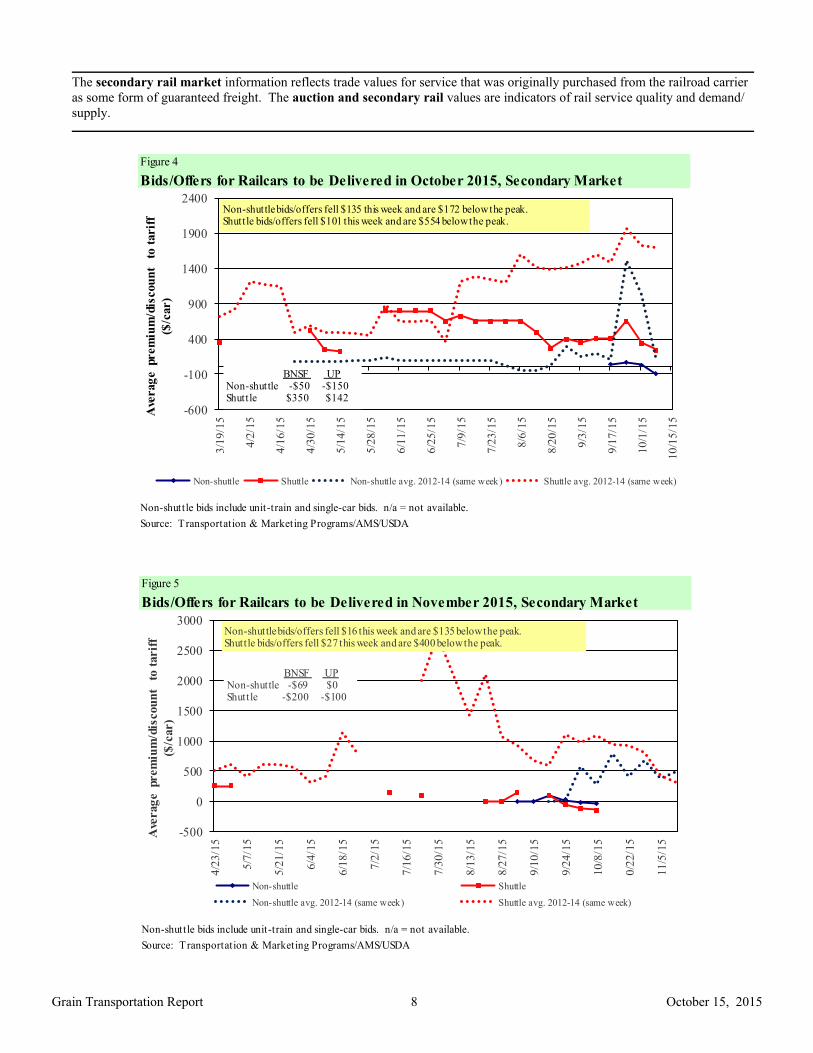
The secondary rail market information reflects trade values for service that was originally purchased from the railroad carrier
as some form of guaranteed freight. The auction and secondary rail values are indicators of rail service quality and demand/
supply.
Figure 5
Bids/Offers for Railcars to be Delivered in November 2015, Secondary Market
Non-shuttle bids include unit-train and single-car bids. n/a = not available.
Source: Transportation & Marketing Programs/AMS/USDA
-500
0
500
1000
1500
2000
2500
3000
4/2
3/1
5
5/7
/15
5/2
1/1
5
6/4
/15
6/1
8/1
5
7/2
/15
7/1
6/1
5
7/3
0/1
5
8/1
3/1
5
8/2
7/1
5
9/1
0/1
5
9/2
4/1
5
10/8
/15
10/2
2/1
5
11/5
/15
Non-shuttle Shuttle
Non-shuttle avg. 2012-14 (same week) Shuttle avg. 2012-14 (same week)
BNSF UP Non-shuttle -$69 $0 Shuttle -$200 -$100
Ave
rag
e prem
ium
/dis
cou
nt
to t
arif
f
($/c
ar)
Non-shuttle bids/offers fell $16 this week and are $135 below the peak.Shuttle bids/offers fell $27 this week and are $400 below the peak.
Figure 4
Bids/Offers for Railcars to be Delivered in October 2015, Secondary Market
Non-shuttle bids include unit-train and single-car bids. n/a = not available.
Source: Transportation & Marketing Programs/AMS/USDA
-600
-100
400
900
1400
1900
2400
3/1
9/1
5
4/2
/15
4/1
6/1
5
4/3
0/1
5
5/1
4/1
5
5/2
8/1
5
6/1
1/1
5
6/2
5/1
5
7/9
/15
7/2
3/1
5
8/6
/15
8/2
0/1
5
9/3
/15
9/1
7/1
5
10/1
/15
10
/15
/15
Non-shuttle Shuttle Non-shuttle avg. 2012-14 (same week) Shuttle avg. 2012-14 (same week)
BNSF UP Non-shuttle -$50 -$150Shuttle $350 $142
Ave
rag
e prem
ium
/dis
cou
nt
to t
arif
f
($/c
ar)
Non-shuttle bids/offers fell $135 this week and are $172 below the peak.Shuttle bids/offers fell $101 this week and are $554 below the peak.

October 15, 2015
Grain Transportation Report 9
Table 6
Weekly Secondary Railcar Market ($/car)1
Week ending
10/8/2015 Oct-15 Nov-15 Dec-15 Jan-16 Feb-16 Mar-16
Non-shuttle
BNSF-GF (50) (69) n/a n/a n/a n/a
Change from last week (100) (6) n/a n/a n/a n/a
Change from same week 2014 n/a n/a n/a n/a n/a n/a
UP-Pool (150) - 25 n/a n/a n/a
Change from last week (170) (25) - n/a n/a n/a
Change from same week 2014 n/a n/a n/a n/a n/a n/a
Shuttle2
BNSF-GF 350 (200) n/a n/a n/a n/a
Change from last week (44) (78) n/a n/a n/a n/a
Change from same week 2014 (5,525) (3,700) n/a n/a n/a n/a
UP-Pool 142 (100) (200) n/a n/a n/a
Change from last week (158) 25 (100) n/a n/a n/a
Change from same week 2014 (2,358) (2,150) (1,725) n/a n/a n/a1Average premium/discount to tariff, $/car-last week2Shuttle bids are a new data series; prior to this we provided only non-shuttle rates.
Note: Bids listed are market INDICATORS only & are NOT guaranteed prices,
n/a = not available; GF = guaranteed freight; Pool = guaranteed pool
Sources: Transportation and Marketing Programs/AMS/USDA
Data from James B. Joiner Co., Tradewest Brokerage Co.
Delivery period
Figure 6
Bids/Offers for Railcars to be Delivered in December 2015, Secondary Market
Non-shuttle bids include unit-train and single-car bids. n/a = not available.
Source: Transportation & Marketing Programs/AMS/USDA
-500
0
500
1000
1500
2000
2500
3000
5/2
8/1
5
6/1
1/1
5
6/2
5/1
5
7/9
/15
7/2
3/1
5
8/6
/15
8/2
0/1
5
9/3
/15
9/1
7/1
5
10/1
/15
10/1
5/1
5
10/2
9/1
5
11/1
2/1
5
11/2
6/1
5
12/1
0/1
5
Non-shuttle Shuttle Non-shuttle avg. 2012-14 (same week) Shuttle avg. 2012-14 (same week)
BNSF UP Non-shuttle n/a $25Shuttle n/a -$200
Ave
rag
e prem
ium
/dis
cou
nt
to t
arif
f
($/c
ar)
Non-shuttle bids/offers were unchanged this week and are at the peak.Shuttle bids/offers fell $100 this week and are $300 below the peak.

October 15, 2015
Grain Transportation Report 10
Table 7
Tariff Rail Rates for Unit and Shuttle Train Shipments1
Effective date: Percent
Tariff change
10/1/2015 Origin region* Destination region* rate/car metric ton bushel2
Y/Y3
Unit train
Wheat Wichita, KS St. Louis, MO $3,605 $51 $36.30 $0.99 3
Grand Forks, ND Duluth-Superior, MN $3,563 $9 $35.47 $0.97 -3
Wichita, KS Los Angeles, CA $6,950 $46 $69.47 $1.89 3
Wichita, KS New Orleans, LA $4,243 $89 $43.02 $1.17 0
Sioux Falls, SD Galveston-Houston, TX $6,486 $38 $64.78 $1.76 4
Northwest KS Galveston-Houston, TX $4,511 $98 $45.76 $1.25 -1
Amarillo, TX Los Angeles, CA $4,710 $136 $48.12 $1.31 -2
Corn Champaign-Urbana, IL New Orleans, LA $3,328 $101 $34.05 $0.86 -7
Toledo, OH Raleigh, NC $6,061 $0 $60.19 $1.53 15
Des Moines, IA Davenport, IA $2,168 $21 $21.74 $0.55 -2
Indianapolis, IN Atlanta, GA $5,004 $0 $49.69 $1.26 11
Indianapolis, IN Knoxville, TN $4,311 $0 $42.81 $1.09 14
Des Moines, IA Little Rock, AR $3,444 $63 $34.82 $0.88 -1
Des Moines, IA Los Angeles, CA $5,052 $182 $51.98 $1.32 -13
Soybeans Minneapolis, MN New Orleans, LA $3,634 $74 $36.83 $1.00 -8
Toledo, OH Huntsville, AL $5,051 $0 $50.16 $1.37 23
Indianapolis, IN Raleigh, NC $6,178 $0 $61.35 $1.67 16
Indianapolis, IN Huntsville, AL $4,529 $0 $44.98 $1.22 23
Champaign-Urbana, IL New Orleans, LA $3,974 $101 $40.46 $1.10 -6
Shuttle Train
Wheat Great Falls, MT Portland, OR $3,953 $26 $39.52 $1.08 0
Wichita, KS Galveston-Houston, TX $3,919 $21 $39.12 $1.06 6
Chicago, IL Albany, NY $5,492 $0 $54.54 $1.48 22
Grand Forks, ND Portland, OR $5,611 $46 $56.17 $1.53 0
Grand Forks, ND Galveston-Houston, TX $6,532 $47 $65.34 $1.78 -1
Northwest KS Portland, OR $5,478 $160 $55.99 $1.52 -3
Corn Minneapolis, MN Portland, OR $5,000 $56 $50.20 $1.28 -10
Sioux Falls, SD Tacoma, WA $4,960 $51 $49.76 $1.26 -9
Champaign-Urbana, IL New Orleans, LA $3,147 $101 $32.25 $0.82 -7
Lincoln, NE Galveston-Houston, TX $3,600 $30 $36.04 $0.92 -6
Des Moines, IA Amarillo, TX $3,795 $79 $38.47 $0.98 -2
Minneapolis, MN Tacoma, WA $5,000 $55 $50.20 $1.28 -10
Council Bluffs, IA Stockton, CA $4,640 $57 $46.64 $1.18 -7
Soybeans Sioux Falls, SD Tacoma, WA $5,490 $51 $55.02 $1.50 -9
Minneapolis, MN Portland, OR $5,510 $56 $55.27 $1.50 -10
Fargo, ND Tacoma, WA $5,380 $45 $53.87 $1.47 -9
Council Bluffs, IA New Orleans, LA $4,425 $116 $45.09 $1.23 -6
Toledo, OH Huntsville, AL $4,226 $0 $41.97 $1.14 29
Grand Island, NE Portland, OR $5,360 $164 $54.85 $1.49 -7
1A unit train refers to shipments of at least 25 cars. Shuttle train rates are available for qualified shipments of
75-120 cars that meet railroad efficiency requirements.
2Approximate load per car = 111 short tons (100.7 metric tons): corn 56 lbs./bu., wheat & soybeans 60 lbs./bu.
3Percentage change year over year calculated using tariff rate plus fuel surchage
Sources: www.bnsf.com, www.cpr.ca, www.csx.com, www.uprr.com
*Regional economic areas defined by the Bureau of Economic Analysis (BEA)
Tariff plus surcharge per:Fuel
surcharge
per car
The tariff rail rate is the base price of freight rail service, and together with fuel surcharges and any auction and secondary
rail values constitute the full cost of shipping by rail. Typically, auction and secondary rail values are a small fraction of the
full cost of shipping by rail relative to the tariff rate. High auction and secondary rail values, during times of high rail demand
or short supply, can exceed the cost of the tariff rate plus fuel surcharge.

October 15, 2015
Grain Transportation Report 11
Figure 7
Railroad Fuel Surcharges, North American Weighted Average1
Sources: www.bnsf.com, www.cn.ca, www.cpr.ca, www.csx.com, www.kcsi.com, www.nscorp.com, www.uprr.com
$0.00
$0.10
$0.20
$0.30
$0.40
$0.50
$0.60
$0.70
$0.80
Sep
-13
Oct
-13
Nov
-13
Dec
-13
Jan
-14
Feb
-14
Mar
-14
Ap
r-1
4
May
-14
Ju
n-1
4
Ju
l-1
4
Au
g-1
4
Sep
-14
Oct
-14
Nov
-14
Dec
-14
Jan
-15
Feb
-15
Mar
-15
Ap
r-1
5
May
-15
Ju
n-1
5
Ju
l-1
5
Au
g-1
5
Sep
-15
Oct
-15
Do
lla
rs p
er
rail
car
mil
e
Fuel Surcharge* ($/mile/railcar)
3-year Monthly Average
1 Weighted by each Class I railroad's proportion of grain traffic for the prior year. * Mileage-based fuel surcharges for March and April 2007 are estimated. Beginning January 2009, the Canadian Pacific fuel surcharge is computed by a monthly average of the bi-weekly fuel surcharge.
** BNSF strike price (diesel price when fuel surcharges begin) changed from $1.25/gal. to $2.50/gal. starting March 1, 2011.***CSX strike price changed from $2.00/gal. to $3.75/gal. starting January 1, 2015.
October 2015: $0.05, down 40 percent from last month's surcharge of $0..083/mile; down 84% from theOctober 2014 surcharge of $0.31/mile; and down 85% from the October prior 3-year average of $0.329/mile.
$0.05
Table 8
Tariff Rail Rates for U.S. Bulk Grain Shipments to MexicoEffective date: 10/1/2015 Percent
Tariff change
Commodity Destination region rate/car1
metric ton3 bushel
3Y/Y
4
Wheat MT Chihuahua, CI $7,459 $48 $76.71 $2.09 7
OK Cuautitlan, EM $6,514 $59 $67.15 $1.83 -9
KS Guadalajara, JA $6,995 $57 $72.05 $1.96 -9
TX Salinas Victoria, NL $4,142 $22 $42.54 $1.16 1
Corn IA Guadalajara, JA $8,427 $67 $86.78 $2.20 -4
SD Celaya, GJ $7,840 $63 $80.75 $2.05 -6
NE Queretaro, QA $7,879 $59 $81.11 $2.06 -3
SD Salinas Victoria, NL $6,545 $48 $67.36 $1.71 3
MO Tlalnepantla, EM $7,238 $57 $74.54 $1.89 -3
SD Torreon, CU $7,240 $53 $74.52 $1.89 0
Soybeans MO Bojay (Tula), HG $8,478 $56 $87.19 $2.37 -2
NE Guadalajara, JA $9,042 $64 $93.04 $2.53 -2
IA El Castillo, JA $9,270 $63 $95.36 $2.59 -2
KS Torreon, CU $7,339 $40 $75.39 $2.05 -1
Sorghum TX Guadalajara, JA $7,150 $41 $73.48 $1.86 -3
NE Celaya, GJ $7,404 $57 $76.23 $1.93 -6
KS Queretaro, QA $7,563 $36 $77.64 $1.97 5
NE Salinas Victoria, NL $6,168 $42 $63.45 $1.61 4
NE Torreon, CU $6,827 $47 $70.24 $1.78 01Rates are based upon published tariff rates for high-capacity shuttle trains. Shuttle trains are available for qualified
shipments of 75--110 cars that meet railroad efficiency requirements.2Fuel surcharge adjusted to reflect the change in Ferrocarril Mexicano, S.A. de C.V railroad fuel surcharge policy as of 10/01/20093Approximate load per car = 97.87 metric tons: Corn & Sorghum 56 lbs/bu, Wheat & Soybeans 60 lbs/bu4Percentage change year over year calculated using tariff rate plus fuel surchage
Sources: www.bnsf.com, www.uprr.com, www.kcsouthern.com
Fuel
surcharge
per car2
Tariff plus surcharge per:Origin
state

October 15, 2015
Grain Transportation Report 12
Barge Transportation
Figure 8
Illinois River Barge Freight Rate1,2
1Rate = percent of 1976 tariff benchmark index (1976 = 100 percent); 24-week moving average of the 3-year average.
Source: Transportation & Marketing Programs/AMS/USDA
0
200
400
600
800
1000
1200
10/1
4/14
10/2
8/14
11/1
1/14
11/2
5/14
12/0
9/14
12/2
3/14
01/0
6/15
01/2
0/15
02/0
3/15
02/1
7/15
03/0
3/15
03/1
7/15
03/3
1/15
04/1
4/15
04/2
8/15
05/1
2/15
05/2
6/15
06/0
9/15
06/2
3/15
07/0
7/15
07/2
1/15
08/0
4/15
08/1
8/15
09/0
1/15
09/1
5/15
09/2
9/15
10/1
3/15
Per
cen
t of
tar
iff Weekly rate
3-year avg. forthe week
Week ending October 13: 15 percent lower than last week, 40 percent lower than a year ago and 27 percent lower than the 3-year
Table 9
Weekly Barge Freight Rates: Southbound Only
Twin
Cities
Mid-
Mississippi
Lower
Illinois
River St. Louis Cincinnati
Lower
Ohio
Cairo-
Memphis
Rate1
10/13/2015 558 533 500 425 500 500 425
10/6/2015 597 592 592 500 583 583 483
$/ton 10/13/2015 34.54 28.36 23.20 16.96 23.45 20.20 13.35
10/6/2015 36.95 31.49 27.47 19.95 27.34 23.55 15.17
Current week % change from the same week:
Last year -25 -36 -40 -38 -38 -38 -31
3-year avg. 2
-16 -23 -27 -35 -30 -30 -33-2 6 6
Rate1
November 530 488 428 370 425 425 338
January - - 418 305 350 350 288
Source: Transportation & Marketing Programs/AMS/USDA
1Rate = percent of 1976 tariff benchmark index (1976 = 100 percent);
24-week moving average; ton = 2,000 pounds; missing data due to winter
closure
Figure 9
Benchmark tariff rates
Calculating barge rate per ton:
(Rate * 1976 tariff benchmark rate per ton)/100
Select applicable index from market quotes included in
tables on this page. The 1976 benchmark rates per ton
are provided in map.
Twin Cities 6.19
Mid-Mississippi 5.32
St. Louis 3.99
Cairo-Memphis 3.14
Illinois 4.64 Cincinnati 4.69
Lower Ohio 4.04

October 15, 2015
Grain Transportation Report 13
Figure 10
Barge Movements on the Mississippi River1 (Locks 27 - Granite City, IL)
1 The 3-year average is a 4-week moving average.
Source: U.S. Army Corps of Engineers
0
100
200
300
400
500
600
700
800
900
1,000
10/0
4/14
10/1
8/14
11/0
1/14
11/1
5/14
11/2
9/14
12/1
3/14
12/2
7/14
01/1
0/15
01/2
4/15
02/0
7/15
02/2
1/15
03/0
7/15
03/2
1/15
04/0
4/15
04/1
8/15
05/0
2/15
05/1
6/15
05/3
0/15
06/1
3/15
06/2
7/15
07/1
1/15
07/2
5/15
08/0
8/15
08/2
2/15
09/0
5/15
09/1
9/15
10/0
3/15
10/1
7/15
10/3
1/15
1,0
00 to
ns
SoybeansWheatCorn3-Year Average
Week ending October 10: up 46% from last year and up 147% from the 3-yr avg.
Table 10
Barge Grain Movements (1,000 tons)Week ending 10/10/2015 Corn Wheat Soybeans Other Total
Mississippi River
Rock Island, IL (L15) 11 5 29 0 45
Winfield, MO (L25) 85 5 77 0 167
Alton, IL (L26) 142 5 312 0 459
Granite City, IL (L27) 129 6 307 0 443
Illinois River (L8) 27 0 68 0 96
Ohio River (L52) 175 15 182 0 372
Arkansas River (L1) 0 3 60 6 68
Weekly total - 2015 304 24 549 6 883
Weekly total - 2014 292 20 340 4 656
2015 YTD1 16,281 1,639 7,611 216 25,748
2014 YTD 17,271 2,051 5,446 186 24,954
2015 as % of 2014 YTD 94 80 140 116 103
Last 4 weeks as % of 20142 83 135 144 100 105
Total 2014 20,693 2,181 11,813 258 34,946
2 As a percent of same period in 2014.
Source: U.S. Army Corps of Engineers Note: Total may not add exactly, due to rounding
1 Weekly total, YTD (year-to-date) and calendar year total includes Miss/27, Ohio/52, and Ark/1; "Other" refers to oats, barley, sorghum, and rye.
October 15, 2015
Grain Transportation Report 14
Figure 11
Source: U.S. Army Corps of Engineers
Upbound Empty Barges Transiting Mississippi River Locks 27, Arkansas River
Lock and Dam 1, and Ohio River Locks and Dam 52
0
100
200
300
400
500
600
7001/
3/1
51/
10/
151/
17/
151/
24/
151/
31/
152/
7/1
52/
14/
152/
21/
152/
28/
153/
7/1
53/
14/
153/
21/
153/
28/
154/
4/1
54/
11/
154/
18/
154/
25/
155/
2/1
55/
9/1
55/
16/
155/
23/
155/
30/
156/
6/1
56/
13/
156/
20/
156/
27/
157/
4/1
57/
11/
157/
18/
157/
25/
158/
1/1
58/
8/1
58/
15/
158/
22/
158/
29/
159/
5/1
59/
12/
159/
19/
159/
26/
1510
/3/1
510
/10/
15
Nu
mb
er o
f Ba
rges
Miss. Locks 27 Ark. Lock 1 Ohio Locks 52
Week ending October 10: 414 total
barges, up 119 barges from the previous
week, and 9 percent lower than the 3-year
Figure 12
Grain Barges for Export in New Orleans Region
Source: U.S. Army Corps of Engineers and GIPSA
0
200
400
600
800
1000
1200
10/1
1/1
4
10/2
5/1
4
11/8
/14
11/2
2/1
4
12/6
/14
12/2
0/1
4
1/3
/15
1/1
7/1
5
1/3
1/1
5
2/1
4/1
5
2/2
8/1
5
3/1
4/1
5
3/2
8/1
5
4/1
1/1
5
4/2
5/1
5
5/9
/15
5/2
3/1
5
6/6
/15
6/2
0/1
5
7/4
/15
7/1
8/1
5
8/1
/15
8/1
5/1
5
8/2
9/1
5
9/1
2/1
5
9/2
6/1
5
10/1
0/1
5
Downbound Grain Barges Locks 27, 1, and 52
Grain Barges Unloaded in New Orleans
Nu
mb
er o
f b
arges
Week ending October 10: 551 grain barges moved down river, up 149 percent from last week, 729 grain barges wereunloaded in New Orleans, up 6 percent from previous week.

October 15, 2015
Grain Transportation Report 15
The weekly diesel price provides a proxy for trends in U.S. truck rates as diesel fuel is a significant expense for truck grain move-
ments.
Truck Transportation
Table 11
Change from
Region Location Price Week ago Year ago
I East Coast 2.554 0.030 -1.160
New England 2.578 0.002 -1.237
Central Atlantic 2.661 0.030 -1.123
Lower Atlantic 2.469 0.037 -1.169
II Midwest2 2.634 0.145 -1.002
III Gulf Coast3
2.339 0.016 -1.298
IV Rocky Mountain 2.516 0.015 -1.234
V West Coast 2.730 0.036 -1.161
West Coast less California 2.603 0.043 -1.199
California 2.833 0.030 -1.132
Total U.S. 2.556 0.064 -1.1421Diesel fuel prices include all taxes. Prices represent an average of all types of diesel fuel.
2Same as North Central 3Same as South Central
Source: Energy Information Administration/U.S. Department of Energy (www.eia.doe.gov)
Retail on-Highway Diesel Prices1, Week Ending 10/12/2015 (US $/gallon)
Figure 13
Weekly Diesel Fuel Prices, U.S. Average
Source: Retail On-Highway Diesel Prices, Energy Information Administration, Dept. of Energy
2.0
2.5
3.0
3.5
4.0
4.5
04/1
3/1
5
04/2
0/1
5
04/2
7/1
5
05/0
4/1
5
05/1
1/1
5
05/1
8/1
5
05/2
5/1
5
06/0
1/1
5
06/0
8/1
5
06/1
5/1
5
06/2
2/1
5
06/2
9/1
5
07/0
6/1
5
07/1
3/1
5
07/2
0/1
5
07/2
7/1
5
08/0
3/1
5
08/1
0/1
5
08/1
7/1
5
08/2
4/1
5
08/3
1/1
5
09/0
7/1
5
09/1
4/1
5
09/2
1/1
5
09/2
8/1
5
10/0
5/1
5
10/1
2/1
5
Last year Current Year
$ p
er
gall
on
Week ending Oct 12: Up 6 cents from the previous week but $1.14 lower than the same week last year.
October 15, 2015
Grain Transportation Report 16
Grain Exports
Table 12
U.S. Export Balances and Cumulative Exports (1,000 metric tons)
Wheat Corn Soybeans Total
Week ending HRW SRW HRS SWW DUR All wheat
Export Balances1
10/1/2015 961 529 1,344 786 134 3,753 7,860 19,593 31,206
This week year ago 1,506 869 1,443 790 101 4,708 11,243 27,405 43,356
Cumulative exports-marketing year 2
2015/16 YTD 2,160 1,503 2,341 1,234 392 7,630 3,173 2,340 13,143
2014/15 YTD 2,970 1,753 2,902 1,437 170 9,232 4,055 2,266 15,553
YTD 2015/16 as % of 2014/15 73 86 81 86 231 83 78 103 85
Last 4 wks as % of same period 2014/15 74 69 120 110 149 91 71 67 70
2014/15 Total 7,009 3,654 7,250 3,758 665 22,336 32,194 46,619 101,149
2013/14 Total 11,465 7,307 6,338 4,367 486 29,963 46,868 44,478 121,3091 Current unshipped export sales to date
2 Shipped export sales to date; new marketing year now in effect for corn and soybeans
Note: YTD = year-to-date. Marketing Year: wheat = 6/01-5/31, corn & soybeans = 9/01-8/31
Source: Foreign Agricultural Service/USDA (www.fas.usda.gov)
Table 13
Top 5 Importers 1 of U.S. Corn
Week ending 10/1/2015 % change
Exports3
2015/16 2014/15 current MY 3-year avg
Current MY Last MY from last MY 2011-2013 - 1,000 mt -
Japan 1,721 2,821 (39) 10,079
Mexico 4,698 3,860 22 8,145
Korea 123 414 (70) 2,965
Colombia 783 1,341 (42) 3,461
Taiwan 204 257 (21) 1,238
Top 5 Importers 7,529 8,692 (13) 25,887
Total US corn export sales 11,033 15,298 (28) 34,445
% of Projected 23% 32%
Change from prior week 520 785
Top 5 importers' share of U.S. corn
export sales 68% 57% 75%
USDA forecast, October 2015 47,074 47,430 (1)
Corn Use for Ethanol USDA
forecast, October 2015 133,350 132,258 1
1Based on FAS Marketing Year Ranking Reports - www.fas.usda.gov; Marketing year (MY) = Sep 1 - Aug 31.
Total Commitments2
- 1,000 mt -
3FAS Marketing Year Ranking Reports - http://apps.fas.usda.gov/export-sales/myrkaug.htm; 3-yr average
2Cumulative Exports (shipped) + Outstanding Sales (unshipped), FAS Weekly Export Sales Report, or Export
Sales Query--http://www.fas.usda.gov/esrquery/
(n) indicates negative number.

October 15, 2015
Grain Transportation Report 17
Table 15
Top 10 Importers1 of All U.S. Wheat
Week Ending 10/1/2015 % change
Exports3
2015/16 2014/15 current MY 3-yr avg
Current MY Last MY from last MY 2012-2014
- 1,000 mt -
Japan 1,138 1,435 (21) 3,113
Mexico 1,142 1,564 (27) 2,807
Nigeria 929 1,503 (38) 2,512
Philippines 1,108 1,122 (1) 2,105
Brazil 310 1,386 (78) 2,091
Korea 624 773 (19) 1,273
Taiwan 510 590 (14) 1,007
Indonesia 193 349 (45) 751
Colombia 364 365 (0) 662
Thailand 194 164 618
Top 10 importers 6,317 9,086 (30) 16,939
Total US wheat export sales 11,382 13,940 (18) 26,361
% of Projected 49% 60%
Change from prior week 288 373
Top 10 importers' share of
U.S. wheat export sales 56% 65% 64%
USDA forecast, October 2015 23,161 23,270 (0)
1 Based on FAS Marketing Year Ranking Reports - www.fas.usda.gov; Marketing year = Jun 1 - May 31.
Total Commitments2
3 FAS Marketing Year Final Reports - www.fas.usda.gov/export-sales/myfi_rpt.htm.
(n) indicates negative number.
2 Cumulative Exports (shipped) + Outstanding Sales (unshipped), FAS Weekly Export Sales Report, or
Export Sales Query--http://www.fas.usda.gov/esrquery/
- 1,000 mt -
Table 14
Top 5 Importers1 of U.S. Soybeans
Week Ending 10/1/2015 % change
Exports3
2015/16 2014/15 current MY 3-yr avg.
Current MY Last MY from last MY 2011-13
- 1,000 mt -
China 9,152 17,193 (47) 24,211
Mexico 1,027 1,068 (4) 2,971
Indonesia 292 681 (57) 1,895
Japan 905 544 66 1,750
Taiwan 334 603 (45) 1,055
Top 5 importers 11,710 20,089 (42) 31,882
Total US soybean export sales 21,933 29,672 (26) 39,169
% of Projected 48% 59%
Change from prior week 1,285 923
Top 5 importers' share of U.S.
soybean export sales 53% 68% 81%
USDA forecast, October 2015 45,640 50,218 (9)
1Based on FAS Marketing Year Ranking Reports - www.fas.usda.gov; Marketing year (MY) = Sep 1 - Aug 31.
Total Commitments2
- 1,000 mt -
3 FAS Marketing Year Final Reports - www.fas.usda.gov/export-sales/myfi_rpt.htm. (Carryover plus
Accumulated Exports)
(n) indicates negative number.
2Cumulative Exports (shipped) + Outstanding Sales (unshipped), FAS Weekly Export Sales Report, or Export
Sales Query--http://www.fas.usda.gov/esrquery/

October 15, 2015
Grain Transportation Report 18
The United States exports approximately one-quarter of the grain it produces. On average, this includes nearly 45 percent of U.S.-grown
wheat, 35 percent of U.S.-grown soybeans, and 20 percent of the U.S.-grown corn. Approximately 59 percent of the U.S. export grain ship-
ments departed through the U.S. Gulf region in 2014.
Table 16
Grain Inspections for Export by U.S. Port Region (1,000 metric tons)
Port Week ending Previous Current Week 2015 YTD as Total1
regions 10/08/15 Week1
as % of Previous 2015 YTD1
2014 YTD1
% of 2014 YTD 2014 3-yr. avg. 2014
Pacific Northwest
Wheat 226 363 62 8,848 10,185 87 110 122 12,436
Corn 121 0 n/a 7,057 7,393 95 75 228 7,781
Soybeans 622 173 360 4,881 4,502 108 n/a 112 12,887
Total 969 536 181 20,786 22,080 94 151 125 33,104
Mississippi Gulf
Wheat 22 67 33 3,691 4,000 92 89 64 4,495
Corn 298 294 101 22,795 24,741 92 75 81 30,912
Soybeans 1,076 849 127 15,570 13,197 118 121 117 29,087
Total 1,396 1,210 115 42,057 41,938 100 99 97 64,495
Texas Gulf
Wheat 28 66 42 3,061 5,169 59 50 40 6,120
Corn 21 8 262 541 509 106 163 403 580
Soybeans 0 0 n/a 210 265 79 0 0 949
Total 49 74 66 3,812 5,943 64 60 47 7,649
Interior
Wheat 11 33 33 1,155 1,150 100 47 116 1,400
Corn 92 114 80 4,876 4,562 107 85 130 5,677
Soybeans 136 191 71 2,544 2,485 102 80 133 4,312
Total 238 339 70 8,574 8,197 105 85 117 11,389
Great Lakes
Wheat 18 59 30 799 543 147 60 77 935
Corn 17 0 n/a 433 226 192 53 163 288
Soybeans 32 0 n/a 118 51 233 n/a 43 988
Total 67 59 113 1,351 820 165 74 72 2,211
Atlantic
Wheat 1 1 80 418 516 81 14 32 553
Corn 13 43 30 208 716 29 65 117 816
Soybeans 12 4 270 986 1,003 98 405 187 2,119
Total 26 49 53 1,612 2,234 72 47 88 3,487
U.S. total from ports2
Wheat 306 590 52 17,973 21,564 83 85 84 25,939
Corn 561 461 122 35,909 38,146 94 80 101 46,054
Soybeans 1,878 1,217 154 24,309 21,503 113 165 114 50,342
Total 2,745 2,267 121 78,191 81,213 96 107 101 122,3351 Data includes revisions from prior weeks; some regional totals may not add exactly due to rounding.
Source: Grain Inspection, Packers and Stockyards Administration/USDA (www.gipsa.usda.gov); YTD= year-to-date; n/a = not applicable
Last 4-weeks as % of

October 15, 2015
Grain Transportation Report 19
Figure 14
U.S. grain inspected for export (wheat, corn, and soybeans)
Source: Grain Inspection, Packers and Stockyards Administration/USDA (www.gipsa.usda.gov)
Note: 3-year average consists of 4-week running average
0
20
40
60
80
100
120
140
160
180
01
/02/1
4
01
/30/1
4
02
/27/1
4
03
/27/1
4
04
/24/1
4
05
/22/1
4
06
/19/1
4
07
/17/1
4
08
/14/1
4
09
/11/1
4
10
/09/1
4
11
/06/1
4
12
/04/1
4
01
/01/1
5
01
/29/1
5
02
/26/1
5
03
/26/1
5
04
/23/1
5
05
/21/1
5
06
/18/1
5
07
/16/1
5
08
/13/1
5
09
/10/1
5
10
/08/1
5
11
/05/1
5
12
/03/1
5
12
/31/1
5
01
/28/1
6
02
/25/1
6
03
/24/1
6
Mil
lion
bu
shels
(m
bu
)
Current week 3-year average
For the week ending Oct. 8: 102.3 mbu, up 21% from the previous week,down 7% from same week last year, and 12% above the 3-year average
Figure 15
U.S. Grain Inspections: U.S. Gulf and PNW1 (wheat, corn, and soybeans)
0
20
40
60
80
100
1/2
/14
2/2
/14
3/2
/14
4/2
/14
5/2
/14
6/2
/14
7/2
/14
8/2
/14
9/2
/14
10
/2/1
4
11
/2/1
4
12
/2/1
4
1/2
/15
2/2
/15
3/2
/15
4/2
/15
5/2
/15
6/2
/15
7/2
/15
8/2
/15
9/2
/15
10
/2/1
5
11
/2/1
5
12
/2/1
5
Mil
lio
n b
ush
els
(mb
u)
Miss . Gulf 3-Year avg - Miss. Gulf
PNW 3-Year avg - PNW
Texas Gulf 3-Year avg - TX Gulf
1.9
52.1*
35.9*
Source: Grain Inspection, Packers and Stockyards Administration/USDA (www.gipsa.usda.gov); *mbu, this week.
O ctober 8: % change from: MS Gulf TX Gulf U.S. Gulf PNWLast week up 15 down 32 up 12 up 82
Last year (same week) down 21 down 67 down 25 up 41
3-yr avg. (4-wk mov. avg. up 12 down 73 up 1 up 56

October 15, 2015
Grain Transportation Report 20
Ocean Transportation
Figure 16
U.S. Gulf1 Vessel Loading Activity
0
10
20
30
40
50
60
70
80
90
5/2
1/2
015
5/2
8/2
01
5
6/0
4/2
01
5
6/1
1/2
01
5
6/1
8/2
015
6/2
5/2
015
7/0
2/2
01
5
7/0
9/2
01
5
7/1
6/2
01
5
7/2
3/2
015
7/3
0/2
015
8/0
6/2
01
5
8/1
3/2
01
5
8/2
0/2
01
5
8/2
7/2
015
9/0
3/2
01
5
9/1
0/2
01
5
9/1
7/2
01
5
9/2
4/2
01
5
10/0
1/2
015
10/0
8/2
015
Nu
mb
er
of
ve
ssel
s
Loaded Last 7 Days Due Next 10 days Loaded 4 Year Average
Source:Transportation & Marketing Programs/AMS/USDA1U.S. Gulf includes Mississippi, Texas, and East Gulf.
Week ending October 8 Loaded Due Change from last year -4.9% 23.0%
Change from 4-year avg. -3.7% 11.5%
Table 17
Weekly Port Region Grain Ocean Vessel Activity (number of vessels)
Pacific Vancouver
Gulf Northwest B.C.
Loaded Due next
Date In port 7-days 10-days In port In port
10/8/2015 45 39 75 11 n/a
10/1/2015 49 42 64 12 n/a
2014 range (18..88) (24..52) (27..97) (6..26) n/a
2014 avg. 47 39 60 15 n/a
Source: Transportation & Marketing Programs/AMS/USDA

October 15, 2015
Grain Transportation Report 21
Figure 17
Grain Vessel Rates, U.S. to Japan
Data Source: O'Neil Commodity Consulting
0
10
20
30
40
50
60
70
Sep
t. 1
3
Nov
. 13
Jan.
14
Mar
. 14
May
14
July
14
Sep
t. 1
4
Nov
. 14
Jan.
15
Mar
. 15
May
15
July
15
Sep
t. 1
5
US
$/m
etri
c to
n
Spread Gulf vs. PNW to Japan Rate Gulf to Japan Rate PNW to Japan
Gulf PNW Spread Ocean rates for September '15 $34.44 $18.19 $16.25 Change from September '14 -25.3% -29.4% -20.3%
Change from 4-year avg. -30.6% -34.8% -25.3 %
Table 18
Ocean Freight Rates For Selected Shipments, Week Ending 10/10/2015
Export Import Grain Loading Volume loads Freight rate
region region types date (metric tons) (US$/metric ton)
U.S. Gulf China Heavy Grain Oct 25/30 55,000 30.50
U.S.Gulf China Heavy Grain Oct 22/31 58,000 32.25
U.S.Gulf China Heavy Grain Oct 22/31 58,000 31.00
U.S. Gulf China Heavy Grain Oct 15/24 55,000 32.25
U.S. Gulf China Heavy Grain Oct 5/20 58,000 31.00
U.S. Gulf China Heavy Grain Oct 5/15 55,000 32.00
U.S. Gulf China Heavy Grain Oct 5/15 55,000 31.50
U.S. Gulf China Heavy Grain Sep 30/ Oct 4 55,000 32.25
U.S. Gulf China Heavy Grain Nov 1/30 55,000 34.50
U.S. Gulf China Heavy Grain Sep 10/20 58,000 36.00
U.S. Gulf China Heavy Grain Sept 20/25 58,000 32.50
U.S. Gulf China Heavy Grain Sep 1/10 60,000 33.00
U.S. Gulf Guatemala1
Corn Jul 20/30 10,000 108.18
PNW Yemen Heavy Grain Oct 1/20 55,000 26.00
Australia Yemen Heavy Grain Oct 1/20 55,000 18.00
Brazil South Africa Grain Oct 1/10 40,000 16.80
Brazil China Heavy Grain Sep 20/30 60,000 24.25
EC S. America China Grain Sep 25/Oct 5 65,000 22.50
France Algeria Wheat Sep 8/10 23,500 17.50
France Algeria Heavy Grain Sep 5/10 25,000 18.00
Latvia Algeria Grain Sep 1/5 45,000 19.25
Lithuania Sp Mediterranean Grain Sep 10/14 25,000 19.50
Romania South Africa Grain Oct 2/7 22,000 33.00
Rates shown are for metric ton (2,204.62 lbs. = 1 metric ton), F.O.B., except where otherwise indicates; op = option
150 percent of food aid from the United States is required to be shipped on U.S.-flag vessels.

October 15, 2015
Grain Transportation Report 22
In 2014, containers were used to transport 7 percent of total U.S. waterborne grain exports. Approximately 63 percent of U.S. wa-
terborne grain exports in 2014 went to Asia, of which 11 percent were moved in containers. Approximately 95 percent of U.S. wa-
terborne containerized grain exports were destined for Asia.
Figure 19
Monthly Shipments of Containerized Grain to Asia
Source: USDA/Agricultural Marketing Service/Transportation Services Division analysis of Port Import Export Reporting Service
(PIERS) data.
Note: The following Harmonized Tariff Codes are used to calculate containerized grains movements: 100190, 100200, 100300,
100400, 100590, 100700, 110100, 230310, 110220, 110290, 120100, 230210, 230990, 230330, and 120810.
05
101520253035404550556065707580
Jan.
Feb
.
Mar
.
Apr.
May
Jun
.
Jul.
Au
g
.
Sep
.
Oct
.
No
v
.
Dec
.
Th
ou
san
d
20
-ft
equ
ivale
nt
un
its
2014
2015
5-year avg
July 2015: Up 14% from last year and 29% higher
than the 5-year average
Figure 18
Top 10 Destination Markets for U.S. Containerized Grain Exports, January-July 2015
Source: USDA/Agricultural Marketing Service/Transportation Services Division analysis of Port Import Export Reporting
Service (PIERS) data
Note: The following Harmonized Tariff Codes are used to calculate containerized grains movements: 100190, 100200,
100300, 100400, 100590, 100700, 110100, 230310, 110220, 110290, 120100, 230210, 230990, 230330, and 120810.
China
37%
Taiwan10%
Indonesia9% Thailand
7%
Vietnam7%
Korea6%
Japan5%
Philippines2%
Malaysia
2%Saudi Arabia2%
Other13%

October 15, 2015
Grain Transportation Report 23
Coordinators
Surajudeen (Deen) Olowolayemo [email protected] (202) 720 - 0119
Pierre Bahizi [email protected] (202) 690 - 0992
Weekly Highlight Editors
Surajudeen (Deen) Olowolayemo [email protected] (202) 720 - 0119
April Taylor [email protected] (202) 720 - 7880
Nicholas Marathon [email protected] (202) 690 - 4430
Grain Transportation Indicators
Surajudeen (Deen) Olowolayemo [email protected] (202) 720 - 0119
Rail Transportation
Johnny Hill [email protected] (202) 690 - 3295
Jesse Gastelle [email protected] (202) 690 - 1144
Peter Caffarelli [email protected] (202) 690 - 3244
Barge Transportation
Nicholas Marathon [email protected] (202) 690 - 4430
April Taylor [email protected] (202) 720 - 7880
Truck Transportation
April Taylor [email protected] (202) 720 - 7880
Grain Exports
Johnny Hill [email protected] (202) 690 - 3295
Ocean Transportation
Surajudeen (Deen) Olowolayemo [email protected] (202) 720 - 0119
(Freight rates and vessels)
April Taylor [email protected] (202) 720 - 7880
(Container movements)
Subscription Information: Send relevant information to [email protected] for an electronic copy
(printed copies are also available upon request).
Preferred citation: U.S. Dept. of Agriculture, Agricultural Marketing Service. Grain Transportation Report.
October 15, 2015. Web: http://dx.doi.org/10.9752/TS056.10-15-2015
Contacts and Links
In accordance with Federal civil rights law and U.S. Department of Agriculture (USDA) civil rights regulations and policies, the USDA, its Agencies, offices, and
employees, and institutions participating in or administering USDA programs are prohibited from discriminating based on race, color, national origin, religion, sex,
gender identity (including gender expression), sexual orientation, disability, age, marital status, family/parental status, income derived from a public assistance
program, political beliefs, or reprisal or retaliation for prior civil rights activity, in any program or activity conducted or funded by USDA (not all bases apply to all
programs). Remedies and complaint filing deadlines vary by program or incident.
Persons with disabilities who require alternative means of communication for program information (e.g., Braille, large print, audiotape, American Sign Language,
etc.) should contact the responsible Agency or USDA’s TARGET Center at (202) 720-2600 (voice and TTY) or contact USDA through the Federal Relay Service
at (800) 877-8339. Additionally, program information may be made available in languages other than English.
To file a program discrimination complaint, complete the USDA Program Discrimination Complaint Form, AD-3027, found online at http://www.ascr.usda.gov/
complaint_filing_cust.html and at any USDA office or write a letter addressed to USDA and provide in the letter all of the information requested in the form. To
request a copy of the complaint form, call (866) 632-9992. Submit your completed form or letter to USDA by:
(1) mail: U.S. Department of Agriculture
Office of the Assistant Secretary for Civil Rights
1400 Independence Avenue, SW
Washington, D.C. 20250-9410;
(2) fax: (202) 690-7442; or
(3) email: [email protected].