unlikely locations: enclosed malls, small markets, and civic prestige david j. roelfs university of...
TRANSCRIPT
Unlikely Locations:Enclosed Malls,Small Markets,
and Civic Prestige
David J. RoelfsUniversity of Louisville

Enclosed Mall Development: The Industry Perspective
• Ring Analysis: the feasibility of a proposed shopping center depends on the population size, consumer purchasing power, degree of retail competition, and site availability within the center’s prospective market/trade area
• On average, a sustainable mall will have 2.5 to 3.0 square feet GLA (gross leasable area) per capita
• Typology of shopping centers– Neighborhood centers: 0 to 99,999 sq. ft. GLA (3K – 40K population)– Community centers: 100,000 to 299,999 sq. ft. GLA (40K – 150K population)– Regional centers: 300,000 to 749,999 sq. ft. GLA (150K – 300K population)– Super regional centers: 750,000+ sq. ft. GLA (300K or more population)
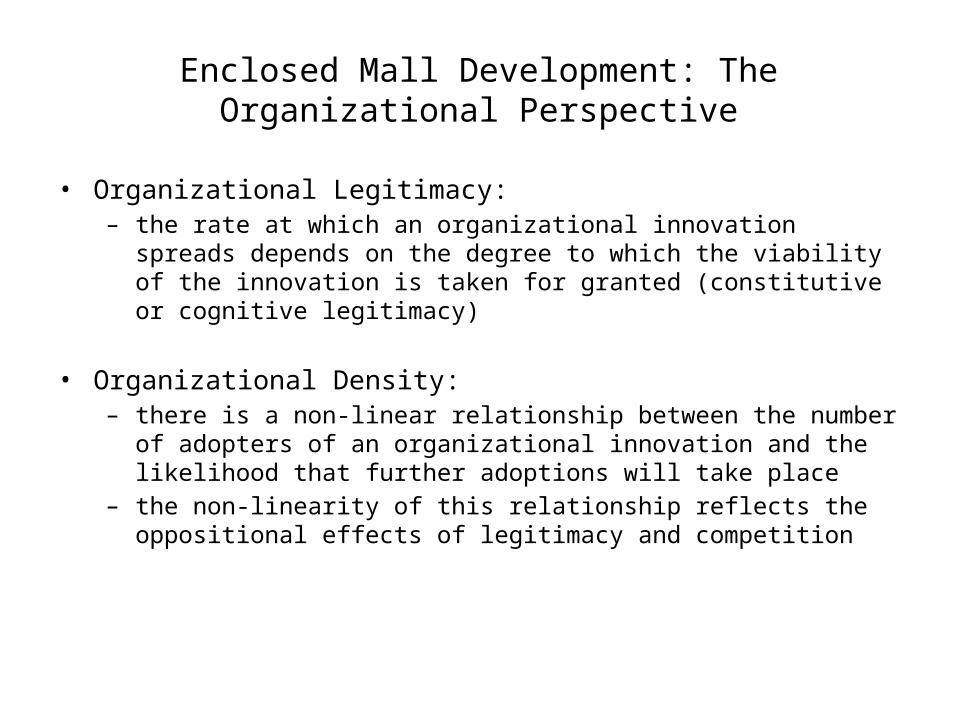
Enclosed Mall Development: The Organizational Perspective
• Organizational Legitimacy: – the rate at which an organizational innovation spreads depends on the degree to
which the viability of the innovation is taken for granted (constitutive or cognitive legitimacy)
• Organizational Density: – there is a non-linear relationship between the number of adopters of an
organizational innovation and the likelihood that further adoptions will take place
– the non-linearity of this relationship reflects the oppositional effects of legitimacy and competition

Data and Methods• Statistical Method: Proportional Hazards (Cox) Regression for Repeated Events
– Event: opening of a new mall or addition of an enclosed mall to an existing shopping center
– Unit-of-analysis: county (proxy for the market area)– Setting: United States, including the District of Columbia, 1945-2009
• Focal Independent Variables– Population size and density– Per capita income and asset levels– Number of farms, manufacturers, wholesalers, service businesses– Number of retailers and retail sales– Number of existing malls and non-enclosed shopping centers– Shopping center legitimacy level
• Control Variables– Geographic region– Land area– Racial, urban/rural, age, and educational composition– National GDP– Federal Reserve Prime Interest Rate

Results

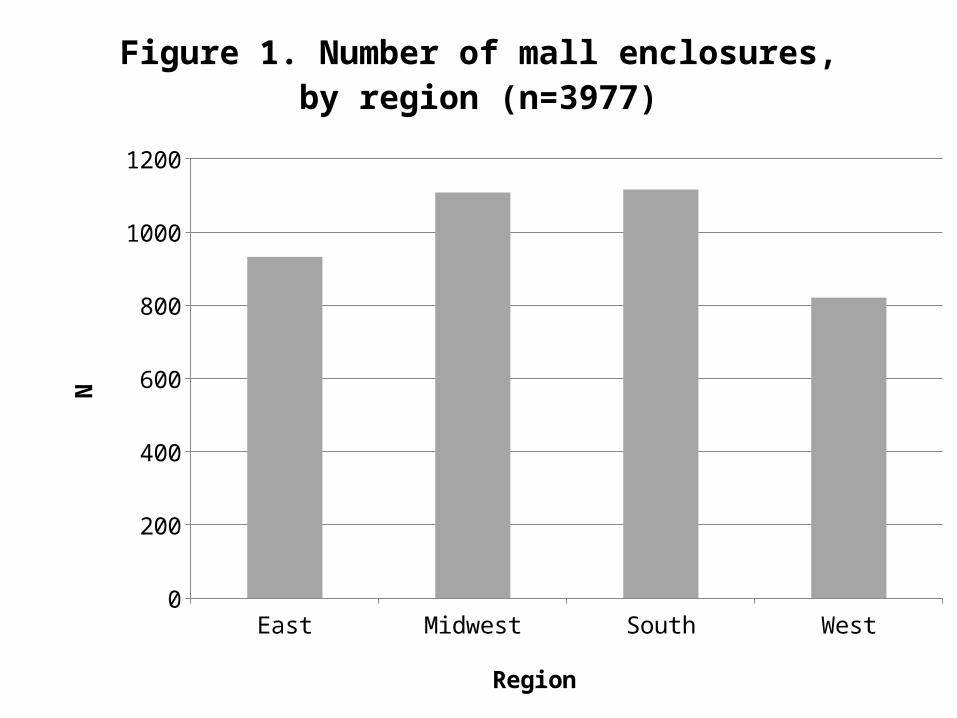
East Midwest South West0
200
400
600
800
1000
1200
Figure 1. Number of mall enclosures, by region (n=3977)
Region
N

Table 1. Descriptive statisticsVariable Min Max Median Mean SE
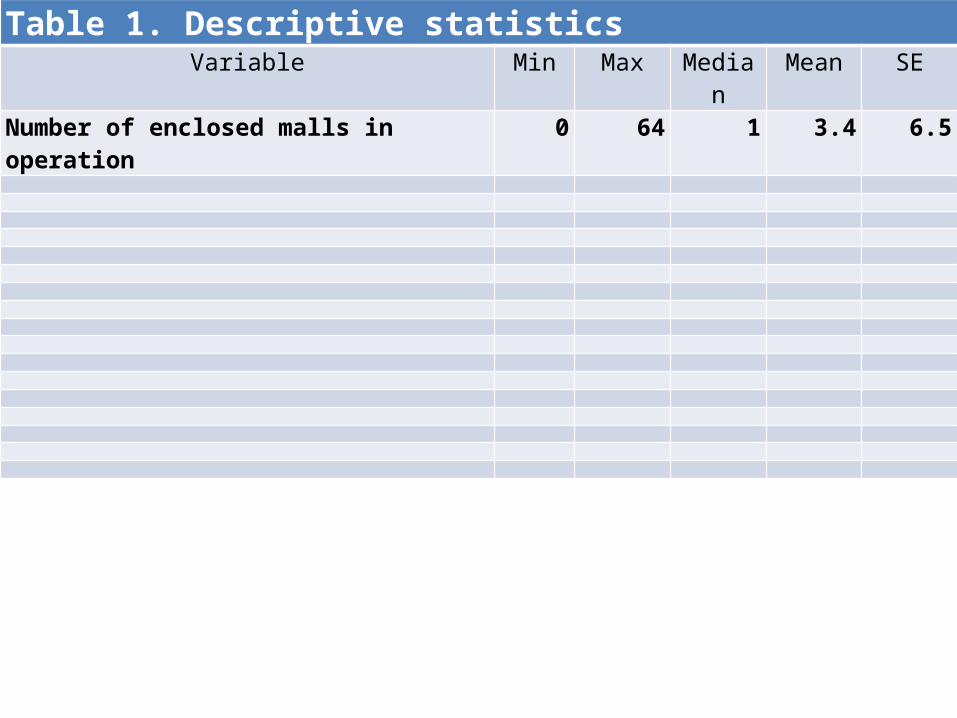
Table 1. Descriptive statisticsVariable Min Max Median Mean SE
Number of enclosed malls in operation 0 64 1 3.4 6.5

Table 1. Descriptive statisticsVariable Min Max Median Mean SE
Number of enclosed malls in operation 0 64 1 3.4 6.5Year enclosed 1956 2009 1974 1975.2 10.3

1956
1958
1960
1962
1964
1966
1968
1970
1972
1974
1976
1978
1980
1982
1984
1986
1988
1990
1992
1994
1996
1998
2000
2002
2004
2006
2008
0
25
50
75
100
125
150
175
200
225
250
Figure 2. Number of enclosed malls constructed, by year (n=3977); includes new construction and re-
modeling of existing centers)
Year
N

Table 1. Descriptive statisticsVariable Min Max Median Mean SE
Number of enclosed malls in operation 0 64 1 3.4 6.5Year enclosed 1956 2009 1974 1975.2 10.3Survival Duration (years) .14 64 4 9.7 11.5

Les
s th
an 1
3 to
3.9
6 to
6.9
9 to
9.9
12 to
12.
9
15 to
15.
9
18 to
18.
9
21 to
21.
9
24 to
24.
9
27 to
27.
9
30 to
30.
9
33 to
33.
9
36 to
36.
9
39 to
39.
9
42 to
42.
9
45 to
45.
9
48 to
48.
9
51 to
51.
9
54 to
54.
9
57 to
57.
9
60 to
60.
9
63 to
63.
90
100
200
300
400
500
600
700
800
Figure 3. Distribution of survival times, county level(n=7112 periods, 3978 periods culminating in mall enclosure event and 3134 right-censored periods)*
Event Censored
Years elapsed since last mall enclosure in county
N
*2108 censored periods with survival time of 64 to 64.9 years (i.e., counties with 0 en-closed malls) not shown

Table 1. Descriptive statisticsVariable Min Max Median Mean SE
Number of enclosed malls in operation 0 64 1 3.4 6.5Year enclosed 1956 2009 1974 1975.2 10.3Survival Duration (years) .14 64 4 9.7 11.5Land Area (square miles) 1 136 K 648 1184.1 2856.2Population 45 9.8 M 76.8 K 318.5K 797.2 KPopulation Density (persons per square mile) .04 84 K 110 699.6 3 K

Table 1. Descriptive statisticsVariable Min Max Median Mean SE
Number of enclosed malls in operation 0 64 1 3.4 6.5Year enclosed 1956 2009 1974 1975.2 10.3Survival Duration (years) .14 64 4 9.7 11.5Land Area (square miles) 1 136 K 648 1184.1 2856.2Population 45 9.8 M 76.8 K 318.5K 797.2 KPopulation Density (persons per square mile) .04 84 K 110 699.6 3 KWhite population proportion 5% 100% 94% 88.0% 14.9%Urban population proportion 0% 100% 63% 57.8% 32.9%

Table 1. Descriptive statisticsVariable Min Max Median Mean SE
Number of enclosed malls in operation 0 64 1 3.4 6.5Year enclosed 1956 2009 1974 1975.2 10.3Survival Duration (years) .14 64 4 9.7 11.5Land Area (square miles) 1 136 K 648 1184.1 2856.2Population 45 9.8 M 76.8 K 318.5K 797.2 KPopulation Density (persons per square mile) .04 84 K 110 699.6 3 KWhite population proportion 5% 100% 94% 88.0% 14.9%Urban population proportion 0% 100% 63% 57.8% 32.9%Median Age (years) 19 59 34 34.7 6.8High school graduation rate 20% 99% 75% 72.3% 16.4%

Table 1. Descriptive statisticsVariable Min Max Median Mean SE
Number of enclosed malls in operation 0 64 1 3.4 6.5Year enclosed 1956 2009 1974 1975.2 10.3Survival Duration (years) .14 64 4 9.7 11.5Land Area (square miles) 1 136 K 648 1184.1 2856.2Population 45 9.8 M 76.8 K 318.5K 797.2 KPopulation Density (persons per square mile) .04 84 K 110 699.6 3 KWhite population proportion 5% 100% 94% 88.0% 14.9%Urban population proportion 0% 100% 63% 57.8% 32.9%Median Age (years) 19 59 34 34.7 6.8High school graduation rate 20% 99% 75% 72.3% 16.4%Bank deposits, per capita, inflation adjusted 0 6.5 K 127 159.7 81.2Median household income, inflation adjusted 9.5 K 118 K 49 K 51 K 13 K

Table 1. Descriptive statisticsVariable Min Max Median Mean SE
Number of enclosed malls in operation 0 64 1 3.4 6.5Year enclosed 1956 2009 1974 1975.2 10.3Survival Duration (years) .14 64 4 9.7 11.5Land Area (square miles) 1 136 K 648 1184.1 2856.2Population 45 9.8 M 76.8 K 318.5K 797.2 KPopulation Density (persons per square mile) .04 84 K 110 699.6 3 KWhite population proportion 5% 100% 94% 88.0% 14.9%Urban population proportion 0% 100% 63% 57.8% 32.9%Median Age (years) 19 59 34 34.7 6.8High school graduation rate 20% 99% 75% 72.3% 16.4%Bank deposits, per capita, inflation adjusted 0 6.5 K 127 159.7 81.2Median household income, inflation adjusted 9.5 K 118 K 49 K 51 K 13 KNumber of farms 0 8 K 725 903.8 790.4Number of manufacturers 0 21 K 88 516.2 1711.6Number of wholesalers 0 24 K 90 605.8 1769.0Number of service businesses 0 140 K 523 2.7 K 7.7 K

Table 1. Descriptive statisticsVariable Min Max Median Mean SE
Number of enclosed malls in operation 0 64 1 3.4 6.5Year enclosed 1956 2009 1974 1975.2 10.3Survival Duration (years) .14 64 4 9.7 11.5Land Area (square miles) 1 136 K 648 1184.1 2856.2Population 45 9.8 M 76.8 K 318.5K 797.2 KPopulation Density (persons per square mile) .04 84 K 110 699.6 3 KWhite population proportion 5% 100% 94% 88.0% 14.9%Urban population proportion 0% 100% 63% 57.8% 32.9%Median Age (years) 19 59 34 34.7 6.8High school graduation rate 20% 99% 75% 72.3% 16.4%Bank deposits, per capita, inflation adjusted 0 6.5 K 127 159.7 81.2Median household income, inflation adjusted 9.5 K 118 K 49 K 51 K 13 KNumber of farms 0 8 K 725 903.8 790.4Number of manufacturers 0 21 K 88 516.2 1711.6Number of wholesalers 0 24 K 90 605.8 1769.0Number of service businesses 0 140 K 523 2.7 K 7.7 KNumber of retailers 0 80 K 525 2.2 K 5.6 KRetail sales, per capita, inflation adjusted ($) 0 128 K 11 K 11 K 5 K

County-level models, without fixed effects

Table 2. Cox regression of the time elapsed between mall enclosure events, county level
Full Model Parsimonious ModelVariable ln (HR) p ln (HR) p HR (95% CI)
Region (reference=West) .161 .367 East .034 Midwest .004 South -.085
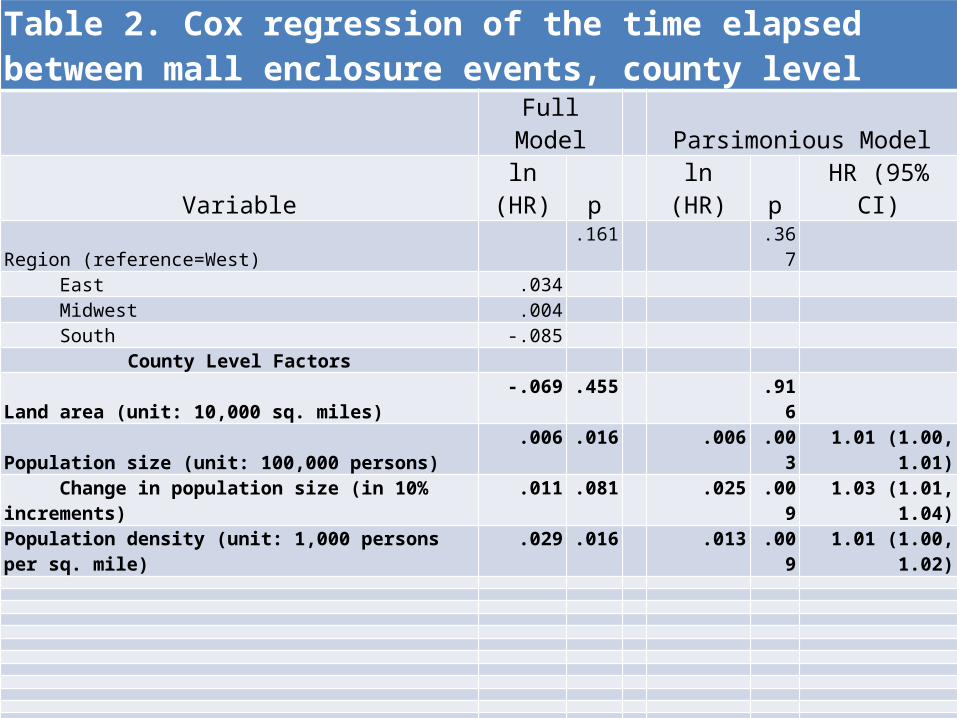
Table 2. Cox regression of the time elapsed between mall enclosure events, county level
Full Model Parsimonious ModelVariable ln (HR) p ln (HR) p HR (95% CI)
Region (reference=West) .161 .367 East .034 Midwest .004 South -.085
County Level Factors Land area (unit: 10,000 sq. miles) -.069 .455 .916 Population size (unit: 100,000 persons) .006 .016 .006 .003 1.01 (1.00, 1.01) Change in population size (in 10% increments) .011 .081 .025 .009 1.03 (1.01, 1.04)Population density (unit: 1,000 persons per sq. mile) .029 .016 .013 .009 1.01 (1.00, 1.02)

Table 2. Cox regression of the time elapsed between mall enclosure events, county level
Full Model Parsimonious ModelVariable ln (HR) p ln (HR) p HR (95% CI)
Region (reference=West) .161 .367 East .034 Midwest .004 South -.085
County Level Factors Land area (unit: 10,000 sq. miles) -.069 .455 .916 Population size (unit: 100,000 persons) .006 .016 .006 .003 1.01 (1.00, 1.01) Change in population size (in 10% increments) .011 .081 .025 .009 1.03 (1.01, 1.04)Population density (unit: 1,000 persons per sq. mile) .029 .016 .013 .009 1.01 (1.00, 1.02)Percent population that is white (in 10% increments) -.014 .436 .602 Change in white population (in 10% increments) -.007 .884 .575 Urban population proportion (in 10% increments) .067 .000 .064 .000 1.07 (1.04, 1.09) Change in urban proportion (in 10% increments) -.044 .136 .120

Table 2. Cox regression of the time elapsed between mall enclosure events, county level
Full Model Parsimonious ModelVariable ln (HR) p ln (HR) p HR (95% CI)
Region (reference=West) .161 .367 East .034 Midwest .004 South -.085
County Level Factors Land area (unit: 10,000 sq. miles) -.069 .455 .916 Population size (unit: 100,000 persons) .006 .016 .006 .003 1.01 (1.00, 1.01) Change in population size (in 10% increments) .011 .081 .025 .009 1.03 (1.01, 1.04)Population density (unit: 1,000 persons per sq. mile) .029 .016 .013 .009 1.01 (1.00, 1.02)Percent population that is white (in 10% increments) -.014 .436 .602 Change in white population (in 10% increments) -.007 .884 .575 Urban population proportion (in 10% increments) .067 .000 .064 .000 1.07 (1.04, 1.09) Change in urban proportion (in 10% increments) -.044 .136 .120 Median age (years) -.010 .084 -.011 .025 0.99 (0.98, 1.00) Change in median age (years) -.004 .790 .493 High school graduation rate (in 10% increments) -.014 .647 .915 Change in graduation rate (in 10% increments) -.166 .019 -.193 .003 0.82 (0.73, 0.94)

Table 2. Cox regression of the time elapsed between mall enclosure events, county level
Full Model Parsimonious ModelVariable ln (HR) p ln (HR) p HR (95% CI)
Region (reference=West) .161 .367 East .034 Midwest .004 South -.085
County Level Factors Land area (unit: 10,000 sq. miles) -.069 .455 .916 Population size (unit: 100,000 persons) .006 .016 .006 .003 1.01 (1.00, 1.01) Change in population size (in 10% increments) .011 .081 .025 .009 1.03 (1.01, 1.04)Population density (unit: 1,000 persons per sq. mile) .029 .016 .013 .009 1.01 (1.00, 1.02)Percent population that is white (in 10% increments) -.014 .436 .602 Change in white population (in 10% increments) -.007 .884 .575 Urban population proportion (in 10% increments) .067 .000 .064 .000 1.07 (1.04, 1.09) Change in urban proportion (in 10% increments) -.044 .136 .120 Median age (years) -.010 .084 -.011 .025 0.99 (0.98, 1.00) Change in median age (years) -.004 .790 .493 High school graduation rate (in 10% increments) -.014 .647 .915 Change in graduation rate (in 10% increments) -.166 .019 -.193 .003 0.82 (0.73, 0.94)Bank deposits (in $1,000,000s per capita) -.174 .876 .918 Change in bank deposits (in 10% increments) -.002 .784 .714 Median household income (in $1,000s) .005 .039 .007 .000 1.01 (1.00, 1.01) Change in median household income (in 10% increm.) .019 .301 .528
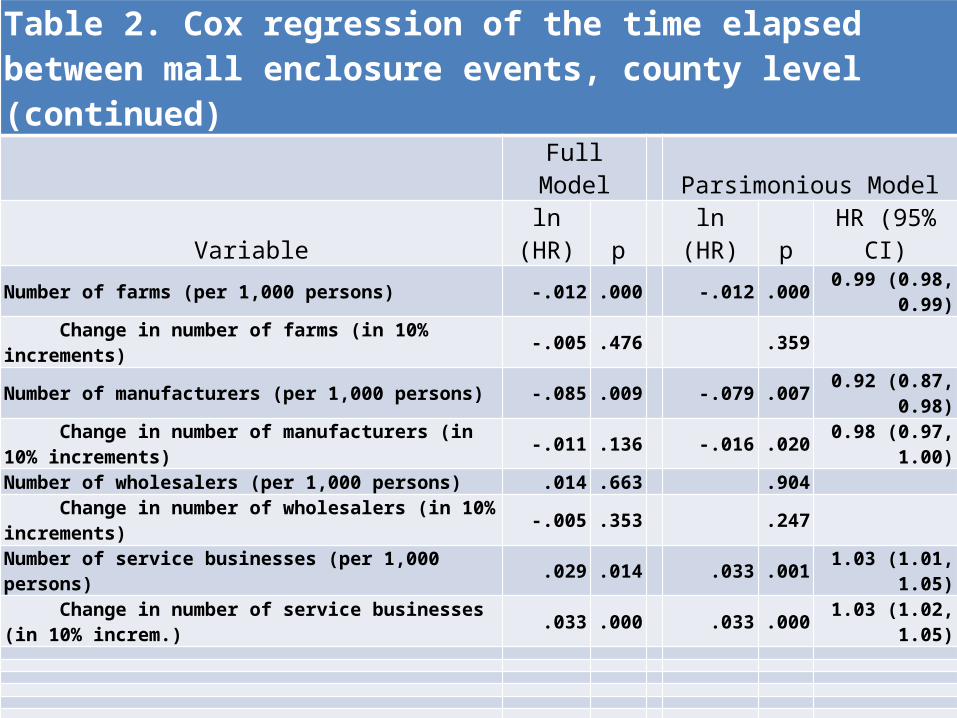
Table 2. Cox regression of the time elapsed between mall enclosure events, county level (continued)
Full Model Parsimonious ModelVariable ln (HR) p ln (HR) p HR (95% CI)
Number of farms (per 1,000 persons) -.012 .000 -.012 .000 0.99 (0.98, 0.99) Change in number of farms (in 10% increments) -.005 .476 .359 Number of manufacturers (per 1,000 persons) -.085 .009 -.079 .007 0.92 (0.87, 0.98) Change in number of manufacturers (in 10% increments) -.011 .136 -.016 .020 0.98 (0.97, 1.00)Number of wholesalers (per 1,000 persons) .014 .663 .904 Change in number of wholesalers (in 10% increments) -.005 .353 .247 Number of service businesses (per 1,000 persons) .029 .014 .033 .001 1.03 (1.01, 1.05) Change in number of service businesses (in 10% increm.) .033 .000 .033 .000 1.03 (1.02, 1.05)

Table 2. Cox regression of the time elapsed between mall enclosure events, county level (continued)
Full Model Parsimonious ModelVariable ln (HR) p ln (HR) p HR (95% CI)
Number of farms (per 1,000 persons) -.012 .000 -.012 .000 0.99 (0.98, 0.99) Change in number of farms (in 10% increments) -.005 .476 .359 Number of manufacturers (per 1,000 persons) -.085 .009 -.079 .007 0.92 (0.87, 0.98) Change in number of manufacturers (in 10% increments) -.011 .136 -.016 .020 0.98 (0.97, 1.00)Number of wholesalers (per 1,000 persons) .014 .663 .904 Change in number of wholesalers (in 10% increments) -.005 .353 .247 Number of service businesses (per 1,000 persons) .029 .014 .033 .001 1.03 (1.01, 1.05) Change in number of service businesses (in 10% increments) .033 .000 .033 .000 1.03 (1.02, 1.05)Number of retailers (per 1,000 persons) -.034 .030 -.026 .071 0.97 (0.95, 1.00) Change in number of retailers (in 10% increments) -.041 .001 -.051 .000 0.95 (0.93, 0.97)Retail sales (in $1,000s per capita) .007 .393 .368 Change in retail sales (in 10% increments) -.002 .761 .770
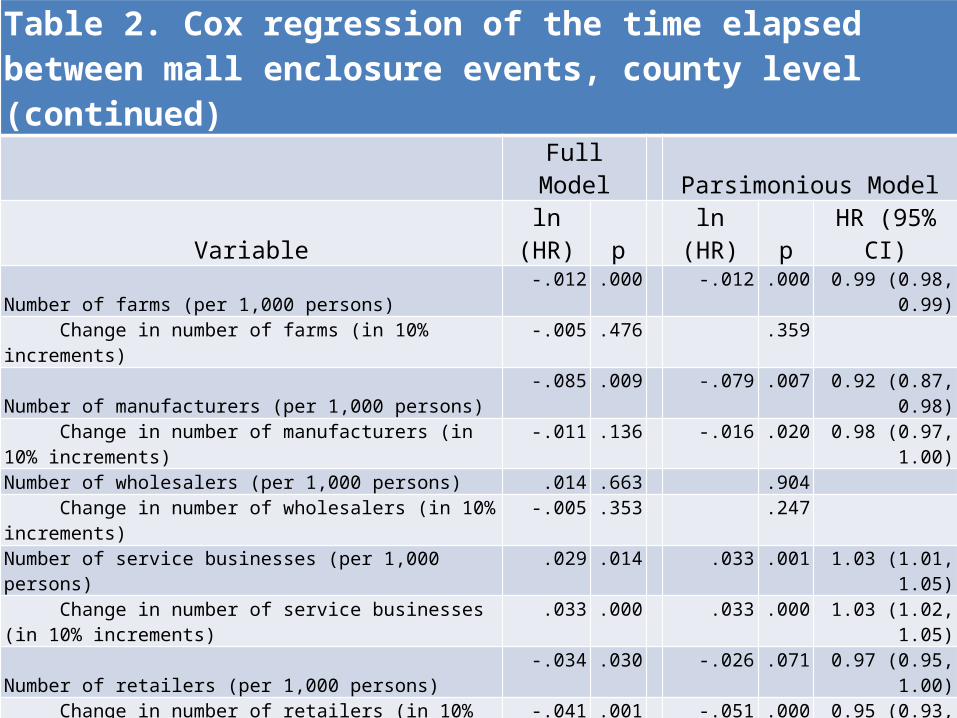
Table 2. Cox regression of the time elapsed between mall enclosure events, county level (continued)
Full Model Parsimonious ModelVariable ln (HR) p ln (HR) p HR (95% CI)
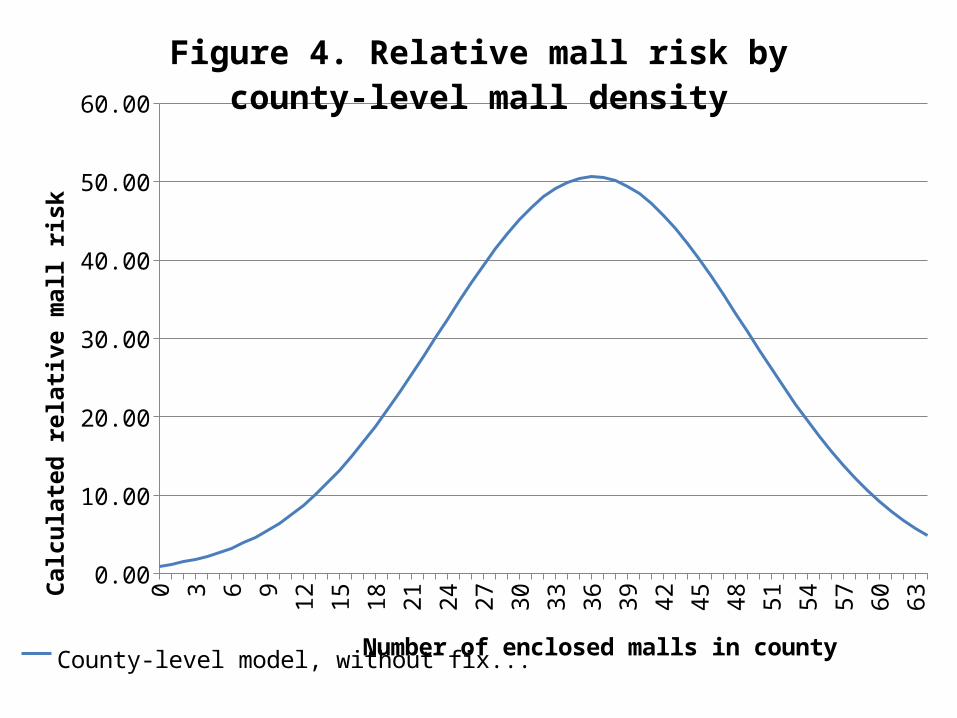
Number of farms (per 1,000 persons) -.012 .000 -.012 .000 0.99 (0.98, 0.99) Change in number of farms (in 10% increments) -.005 .476 .359 Number of manufacturers (per 1,000 persons) -.085 .009 -.079 .007 0.92 (0.87, 0.98) Change in number of manufacturers (in 10% increments) -.011 .136 -.016 .020 0.98 (0.97, 1.00)Number of wholesalers (per 1,000 persons) .014 .663 .904 Change in number of wholesalers (in 10% increments) -.005 .353 .247 Number of service businesses (per 1,000 persons) .029 .014 .033 .001 1.03 (1.01, 1.05) Change in number of service businesses (in 10% increments) .033 .000 .033 .000 1.03 (1.02, 1.05)Number of retailers (per 1,000 persons) -.034 .030 -.026 .071 0.97 (0.95, 1.00) Change in number of retailers (in 10% increments) -.041 .001 -.051 .000 0.95 (0.93, 0.97)Retail sales (in $1,000s per capita) .007 .393 .368 Change in retail sales (in 10% increments) -.002 .761 .770 Number of malls .218 .000 .217 .000 1.24 (1.23, 1.26) Number of malls, squared -.003 .000 -.003 .000 1.00 (1.00, 1.00)
0 3 6 9 12 15 18 21 24 27 30 33 36 39 42 45 48 51 54 57 60 63
0.00
10.00
20.00
30.00
40.00
50.00
60.00
Figure 4. Relative mall risk by county-level mall density
County-level model, without fixed effects
Number of enclosed malls in county
Cal
cula
ted
rela
tive
mal
l ris
k

Table 2. Cox regression of the time elapsed between mall enclosure events, county level (continued)
Full Model Parsimonious ModelVariable ln (HR) p ln (HR) p HR (95% CI)
Number of farms (per 1,000 persons) -.012 .000 -.012 .000 0.99 (0.98, 0.99) Change in number of farms (in 10% increments) -.005 .476 .359 Number of manufacturers (per 1,000 persons) -.085 .009 -.079 .007 0.92 (0.87, 0.98) Change in number of manufacturers (in 10% increments) -.011 .136 -.016 .020 0.98 (0.97, 1.00)Number of wholesalers (per 1,000 persons) .014 .663 .904 Change in number of wholesalers (in 10% increments) -.005 .353 .247 Number of service businesses (per 1,000 persons) .029 .014 .033 .001 1.03 (1.01, 1.05) Change in number of service businesses (in 10% increments) .033 .000 .033 .000 1.03 (1.02, 1.05)Number of retailers (per 1,000 persons) -.034 .030 -.026 .071 0.97 (0.95, 1.00) Change in number of retailers (in 10% increments) -.041 .001 -.051 .000 0.95 (0.93, 0.97)Retail sales (in $1,000s per capita) .007 .393 .368 Change in retail sales (in 10% increments) -.002 .761 .770 Number of malls .218 .000 .217 .000 1.24 (1.23, 1.26) Number of malls, squared -.003 .000 -.003 .000 1.00 (1.00, 1.00)
National Level Factors Number of malls (in increments of 100) -.059 .079 -.080 .000 0.92 (0.89, 0.96) Number of malls, squared .003 .000 .003 .000 1.00 (1.00, 1.00)Number of shopping centers (in increments of 1,000) .171 .000 .178 .000 1.20 (1.14, 1.25) Number of shopping centers, squared -.004 .000 -.004 .000 1.00 (0.99, 1.00)

0
200
400
600
800
1000
1200
1400
1600
1800
2000
2200
2400
2600
2800
3000
3200
0
0.5
1
1.5
2
2.5
3
3.5
4
Figure 5. County-level relative mall risk by national-level mall density
County-level model, without fixed effects
Number of enclosed malls in nation
Cal
cula
ted
rela
tive
mal
l ris
k

Table 2. Cox regression of the time elapsed between mall enclosure events, county level (continued)
Full Model Parsimonious ModelVariable ln (HR) p ln (HR) p HR (95% CI)
Number of farms (per 1,000 persons) -.012 .000 -.012 .000 0.99 (0.98, 0.99) Change in number of farms (in 10% increments) -.005 .476 .359 Number of manufacturers (per 1,000 persons) -.085 .009 -.079 .007 0.92 (0.87, 0.98) Change in number of manufacturers (in 10% increments) -.011 .136 -.016 .020 0.98 (0.97, 1.00)Number of wholesalers (per 1,000 persons) .014 .663 .904 Change in number of wholesalers (in 10% increments) -.005 .353 .247 Number of service businesses (per 1,000 persons) .029 .014 .033 .001 1.03 (1.01, 1.05) Change in number of service businesses (in 10% increments) .033 .000 .033 .000 1.03 (1.02, 1.05)Number of retailers (per 1,000 persons) -.034 .030 -.026 .071 0.97 (0.95, 1.00) Change in number of retailers (in 10% increments) -.041 .001 -.051 .000 0.95 (0.93, 0.97)Retail sales (in $1,000s per capita) .007 .393 .368 Change in retail sales (in 10% increments) -.002 .761 .770 Number of malls .218 .000 .217 .000 1.24 (1.23, 1.26) Number of malls, squared -.003 .000 -.003 .000 1.00 (1.00, 1.00)
National Level Factors Number of malls (in increments of 100) -.059 .079 -.080 .000 0.92 (0.89, 0.96) Number of malls, squared .003 .000 .003 .000 1.00 (1.00, 1.00)Number of shopping centers (in increments of 1,000) .171 .000 .178 .000 1.20 (1.14, 1.25) Number of shopping centers, squared -.004 .000 -.004 .000 1.00 (0.99, 1.00)Shopping center legitimacy level (range: 0-1) -.184 .688 .883

Table 2. Cox regression of the time elapsed between mall enclosure events, county level (continued)
Full Model Parsimonious ModelVariable ln (HR) p ln (HR) p HR (95% CI)
Number of farms (per 1,000 persons) -.012 .000 -.012 .000 0.99 (0.98, 0.99) Change in number of farms (in 10% increments) -.005 .476 .359 Number of manufacturers (per 1,000 persons) -.085 .009 -.079 .007 0.92 (0.87, 0.98) Change in number of manufacturers (in 10% increments) -.011 .136 -.016 .020 0.98 (0.97, 1.00)Number of wholesalers (per 1,000 persons) .014 .663 .904 Change in number of wholesalers (in 10% increments) -.005 .353 .247 Number of service businesses (per 1,000 persons) .029 .014 .033 .001 1.03 (1.01, 1.05) Change in number of service businesses (in 10% increments) .033 .000 .033 .000 1.03 (1.02, 1.05)Number of retailers (per 1,000 persons) -.034 .030 -.026 .071 0.97 (0.95, 1.00) Change in number of retailers (in 10% increments) -.041 .001 -.051 .000 0.95 (0.93, 0.97)Retail sales (in $1,000s per capita) .007 .393 .368 Change in retail sales (in 10% increments) -.002 .761 .770 Number of malls .218 .000 .217 .000 1.24 (1.23, 1.26) Number of malls, squared -.003 .000 -.003 .000 1.00 (1.00, 1.00)
National Level Factors Number of malls (in increments of 100) -.059 .079 -.080 .000 0.92 (0.89, 0.96) Number of malls, squared .003 .000 .003 .000 1.00 (1.00, 1.00)Number of shopping centers (in increments of 1,000) .171 .000 .178 .000 1.20 (1.14, 1.25) Number of shopping centers, squared -.004 .000 -.004 .000 1.00 (0.99, 1.00)Shopping center legitimacy level (range: 0-1) -.184 .688 .883 GDP (in $1 Trillions) -.485 .000 -.489 .000 0.61 (0.53, 0.71) GDP growth rate (in 10% increments) .221 .000 .231 .000 1.26 (1.17, 1.35)Federal Reserve Prime Rate (in 1% increments) -.004 .673 .524

County-level models, with fixed effects

Table 3. Cox regression with fixed effects of the time elapsed between mall enclosure events, county level
Full Model Parsimonious Model
Variableln
(HR) p ln
(HR) p HR (95% CI)County Level Factors
Land area (unit: 10,000 sq. miles) -2.780 .532 .812 Population size (unit: 100,000 persons) -.016 .290 .329 Change in population size (in 10% increments) .014 .565 .198 Population density (unit: 1,000 persons per sq. mile) -.113 .018 -.113 .022 0.89 (0.81, 0.98)

Table 3. Cox regression with fixed effects of the time elapsed between mall enclosure events, county level
Full Model Parsimonious Model
Variableln
(HR) p ln
(HR) p HR (95% CI)County Level Factors
Land area (unit: 10,000 sq. miles) -2.780 .532 .812 Population size (unit: 100,000 persons) -.016 .290 .329 Change in population size (in 10% increments) .014 .565 .198 Population density (unit: 1,000 persons per sq. mile) -.113 .018 -.113 .022 0.89 (0.81, 0.98)Percent population that is white (in 10% increments) -.089 .323 .265 Change in white population (in 10% increments) -.026 .767 .511 Urban population proportion (in 10% increments) .008 .874 .931 Change in urban proportion (in 10% increments) .030 .614 .690

Table 3. Cox regression with fixed effects of the time elapsed between mall enclosure events, county level
Full Model Parsimonious Model
Variableln
(HR) p ln
(HR) p HR (95% CI)County Level Factors
Land area (unit: 10,000 sq. miles) -2.780 .532 .812 Population size (unit: 100,000 persons) -.016 .290 .329 Change in population size (in 10% increments) .014 .565 .198 Population density (unit: 1,000 persons per sq. mile) -.113 .018 -.113 .022 0.89 (0.81, 0.98)Percent population that is white (in 10% increments) -.089 .323 .265 Change in white population (in 10% increments) -.026 .767 .511 Urban population proportion (in 10% increments) .008 .874 .931 Change in urban proportion (in 10% increments) .030 .614 .690 Median age (years) -.027 .337 .132 Change in median age (years) -.027 .320 .288 High school graduation rate (in 10% increments) -.226 .071 -.206 .047 0.81 (0.66, 1.00) Change in graduation rate (in 10% increments) -.398 .005 -.301 .018 0.74 (0.58, 0.95)

Table 3. Cox regression with fixed effects of the time elapsed between mall enclosure events, county level
Full Model Parsimonious Model
Variableln
(HR) p ln
(HR) p HR (95% CI)County Level Factors
Land area (unit: 10,000 sq. miles) -2.780 .532 .812 Population size (unit: 100,000 persons) -.016 .290 .329 Change in population size (in 10% increments) .014 .565 .198 Population density (unit: 1,000 persons per sq. mile) -.113 .018 -.113 .022 0.89 (0.81, 0.98)Percent population that is white (in 10% increments) -.089 .323 .265 Change in white population (in 10% increments) -.026 .767 .511 Urban population proportion (in 10% increments) .008 .874 .931 Change in urban proportion (in 10% increments) .030 .614 .690 Median age (years) -.027 .337 .132 Change in median age (years) -.027 .320 .288 High school graduation rate (in 10% increments) -.226 .071 -.206 .047 0.81 (0.66, 1.00) Change in graduation rate (in 10% increments) -.398 .005 -.301 .018 0.74 (0.58, 0.95)Bank deposits (in $1000s per capita) 2.721 .577 .226 Change in bank deposits (in 10% increments) .005 .654 .383 Median household income (in $1,000s) .022 .008 .019 .007 1.02 (1.01, 1.03) Change in median household income (in 10% increments) -.030 .330 .856

Table 3. Multiple event history analyses with fixed effects (cont.)Full Model Parsimonious Model
Variableln
(HR) p ln
(HR) p HR (95% CI)Number of farms (per 1,000 persons) -.040 .000 -.047 .000 0.95 (0.94, 0.97) Change in number of farms (in 10% increments) -.021 .086 .121 Number of manufacturers (per 1,000 persons) -.715 .000 -.749 .000 0.47 (0.37, 0.60) Change in number of manufacturers (in 10% increments) .011 .453 .104 Number of wholesalers (per 1,000 persons) -.115 .278 .258 Change in number of wholesalers (in 10% increments) .013 .296 .233 Number of service businesses (per 1,000 persons) -.004 .878 .618 Change in number of service businesses (in 10% increments) .012 .307 .026 .001 1.03 (1.01, 1.04)

Table 3. Multiple event history analyses with fixed effects (cont.)Full Model Parsimonious Model
Variableln
(HR) p ln
(HR) p HR (95% CI)Number of farms (per 1,000 persons) -.040 .000 -.047 .000 0.95 (0.94, 0.97) Change in number of farms (in 10% increments) -.021 .086 .121 Number of manufacturers (per 1,000 persons) -.715 .000 -.749 .000 0.47 (0.37, 0.60) Change in number of manufacturers (in 10% increments) .011 .453 .104 Number of wholesalers (per 1,000 persons) -.115 .278 .258 Change in number of wholesalers (in 10% increments) .013 .296 .233 Number of service businesses (per 1,000 persons) -.004 .878 .618 Change in number of service businesses (in 10% increments) .012 .307 .026 .001 1.03 (1.01, 1.04)Number of retailers (per 1,000 persons) -.093 .044 -.102 .000 0.90 (0.85, 0.95) Change in number of retailers (in 10% increments) .001 .974 .591 Retail sales (in $1000s per capita) .029 .127 .362 Change in retail sales (in 10% increments) -.003 .782 .400

Table 3. Multiple event history analyses with fixed effects (cont.)Full Model Parsimonious Model
Variableln
(HR) p ln
(HR) p HR (95% CI)Number of farms (per 1,000 persons) -.040 .000 -.047 .000 0.95 (0.94, 0.97) Change in number of farms (in 10% increments) -.021 .086 .121 Number of manufacturers (per 1,000 persons) -.715 .000 -.749 .000 0.47 (0.37, 0.60) Change in number of manufacturers (in 10% increments) .011 .453 .104 Number of wholesalers (per 1,000 persons) -.115 .278 .258 Change in number of wholesalers (in 10% increments) .013 .296 .233 Number of service businesses (per 1,000 persons) -.004 .878 .618 Change in number of service businesses (in 10% increments) .012 .307 .026 .001 1.03 (1.01, 1.04)Number of retailers (per 1,000 persons) -.093 .044 -.102 .000 0.90 (0.85, 0.95) Change in number of retailers (in 10% increments) .001 .974 .591 Retail sales (in $1000s per capita) .029 .127 .362 Change in retail sales (in 10% increments) -.003 .782 .400 Number of malls .159 .000 .151 .000 1.16 (1.13, 1.20) Number of malls, squared -.002 .000 -.002 .000 1.00 (1.00, 1.00)

0 3 6 9 12 15 18 21 24 27 30 33 36 39 42 45 48 51 54 57 60 63
0.00
10.00
20.00
30.00
40.00
50.00
60.00
Figure 6. Relative mall risk by county-level mall density
County-level model, without fixed effects County-level model, with fixed effects
Number of enclosed malls in county
Cal
cula
ted
rela
tive
mal
l ris
k
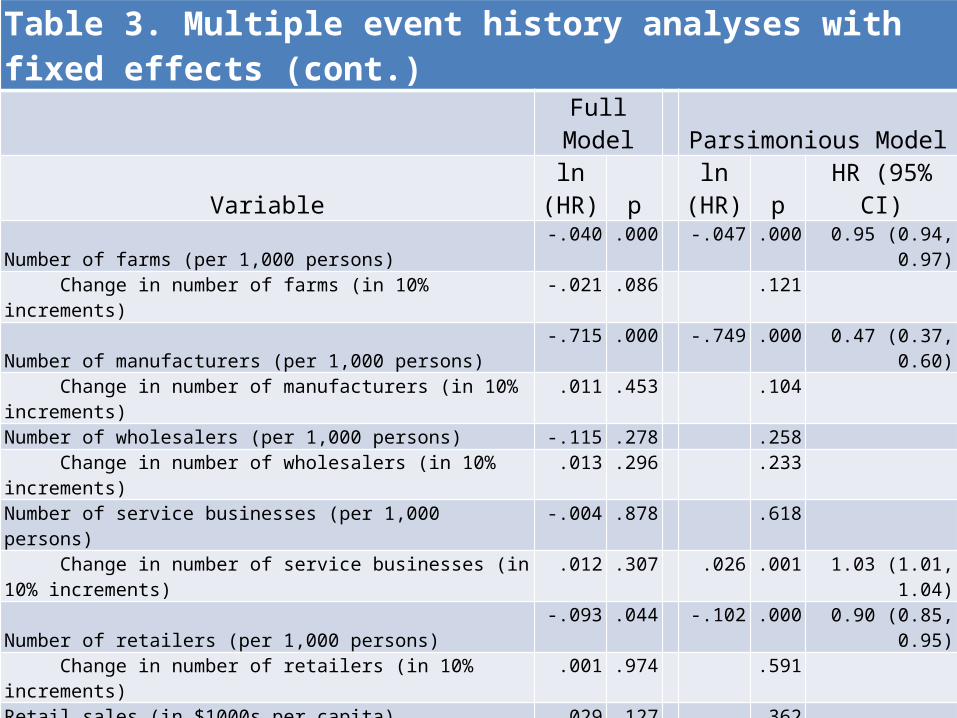
Table 3. Multiple event history analyses with fixed effects (cont.)Full Model Parsimonious Model
Variableln
(HR) p ln
(HR) p HR (95% CI)Number of farms (per 1,000 persons) -.040 .000 -.047 .000 0.95 (0.94, 0.97) Change in number of farms (in 10% increments) -.021 .086 .121 Number of manufacturers (per 1,000 persons) -.715 .000 -.749 .000 0.47 (0.37, 0.60) Change in number of manufacturers (in 10% increments) .011 .453 .104 Number of wholesalers (per 1,000 persons) -.115 .278 .258 Change in number of wholesalers (in 10% increments) .013 .296 .233 Number of service businesses (per 1,000 persons) -.004 .878 .618 Change in number of service businesses (in 10% increments) .012 .307 .026 .001 1.03 (1.01, 1.04)Number of retailers (per 1,000 persons) -.093 .044 -.102 .000 0.90 (0.85, 0.95) Change in number of retailers (in 10% increments) .001 .974 .591 Retail sales (in $1000s per capita) .029 .127 .362 Change in retail sales (in 10% increments) -.003 .782 .400 Number of malls .159 .000 .151 .000 1.16 (1.13, 1.20) Number of malls, squared -.002 .000 -.002 .000 1.00 (1.00, 1.00)
National Level Factors Number of malls (in increments of 100) .018 .729 .039 .164 1.04 (0.98, 1.10) Number of malls, squared .001 .148 .001 .088 1.00 (1.00, 1.00)Number of shopping centers (in increments of 1,000) .102 .013 .112 .001 1.12 (1.05, 1.19) Number of shopping centers, squared -.002 .012 -.003 .000 1.00 (1.00, 1.00)

0
200
400
600
800
1000
1200
1400
1600
1800
2000
2200
2400
2600
2800
3000
3200
0
0.5
1
1.5
2
2.5
3
3.5
4
Figure 7. County-level relative mall risk by national-level mall density
County-level model, without fixed effects County-level model, with fixed effects
Number of enclosed malls in nation
Cal
cula
ted
rela
tive
mal
l ris
k
0
200
400
600
800
1000
1200
1400
1600
1800
2000
2200
2400
2600
2800
3000
3200
0
5
10
15
20
25
30
35
40
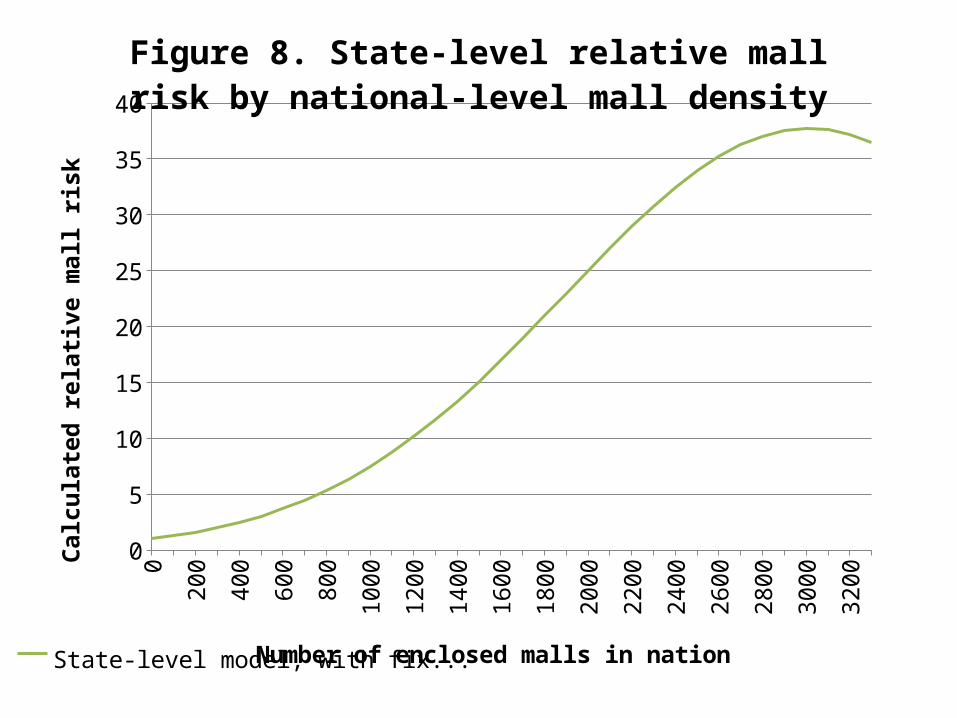
Figure 8. State-level relative mall risk by national-level mall density
State-level model, with fixed effects
Number of enclosed malls in nation
Cal
cula
ted
rela
tive
mal
l ris
k

Table 3. Multiple event history analyses with fixed effects (cont.)Full Model Parsimonious Model
Variableln
(HR) p ln
(HR) p HR (95% CI)Number of farms (per 1,000 persons) -.040 .000 -.047 .000 0.95 (0.94, 0.97) Change in number of farms (in 10% increments) -.021 .086 .121 Number of manufacturers (per 1,000 persons) -.715 .000 -.749 .000 0.47 (0.37, 0.60) Change in number of manufacturers (in 10% increments) .011 .453 .104 Number of wholesalers (per 1,000 persons) -.115 .278 .258 Change in number of wholesalers (in 10% increments) .013 .296 .233 Number of service businesses (per 1,000 persons) -.004 .878 .618 Change in number of service businesses (in 10% increments) .012 .307 .026 .001 1.03 (1.01, 1.04)Number of retailers (per 1,000 persons) -.093 .044 -.102 .000 0.90 (0.85, 0.95) Change in number of retailers (in 10% increments) .001 .974 .591 Retail sales (in $1000s per capita) .029 .127 .362 Change in retail sales (in 10% increments) -.003 .782 .400 Number of malls .159 .000 .151 .000 1.16 (1.13, 1.20) Number of malls, squared -.002 .000 -.002 .000 1.00 (1.00, 1.00)
National Level Factors Number of malls (in increments of 100) .018 .729 .039 .164 1.04 (0.98, 1.10) Number of malls, squared .001 .148 .001 .088 1.00 (1.00, 1.00)Number of shopping centers (in increments of 1,000) .102 .013 .112 .001 1.12 (1.05, 1.19) Number of shopping centers, squared -.002 .012 -.003 .000 1.00 (1.00, 1.00)Shopping center legitimacy level (range: 0-1) .455 .488 .731

Table 3. Multiple event history analyses with fixed effects (cont.)Full Model Parsimonious Model
Variableln
(HR) p ln
(HR) p HR (95% CI)Number of farms (per 1,000 persons) -.040 .000 -.047 .000 0.95 (0.94, 0.97) Change in number of farms (in 10% increments) -.021 .086 .121 Number of manufacturers (per 1,000 persons) -.715 .000 -.749 .000 0.47 (0.37, 0.60) Change in number of manufacturers (in 10% increments) .011 .453 .104 Number of wholesalers (per 1,000 persons) -.115 .278 .258 Change in number of wholesalers (in 10% increments) .013 .296 .233 Number of service businesses (per 1,000 persons) -.004 .878 .618 Change in number of service businesses (in 10% increments) .012 .307 .026 .001 1.03 (1.01, 1.04)Number of retailers (per 1,000 persons) -.093 .044 -.102 .000 0.90 (0.85, 0.95) Change in number of retailers (in 10% increments) .001 .974 .591 Retail sales (in $1000s per capita) .029 .127 .362 Change in retail sales (in 10% increments) -.003 .782 .400 Number of malls .159 .000 .151 .000 1.16 (1.13, 1.20) Number of malls, squared -.002 .000 -.002 .000 1.00 (1.00, 1.00)
National Level Factors Number of malls (in increments of 100) .018 .729 .039 .164 1.04 (0.98, 1.10) Number of malls, squared .001 .148 .001 .088 1.00 (1.00, 1.00)Number of shopping centers (in increments of 1,000) .102 .013 .112 .001 1.12 (1.05, 1.19) Number of shopping centers, squared -.002 .012 -.003 .000 1.00 (1.00, 1.00)Shopping center legitimacy level (range: 0-1) .455 .488 .731 GDP (in $1 Trillions) -.491 .000 -.486 .000 0.61 (0.51, 0.74) GDP growth rate (in 10% increments) .155 .004 .164 .001 1.18 (1.07, 1.30)Federal Reserve Prime Rate (in 1% increments) .007 .541 .549

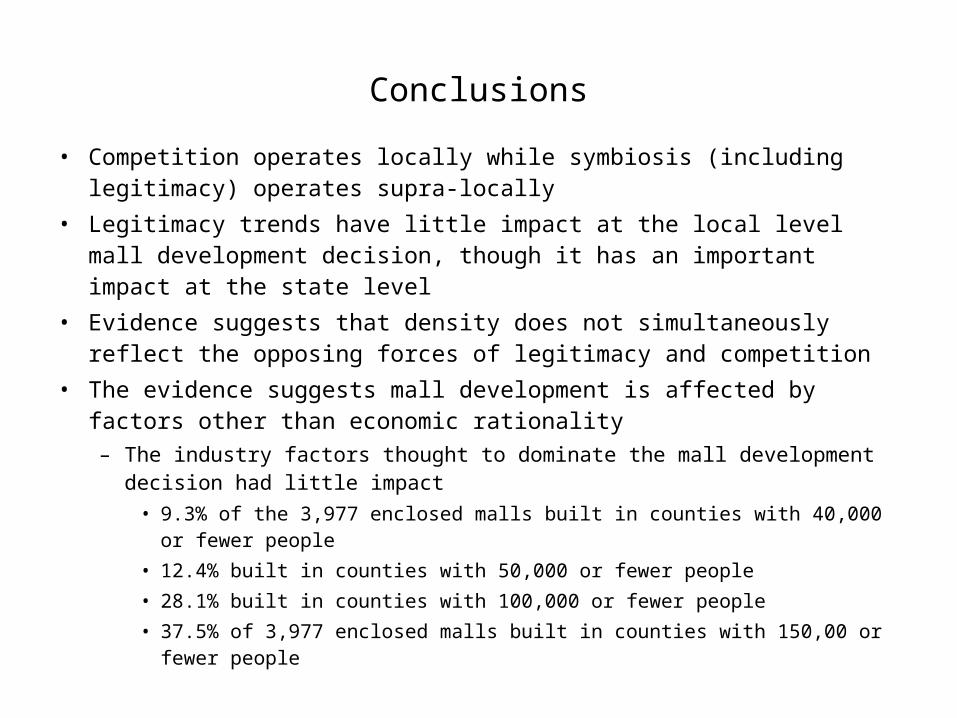
Conclusions
• Competition operates locally while symbiosis (including legitimacy) operates supra-locally

Conclusions
• Competition operates locally while symbiosis (including legitimacy) operates supra-locally
• Legitimacy trends have little impact at the local level mall development decision, though it has an important impact at the state level

Conclusions
• Competition operates locally while symbiosis (including legitimacy) operates supra-locally
• Legitimacy trends have little impact at the local level mall development decision, though it has an important impact at the state level
• Evidence suggests that density does not simultaneously reflect the opposing forces of legitimacy and competition
• The evidence suggests mall development is affected by factors other than economic rationality

Conclusions
• Competition operates locally while symbiosis (including legitimacy) operates supra-locally
• Legitimacy trends have little impact at the local level mall development decision, though it has an important impact at the state level
• Evidence suggests that density does not simultaneously reflect the opposing forces of legitimacy and competition
• The evidence suggests mall development is affected by factors other than economic rationality– The industry factors thought to dominate the mall development decision had
little impact
Conclusions
• Competition operates locally while symbiosis (including legitimacy) operates supra-locally
• Legitimacy trends have little impact at the local level mall development decision, though it has an important impact at the state level
• Evidence suggests that density does not simultaneously reflect the opposing forces of legitimacy and competition
• The evidence suggests mall development is affected by factors other than economic rationality– The industry factors thought to dominate the mall development decision had
little impact• 9.3% of the 3,977 enclosed malls built in counties with 40,000 or fewer people• 12.4% built in counties with 50,000 or fewer people• 28.1% built in counties with 100,000 or fewer people• 37.5% of 3,977 enclosed malls built in counties with 150,00 or fewer people
– There is evidence of contagion at both the county and the state level

Thank You
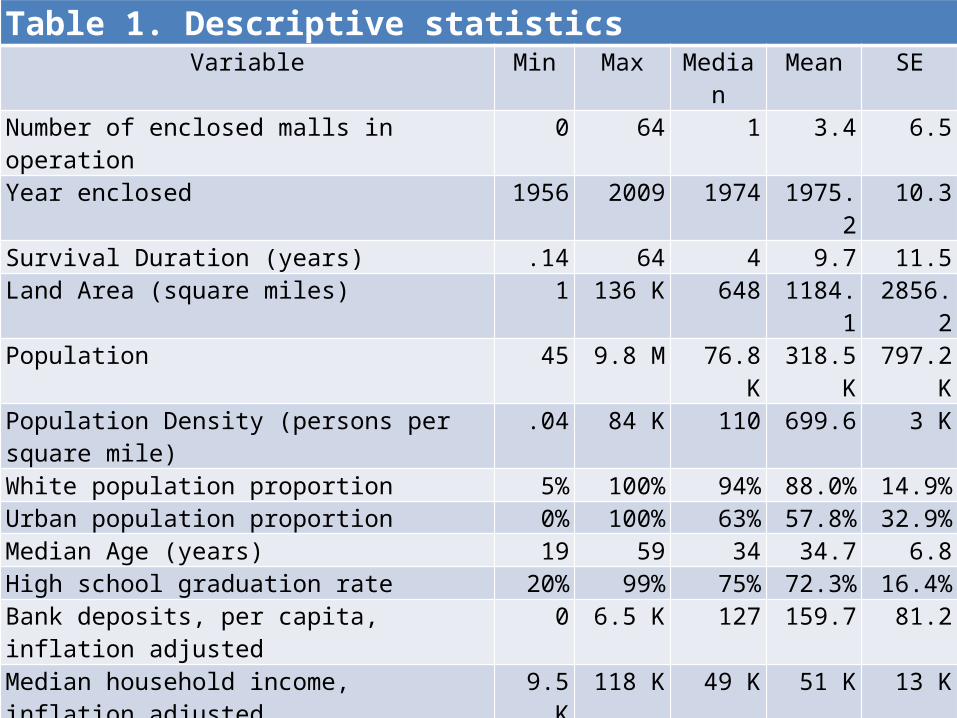
Table 1. Descriptive statisticsVariable Min Max Median Mean SE
Number of enclosed malls in operation 0 64 1 3.4 6.5Year enclosed 1956 2009 1974 1975.2 10.3Survival Duration (years) .14 64 4 9.7 11.5Land Area (square miles) 1 136 K 648 1184.1 2856.2Population 45 9.8 M 76.8 K 318.5K 797.2 KPopulation Density (persons per square mile) .04 84 K 110 699.6 3 KWhite population proportion 5% 100% 94% 88.0% 14.9%Urban population proportion 0% 100% 63% 57.8% 32.9%Median Age (years) 19 59 34 34.7 6.8High school graduation rate 20% 99% 75% 72.3% 16.4%Bank deposits, per capita, inflation adjusted 0 6.5 K 127 159.7 81.2Median household income, inflation adjusted 9.5 K 118 K 49 K 51 K 13 KNumber of farms 0 8 K 725 903.8 790.4Number of manufacturers 0 21 K 88 516.2 1711.6Number of wholesalers 0 24 K 90 605.8 1769.0Number of service businesses 0 140 K 523 2.7 K 7.7 KNumber of retailers 0 80 K 525 2.2 K 5.6 KRetail sales, per capita, inflation adjusted ($) 0 128 K 11 K 11 K 5 K
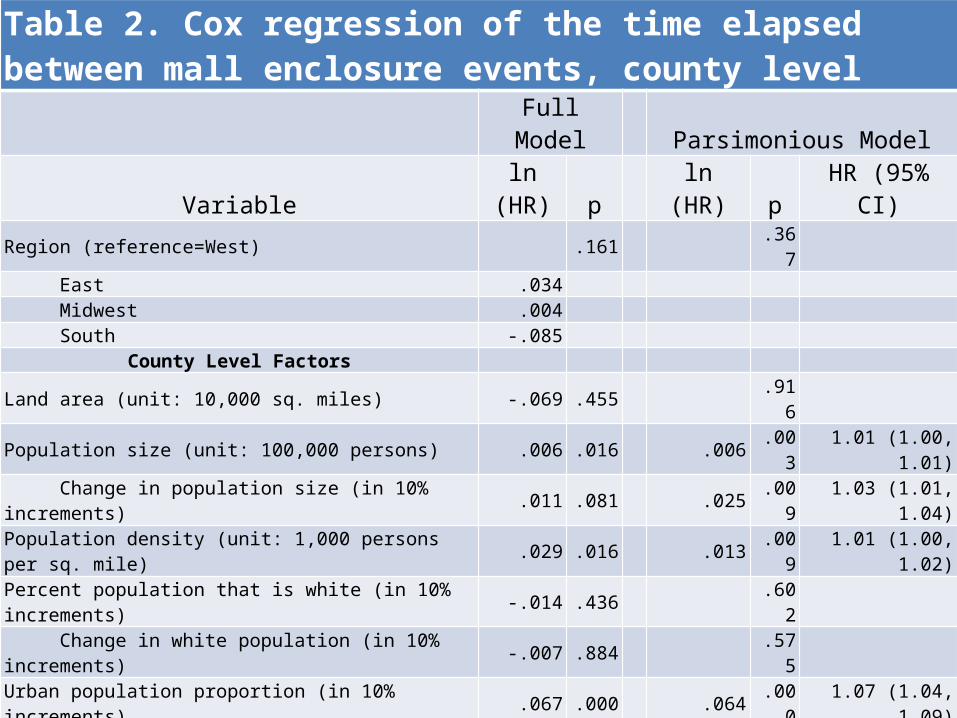
Table 2. Cox regression of the time elapsed between mall enclosure events, county level
Full Model Parsimonious ModelVariable ln (HR) p ln (HR) p HR (95% CI)
Region (reference=West) .161 .367 East .034 Midwest .004 South -.085
County Level Factors Land area (unit: 10,000 sq. miles) -.069 .455 .916 Population size (unit: 100,000 persons) .006 .016 .006 .003 1.01 (1.00, 1.01) Change in population size (in 10% increments) .011 .081 .025 .009 1.03 (1.01, 1.04)Population density (unit: 1,000 persons per sq. mile) .029 .016 .013 .009 1.01 (1.00, 1.02)Percent population that is white (in 10% increments) -.014 .436 .602 Change in white population (in 10% increments) -.007 .884 .575 Urban population proportion (in 10% increments) .067 .000 .064 .000 1.07 (1.04, 1.09) Change in urban proportion (in 10% increments) -.044 .136 .120 Median age (years) -.010 .084 -.011 .025 0.99 (0.98, 1.00) Change in median age (years) -.004 .790 .493 High school graduation rate (in 10% increments) -.014 .647 .915 Change in graduation rate (in 10% increments) -.166 .019 -.193 .003 0.82 (0.73, 0.94)Bank deposits (in $1,000,000s per capita) -.174 .876 .918 Change in bank deposits (in 10% increments) -.002 .784 .714 Median household income (in $1,000s) .005 .039 .007 .000 1.01 (1.00, 1.01) Change in median household income (in 10% increments) .019 .301 .528

Table 2. Cox regression of the time elapsed between mall enclosure events, county level (continued)
Full Model Parsimonious ModelVariable ln (HR) p ln (HR) p HR (95% CI)
Number of farms (per 1,000 persons) -.012 .000 -.012 .000 0.99 (0.98, 0.99) Change in number of farms (in 10% increments) -.005 .476 .359 Number of manufacturers (per 1,000 persons) -.085 .009 -.079 .007 0.92 (0.87, 0.98) Change in number of manufacturers (in 10% increments) -.011 .136 -.016 .020 0.98 (0.97, 1.00)Number of wholesalers (per 1,000 persons) .014 .663 .904 Change in number of wholesalers (in 10% increments) -.005 .353 .247 Number of service businesses (per 1,000 persons) .029 .014 .033 .001 1.03 (1.01, 1.05) Change in number of service businesses (in 10% increments) .033 .000 .033 .000 1.03 (1.02, 1.05)Number of retailers (per 1,000 persons) -.034 .030 -.026 .071 0.97 (0.95, 1.00) Change in number of retailers (in 10% increments) -.041 .001 -.051 .000 0.95 (0.93, 0.97)Retail sales (in $1,000s per capita) .007 .393 .368 Change in retail sales (in 10% increments) -.002 .761 .770 Number of malls .218 .000 .217 .000 1.24 (1.23, 1.26) Number of malls, squared -.003 .000 -.003 .000 1.00 (1.00, 1.00)
National Level Factors Number of malls (in increments of 100) -.059 .079 -.080 .000 0.92 (0.89, 0.96) Number of malls, squared .003 .000 .003 .000 1.00 (1.00, 1.00)Number of shopping centers (in increments of 1,000) .171 .000 .178 .000 1.20 (1.14, 1.25) Number of shopping centers, squared -.004 .000 -.004 .000 1.00 (0.99, 1.00)Shopping center legitimacy level (range: 0-1) -.184 .688 .883 GDP (in $1 Trillions) -.485 .000 -.489 .000 0.61 (0.53, 0.71) GDP growth rate (in 10% increments) .221 .000 .231 .000 1.26 (1.17, 1.35)Federal Reserve Prime Rate (in 1% increments) -.004 .673 .524

Table 3. Cox regression with fixed effects of the time elapsed between mall enclosure events, county level
Full Model Parsimonious Model
Variableln
(HR) p ln
(HR) p HR (95% CI)County Level Factors
Land area (unit: 10,000 sq. miles) -2.780 .532 .812 Population size (unit: 100,000 persons) -.016 .290 .329 Change in population size (in 10% increments) .014 .565 .198 Population density (unit: 1,000 persons per sq. mile) -.113 .018 -.113 .022 0.89 (0.81, 0.98)Percent population that is white (in 10% increments) -.089 .323 .265 Change in white population (in 10% increments) -.026 .767 .511 Urban population proportion (in 10% increments) .008 .874 .931 Change in urban proportion (in 10% increments) .030 .614 .690 Median age (years) -.027 .337 .132 Change in median age (years) -.027 .320 .288 High school graduation rate (in 10% increments) -.226 .071 -.206 .047 0.81 (0.66, 1.00) Change in graduation rate (in 10% increments) -.398 .005 -.301 .018 0.74 (0.58, 0.95)Bank deposits (in $1000s per capita) 2.721 .577 .226 Change in bank deposits (in 10% increments) .005 .654 .383 Median household income (in $1,000s) .022 .008 .019 .007 1.02 (1.01, 1.03) Change in median household income (in 10% increments) -.030 .330 .856

Table 3. Multiple event history analyses with fixed effects (cont.)Full Model Parsimonious Model
Variableln
(HR) p ln
(HR) p HR (95% CI)Number of farms (per 1,000 persons) -.040 .000 -.047 .000 0.95 (0.94, 0.97) Change in number of farms (in 10% increments) -.021 .086 .121 Number of manufacturers (per 1,000 persons) -.715 .000 -.749 .000 0.47 (0.37, 0.60) Change in number of manufacturers (in 10% increments) .011 .453 .104 Number of wholesalers (per 1,000 persons) -.115 .278 .258 Change in number of wholesalers (in 10% increments) .013 .296 .233 Number of service businesses (per 1,000 persons) -.004 .878 .618 Change in number of service businesses (in 10% increments) .012 .307 .026 .001 1.03 (1.01, 1.04)Number of retailers (per 1,000 persons) -.093 .044 -.102 .000 0.90 (0.85, 0.95) Change in number of retailers (in 10% increments) .001 .974 .591 Retail sales (in $1000s per capita) .029 .127 .362 Change in retail sales (in 10% increments) -.003 .782 .400 Number of malls .159 .000 .151 .000 1.16 (1.13, 1.20) Number of malls, squared -.002 .000 -.002 .000 1.00 (1.00, 1.00)
National Level Factors Number of malls (in increments of 100) .018 .729 .039 .164 1.04 (0.98, 1.10) Number of malls, squared .001 .148 .001 .088 1.00 (1.00, 1.00)Number of shopping centers (in increments of 1,000) .102 .013 .112 .001 1.12 (1.05, 1.19) Number of shopping centers, squared -.002 .012 -.003 .000 1.00 (1.00, 1.00)Shopping center legitimacy level (range: 0-1) .455 .488 .731 GDP (in $1 Trillions) -.491 .000 -.486 .000 0.61 (0.51, 0.74) GDP growth rate (in 10% increments) .155 .004 .164 .001 1.18 (1.07, 1.30)Federal Reserve Prime Rate (in 1% increments) .007 .541 .549
East Midwest South West0
200
400
600
800
1000
1200
Figure 1. Number of mall enclosures, by region (n=3977)
Region
N

1956
1958
1960
1962
1964
1966
1968
1970
1972
1974
1976
1978
1980
1982
1984
1986
1988
1990
1992
1994
1996
1998
2000
2002
2004
2006
2008
0
25
50
75
100
125
150
175
200
225
250
Figure 2. Number of enclosed malls constructed, by year (n=3977); includes new construction and re-
modeling of existing centers)
Year
N

Les
s th
an 1
3 to
3.9
6 to
6.9
9 to
9.9
12 to
12.
9
15 to
15.
9
18 to
18.
9
21 to
21.
9
24 to
24.
9
27 to
27.
9
30 to
30.
9
33 to
33.
9
36 to
36.
9
39 to
39.
9
42 to
42.
9
45 to
45.
9
48 to
48.
9
51 to
51.
9
54 to
54.
9
57 to
57.
9
60 to
60.
9
63 to
63.
90
100
200
300
400
500
600
700
800
Figure 3. Distribution of survival times, county level(n=7112 periods, 3978 periods culminating in mall enclosure event and 3134 right-censored periods)*
Event Censored
Years elapsed since last mall enclosure in county
N
*2108 censored periods with survival time of 64 to 64.9 years (i.e., counties with 0 en-closed malls) not shown

0 3 6 9 12 15 18 21 24 27 30 33 36 39 42 45 48 51 54 57 60 63
0.00
10.00
20.00
30.00
40.00
50.00
60.00
Figure 4. Relative mall risk by county-level mall density
County-level model, without fixed effects
Number of enclosed malls in county
Cal
cula
ted
rela
tive
mal
l ris
k

0
200
400
600
800
1000
1200
1400
1600
1800
2000
2200
2400
2600
2800
3000
3200
0
0.5
1
1.5
2
2.5
3
3.5
4
Figure 5. County-level relative mall risk by national-level mall density
County-level model, without fixed effects
Number of enclosed malls in nation
Cal
cula
ted
rela
tive
mal
l ris
k

0 3 6 9 12 15 18 21 24 27 30 33 36 39 42 45 48 51 54 57 60 63
0.00
10.00
20.00
30.00
40.00
50.00
60.00
Figure 6. Relative mall risk by county-level mall density
County-level model, without fixed effects County-level model, with fixed effects
Number of enclosed malls in county
Cal
cula
ted
rela
tive
mal
l ris
k

0
200
400
600
800
1000
1200
1400
1600
1800
2000
2200
2400
2600
2800
3000
3200
0
0.5
1
1.5
2
2.5
3
3.5
4
Figure 7. County-level relative mall risk by national-level mall density
County-level model, without fixed effects County-level model, with fixed effects
Number of enclosed malls in nation
Cal
cula
ted
rela
tive
mal
l ris
k

0
200
400
600
800
1000
1200
1400
1600
1800
2000
2200
2400
2600
2800
3000
3200
0
5
10
15
20
25
30
35
40
Figure 8. State-level relative mall risk by national-level mall density
State-level model, with fixed effects
Number of enclosed malls in nation
Cal
cula
ted
rela
tive
mal
l ris
k