university system of maryland fiscal 2013 budget overview
TRANSCRIPT

For further information contact: Sara J. Baker Phone: (410) 946-5530
Analysis of the FY 2013 Maryland Executive Budget, 2012
1
University System of Maryland Fiscal 2013 Budget Overview
Department of Legislative Services Office of Policy Analysis
Annapolis, Maryland
February 2012

R30B00 – University System of Maryland – Fiscal 2013 Budget Overview
Analysis of the FY 2013 Maryland Executive Budget, 2012 2
Operating Budget Data
University System of Maryland Overview ($ in Thousands)
FY 11 Actual
FY 12 Working
FY 13 Allowance
FY 12-13 Change
% Change
Prior Year
General Funds $1,016,993 $1,005,625 $1,023,372 $17,746 1.8% Contingent & Back of the Bill Reductions 0 0 - 589 - 589
Adjusted General Funds $1,016,993 $1,005,625 $1,022,783 $17,157 1.7%
Special Funds $39,413 $54,735 $46,133 -$8,602 -15.7% Contingent & Back of the Bill Reductions 0 0 589 589
Adjusted Special Funds $39,413 $54,735 $46,722 -$8,013 -14.6%
Other Unrestricted Funds $2,205,423 $2,372,410 $2,425,805 $53,395 2.3% Adjusted Other Unrestricted Funds $2,205,423 $2,372,410 $2,425,805 $53,395 2.3%
Total Unrestricted Funds $3,261,829 $3,432,770 $3,495,309 $62,540 1.8% Adjusted Total Unrestricted Funds $3,261,829 $3,432,770 $3,495,309 $62,540 1.8%
Restricted Funds $1,178,311 $1,199,366 $1,239,557 $40,191 3.4% Contingent & Back of the Bill Reductions
Adjusted Restricted Funds $1,178,311 $1,199,366 $1,239,557 $40,191 3.4%
Adjusted Grand Total $4,440,140 $4,632,136 $4,734,866 $102,730 2.2% General funds increase $17.2 million, or 1.7%, in the fiscal 2013 allowance after adjusting for
the $0.6 million contingent reduction, which will be offset by a corresponding increase in the Higher Education Investment Fund (HEIF). HEIF declines 14.6%, or $8.0 million, due to use of fund balance in fiscal 2012. Overall, State funds increase $9.1 million.
Other unrestricted funds increase $53.4 million, or 2.3%, and restricted funds grow 3.4%, or
$40.2 million, over fiscal 2012.

R30B00 – University System of Maryland – Fiscal 2013 Budget Overview
Analysis of the FY 2013 Maryland Executive Budget, 2012
3
Personnel Data
FY 11 FY 12 FY 13 FY 12-13 Actual Working Allowance Change
Regular Positions
22,220.68
22,731.86
22,731.86
0.00
Contractual FTEs
5,513.22
5,394.35
5,406.55
12.20
Total Personnel
27,733.90
28,126.21
28,138.41
12.20
Vacancy Data: Regular Positions
Turnover and Necessary Vacancies, Excluding New Positions
497.83
2.2%
Positions and Percentage Vacant as of 12/31/11
1,189.03
5.2%
The fiscal 2013 allowance does not provide any new regular positions; however, the
University System of Maryland (USM) has personnel autonomy and may create new positions during the fiscal year.
Analysis in Brief Major Trends Continued Growth in Teacher Programs: Enrollment in teacher programs at Towson University and Salisbury University increased by 300 students which partially offset declines at other USM programs. This resulted in an overall increase of 230 students in fiscal 2011. Meanwhile, the number of students completing training programs increased 1.8% in fiscal 2011. Issues Feasibility of Merging the University of Maryland, Baltimore and the University of Maryland, College Park: The 2011 Joint Chairmen’s Report (JCR) requested the Board of Regents (BOR) to examine the advantages and disadvantages of merging the University of Maryland, College Park (UMCP) and the University of Maryland, Baltimore (UMB). BOR concluded that the disadvantages of merging the two institutions clearly outweigh the advantages. Instead, BOR endorsed a University of Maryland Strategic Alliance between UMCP and UMB.
R30B00 – University System of Maryland – Fiscal 2013 Budget Overview
Analysis of the FY 2013 Maryland Executive Budget, 2012
4
Powering Maryland Forward: USM’s 2010-2020 Strategic Plan: USM entered into the second year of implementing its 10-year strategic plan – Powering Maryland Forward. The plan’s five themes provide the strategic focus for USM in developing institution-specific targets needed to meet the goals identified in the plan. Recommended Actions 1. Add language reducing the University System of Maryland’s general funds.
2. Adopt committee narrative requesting the submission of a report on institutional aid by Expected Family Contribution category.
3. Adopt committee narrative requesting the submission of a report on loan data by Expected Family Contribution.
4. Adopt committee narrative requesting the submission of an annual report on faculty workload.
Updates Funding of Intercollegiate Athletic Programs: Language in the 2011 JCR required USM to submit a report on the amount of general funds expended in fiscal 2011 on intercollegiate athletics, including institutional scholarships to student athletes on the basis of athletic ability. Institutions reported that no general funds were allocated for teams, intercollegiate athletic administration, or scholarship costs in fiscal 2011. However, there seems to be instances in which State funds, which include general funds and HEIF, may have been used to fund campus athletic programs. Faculty Workload Report: A key component of USM’s Effectiveness and Efficiency initiative is increasing faculty instructional workload. The faculty instructional workload target at comprehensive institutions is 7.5 course units and 5.5 for research institutions. Six of nine USM institutions met or exceeded the workload target in fiscal 2011. Allocation of General Funds Among Institutions: Language in the 2011 JCR required USM to submit a report on efforts to address the allocation of general funds among institutions and how it will better meet the needs of the underserved and high demand areas of the State.

R30B00 University System of Maryland
Analysis of the FY 2013 Maryland Executive Budget, 2012
5
Operating Budget Analysis Program Description
Title 12 of the Education Article establishes the University System of Maryland (USM) to “foster the development of a consolidated system of public higher education, to improve the quality of education, to extend its benefits, and to encourage the economical use of the State’s resources.” USM consists of 11 degree-granting institutions, a research center, and the system office, which operates two regional higher education centers. Exhibit 1 illustrates the structure of the system.
Exhibit 1 University System of Maryland
Regional Centers
Governor
University System of Maryland Board
of Regents
System Office
UM, Baltimore UM, College Park
UM Eastern Shore
Bowie State Coppin State
UM Baltimore County
University of Baltimore
Frostburg State
Salisbury
Towson
UM University College UM Center for Environmental Science
UM: University of Maryland Source: Department of Legislative Services

R30B00 – University System of Maryland – Fiscal 2013 Budget Overview
Analysis of the FY 2013 Maryland Executive Budget, 2012
6
The Board of Regents (BOR) is the governing body of USM. The board consists of 17 members, including a full-time student and the State Secretary of Agriculture (ex officio). Except for the Agriculture Secretary, each member is appointed by the Governor with the advice and consent of the Senate. The board appoints the Chancellor, who serves as the chief executive officer of the system and the chief of staff to the board. The Chancellor and staff coordinate system planning; advise the board of systemwide policy; coordinate and arbitrate among system institutions; and provide technical, legal, and financial assistance.
The board reviews, modifies, and approves a system strategic plan developed by the Chancellor in consultation with institution presidents. The board is charged with assuring that programs offered by the institutions are not unproductive or unreasonably duplicative. Other board activities include reviewing and approving new programs, reviewing existing programs, setting minimum admission standards, and determining guidelines for tuition and fees. The board monitors the progress of each system institution toward its approved goals and holds each president accountable for the progress toward the goals. Furthermore, the board may delegate any of its responsibilities to the Chancellor.
USM goals, consistent with the State Plan for Higher Education, are to:
create and maintain a well-educated workforce;
promote economic development;
increase access for economically disadvantaged and minority students; and
achieve and sustain national eminence in providing quality education, research, and public service.
Performance Analysis
Creating a well-educated workforce is a goal of USM and a State priority which has a goal of having at least 55.0% of the adult population attain a college degree. To that end, undergraduate enrollment at USM institutions increased 2.7% from 105,704 students in fiscal 2010 to 108,583 in fiscal 2011. During the same time period, the number of bachelor’s degree recipients increased 2.8% from 19,416 to 19,950 recipients. Continued Growth in Teacher Programs
One of the themes of USM’s strategic plan is to ensure the State’s competitiveness in the new economy. This includes ensuring a strong system of public education and contributing to the economic development of the State through the education and preparation of the workforce particularly in critical need areas such as education. As such, USM seeks to increase the number of students completing teacher training programs at the eight USM institutions that offer teacher education programs.

R30B00 – University System of Maryland – Fiscal 2013 Budget Overview
Analysis of the FY 2013 Maryland Executive Budget, 2012
7
As shown in Exhibit 2, after three years in which enrollment in teachers programs averaged 5,700 students, enrollment rebounded growing 17.8% since fiscal 2009. A majority of this growth occurred in fiscal 2010 mainly due to increases in enrollment at Salisbury University (SU) and Towson University (TU) of 347 and 168 students, respectively. However, approximately one-third of SU’s growth was due to the inclusion of students in the master’s program. In fiscal 2011, enrollment at TU and SU increased by 300 students, which partially offset declines at other USM programs, resulting in an overall increase of 230 students. It is projected that enrollment will decline slightly in fiscal 2012, which USM speculates could be due to rapid expansion of programs to a certain level; therefore, they are entering into a “maintain/consolidation” pattern. SU reported that it projects flat enrollment due to a decline in the demand for teachers.
Exhibit 2 USM Students Enrolled in and Completing Teacher Training Programs
Fiscal 2004-2013
USM: University System of Maryland
Source: Governor’s Budget Books, Fiscal 2013
While the number of students completing training programs increased 1.8% in fiscal 2011, it has yet to reach the levels achieved in fiscal 2005 to 2008 when USM averaged 1,710 completions. USM attributes the drop off, which began in fiscal 2009, to a change in the way Bowie State University (BSU) and the University of Maryland Baltimore County (UMBC) defined and reported on graduate students completing the program, which resulted in each lowering its total number. Therefore, it is difficult to compare years prior to fiscal 2009 to more current years to identify trends in students completing teacher programs. However, the goals for fiscal 2012 and 2013 are to return to the pre-2009 levels.
6,569 6,310 6,292 5,746 5,803 5,610
6,380 6,610 6,511 6,723
1,558 1,709 1,689 1,741 1,700 1,451 1,560 1,588 1,731 1,736
0
1,000
2,000
3,000
4,000
5,000
6,000
7,000
8,000
2004 2005 2006 2007 2008 2009 2010 2011 2012 Est.
2013 Est.
Stud
ents
Students Enrolled Students Completing Training

R30B00 – University System of Maryland – Fiscal 2013 Budget Overview
Analysis of the FY 2013 Maryland Executive Budget, 2012
8
Second- and Third-year Retention Rates
Student persistence, or retention, provides a measure of student success and an indication of an institution’s performance. The highest dropout rate usually occurs between the first and second year; therefore, the higher the retention rate, the more likely students will persist and graduate. Improving the retention of students is a key component to USM’s efforts to double the number of undergraduate degrees awarded by 2020, one of the four key goals of USM’s strategic plan. Exhibit 3 shows the second- and third-year retention rates for the 2008 cohort at USM institutions, excluding the University of Maryland, Baltimore (UMB). The University of Maryland, College Park (UMCP) continues to not only have the highest rates but also the narrowest margin of 4.7 percentage point between the second- and third-year rates. This also illustrates that in order for UMCP to increase its degree production, it will need to increase the number of new and transfer students.
Exhibit 3 Undergraduate Second- and Third-year Retention Rates
2008 Cohort
BSU: Bowie State University UB: University of Baltimore CSU: Coppin State University UMBC: University of Maryland Baltimore County FSU: Frostburg State University UMCP: University of Maryland, College Park SU: Salisbury University UMES: University of Maryland Eastern Shore TU: Towson University Source: Maryland Higher Education Commission
20%
30%
40%
50%
60%
70%
80%
90%
100%
UMCP BSU TU UMES FSU CSU UB SU UMBC
Second Year Third Year
Second-year Unweighted Average Third-year Unweighted Average

R30B00 – University System of Maryland – Fiscal 2013 Budget Overview
Analysis of the FY 2013 Maryland Executive Budget, 2012
9
While UMBC had the second highest second-year retention rate at 85.2%, its third-year rate drops to 72.1%, behind UMCP, TU, and SU. USM attributes this to students transferring from UMBC to other institutions due to the limited program offerings in some areas such as business. In general, while institutions focus efforts on improving the second-year rate, the number of students returning for their third year drops as illustrated with the gap between second- and third-year rates for over half the institutions exceeding 13 percentage points. This indicates that in order for USM to meet its degree production target, institutions will need to strengthen their efforts in retaining students.
Four- and Six-year Graduation Rates
In general, students are more likely to graduate in six years than in four years, as illustrated in Exhibit 4. A major academic initiative of the BOR Effectiveness and Efficiency effort is improving the student time to degree. According to USM’s Annual Faculty Workload Report, the latest available data for the 2002 cohort, shows a decline in the time to degree from 8.8 to 8.7 semesters, a little over four years. Overall, UMCP has the highest four- and six-year rates at 58.9% and 82.6%, respectively, with SU and TU having the next highest rates. Coppin State University (CSU) has the lowest four- and six-year rates at 5.2% and 18.3%, respectively, which equates to 25.7 and 38.2 percentage points, respectively, below the unweighted averages.
Exhibit 4 Four- and Six-year Gradation Rates
2004 Cohort
BSU: Bowie State University TU: Towson University CSU: Coppin State University UMBC: University of Maryland Baltimore County FSU: Frostburg State University UMCP: University of Maryland, College Park SU: Salisbury University UMES: University of Maryland Eastern Shore
Source: Maryland Higher Education Commission
0% 10% 20% 30% 40% 50% 60% 70% 80% 90%
UMCP BSU TU UMES FSU CSU SU UMBC
Four-year Six-year Four-year Unweighted Average Six-year Unweighted Average
R30B00 – University System of Maryland – Fiscal 2013 Budget Overview
Analysis of the FY 2013 Maryland Executive Budget, 2012
10
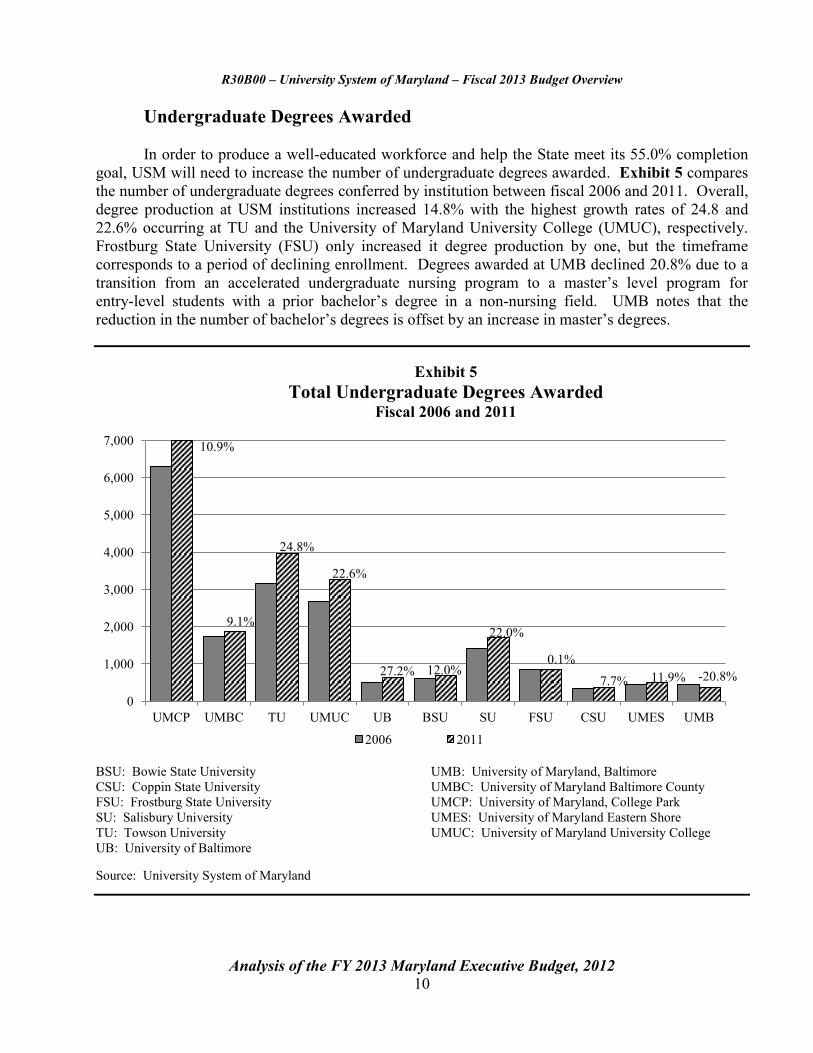
Undergraduate Degrees Awarded In order to produce a well-educated workforce and help the State meet its 55.0% completion
goal, USM will need to increase the number of undergraduate degrees awarded. Exhibit 5 compares the number of undergraduate degrees conferred by institution between fiscal 2006 and 2011. Overall, degree production at USM institutions increased 14.8% with the highest growth rates of 24.8 and 22.6% occurring at TU and the University of Maryland University College (UMUC), respectively. Frostburg State University (FSU) only increased it degree production by one, but the timeframe corresponds to a period of declining enrollment. Degrees awarded at UMB declined 20.8% due to a transition from an accelerated undergraduate nursing program to a master’s level program for entry-level students with a prior bachelor’s degree in a non-nursing field. UMB notes that the reduction in the number of bachelor’s degrees is offset by an increase in master’s degrees.
Exhibit 5 Total Undergraduate Degrees Awarded
Fiscal 2006 and 2011
BSU: Bowie State University UMB: University of Maryland, Baltimore CSU: Coppin State University UMBC: University of Maryland Baltimore County FSU: Frostburg State University UMCP: University of Maryland, College Park SU: Salisbury University UMES: University of Maryland Eastern Shore TU: Towson University UMUC: University of Maryland University College UB: University of Baltimore Source: University System of Maryland
10.9%
9.1%
24.8%
22.6%
27.2% 12.0%
22.0%
0.1% 7.7% 11.9%
0
1,000
2,000
3,000
4,000
5,000
6,000
7,000
UMCP UMBC TU UMUC UB BSU SU FSU CSU UMES UMB
2006 2011
-20.8%

R30B00 – University System of Maryland – Fiscal 2013 Budget Overview
Analysis of the FY 2013 Maryland Executive Budget, 2012
11
Fiscal 2012 Actions
Proposed Deficiency A fiscal 2012 deficiency would provide the University of Maryland Center for Environmental Science (UMCES) $150,000 in general funds to meet the costs associated with leasing a facility in Annapolis to house the Environmental Synthesis Center. This is part of a National Science Foundation grant awarded to UMCP, of which UMCES is a partner, to establish the center.
Other Actions
Section 47 of the fiscal 2012 budget bill required the Governor to abolish 450 positions as of January 1, 2012. USM’s share of the reduction was 60 positions with a corresponding $2.0 million reduction in general funds.
Section 24 of the Budget Reconciliation and Financing Act of 2011 allowed USM to increase
salaries in order to retain faculty and “operationally critical staff.” USM developed policies and procedures similar to those implemented in prior years to increase salaries to retain faculty. A total of 159 personnel were classified as operationally critical: 30 staff and 129 faculty received salary raises totaling $3.0 million. Of the 30 staff deemed critical, most are administrators and managers in the financial, information technology, and health care fields. The majority of faculty, 58.9%, are mainly in health related fields at UMB. Six institutions used this option to help retain personnel as shown in Exhibit 6. USM notes 46.0% of the positions were fully State-supported; 41.0% were funded with non-State-supported funds; and 13.0% were funded with a combination of State- and non-State-supported funds.
Exhibit 6 Positions and Salary Increases to Retain Personnel
Number of
Faculty Number of
Staff
Total Total Amount of Increases
FSU 0 2 2 $15,868 SU 2 3 5 24,000 UMB 76 4 80 1,911,767 UMBC 12 17 29 242,954 UMCP 39 3 42 834,823 USMO 0 1 1 10,000 Total 129 30 159 $3,039,412
FSU: Frostburg State University UMBC: University of Maryland Baltimore County SU: Salisbury University UMCP: University of Maryland, College Park UMB: University of Maryland, Baltimore USMO: University System of Maryland Office
Source: University System of Maryland

R30B00 – University System of Maryland – Fiscal 2013 Budget Overview
Analysis of the FY 2013 Maryland Executive Budget, 2012
12
Proposed Budget The general fund allowance for fiscal 2013 is 1.7%, or $17.0 million, higher than in fiscal 2012 after including the deficiency and adjusting for the contingent reduction of $0.6 million of general funds to be replaced with the Higher Education Investment Fund (HEIF), as shown in Exhibit 7. When accounting for a 14.6%, or $8.0 million, decline in the HEIF due to use of fund balance in fiscal 2012, the overall growth in State funds is 0.8%, or $9.0 million, above fiscal 2012.
Exhibit 7 Proposed Budget
University System of Maryland ($ in Thousands)
FY 11 Actual
FY 12 Working
FY 13 Adjusted
FY 12-13 Change
% Change Prior Year
General Funds $1,016,993 $1,005,775 $1,022,783 $17,007 1.7% HEIF 39,413 54,735 46,722 -8,013 -14.6% Total State Funds 1,056,406 1,060,510 1,069,505 8,995 0.8% Other Unrestricted Funds 2,205,423 2,372,410 2,425,805 53,395 2.3% Total Unrestricted Funds 3,261,829 3,432,920 3,495,309 62,390 1.8% Restricted Funds 1,178,311 1,199,366 1,239,557 40,191 3.4% Total Funds $4,440,140 $4,632,286 $4,734,866 $102,580 2.2%
HEIF: Higher Education Investment Fund Note: Fiscal 2012 general funds include $0.1 million deficiency. Fiscal 2013 general funds and Higher Education Investment Fund (HEIF) are adjusted by $0.6 million to reflect a decrease in general funds which is offset by a corresponding increase in HEIF contingent upon legislation. Numbers may not sum to total due to rounding. Source: Governor’s Budget Book, Fiscal 2013; Department of Budget Management
R30B00 – University System of Maryland – Fiscal 2013 Budget Overview
Analysis of the FY 2013 Maryland Executive Budget, 2012
13
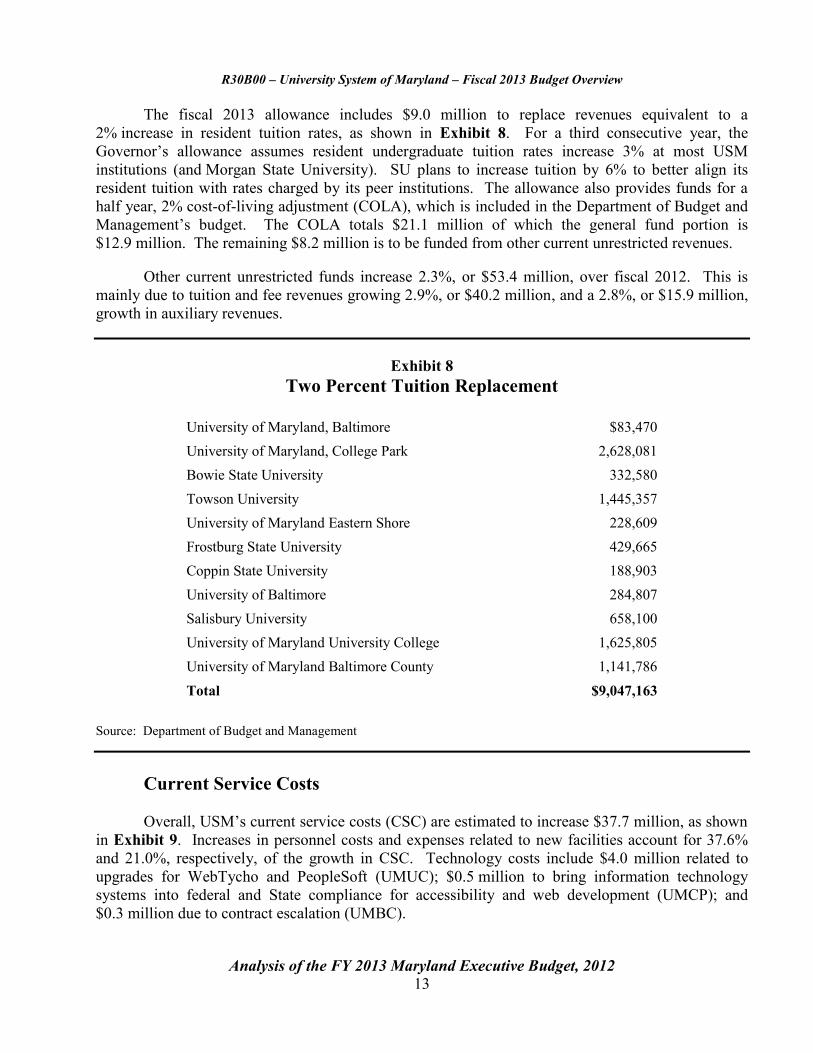
The fiscal 2013 allowance includes $9.0 million to replace revenues equivalent to a 2% increase in resident tuition rates, as shown in Exhibit 8. For a third consecutive year, the Governor’s allowance assumes resident undergraduate tuition rates increase 3% at most USM institutions (and Morgan State University). SU plans to increase tuition by 6% to better align its resident tuition with rates charged by its peer institutions. The allowance also provides funds for a half year, 2% cost-of-living adjustment (COLA), which is included in the Department of Budget and Management’s budget. The COLA totals $21.1 million of which the general fund portion is $12.9 million. The remaining $8.2 million is to be funded from other current unrestricted revenues.
Other current unrestricted funds increase 2.3%, or $53.4 million, over fiscal 2012. This is
mainly due to tuition and fee revenues growing 2.9%, or $40.2 million, and a 2.8%, or $15.9 million, growth in auxiliary revenues.
Exhibit 8 Two Percent Tuition Replacement
University of Maryland, Baltimore
$83,470 University of Maryland, College Park
2,628,081
Bowie State University
332,580 Towson University
1,445,357
University of Maryland Eastern Shore
228,609 Frostburg State University
429,665
Coppin State University
188,903 University of Baltimore
284,807
Salisbury University
658,100 University of Maryland University College
1,625,805
University of Maryland Baltimore County
1,141,786
Total
$9,047,163 Source: Department of Budget and Management
Current Service Costs
Overall, USM’s current service costs (CSC) are estimated to increase $37.7 million, as shown in Exhibit 9. Increases in personnel costs and expenses related to new facilities account for 37.6% and 21.0%, respectively, of the growth in CSC. Technology costs include $4.0 million related to upgrades for WebTycho and PeopleSoft (UMUC); $0.5 million to bring information technology systems into federal and State compliance for accessibility and web development (UMCP); and $0.3 million due to contract escalation (UMBC).

R30B00 – University System of Maryland – Fiscal 2013 Budget Overview
Analysis of the FY 2013 Maryland Executive Budget, 2012
14
Exhibit 9
University System of Maryland Increase in Current Service Costs
Fiscal 2013
Amount
Health Retirement and Benefits $14,200,217 New Facilities 7,916,537 Technology 4,913,816 Institutional Aid 4,898,359 Statewide Cost Allocation 3,055,809 Academic Revenue Bond Debt Service 2,300,000 Other 451,415
Total Current Service Costs $37,736,153
Note: The University System of Maryland (USM) estimated current services cost (CSC) to increase $58.4 million. However, USM estimates systemwide increases in undergraduate and graduate financial aid of $10.7 million of which $4.9 million is attributed to a 3% growth in undergraduate aid consistent with a 3% increase in tuition. The remaining $5.8 million, along with $6.9 million of costs associated with enrollment growth and program enhancements, are better categorized as enhancement funding, and therefore, deducted from USM’s CSC. Additionally, $8.1 million related to research grants and contracts are better categorized as restricted revenue costs and are also deducted from CSC. Source: University System of Maryland; Department of Legislative Services
CSC are typically those costs funded with unrestricted revenues (e.g., general funds, HEIF, and tuition revenues). However, in fiscal 2013, $8.1 million appears to be directly related to research activities at UMB ($6.4 million), UMCP ($1.6 million), and UMBC ($0.1 million) and, therefore, should be covered by revenues generated from research grants and contracts. These costs are related to program development at two research centers, technology transfer activities, and administrative support for research which exceeds the federal cap resulting in an “unfunded mandated compliance cost.” Therefore, DLS deducted these costs from CSC along with funds associated with enrollment growth and program enhancements.
Overall, the fiscal 2013 allowance provides $12.7 million to fund enhancements, as shown in Exhibit 10. New State funds, totaling $33.6 million, include $11.6 million from the one-time $750 bonus that was added to USM’s base appropriation and $12.9 million to fund the State portion of the COLA. It appears that the one-time $750 bonus, totaling $11.6 million, was not deducted from the fiscal 2013 allowance as it was for other State agencies. Since this was a one-time, temporary increase to salaries in fiscal 2012, it is not a cost that will be incurred in fiscal 2013. Therefore, the Department of Legislative Services (DLS) recommends that USM’s fiscal 2013 general fund appropriation be reduced by $11,638,639, the amount of the one-time bonus.

R30B00 – University System of Maryland – Fiscal 2013 Budget Overview
Analysis of the FY 2013 Maryland Executive Budget, 2012
15
Exhibit 10
USM State Supported Revenues Available for Program Enhancements Fiscal 2013
$ Amount
Expenditures Current Services Cost Increase
$37,736,153 Employee Cost-of-living Adjustment (COLA)
21,105,668
Total Expenditures
$58,841,821
Revenues General Funds and HEIF New General Funds and HEIF $8,994,753
One-time Bonus Added to Base 11,638,639 COLA Funds Received through DBM Budget 12,939,436 Total New State Funds $33,572,828
New Tuition and Fee Revenues
40,255,007 Other Unrestricted Revenues1
-2,262,350
New General Fund, Tuition, and Other Revenues
$71,565,485
Funds Available for Enhancements/Enrollment Growth
$12,723,664 (Revenues Less Expenditures)
DBM: Department of Budget and Management HEIF: Higher Education Investment Fund USM: University System of Maryland 1 Does not include auxiliary or restricted revenues. Note: The University System of Maryland (USM) estimated current services cost (CSC) to increase $58.4 million. However, USM estimates systemwide increases in undergraduate and graduate financial aid of $10.7 million of which $4.9 million is attributed to a 3% growth in undergraduate aid. The remaining $5.8 million, along with $6.9 million of costs associated with enrollment growth and program enhancements, are better categorized as enhancement funding, and therefore, deducted from USM’s CSC. Additionally, $8.1 million related to research grants and contracts are better categorized as restricted revenue costs and are also deducted from CSC. Source: Governor’s Budget Books, Fiscal 2013; University System of Maryland

R30B00 – University System of Maryland – Fiscal 2013 Budget Overview
Analysis of the FY 2013 Maryland Executive Budget, 2012
16
Tuition and fee revenues increase $40.3 million, thereby providing USM with $71.6 million in total new revenue. However, over the past five years, USM has underestimated tuition and fee revenues, often significantly so, as shown in Exhibit 11. In fiscal 2010 and 2011, revenues were, on average, 7.1% higher than the allowance. During this time period, USM projected only a slight growth in enrollment but actually experienced a growth of over 3.0%. Currently for fiscal 2012, revenues are $107.4 million higher than the allowance. Therefore, new tuition and fee revenues in fiscal 2013 will likely exceed the allowance providing USM with more revenue to fund enhancements. It should be noted that USM plans to transfer $17.5 million into its fund balance in fiscal 2013.
Exhibit 11 Comparison of Appropriated and Actual Tuition and Fee Revenues
Fiscal 2007-2012 ($ in Millions)
2007 2008 2009 2010 2011 2012
Appropriated $1,020.3 $1,056.4 $1,115.0 $1,168.0 $1,230.8 $1,268.6
Actual 1,022.1 1,083.7 1,158.2 1,244.2 1,327.2 1,376.0 * $ Difference $1.8 $27.3 $43.2 $76.2 $96.4 $107.4
% Difference 0.2% 2.6% 3.9% 6.5% 7.8% 8.5%
* Reflects fiscal 2012 allowance and working appropriation to date. Source: Governor’s Budget Books Expenditures on Scholarships and Fellowships Grow at Highest Rate Budget changes by program area in the allowance are shown in Exhibit 12. This data considers unrestricted funds only, the majority of which consists of general fund and tuition and fee revenues. Expenditures on scholarships and fellowships increase at the highest rate of 7.0%, or $10.7 million. Operation and maintenance of plant grows 2.5%, or $10.8 million, due to expenses related to the opening of several new facilities and to academic revenue bond debt service payments. Expenditures for institutional support increase $9.4 million due to the allocation of statewide costs and costs related to technology transfer activities. Growth of 3.2%, or $5.7 million, in student services is mainly attributed to UMUC migrating to a new learning platform while expenditures for instruction rise $4.4 million due to fringe benefits, increases in summer/winter sessions, and part-time faculty.

R30B00 – University System of Maryland – Fiscal 2013 Budget Overview
Analysis of the FY 2013 Maryland Executive Budget, 2012
17
Exhibit 12
USM Budget Changes for Unrestricted Funds by Program Fiscal 2011-2013 ($ in Thousands)
2011 Actual
2012 Working
2011-12 % Change
2013 Adjusted
2012-13 % Change
2012-13 Change
Expenditures Instruction $1,000,322 $1,057,318 5.7% $1,061,734 0.4% $4,416
Research 206,338 219,714 6.5% 222,758 1.4% 3,045 Public Service 51,113 59,605 16.6% 60,030 0.7% 425 Academic Support 351,218 374,173 6.5% 377,041 0.8% 2,868 Student Services 166,853 178,173 6.8% 183,897 3.2% 5,723 Institutional Support 361,263 374,051 3.5% 383,461 2.5% 9,410 Operation and Maintenance of Plant 428,252 438,160 2.3% 448,956 2.5% 10,796 Scholarships and Fellowships 140,112 152,550 8.9% 163,279 7.0% 10,729 Education and General Total $2,705,472 $2,853,744 5.5% $2,901,156 1.7% $47,413
Hospitals (UMB) $35,404 $35,377 -0.1% $35,377 0.0% Auxiliary Enterprises 520,953 543,649 4.4% 558,776 2.8% 15,127
Grand Total $3,261,829 $3,432,770 5.2% $3,495,309 1.8% $62,540
Revenues Tuition and Fees $1,327,218 $1,376,020 3.7% $1,416,275 2.9% $40,255
General Funds 1,016,993 1,005,625 -1.1% 1,022,783 1.7% 17,157 HEIF 39,413 54,735 38.9% 46,722 14.6% -8,013 Other Unrestricted Funds 474,151 449,502 -5.2% 448,418 -0.2% -1,084 Subtotal $2,857,775 $2,885,882 1.0% $2,933,020 1.6% $47,137
Auxiliary Enterprises $542,587 $563,908 3.9% $579,820 2.8% $15,912
Transfer (to)/from Fund Balance -138,532 -17,021
-17,530 Grand Total $3,261,829 $3,432,770 5.2% $3,495,309 1.8% $62,540
HEIF: Higher Education Investment Fund UMB: University of Maryland, Baltimore USM: University System of Maryland Note: Fiscal 2013 allowance reflects adjustment to general funds and Higher Education Investment Fund (HEIF) of $0.6 million to reflect a decrease in general funds which is offset by a corresponding increase in HEIF contingent upon legislation. Unrestricted funds only. All programs. Source: Governor’s Budget Books, Fiscal 2013

R30B00 – University System of Maryland – Fiscal 2013 Budget Overview
Analysis of the FY 2013 Maryland Executive Budget, 2012
18
Tuition and Fee Revenue Continue to Grow Tuition and fee revenue consistently grew on average 7.0% from fiscal 2006 to 2011 despite a
freeze on in-state undergraduate tuition from fiscal 2007 to 2010, as shown in Exhibit 13. This growth can be attributed to increases in fees, out-of-state undergraduate and graduate tuition, and an overall enrollment growth of 3.5%. Between fiscal 2006 and 2009, State funds, on average, increased 7.0%, but starting in fiscal 2010, impacts of the economic recession can be seen with State funds remaining relatively flat. Restricted revenue, comprised of research contract and grant funding, sales of educational services and other sources, continues to grow but at a lower average rate of 2.6% in fiscal 2012 and 2013. It should be noted federal contracts and grants increased $83.5 million, or 8.5%, in fiscal 2010 but declined $24.1 million or 3.1% in fiscal 2011 due to one-time federal stimulus funding. This was offset by $21.9 million, or 24.7%, increase in other restricted funds.
Exhibit 13 USM Current Unrestricted and Restricted Revenues
Fiscal 2006-2013 ($ in Millions)
HEIF: Higher Education Investment Fund USM: University System of Maryland Note: Other includes unrestricted grants, contracts, gifts, and other sources of revenue. Source: Governor’s Budget Books, Fiscal 2009-2013
$
$2,000
$4,000
$6,000
$8,000
$10,000
$12,000
$14,000
$16,000
2006 2007 2008 2009 2010 2011 2012 2013
Tuition & Fees
General Funds & HEIF
Current Restricted Revenues
Education & Auxiliary
Other

R30B00 – University System of Maryland – Fiscal 2013 Budget Overview
Analysis of the FY 2013 Maryland Executive Budget, 2012
19
Continued Growth of Filled Positions While the fiscal 2012 allowance did not provide USM with any new regular positions, the
number of filled positions, as of October 2011, increased 3.1%, or 640.6 positions, over the previous year, as shown in Exhibit 14. Since USM has statutory authority to establish staffing levels within existing funds, it can create positions as needed. The increase (to date) in fiscal 2012 is mainly due to this autonomy and from the reorganization of the University of Maryland Biotechnology Institute (UMBI) in which positions were transferred to four institutions. Of the new positions, 531.1 are State-supported, funded with unrestricted revenues excluding auxiliary; 58.7% were in instruction. In fiscal 2009 and 2010, growth in the total number of positions was under 1.0% with State-supported positions declining, on average, 0.2% while non-State-supported positions, funded with restricted and auxiliary revenues, increased by approximately 3.9%. Overall, for the past five years, filled positions grew 15.9% while enrollment increased 20.1%.
Exhibit 14 USM Personnel State and Non-State Supported Positions
2006-2011
USM: University System of Maryland Note: Number of filled positions as of October of each year. Excludes the University of Maryland Center for Environmental Science and the University System of Maryland Office. Source: University System of Maryland Institutions; Department of Legislative Services
12,919.3 13,941.8 14,409.4 14,372.0 14,345.9 14,877.0
5,215.3 5,386.8 5,581.5 5,802.7 6,026.0 6,135.5
0
2,000
4,000
6,000
8,000
10,000
12,000
14,000
16,000
2006 2007 2008 2009 2010 2011
State Supported Non-State Supported

R30B00 – University System of Maryland – Fiscal 2013 Budget Overview
Analysis of the FY 2013 Maryland Executive Budget, 2012
20
Exhibit 15 shows changes in full-time equivalents (FTE) by program area relative to the 20.1% enrollment growth between fiscal 2006 and 2011. The number of filled positions per 100 students declined in all areas, except research and auxiliary, which are mainly comprised of non-State-supported positions. Two program areas directly affecting the quality of education student services (e.g., admissions and registrar, counseling, career guidance, and financial aid administration) and instruction declined 9.1% and 8.5%, respectively. Declines in these areas could impact the ability of institutions to provide the services and programs designed to retain students. For instance, the down turn in instruction suggests that in order to meet the growing demand, institutions are relying on adjunct faculty to teach courses. Auxiliary grew at the highest rate of 28.1%. Since auxiliary includes self-supporting activities such as food services, residence halls, and intercollegiate athletics, it is expected positions would increase with enrollment growth.
Exhibit 15 Total State and Non-State FTE Positions Per 100 FTES
Fiscal 2006-2011
FTE: full-time equivalent FTES: Full-time equivalent student
Note: Number of filled positions as of October of each year. Excludes the University of Maryland Center for Environmental Science and the University System of Maryland Office.
Source: University System of Maryland Institutions; Department of Legislative Services
-8.5%
13.3%
-17.1%
-1.9%
-9.1%
-8.7%
-8.2% 28.1%
0
1
2
3
4
5
6
7
State Supported Non-State Supported
Instruction Research Public Service
Academic Support
Student Services
Institutional Support
Operations &
Maintenance Auxiliary

R30B00 – University System of Maryland – Fiscal 2013 Budget Overview
Analysis of the FY 2013 Maryland Executive Budget, 2012
21
Funding Per Full-time Equivalent Student
Exhibit 16 compares, by institution, State funds (general fund/HEIF) and tuition and fee revenues per full-time equivalent student (FTES) for the 10-year period of fiscal 2003 to 2013. On average, State funds per FTES increased 19.0% while tuition and fee revenues per FTES grew 50.5%. In terms of State funds, CSU’s funding grew at the highest rate of 89.2%, increasing from $6,704 in fiscal 2003 to $12,682 per FTES in fiscal 2013. Funding per FTES for the University of Baltimore (UB) declined $33 due to the enrollment growth associated with the initiation of its undergraduate program in fiscal 2008. Being a tuition driven institution, UMUC has the lowest State funds per FTES at $1,486 in fiscal 2013. The highest growth rates of tuition and fee revenues per FTES of 86.7% and 73.1% occurred at UMB and UMCP, respectively. Five institutions (TU, University of Maryland Eastern Shore (UMES), FSU, CSU and SU) experienced growth ranging from 42 to 46%.

Analysis of the F
Y 2013 Maryland E
xecutive Budget, 2012
22
Exhibit 16
Comparison of State Funds and Tuition and Fee Revenues Per FTES Fiscal 2003 and 2013
BSU: Bowie State University TU: Towson University CSU: Coppin State University UB: University of Baltimore FSU: Frostburg State University UMB: University of Maryland, Baltimore FTES: full-time equivalent student UMBC: University of Maryland Baltimore County SF: State funds UMCP: University of Maryland, College Park SU: Salisbury University UMES: University of Maryland Eastern Shore TF: total funds UMUC: University of Maryland University College Note: UMCP and UMES exclude funding for Agriculture Cooperative Extension and Experimental Stations. Source: Governor’s Budget Books, Fiscal 2013; University of Maryland, College Park
R30B
00 – University System
of Maryland – F
iscal 2013 Budget O
verview

R30B00 – University System of Maryland – Fiscal 2013 Budget Overview
Analysis of the FY 2013 Maryland Executive Budget, 2012
23
Issues 1. Feasibility of Merging the University of Maryland, Baltimore and the
University of Maryland, College Park
Maryland is one of the few states in the country where the major comprehensive public research institution, UMCP, is not affiliated with the public medical school, which is part of UMB. Nationally, only three flagship institutions (in Alaska, Delaware, and Rhode Island) do not have a medical or law school. Only 14 lack an affiliation with a medical school, of which two, Rutgers University and the University of Texas-Austin, are seeking to add a medical school. In both cases, an increase in research funding and prestige were cited as reasons for the inclusion of a medical school.
According to the 2010 Annual Report of the Top American Research Universities by the Center for Measuring University Performance, in terms of total research expenditures, UMCP ranked thirty-ninth and UMB forty-first among 200 institutions that had over $40 million in federal research expenditures in 2008, as illustrated in Exhibit 17. John Hopkins University ranked first. Of the 38 ranked above UMCP, 13 were flagship universities of which 11 have medical and law schools. If research expenditures for UMCP and UMB were combined, it would have ranked seventh. Proponents of a merger argue that a united UMCP and UMB would lead to an increase in research funding and help foster more collaborative activities, enabling the institutions to attract high-caliber faculty, staff, and students. However, while UMCP and UMB currently participate in some collaborative research activities, an organizational, geographical, and cultural divide exists between the two institutions which may impede the potential for faculty to form partnerships to pursue research and develop interdisciplinary programs.
These above-mentioned factors led to interest in creating an affiliation between UMCP and
UMB during the 2011 legislative session. As a result, restrictive language was placed on $1.0 million of the University System of Maryland Office’s (USMO) appropriation until BOR submitted a report on the advantages and disadvantages of merging UMCP and UMB.
Board of Regents Recommendation
On December 12, 2011, USMO submitted a report summarizing the study process, providing
discussions on key questions raised in the legislation, and factors leading to the board’s decision. The board concluded “…merging UMCP and UMB is not in the best interest of the students, the system as a whole and the State of Maryland…” and further cited “The disadvantages of merging the two institutions clearly outweigh the advantages.” Instead, BOR endorsed a “University of Maryland Strategic Alliance”, which is envisioned to be a “…structured, accountable, and agile…” alliance between UMCP and UMB that will be able to make timely joint faculty appointments, conduct joint research in areas critical to the State’s economy, and enhance educational opportunities.

R30B00 – University System of Maryland – Fiscal 2013 Budget Overview
Analysis of the FY 2013 Maryland Executive Budget, 2012
24
Exhibit 17
Rankings of Selected Flagship and Maryland Institutions Based on Total Research Expenditures – 2008
Institutions Total Research
($ in Thousands)
National Rank Johns Hopkins University $1,680,927 1 University of Wisconsin – Madison 881,777 3 University of Michigan – Ann Arbor 876,390 4 University of Washington – Seattle 765,135 8 Ohio State University – Columbus 702,592 10 University of Minnesota – Twin Cities 682,662 12 Pennsylvania State University – University Park 620,432 15 University of California – Berkeley 591,770 17 University of Florida 584,170 18 University of Arizona 545,869 23 University of North Carolina – Chapel Hill 525,843 24 University of Illinois – Urbana-Champaign 501,279 27 University of Texas – Austin 493,294 28 University of Alabama – Birmingham 404,615 38 University of Maryland – College Park 395,037 39 University of Maryland – Baltimore 379,407 41 Source: The Center for Measuring University Performance, The Top American Research Universities, 2010 Annual Report USM Explores the Possibilities
USM developed a work plan outlining the approach to analyze the impacts of the proposed
merger. A series of 12 guiding questions were developed by USM Presidents and system officials with specific questions to be studied by one of four task forces, each comprised of representatives from UMCP and UMB. The task forces examined the impact a merger would have on: the mission and quality of learning – including expanding access to underserved populations,
facilitating cross-disciplinary collaboration, and effects on carrying out its mission; cultural/locational/cost/administrative issues – including financial costs and savings and
impact of State and federal requirements on a combined institution;

R30B00 – University System of Maryland – Fiscal 2013 Budget Overview
Analysis of the FY 2013 Maryland Executive Budget, 2012
25
technology transfer and commercialization; and impact on economics and quality of life in surrounding communities.
The task forces also examined an alternative to a merger – a strategic alliance. This was defined as “a purposeful, value driven partnership where each maintains its own identity but agrees to act in the joint pursuit of opportunities of mutual value and high impact.”
A fifth task force, comprised of undergraduate and graduate students from both campuses, identified issues and concerns of the students. A sixth task force, comprised of senior officials from all USM institutions, examined the impacts a merger would have on all the institutions and USM as a whole. Final Verdict on Merging
Overall, six benefits and 15 risks were identified from which it was concluded that the risks of a merger “far outweighed any potential benefits.” Especially of concern were those risks related to merging two large and distinct bureaucracies into a single institution. Benefits were discussed in terms of affecting the core areas of the institutions such as research, learning, and service while risks were categorized by level of impact: system/State, institutional, and personnel.
Benefits cited in the report include increased opportunities for research collaborations and educational and experiential learning; improved rankings and reputation; ability to attract talented faculty and students; and enhanced community service.
Potential risks were classified as having an impact at the system/State (5 risks), institutional (6 risks), or personnel (4 risks) level. However, many of the risks appear to be variations on the same theme, for instance risks related to funding were identified as impacting multiple levels. The potential risks were related to: the competition among institutions for resources including funding, faculty, students, and
program offerings; the time it would take to accomplish a merger; the impediments caused by the distance between UMCP and UMB; the differences in the personnel and compensation systems; the potential damage to external relations; and the shared governance structure.

R30B00 – University System of Maryland – Fiscal 2013 Budget Overview
Analysis of the FY 2013 Maryland Executive Budget, 2012
26
Given the research missions of UMCP and UMB, there was a notable lack of discussion regarding the impact a merger would have on technology transfer and commercialization efforts, particularly in light of BOR’s recent establishment of a permanent standing committee on Economic Development and Technology Commercialization. In addition, it should be noted that with email and video conferencing technology, the approximately 30-mile distance between UMCP and UMB should not be a significant issue. In fact, several models for much greater distances among parts of an institution can be seen at Cornell University, with a medical school in New York City, and right here in Maryland with UMCES, which has centers in Western Maryland (Frostburg), Southern Maryland (Solomons), and the Eastern Shore (Cambridge).
Cost and Savings of a Merger
While BOR was not required to determine the potential costs and cost savings from a merger, this was considered by the USM task force. The task force could only develop a “very rough estimate of the potential costs” due to the vague definition and lack of any substantive details such as the scope, structure, outcomes, goals, and timeframe of a merger. Given these and other limitations, the task force only focused on administrative and support areas and determined that the costs in those areas could range from $235 million to $285 million and include:
$20 million to $60 million in one-time costs to merge various data systems;
up to $7 million to merge library holdings;
$39 million to implement new programs and collaborations;
$169 million for a new facility at Shady Grove, specifically for collaborations; and
$200,000 to $10 million for commercialization ranging from additional staff resources to the
creation of a “Maryland Medical Innovation Institute” to accelerate the commercialization of medical devices, imaging, and bioinformatics.
The largest cost is for a new building at the Shady Grove regional center. While this may be desirable over the long-term to enhance collaborative opportunities, its necessity is arguable.
The task force also looked at the cost savings that could be realized from a merger. While it was acknowledged that a merger could lead to savings and efficiencies, especially in the administrative and technology areas, the lack of information made it difficult to estimate the amount of cost savings. However, the task force conservatively estimated there could be $1.0 million in savings. This appears to be extremely low considering that when UMBI was reorganized, an institution with approximately $20 million in total funding, a savings of $2.0 million was realized mainly due to the elimination of duplicative positions. (The $2.0 million in savings was subsequently reallocated among UMB and CU). Given this, it would seem the potential savings from uniting two large research institutions with funding totaling over $2.6 billion would result in far greater savings than $1 million.

R30B00 – University System of Maryland – Fiscal 2013 Budget Overview
Analysis of the FY 2013 Maryland Executive Budget, 2012
27
University of Maryland Strategic Alliance
The task forces considered alternative structures that would capture the benefits of a merger but pose fewer risks. BOR concluded UMCP and UMB “…have already developed many areas of collaboration and the needs of the State have evolved to a point that a more formal alliance would benefit the campuses and State.” Therefore, BOR proposes creating a University of Maryland Strategic Alliance; a formal collaboration between the two institutions consisting of a “…small administrative structure…” that will identify and target selected programs and initiatives. However, the report does not provide any substantial details on the alliance such as the composition and organization of the administration, the process of identifying collaborative projects, how cooperation will be encouraged and, conversely, the consequences of not moving toward greater cooperation. BOR charged the Presidents of UMCP and UMB and the Chancellor to develop by March 2012 a detailed plan for creating an alliance, including defining the administrative structure, budget, and identifying additional opportunities. Opportunities and Potential Risks
A limited discussion was provided on the advantages and disadvantages of an alliance. BOR foresees numerous advantages, and identified six including enhancing the reputations of UMCP and UMB by combined reporting on research and technology transfer when possible; making timely joint appointments; enhancing educational opportunities through articulated degree pathways; creation of a unified technology transfer and commercialization operation; and development of programs in bioscience and biomedical areas.
In regards to risk, it was determined that “many of the risks for success under an
alliance...were the same as those under a merger…” In addition, risks specific to an alliance include lack of institutional buy-in due to the selective and focused nature of the alliance and lack of emphasis on collaboration leading to a decrease in alliance supported initiatives.
Costs but No Savings As in the case of a merger, BOR noted that the ultimate success of the alliance will be
dependent on “…an investment of resources sufficient to achieve its identified goals.” The costs are estimated to be the same as a merger excluding the $20 million to $67 million one-time costs to merge various data systems. However, it is noted that administrative procedures are a current barrier to enhanced collaborations, particularly in making joint appointments. A major obstacle is different human resource data systems used by each institution; therefore, it seems that funding would be needed to merge the two systems in order to facilitate joint appointments and/or other collaborations. Additionally, BOR conceded that there would be a need to develop a common data warehouse system, resulting in the potential cost of an alliance equaling that of a merger. Since there was no discussion on potential cost savings, it is assumed that no efficiencies would be created from an alliance. However, it seems likely that collaboration may yield opportunities for greater efficiencies and economies of scale.

R30B00 – University System of Maryland – Fiscal 2013 Budget Overview
Analysis of the FY 2013 Maryland Executive Budget, 2012
28
A Better Model?
Without more detailed information, it is difficult to ascertain how an alliance would be able to overcome or significantly lessen the organizational, geographical, and cultural divide that currently exists to the formation of partnerships. It is unclear how an alliance would be more advantageous than a merger, considering that the task forces concluded both pose the same risks and costs but efficiencies would be achieved through a merger while an alliance would create another administrative layer. Furthermore, as envisioned by BOR, the alliance would focus on selected program areas, particularly bioscience and biomedical, which may deter faculty in other program areas from pursuing partnerships due to the perceived lack of management support.
There are also concerns about the ability of the institutions to sustain an alliance. The report
did not provide any details on how partnerships would be identified, encouraged, or the consequences if the alliance did not meet expectations. A recent example of a collaboration, which was approved by BOR in 2006 but was never fully realized, was a University of Maryland School of Public Health. The goal of this joint school was to combine the clinical strengths of UMB and UMCP in the behavioral and social sciences. The unique nature of this school would have enabled it to be eligible for additional research funding and make it easier to recruit well qualified faculty. In the end, UMCP established a School of Public Health on its own, which has proven to be successful in obtaining research awards and attracting high caliber faculty and students. Overall, it is difficult to determine if an alliance would better meet the State’s goals and priorities until a more detailed plan is submitted to BOR.
The Chancellor should comment on how the University of Maryland Strategic Alliance
will facilitate collaboration; whether it will remove or lessen the divide between the two institutions; and what support, if any, the institutions and faculty would receive for creating partnerships both within and outside the focus of the alliance. The Chancellor should also address the estimated costs, considering a majority of the costs are for initiatives which could be undertaken regardless if the institutions merged or formed an alliance. Furthermore, the Chancellor should address how USM would support the success of the alliance as envisioned by BOR. 2. Powering Maryland Forward: USM’s 2010-2020 Strategic Plan
In fiscal 2013, USM will enter into the second year of implementing its 10-year strategic plan, Powering Maryland Forward, which lays out the goals, strategies, and outcomes that will help power the State toward becoming a leader in education and economic development. In response to the plan, each institution developed an implementation plan that specifies each institution’s commitment or contribution to the plan and also identifies specific actions and resources necessary to achieve the goals.

R30B00 – University System of Maryland – Fiscal 2013 Budget Overview
Analysis of the FY 2013 Maryland Executive Budget, 2012
29
The plan is centered around five themes:
Theme 1: Access, Affordability, and Attainment
Theme 2: Ensuring Maryland’s Competiveness in the New Economy
Theme 3: Transforming the Academic Model
Theme 4: Identifying New and More Effective Ways to Build and Leverage Resources
Theme 5: Achieving and Sustaining National Eminence Four key goals of the plan are: college completion;
degree production in science, technology, engineering, and mathematics (STEM) fields;
economic competitiveness and innovation; and
transforming the academic model.
College Completion
Strategies under Theme 1, designed to help the State reach its goal of having at least 55.0% of the adult population attain a college degree, will be discussed in a separate policy paper.
Degree Production in STEM Fields USM’s strategic plan calls for increasing degree production in high need areas of STEM by 40% by 2020. Meeting this target will not only help to meet the goal of ensuring Maryland’s competitiveness but will also help the State achieve its 55% college completion goal. In order to meet this goal, institutions will need to increase production of STEM degrees by approximately 2,200 of which 320 will be STEM education graduates
Enrollment in STEM programs continues a steady growth, as shown in Exhibit 18, with enrollment in fiscal 2011 increasing 7.9% over fiscal 2010, the base year from which progress will be tracked. USM attributes overall trends in enrollments and degrees to the computer and information science (CIS) programs which tend to have more students than other programs and, therefore, are the primary driver behind the numbers. According to USM, total enrollments in STEM programs and CIS sunk to a six-year low of 25,122 students in fiscal 2005, but improvements in the computer science job market led to a 45.0% increase in CIS which is reflected in the overall enrollment numbers.

R30B00 – University System of Maryland – Fiscal 2013 Budget Overview
Analysis of the FY 2013 Maryland Executive Budget, 2012
30
Exhibit 18
Students Enrolled and Graduates in STEM Programs Fiscal 2006-2013
STEM: science, technology, engineering, and mathematics Note: STEM includes bachelor, master, and doctoral programs in biological sciences, computer and information sciences, engineering, mathematics, physical sciences, and natural science programs. Source: Governor’s Budget Books, Fiscal 2013
In terms of the number of graduates, after a three-year decline in which the number of
graduates fell by 280 between fiscal 2007 and 2010, growth in degrees spiked 10% in fiscal 2011. Again, this reflects the growth in CIS enrollments which overshadows growth in other STEM areas, particularly the biological sciences and mathematics programs. USM notes that engineering has basically remained flat, graduating approximately 1,200 to 1,300 students per year. Overall, it appears that as long as employment in the computer science field remains healthy, USM will be on track to meet its goals.
USM plans to triple of the number of STEM teacher graduates to at least 321 per year. According to the Maryland State Department of Education’s (MSDE) teacher staffing report, there were 106 STEM teacher certifications in fiscal 2009 and 107 in fiscal 2010, the baseline year from which progress will be measured. In fiscal 2011, USM expects 116 STEM teacher graduates. USM notes that MSDE data does not include individuals participating in alternative certification programs
25,189 25,890 26,497 28,204
30,365 32,778 33,000 33,200
2.8%
1.6% -1.1% -1.9%
-2.4%
10.0%
1.9% 1.8%
-4%
-2%
0%
2%
4%
6%
8%
10%
12%
0
5,000
10,000
15,000
20,000
25,000
30,000
35,000
2006 2007 2008 2009 2010 2011 2012 Est. 2013 Est.
Students Enrolled % Change in Number of Graduates

R30B00 – University System of Maryland – Fiscal 2013 Budget Overview
Analysis of the FY 2013 Maryland Executive Budget, 2012
31
or those who are certified in one area such as elementary education and seek additional certification in STEM. USM is working with institutions to develop a process to capture this information. Given that enrollment in teacher programs at USM institutions is projected to remain relatively stable, as shown in Exhibit 1, it is unlikely USM will be able to achieve its target solely through increased enrollment in teacher programs. USM states that achieving this goal will require an array of targeted strategies such as convincing those interested in or enrolled in education programs to switch to STEM areas and notes it has seen some success in this area with a 20% increase in math and science education majors in the past year. Economic Competitiveness and Innovation
In order to maintain Maryland as an innovation economy leader, USM seeks to attract more federal funding to the State. To this end, USM established a goal of doubling research funding to $2.4 billion by fiscal 2020. In fiscal 2010, awards totaled $1.37 billion but declined 4.3% to $1.31 billion in fiscal 2011, which may partly reflect an influx of one-time federal funding related to the American Recovery and Reinvestment Act of 2009. It may be difficult for USM to reach its target given the base year, fiscal 2010, included one-time funding and the current condition of the economy and the federal budget.
While USM has traditionally performed well in obtaining funding for basic research, it has not been as successful in the area of technology transfer and commercialization. Therefore, the plan calls for the creation of 325 new companies by fiscal 2020, which was based on the recommendations of USM’s Presidential Task Force on Research and Economic Competitiveness. However, the task force did not define what constituted a startup company, e.g., those created as a direct result of university-owned intellectual property or a broader definition encompassing businesses created as a result of university activity. In 2011, BOR established a Committee on Economic Development and Technology Commercialization which developed a definition that will be use to measure progress towards this goal. The committee established a four tiered reporting system:
Tier 1: university-owned intellectual property (IP)-based companies
Tier 2: includes tier 1; venture accelerator/mentoring (including companies based on non-university-owned IP); incubator companies; and companies with angel investments exceeding $50,000
Tier 3: includes tier 1 and 2; business plan competition companies; companies using
university laboratory or other space; companies started by undergraduate students
Tier 4: includes tier 1, 2, and 3; companies started by alumni
Only tier 1 or 2 companies will be used to measure progress toward the 325 goal. This will not only reflect start-ups generated as a result of university-owned IP, but also those created as a result of significant university support. USM states preliminary data, which will be used as a baseline to track progress, should be available in spring 2012.
R30B00 – University System of Maryland – Fiscal 2013 Budget Overview
Analysis of the FY 2013 Maryland Executive Budget, 2012
32
In order to promote economic development and facilitate technology and commercialization activities in the State, Senate Bill 239 was introduced which would establish the Maryland Innovation Initiative that would be administered by the Maryland Technology Development Corporation. The bill would authorize USM to undertake high impact economic development activities that support job creation, technology transfer, commercialization, and increase sponsored research funding.
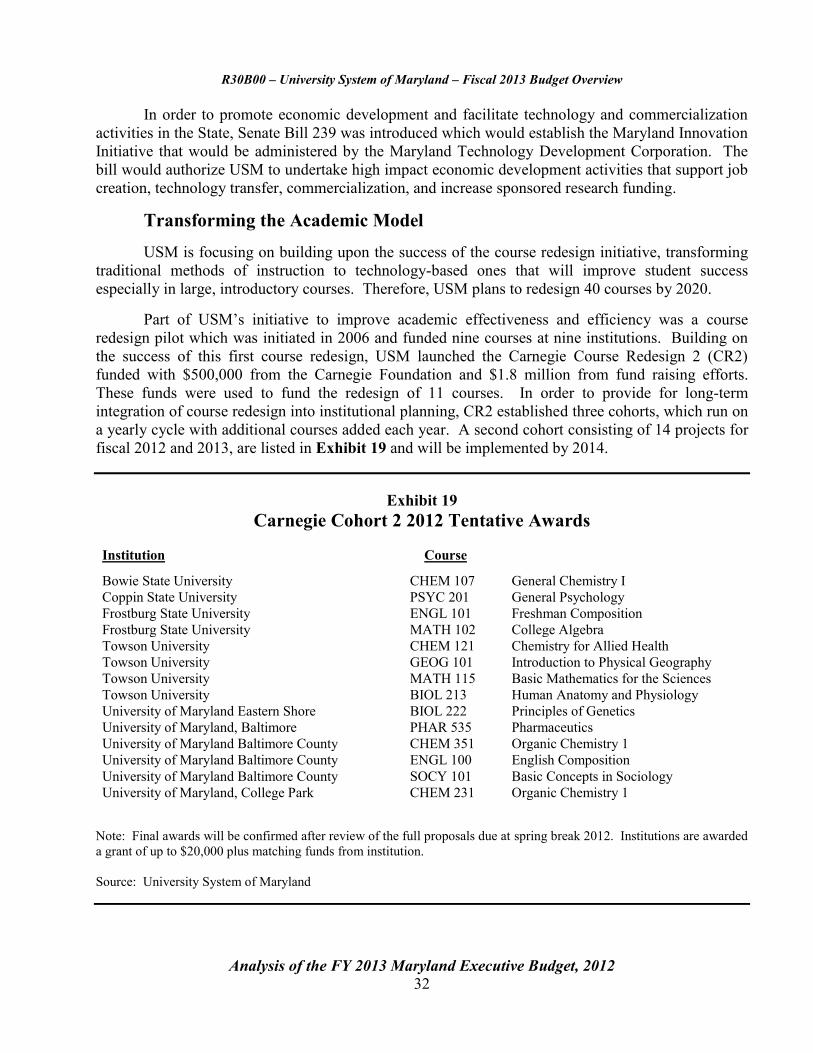
Transforming the Academic Model USM is focusing on building upon the success of the course redesign initiative, transforming traditional methods of instruction to technology-based ones that will improve student success especially in large, introductory courses. Therefore, USM plans to redesign 40 courses by 2020. Part of USM’s initiative to improve academic effectiveness and efficiency was a course redesign pilot which was initiated in 2006 and funded nine courses at nine institutions. Building on the success of this first course redesign, USM launched the Carnegie Course Redesign 2 (CR2) funded with $500,000 from the Carnegie Foundation and $1.8 million from fund raising efforts. These funds were used to fund the redesign of 11 courses. In order to provide for long-term integration of course redesign into institutional planning, CR2 established three cohorts, which run on a yearly cycle with additional courses added each year. A second cohort consisting of 14 projects for fiscal 2012 and 2013, are listed in Exhibit 19 and will be implemented by 2014.
Exhibit 19 Carnegie Cohort 2 2012 Tentative Awards
Institution Course
Bowie State University CHEM 107
General Chemistry I Coppin State University PSYC 201
General Psychology
Frostburg State University ENGL 101
Freshman Composition Frostburg State University MATH 102
College Algebra
Towson University CHEM 121
Chemistry for Allied Health Towson University GEOG 101
Introduction to Physical Geography
Towson University MATH 115 Basic Mathematics for the Sciences Towson University BIOL 213
Human Anatomy and Physiology
University of Maryland Eastern Shore BIOL 222
Principles of Genetics University of Maryland, Baltimore PHAR 535
Pharmaceutics
University of Maryland Baltimore County CHEM 351
Organic Chemistry 1 University of Maryland Baltimore County ENGL 100
English Composition
University of Maryland Baltimore County SOCY 101
Basic Concepts in Sociology University of Maryland, College Park CHEM 231
Organic Chemistry 1
Note: Final awards will be confirmed after review of the full proposals due at spring break 2012. Institutions are awarded a grant of up to $20,000 plus matching funds from institution. Source: University System of Maryland
R30B00 – University System of Maryland – Fiscal 2013 Budget Overview
Analysis of the FY 2013 Maryland Executive Budget, 2012
33
In addition, the initiative includes the creation of course redesign faculty fellows who will provide peer support for redesigns at either their home institutions or within their disciplines at other institutions. Five faculty were identified in 2010 and 2011 and have extended appointments through 2012. Cost of Implementation
According to USM, in order to meet its goals, implementation of the strategic plan “will require substantial and sustainable increase in State funding for higher education.” USM estimates that from fiscal 2012 to 2016, it will need an additional $793 million comprised of State funds and tuition revenue. This assumes an annual 7.0% increase in State funding and 7.0% increase in tuition, which would include a few market adjustments at some institutions. Expenditures include $443 million in current service costs and $350 million for enrollment, degree enhancement, and other program enhancements. Additionally, USM would grow by 1,851 positions and require $1.8 billion in new capital projects. The Chancellor should comment on progress made toward achieving the goals in the strategic plan and address how USM institutions will increase the number of STEM teachers given the flat enrollment in teacher education programs and how USM plans to meet its research goals given the uncertainty of federal funding. The Chancellor should also comment on how USM tracks the performance/progress of students who have taken redesigned courses. Finally, the Chancellor should discuss how USM will pursue the goals given the current economic and budget environment.

R30B00 – University System of Maryland – Fiscal 2013 Budget Overview
Analysis of the FY 2013 Maryland Executive Budget, 2012
34
Recommended Actions
1. Add the following language: Provided that the appropriation herein for the University System of Maryland institutions shall be reduced by $11,638,639 in current unrestricted funds. Explanation: The language reduces the University System of Maryland current unrestricted (general fund) funds appropriation by the amount of the one-time $750 bonus received in fiscal 2012 but appeared not to have been deducted from the fiscal 2013 allowance. Since this was a one-time temporary increase to salaries, it is not a cost that will be incurred in fiscal 2013.
2. Adopt the following narrative: Institutional Aid by Expected Family Contribution Category: The committees request that data be submitted for each University System of Maryland (USM) institution on undergraduate institutional aid awards. Data should include the number of institutional aid awards and average award size by Expected Family Contribution (EFC) for institutional grants, institutional athletic scholarships, and other institutional scholarships as reported to the Maryland Higher Education Commission for fiscal 2012. Data should also include the number of institutional aid awards and average award size by EFC for tuition waivers/remissions of fees to employees and dependents for fiscal 2012.
Information Request Report on institutional aid by EFC category
Author USM
Due Date December 14, 2012
3. Adopt the following narrative: Loan Data by Expected Family Contribution Category: In order to more fully understand all of the types of aid available to students, the committees request that undergraduate loan data be submitted for each University System of Maryland (USM) institution. Data should include, by Expected Family Contribution (EFC), the number of loans and average loan size of federal subsidized and unsubsidized loans, and loans from private sources as reported to the Maryland Higher Education Commission for fiscal 2012. Additionally, data should be provided on Pell grants including the number and average award size by EFC for fiscal 2012.
Information Request Loan data by EFC category
Author USM
Due Date December 14, 2012

R30B00 – University System of Maryland – Fiscal 2013 Budget Overview
Analysis of the FY 2013 Maryland Executive Budget, 2012
35
4. Adopt the following narrative: Faculty Workload Report: The committees request that the University System of Maryland (USM) continue to provide annual instructional workload reports for tenured and tenure-track faculty. By focusing on these faculty, the committees gain a sense of the teaching activities for the regular, core faculty at the institutions. Additional information may be included in the report at USM’s discretion. Furthermore, the report should include the percent of faculty meeting or exceeding teaching standards for tenured and tenure-track faculty for the University of Maryland, Baltimore.
Information Request Annual report on instructional workload for tenured and tenure-track faculty
Author USM
Due Date December 1, 2012

R30B00 – University System of Maryland – Fiscal 2013 Budget Overview
Analysis of the FY 2013 Maryland Executive Budget, 2012
36
Updates 1. Funding of Intercollegiate Athletic Programs
Language in the 2011 Joint Chairmen’s Report required USM to submit a report on the amount of general funds expended in fiscal 2011 on intercollegiate athletics, including institutional scholarships to student athletes on the basis of athletic ability.
Eight USM institutions participate in intercollegiate athletics (ICA). Five have Division I programs – UMCP, TU, UMES, CSU, and UMBC; BSU has a Division II program; and FSU and SU have Division III programs.
USM Office gathered funding information on each institution’s ICA program including
administration, personnel, team operating expenditures, and athletic scholarships. After analyzing the data and meeting with institutional representatives to further discuss and clarify issues, USM stated that “…institutions report that there were no general funds allocated for teams, ICA administrative or scholarship costs in FY 2011.” However, as will be discussed further, DLS requested additional information and found instances in which State funds, which include general funds and HEIF, may have been used to fund campus athletic programs. Administration and Team Operating Expenditures
In the report, USM concludes “…that the majority of the institutions’ ICA programs are self-supporting in the areas of administration and team operating expenses.” Institutions reported that these expenses are mainly funded from student athletic fees, National Collegiate Athletic Association (NCAA)/conference income distributions, revenue generating sports, and other sources such as sales, fundraising, and corporate sponsorships. However, the salaries of some athletic personnel at five institutions are either partially or fully funded from the State-supported academic program area, which is mainly comprised of general funds, HEIF, and tuition revenue. After funds are appropriated to the institutions, they are intermingled in the State-supported current unrestricted fund budget and are not tracked by fund source. More specifically: coaches at SU and UMBC teach academic courses as part of their workload and, as such, a
portion of their salaries are funded from academic programs;
salaries of four academic advisors at TU who counsel, tutor, mentor, and monitor student athletes are funded solely from academic programs;
salaries of two athletic employees at FSU are split-funded with academic programs for services provided to academic programs; and
up to five of the coaches’ salaries at CSU are partially funded by the Health and Human Performance Department (HHP), an academic program, for overseeing and mentoring students who participate in intramural and club sports that are managed by HHP. However,

R30B00 – University System of Maryland – Fiscal 2013 Budget Overview
Analysis of the FY 2013 Maryland Executive Budget, 2012
37
this arrangement is questionable, for it appears that an academic program is funding extracurricular activities that are generally funded from the student activity fee.
Athletic Scholarships
In regards to the funding of athletic scholarships, USM states a “…majority of the funding
comes from ICA revenues, gifts from affiliated foundation and athletic booster organizations” but further acknowledges “…there are instances in which institutional tuition funds are utilized for athletic scholarships.” Indeed, as shown in Exhibit 20, in fiscal 2011, all Division I institutions supported a portion of their athletic scholarships with institutional aid. Most notably, UMES funds 95% of its athletic scholarships with institutional aid. As Division III programs, FSU and SU cannot offer athletic-related scholarships.
Exhibit 20 Percentage of Athletic Scholarships Funded from Institutional Aid
Fiscal 2011
University of Maryland, College Park 22% Towson University 34% University of Maryland Eastern Shore 95% Coppin State University 28% University of Maryland Baltimore County 43%
Source: University System of Maryland Office
TU, UMES, and CSU refer to their athletic awards as performance or talent scholarships. These awards are based on tryouts or, as in the case of TU, on the need for specific teams to be competitive; geographic regions of the recruiting talent pools; and the history of the recruiting class. In the case of UMCP and UMBC, institutional aid-funded athletic scholarships are used to pay the difference between in- and out-of-state tuition for high-talent, full scholarship nonresident athletes. BOR policy (VIII-2.41 Policy on Institutional Student Financial Aid for Undergraduate Students) allows institutions to set criteria for awarding institutional aid to in- and out-of-state students based on merit which includes “special talent” defined as academic, artistic, musical, and/or athletic. NCAA College Athletics Finance Database
In order to corroborate the statement that no general funds were used to support USM’s ICA programs, DLS used the USA Today’s NCAA College Athletics Finance Database to determine if any revenues were derived from direct State support. The database contains 36 revenue and expense items that each Division I member institution reports to the NCAA. The latest data contained in the database is for academic year 2009-2010 (fiscal 2010). Upon reviewing the data, it was noted that all USM Division I programs, except CSU, derived a portion of their revenues from direct institutional

R30B00 – University System of Maryland – Fiscal 2013 Budget Overview
Analysis of the FY 2013 Maryland Executive Budget, 2012
38
support which is defined as the value of institutional resources for the current operations of ICA and all unrestricted funds allocated to athletics. DLS requested information from USMO on the source and use of these revenues. USMO reported that funds for direct institutional support were derived from tuition revenue, federal funds, and other special funds which include:
private indirect cost revenues;
gifts;
sales of education and general services;
vending and credit card commissions and rebates;
health center charges; and
a variety of miscellaneous income (e.g., library fines and photocopy fees).
Exhibit 21 shows, by institution, the purpose and amount attributed to direct institutional support in fiscal 2010.
DLS also requested additional information on reasons why CSU was the only USM Division I
program that did not derive any revenues from direct institutional support. USM responded that in fiscal 2010, unlike the other Division I programs, CSU fully funded its athletic scholarships through the ICA program even though the program was, and still is, operating in a deficit situation. Starting in fiscal 2011, as was shown in Exhibit 20, CSU is funding 28% of its athletic scholarships from institutional aid. UMCP Cost Containment Repayment
Upon reviewing USM’s report, DLS noted that there was no mention of UMCP’s repayment to the ICA program for funds borrowed during a period of cost containment. DLS requested further information on the situation. In response, USMO reported that during the period between fiscal 2002 and 2009, cost containment measures at UMCP included a $9.2 million contribution or loan from the athletic department to the central university budget. Starting in fiscal 2009, repayments from the central budget were made to the athletic department budget with the final repayment of $2.3 million made in fiscal 2011. USMO states that these funds were not included in the original report as they were not general funds expended on ICA “…but rather the re-payment of special funds previously contributed to the central university budget.” However, DLS notes that the central budget is comprised of various State-supported funds including general funds, HEIF, and tuition revenue. Therefore, there is a possibility that some general funds were used to repay the athletic department.

R30B00 – University System of Maryland – Fiscal 2013 Budget Overview
Analysis of the FY 2013 Maryland Executive Budget, 2012
39
Exhibit 21
Use of Direct Institutional Support Funds by Division I Institutions Fiscal 2010
Amount University of Maryland, College Park High talent scholarship for nonresident athletes $2,654,897
Restoration of cost containment 1,516,762
Transfer from Provost Office for academic support and career
development unit 170,000
Total $4,341,659
Towson University Talent grant scholarships $2,036,358 Federal work study 20,211 Total $2,056,569 University of Maryland Eastern Shore Scholarships $1,317,742 Academic advising and other support 662,862 Contributions/gifts/other 119,667 Total $2,100,271
University of Maryland Baltimore County High talent scholarship for nonresident athletics $1,622,000 Physical Education instructional coursework salaries 438,982 Total $2,060,982
Source: University System of Maryland Office
ICA Task Force
The General Assembly reporting requirement, along with media reports regarding the financial condition of UMCP’s ICA program, led to concerns among BOR that institutions have not recognized their responsibility to provide a full and complete statement of all revenues and expenditures in ICA programs. To that end, the Chancellor appointed an USMO task force to review current board policy, process, and practice. The task force will make recommendations to improve transparency of financial disclosures and institutional accountability, and strengthen board oversight over the management and finances of ICA programs.

R30B00 – University System of Maryland – Fiscal 2013 Budget Overview
Analysis of the FY 2013 Maryland Executive Budget, 2012
40
2. Faculty Workload Report
In fall 2004, USM implemented its Effectiveness and Efficiency initiative to reduce costs, improve quality, and accommodate future enrollment growth. Increasing faculty instructional workload is a key part of the E&E initiative. BOR set standards of expectations for tenured/tenure-track faculty workload – faculty at comprehensive institutions should carry a workload of 7.0 to 8.0 courses and for faculty at research institutions a workload of 5 to 6 courses, with each institution charged with meeting the mid-point of the workload standard. The faculty instruction workload target at comprehensive institutions is 7.5 course units and 5.5 course units for research institutions.
While six of nine USM institutions met or exceeded the workload target, the average course units taught decreased at UB in fiscal 2011, as shown in Exhibit 22. The average workload for comprehensive institutions increased to 7.5 meeting the target of 7.5 course units. Even though the workload at TU increased to 7.1, TU and UB consistently fall below the faculty workload target. The average course units taught at BSU jumped from 7.9 to 8.1 reflecting high levels of release time related to Middle States accreditation activities during the prior years. The average workload at UMES fell from 8.4 to 7.7 course units. USM reports that the lower than expected faculty workload at TU is the result of increased FTES enrollment and, therefore, the hiring of new faculty. New faculty are typically allowed a period of reduced course load in order for them to establish themselves at the institution, which reduces the overall faculty workload calculation. At UB, the business and law school faculty are exempt due to accreditation requirements limiting their course loads below these established targets leaving a small number of faculty covered by this policy.
Research institutions exceeded the target of 5.5, averaging 6.0 course units. The faculty workload at UMCP increased to 5.8 while UMBC remained steady at 6.6 course units.
UMB reports on actual course units taught and the percentage of faculty meeting or exceeding the institution’s standard. This is a more appropriate measure due to UMB’s many professional schools which may be subject to varying workload requirements from differing accrediting bodies. UMB reports that 93% of all core faculty meet or exceed the institution’s standard.

R30B00 – University System of Maryland – Fiscal 2013 Budget Overview
Analysis of the FY 2013 Maryland Executive Budget, 2012
41
Exhibit 22
Average Course Units Taught by Tenured/Tenure-track Faculty 2004-2011 Academic Year
2004-2005 Courses/
FTEF
2005-2006 Courses/
FTEF
2006-2007 Courses/
FTEF
2007-2008 Courses/
FTEF
2008-2009 Courses/
FTEF
2009-2010 Courses/
FTEF
2010-2011 Courses/
FTEF
Comprehensive Institutions
Bowie State University 8.2 7.5 7.9 7.9 7.5 7.3 8.2 Coppin State University 9.0 9.2 8.5 8.5 7.9 7.9 8.1 Frostburg State University 7.8 7.8 7.7 7.8 7.5 7.5 7.5 Salisbury University1 7.9 7.9 7.9 7.9 7.9 7.6 7.6 Towson University1 7.3 7.1 7.0 6.9 7.0 7.0 7.1 University of Baltimore (UB)1 6.9 6.9 6.7 7.3 7.1 7.1 6.8 University of MD Eastern Shore 7.5 7.8 7.8 7.4 7.7 8.4 7.7 All Comprehensive Institutions 7.7 7.7 7.5 7.5 7.4 7.4 7.5
Research Institutions
Univ. of MD, Baltimore (UMB)2 n/a n/a n/a n/a n/a n/a n/a Univ. of MD Baltimore County3 5.7 5.8 5.8 6.0 6.1 6.6 6.6 Univ. of MD, College Park3 5.1 6.1 5.9 5.8 5.7 5.8 5.9 All Research Institutions 5.3 6.0 5.9 5.8 5.8 6.0 6.0
FTEF: full-time equivalent faculty 1Calculations for Salisbury University, Towson University, and the University of Baltimore omit the schools of business and law because accreditation standards requires law faculty to teach 4 course units and business faculty to teach 6 course units. 2The University of Maryland, Baltimore (UMB) reports 93% of all core faculty met or exceeded UMB’s standard for workload in 2009-2010. 3State-supported full-time equivalent. Source: University System of Maryland’s Faculty Workload Report, November 14, 2011

R30B00 – University System of Maryland – Fiscal 2013 Budget Overview
Analysis of the FY 2013 Maryland Executive Budget, 2012
42
The faculty workload report only provides information on tenured/tenure-track faculty. Some institutions, particularly comprehensives, rely on full- and part-time non-tenured/non-tenure-track faculty to carry some of the instruction workload, as shown in Exhibit 23.
Exhibit 23 Instructional Faculty
Number and Percent of Total by Type 2007-2011 Academic Year
Research Comprehensive
Faculty Type 2007-2008 2008-2009 2009-2010
2010-2011 2007-2008 2008-2009 2009-2010
2010-2011 Tenured/ Tenure-track
1,848 (42%)
1,866 (38.8%)
1,854 (37.5%)
1,845 (38.7%)
1,563 (44.4%)
1,637 (42.6%)
1,668 (42.8%)
1,688 (42.2%)
Full-time
Non-tenured/ Non-tenure-track
Instructional
368 (8.4%)
386 (8.0%)
355 (7.2%)
385 (8.1%)
485 (13.8%)
523 (13.6%)
545 (14.0%)
550 (13.7%)
Full-time
Non-tenured/ Non-tenure-track
Research
1,378 (31.3%)
1,396 (29%)
1,542 (31.2%)
1,660 (34.8%)
14 (0.4%)
8 (0.2%)
4 (0.1%)
5 (0.1%)
Part-time 807 (18.3%)
1,163 (24.2%)
1,192 (24.1%)
877 (18.4%)
1,457 (41.4%)
1,678 (43.6%)
1,680 (43.1%)
1,761 (44.0%)
Total 4,401 4,811 4,943 4,767 3,519 3,846 3,897 4,004
Source: University System of Maryland’s Faculty Workload Report
Focusing on tenured/tenure-track faculty does not accurately reflect the workload of instructional faculty. As shown in Exhibit 24, when taking into account the workload of full-time non-tenured/non-tenure-track faculty, the average course load increases from 7.5 to 7.9 course units for comprehensive institutions and from 6.0 to 6.1 at research institutions. This suggests non-tenured-track faculty are taking on more of the teaching responsibilities, thereby decreasing the instructional workload of tenured/tenure-track faculty.
R30B00 – University System of Maryland – Fiscal 2013 Budget Overview
Analysis of the FY 2013 Maryland Executive Budget, 2012
43
Exhibit 24
Average Course Units Taught by Tenured/Tenure-track and Full-time Non-tenured/Non-tenure-track Instructional Faculty
2006-2011 Academic Year
2006-2007 Courses/
FTEF
2007-2008 Courses/
FTEF
2008-2009 Courses/
FTEF
2009-2010 Courses/
FTEF
2010-2011 Courses/
FTEF
Comprehensive Institutions
Bowie State University 7.9 8.0 8.0 7.6 8.3 Coppin State University 8.8 9.0 8.2 10.5 9.0 Frostburg State University 8.0 8.1 7.6 7.5 7.5 Salisbury University 8.0 8.2 7.9 7.6 7.7 Towson University 7.3 7.3 7.4 7.3 7.7 University of Baltimore (UB) 7.0 7.5 7.5 7.6 7.8 University of MD Eastern Shore 7.9 7.6 7.9 9.3 8.1 All Comprehensive Institutions 7.7 7.8 7.7 7.9 7.9
Research Institutions University of MD Baltimore
County 6.1 6.3 6.5 6.5 6.9 University of MD, College Park 5.9 5.8 5.7 5.8 5.8 All Research Institutions 6.0 5.9 5.9 6.0 6.1
FTEF: full-time equivalent faculty UB: University of Baltimore Note: Calculations for Salisbury University, Towson University, and University of Baltimore omit the schools of business and law; research universities include State-supported full-time equivalent in addition to full-time non-tenured faculty. Source: University System of Maryland’s Faculty Workload Report 3. Allocation of General Funds Among Institutions
Language in the 2011 Joint Chairmen’s Report required USM to submit a report on efforts to address the allocation of general funds among institutions and how it will better meet the needs of the underserved and high demand areas of the State. The report summarizes legislative and legal considerations that impact the allocation of funds. These include the State’s priorities as defined in

R30B00 – University System of Maryland – Fiscal 2013 Budget Overview
Analysis of the FY 2013 Maryland Executive Budget, 2012
44
statute, funding guidelines, and the Office for Civil Rights Partnership Agreement with the State. Overall, a number of other factors affect the distribution of general funds including condition of the State budget; increases in mandatory costs; availability of additional tuition revenues; and funding of program priorities. The goal in the future is to use the strategic plan more heavily in the allocation of general funds.
In order to meet the educational needs of the State, USM plans to strategically expand access and outreach to those traditionally underserved areas of the State by expanding and enhancing current programs and initiatives such as, elimination of the achievement gap, expanding need-based aid, and expansion of regional centers. Further, USM plans to enhance existing programs including expanding online learning opportunities, improving program articulation and transfer of students from community colleges, and supporting initiatives to close the achievement gap.
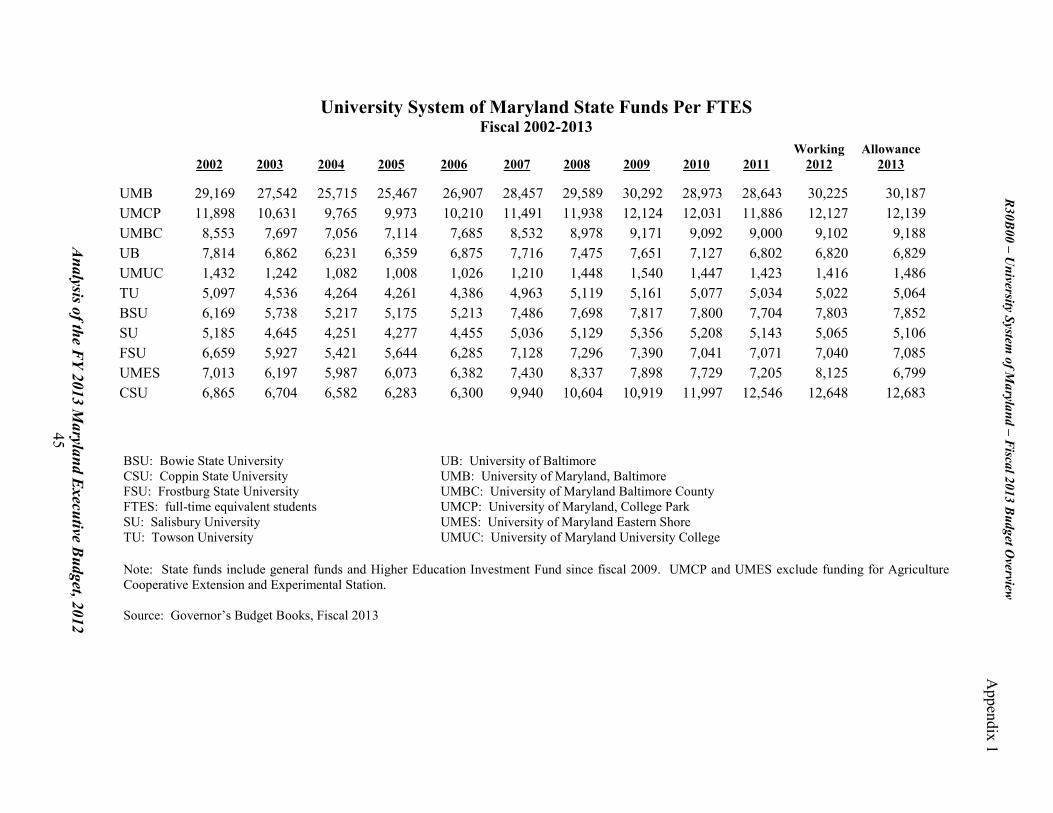
Analysis of the F
Y 2013 Maryland E
xecutive Budget, 2012
45
University System of Maryland State Funds Per FTES Fiscal 2002-2013
BSU: Bowie State University UB: University of Baltimore CSU: Coppin State University UMB: University of Maryland, Baltimore FSU: Frostburg State University UMBC: University of Maryland Baltimore County FTES: full-time equivalent students UMCP: University of Maryland, College Park SU: Salisbury University UMES: University of Maryland Eastern Shore TU: Towson University UMUC: University of Maryland University College Note: State funds include general funds and Higher Education Investment Fund since fiscal 2009. UMCP and UMES exclude funding for Agriculture Cooperative Extension and Experimental Station. Source: Governor’s Budget Books, Fiscal 2013
2002 2003 2004 2005 2006 2007 2008 2009 2010 2011
Working 2012
Allowance 2013
UMB 29,169 27,542 25,715 25,467 26,907 28,457 29,589 30,292 28,973 28,643 30,225 30,187 UMCP 11,898 10,631 9,765 9,973 10,210 11,491 11,938 12,124 12,031 11,886 12,127 12,139 UMBC 8,553 7,697 7,056 7,114 7,685 8,532 8,978 9,171 9,092 9,000 9,102 9,188 UB 7,814 6,862 6,231 6,359 6,875 7,716 7,475 7,651 7,127 6,802 6,820 6,829 UMUC 1,432 1,242 1,082 1,008 1,026 1,210 1,448 1,540 1,447 1,423 1,416 1,486 TU 5,097 4,536 4,264 4,261 4,386 4,963 5,119 5,161 5,077 5,034 5,022 5,064 BSU 6,169 5,738 5,217 5,175 5,213 7,486 7,698 7,817 7,800 7,704 7,803 7,852 SU 5,185 4,645 4,251 4,277 4,455 5,036 5,129 5,356 5,208 5,143 5,065 5,106 FSU 6,659 5,927 5,421 5,644 6,285 7,128 7,296 7,390 7,041 7,071 7,040 7,085 UMES 7,013 6,197 5,987 6,073 6,382 7,430 8,337 7,898 7,729 7,205 8,125 6,799 CSU 6,865 6,704 6,582 6,283 6,300 9,940 10,604 10,919 11,997 12,546 12,648 12,683
R30B
00 – University System
of Maryland – F
iscal 2013 Budget O
verview A
ppendix 1
Appendix 5

Analysis of the F
Y 2013 Maryland E
xecutive Budget, 2012
46
R30B
00 – University System
of Maryland – F
iscal 2013 Budget O
verview A
ppendix 2
USM Full-time Equivalent Personnel by Budget Program
Fiscal 2002, 2011, and 2012
Fiscal 2002 Fiscal 2011 Fiscal 2012
FTEs
% of Total FTEs FTEs
% of Total FTEs FTEs
% of Total FTEs
Change in Share of Total
2002-2012
Instruction 5,858 33.5% 6,499 30.6% 6,837.0 31.2% -2.3% Research 2,455 14.0% 3,804 17.9% 3,883.7 17.7% 3.7% Public Service 689 3.9% 705 3.3% 749.7 3.4% -0.5% Academic Support 1,937 11.1% 2,203 10.4% 2,295.7 10.5% -0.6% Student Services 945 5.4% 1,152 5.4% 1,177.5 5.4% 0.0% Institutional Support 2,427 13.9% 2,840 13.4% 2,810.1 12.8% -1.1% Operations and Maintenance of Plant 1,558 8.9% 1,633 7.7% 1,623.0 7.4% -1.5% Auxiliary 1,368 7.8% 1,873 8.8% 1,975.6 9.0% 1.2% Hospitals 248 1.4% 532 2.5% 555 2.5% 1.1%
Total 17,485
21,240
21,907
Notes: Data are for filled positions only. Source: University System of Maryland Institutions