university of zagreb faculty of mechanical engineering … · university of zagreb faculty of...
TRANSCRIPT

U N I V E R S I T Y O F Z A G R E B
FACULTY OF MECHANICAL ENGINEERING AND NAVAL ARCHITECTURE
International Master of Science Programme: Sustainable Energy Engineering
THE ANALYSYS OF THE POTENTIAL OF MATERIAL AND ENERGY RECOVERY OF MUNICIPAL WASTE
IN CANADA
MASTER THESIS
PATRICK FOWLER
ZAGREB – 2011

U N I V E R S I T Y O F Z A G R E B
FACULTY OF MECHANICAL ENGINEERING AND NAVAL ARCHITECTURE
International Master of Science Programme: Sustainable Energy Engineering
THE ANALYSYS OF THE POTENTIAL OF MATERIAL AND ENERGY RECOVERY OF MUNICIPAL WASTE
IN CANADA
MASTER THESIS
Supervisor:
Prof. dr. sc. SLAVEN DOBROVIĆ
Candidate:
PATRICK FOWLER
ZAGREB – 2011

THE ANALYSYS OF THE POTENTIAL OF MATERIAL AND ENERGY RECOVERY OF MUNICIPAL WASTE IN CANADA
I
DATA FOR BIBLIOGRAPHICAL CARD:
UDK: 628.4(71)
Key words: SUSTAINABLE AND INTEGRATED WASTE-RELATED MANAGEMENT,
MATERIAL RECYCLING, ENERGY RECYCLING, GREENHOUSE GASSES
EMISSIONS, WASTE MANAGEMENT, WASTE RELATED POLICY
Scientific scope: TECHNICAL SCIENCES
Scientific field: SUSTAINABLE ENERGY ENGINEERING
Institution at which work has been made: UNIVERSITY OF ZAGREB, FMENA
Advisor: Prof. dr. sc. SLAVEN DROBROVIĆ
Number of pages: 187
Number of figures: 40
Number of tables: 52
Number of titles listed in Bibliography: 148
Date of presentation: 2011
Committee: Prof. dr. sc DANIEL ROLPH SCHNEIDER Prof.dr.sc. SLAVEN DOBROVIĆ Doc.dr.sc. IGOR SUTLOVIĆ
Institution at which work is filled: UNIVERSITY OF ZAGREB, FMENA
THE ANALYSYS OF THE POTENTIAL OF MATERIAL AND ENERGY RECOVERY OF MUNICIPAL WASTE IN CANADA
II
UNIVERSITY OF ZAGREB
S v e u č i l i š t e Z a g r e b u F a k u l t e t s t r o j a r s t v a i b r o d o g r a d n j e
International Master of Science Programme: Sustainable Energy Engineering
Zagreb, June 29th, 2010
Master thesis proposal
Candidate: Patrick Fowler, dipl. ing. Title: The analysis of the potential of material and energy recovery of municipal waste in
Canada Thesis Contents:
This thesis will investigate overall potential of material and energy recovery of municipal waste in Canada. The analysis of the potential will include all material and energy flows, but also the emissions of pollutants to the environment as a direct or indirect result of particular treatment of municipal waste.
The introductory part of the thesis will give an explanation of basic terms and definition of the concept of sustainable integrated waste management. Special emphasis will be given to the hierarchy of waste treatment practices in the context of sustainability of particular treatment.
Based on review of recent reports, the thesis will present Canada’s current situation in waste management sector, including the comparison with some other countries and the rest of the world. Following chapter will give an overview and description of all major waste treatment practices which will be analysed further on regarding its environmental influence. Special attention of this analysis will be given to the greenhouse gasses emissions related to particular treatment.
The analysis of the potential of material and energy recycling of municipal solid waste in Canada will be done according to the chosen methodology and based on several development scenarios of waste management system. Scenarios differ regarding the quantity of waste being diverted to material or energy recycling. Besides two extremes with maximum diversion towards material and energy recycling, several other scenarios with different shares of treatment practices will be also analysed.
The analysis of each scenarios will include an assessment of material and energy flows and resulting emissions of pollutants with a special emphasis on the greenhouse gases. In the discussion of the results, each scenario has to be evaluated regarding the preservation of natural resources. Based on the comprehensive discussion, conclusion remarks will be given in a way that could help policy makers to create more sustainable surroundings in the waste management sector, especially in the Canada.
Thesis proposed: Thesis submitted: Supervisor: Chairman of Committee for Project Director: postgraduate studies: Doc. dr. sc. Slaven Dobrović Prof. dr. sc. Tomislav Filetin Prof. dr. sc. Tonko Ćurko
THE ANALYSYS OF THE POTENTIAL OF MATERIAL AND ENERGY RECOVERY OF MUNICIPAL WASTE IN CANADA
III
ACKNOWLEDGEMENTS
This master thesis has been four years in the making, as I chose to develop my career at the
same time, applying the knowledge gained in the MSc SEE program. I have many people to
thank for getting me through this. Each person has contributed to my success and I am
fortunate to have these people in my life. I dedicate this paper to them.
First and foremost to the love of my life – Chantal – who has been there for me at the final
stages, encouraging me and making sure that I never gave up. For her strength and diligence I
thank her.
I’m largely indebted to my loving family who, despite my wishes, constantly, with the best
intentions, inquired about the status of this paper. Their tireless support has kept me going
throughout.
To my dear friend Teri Coburn, who has graciously opened her home to me as a refuge from
the distractions of city life, without which this paper could not have been completed. Over the
past three years her home has been my scholarly office away from the University of Zagreb.
Prof.dr.sc. Slaven Dobrović, my advisor who has guided and directed me from abroad in
reviewing, commenting and supporting me throughout.
Prof.dr.sc. Neven Duić, who has spent many hours supporting and championing my cause
and working with the University to make this program a success.
And finally, the entire teaching and support staff at FSB for the memorable year of class
work and the invaluable knowledge and lessons learned.
THE ANALYSYS OF THE POTENTIAL OF MATERIAL AND ENERGY RECOVERY OF MUNICIPAL WASTE IN CANADA
IV
TABLE OF CONTENTS
DATA FOR BIBLIOGRAPHICAL CARD: ............................................................................. I
UNIVERSITY OF ZAGREB ................................................................................................... II
ACKNOWLEDGEMENTS .....................................................................................................III
TABLE OF CONTENTS ........................................................................................................ IV
PREFACE/PURPOSE ........................................................................................................... VII
SAŽETAK (CROATIAN) .................................................................................................... VIII
ABSTRACT/SUMMARY (ENGLISH) ................................................................................. IX
KEY WORDS (ENGLISH/CROATIAN) ................................................................................ X
LIST OF SYMBOLS & ABBREVIATIONS ......................................................................... XI
LIST OF FIGURES ............................................................................................................. XIV
LIST OF TABLES ............................................................................................................... XVI
CHAPTER 1: INTRODUCTION ....................................................................................... 1-1
1.1 Introduction ............................................................................................................. 1-1
1.2 Background ............................................................................................................. 1-4
1.3 Definitions ............................................................................................................... 1-8
1.3.1 Waste – Uses of the word ................................................................................ 1-8
1.3.2 Waste-Related Definitions ............................................................................. 1-11
1.4 Methodology ......................................................................................................... 1-12
1.4.1 Literature Review........................................................................................... 1-12
1.4.2 Basis for Comparison ..................................................................................... 1-12
1.5 Summary ............................................................................................................... 1-14
CHAPTER 2: SUSTAINABLE AND INTEGRATED WASTE RELATED MANAGEMENT ......................................................................................... 2-1
2.1 Introduction ............................................................................................................. 2-1
2.2 Current Waste-Related Management Systems ........................................................ 2-1
2.2.1 A brief History ................................................................................................. 2-1
2.2.2 Waste-Related Management ............................................................................ 2-3
2.2.3 Recap of Current Waste-Related Management Systems ................................. 2-5
2.3 Sustainable and Integrated Waste-Related Management ........................................ 2-6
2.3.1 The Concept ..................................................................................................... 2-7
2.3.2 Improving the traditional WRM hierarchy ...................................................... 2-9

THE ANALYSYS OF THE POTENTIAL OF MATERIAL AND ENERGY RECOVERY OF MUNICIPAL WASTE IN CANADA
V
2.3.3 Environmental Concerns ................................................................................ 2-14
2.3.4 The Role of Waste-Related Products to Energy ............................................ 2-16
2.4 Material Recycling ................................................................................................ 2-18
2.4.1 Paper and Cardboard ...................................................................................... 2-19
2.4.2 Glass ............................................................................................................... 2-20
2.4.3 Metals ............................................................................................................. 2-20
2.4.4 Plastics ........................................................................................................... 2-21
2.4.5 Textiles ........................................................................................................... 2-21
2.4.6 Waste Electrical and Electronic Equipment (WEEE) .................................... 2-22
2.5 Disposal and Energy Recycling ............................................................................ 2-22
2.5.1 The basics....................................................................................................... 2-22
2.5.2 Physical Processing ........................................................................................ 2-27
2.5.3 Biochemical Conversion ................................................................................ 2-28
2.5.4 Thermochemical Conversion ......................................................................... 2-31
2.5.5 Engineered Landfill ....................................................................................... 2-49
2.5.6 Conclusions – Energy Recycling ................................................................... 2-51
2.6 Conclusions ........................................................................................................... 2-53
CHAPTER 3: CANADIAN SUSTAINABLE AND INTEGRATED WASTE-RELATED MANAGEMENT POLICY ......................................................................... 3-1
3.1 Introduction ............................................................................................................. 3-1
3.2 Canadian Performance ............................................................................................ 3-1
3.3 Canadian waste policy ............................................................................................. 3-5
3.3.1 Federal.............................................................................................................. 3-5
3.3.2 Provincial and Territorial ................................................................................. 3-8
3.3.3 Municipal/Regional........................................................................................ 3-22
3.4 Canadian Waste-Related-Products-to-Energy Policy ........................................... 3-22
3.4.1 The Ontario example ...................................................................................... 3-23
3.5 Canada vs. the World ............................................................................................ 3-24
3.5.1 Waste & Recoverable Product Generation & Diversion ............................... 3-24
3.5.2 Energy Recycling ........................................................................................... 3-27
3.5.3 Summary ........................................................................................................ 3-27
3.6 Conclusion ............................................................................................................. 3-28

THE ANALYSYS OF THE POTENTIAL OF MATERIAL AND ENERGY RECOVERY OF MUNICIPAL WASTE IN CANADA
VI
CHAPTER 4: GREENHOUSE GAS EMISSIONS FROM WASTE-RELATED MANAGEMENT ......................................................................................... 4-1
4.1 Introduction ............................................................................................................. 4-1
4.2 Methodology ........................................................................................................... 4-2
4.2.1 Validation of the method used ......................................................................... 4-3
4.2.2 Common information ....................................................................................... 4-5
4.2.3 Transportation/Mobilisation ............................................................................ 4-6
4.2.4 Landfill ........................................................................................................... 4-11
4.2.5 Incineration .................................................................................................... 4-19
4.2.6 Composting .................................................................................................... 4-23
4.2.7 Anaerobic Digestion ...................................................................................... 4-27
4.2.8 Recycling ....................................................................................................... 4-30
4.3 Comparison ........................................................................................................... 4-33
4.3.1 Landfill ........................................................................................................... 4-33
4.3.2 Incineration .................................................................................................... 4-35
4.3.3 Composting and AD ...................................................................................... 4-36
4.3.4 Recycling ....................................................................................................... 4-37
4.3.5 Material specific ............................................................................................. 4-37
4.4 Scenarios ............................................................................................................... 4-40
4.5 Results & Conclusions ..........................................................................................4–50
CHAPTER 5: CONCLUSIONS AND RECOMMENDATIONS ...................................... 5-1
5.1 Overview ................................................................................................................. 5-1
5.2 Conclusions ............................................................................................................. 5-5
5.3 Recommendations for Canada ................................................................................ 5-8
LITERATURE & REFERENCES ............................................................................................. I

THE ANALYSYS OF THE POTENTIAL OF MATERIAL AND ENERGY RECOVERY OF MUNICIPAL WASTE IN CANADA
VII
PREFACE/PURPOSE
This purpose of this final paper is to complete the requirements for the international Master
of Science program with specialization in Sustainable Energy Engineering from FSB,
University of Zagreb, Croatia.
The aim of this final paper is to demonstrate that the candidate can deal with a particular
topic using technical knowledge and professional methods, and consequently prove he or she
deserves the degree of MSc SEE.
In this case, the broad topic of waste & recoverable product management: sustainability,
policy and GHG emissions, Canada is suitable in the context of sustainable energy
engineering and meets the requirements of the final paper. In addition the results of this paper
are placed in the context of the Canadian environment for analysis since it is the author’s
home country.
Originally the focus of this paper was to explore waste-related products to energy (energy
recycling) technologies and elaborate on the greenhouse gas effects of these. However, as is
the case with most sustainability topics, a small portion could not be analysed without
considering waste-related management as a whole. Therefore, the concepts and hierarchy of
waste-related management are explored and a new sustainable hierarchy is developed to
ensure waste-related products to energy can be attributed the proper importance relative to
other strategies.
Finally, this paper draws conclusions from the three main chapters in order to propose
improvements to Canadian waste-related policies. Consequently it hopes to sensitise
Canadians to the issues and reduce the environmental impacts of this industry.

THE ANALYSYS OF THE POTENTIAL OF MATERIAL AND ENERGY RECOVERY OF MUNICIPAL WASTE IN CANADA
VIII
SAŽETAK (CROATIAN)
Gospodarenje otpadom složena je problematika koja se značajno razvila tijekom vremena. U suvremenom kontekstu, s okolišem u prvom planu, tradicionalne metode samostalno ne mogu zadovoljiti potrebe. Čak se i naša postojeća definicija i upotreba riječi otpad mora promijeniti. Održivo i integrirano gospodarenje otpadom (Sustainable and integrated waste-related management (SIWRM)) je holistički pristup tradicionalnom gospodarenju otpadom, s jasno definiranim načelima i naglaskom na prevenciju i redukciju.
Uloga otpadnih proizvoda prema energiji (waste-related products to energy (WRPtE)) u toj hijerarhiji održivog i integriranog gospodarenja otpadom je vrlo važna. Također poznate kao recikliranje energije, te tehnologije mogu proizvesti neke opipljive količine energije iz proizvoda koji se inače smatraju otpadom. Moderne tehnologije su projektirane da zadovolje najstrože ekološke standarde te se u većini slučajeva preferiraju kao alternativa samom odlaganju otpada.
Politika Kanade prema WRPtE i SIWRM je neusmjerena i nejasna. Pokrajine su prepuštene same određivati ciljeve, a regije bi trebale razvijati i provoditi svoje planove. Postoji pogodnost u strukturi koja dopušta da strategije budu specifične za regije, međutim utjecaj na okoliš tih aktivnosti mora biti postavljen na nacionalnoj razini, s politikom koja rukovodi regionalnim aktivnostima.
Emisije stakleničkih plinova su globalni problem i industrija povezana s otpadom je veliki neto proizvođač stakleničkih plinova. S pravilnim izborima napravljenim u kontekstu SIWRM-a, ta industrija zapravo može postati korisna. Svaka komponenta prisutna u našim otpadnim/obnovljivim proizvodima (W&RP) ima svoje karakteristike koje se, ako se ispravno iskorištavaju, mogu ponovno koristiti za druge namjene ili reciklirati za dobivanje novih proizvoda ili čak energije.
U Kanadi proizvodimo više otpadnih/obnovljivih proizvoda po stanovniku od većine razvijenih zemalja, dio njih odvajamo s odlagališta, i neke izvozimo u SAD. Industrija je neto proizvođač emisija stakleničkih plinova i trenutne politike promiču odlagališta naspram WRPtE postrojenja, s nejasnim nacionalnim ciljevima za smanjenje otpada, odvajanje ili pretvorbu.
Konačno, ovaj će rad pokazati usporedbu Kanade i drugih zemalja u ovom području, koji je njihov potencijal za odvajanje i emisije stakleničkih plinova za razne scenarije. Preporuke su načinjene kako bi pomogle Kanadi utvrditi ciljeve i razvojne programe u pogledu održive budućnosti.

THE ANALYSYS OF THE POTENTIAL OF MATERIAL AND ENERGY RECOVERY OF MUNICIPAL WASTE IN CANADA
IX
ABSTRACT/SUMMARY (ENGLISH)
Waste-related management is a complex topic which has evolved significantly over time. In a
modern context, with the environment at the forefront, traditional methods alone cannot
satisfy the needs. Even our current definition and use of the word waste needs to change.
Sustainable and integrated waste-related management (SIWRM) is a holistic approach to
traditional waste management, with clearly defined principles and focus on prevention and
reduction.
The role of waste-related products to energy (WRPtE) in this SIWRM hierarchy is very
important. Also known as energy recycling, these technologies can produce some tangible
quantities of energy from products otherwise considered waste. Modern technologies are
designed to meet the most stringent environmental standards and in most cases are preferable
to landfills as a disposal alternative.
Canada’s policy towards WRPtE and SIWRM is unfocused and unclear. Provinces are left to
set their own targets and the regions are supposed to develop and implement their own plans.
There are benefits to a structure which allows strategies to be region specific however the
environmental impact of this activity should be addressed at the national level, with policies
to guide the regional activities.
Greenhouse gas (GHG) emissions are a global issue and the waste-related industry is a large
net producer of GHGs. With proper choices made within a SIWRM context, this industry can
actually become a sink rather than a source. Each component present in our waste &
recoverable products (W&RP) has its own characteristics which, if managed correctly, can be
re-used for other purposes or recycled to generate new products or even energy.
In Canada we generate more W&RP per capita than most developed nations, we divert a
fraction of it from landfill, and we export some to the USA. The industry is a net producer of
GHG emissions and current policies promote landfills over WRPtE facilities, with no clear
national targets for waste reduction, diversion or conversion.
Ultimately, this paper will demonstrate how Canada compares to other countries in this field,
what their potential for diversion is and the associated GHG emissions for various scenarios.
Recommendations are made to help Canada establish targets and development programs
towards a sustainable future.

THE ANALYSYS OF THE POTENTIAL OF MATERIAL AND ENERGY RECOVERY OF MUNICIPAL WASTE IN CANADA
X
KEY WORDS (ENGLISH/CROATIAN)
English Croatian
Sustainable and Integrated Waste-Related Management
Održivo i integrirano gospodarenje otpadom
Material Recycling Recikliranje materije
Energy Recycling Recikliranje energije
Greenhouse Gasses Emissions Emisije stakleničkih plinova
Waste Management Gospodarenje otpadom
Waste Related Policy Politika upravljanja otpadom

THE ANALYSYS OF THE POTENTIAL OF MATERIAL AND ENERGY RECOVERY OF MUNICIPAL WASTE IN CANADA
XI
LIST OF SYMBOLS & ABBREVIATIONS
AB Alberta AD Anaerobic Digestion As Arsenic BC British Columbia BCE Before the Common Era BFB Bubbling Fluidized Bed C Carbon C&D Construction & Demolition CA/CAN Canada CCME Canadian Council of Ministers of the Environment Cd Cadmium CE Common Era CEE Central & Eastern Europe CEPA Canadian Environmental Protection Act CFB Circulating Fluidized Bed CH4 Methane CHP Combined Heat and Power Cl Chlorine CO Carbon Monoxide CO2 Carbon Dioxide
CO2eq Carbon Dioxide Equivalent Cr Chromium Cu Copper DDOC Dissimilated DOC DOC Degradable Organic Carbon EC Environment Canada EfW Energy from Waste EPR Extended Producer Responsibility EU European Union F Fluorine FB Fluidized bed Fe Iron GDP Gross Domestic Product GHG Greenhouse Gas GWP Global Warming Potential H Hydrogen H2O Water H2S Hydrogen Sulphide HC Hydrocarbon HCl Hydrogen Chloride HCN Hydrogen Cyanide HDPE High Density Polyethylene HF Hydrogen fluoride Hg Mercury
THE ANALYSYS OF THE POTENTIAL OF MATERIAL AND ENERGY RECOVERY OF MUNICIPAL WASTE IN CANADA
XII
HHV Higher Heating Value IC&I Industrial, Commercial and Institutional IEA International Energy Agency IPCC Intergovernmental Panel on Climate Change IWM Integrated Waste Management IWMC Island Waste Management Corporation K Potassium Kt Kilo ton LCA Life Cycle Analysis LFG Landfill Gas LHV Lower Heating Value MB Manitoba MC Moisture Content MRMR Municipal Refuse Management Regulations Mt Mega ton MW&RP Municipal Waste & Recoverable Products N Nitrogen NB New Brunswick NH3 Hydrogen Nitride (Ammonia) NIMBY Not In My Back Yard NL Newfoundland NOx Nitrogen Oxides NS Nova Scotia NWT Northwest Territories O Oxygen OECD Organisation for Economic Co-operation and Development ON Ontario P Phosphorous Pb Lead PEI Prince Edward Island PET Polyethylene Terephthalate PM Particulate Matter ppm Parts per million QC Quebec RCV Refuse Collection Vehicle RDF Refuse Derived Fuel RTS Refuse Transfer Station S Sulphur SIWRM Sustainable & Integrated Waste-Related Management SK Saskatchewan SO2 Sulphur Dioxide TC Total Carbon TEQ Toxicity Equivalent UK United Kingdom UN United Nations UNDP United Nations Development Programme
THE ANALYSYS OF THE POTENTIAL OF MATERIAL AND ENERGY RECOVERY OF MUNICIPAL WASTE IN CANADA
XIII
UNEP United Nations Environmental Programme US EPA United States Environmental Protection Agency VOC Volatile Organic Compound W&RP Waste & Recoverable Products WDO Waste Diversion Ontario WEEE Waste Electrical and Electronic Equipment WRM Waste-Related Management WRP Waste-Related Products WRPtE Waste-Related Products to Energy Zn Zinc

THE ANALYSYS OF THE POTENTIAL OF MATERIAL AND ENERGY RECOVERY OF MUNICIPAL WASTE IN CANADA
XIV
LIST OF FIGURES
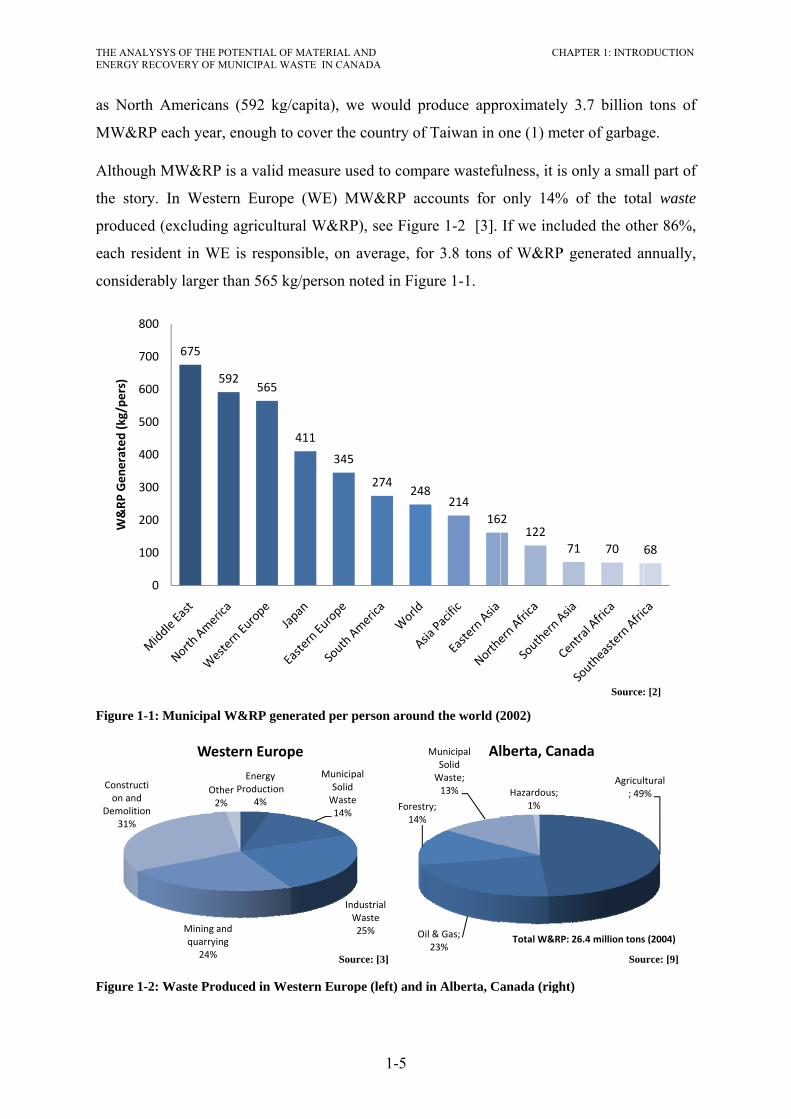
Figure 1-1: Municipal W&RP generated per person around the world (2002) ..................... 1-5
Figure 1-2: Waste Produced in Western Europe (left) and in Alberta, Canada (right) ......... 1-5
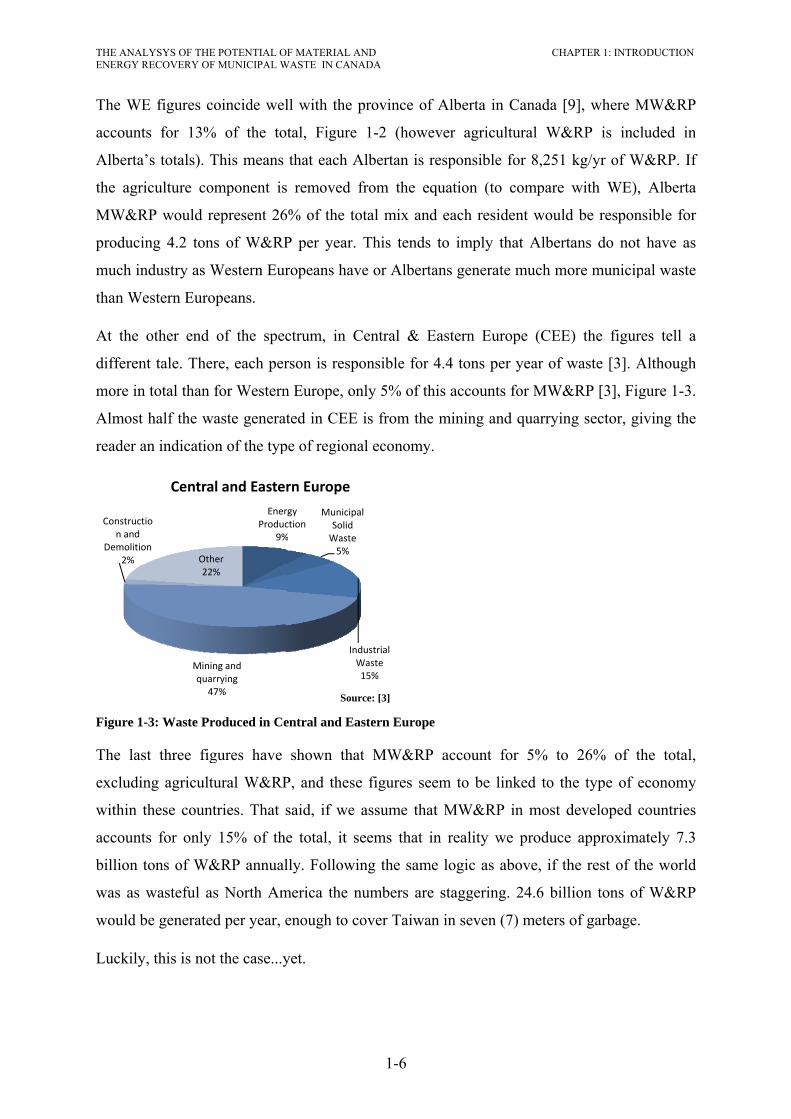
Figure 1-3: Waste Produced in Central and Eastern Europe ................................................. 1-6
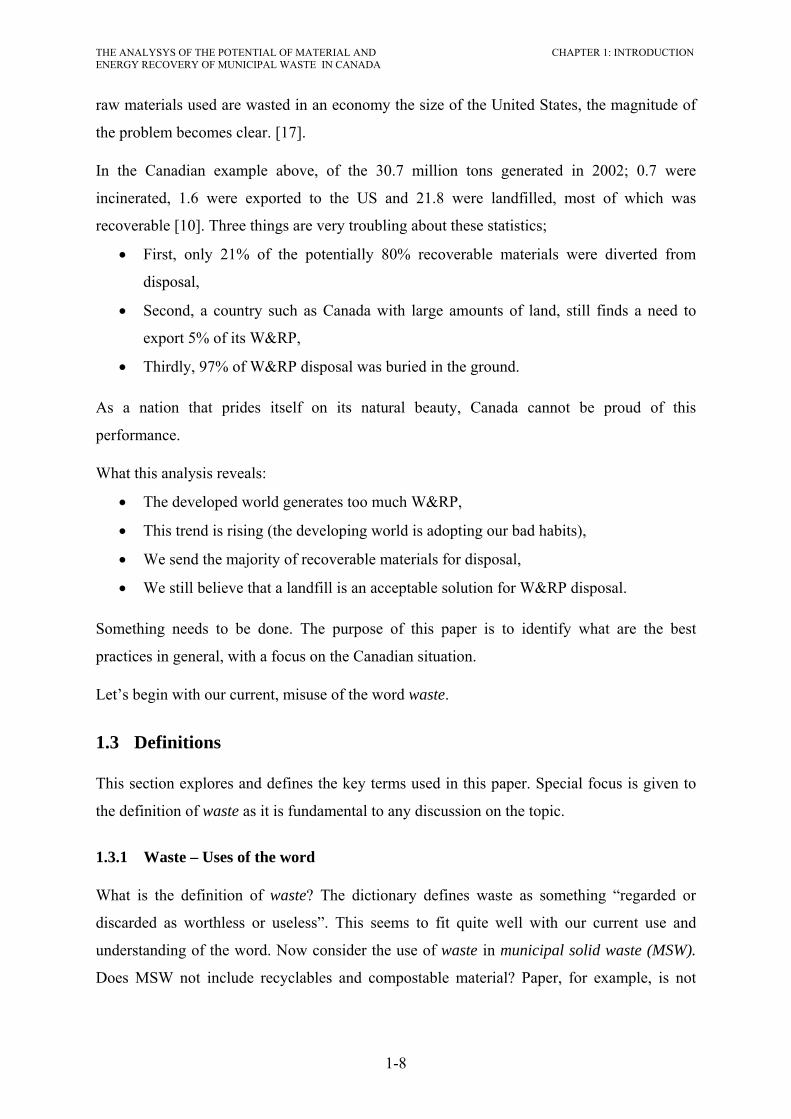
Figure 1-4: MW&RP sent for disposal in Canada (2002) ..................................................... 1-7
Figure 2-1: Traditional Waste Management Hierarchy ......................................................... 2-3
Figure 2-2: Integrated waste-related management system ..................................................... 2-8
Figure 2-3: Sustainable & Integrated Waste-Related Management Hierarchy ................... 2-13
Figure 2-4: Production of recycled paper fiber .................................................................... 2-19
Figure 2-5: Composition of MW&RP in Ontario, Canada (left) and in Europe (right) ...... 2-24
Figure 2-6: Thermal conversion process and products ........................................................ 2-35
Figure 2-7: A Large MW&RP incineration facility ............................................................. 2-37
Figure 2-8: Fixed and fluidized bed gasification ................................................................. 2-40
Figure 2-9: Direct and indirect gasification ......................................................................... 2-40
Figure 2-10: Overview of the Plasco plasma gasification process ...................................... 2-44
Figure 2-11: Primary (left) and Secondary (right) Reaction Vessels for Plasma Gasification Process ................................................................................................................................. 2-45
Figure 2-12: Vitrification Vessel for Slag Melting .............................................................. 2-46
Figure 2-13: Syngas Scrubbing and Separation Flow Diagram ........................................... 2-47
Figure 2-14: Engineered Landfill ......................................................................................... 2-49
Figure 2-15: Example of a sorting and WRPtE facility ....................................................... 2-52
Figure 3-1: Landfills across Canada ...................................................................................... 3-2
Figure 3-2: Municipal Waste & Recoverable Products Generated in Canada (2004) ........... 3-4
Figure 3-3: Landfill, Incineration, Diversion of MW&RP (left, 2004) and Composition in Canada (right, 2002) .............................................................................................................. 3-4
Figure 3-4: Diversion and disposal of MW&RP, by province (2004) ................................... 3-9
Figure 3-5: Total municipal waste & recoverable products generated by province (2004) 3-10
Figure 3-6: MW&RP generation per capita, by province (2004) ........................................ 3-10
Figure 3-7: Expenditure on MW&RP services per capita – Local Government (2004) ..... 3-11
Figure 3-8: Expenditure on MW&RP services per capita – Local Government plus Business Sector (2004) ........................................................................................................................ 3-12
Figure 3-9: Municipal Solid Waste Generated per capita per year ...................................... 3-25
Figure 3-10: Distribution of waste-related activities in various countries ........................... 3-26
THE ANALYSYS OF THE POTENTIAL OF MATERIAL AND ENERGY RECOVERY OF MUNICIPAL WASTE IN CANADA
XV
Figure 3-11: Distribution of waste-related activities in selected countries .......................... 3-26
Figure 4-1: Base Case - Current Canadian Emissions from Landfill .................................. 4-17
Figure 4-2: Best Case - All Landfill Sites Capture Methane ............................................... 4-17
Figure 4-3: Restoration Layer is applied to all Landfills ..................................................... 4-18
Figure 4-4: Comparison of Emissions for three (3) Landfill Scenarios ............................... 4-18
Figure 4-5: GHG Flux of landfill vs. incineration of unsorted MW&RP ............................ 4-37
Figure 4-6: GHG flux of Paper & cardboard ....................................................................... 4-39
Figure 4-7: GHG flux of Yard Trimmings .......................................................................... 4-39
Figure 4-8: GHG Flux of Food Scraps ................................................................................ 4-40
Figure 5-1: Comparison of the various scenarios .................................................................. 5-6
Figure 5-2: GHG Flux of landfill vs. incineration of unsorted MW&RP .............................. 5-6
THE ANALYSYS OF THE POTENTIAL OF MATERIAL AND ENERGY RECOVERY OF MUNICIPAL WASTE IN CANADA
XVI
LIST OF TABLES
Table 2-1: Effects of Bag Limits and Unit Pricing on Material Recycled and Waste Disposed in Six Canadian Municipalities ............................................................................................ 2-11
Table 2-2: Typical composition of municipal solid wastes from high and low income countries ............................................................................................................................... 2-25
Table 2-3: Composition and heating value of MSW ........................................................... 2-25
Table 2-4: Characteristics of the waste feedstocks (dry mass basis) ................................... 2-25
Table 2-5: Comparison of Austrian and UK W&RP data ................................................... 2-26
Table 2-6: Comparison of heavy metal data by fraction ...................................................... 2-26
Table 2-7: MW&RP conversion processes .......................................................................... 2-27
Table 2-8: Atmospheric releases of dioxins and furans by source, 1999 ............................ 2-32
Table 2-9: Contaminant presence in the gas and relative problems .................................... 2-33
Table 2-10: Percentage distribution of pollutants in incineration ........................................ 2-38
Table 2-11: A comparison of UK (best practice) and European mean WRPtE incineration emissions and percentage improvement over UK 1991 performance ................................. 2-38
Table 2-12: Effect of gasifying agent on producer gas quality ............................................ 2-41
Table 2-13: Gas quality requirements/energy recovery system ........................................... 2-41
Table 2-14: Fuel gas contaminants: problems and cleanup processes ................................. 2-42
Table 2-15: Advantages and disadvantages of tar removal systems .................................... 2-42
Table 2-16: Projected Emission data for Plasco Energy ...................................................... 2-48
Table 2-17: Collection of landfill gas .................................................................................. 2-50
Table 2-18: Conversion efficiency of electricity generation processes ............................... 2-52
Table 3-1: Population across Canada ..................................................................................... 3-3
Table 3-2: W&RP generated and diverted by province and territory .................................. 3-11
Table 3-3: State of WRPtE around the world ...................................................................... 3-27
Table 4-1: Degradable Organic Carbon in MW&RP Comparison ........................................ 4-4
Table 4-2: CH4 generated from landfills in Canada comparing methods of calculation ...... 4-4
Table 4-3: Composition of MW&RP in Canada and heating value ...................................... 4-5
Table 4-4: Electricity production share - GHG emissions by source .................................... 4-6
Table 4-5: Vehicle type assumptions ..................................................................................... 4-6
Table 4-6: Mobilisation Emissions for W&RP ...................................................................... 4-9
Table 4-7: Scenario information .......................................................................................... 4-12
THE ANALYSYS OF THE POTENTIAL OF MATERIAL AND ENERGY RECOVERY OF MUNICIPAL WASTE IN CANADA
XVII
Table 4-8: Base Case – Estimates of short-cycle carbon dioxide and methane generated from landfilled waste .................................................................................................................... 4-14
Table 4-9: Base Case – Estimates of CO2 and methane released from landfill waste and electricity generated from landfill gas ................................................................................. 4-15
Table 4-10: Landfill Net GHG Emissions with Sensitivity Analysis (kg CO2eq/t material treated) ................................................................................................................................. 4-16
Table 4-11: Incineration of MW&RP – emissions .............................................................. 4-20
Table 4-12: Incineration Net GHG Emissions – No energy recovery (kg CO2eq/t material treated) ................................................................................................................................. 4-21
Table 4-13: Incineration Net GHG Emissions – Various energy recovery (kg CO2eq/t material treated) ................................................................................................................... 4-22
Table 4-14: Potential greenhouse gas emissions avoided in fertiliser manufacture if compost displaces mineral fertiliser. .................................................................................................. 4-24
Table 4-15: Estimates of carbon dioxide released during composting and over subsequent 100-years after use of compost as soil conditioner. ............................................................. 4-25
Table 4-16: Emission factors for wastes processed through composting (kg CO2eq/t material treated). ................................................................................................................................ 4-26
Table 4-17: Table: Avoided emissions from AD ................................................................. 4-27
Table 4-18: Emission factors for waste & recoverable products processed through AD (kg CO2eq/t material treated) ..................................................................................................... 4-29
Table 4-19: Recycling - Avoided Energy and Materials - Summary .................................. 4-30
Table 4-20: Emission factors for recycling (kg CO2eq/t material treated) ......................... 4-32
Table 4-21: Summary of net GHG flux for the components of MW&RP (kg CO2eq/ton) 4-34
Table 4-22: GHG Summary - Base Case ............................................................................. 4-43
Table 4-23: GHG Summary - Maximum diversion ............................................................. 4-44
Table 4-24: GHG Summary - Maximum WRPtE................................................................ 4-45
Table 4-25: GHG Summary - Optimised Waste-Related Management .............................. 4-46
Table 4-26: GHG Summary - Diversion x2, WRPtE x2 ..................................................... 4-47
Table 4-27: GHG Summary - Diversion +20%, WRPtE 50% ............................................ 4-48
Table 4-28: GHG Summary – Maximum landfill................................................................ 4-49
Table 4-29: Summary of GHG flux for four scenarios ........................................................ 4–50
Table 5-1: Theoretical residual waste .................................................................................... 5-7
Table 5-2: Responsibility of the various governments in W&RP ....................................... 5–10

THE ANALYSYS OF THE POTENTIAL OF MATERIAL AND ENERGY RECOVERY OF MUNICIPAL WASTE IN CANADA
CHAPTER 1: INTRODUCTION
1-1
CHAPTER 1: INTRODUCTION
1.1 Introduction
As economic activity progresses globally, the amenities that westerners have become used to
are being desired by developing countries, and rightfully so. The so called “flattening of the
earth” has allowed for more people around the globe to contribute and profit in the fast
changing global economy. The inevitable consequence is that environmental changes are
occurring at an alarming rate. Resources are being depleted, the ice caps are melting, seas are
rising, and finely balanced ecosystems are suffering devastating and perhaps irreversible
damage. Mother Earth is under siege. All indications point to a continuation of this
destructive trend.
The waste we produce is only a portion of the problem, but it’s a critical indicator of both our
current lifestyle and our detachment from the environment around us.
Consider the history of man and the evolution of waste management [1]. In the beginning,
most waste was organic; hunting and food remains and fecal matter, which had an
insignificant effect on human health and the environment. Nomadic tribes living off the land
would simply relocate when the waste became too excessive. When man began living in
caves, wastes would be piled up at the entrances. The inhabitants could move when and if it
became a problem. Around 9000 BCE, humans started abandoning their nomadic ways for a
more sedentary lifestyle. The change from hunters to farmers and craftsmen increased the
amount of waste generated. The stationary lifestyle also required that waste be transported
away from the habitations. Rules and best practices had started to emerge and hence waste
management was born.
As early as 9000 BCE, waste was being taken away from the settlements in an effort to keep
insects, bacteria and animals away from the people. The Minoans (3000 – 1000 BCE) would
put their waste in a pit and periodically cover it with dirt, which may in fact be the first
landfills. The Bible has instructions on how to manage human waste (Deuteronomy 23:12-
13). Up to this point, wastes were the responsibility of the homeowner. Various laws would
only force inhabitants to dispose of their refuse outside of city boundaries. It was the Romans
however, in 14 CE, who were the first to commission a common workforce for waste
collection.
THE ANALYSYS OF THE POTENTIAL OF MATERIAL AND ENERGY RECOVERY OF MUNICIPAL WASTE IN CANADA
CHAPTER 1: INTRODUCTION
1-2
After the fall of the Roman Empire, Europe fell into a chaos. Knowledge and enforcement of
waste management was lost. For generations Europeans returned to the old habits of dumping
waste in the streets. During this time various laws had been made and revoked to help
remediate the situation with little effect. By the 1800’s London had a waste policy.
Restrictions, laws and penalties were in place to prevent uncontrolled dumping. In 1875, the
London Public Health Act mandated that refuse would be placed in bins in front of the homes
and would be removed on scheduled days by the Sanitary Authority.
Cities around the world faced the same issues as they expanded, and most came to the same
conclusions: Waste needed to be kept off the streets and away from residences. The concept
of waste management was evolving, since collection, transportation and disposal was now
required. This brings us to the system we now know today.
Of significance is the fact that the composition of waste has also evolved over time. Consider
that before great civilizations were formed, most refuse was organic and would decay
naturally. Non-biodegradable products such as tools, containers and jewellery were made to
be durable and useful for a long time. Once industrialization began the activities of mining,
quarrying, construction, demolition, agriculture and extraction, processing and combustion of
fossil fuels produced some non degradable by-products. By the late 1800’s the first
commercial plastics were invented and we have not looked back since.
This is also the point in history humans stopped throwing out only waste. When the
extraction of resources surpassed our needs, we started discarding formerly reusable and
recyclable products. From the industrial revolution on, humans have been increasingly
disposing of Waste & Recoverable Products. We are no longer in an age of “Waste”
management as it has been historically known. Our traditional use of the word Waste needs to
be reviewed. The use of the word implies that a product is no longer useful, and waste is used
to define everything, including recyclables and reusables. This will be reviewed later on in
this Chapter.
Currently, on a global scale, we generate approximately 1.55 billion tons of Municipal Waste
& Recoverable Products (MW&RP) each year [2]. This figure includes, in general, only the
Waste & Recoverable Products (W&RP) that enter the municipal streams (residential,
institutional, commercial and light industry) and excludes those produced and managed
otherwise (e.g. from large industry, mining, agriculture, energy production, some
construction and demolition waste, etc.). Consequently, MW&RP accounts for only a small

THE ANALYSYS OF THE POTENTIAL OF MATERIAL AND ENERGY RECOVERY OF MUNICIPAL WASTE IN CANADA
CHAPTER 1: INTRODUCTION
1-3
portion of the total W&RP generated in a country. Figures ranging from 5% to 26% have
been observed [3], and these can be related to the Gross Domestic Product (GDP) of the
country [4]. It is estimated that the world produces approximately 7.3 billion tons of W&RP
annually. If the rest of the world was as wasteful as North Americans, it is estimated that we
would produce 24.6 billion tons of W&RP.
Today, 49% of the world’s population live in urban centres and the number is much higher in
developed countries (75% to 85%) [5], in addition, the number of megacities (>10,000,000
inhabitants) around the world is growing. In the 1950’s New York was the only one, but in
1985 there were 9, in 2004 it was 19 and in 2005 up to 25. The trend is moving towards
heavy urbanization (75% to 85% of the total population) living in cities. The next generation
is known as hypercities (20 million or more). It is expected that by 2025 Asia alone will have
10 hypercities. These numbers are staggering.
As civilization evolves, the standard of life and the population increases, so will the quantity
of W&RP we generate. Moreover, as a rising number of people start living in dense urban
centers the various W&RP management options will be limited. Today many parts of the
developed world are struggling to gain a proper grasp of their W&RP management issues.
Even in Canada, the existing infrastructures are stretched, landfills are becoming less popular,
transportation is expensive and the impact on climate change is a growing concern.
“The need to develop sustainable waste management strategies and policies is being
recognized on an increasing basis worldwide. For the first time, human activity is sufficiently
great to have a real and recognizable impact on the global environment. Sustainable practices
are becoming an actual requirement rather than simply a theoretical principle.” [6].
So what are the appropriate sustainable waste-related management practices? What are
Canada’s policies regarding waste-related management? What are the environmental impacts
of all this? This thesis will attempt to provide some answers.
This paper is divided into five chapters;
Chapter 1: Introduction
Explains the genesis of waste-related management, proposes a new approach to the definition
of the word waste and explains the methodology used in this paper.
Chapter 2: Waste-Related Management & Energy Recycling

THE ANALYSYS OF THE POTENTIAL OF MATERIAL AND ENERGY RECOVERY OF MUNICIPAL WASTE IN CANADA
CHAPTER 1: INTRODUCTION
1-4
Starting with the historical and traditional approach to waste-related management, the
concepts of sustainable and integrated waste-related management are introduced and the role
of energy recycling in the hierarchy is established. A special focus is given to the current and
future waste-related products to energy technologies and challenges.
Chapter 3: Canadian Sustainable & Integrated Waste-Related Management Policy
Explores the various Canadian policies regarding waste-related management on a national
and provincial scale. The Canadian performance is compared against other developed
countries.
Chapter 4: Greenhouse Gas Emissions from Waste-Related Management
In this chapter a model is developed to estimate the GHG emissions related to various waste-
related management activities. Using this model, seven scenarios with varying degrees of
diversion and energy recycling are analysed for the Canadian environment.
Chapter 5: Conclusions and Recommendations
Summarises the results from the previous chapters and concludes on the sustainability, policy
and GHG emission situation in Canada. Recommendations are made for Canada to achieve
an optimal sustainable and integrated waste-related management scheme.
The initial intent of this paper was to discuss waste-to-energy technologies. However, in the
author’s opinion waste and recoverable products to energy (WRPtE) are only one aspect of
the waste issue and certainly not the only solution. Although integral to the concept of waste-
related management, the importance of WRPtE technologies can only be understood in the
context of the whole integrated system. This paper will discuss the concepts of waste-related
management in detail and describe where WRPtE fits within it, before elaborating on this
topic.
1.2 Background
The United Nations Development Program collects data on the Municipal Waste &
Recoverable Products (MW&RP) generated for countries around the world [7]. Figure 1-1
shows the estimated MW&RP generated. Some adjustments were made since not all
countries reported data [2]. This represents a total in excess of 1.5 billion tons of MW&RP
produced each year. Assuming an average density of 100 kg/m3 [8], this represents almost
15.5 billion m3 of W&RP. Furthermore, consider that if the rest of the world was as wasteful
THE ANALENERGY R
as Nort
MW&R
Althoug
the stor
produce
each re
conside
Figure 1
Figure 1
1
2
3
4
5
6
7
8
W&RP
Gen
erated
(kg/pe
rs)
Construcon and
Demolitio31%
LYSYS OF THERECOVERY OF
th America
RP each yea
gh MW&RP
ry. In Wes
ed (excludin
sident in W
erably larger
-1: Municipa
-2: Waste Pr
675
0
100
200
300
400
500
600
700
800
Mining quarry
24%
ti
on
O
We
E POTENTIAL OF MUNICIPAL W
ans (592 kg
ar, enough to
P is a valid
stern Europ
ng agricultu
WE is respo
r than 565 k
al W&RP gen
roduced in W
592565
Energy Production
4%
and ying%
Other2%
estern Euro
OF MATERIAL AWASTE IN CAN
g/capita), w
o cover the
measure us
pe (WE) M
ural W&RP
onsible, on a
kg/person no
nerated per p
Western Europ
411
345
MunicipaSolid Waste14%
IndW2
ope
Sour
AND NADA
1-5
e would pr
country of
sed to comp
MW&RP acc
P), see Figur
average, for
oted in Figu
person around
pe (left) and i
274248
al
dustrial Waste25% Oil
Forestr14%
M
rce: [3]
roduce appr
Taiwan in o
pare wastefu
counts for
re 1-2 [3].
r 3.8 tons o
ure 1-1.
d the world (2
in Alberta, Ca
8214
16
& Gas; 23%
y;
Municipal Solid Waste; 13%
Al
CHA
roximately
one (1) met
ulness, it is o
only 14%
If we inclu
of W&RP g
2002)
anada (right)
2122
7
Hazardous; 1%
lberta, Cana
Total W&RP: 2
APTER 1: INTRO
3.7 billion
er of garbag
only a smal
of the tota
uded the oth
generated a
)
71 70
Agricul; 49
ada
26.4 million tons
Source:
Sou
ODUCTION
tons of
ge.
ll part of
al waste
her 86%,
annually,
68
ltural9%
s (2004)
: [2]
urce: [9]
THE ANALENERGY R
The WE
account
Alberta
the agr
MW&R
produci
much in
than We
At the
differen
more in
Almost
reader a
Figure 1
The las
excludi
within t
account
billion
was as
would b
Luckily
Constructn and
Demolitio2%
LYSYS OF THERECOVERY OF
E figures co
ts for 13%
a’s totals). T
iculture com
RP would re
ing 4.2 tons
ndustry as W
estern Euro
other end
nt tale. Ther
n total than f
half the wa
an indicatio
-3: Waste Pr
st three fig
ng agricultu
these count
ts for only
tons of W&
wasteful as
be generated
y, this is not
Mininquar
47
tio
onOth22%
Centra
E POTENTIAL OF MUNICIPAL W
oincide wel
% of the to
This means
mponent is
epresent 26
s of W&RP
Western Eur
opeans.
of the spec
re, each per
for Western
aste generat
n of the typ
roduced in Ce
gures have
ural W&RP
tries. That s
15% of th
&RP annual
s North Am
d per year, e
t the case...y
EnerProduc
9%
ng and rrying7%
er%
l and Easte
OF MATERIAL AWASTE IN CAN
ll with the
otal, Figure
that each A
s removed
6% of the to
P per year.
ropeans hav
ctrum, in C
rson is resp
n Europe, on
ted in CEE
pe of regiona
entral and Ea
shown tha
P, and these
said, if we
e total, it s
lly. Followi
merica the n
enough to c
yet.
rgy ction%
MunicipaSolid Waste5%
InW
rn Europe
Sou
AND NADA
1-6
province of
1-2 (howe
Albertan is
from the e
otal mix an
This tends
ve or Albert
Central & E
ponsible for
nly 5% of th
is from the
al economy
astern Europ
at MW&RP
e figures se
assume tha
seems that
ing the sam
numbers are
cover Taiwa
al
dustrial Waste15%
rce: [3]
f Alberta in
ever agricu
responsible
equation (to
nd each resi
s to imply t
tans generat
Eastern Eur
4.4 tons pe
his account
e mining an
y.
e
P account f
eem to be l
at MW&RP
in reality w
me logic as a
e staggering
an in seven
CHA
n Canada [9
ultural W&
e for 8,251 k
o compare w
dent would
that Alberta
te much mo
rope (CEE)
er year of w
s for MW&
nd quarrying
for 5% to
inked to th
P in most d
we produce
above, if th
g. 24.6 billi
(7) meters o
APTER 1: INTRO
9], where M
&RP is incl
kg/yr of W
with WE),
d be respons
ans do not
ore municip
) the figure
waste [3]. A
&RP [3], Fig
g sector, gi
26% of th
he type of e
developed c
approxima
he rest of th
ion tons of
of garbage.
ODUCTION
MW&RP
luded in
W&RP. If
Alberta
sible for
have as
al waste
es tell a
Although
gure 1-3.
ving the
he total,
economy
countries
ately 7.3
he world
f W&RP

THE ANALENERGY R
Althoug
any div
not con
Howeve
the wor
24% of
compar
These n
divertin
landfill
million
materia
residues
74% of
recyclab
Figure 1
To mak
despite
up by a
report s
more W
Another
end up
What is
Wood
O
Total Dis(79% of
LYSYS OF THERECOVERY OF
gh shocking
version effor
nsidered in t
er, it is clea
rld and rece
f its W&RP
red to the EU
numbers on
ng W&RP?
or incinera
tons (21%)
al that was
s and the re
f the MW&
ble. There i
-4: MW&RP
ke matters w
increasing
approximate
suggests tha
W&RP.
r study esti
as usable p
s not transfo
d; 8%
rganics; 28%
Other; 18%
MW&RP
sposed: 24.1 milltotal generated
E POTENTIAL OF MUNICIPAL W
g, these num
rts. Since di
the above ca
ar from Figu
ent figures s
P generated
U-25 39% (
nly show w
In Canada,
ated in 200
) were diver
sent for dis
emaining 26
RP sent for
is much roo
P sent for disp
worse, the
diversion e
ely 54% bet
at this trend
imated that
products [15
ormed is “w
Disposed in(2002)
lion tonsin 2002)
OF MATERIAL AWASTE IN CAN
mbers repre
iversion fig
alculations.
ure 1-1 that
show that o
d from lan
(2004) [12].
what was a
, Figure 1-4
02. Out of
rted from la
sposal, 46%
6% can be c
r disposal (l
m for impro
posal in Cana
amount of
efforts. Acco
tween 1980
is slowing
each year
5]. Of this,
waste” in on
Paper; 29%
Meta
Glas
Plastics; 9%
n Canada
Sourc
AND NADA
1-7
esent total g
gures vary g
These elem
t North Am
our diversio
ndfill in 200
.
actually ach
4 shows the
30.7 millio
andfill eithe
% is conside
classified as
landfill or i
ovement.
ada (2002)
W&RP be
ording to th
and 2000 i
down, the p
only 6% of
only 1% a
ne form or a
%
als; 5%
s; 3%
ce: [13]
generated W
greatly depe
ments will b
mericans are
n efforts ar
04 [10] an
hieved, but
distribution
on tons of M
er by recycli
ered recycla
s non-recov
incineration
ing generat
he OECD (2
in OECD co
point remain
f all raw ma
ctually end
another. Wh
CHA
W&RP and
ending on th
be discussed
amongst th
re fairly poo
nd the USA
what abou
n of MW&R
MW&RP g
ing or comp
able, 28% i
verable matt
n) in 2002 w
ted (per cap
2004) MW&
ountries [14
ns that we c
aterials con
ds up as dur
hen consider
APTER 1: INTRO
do not acc
he country,
d later in Ch
he most wa
or. Canada
A 33% (200
ut the poten
RP that was
generated, o
posting [13]
is kitchen a
ter. This me
was compos
pita) is on
&RP produ
4]. Even tho
continue to g
nsumed in t
rable produc
ring that 99
ODUCTION
ount for
they are
hapter 3.
steful in
diverted
06) [11]
ntial for
s sent to
only 6.6
]. Of the
and yard
eans that
stable or
the rise,
uced was
ough the
generate
the USA
cts [16].
9% of all
THE ANALYSYS OF THE POTENTIAL OF MATERIAL AND ENERGY RECOVERY OF MUNICIPAL WASTE IN CANADA
CHAPTER 1: INTRODUCTION
1-8
raw materials used are wasted in an economy the size of the United States, the magnitude of
the problem becomes clear. [17].
In the Canadian example above, of the 30.7 million tons generated in 2002; 0.7 were
incinerated, 1.6 were exported to the US and 21.8 were landfilled, most of which was
recoverable [10]. Three things are very troubling about these statistics;
• First, only 21% of the potentially 80% recoverable materials were diverted from
disposal,
• Second, a country such as Canada with large amounts of land, still finds a need to
export 5% of its W&RP,
• Thirdly, 97% of W&RP disposal was buried in the ground.
As a nation that prides itself on its natural beauty, Canada cannot be proud of this
performance.
What this analysis reveals:
• The developed world generates too much W&RP,
• This trend is rising (the developing world is adopting our bad habits),
• We send the majority of recoverable materials for disposal,
• We still believe that a landfill is an acceptable solution for W&RP disposal.
Something needs to be done. The purpose of this paper is to identify what are the best
practices in general, with a focus on the Canadian situation.
Let’s begin with our current, misuse of the word waste.
1.3 Definitions
This section explores and defines the key terms used in this paper. Special focus is given to
the definition of waste as it is fundamental to any discussion on the topic.
1.3.1 Waste – Uses of the word
What is the definition of waste? The dictionary defines waste as something “regarded or
discarded as worthless or useless”. This seems to fit quite well with our current use and
understanding of the word. Now consider the use of waste in municipal solid waste (MSW).
Does MSW not include recyclables and compostable material? Paper, for example, is not

THE ANALYSYS OF THE POTENTIAL OF MATERIAL AND ENERGY RECOVERY OF MUNICIPAL WASTE IN CANADA
CHAPTER 1: INTRODUCTION
1-9
useless or worthless. On the contrary it is a resource, not a waste. Globally, and certainly in
Canada, the term seems to be applied liberally, arbitrarily and inconsistently.
Perhaps the most widely accepted definition of waste today is that of the Basel Convention
on the Control of Transboundary Movements of Hazardous Wastes and Their Disposal,
which Canada ratified in 1992. It proposes the following; “Wastes are substances or objects
which are disposed of or are intended to be disposed of or are required to be disposed of by
the provisions of national law.” [21].
The United Nations defines municipal waste as follows;
"Municipal waste includes household waste and similar waste. The definition also
includes bulky waste (e.g. white goods, old furniture, mattresses) and yard waste,
leaves, grass clippings, street sweepings, the content of litter containers, and market
cleansing waste, if managed as waste. It includes waste originating from: households,
commerce and trade, small businesses, office buildings and institutions (schools,
hospitals, government buildings). It also includes waste from selected municipal
services, e.g. waste from park and garden maintenance, waste from street cleaning
services (street sweepings, the content of litter containers, market cleansing waste), if
managed as waste. The definition excludes waste from municipal sewage network and
treatment, municipal construction and demolition waste."
Another example is Environment Canada, which refers to municipal solid waste as;
“recyclables and compostable materials, as well as garbage from homes, businesses,
institutions, and construction and demolition sites” [22].
The EU Waste Framework Directive (European Directive 2006/12/EC) defines waste as;
"Any substance or object the holder discards, intends to discard or is required to discard"
[23]. This implies anything that is thrown out, including recoverable materials.
In all these examples, waste is used to describe both unusable and recoverable materials. The
appropriate definition of the word waste should mean only materials that are useless. Clearly
the word waste is being applied inappropriately in our every day terminology.
CEPA the Canadian Environmental Protection Act on the other hand, bases itself on the
Basel Convection but clarifies that; "Waste means any material that is disposed, destined for
disposal, or is required to be disposed, and does not include recyclable material or any
THE ANALYSYS OF THE POTENTIAL OF MATERIAL AND ENERGY RECOVERY OF MUNICIPAL WASTE IN CANADA
CHAPTER 1: INTRODUCTION
1-10
material used for its original purpose” [24]. It’s troubling, that many other Canadian
publications still include recyclables within their description of waste.
Our current misuse of the word may be contributing to our wasteful habits. Consider that
many publications refer to materials that are recovered as diverted waste. There are two
major problems with this;
• Firstly, it reinforces the concept that everything we choose to get rid of is
automatically waste. Something that is recoverable should never be referred to as a
waste, since it precludes that it is useless.
• Secondly, it promotes the perception that not sending waste for disposal is a positive.
Whereas the opposite should be our goal – preventing recoverables from being
disposed.
Hence, diverted waste could be referred to as recovered recyclables, for example. It is a
nuance but consider the impact of using the term disposed recyclables for recoverable
materials sent for disposal and hence a negative thing. It is far more representative of what is
taking place, and is an important step towards our next stage of waste & recoverable products
management.
For all the examples above, additional definitions are provided for recyclables, diverted
materials, compostable and recoverable materials to name a few, but they are still defined as
waste at the outset.
Many critics believe that this is a part of the problem. Pongrácz and Pohjola [25] write that
the current definition of waste at the European Union level is inappropriate and actually
prevents the EU from attaining a sustainable waste management structure. They argue that
current legislative definitions of waste dictate the manner in which waste must be handled.
And although the European legislations are there to monitor and control the safe de-evolution
of waste, they can in many cases inhibit recyclables, compostable and potentially hazardous
materials, from their optimum treatment, simply because they are labelled waste. They
continue to say;
“By accepting that the way waste is described, prescribes the way it is handled; waste
related activities need to be based on radical new waste definitions: Purpose
readjustment without Structure manipulation to make Performance satisfactory, or
readjustment of Structure by accepting current Purpose. Waste management can now

THE ANALYSYS OF THE POTENTIAL OF MATERIAL AND ENERGY RECOVERY OF MUNICIPAL WASTE IN CANADA
CHAPTER 1: INTRODUCTION
1-11
be defined as control of waste-related activities with the aim of protecting the
environment and human health, and encouraging resource conservation.”
This alters mainly the perception one must have towards waste management in a sustainable
context, and will be explored later in this paper. The point is that if something is labelled
waste, then it is assumed (intentional or not) that it is destined for disposal.
It is clear that the word waste can be improperly used and needs to be applied with purpose.
1.3.2 Waste-Related Definitions
Some of the current definitions used in waste management are prohibitive to the development
of a sustainable system. More importantly, using improper definitions dilutes the focus and
impact of this paper. The following intuitive definitions will be used throughout this paper.
Waste has been defined by other experts on the topic as: “a man-made thing, which in a given
time and place, in its actual Structure and State, is not useful to its owner, or an output that
does not have any owner.” [25]. In this case, the concept of ownership is quite important.
However, for simplicity the following definition will be used;
Unrecoverable Materials or Waste: materials that cannot be reused for any other means, in
other words residual waste.
Waste & Recoverable Products (W&RP): All that is the by-product of a process or activity
and refers to both recoverable materials and residual waste. This consciously includes all
materials and is used instead of the traditional term waste. For example, agriculture waste &
recoverable products (instead of agricultural waste) or waste & recoverable products
generated (instead of waste generated).
Waste-related products or activities: is used synonymously with waste & recoverable
products.
Municipal Waste & Recoverable Products (MW&RP): Formally known as Municipal Solid
Waste (MSW) or municipal waste. The definition for MW&RP is the same as MSW, but the
name is revised to be more accurate. MW&RP refers to waste and recoverable products
collected by or on behalf of municipalities as well as those collected by the private sector.
MW&RP includes household, industrial, commercial and institutional waste, recyclables,
compostable and recoverable materials that enter the municipal streams (may also include
construction and demolition). The waste and recoverable products managed onsite and
THE ANALYSYS OF THE POTENTIAL OF MATERIAL AND ENERGY RECOVERY OF MUNICIPAL WASTE IN CANADA
CHAPTER 1: INTRODUCTION
1-12
privately are not included, such as: agricultural, large industry, mining, quarrying, energy
production, etc.
Waste-Related Management: The management of waste-related activities, which includes:
public education, collection, transport, material recovery and residual waste disposal (for as
long as the material is still considered waste).
Sustainable & Integrated Waste-Related Management (SIWRM): waste-related management
practices that protect human health and the environment by meeting the needs of today,
without compromising the ability of future generations to meet their own needs (adapted
from The World Commission on Environment and Development, Brundtland Commission
1987).
1.4 Methodology
The following section is a brief description of the methodology used to research for and write
this paper.
1.4.1 Literature Review
The present paper is mainly a literary review of previously published papers, articles, reports,
websites, books, etc. However, Chapter 4 develops and discusses a model used to estimate
GHG emissions; the methodology used is explained there. The purpose of this paper is to
analytically review the topic of waste-related activities, in particular the context of
sustainability, waste & recoverable products to energy (WRPtE) technologies and policy. All
information referred to is properly referenced at the end of this paper.
1.4.2 Basis for Comparison
Throughout this paper, information is analyzed and compared in order to draw educated
conclusions on waste-related activities in Canada and the world. As is often the case, there
are discrepancies between the data from independent studies. Within the context of waste-
related information the differences are even more pronounced [26].
As a matter of comparison, Statistics Canadai reported that in 2004 Canadians generated an
average 1,037 kg/person of Municipal Waste & Recoverable Products (MW&RP) [27].
i Statistics Canada is the national body responsible for Canadian Statistics

THE ANALYSYS OF THE POTENTIAL OF MATERIAL AND ENERGY RECOVERY OF MUNICIPAL WASTE IN CANADA
CHAPTER 1: INTRODUCTION
1-13
Another figure based on the OECD Environmental Data Compendium: 2002 places Canada
at 640 kg/person per year [28]. A third compilation from The United Nations Statistics
Division places Canada at 423 kg/person [7], using Statistics Canada information.
Why are these numbers so drastically different? At first let’s compare the definitions of
“municipal waste”. All three use the definitionii of MW&RP as stated in the previous section
as a baseline, except that Statistics Canada includes construction and demolition waste-
related products whereas the others do not. In the UN report, it is unclear if recoverable
materials are excluded. With regard to the age of the data, the OECD Compendium
information is based on Canadian data from the 1990’s, whereas the other two are from 2004.
Hence it could be argued that the Statistics Canada data is higher since it includes
construction and demolition waste-related products. By removing this content, the numbers
would be closer to the OECD information. However, the actual contribution of this sector to
the W&RP is unclear. As for the OECD information, it could easily be out of date and
unusable. Finally for the UN figures, if construction and demolition products are excluded, as
well as recovered materials then the figures may match up with the ones from Statistics
Canada of the same year, however this is not clear.
This is just an example of the issues facing this industry. Information is scattered, definitions
are inconsistent, which consequently impacts the conclusions. On the other hand, this
ii Statistics Canada: Includes residential and not‐residential waste “Residential waste includes solid waste from residential sources, which includes all households, and includes waste that is picked up by the municipality (either using its own staff or through contracting firms) and waste from residential sources that is taken by the generator to depots, transfer stations and disposal facilities. Non‐residential waste includes municipal solid non‐hazardous waste generated by industrial, commercial and institutional sources as well as waste generated by construction and demolition activities.
OECD Compendium: “Municipal waste is waste collected by or on the order of municipalities. It includes waste originating from households, commercial activities, office buildings, institutions such as schools and government buildings, and small businesses that dispose of waste at the same facilities used for municipally collected waste. Household waste is waste generated by the domestic activity of households. It includes garbage, bulky waste and separately collected waste. National definitions may differ. Amounts per capita are rounded.”
United Nations: "Municipal waste includes household waste and similar waste. The definition also includes bulky waste (e.g. white goods, old furniture, mattresses) and yard waste, leaves, grass clippings, street sweepings, the content of litter containers, and market cleansing waste, if managed as waste. It includes waste originating from: households, commerce and trade, small businesses, office buildings and institutions (schools, hospitals, government buildings). It also includes waste from selected municipal services, e.g. waste from park and garden maintenance, waste from street cleaning services (street sweepings, the content of litter containers, market cleansing waste), if managed as waste. The definition excludes waste from municipal sewage network and treatment, municipal construction and demolition waste."

THE ANALYSYS OF THE POTENTIAL OF MATERIAL AND ENERGY RECOVERY OF MUNICIPAL WASTE IN CANADA
CHAPTER 1: INTRODUCTION
1-14
example shows that with a little reasoning, the differences can be explained to a certain
degree. But the point remains that finding the exact information is not easy. Even within
Canadian data, things are contradictory and often hard to confirm. Municipal, provincial and
national reports can differ by large amounts, depending on the method of measure used.
Fortunately the purpose of this paper is not to qualify the accuracy of this data and the
conclusions do not hinge on their precision. The figures and tables used here are for
comparative and discussion purposes. Whenever possible, the same source will be used as a
consistent means for comparison and in all cases, the assumptions made and context of the
information is elaborated.
1.5 Summary
The following chapters are intended to elaborate on the topics of sustainable & integrated
waste-related management, waste-related products to energy technology, and Canadian
waste-related policy and greenhouse gas emission associated with waster-related activities.
Ultimately, this paper will demonstrate how Canada compares to other countries in this field,
what their potential for diversion is and the associated greenhouse gas emissions for various
scenarios. Subsequently, recommendations are made to help Canada establish targets and
policies towards a sustainable future.
THE ANALYSYS OF THE POTENTIAL OF MATERIAL AND ENERGY RECOVERY OF MUNICIPAL WASTE IN CANADA
CHAPTER 2: SUSTAINABLE AND INTEGRATED WASTE RELATED MANAGEMENT
2-1
CHAPTER 2: SUSTAINABLE AND INTEGRATED WASTE RELATED MANAGEMENT
2.1 Introduction
Waste-related management is a very broad topic with many components and avenues to
explore. The concepts and goals have changed over time, mainly out of need, to address new
types of waste-related products and increasing volumes. In general the prime movers in this
field have been financial and health related side effects.
Today, the environment is of growing concern and traditional waste-related management
systems are inadequate. To address these needs the concept of Sustainable & Integrated
Waste-Related Management (SIWRM) is explored. SIWRM is the implementation of waste-
related management practices that protect human health and the environment by meeting the
needs of today, without compromising the ability of future generations to meet their own
needs. The first part of this Chapter will deal with this.
The second part of this Chapter investigates the role of energy recycling or Waste-Related
Products to Energy (WRPtE) in the SIWRM scheme. Although not desirable, the reality is
that we currently and for the foreseeable future require the permanent disposal of some Waste
& Recoverable Products (W&RP). Since it is the most environmentally questionable element
of any waste-related management strategy it deserves special attention. Therefore a large
portion of this Chapter is dedicated to exploring the various disposal and energy recycling
strategies and technologies.
The main goals of this Chapter are for the reader to understand why sustainable & integrated
waste-related management is important and the role that energy recycling plays in all this.
2.2 Current Waste-Related Management Systems
2.2.1 A brief History
The activities of waste-related management were started as early as 9000 BCE with the rise
of the great Mesopotamia and Egyptian civilizations. It was recognized that waste was a
growing concern in urban centers. Dumps were created away from the settlements in an effort
to keep animals, insects and bacteria from the people. Even in 14 CE, the Romans
commissioned a common workforce to collect and transport the waste, which had previously
been done by the inhabitants themselves [1].
THE ANALYSYS OF THE POTENTIAL OF MATERIAL AND ENERGY RECOVERY OF MUNICIPAL WASTE IN CANADA
CHAPTER 2: SUSTAINABLE AND INTEGRATED WASTE RELATED MANAGEMENT
2-2
Over the years, waste management followed the rise and fall of great empires and cities. It
has been an issue since man has roamed the earth. Nomadic tribes would live on a piece of
land until the waste built up and would then move to another location. These practices had
little environmental effects since the waste generated was generally biodegradable, reusable
or recyclable [29].
Up until the industrial revolution, reuse and recycling of products was commonplace. Before
this time, materials were more difficult to obtain than labour, hence items were built to last,
conserved, repaired and reused as much as possible. In the UK at the time, the main wastes
generated were ash from fires, wood, bones, bodies and vegetable waste. These were
routinely composted or tilled back into the soil. With the industrial revolution, machinery
made it possible to extract much more raw materials than required, which subsequently led to
the wasteful use of resources and reduced reuse [29]. This can be considered as the turning
point from waste activities to waste-related activities.
Next, the discovery of oil enabled humanity to create a myriad of wonderful synthetic
products such as plastics, lubricants, wax, ink, crayons, bubble gum, dishwashing liquids,
deodorant, eyeglasses, records, tires, ammonia, heart valves, etc. The combination of these
non-renewable products with our increasingly wasteful habits created problems for disposal.
The generation of non-reusable waste in growing quantities meant more and larger disposal
facilities.
Throughout the past century, governments have battled to gain control over their waste
management strategies. Most cities that have collection and disposal infrastructure are today
faced with urban sprawl, loss of suitable landfill sites, environmental concerns and public
opinion. To say that these latter factors have contributed to the adoption of the 3R’s (reduce,
reuse and recycle) would not be totally accurate. The waste diversion policies have mostly
been implemented based on material shortages and depletion of waste disposal land [30].
In essence, waste-related management strategies have been developed and modified out of
need, not necessarily due to environmental concern. It should be noted however, that
civilizations have always been aware that resources are precious and that waste is an
undesirable thing. Yet it seems that the extent of the environmental impacts resulting from
our modern activities are only now being quantified and acknowledged.
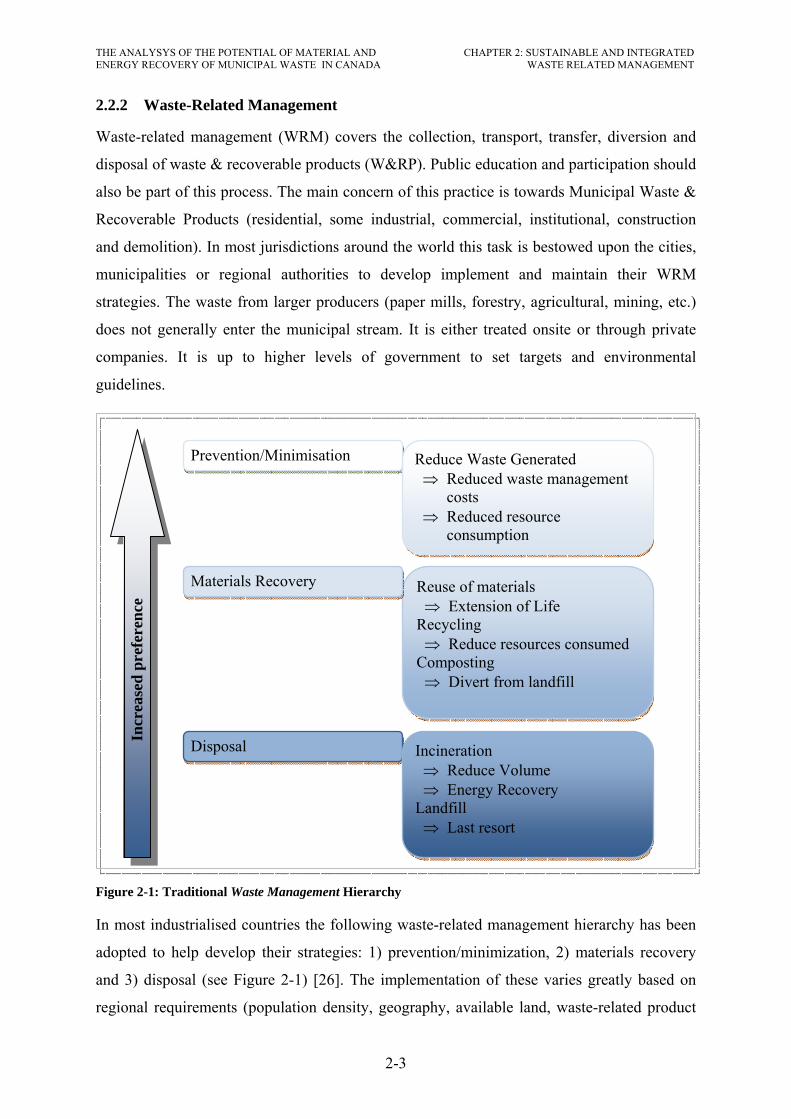
THE ANALYSYS OF THE POTENTIAL OF MATERIAL AND ENERGY RECOVERY OF MUNICIPAL WASTE IN CANADA
CHAPTER 2: SUSTAINABLE AND INTEGRATED WASTE RELATED MANAGEMENT
2-3
2.2.2 Waste-Related Management
Waste-related management (WRM) covers the collection, transport, transfer, diversion and
disposal of waste & recoverable products (W&RP). Public education and participation should
also be part of this process. The main concern of this practice is towards Municipal Waste &
Recoverable Products (residential, some industrial, commercial, institutional, construction
and demolition). In most jurisdictions around the world this task is bestowed upon the cities,
municipalities or regional authorities to develop implement and maintain their WRM
strategies. The waste from larger producers (paper mills, forestry, agricultural, mining, etc.)
does not generally enter the municipal stream. It is either treated onsite or through private
companies. It is up to higher levels of government to set targets and environmental
guidelines.
Figure 2-1: Traditional Waste Management Hierarchy
In most industrialised countries the following waste-related management hierarchy has been
adopted to help develop their strategies: 1) prevention/minimization, 2) materials recovery
and 3) disposal (see Figure 2-1) [26]. The implementation of these varies greatly based on
regional requirements (population density, geography, available land, waste-related product
Prevention/Minimisation
Incr
ease
d pr
efer
ence
Reuse of materials ⇒ Extension of Life
Recycling ⇒ Reduce resources consumed
Composting ⇒ Divert from landfill
Materials Recovery
Disposal
Reduce Waste Generated ⇒ Reduced waste management
costs ⇒ Reduced resource
consumption
Incineration ⇒ Reduce Volume ⇒ Energy Recovery
Landfill ⇒ Last resort

THE ANALYSYS OF THE POTENTIAL OF MATERIAL AND ENERGY RECOVERY OF MUNICIPAL WASTE IN CANADA
CHAPTER 2: SUSTAINABLE AND INTEGRATED WASTE RELATED MANAGEMENT
2-4
characteristics, etc.) but the basic concept remains the same. One of the big regional
differences is of course, the definition of waste-related activities [26]. As discussed in the
previous chapter, definition is everything, and it is in fact a major hurdle with regard to
accurate data collection, comparing information and achieving a truly sustainable structure.
2.2.2.1 Prevention/Minimization
The first step in any waste management strategy is to reduce the W&RP being produced.
Ever since the Community Strategy for Waste Management (SEC (89) 934) was adopted in
the EU, prevention and minimization has been at the top of the priority list in Europe [31].
Reducing the W&RP generated, reduces handling and management costs for the
municipalities [26]. This is mainly achieved by the higher levels of government involvement
targeting the manufacturing sectors.
An example of this is the Extended Producer Responsibility (EPR) concept, where the
producers assume full responsibility for disposing the packaging of their products.
Consequently, the jurisdictions do not assume the bill. In Canada, the National Packaging
Protocol asked the producers to reduce their packaging by 50% from 1990 to 2000, on a
voluntary basis with successful results [32].
2.2.2.2 Material Recovery
The concept of material recovery can be further broken into three activities; reuse, recycling
and composting. Reuse and recycling are often used synonymously, but in fact the reuse of a
product implies leaving in its original state. Recycling is better defined as the use of
otherwise waste materials as raw materials for another product.
The reuse of materials is a novel concept since it assumes that a waste-related product is still
useful in its original form. For example, an automobile that is no longer useful by one owner
(for whatever reason) might be exactly what someone else needs. A W&RP for one person
becomes a product for another with very little additional energy and resources. Unfortunately,
for this exchange to have any merit, it’s assumed that products are made in a durable fashion
with quality components, which is not necessarily the case with everything. In this day and
age, it’s often simpler to buy a new car than to try and fix a reused one.
Recycling has been promoted as a means to minimize the use of natural resources and by
doing so the amount of ultimate waste generated is reduced. In general these activities have
been successful in reducing the amount of waste-related products for disposal. However, the

THE ANALYSYS OF THE POTENTIAL OF MATERIAL AND ENERGY RECOVERY OF MUNICIPAL WASTE IN CANADA
CHAPTER 2: SUSTAINABLE AND INTEGRATED WASTE RELATED MANAGEMENT
2-5
efforts have been highly influenced by the fluctuating market for such materials. Entire
recycling programs have been shut down due to lack of infrastructure and funding (Nipawin,
SK, Canada [33]).
About 30% of municipal waste & recoverable products (MW&RP) in developed countries are
organic materials [9, 34], so the potential for diverting these from disposal is huge. Organics
decompose relatively fast and are the main source of methane in a landfill. They can be
composted (aerobic digestion) or processed in an environment without oxygen (anaerobic
digestion) to extract energy. Composting has gained a lot of attention over the recent years as
a cost effective means to divert W&RP from landfill.
2.2.2.3 Disposal
After prevention/minimization and recovery has occurred, the remaining product is in theory
waste. The residual waste has traditionally been sent to either landfill or incineration. This
dates back to early man. Incineration has been developed to reduce the volume and/or
sterilize waste (e.g. hospital). Concerns with air emissions and related health hazards have
forced many governments to instate strict laws on acceptable contaminants released into the
environment. Consequently the incineration process has become, in some cases, cost
prohibitive. However, growing aversion to landfills, lack of land and transport costs are
causing new cleaner technologies to emerge.
2.2.3 Recap of Current Waste-Related Management Systems
Waste-related management has been around for thousands of years. Innovations in the
practice have occurred out of need (e.g. health problems associated with waste in the
proximity of people created central landfills) or financial motivation (e.g. to reduce operating
costs - prevention/minimization and recovery practices divert waste-related materials form
the waste stream). Unfortunately the environmental impacts have not been the primary
drivers of policy changes.
It is important to distinguish that the traditional hierarchy has its merits and typically it’s the
waste-related management system that does not apply the concepts properly. There are three
main items that are commonly misused in many WRM plans or policies [6]:
• First, the hierarchy should be used as a guideline. It is not the law, but many
governments have adopted it as such. The decision makers need to account for local
needs and tailor the concept accordingly [35].
THE ANALYSYS OF THE POTENTIAL OF MATERIAL AND ENERGY RECOVERY OF MUNICIPAL WASTE IN CANADA
CHAPTER 2: SUSTAINABLE AND INTEGRATED WASTE RELATED MANAGEMENT
2-6
• Secondly, the hierarchy is lacking in the area of reducing demand. There is emphasis
on waste prevention/minimization, but the focus is on reducing the quantity of W&RP
produced, without necessarily trying to change the consumption patterns. The
prioritisation needs to be more explicit at the top if any measurable changes are to
occur. Reducing the demand for products is the first step.
• Thirdly, recycling is a measure to divert materials from disposal and hence should be
a last resort. However, recycling seems to take have taken precedence in policy
makers diversion priorities. The role of recycling in the hierarchy needs to be viewed
as a step prior to disposal.
Therefore some changes could be made to the traditional hierarchy in an effort to better
highlight the intentions of a good waste-related management system, especially considering
that environmental impacts are becoming key indicators. Consequently, sustainable practices
must be integrated. Improvements to the hierarchy and the waste-related management
concepts will be discussed in the next section.
2.3 Sustainable and Integrated Waste-Related Management
In the previous section, the traditional waste-related management structures were described.
This need based and financially motivated structure is no longer sufficient. We must move
towards a proactive, Sustainable and Integrated Waste-Related Management (SIWRM)
approach. The waste-related practices must be able to fit within the concept of a sustainable
developmentiii; “Sustainable practices are becoming an actual requirement rather than simply
a theoretical principle. Integrated waste management must be a fundamental part of the policy
built into any strategy for sustainability.” [6].
A truly SIWRM system would minimise environmental impacts and consider all stakeholders
involved and affected by the process and respect economic, social and cultural elements [35].
The following section explores the concept of integrated waste-related management.
iii Sustainable Development: One that "meets the needs of the present generation without compromising the ability of future generations to meet their own needs.” (Brundtland Commission 1987) [27].

THE ANALYSYS OF THE POTENTIAL OF MATERIAL AND ENERGY RECOVERY OF MUNICIPAL WASTE IN CANADA
CHAPTER 2: SUSTAINABLE AND INTEGRATED WASTE RELATED MANAGEMENT
2-7
2.3.1 The Concept
When discussing sustainability in any context, it typically implies looking at the big picture,
or expanding the boundaries of the existing systemiv. The total impacts on the environment,
society and economy of any activity must be considered. In other words, the concept of
applying a life cycle analysis (LCA) model should be used. For example, the cost of
producing an incandescent light bulb should consider the resources and energy consumed and
human and environmental impacts during the entire life of the product including extraction,
production, transportation, operation and disposal. Only in this way then can the true cost of
something be quantified.
To achieve a sustainable waste-related management system, one should consider what is
known as Integrated Waste Management (IWM). IWM is the industry accepted term, but as
discussed previously the term should be modified to Integrated Waste-Relate Management
(IWRM) or sustainable & integrated waste-related management (SIWRM), and will be used
as such henceforth. SIWRM is a holistic approach to the process, in-line with sustainable
development. Decision makers should not simply be concerned with making their existing
waste-related infrastructure more cost effective and environmentally friendly; it requires the
expansion and understanding of the entire W&RP life cycle, and not just solid waste, but all
waste-related products. IWRM is a series of complimentary actions that help reduce the
quantity of waste-related material generated [35].
The United Nations Environmental Programme (UNEP) in 1996 defined integrated waste-
related management as: “a framework of reference for designing and implementing new
waste-related management systems and for analysing and optimising existing systems” [17].
Expanding on this, SIWRM follows the traditional WRM hierarchy (Figure 2-1) but also
considers the “direct impacts (transportation, collection, treatment and disposal of waste) and
indirect impacts (use of waste materials and energy outside the waste management system).”
[36].
Take for example the New Zealand Waste Strategy. They define waste as ‘‘any material,
solid, liquid or gas, that is unwanted and/or unvalued, and discarded or discharged by its
owner’’ [37]. The purpose behind this definition is to allow policy makers the possibility of
integrating all the types of waste streams in their strategies. When treated separately, the total iv A system is a: ‘‘set of interacting units or elements that form an integrated whole intended to perform some function’’ [38].

THE ANALYSYS OF THE POTENTIAL OF MATERIAL AND ENERGY RECOVERY OF MUNICIPAL WASTE IN CANADA
CHAPTER 2: SUSTAINABLE AND INTEGRATED WASTE RELATED MANAGEMENT
2-8
waste produced will be greater. Seadon (2006) writes that with SIWRM, “There is wider
scope for users to fully integrate media, agents and tools to provide a waste management
system that reduces the need for virgin materials, utilizes energy more efficiently, produces
fewer emissions and thus has a lower environmental impact.” [17].
Figure 2-2: Integrated waste-related management system
Waste Prevention By Design
Adapted from: [47]
Industrial Society Landfill
ENVIRONMENT SOCIETAL
SYSTEM
The Creation of Waste
Energy
Raw Materials
Air Water Soil
Emissions to:
Landfill
ENVIRONMENT SOCIETAL
SYSTEM
Role of Waste Prevention
Energy
Raw Materials
Air Water Soil
Emissions to:
Landfill
ENVIRONMENT SOCIETAL
SYSTEM
Role of Integrated Waste-Related Management
Energy
Raw Materials
Air Water Soil
Emissions to:
I W M
Energy Recovery
Materials Recovery
Energy

THE ANALYSYS OF THE POTENTIAL OF MATERIAL AND ENERGY RECOVERY OF MUNICIPAL WASTE IN CANADA
CHAPTER 2: SUSTAINABLE AND INTEGRATED WASTE RELATED MANAGEMENT
2-9
Overall, the concept of integrated waste-related management (as shown in Figure 2-2) is
crucial to sustainable development. Some of the concepts that form an SIWRM system are, in
no particular order, as follows [6], [35]:
• Comprehensive waste-related policies need to consider the social, environmental and
economical impacts of their strategies. The ecological footprint and life cycle analysis
of resources should be at the top of the priority list. The traditional hierarchy needs to
be used as a tool and not a rule.
• A more synergetic approach between consumer needs and market demand in policy
development.
• Education of the public to reduce consumption, purchase durable products and lead a
sustainable lifestyle.
• Increased pressure on the manufacturing industry to design more durable products and
minimal packaging, which enhance reuse and recycling. Design of products should
include life cycle analyses.
• Initiatives to reduce the quantity of waste generated at all levels.
• Capital investment and continuous funding on behalf of the various levels of
government to promote new initiatives.
• Continuous management and operation to implement the SIWRM plans, dynamically
adapt to changing conditions, investigate best available technologies and oversee
private sector service providers.
• Selection of waste & recoverable facility location and available service which do not
discriminate based on racial, ethical, cultural or economic characteristics.
• Processing schemes to include; recycling, putrescible material treatment, energy
recovery from W&RP and sanitary landfills.
2.3.2 Improving the traditional WRM hierarchy
By considering the SIWRM principles, policy makers should be able to develop
comprehensive strategies which will contribute to a sustainable development. The importance
of waste prevention is re-emphasized and expanded to included lifestyle education. Recycling
and disposal are still considered a last resort in the hierarchy.
2.3.2.1 Prevention/Minimisation
At the outset, there needs to be more emphasis on prevention and minimization. Current
strategies have included the Extended Producer Responsibility (EPR) or User-Pay structures,
THE ANALYSYS OF THE POTENTIAL OF MATERIAL AND ENERGY RECOVERY OF MUNICIPAL WASTE IN CANADA
CHAPTER 2: SUSTAINABLE AND INTEGRATED WASTE RELATED MANAGEMENT
2-10
with some success. These tend to minimize packaging and promote sorting. They have
minimal impacts on the consumers’ attitude towards minimizing W&RP. Lifestyle and
consumption habits need to be revisited in addition to EPR and User-Pay systems.
Reducing demand is at the top of the list. The main reason that we currently produce so much
waste is that we choose to consume more than is required. Consider all the frivolities that one
is privileged to enjoy in the developed world. How much is really necessary? An author on
the topic of climate change once said that; to avoid a global collapse of the environment we
would have to lead a lifestyle that is similar to that of the Stone Age [40]. Without going that
far, it is our responsibility to make educated choices about the things we purchase and
consume. Moreover it is the responsibility of our leaders to support and give us direction in
that respect; despite the fact it might go against the economic expansion paradigm we now
follow. Supporting local products is one way to reduce the overall life cycle cost of items.
In terms of prevention, we need to manufacture things that are less wasteful. This means less
packaging, using recycled materials and creating reusable products. In part governments must
set targets and require that manufacturers meet these goals and penalize those who don’t. The
responsibility also falls on the consumer to make educated choices about what they buy.
The durability of the items we create and buy also goes hand in hand with preventing the
waste we produce. It is the consumer that must consider what to buy. But the government
should also participate by enforcing manufacturers to; for example, have minimum warranty
periods on their products. The variations are numerous, but the point is still made:
cooperation is needed between government and consumers.
Consider that if we purchase only what we need, and those items have minimal associated
waste and are durable, then the residual waste should be reduced. However, there will surely
be waste & recoverable products despite our best efforts. In this case, a User-Pay system
should be used to discourage disposing of potential resources. Typically the cost for
MW&RP management is lumped into property taxes, and consequently does not reward
one’s ability to cut waste or to separate recoverable products. Many jurisdictions that have
implemented full or partial pay-as-you-go type systems have seen drastic reductions in the
quantity of waste being sent for disposal and increase in recycling [41]. Table 2-1 displays
the positive effects of a user-pay structure for six Canadian cities. All show reductions in
W&RP sent for disposal and increased diversion.
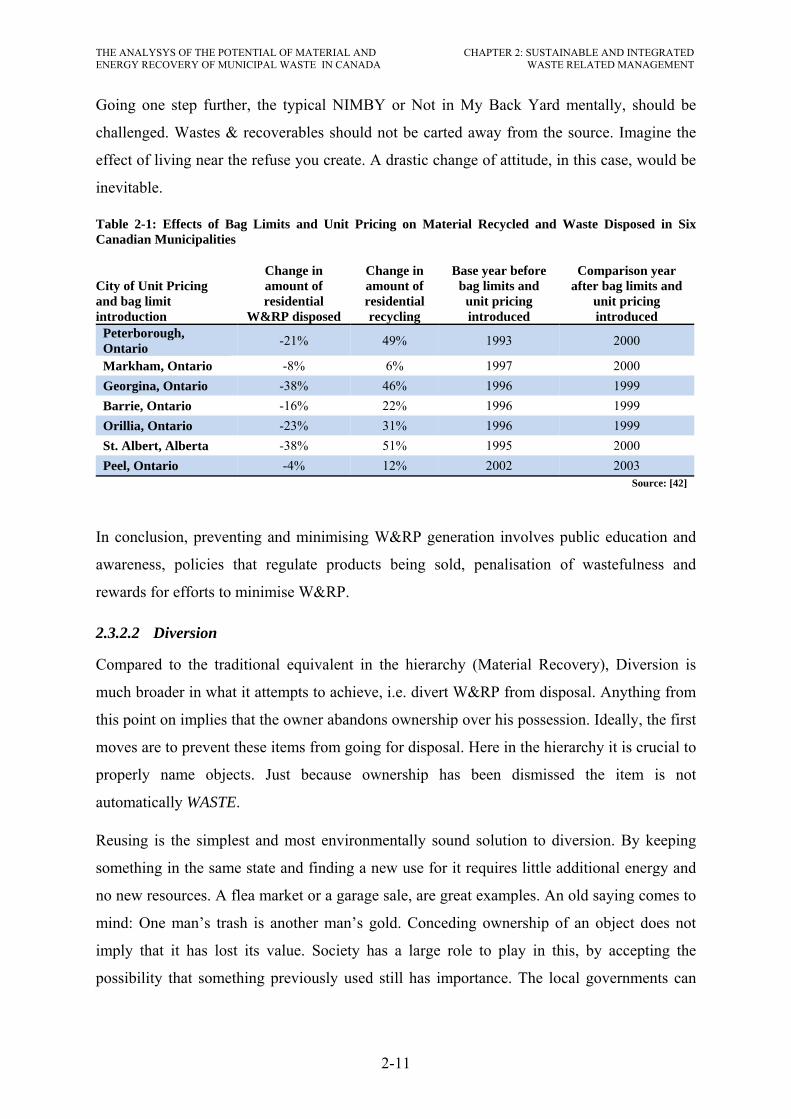
THE ANALYSYS OF THE POTENTIAL OF MATERIAL AND ENERGY RECOVERY OF MUNICIPAL WASTE IN CANADA
CHAPTER 2: SUSTAINABLE AND INTEGRATED WASTE RELATED MANAGEMENT
2-11
Going one step further, the typical NIMBY or Not in My Back Yard mentally, should be
challenged. Wastes & recoverables should not be carted away from the source. Imagine the
effect of living near the refuse you create. A drastic change of attitude, in this case, would be
inevitable.
Table 2-1: Effects of Bag Limits and Unit Pricing on Material Recycled and Waste Disposed in Six Canadian Municipalities
City of Unit Pricing and bag limit introduction
Change in amount of residential
W&RP disposed
Change in amount of residential recycling
Base year before bag limits and
unit pricing introduced
Comparison year after bag limits and
unit pricing introduced
Peterborough, Ontario -21% 49% 1993 2000
Markham, Ontario -8% 6% 1997 2000 Georgina, Ontario -38% 46% 1996 1999 Barrie, Ontario -16% 22% 1996 1999 Orillia, Ontario -23% 31% 1996 1999 St. Albert, Alberta -38% 51% 1995 2000 Peel, Ontario -4% 12% 2002 2003 Source: [42]
In conclusion, preventing and minimising W&RP generation involves public education and
awareness, policies that regulate products being sold, penalisation of wastefulness and
rewards for efforts to minimise W&RP.
2.3.2.2 Diversion
Compared to the traditional equivalent in the hierarchy (Material Recovery), Diversion is
much broader in what it attempts to achieve, i.e. divert W&RP from disposal. Anything from
this point on implies that the owner abandons ownership over his possession. Ideally, the first
moves are to prevent these items from going for disposal. Here in the hierarchy it is crucial to
properly name objects. Just because ownership has been dismissed the item is not
automatically WASTE.
Reusing is the simplest and most environmentally sound solution to diversion. By keeping
something in the same state and finding a new use for it requires little additional energy and
no new resources. A flea market or a garage sale, are great examples. An old saying comes to
mind: One man’s trash is another man’s gold. Conceding ownership of an object does not
imply that it has lost its value. Society has a large role to play in this, by accepting the
possibility that something previously used still has importance. The local governments can

THE ANALYSYS OF THE POTENTIAL OF MATERIAL AND ENERGY RECOVERY OF MUNICIPAL WASTE IN CANADA
CHAPTER 2: SUSTAINABLE AND INTEGRATED WASTE RELATED MANAGEMENT
2-12
help by allowing and making room for flea markets to operate in urban centers where people
can buy, sell and trade their goods.
The next logical steps are to compost and recycle. Although composting is commonly
accepted as “recycling” since the organics are turned into fertilizer, organics represent 1/3 of
our MW&RP stream and hence should be listed as a separate process in the hierarchy. The
traditional breakdown does not draw specific attention to organics, but it is of equal or greater
importance to recycling.
Organics will decompose no matter what. During their decay they will release CO2, methane
and heat so why not capture some energy from this process? This is intuitive; however the
technologies to do so are expensive and must be applied on large scales. Hence, governments
at all levels must step in to support the infrastructure and the technology. If energy recovery
is not possible or does not make sense in a given system, at the very least composting should
be considered if only to minimize the volume of materials being disposed.
As a last method of diversion, recyclables must be removed from discarded goods instead of
being sent for disposal. Ideally materials are reused as opposed to recycled, since it does
require a large amount of energy to sort, transport and convert these into usable raw
materials. Also, recycled materials tend to degrade the more they are recycled, rendering
them eventually unusable. The alternative however, of consuming new resources for the same
product is even more undesirable from a life cycle perspective. The local governments must
provide the collection, sorting and transportation infrastructure and the higher levels of
government must promote and sustain a market to buy recyclables.
At any rate, recycling should be as last resort, before disposal.
2.3.2.3 Disposal
Once a product or material has been rendered unusable, it must then be disposed. Ideally
nothing should make it this far if all the previous steps of the hierarchy are followed. But
alas, unless we revert to the Stone Age, we will always have waste.
The first step would be to extract whatever useful energy is left in the wasted products. The
only items that could be used for this must contain carbon, which would convert to CO2,
methane and heat if left to rot in open air. Instead, if they are placed in a controlled
environment, energy can be extracted. This is known as energy recycling. The advantage of
this is to produce useful energy from something that would otherwise be waste. In addition,

THE ANALYSYS OF THE POTENTIAL OF MATERIAL AND ENERGY RECOVERY OF MUNICIPAL WASTE IN CANADA
CHAPTER 2: SUSTAINABLE AND INTEGRATED WASTE RELATED MANAGEMENT
2-13
GHG’s are controlled before being released into the atmosphere, as opposed to decomposing
outdoors (e.g. landfills). By-products of this energy recycling are typically inert solids,
liquids and flue gases. First, local governments need to assess some of the newer options. The
upper levels of government must implement laws and regulations that allow newer
technologies to be explored, in addition to providing funding for start-up projects.
Landfill is the last resort for wastes. These wastes are buried in the ground where they slowly
decompose.
2.3.2.4 Conclusion of SIWRM
Figure 2-3: Sustainable & Integrated Waste-Related Management Hierarchy
Figure 2-3 is a summary of the recommend sustainable and integrated waste-related
management hierarchy discussed above. Compared to the traditional hierarchy, the preference
flow has been changed. In Figure 2-1, the treatment preference increases from disposal to
prevention. But as discussed in Chapter 1, the mentality that diverting waste is a good thing
as opposed to discarding recoverables being a bad thing needs to change. Therefore it is
Wastes have not been generated yet…prevent it!! Owner has conceded ownership…divert it!! Disposal is unavoidable!!
Prev
entio
n
Dec
reas
ed p
refe
renc
e
Div
ersi
on
Dis
posa
l 9) Thermal WRPtE
10) Landfill
1) Reduce Demand
2) Prevent
3) Durability
4) Minimise
5) Reuse
6) Organics: WRPtE
7) Organics: Compost
8) Recycle
Promote reuse
Invest in infrastructure
Invest in infrastructure / Public education
Develop and support markets
Public education – Sustainable Lifestyle
Extended Producer Responsibility
Increase quality of products
Pay-per-use structure
Invest in new technologies
Last resort
Action Approach

THE ANALYSYS OF THE POTENTIAL OF MATERIAL AND ENERGY RECOVERY OF MUNICIPAL WASTE IN CANADA
CHAPTER 2: SUSTAINABLE AND INTEGRATED WASTE RELATED MANAGEMENT
2-14
proposed that the decision flow be reversed, decreasing in preference as you work down the
hierarchy.
2.3.3 Environmental Concerns
Waste-related management is plagued with environmental concerns. The very concept itself
of ‘waste’ has negative environmental impacts. The following section is a brief description of
some of these.
2.3.3.1 Resource depletion
The first big environmental issue is resource depletion. If we did not have such a
consumption driven attitude, then our resources would be cherished as opposed to ravaged.
The sheer scale at which we extract materials from the ground is staggering. Since our
economies are consumption driven, we continuously exploit new ways to find and extract
more resources, as other sources diminish. The amount of energy spent, the ecosystems
compromised and resources wasted leave unchangeable scars on our planet. So long as we
consume, new materials are required. At which point will there be no more? Is there a limit to
ecological devastation?
In essence, waste-related management must have as a primary goal to minimize the new
resources required, as seen in Figure 2-2.
2.3.3.2 Transportation
The transportation of waste-related products from where it’s generated to a processing site is
part of most waste-related management strategies [43]. Typically people are against having
waste-related facilities near urban centers. So it is easier to transport the products away where
land has always been cheaper.
This mentality however, is changing. Adequately located land is harder to obtain due to urban
sprawl and growing public opposition. Transportation costs are also going up and in some
cases is the most expensive part of a WRM system [45]. The GHG impact is also of concern
and there are additional issues such as potential traffic accidents which put the environment
and public safety at risk.
The role of transportation in a SIWRM system will depend on many factors such as: what is
being collected and how often (this depends on the SIWRM strategy itself) and location
factors such as population density, geography, topography and environmental conditions

THE ANALYSYS OF THE POTENTIAL OF MATERIAL AND ENERGY RECOVERY OF MUNICIPAL WASTE IN CANADA
CHAPTER 2: SUSTAINABLE AND INTEGRATED WASTE RELATED MANAGEMENT
2-15
[45]. For example, in hot climates where unsorted W&RP is being collected, the system may
require more frequent pickups (such as multiple times a week) in order to keep the odours
from decomposing organics to a minimum [43]. Whereas if waste streams are being sorted at
the source and organics composted on site or collected separately, the balance of the waste
and recyclables can be stored and collected once a week or every second week.
From a cost perspective, it can in general be argued that the method used to collect W&RP
(i.e. source separated vs bulk and frequency) does not affect the overall transportation costs
[43]. Assuming that all trucks are filled near capacity, the cost of transporting 10 tons of
mixed W&RP compared to 5 tons of refuse and 5 tons recyclables is relatively the same. Or if
100 tons of W&RP are collected once per week vs. 20 tons per day, the cost per ton is the
same. The same logic can be applied to the other associated environmental and social
implications. The only way to minimize the impacts associated with transportation is to
reduce the quantity transported and the distances required. For example the treatment of
organics at the source (e.g. composting) would reduce the quantity of material being
transported by 1/3.
Materials that can be recycled on the other hand may require transportation over long
distances [47]. Re-processing facilities can be few and far between. Transportation from
collection or sorting facilities to these plants can be very significant and in many cases affect
the economics of the process. And so the locations of these facilities are important, near
railways for example, where large quantities can be shipped for relatively low costs and
environmental impacts.
In essence, transportation is part of most WRM systems and the environmental, social and
economical side effects must therefore be considered. The only way to mitigate their impact
is to reduce the quantity and distance that W&RP must travel. So it’s crucial to start
accepting new strategies and technologies that will allow W&RP to be treated near the
source. Doing so, society will be faced with the W&RP they generate and arguably this
would have the positive effect of reducing the quantity. The ‘out of sight, out of mind’
mentality cannot be part of a SIWRM.
2.3.3.3 Disposal
Disposal is the worst of all environmentally unsafe aspects of waste-related management.
Although it has been previously argued that residual waste should in fact be free of all
hazardous, organic, recyclable and reusable materials, it is rarely so. Today, the majority of
THE ANALYSYS OF THE POTENTIAL OF MATERIAL AND ENERGY RECOVERY OF MUNICIPAL WASTE IN CANADA
CHAPTER 2: SUSTAINABLE AND INTEGRATED WASTE RELATED MANAGEMENT
2-16
all W&RP are sent to landfill or incinerated. In Canada, landfill accounts for 97% of the
residual W&RP disposal. Either of the two options however, have their drawbacks.
Landfills produce methane as the organics decompose but due to the environmental
conditions and mainly a lack of humidity, this takes decades. Furthermore, some organics (10
to 20% [43]) dissolve into a complex mixture of organic acids, aldehydes, alcohols and
simple sugars. These are combined with other liquids, rain water, hazardous materials present
in the W&RP to form what is called leachate. Leachate is a lethal mix, as discussed later, that
can seep into the ground and reach the water table. The effects are devastating and this occurs
over decades, even after a landfill is closed.
Incinerators, or other thermal processing technologies, are notorious for their emissions,
hazardous liquid and solid by-products. However, if managed and treated properly, the
impacts are far less than landfills since emissions and by-products are created in a controlled
environment.
2.3.4 The Role of Waste-Related Products to Energy
Waste & recoverable products can be thermally treated as a final means to help divert them
from landfill. The main goal is to extract useful energy and reduce the volume of the residual
waste. Although good in concept, there are many opposed to promoting such practices for
two main reasons: 1) harmful emissions and other by-products are generated and 2) the
activity competes with recycling [44]. Both these issues have been successfully addressed in
many cases and are mainly focused on thermal processes (e.g. incineration) and not
biochemical (e.g. composting). There are many different WRP-to-Energy (WRPtE)
technologies, some that have been proven for many years and others that are cutting edge.
The chosen approach depends mainly on the feedstock composition and the desired output.
The opposition to WRPtE technology with regards to pollution comes from three major
issues [46];
• Incinerators and other thermal processes are said to be the largest producers of dioxins
and furans,
• Some of the by-products of the process are toxic,
• Even the best available technologies will pollute.
Although these statements are true to a certain extent, each technology must be viewed in
context and state of the art technologies are far superior with respect to their predecessors.

THE ANALYSYS OF THE POTENTIAL OF MATERIAL AND ENERGY RECOVERY OF MUNICIPAL WASTE IN CANADA
CHAPTER 2: SUSTAINABLE AND INTEGRATED WASTE RELATED MANAGEMENT
2-17
WRPtE plants are strictly regulated by governments, and air emissions comply and often
surpass these requirements (see Table 2-16, for example). The emissions from newer
facilities are far better than oil and coal fired power stations and is slightly worse than natural
gas [48]. In Germany, WRPtE plants accounted for 1/3 of all dioxin emissions in 1990. By
using better technology, applying flue cleaning processes and improved waste-related
material quality, these figures were less than 1% in 2000 [49]. These dioxin control measures
are expensive to implement and reduce the financial viability of such facilities but in certain
cases, the protection of human health and the environment is more important.
In addition, many supporters say that WRPtE will reduce the methane that is currently
emitted by landfills. In Europe, it is estimated that new directives will cut 74 million tonnes
of CO2eq by 2016 [50] and WRPtE technology will play a role in diminishing our reliance on
fossil fuels.
With regards to WRPtE inhibiting the recycling process, there are good arguments on both
sides. Opponents such as Greenpeace, say that if thermal processes are used it would reduce
the willingness of the public to recycle. Also, it is true that these technologies are looking for
organics, paper, plastics and rubber to increase the energy content and consequently their
energy output. These are all recoverable materials. Furthermore, the amount of energy
produced via these processes is only a fraction of the energy required to manufacture the
same product [46].
However, achieving 100% diversion of waste is not achievable in the foreseeable future due
to the ailing recyclable material market. Even in Canada, in 2004 only 23.7% of materials
were diverted from disposal [27], so there is a long way to go before eliminating disposal.
Also, as discussed previously, the quality of the recycled material degrades overtime and
becomes un-recyclable. In other words, WRPtE is a useful tool in the interim to reduce waste
to landfill and has potential in the future to eliminate obsolete recyclable materials.
Moreover, European experiences have shown that the countries with the highest recycling
rates also show the strongest WRPtE growth [44] (also see Figure 3-10 and Figure 3-11). In
the UK, a municipal council stated;
“Experience in a number of other European countries shows that EfW incineration underpins
schemes with high recycling rates. EfW gives the opportunity to recover value (energy) from
waste which cannot be recycled, provides an opportunity for the recycling of bottom ash
THE ANALYSYS OF THE POTENTIAL OF MATERIAL AND ENERGY RECOVERY OF MUNICIPAL WASTE IN CANADA
CHAPTER 2: SUSTAINABLE AND INTEGRATED WASTE RELATED MANAGEMENT
2-18
(thus contributing to a more sustainable use of aggregates), and provides a treatment option
for recyclable waste when markets for recyclables are poor.” [51].
In essence, WRPtE is an integral part of a sustainable development for the following reason;
• Emissions are far less toxic than they used to be, and surpass those of other power generating technologies with the proper flue gas cleaning equipment.
• WRPtE goes hand in hand with recycling. • There will always be (at least for the foreseeable future) a portion of residual waste
requiring disposal. • WRPtE is better than landfill (as will be seen later on).
2.4 Material Recycling
Within the scope of a SIWRM system, recycling is slightly better than disposal and worst
than re-use. Additional energy and resources are required to convert the recyclables into raw
materials for other processes. However, we currently generate a large quantity of W&RP and
at the moment not all can be re-used. Recycling is part of most waste-related management
schemes and will continue to do so in the foreseeable future. At the root, many of the modern
day products that are suitable for recycling cannot be reused as is (e.g. packaging materials,
cans, newspapers, bottles, etc). Many of these are suitable and must be considered for
recycling or disposal (as a last resort).
The quantity and type of materials being recycled depends on its financial viability within a
waste-related management system. Consequently it varies quite drastically in the different
regions of the world based on the type of material being recycled, population density, system
infrastructure, available resources, technology, market value of raw and recycled materials,
etc [47]. However, as the cost of landfills increase and the amount of suitable land is
diminishing, recycling is more prevalent in waste-related management systems [52]. In
general, the benefit of reducing the amount of raw materials being extracted is a secondary
benefit of recycling.
The typical recycling scheme involves collection, sorting/bulking and reprocessing [43]. The
cost of reprocessing depends largely on the scale of the process, complexity of the technology
and quality of the feedstock. The quality of recycled materials is directly dependant on the
quality of the sorting and separation, either at the source and/or at central sorting facilities.
Therefore the role of sorting in any SIWRM system if very important and requires special
attention.

THE ANALYSYS OF THE POTENTIAL OF MATERIAL AND ENERGY RECOVERY OF MUNICIPAL WASTE IN CANADA
CHAPTER 2: SUSTAINABLE AND INTEGRATED WASTE RELATED MANAGEMENT
2-19
Different types of recycling processes are applicable depending on the material. The
following is a brief summary of the various recyclable categories. Organics can also be
recycled (e.g. composting) and are discussed later on in this chapter.
2.4.1 Paper and Cardboard
Paper and cardboard are amongst the easiest and most cost effective household materials to
recycle. They represent about 30% of the municipal solid waste-related stream and
consequently have a significant impact on the quantity of material sent for disposal.
However, it is estimated that about 30% of this resource is not recoverable because they are
destroyed (e.g. toilette paper), contaminated (e.g. pizza boxes), permanent (e.g. books) or in
areas where the population density is too low to warrant collection [43].
Figure 2-4: Production of recycled paper fiber
Source [53]
THE ANALYSYS OF THE POTENTIAL OF MATERIAL AND ENERGY RECOVERY OF MUNICIPAL WASTE IN CANADA
CHAPTER 2: SUSTAINABLE AND INTEGRATED WASTE RELATED MANAGEMENT
2-20
Current paper and cardboard recycling technologies and processes create some wastes. It is
estimated that about 15% of the original material is not recycled [47], as is shown in Figure
2-4 for bulk recycling of paper.
The industry produces a wide variety of paper type and grade. As a result, most can contain a
portion of recycled materials. Even most commodity grade paper can be made almost entirely
of recycled paper [43]. Considering the quantity of paper and cardboard sent for disposal and
the ease of recycling, this resource plays an important role in most waster-related
management schemes.
2.4.2 Glass
Recycled glass is typically in the form of bottles and jars. It is collected and sent to sorting
and reprocessing facilities, where various steps occur. Typically, all foreign objects are
removed, starting with manual separation (e.g. plastic bottles, lead wine bottle collars), then
the mechanical removal of ferrous metals and low density materials such as paper and
aluminum caps [47]. The sorted glass is then crushed into cutlets for use in new products.
The glass cutlets are typically mixed with raw materials to make new bottles and jars, but can
also have other applications like in fiberglass or as additives in building materials such as
asphalt, bricks, insulation, ceramics, etc [43].
2.4.3 Metals
Metals are usually separated into ferrous (steel) and non-ferrous metals (mainly aluminum),
each are treated and recycled separately.
The recycling of ferrous metals to make steel is a well established industry [43]. Steel is a
principal construction material due to its low cost and the widespread availability of iron ore.
However, processing raw iron oxide is very energy intensive compared to reprocessing
recycled steel. So since the large increases in energy costs of the 1960’s, production has
incorporated recycled steel by using more flexible processes, in an effort to remain more
competitive [47]. Although most recycled steel comes from the construction/demolition
industry and the industrial sector, about 4% of MW&RP is ferrous metal. These materials are
easily removed from other recyclables by using magnets at sorting facilities.
Aluminum is a typical non-ferrous metal collected in MW&RP stream (approximately 1%) in
the form of cans, foil and containers. Similar to steel, aluminum is a highly valuable recycled

THE ANALYSYS OF THE POTENTIAL OF MATERIAL AND ENERGY RECOVERY OF MUNICIPAL WASTE IN CANADA
CHAPTER 2: SUSTAINABLE AND INTEGRATED WASTE RELATED MANAGEMENT
2-21
material because of the high energy costs required to process raw bauxite into aluminum. One
source estimates the relative energy cost of processing raw and scrap aluminum to be 183
GJ/ton and 8 GJ/ton, respectively [47]. Even though it is only a small part of the MW&RP
generated, its value warrants recycling.
2.4.4 Plastics
Plastics are particular materials that are difficult to recycle because they are produced in
many different types of polymers, such as: high and low density polyethylene (HDPE,
LDPE), polyethylene terephthalate (PET), polypropylene (PP), polystyrene (PS), polyvinyl
chloride (PVC) and many more. Because of the various types of plastic, proper sorting
becomes the most important part in the recycling loop [52]. Additionally, plastics have a
relatively low density which makes transportation problematic.
Plastics are amongst the least sustainable elements of the waste-related products. 90% of the
plastics used are created from non-renewable fossil fuels [52]. Many plastics enter the waste-
related stream after only one use, for example packaging materials, which represent 35% of
all plastics consumed worldwide [52]. Therefore plastics required special attention in a
SIWRM scheme.
Plastics can either be mechanically or chemically reprocessed. The simplest method being
mechanical, where plastics are shredded and cleaned to remove paper and other soluble
residues. Typically this forms low quality or contaminated raw plastics for products designed
for this material (e.g. fencing, traffic cones, etc) [43]. Obviously the quality of the recycled
plastic is dependent on the sorting performance.
The chemical processing of plastic involves breaking down the polymers into their monomer
form [47]. This process is more complex than mechanical processing and requires much more
energy. Doing so allows the recycled plastic to be re-formed in a much wider range of
products.
Plastics can also be thermally converted as feedstock for energy production (energy
recycling) and this is discussed later in this chapter.
2.4.5 Textiles
Textiles come from clothing, carpets, curtains, etc. Many of these can be typically re-used via
second hand stores. But in some cases the wear is excessive and these materials must be re-
THE ANALYSYS OF THE POTENTIAL OF MATERIAL AND ENERGY RECOVERY OF MUNICIPAL WASTE IN CANADA
CHAPTER 2: SUSTAINABLE AND INTEGRATED WASTE RELATED MANAGEMENT
2-22
processed. The recycled product can be split into various categories depending on the desired
product (e.g. cotton, wool, synthetics, etc). They can be re-processed to produce new fabrics
or stuffing materials, for example. The process to recycle and produce textiles is similar to
that of the pulp and paper industry [47].
2.4.6 Waste Electrical and Electronic Equipment (WEEE)
Waste electrical and electronic equipment (WEEE) covers a wide range of household
products (e.g. computers, TV’s, appliances). In Canada, WEEE is estimated at less than 4%
of the MW&RP stream. However, studies have shown that the quantity being generated is
growing at a rate 3 times faster than MW&RP [43].
These products are generally sent to landfill because it’s difficult to separate all the various
components (plastics, ferrous and non-ferrous metals, glass and other non-recyclables). In
some cases it’s possible to refurbish some of these products and put them back into the
market, but this is not a prevalent trend. The infrastructure to reuse and recycle these
materials needs to be developed and must form part of any SIWRM strategy. Trends show
that they are gaining importance in the WRM stream and cannot simply be sent to landfill.
2.5 Disposal and Energy Recycling
The current reality, and foreseeable future, includes waste-related disposal as part of any
SIWRM. This would include landfills and Waste-Related Products to Energy (WRPtE) or
Energy Recycling. The following section will describe these various methods with a special
focus on energy recycling.
As a starting point, some of the basic principles and concepts are reviewed to better
understand the processes.
2.5.1 The basics
There are three main sources of biomass feedstock for energy conversion: waste &
recoverable products, agriculture residues and energy crops. When using biomassv (such as
MW&RP) as a feedstockvi for energy production it is important to understand its
v Renewable organic materials such as; wood, agricultural crops or wastes, and municipal W&RP.
vi Raw material required for an industrial process.

THE ANALYSYS OF THE POTENTIAL OF MATERIAL AND ENERGY RECOVERY OF MUNICIPAL WASTE IN CANADA
CHAPTER 2: SUSTAINABLE AND INTEGRATED WASTE RELATED MANAGEMENT
2-23
characteristics, i.e. moisture content, heating value, fixed carbon and volatile mater
proportions, ash content, alkali metal content and cellulose & lignin ratio [54].
The interest in agricultural waste and energy crops is that they can be mixed with W&RP in
an effort to normalize the heating value and improve the supply stability of the feedstock. In
addition, it is good integrated waste-related management practice to consider other waste
streams. Sanitary waste-related products can also be considered as feedstock.
2.5.1.1 Agricultural Waste
Agricultural waste is of interest because it’s exactly that, waste. In some cases it’s tilled back
into the ground or used as animal bedding. Sometimes it’s burned or sent to landfill, and
hence a valuable source of energy is being discarded.
Agricultural waste can be divided into; wood, manure, temperate and tropical crop waste &
recoverable products. Wood by-products are an important source of energy and they are often
ignored. Mill wastes, trimmings and forest residues are commonly left to rot or go to landfill.
Manure is produced from farm animals and is a very good energy source due to its high
volatility. Collecting it also helps reduce the green house effect since it captures the otherwise
released methane.
The main problem with agricultural waste/resources is collection. It’s produced in a dispersed
fashion. Moreover, the density is low which increases transportation costs and further puts
into question the economics of such an energy source. The most beneficial biomass to energy
facilities are placed on site where the waste/resource is produced, such as large farms, saw
mills, sugar refineries or olive oil pressing factories, as some examples.
2.5.1.2 Energy crops
Energy crops are grown for the sole purpose of being converted to energy. The interest is
intertwined with mitigating greenhouse gas emissions. Energy crops are considered CO2-
neutral, when they are harvested sustainably, since they consume as much during growth as
they release during the energy conversion process. They can be converted to heat, electricity
or biofuels. Other benefits are usage of surplus agricultural land and reducing the dependence
on oil. Energy crops however, do raise certain environmental concerns such as excessive land
use, soil desertification, water table contamination due to fertilizers and loss of biodiversity.
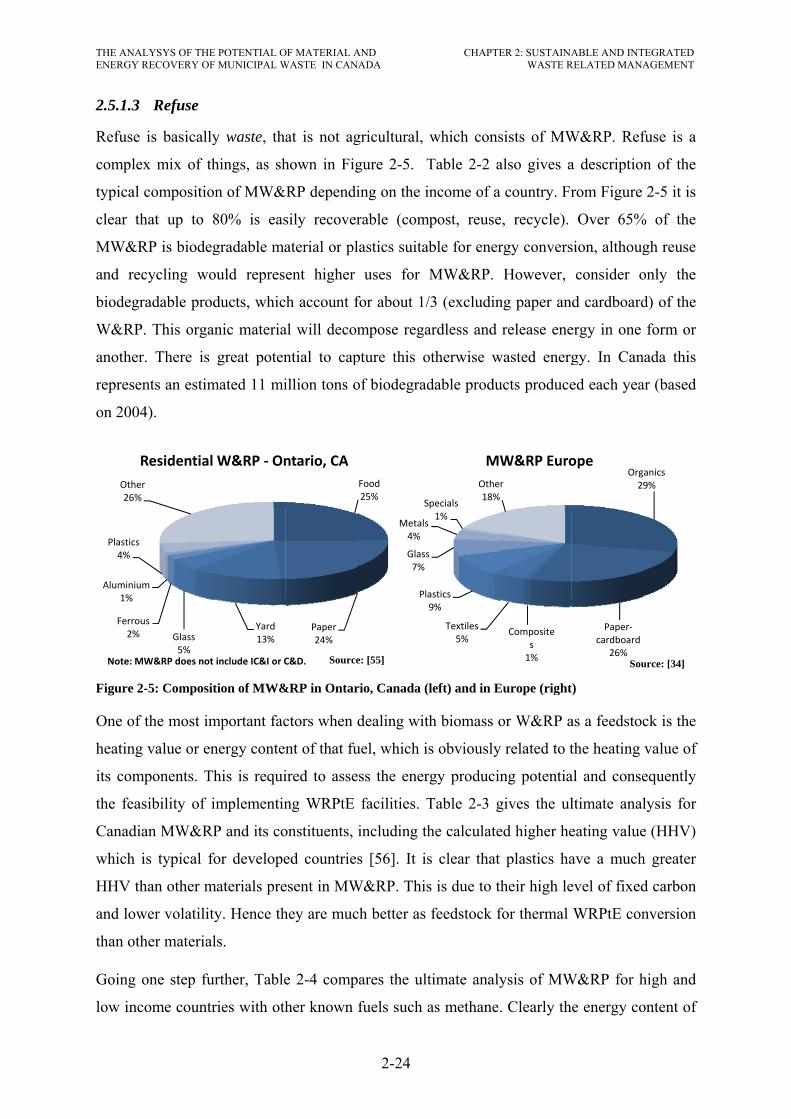
THE ANALENERGY R
2.5.1.3
Refuse
complex
typical
clear th
MW&R
and rec
biodegr
W&RP
another
represen
on 2004
Figure 2
One of
heating
its com
the feas
Canadia
which i
HHV th
and low
than oth
Going o
low inc
Ferrou2%
Aluminium1%
Plastics4%
Other26%
R
Note: M
LYSYS OF THERECOVERY OF
Refuse
is basically
x mix of th
compositio
hat up to 8
RP is biodeg
cycling wo
radable prod
. This organ
r. There is
nts an estim
4).
-5: Composit
the most im
value or en
mponents. Th
sibility of i
an MW&RP
is typical fo
han other m
wer volatility
her material
one step fu
come countr
Glass 5%
us
m
r
Residential
MW&RP does not
E POTENTIAL OF MUNICIPAL W
y waste, tha
hings, as sh
n of MW&
80% is eas
gradable ma
ould represe
ducts, whic
nic materia
great poten
mated 11 mi
tion of MW&
mportant fac
nergy conten
his is requi
implementin
P and its co
for develope
materials pre
y. Hence th
ls.
rther, Table
ries with oth
Yard13%
W&RP ‐ On
include IC&I or C
OF MATERIAL AWASTE IN CAN
at is not ag
hown in Fig
RP dependi
sily recover
aterial or pl
ent higher
h account f
al will decom
ntial to cap
illion tons o
&RP in Ontar
ctors when d
nt of that fu
ired to asse
ng WRPtE
onstituents,
ed countries
esent in MW
hey are muc
e 2-4 comp
her known
Paper24%
ntario, CA
C&D. Source
AND NADA
2-24
gricultural,
gure 2-5. T
ing on the i
rable (com
lastics suitab
uses for
for about 1/
mpose rega
pture this o
of biodegrad
rio, Canada (l
dealing with
uel, which is
ess the ener
facilities. T
including th
s [56]. It is
W&RP. This
ch better as
pares the ult
fuels such a
Food25%
Pla9
Glass7%
Metals4%
S
e: [55]
CHAPTE
which cons
Table 2-2 a
ncome of a
mpost, reuse
ble for ener
MW&RP.
/3 (excludin
ardless and
otherwise w
dable produ
left) and in E
h biomass o
s obviously
rgy producin
Table 2-3 g
he calculate
s clear that
s is due to th
feedstock f
timate analy
as methane.
Textiles5%
astics9%
s
pecials1%
Othe18%
MW
ER 2: SUSTAINAWASTE R
sists of MW
also gives a
country. Fr
e, recycle).
rgy convers
However,
ng paper and
release ene
wasted energ
ucts produce
Europe (right
or W&RP a
y related to t
ng potentia
gives the ul
ed higher he
plastics ha
heir high le
for thermal
ysis of MW
. Clearly th
Composites1%
r
W&RP Euro
ABLE AND INTRELATED MANA
W&RP. Ref
a description
rom Figure
Over 65%
sion, althoug
consider o
d cardboard
ergy in one
gy. In Can
ed each yea
)
as a feedstoc
the heating
al and conse
ltimate anal
eating value
ave a much
evel of fixed
WRPtE con
W&RP for h
e energy co
Org29
Paper‐cardboard
26%
ope
Sou
TEGRATED AGEMENT
fuse is a
n of the
2-5 it is
% of the
gh reuse
only the
d) of the
form or
nada this
ar (based
ck is the
value of
equently
lysis for
e (HHV)
h greater
d carbon
nversion
high and
ontent of
anics9%
urce: [34]

THE ANALYSYS OF THE POTENTIAL OF MATERIAL AND ENERGY RECOVERY OF MUNICIPAL WASTE IN CANADA
CHAPTER 2: SUSTAINABLE AND INTEGRATED WASTE RELATED MANAGEMENT
2-25
W&RP is comparatively low. It is important to remember that other biomass can be
combined with the MW&RP to improve the heating value and stability of the W&RP as a
feedstock.
Table 2-2: Typical composition of municipal solid wastes from high and low income countries
Category MW&RP (%) (low-income countries)
MW&RP (%) (high-income countries)
Paper 3–10 30–46 Plastics 2–7 7–13 Compostable 36–80 23–38 Glass and ceramics 1–8 4–10 Metals 1–4 4–9 Others 14–54 8–22
Source: [57]
Table 2-3: Composition and heating value of MSW
Canada Ultimate Analysis HHV LHV Material Share C H O N S Ash Cl MC (MJ/kg)
Paper/cardboard 29.0% 34.7% 4.7% 32.5% 0.2% 0.2% 6.5% 0.2% 21.0% 14.1 12.5 Yard Trimming 7.6% 23.3% 2.9% 17.5% 0.9% 0.2% 10.1% 0.1% 45.0% 9.7 8.0 Organics 28.2% 17.9% 2.6% 12.9% 1.1% 0.1% 5.1% 0.4% 60.0% 8.0 5.9 Plastics 9.2% 56.4% 7.8% 8.1% 0.9% 0.3% 8.6% 3.0% 15.0% 29.3 27.2 Glass 3.4% N/A N/A N/A N/A N/A N/A N/A N/A N/A N/A Metals a 4.6% N/A N/A N/A N/A N/A N/A N/A N/A N/A N/A Textiles 2.4% 37.2% 5.0% 27.1% 3.1% 0.3% 2.0% 0.3% 25.0% 16.1 14.4 Other b 15.7% 24% N/A N/A N/A N/A N/A N/A N/A 10.0 8.4
MW&RP- Unsorted 100.0% 27% 3% 16% 1% 0% 5% 0% 28% 11.7 10.1 a Metals are comprised of 4% ferrous and 1% non-ferrous metals. Information based on [58]. b Other is assumed to be 7% misc. combustibles, 2% misc. non-combustibles and 6% fines (dust). Information based on [58]. c Carbon content and Heating values extrapolated for paper, cardboard, wood and plastics taken from [56]. All others were taken from Waste Management Option & Climate Change [43].
Table 2-4: Characteristics of the waste feedstocks (dry mass basis)
Waste type C (%) H (%) O (%) Ash (%) HHV (MJ/kg) MSWa 36.7 7.2 31.1 25.4 8.4 RDFb 44 8 30 18 16 MSWc 47.6 6 32.9 12 19.9 Waste oil 83 17 0 0 34 Landfill gas 47 11 42 0 28.2 Methane 75 25 0 0 55.7
A Low-income countries B Refuse Derived Fuel from a
C High-income countries
Source: [57]
The energy content is only part of the required information, however. The major drawback of
MW&RP as a fuel source is the inherent heavy metals, toxins, hazardous and potentially

THE ANALYSYS OF THE POTENTIAL OF MATERIAL AND ENERGY RECOVERY OF MUNICIPAL WASTE IN CANADA
CHAPTER 2: SUSTAINABLE AND INTEGRATED WASTE RELATED MANAGEMENT
2-26
hazardous materials in unsorted MW&RP. Table 2-5 gives a summary of W&RP molecules
found in Austria and UK refuse.
Table 2-5: Comparison of Austrian and UK W&RP data
Source C
(%) Fe
(%) Cl
(%) S
(%) F
(%) Zn (%)
Pb (%)
Cu (%)
Cd (ppm)
Hg (ppm)
Austria household 24 5 0.8 0.4 0.2 0.1 0.06 0.04 9 2.5
Austria municipal 26 5.6 0.9 0.4 0.2 0.1 0.08 0.05 11 1.4
UK household 34 6.6 1 0.2 0.03 0.1 0.04 0.1 5 0.5 Source: [59]
Going into greater detail, Table 2-6 breaks down some of the heavy metals found in common
W&RP. The harmful chemicals present in the fuel are problematic regardless of the disposal
method, meaning that they need to be accounted for during landfill just as much as for
WRPtE. It is important to note however, that WRPtE occurs in a controlled environment,
which allows these molecules and their by-products to be captured and managed
appropriately, unlike landfills.
Table 2-6: Comparison of heavy metal data by fraction
As (ppm) Cd (ppm) Cr (ppm) Hg (ppm) Pb (ppm) Category UK Nl D UK Nl D UK Nl D UK Nl D UK Nl D
Paper/card 2 2 <5 1 11 1 20 67 10 0.1 <0.1 0.2 42 127 23 Organic waste 5 67 30 1 5 1 25 310 55 0.1 <0.1 0.5 76 188 90 Total plastics 3 388 853 <0.1 302 Dense plastics 2 32 181 0.1 879 Film plastics 4 4 195 0.1 1595 PVC <5 66 29 0.2 50 Wood 6 <5 12 <1 231 5 1 <0.1 277 21 Textiles 2 2 <5 1 16 1 25 934 17 0.1 <0.1 <0.1 35 30 35 Glass 6 287 0 1 <1 0 454 253 1 <0.1 <0.1 0 168 381 329 Miscellaneous non-combustible 11 3 118 <0.1 999
Stone/ceramics 91 10 341 1 822 80 <0.1 0 1967 50 Total metals 20 21 156 nd 582 Ferrous metal 32 539 15 <1 1571 1730 nd nd 1300 520 Non-Fe metal 4 48 16 19 221 331 nd nd 4000 11,635 Batteries 12 53 18 127 10,800Electrical goods 71 361 1304 17 11,000Fines 16 1 97 0.2 706
UK: United Kingdom Nl: Netherlands D: Germany
Source: [59]
The effects that these constituents have on the liquid, solid and gaseous emissions depend on
the process used to convert the W&RP to energy. This will be discussed in the following
sections as we focus on the WRPtE technologies.

THE ANALYSYS OF THE POTENTIAL OF MATERIAL AND ENERGY RECOVERY OF MUNICIPAL WASTE IN CANADA
CHAPTER 2: SUSTAINABLE AND INTEGRATED WASTE RELATED MANAGEMENT
2-27
A final thing to consider before embarking on the WRPtE technology journey is that not all
biomass is suitable for every conversion process. Depending on the characteristics of the
feedstock (HHV, moisture content, toxins, etc.) and the desired output (heat, electricity,
liquid fuels, etc.) different processes are more appropriate than others. This holds true for all
the various materials in W&RP. For example, organics that are volatile and have higher
moisture content are better suited for biochemical conversions (e.g. Anaerobes digestion).
MW&RP can be treated physically, in order to prepare it for recycling or further processing.
Subsequently, waste-related products can be converted either by thermochemical or
biochemical process to produce useful energy. Table 2-7 is a summary of the potential
applicable processes for the multitude of products found in MW&RP.
Table 2-7: MW&RP conversion processes
Type Example Conversion Process Biodegradable products Food, yard, wood, paper Biochemical and thermal processing Recyclable materials Paper, glass, bottles, cans, metals,
certain plastics All are good for recycling, Plastics and paper are good for thermal processing
Inert materials Construction and demolition waste, dirt, rocks
Recycling or landfill
Composite products Clothing, Tetra Paks products, waste plastics
Thermal conversion
Domestic Hazardous Waste Medication, paints, chemicals, light bulbs, fluorescent tubes, spray cans, fertilizer and pesticide containers, batteries, shoe polish
Recycling and often need to be sterilized via thermal processes
Source: [60]
2.5.2 Physical Processing
MW&RP can and should be physically manipulated prior to energy conversion. The W&RP
can be separated, compacted or shredded. The first would separate any compostable,
recyclable or hazardous materials for further processing. Then if energy conversion is to take
place, the quality and characteristics of the feedstock are better known and controlled.
Separation can be done manually, mechanically or both. Compaction and shredding are used
to reduce the volume and size respectively.
Refuse Derived Fuel (RDF), can be made by either shredding or steam pressure treating
MW&RP. It leaves mainly plastics and biodegradables. Non-combustibles must be removed.
The RDF can be compressed into bricks, pellets or logs for transportation to industrial plants
or WRPtE facilities.
THE ANALYSYS OF THE POTENTIAL OF MATERIAL AND ENERGY RECOVERY OF MUNICIPAL WASTE IN CANADA
CHAPTER 2: SUSTAINABLE AND INTEGRATED WASTE RELATED MANAGEMENT
2-28
Physical separation should occur in any SIWRM scheme to ensure compostable and
recyclable material is not sent to landfill, especially if materials are not separated at the
source.
2.5.3 Biochemical Conversion
Biochemical conversion is the decomposition of organics into combustible hydrocarbons (e.g.
methane). Decomposition happens naturally, if left in the presence of oxygen (e.g.
composting) or the process can be accelerated in a controlled environment in the absence of
oxygen (anaerobic digestion (AD) or fermentation) to produce gas or liquid biofuels.
2.5.3.1 Aerobic Digestion (Composting)
Aerobic digestion (also known as composting) is the natural decomposition of organic matter
in the presence of oxygen. Aerobic bacteria such as yeast and fungi do most of the work with
larger creatures such as ants and insects also helping the process. During the process aerobic
bacteria convert the carbon in the form of cellulose to heat, CO2 and water. Nitrogen trapped
in the form of protein is also required to provide nutrients to the bacteria [61].
The type of material preferred for composting has high carbon content such as leafs, sawdust
and paper, mixed with high nitrogen materials (e.g. grass clippings, manure, fruits and
vegetables). The preferred Carbon/Nitrogen ratio is between 25 and 30 on dry mass basis
[61]. Guides are available for household composters. In commercial and industrial
composters, the C:N ratio is closely monitored.
Aerobic digestion can occur either actively or passively. The process requires carbon,
nitrogen, water, heat and oxygen to function. The first two and often water are present in the
feedstock. Heat occurs as a by-product of the decomposition process. As the temperature
increases, so does the metabolism of the bacteria, which accelerates the process, creating
more bacteria and heat. This part is self sufficient. Oxygen on the other can be introduced
naturally or actively. Larger composting facilities will periodically mix the feedstock pile to
stimulate oxygen penetration. Mixing sticks, wood chips and small rocks will also allow
oxygen to migrate through the pile passively. If the compost is left to sit, without new
oxygen, the process will switch to anaerobic digestion and produce odours. Methane will also
be created in the absence of oxygen, which is a lot more harmful than CO2 as a greenhouse
gas (GHG), and this is undesirable.
THE ANALYSYS OF THE POTENTIAL OF MATERIAL AND ENERGY RECOVERY OF MUNICIPAL WASTE IN CANADA
CHAPTER 2: SUSTAINABLE AND INTEGRATED WASTE RELATED MANAGEMENT
2-29
Aerobic digestion can either occur at mesophilic (20 to 44°C) or thermophilic (above 45°C)
temperatures. In general, a higher temperature promotes a faster bacteria metabolism and
consequently faster decomposition. However different bacteria are active at the different
temperature ranges. Consequently, the composting temperatures must be kept relatively
consistent. At temperatures above 55oC for several days, would kill most bacteria [61]. When
a significant portion of the colony is killed, the process takes longer to restart.
Another form of composting would be by worm or vermicomposting. Worms are used to
decompose the organics into a nutrient rich fertilizer. The process can occur indoors, hence
year-round [61].
Although aerobic digestion is not a method to produce energy from waste-related products, it
does play an important role in the integrated waste-related management strategy. The
importance of diverting biodegradable materials form landfill is crucial to sustainable
development. Composting provides a diversion option which creates CO2 as opposed to
methane (being better from a GHG perspective). In addition biomass can be considered
carbon neutral since it generates as much CO2 during decomposition as it consumes during
growth.
On the other hand, there has been success in producing energy from composting. It has been
shown that aerobic digestion piles can reach up to 68oC. By running coils through a compost
pile, hot water can be heated for domestic purposes [62]. This might be interesting for smaller
homes in warm climates and may require more research since it may kill most bacteria and be
only useful for the short term.
2.5.3.2 Anaerobic Digestion (Landfill Gas)
Anaerobic digestion is similar to aerobic digestion, except the whole process occurs in the
absence of oxygen. Using bacterial action in a warm and wet environment this process
produces mainly methane (50-75% of total gas vol.) and CO2 with traces of hydrogen
sulphide. In general the process occurs at mesophilic temperatures (~35oC), and higher
temperatures yield higher biogas rates and shorter residence times in the digester.
Unfortunately higher digester temperatures are not always economical since most of the
methane gas produced must be used to heat the digester tank, depending on the external
environmental conditions.
THE ANALYSYS OF THE POTENTIAL OF MATERIAL AND ENERGY RECOVERY OF MUNICIPAL WASTE IN CANADA
CHAPTER 2: SUSTAINABLE AND INTEGRATED WASTE RELATED MANAGEMENT
2-30
The moisture content of the feedstock ‘slurry’ should also be between 80-95%. This is why
manure is a great feedstock for such systems. MW&RP and sewer sludge (solid by-product
from sewage treatment plants) can also be used to help decontaminate the waste and reduce
landfill. The potential methane release to atmosphere is also mitigated. Any other biomass
can also be used. The solid by-product of the process can be sold as a fertiliser, depending on
the contaminants of the initial feedstock.
The gas can be then used in an IC engine or in a micro-turbine to produce electricity. The
waste heat can be used to heat the digester or for other process heating. The gas can also be
stored and redistributed as needed. Except for storage, compression equipment and energy
requirements are high, which significantly reduces the benefits of such systems. The
conversion efficiency from feedstock to gas is 20-50% of the initial energy content. Electrical
conversion efficiency from feedstock is then 10-16% of the initial energy content [63].
The process of anaerobic digestion is what occurs in landfills. Within a controlled
environment (e.g. digester) the methane gas and odours can be collected, eliminated and
turned into useful energy. In this case, controlled conditions allow for a much faster
decomposition process. A landfill on the other hand, causes the same decay except over years
rather than weeks compared to the controlled environment [64].
2.5.3.3 Fermentation
Fermentation is another anaerobic process by which microbes convert sugars to alcohol. The
process then produces ethanol that can be used as an additive to gasoline in normal engines or
as the primary fuel in converted engines such as in Brazil. The ethanol can also be used in the
esterification process used to create bio-diesel from bio-oils. Sugar crops (sugar cane, sugar
beet) or starch crops (maize, wheat) are best suited for this. Corn will yield about 450 l of
ethanol from one dry ton [63]. The by-products can be used as cow feed or in the case of
bagasse, it can be further converted using a combustor or a gasifier [65].
Once again, this biochemical process is not necessarily pertinent to the WRPtE conversion.
However, in an SIWRM system, the by-product could be combined with another waste-
related stream for further thermochemical processing to energy.

THE ANALYSYS OF THE POTENTIAL OF MATERIAL AND ENERGY RECOVERY OF MUNICIPAL WASTE IN CANADA
CHAPTER 2: SUSTAINABLE AND INTEGRATED WASTE RELATED MANAGEMENT
2-31
2.5.4 Thermochemical Conversion
This type of conversion requires heat to extract the energy trapped in the feedstock. Typical
end-products are heat, electricity, producer gas or bio-oil. Sub-categories of this conversion
are direct combustion or upgrading the fuel via gasification or pyrolysis.
In contrast to biochemical treatments, thermal conversions can deal with a much larger
variety of materials such as plastics and hazardous waste. However, as a result of the higher
temperatures there are far more environmental considerations. The inherent composition of
MW&RP, as shown in Figure 2-5, makes it such that emissions and by-products must be
properly assessed. Unsorted MW&RP can contain metals, plastics, organics, wood and
hazardous products.
In addition, the solid and liquid by-products of thermochemical conversions can also be
environmentally unsafe. Only those of the incineration process are discussed here, since
pyrolysis and gasification facilities are faced with similar environmental concerns [46]. The
specifics of the other processes are discussed along with the technology itself in subsequent
sections.
2.5.4.1.1 Emissions
W&RP can produce emissions during combustion containing “various hazardous substances
such as mercury and other toxic metals, particulate matter (PM), hydrogen chloride, chlorine
gas, undesirable hydrocarbons (VOC’s), and, most notoriously, dioxins and furans.” [44].
Firstly, during combustion metals are not destroyed, and are released in a more concentrated
form. At the higher temperatures toxic metals contained in batteries, paints and certain
plastics, for example, are released in their airborne form. This makes capture and mitigation
more difficult. The metals can include: lead, cadmium, arsenic, mercury and chromium [46].
Second, unburned toxic chemicals are often emitted in the flue gas. Since incinerators do not
operate at 100% efficiency, certain amounts of toxic chemical are not combusted and are
emitted to the environment [46].
Thirdly, there is the creation of new pollutants which were not initially present, e.g. dioxins
and furans (chlorodibenzodioxins and chlorodibenzofurans). “Dioxins and furans are
chlorinated organic compounds which are generally considered to be among the most acutely
toxic carcinogens known to man.” [66]. They are associated with a “…wide range of health
impacts including; cancer, altered sexual development, male and female reproductive
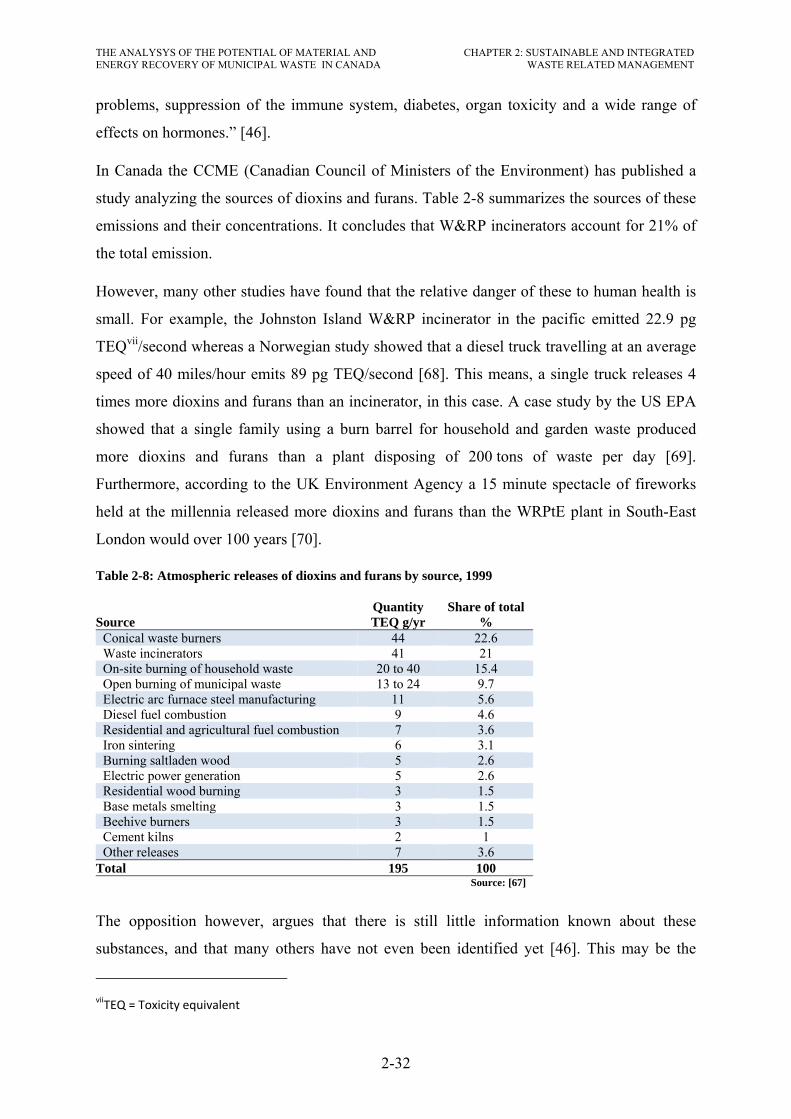
THE ANALYSYS OF THE POTENTIAL OF MATERIAL AND ENERGY RECOVERY OF MUNICIPAL WASTE IN CANADA
CHAPTER 2: SUSTAINABLE AND INTEGRATED WASTE RELATED MANAGEMENT
2-32
problems, suppression of the immune system, diabetes, organ toxicity and a wide range of
effects on hormones.” [46].
In Canada the CCME (Canadian Council of Ministers of the Environment) has published a
study analyzing the sources of dioxins and furans. Table 2-8 summarizes the sources of these
emissions and their concentrations. It concludes that W&RP incinerators account for 21% of
the total emission.
However, many other studies have found that the relative danger of these to human health is
small. For example, the Johnston Island W&RP incinerator in the pacific emitted 22.9 pg
TEQvii/second whereas a Norwegian study showed that a diesel truck travelling at an average
speed of 40 miles/hour emits 89 pg TEQ/second [68]. This means, a single truck releases 4
times more dioxins and furans than an incinerator, in this case. A case study by the US EPA
showed that a single family using a burn barrel for household and garden waste produced
more dioxins and furans than a plant disposing of 200 tons of waste per day [69].
Furthermore, according to the UK Environment Agency a 15 minute spectacle of fireworks
held at the millennia released more dioxins and furans than the WRPtE plant in South-East
London would over 100 years [70].
Table 2-8: Atmospheric releases of dioxins and furans by source, 1999
Source Quantity Share of total TEQ g/yr %
Conical waste burners 44 22.6 Waste incinerators 41 21 On-site burning of household waste 20 to 40 15.4 Open burning of municipal waste 13 to 24 9.7 Electric arc furnace steel manufacturing 11 5.6 Diesel fuel combustion 9 4.6 Residential and agricultural fuel combustion 7 3.6 Iron sintering 6 3.1 Burning saltladen wood 5 2.6 Electric power generation 5 2.6 Residential wood burning 3 1.5 Base metals smelting 3 1.5 Beehive burners 3 1.5 Cement kilns 2 1 Other releases 7 3.6
Total 195 100 Source: [67]
The opposition however, argues that there is still little information known about these
substances, and that many others have not even been identified yet [46]. This may be the
viiTEQ = Toxicity equivalent
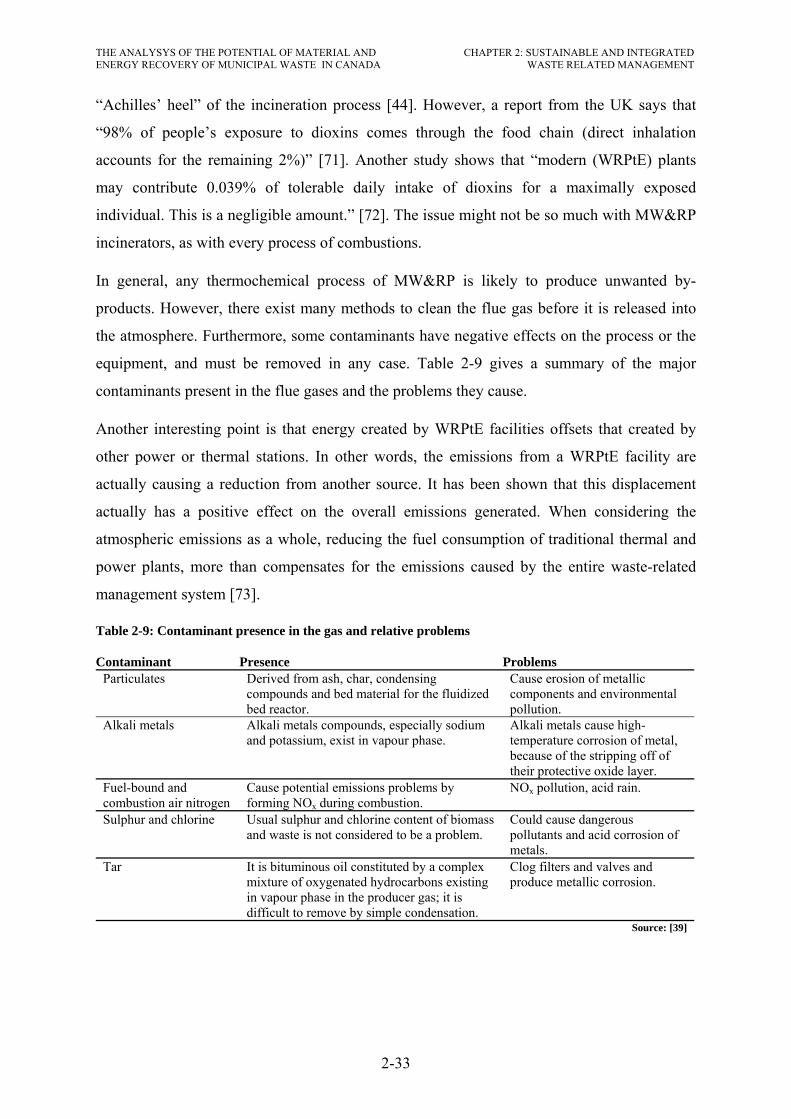
THE ANALYSYS OF THE POTENTIAL OF MATERIAL AND ENERGY RECOVERY OF MUNICIPAL WASTE IN CANADA
CHAPTER 2: SUSTAINABLE AND INTEGRATED WASTE RELATED MANAGEMENT
2-33
“Achilles’ heel” of the incineration process [44]. However, a report from the UK says that
“98% of people’s exposure to dioxins comes through the food chain (direct inhalation
accounts for the remaining 2%)” [71]. Another study shows that “modern (WRPtE) plants
may contribute 0.039% of tolerable daily intake of dioxins for a maximally exposed
individual. This is a negligible amount.” [72]. The issue might not be so much with MW&RP
incinerators, as with every process of combustions.
In general, any thermochemical process of MW&RP is likely to produce unwanted by-
products. However, there exist many methods to clean the flue gas before it is released into
the atmosphere. Furthermore, some contaminants have negative effects on the process or the
equipment, and must be removed in any case. Table 2-9 gives a summary of the major
contaminants present in the flue gases and the problems they cause.
Another interesting point is that energy created by WRPtE facilities offsets that created by
other power or thermal stations. In other words, the emissions from a WRPtE facility are
actually causing a reduction from another source. It has been shown that this displacement
actually has a positive effect on the overall emissions generated. When considering the
atmospheric emissions as a whole, reducing the fuel consumption of traditional thermal and
power plants, more than compensates for the emissions caused by the entire waste-related
management system [73].
Table 2-9: Contaminant presence in the gas and relative problems
Contaminant Presence Problems Particulates Derived from ash, char, condensing
compounds and bed material for the fluidized bed reactor.
Cause erosion of metallic components and environmental pollution.
Alkali metals
Alkali metals compounds, especially sodium and potassium, exist in vapour phase.
Alkali metals cause high-temperature corrosion of metal, because of the stripping off of their protective oxide layer.
Fuel-bound and combustion air nitrogen
Cause potential emissions problems by forming NOx during combustion.
NOx pollution, acid rain.
Sulphur and chlorine Usual sulphur and chlorine content of biomass and waste is not considered to be a problem.
Could cause dangerous pollutants and acid corrosion of metals.
Tar It is bituminous oil constituted by a complex mixture of oxygenated hydrocarbons existing in vapour phase in the producer gas; it is difficult to remove by simple condensation.
Clog filters and valves and produce metallic corrosion.
Source: [39]

THE ANALYSYS OF THE POTENTIAL OF MATERIAL AND ENERGY RECOVERY OF MUNICIPAL WASTE IN CANADA
CHAPTER 2: SUSTAINABLE AND INTEGRATED WASTE RELATED MANAGEMENT
2-34
2.5.4.1.2 Solid and Liquid By-products
Although incinerators are intended to burn waste-related products, liquid (e.g. from flue gas
scrubbing) and solid (e.g. ash, inert materials) by-products are still produced. The ash and
liquid from the process contain some of the same pollutants emitted in the flue gas. Up to 43
different semi-volatile organic chemicals have been found up until now in incinerator ash and
a minimum of 16 organic chemicals in waste water [46].
Solid by-products from the incineration process contain fly ash and bottom ash. Fly ash from
MW&RP is by far the most hazardous since it can contain heavy metals and traces of dioxins
and furans [74]. Bottom ash is typically non-hazardous. Generally these ashes are sent to
landfill where they must abide by the same environmental restriction that regular MW&RP
are subject to. Ash can also be used as an additive in asphalt and concrete, to prevent these
toxic chemicals from going to landfill. However, some samples taken of asphalt and concrete
containing incinerator ash was noted to have “unacceptably high levels of heavy metals and
dioxins.” [46].
Water is used in the flue gas cleaning scrubbers. This wastewater can contain acids, sulphur,
heavy metals, dioxins, furans and other toxic chemicals. The effluent must be sent to a
treatment facility to have the harmful chemicals removed. After treatment to acceptable
levels, the waste water is re-introduced into the lakes and rivers, but the removed hazardous
chemicals still need to be disposed [46].
2.5.4.1.3 Conclusion
There are good arguments for and against energy recycling. Perhaps the compromise would
be to not incinerate or landfill any waste-related products. This goes back to the primary
objective of SIWRM, prevention of waste-related products, with disposal as a last resort.

THE ANALYSYS OF THE POTENTIAL OF MATERIAL AND ENERGY RECOVERY OF MUNICIPAL WASTE IN CANADA
CHAPTER 2: SUSTAINABLE AND INTEGRATED WASTE RELATED MANAGEMENT
2-35
Figure 2-6: Thermal conversion process and products
But in reality, residual waste is not going to disappear in the near future. Hence, considering
the advancement in thermochemical processing technology and flue gas cleaning, it seems
favourable to create useful energy before sending the waste to landfill. The problematic
chemicals inherent in the MW&RP would go to landfill either way. We may as well reduce
the volume, do ‘energy recycling’ and promote the recycling of some of the by-products. In
addition, it is much easier to deal with toxic chemicals in a controlled environment than in a
landfill.
Figure 2-6 shows some of the main thermochemical conversion technologies, their by-
products and ultimately what can be extracted from the processes.
2.5.4.2 Combustion (Incineration)
Combustion is the most cost effective and wide-spread method to extract useful energy from
biomass [64]. The process is common for heating in developing countries or in rural areas.
Larger facilities use the heat from combustion to produce steam and run turbine generators
for electricity. Modern facilities do both, using steam for electricity and the waste heat for
heating, which greatly improves the overall efficiency of the system.
Waste-related products with moisture contents (MC) greater than 50% are generally not
suitable for combustion since the energy required to evaporate the water reduces the
Source: [39]
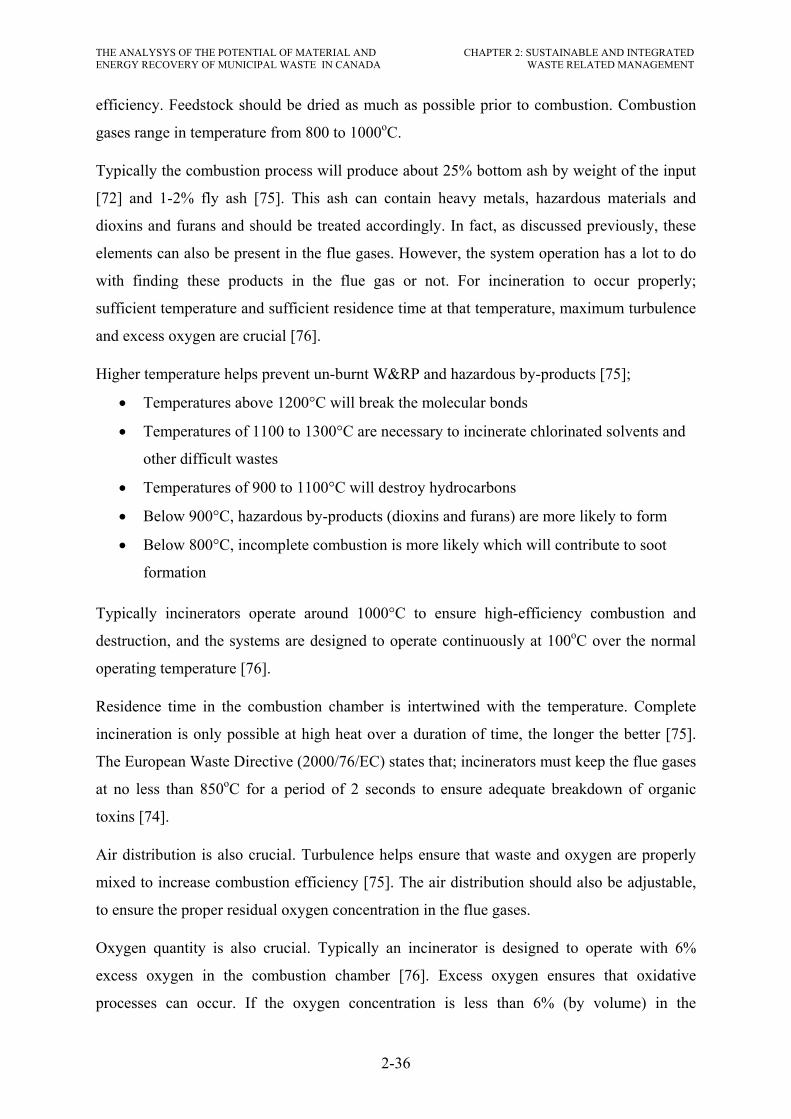
THE ANALYSYS OF THE POTENTIAL OF MATERIAL AND ENERGY RECOVERY OF MUNICIPAL WASTE IN CANADA
CHAPTER 2: SUSTAINABLE AND INTEGRATED WASTE RELATED MANAGEMENT
2-36
efficiency. Feedstock should be dried as much as possible prior to combustion. Combustion
gases range in temperature from 800 to 1000oC.
Typically the combustion process will produce about 25% bottom ash by weight of the input
[72] and 1-2% fly ash [75]. This ash can contain heavy metals, hazardous materials and
dioxins and furans and should be treated accordingly. In fact, as discussed previously, these
elements can also be present in the flue gases. However, the system operation has a lot to do
with finding these products in the flue gas or not. For incineration to occur properly;
sufficient temperature and sufficient residence time at that temperature, maximum turbulence
and excess oxygen are crucial [76].
Higher temperature helps prevent un-burnt W&RP and hazardous by-products [75];
• Temperatures above 1200°C will break the molecular bonds
• Temperatures of 1100 to 1300°C are necessary to incinerate chlorinated solvents and
other difficult wastes
• Temperatures of 900 to 1100°C will destroy hydrocarbons
• Below 900°C, hazardous by-products (dioxins and furans) are more likely to form
• Below 800°C, incomplete combustion is more likely which will contribute to soot
formation
Typically incinerators operate around 1000°C to ensure high-efficiency combustion and
destruction, and the systems are designed to operate continuously at 100oC over the normal
operating temperature [76].
Residence time in the combustion chamber is intertwined with the temperature. Complete
incineration is only possible at high heat over a duration of time, the longer the better [75].
The European Waste Directive (2000/76/EC) states that; incinerators must keep the flue gases
at no less than 850oC for a period of 2 seconds to ensure adequate breakdown of organic
toxins [74].
Air distribution is also crucial. Turbulence helps ensure that waste and oxygen are properly
mixed to increase combustion efficiency [75]. The air distribution should also be adjustable,
to ensure the proper residual oxygen concentration in the flue gases.
Oxygen quantity is also crucial. Typically an incinerator is designed to operate with 6%
excess oxygen in the combustion chamber [76]. Excess oxygen ensures that oxidative
processes can occur. If the oxygen concentration is less than 6% (by volume) in the

THE ANALYSYS OF THE POTENTIAL OF MATERIAL AND ENERGY RECOVERY OF MUNICIPAL WASTE IN CANADA
CHAPTER 2: SUSTAINABLE AND INTEGRATED WASTE RELATED MANAGEMENT
2-37
combustion chamber, CO emissions will be high [75]. On the other hand, oxygen
concentrations higher than 9% (by volume) will promote the creation of NOx, dioxins and
furans [75]. For these reasons, CO and oxygen monitoring is very important.
There are various types of incineration systems such as pile burning, grate fired (stationary,
travelling, vibrating), suspension fired, rotary kiln and fluidized bed (bubbling (BFB) and
circulating (CFB)). Each has its advantages and disadvantages based on efficiency and
quality of combustion, leading to reduced un-burnt fuel emissions. In general going from pile
burning through to fluidized bed combustion implies increased efficiency, quality of
combustion and price.
Figure 2-7 shows an example of an incineration facility for MW&RP with energy recovery
via a steam turbine. In addition, flue gas cleaners are shown since no modern day facility
would be without them; they will be discussed in a later section.
Figure 2-7: A Large MW&RP incineration facility
As stated earlier, when burning MW&RP the emissions can contain “various hazardous
substances such as mercury and other toxic metals, particulate matter (PM), hydrogen
chloride, chlorine gas, undesirable hydrocarbons (VOC’s), and, most notoriously, dioxins and
furans.” [44]. Error! Not a valid bookmark self-reference. gives the distribution of
pollutants found in the by-products of an incineration process. 97% of the sulphur, 99% of
the chlorine, 99% of the lead and 98% of the cadmium is captured either in the bottom ash or
Source: [64]

THE ANALYSYS OF THE POTENTIAL OF MATERIAL AND ENERGY RECOVERY OF MUNICIPAL WASTE IN CANADA
CHAPTER 2: SUSTAINABLE AND INTEGRATED WASTE RELATED MANAGEMENT
2-38
through abatement methods, such as flue gas cleaning. Furthermore, Table 2-11 compares the
European mean and the UK best practice emissions. The values are compared to 1991 levels.
It can be noticed that the percent emission reduction is 89% and above for all and most are
near 99%. It can be concluded from these tables that technologies are improving and although
the emissions are present in MW&RP incineration, they are controllable, and surpass
environmental requirements.
Table 2-10: Percentage distribution of pollutants in incineration
S Cl Pb Cd Abatement residue 60 88 30 83 Bottom ash 37 12 70 15 Atmosphere <3 <0.7 <1 <2.5
Source: [59]
Table 2-11: A comparison of UK (best practice) and European mean WRPtE incineration emissions and percentage improvement over UK 1991 performance
Component
Emission to air in mg/Nm3 – dioxins in ng/Nm3 – dry gas 11% O2 UK 1991
% Reduction
Emission burden
Measured (UK) (best practice)
European (mean)
Waste incineration
Directive
Mean emissions mg/Nm3
(4)-(1) (4)
Best practice emissions a
g/te (1) (2) (3) (4) (5) (6)
Particulates 0.9 2.2 10 500 99.8 4.95 HC1 20 1.6 10 689 97.1 55 HF <0.1 0.03 1 N.A. – 0.55 SO2 36 7.2 50 338 89 198 NOx as NO2 274 29 200 (plant >3 tph) N.A. – 1100 CO 5 – 50 220 98 27.5 VOC <5 – 10 NA – <27.5 Hg <0.02 <0.001 0.05 0.26 99 0.11 Cd <0.001 <0.001 0.05 (Cd & TI) 0.6 99.8 0.0055 Heavy metal summation R7 R12 0.5 >11.0 99 <0.55
<0.1 0.16 Dioxin I-TEQ (ng/Nm3) 0.006 <0.01 0.1 >225 99.9 33 ng
NH3 – – <0.1 – – – Non-biogenic CO2 = 132 kg a(based on (1)) plus NOx of 200 mg/Nm3 and HCl of 10 mg/Nm3
Source: [72]
2.5.4.2.1 Combustion vs. Gasification and Pyrolysis
Although combustion of MW&RP is the most widespread WRPtE technology, it does have
its limitations. How does it compare to gasification and pyrolysis?
Some advantages of gasification and pyrolysis over combustion [75]:
• Better emission control, since gas cleaning can occur prior to combustion
• By-products can be sold

THE ANALYSYS OF THE POTENTIAL OF MATERIAL AND ENERGY RECOVERY OF MUNICIPAL WASTE IN CANADA
CHAPTER 2: SUSTAINABLE AND INTEGRATED WASTE RELATED MANAGEMENT
2-39
• No oxygen implies no dioxins or furans
• Higher thermal efficiency
• Metals are not oxidized
• Smaller amounts of gas to clean (syngas vs. flue gas after combustion)
Some advantages of combustion over gasification and pyrolysis [75]:
• Combustion technology has been around for longer, especially for W&RP
• Capital costs are lower
• Air is cheaper than oxygen
• High pressures may be required especially for hydro-conversion
• Chlorine can cause some problems
• Market may not be developed to purchase by-products steadily
• Corrosion of ash
• Gas cleaning has its challenges (NH3, H2S)
2.5.4.3 Gasification
Gasification involves partially oxidizing the fuel using air or oxygen and steam. The process
takes place between 800 and 1000oC and from 0 up to some 30 atmospheres of pressure [64].
The advantage of such conversion process is to upgrade the quality of the fuel. By gasifying
the feedstock, gas cleaning is possible and it can then be used for many other purposes other
than simply direct heat. The gaseous product of this process is called producer gas and is a
mix of combustibles (carbon monoxide and hydrogen with methane and other HC’s and
condensable tars) along with CO2 and water [64]. The producer gas is then combusted in a
gas turbine, hydrogen and other HC’s can be separated or synthetic gas made. Inert, non-
combustibles are also present such as small char particles, ash and tars. There are three main
types of gasifiers; fixed, fluidized bed and indirect gasifier.
Fixed-bed gasifiers are the traditional technology and can be further differentiated by the
direction of the air flow; Updraft, downdraft and cross-flow. For more detailed information
see [77]. The energy content of the resulting gas is about 75% of the initial feedstock, but
initial moisture content should be less that 20% [77].
Fluidized bed (FB) gasifiers have been used for many years with coal. Their main advantage
over the fixed bed type is the uniform temperature distribution in the gas chamber. This leads
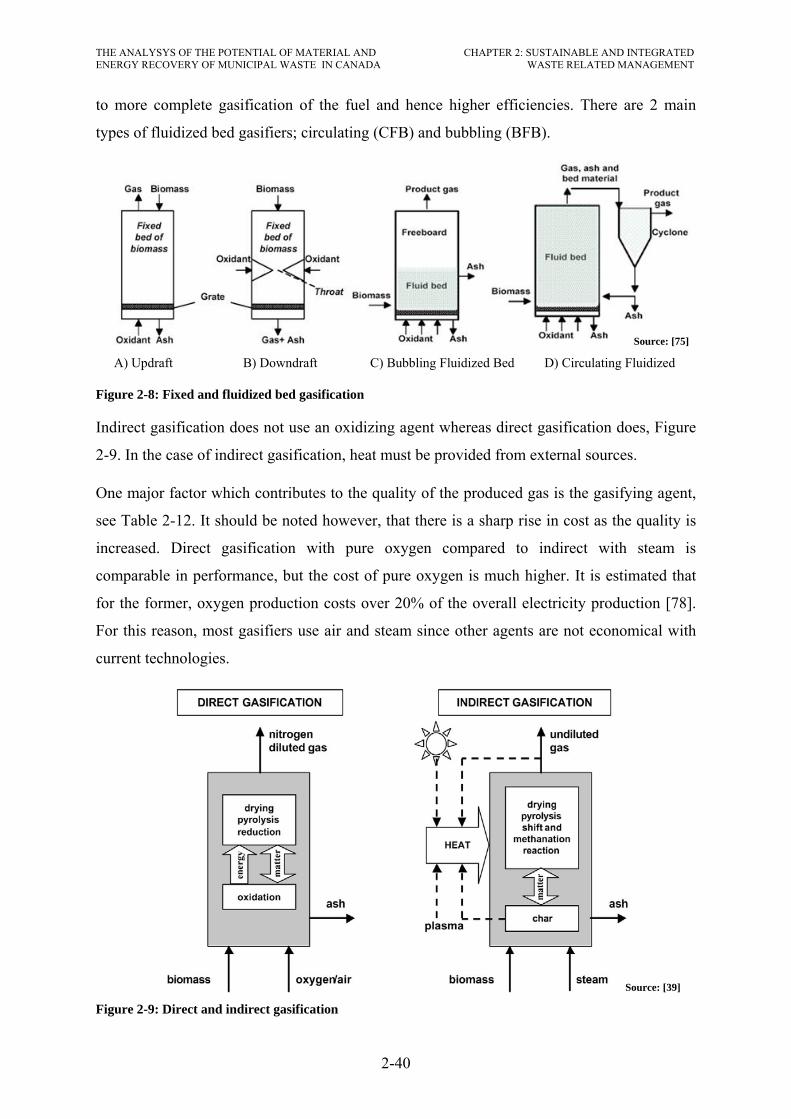
THE ANALYSYS OF THE POTENTIAL OF MATERIAL AND ENERGY RECOVERY OF MUNICIPAL WASTE IN CANADA
CHAPTER 2: SUSTAINABLE AND INTEGRATED WASTE RELATED MANAGEMENT
2-40
to more complete gasification of the fuel and hence higher efficiencies. There are 2 main
types of fluidized bed gasifiers; circulating (CFB) and bubbling (BFB).
Figure 2-8: Fixed and fluidized bed gasification
Indirect gasification does not use an oxidizing agent whereas direct gasification does, Figure
2-9. In the case of indirect gasification, heat must be provided from external sources.
One major factor which contributes to the quality of the produced gas is the gasifying agent,
see Table 2-12. It should be noted however, that there is a sharp rise in cost as the quality is
increased. Direct gasification with pure oxygen compared to indirect with steam is
comparable in performance, but the cost of pure oxygen is much higher. It is estimated that
for the former, oxygen production costs over 20% of the overall electricity production [78].
For this reason, most gasifiers use air and steam since other agents are not economical with
current technologies.
Figure 2-9: Direct and indirect gasification
A) Updraft B) Downdraft C) Bubbling Fluidized Bed D) Circulating Fluidized
Source: [39]
Source: [75]
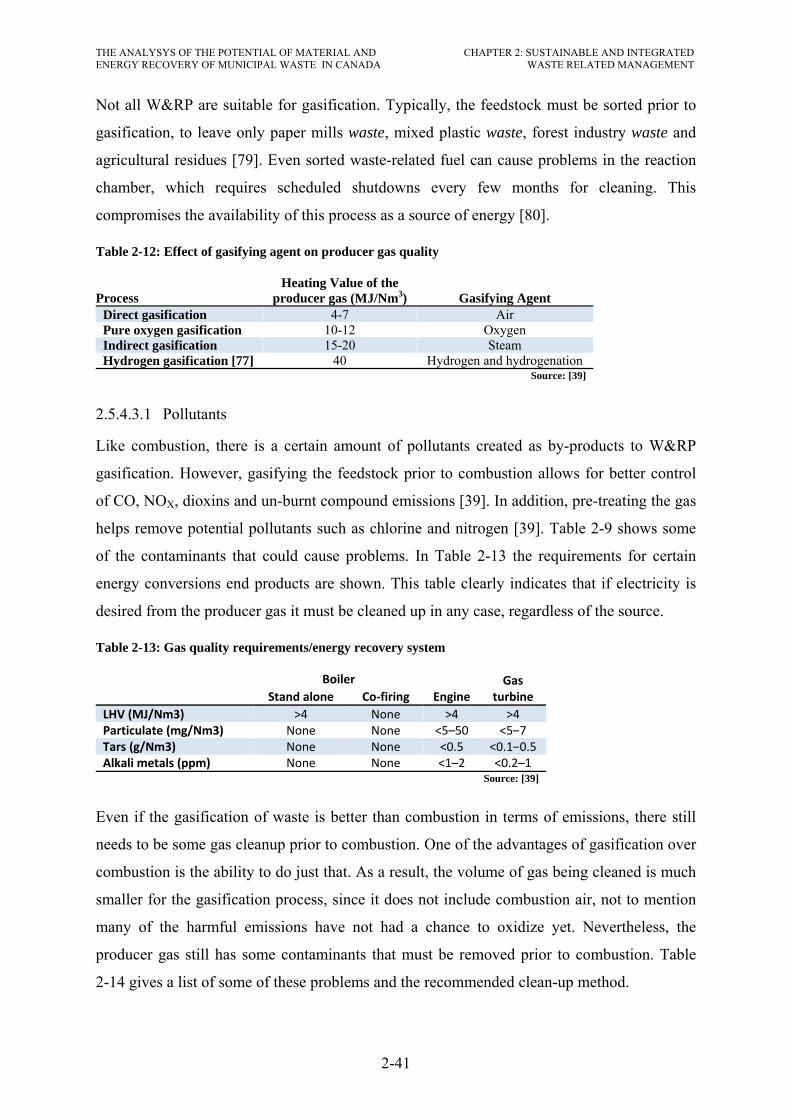
THE ANALYSYS OF THE POTENTIAL OF MATERIAL AND ENERGY RECOVERY OF MUNICIPAL WASTE IN CANADA
CHAPTER 2: SUSTAINABLE AND INTEGRATED WASTE RELATED MANAGEMENT
2-41
Not all W&RP are suitable for gasification. Typically, the feedstock must be sorted prior to
gasification, to leave only paper mills waste, mixed plastic waste, forest industry waste and
agricultural residues [79]. Even sorted waste-related fuel can cause problems in the reaction
chamber, which requires scheduled shutdowns every few months for cleaning. This
compromises the availability of this process as a source of energy [80].
Table 2-12: Effect of gasifying agent on producer gas quality
Process Heating Value of the
producer gas (MJ/Nm3) Gasifying Agent Direct gasification 4-7 Air Pure oxygen gasification 10-12 Oxygen Indirect gasification 15-20 Steam Hydrogen gasification [77] 40 Hydrogen and hydrogenation
Source: [39]
2.5.4.3.1 Pollutants
Like combustion, there is a certain amount of pollutants created as by-products to W&RP
gasification. However, gasifying the feedstock prior to combustion allows for better control
of CO, NOX, dioxins and un-burnt compound emissions [39]. In addition, pre-treating the gas
helps remove potential pollutants such as chlorine and nitrogen [39]. Table 2-9 shows some
of the contaminants that could cause problems. In Table 2-13 the requirements for certain
energy conversions end products are shown. This table clearly indicates that if electricity is
desired from the producer gas it must be cleaned up in any case, regardless of the source.
Table 2-13: Gas quality requirements/energy recovery system
BoilerEngine
Gas turbine Stand alone Co‐firing
LHV (MJ/Nm3) >4 None >4 >4Particulate (mg/Nm3) None None <5–50 <5–7Tars (g/Nm3) None None <0.5 <0.1–0.5Alkali metals (ppm) None None <1–2 <0.2–1
Source: [39]
Even if the gasification of waste is better than combustion in terms of emissions, there still
needs to be some gas cleanup prior to combustion. One of the advantages of gasification over
combustion is the ability to do just that. As a result, the volume of gas being cleaned is much
smaller for the gasification process, since it does not include combustion air, not to mention
many of the harmful emissions have not had a chance to oxidize yet. Nevertheless, the
producer gas still has some contaminants that must be removed prior to combustion. Table
2-14 gives a list of some of these problems and the recommended clean-up method.

THE ANALYSYS OF THE POTENTIAL OF MATERIAL AND ENERGY RECOVERY OF MUNICIPAL WASTE IN CANADA
CHAPTER 2: SUSTAINABLE AND INTEGRATED WASTE RELATED MANAGEMENT
2-42
Solid residues such as char and ash still contain heavy metals and should be disposed in
landfills [39]. The char and ash is collected in three main parts of the process; 2-9% in the
gasifier, 5-10% in the particulate control equipment and 3-6% in the boiler (if used) of the
initial feedstock mass [39].
Table 2-14: Fuel gas contaminants: problems and cleanup processes
Contaminant Range Examples Problems Cleanup method Particulate (g/Nm3) 3–70 Ash, char, fluid bed
material Erosion, emission Filtration, scrubbing
Alkali metals (g/Nm3) Sodium and potassium compounds Hot corrosion Condensation and
filtration Fuel nitrogen (g/Nm3) 1.5–3.0 Mainly NH3 and
HCN NOx formation Scrubbing, SCR
Tars (g/Nm3) 10–100 Refractory aromatics Clog filters, deposit internally
Tar cracking, scrubbing
Sulphur, chlorine (g/Nm3) 2.5–3.5 H2S, HCl Corrosion, emission Lime scrubbing
Source: [39]
Wastewater is produced from various equipment, such as gas coolers and wet scrubbers.
Included in this waste water are soluble and insoluble pollutants (mainly tar); acetic acid,
sulphur, phenols and other oxygenated organic compounds [81]. Tar removal can be difficult
and expensive to do, Table 2-15 compares three (3) methods.
Table 2-15: Advantages and disadvantages of tar removal systems
System Advantages Disadvantages Thermal cracking
Simple control Low cost
LHV losses Low efficiency
Catalytic cracking
LHV unchanged Upgrade too No gas cooled
Catalyser cost Difficult control
Scrubber Easy control Air pollution control
LHV losses Gas cooled Wastewater production
Source: [39]
2.5.4.4 Pyrolysis
Pyrolysis is a form of indirect gasification (Figure 2-9) that uses an inert gas as the gasifying
agent [39]. The process takes place around 500-600oC in the absence of oxygen [56]. The
process produces syngas, char and tar, in fractions that are dependent on the temperature,
residence time and heating rate [56]. Traditionally wood was used to produce charcoal via
this process, except the volatiles were not collected. Since biomass is comprised of mostly
volatiles this was very wasteful. Present day technology condenses the gas to produce bio-oil,
a substitute for petrol products. This oil can then be used for heating or in a gas turbine for

THE ANALYSYS OF THE POTENTIAL OF MATERIAL AND ENERGY RECOVERY OF MUNICIPAL WASTE IN CANADA
CHAPTER 2: SUSTAINABLE AND INTEGRATED WASTE RELATED MANAGEMENT
2-43
electricity or treated and used in vehicles. McKendry [63] reports that if flash pyrolysis is
used bio-oil can contain as much as 80% of the initial feedstock energy. Fast pyrolysis (short
residence time, high heating rate) can be used to have a higher tar yield, whereas slow
pyrolysis (long residence time, low heating rate) will maximize syngas and char production
[56].
The syngas produced depends on the MW&RP composition and has a heating value much
lower than natural gas [56]. The char is comprised of unconverted organic solid and ash
resulting from inorganic materials. It has a heating value equivalent to lignite and coke [56].
The tar fraction is a liquid mixture containing resins, acids, alcohols, intermediate
carbohydrates, phenols, aromatics and aldehydes [56].
There is still little practical information on using MW&RP in the pyrolysis process, but it is
clear that it still has the same environmental issues as combustion and gasification, including
dioxins and furans, mercury and other heavy metals, particulate matter, carbon monoxide,
hydrogen chloride, sulphur dioxide, and more, as well as toxic contaminants in the char or
ash residues, and contaminated waste water [82]. However, pyrolysis is being used in
combination with gasification in newer technologies, as is seen in plasma gasification.
2.5.4.5 Plasma Gasification
Plasma gasification is an interesting emerging technology for WRPtE conversion. It is “a
drastic non-incineration thermal process, which uses extremely high temperatures in an
oxygen-starved environment to completely decompose input waste material into very simple
molecules.” [83]. It combines indirect gasification, pyrolysis and plasmaviii arc torches to
disassociate the molecules. The plasma torch can reach temperatures up to 15,000oC and it
can control temperature independent from the feed quality and supply of air, oxygen and
steam [84]. Plasma gasification generates two products: syngas and vitrified slag [84]. At the
high temperatures, all the inert materials (glass, metal, silicates and heavy metals) are fused
into a volcano lava type fluid, and then hardened to form a silica matrix [84]. The vitrified
slag can be used as an aggregate in concrete [83], as a sub-base in road construction, for sand
blasting [85] and even as raw material for ceramic products [84]. Even more important,
dioxins and furans are reliably destroyed along with other organic contaminants during the
viii “Plasma refers to every gas of which at least a percentage of its atoms or molecules are partially or totally ionized.” [83]

THE ANALENERGY R
gaseous
vitrifica
1.
2.
3.
4.
Figure 2
A pilot
The Pla
descript
LYSYS OF THERECOVERY OF
s and liqui
ation of MW
Pre-treating
o Sep
o Coa
Syngas and
o Pyro
o Gas
o Vitr
Syngas Scr
o Part
o Aci
o Hea
Power gene
o Elec
o Com
-10: Overview
project of t
asco Energy
tion follows
E POTENTIAL OF MUNICIPAL W
id phases o
W&RP is co
g the MW&
parating out
arse shreddi
d Inert slag p
olysis,
sification,
rification.
rubbing (cle
ticulate mat
d gases,
avy metals.
eration;
ctricity,
mbined Hea
w of the Plas
this technol
y Group [86
s their proce
OF MATERIAL AWASTE IN CAN
of the pro
omposed of
&RP;
low caloric
ing.
production;
eaning);
tter (PM),
at and Powe
co plasma ga
logy is in th
6] is using s
ess, Figure
AND NADA
2-44
cess [85].
four main s
c value wast
er (CHP).
asification pro
he last stage
orted MW&
2-10.
CHAPTE
A facility
sub-process
te (glass, gr
ocess
es of comm
&RP to prod
ER 2: SUSTAINAWASTE R
for plasm
es;
rit, metal),
missioning (
duce electri
ABLE AND INTRELATED MANA
ma gasificat
(at time of w
icity. The fo
Sou
TEGRATED AGEMENT
tion and
writing).
ollowing
urce: [86]

THE ANALENERGY R
Pyrolys
oxygen
in the fo
inorgan
(Figure
flow rat
allows i
1100oC
Figure 2
The ref
MW&R
the side
promote
The pro
to the s
are com
torches
refine th
Two 30
the vess
the cent
heated t
LYSYS OF THERECOVERY OF
sis involves
-starved env
form of large
nic fraction
2-11) that
te. The inc
it to extract
C). Both pyro
-11: Primary
fractory line
RP enter fro
es, and the
es mixing m
oduct gas fr
second stage
mbined with
are never i
he syngas [8
00kW Phoen
sel. The tor
ter of the re
to 1000-110
E POTENTIAL OF MUNICIPAL W
the exposu
vironment.
e HC, H2O,
of the waste
allows for
coming air i
t heat from t
olysis and g
y (left) and Se
ed reactor v
om the top,
e ash exits
moves the fe
om the first
e (Figure 2-
h the plasm
n contact w
86].
nix DC plas
rches are ae
eaction vess
00oC.
OF MATERIAL AWASTE IN CAN
ure of organ
The foremo
, H2, N2, CO
e. Plasco’s
full contro
s preheated
the Syngas
gasification
econdary (rig
vessel featu
the moistur
from the b
eedstock be
t chamber (
-11), where
ma heat to
with the MW
sma torches
erodynamica
sel. This pr
AND NADA
2-45
ic materials
ost products
O, and CO2,
approach ut
ol of fuel fe
d to approxim
farther dow
occur here.
ght) Reaction
ures an ope
re and volat
bottom of t
tween stage
mainly CO,
e plasma ga
destroy al
W&RP, they
s with copp
ally control
romotes gre
CHAPTE
s to tempera
s of the proc
ash or tares
tilizes a thre
eed rate and
mately 600
wnstream (th
.
Vessels for P
en-core dow
tiles exit fro
the chambe
es at a contr
, H2, tars an
sification o
ll long chai
y are just us
er electrode
led such tha
eater interac
ER 2: SUSTAINAWASTE R
atures in exc
cess are mo
s, and fixed
ee stage prim
d mixing, teoC using a h
hat is opera
Plasma Gasif
wndraft-like
om the top,
er. An ext
rollable rate
nd un-reacte
ccurs. The
in hydrocar
ed as a high
es are insert
at the arcs a
ction with th
ABLE AND INTRELATED MANA
cess of 400
oisture and v
d carbon, mo
mary reacto
emperature,
heat exchan
ating betwee
fication Proce
e design in
the air ente
tendable gr
e.
ed carbon) c
gas and pro
rbons. The
hly efficien
ted along th
are located c
he Syngas w
Sou
TEGRATED AGEMENT
°C in an
volatiles
ostly the
or vessel
, and air
nger that
en 1000-
ess
that the
ers from
rate that
continue
ocess air
plasma
nt way to
he top of
closer to
which is
urce: [86]

THE ANALYSYS OF THE POTENTIAL OF MATERIAL AND ENERGY RECOVERY OF MUNICIPAL WASTE IN CANADA
CHAPTER 2: SUSTAINABLE AND INTEGRATED WASTE RELATED MANAGEMENT
2-46
Contrary to most processes that rely on direct plasma heating of the fuel for gasification,
Plasco uses the ionization cascade in plasma as a catalyst to gasification. The high reactivity
of electrons and positively charged ions accelerate molecular dissociation. The long
hydrocarbon molecules that remain after the primary (pyrolysis) are then destroyed and
refined, leaving a cleaner and lighter Syngas. The Syngas is mainly composed of CO and H2,
however N2, CO2, HCl, NOx, CH4, HCN, and COS can also be present.
The inorganic components remaining after pyrolysis/gasification move onto the third stage
(Figure 2-12) where they are vitrified into an inert slag in the form of a silica matrix. Of
recent interest, is the improvement of the remaining slag for applications such as those
mentioned above. In addition studies have shown that with the addition of SiO2 and MgO,
leaching of heavy metal ions is significantly reduced [87]. Furthermore, these glasses
showed an increase in Vickers hardness, bending strength, and toughness [87].
Figure 2-12: Vitrification Vessel for Slag Melting
Plasco’s vitrification vessel is shown in Figure 2-12, utilizes a single 300kW Phoenix DC
plasma torch to apply direct heat to the fly ash that remains after the primary and secondary
vessels. Unlike the approach for gasification, this process relies on direct heat from plasma to
melt the ash. The remaining volatiles and fixed carbon are further converted to Syngas by
setting the temperature to 1300oC in order to promote carbon-monoxide formation.
The residue is then vitrified to form inert slag at a rate of 150kg/tonne of MW&RP. Silica,
glass, and aluminum require 1300oC whereas steel is heated to 1650oC. Preliminary results
have shown a 5-10 fold volume reduction of ash and effective destruction of dioxins, furans,
and inertisation of heavy metals.
The syngas is then cleaned before storage and power generation.
Source: [86]
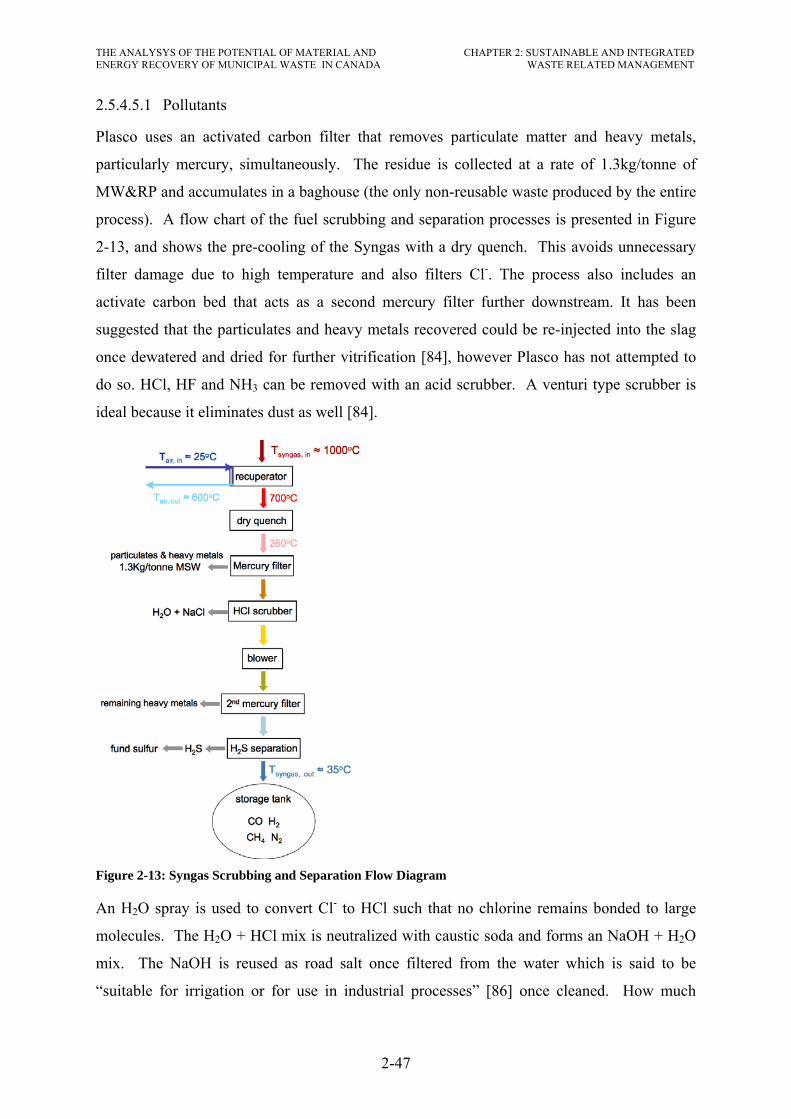
THE ANALYSYS OF THE POTENTIAL OF MATERIAL AND ENERGY RECOVERY OF MUNICIPAL WASTE IN CANADA
CHAPTER 2: SUSTAINABLE AND INTEGRATED WASTE RELATED MANAGEMENT
2-47
2.5.4.5.1 Pollutants
Plasco uses an activated carbon filter that removes particulate matter and heavy metals,
particularly mercury, simultaneously. The residue is collected at a rate of 1.3kg/tonne of
MW&RP and accumulates in a baghouse (the only non-reusable waste produced by the entire
process). A flow chart of the fuel scrubbing and separation processes is presented in Figure
2-13, and shows the pre-cooling of the Syngas with a dry quench. This avoids unnecessary
filter damage due to high temperature and also filters Cl-. The process also includes an
activate carbon bed that acts as a second mercury filter further downstream. It has been
suggested that the particulates and heavy metals recovered could be re-injected into the slag
once dewatered and dried for further vitrification [84], however Plasco has not attempted to
do so. HCl, HF and NH3 can be removed with an acid scrubber. A venturi type scrubber is
ideal because it eliminates dust as well [84].
Figure 2-13: Syngas Scrubbing and Separation Flow Diagram
An H2O spray is used to convert Cl- to HCl such that no chlorine remains bonded to large
molecules. The H2O + HCl mix is neutralized with caustic soda and forms an NaOH + H2O
mix. The NaOH is reused as road salt once filtered from the water which is said to be
“suitable for irrigation or for use in industrial processes” [86] once cleaned. How much
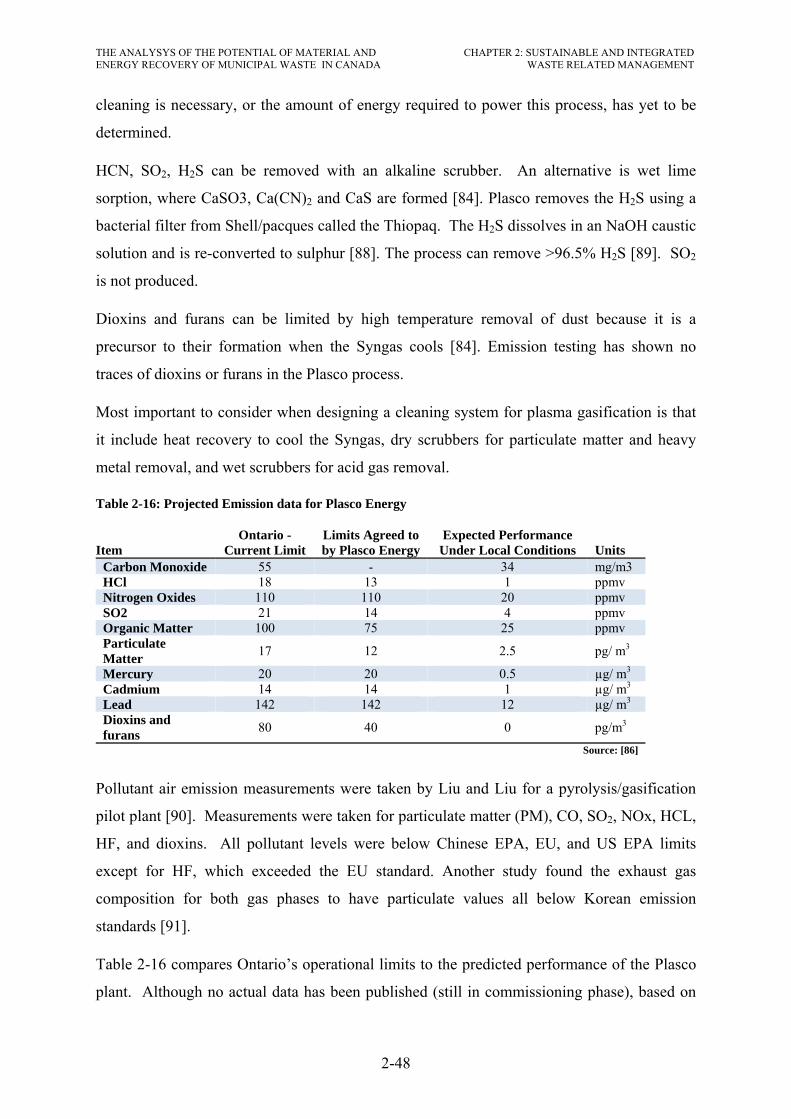
THE ANALYSYS OF THE POTENTIAL OF MATERIAL AND ENERGY RECOVERY OF MUNICIPAL WASTE IN CANADA
CHAPTER 2: SUSTAINABLE AND INTEGRATED WASTE RELATED MANAGEMENT
2-48
cleaning is necessary, or the amount of energy required to power this process, has yet to be
determined.
HCN, SO2, H2S can be removed with an alkaline scrubber. An alternative is wet lime
sorption, where CaSO3, Ca(CN)2 and CaS are formed [84]. Plasco removes the H2S using a
bacterial filter from Shell/pacques called the Thiopaq. The H2S dissolves in an NaOH caustic
solution and is re-converted to sulphur [88]. The process can remove >96.5% H2S [89]. SO2
is not produced.
Dioxins and furans can be limited by high temperature removal of dust because it is a
precursor to their formation when the Syngas cools [84]. Emission testing has shown no
traces of dioxins or furans in the Plasco process.
Most important to consider when designing a cleaning system for plasma gasification is that
it include heat recovery to cool the Syngas, dry scrubbers for particulate matter and heavy
metal removal, and wet scrubbers for acid gas removal.
Table 2-16: Projected Emission data for Plasco Energy
Item Ontario -
Current Limit Limits Agreed to by Plasco Energy
Expected Performance Under Local Conditions Units
Carbon Monoxide 55 - 34 mg/m3 HCl 18 13 1 ppmv Nitrogen Oxides 110 110 20 ppmv SO2 21 14 4 ppmv Organic Matter 100 75 25 ppmv Particulate Matter 17 12 2.5 pg/ m3
Mercury 20 20 0.5 µg/ m3 Cadmium 14 14 1 µg/ m3 Lead 142 142 12 µg/ m3 Dioxins and furans 80 40 0 pg/m3
Source: [86]
Pollutant air emission measurements were taken by Liu and Liu for a pyrolysis/gasification
pilot plant [90]. Measurements were taken for particulate matter (PM), CO, SO2, NOx, HCL,
HF, and dioxins. All pollutant levels were below Chinese EPA, EU, and US EPA limits
except for HF, which exceeded the EU standard. Another study found the exhaust gas
composition for both gas phases to have particulate values all below Korean emission
standards [91].
Table 2-16 compares Ontario’s operational limits to the predicted performance of the Plasco
plant. Although no actual data has been published (still in commissioning phase), based on

THE ANALYSYS OF THE POTENTIAL OF MATERIAL AND ENERGY RECOVERY OF MUNICIPAL WASTE IN CANADA
CHAPTER 2: SUSTAINABLE AND INTEGRATED WASTE RELATED MANAGEMENT
2-49
the results from comparable processes, emission concentrations should be within the
provincial limits.
2.5.5 Engineered Landfill
Landfill is still a major part of our waste-related management system. Although it should
only be used as a last resort, it seems that there is still a need for it. Thermal and chemical
treatments of W&RP are not the only processes to have seen technological growth. Landfills
have vastly improved in terms of their environmental impacts. Engineered landfill sites are
designed to dispose of residual waste in a secure manner, which keeps the impacts on the
environment to a minimum [92], Figure 2-14.
Figure 2-14: Engineered Landfill
The waste & recoverable products are placed in a waterproof cell (lined with a rubber geo-
membrane), levelled, compacted and periodically covered with soil to keep odours and
vermin to a minimum. At the bottom of each cell is a network of perforated pipes to capture
the leachate. Leachate is water that infiltrated into the cells and mixes with the W&RP.
Evidently, the percolating rain water captures contaminants from the W&RP as it passes. The
resulting leachate can be comprised of the following (but not limited to) [94]:
• Dissolved organic matter (alcohols, acids, aldehydes, short chain sugars etc.)
Source: [93]

THE ANALYSYS OF THE POTENTIAL OF MATERIAL AND ENERGY RECOVERY OF MUNICIPAL WASTE IN CANADA
CHAPTER 2: SUSTAINABLE AND INTEGRATED WASTE RELATED MANAGEMENT
2-50
• Inorganic macro components (common cations and anions including sulphate
chloride, Iron, aluminum, zinc and ammonia)
• Heavy metals (Pb, Ni, Cu, Hg)
• Xenobiotic organic compounds such as halogenated organics (PCBs, dioxins etc.)
The leachate is collected in a pond and treated before being released back into the
environment. Surface water is also collected in trenches around the landfill site and sent to
the same pond for treatment.
Once these cells are full, they are covered with a rubber membrane and gas wells are
installed. These wells remove the gas produced from the natural decomposition of organic
matter (see anaerobic digestion above). The produced gas is mainly methane (50-75% of total
gas vol.) and CO2 with traces of hydrogen sulphide. But due to the nature of the landfill waste
(MW&RP, IC&I, construction and demolition), many other harmful gases are created. The
collected gas can then be flared or combusted to produce energy.
However, the decay of the biodegradables happens over a long period of time. So long that it
takes 20 years for the majority of the gas to be produced (although this varies quite
drastically), and can continue for 50 years [95]. For this reason, critics say that only a small
percentage of the gas is actually captured and hence it is a flawed environmental mitigation
measure. The US EPA had stated that 75% of the landfill gas could be collected over the
lifetime of a site [96]. After closer inspection however, these figures are way off. Table 2-17
shows that in fact, the collection efficiency of the landfill gas is more like 19% over the 100
year time horizon. This translates into a reduction of 0.01 ton CO2eq/wet ton of MW&RP, or
5.1% over the lifetime of the landfill [96]…Hardly worth the effort. It is by far more effective
to ban biodegradables from landfills than to try and capture the gas.
Table 2-17: Collection of landfill gas
Phase Time Interval
(years) Portion of Gas Produced
in Time Period
Collection Efficiency in Time
Period
Weighted Collection Efficiency
Before Pipes 0 to 5 6.0% 0.0% 0.0% Before Cover 6 to 10 11.9% 25.0% 3.0% Functioning 11 to 30 32.1% 50.0% 16.1% After shutoff 31 to 100 50.0% 0.0% 0.0%
Total 100.0% 19.0% Source: [96]
In an effort to address some of the escaping methane after a site has been closed, a restoration
layer can be added above the rubber membrane, identified in Figure 2-14 as the soil cover.

THE ANALYSYS OF THE POTENTIAL OF MATERIAL AND ENERGY RECOVERY OF MUNICIPAL WASTE IN CANADA
CHAPTER 2: SUSTAINABLE AND INTEGRATED WASTE RELATED MANAGEMENT
2-51
This has two effects; one to improve the appearance of the landfill and two to convert some
of the methane into CO2. As escaping methane passes through the restoration layer, it comes
in contact with methanogens which then create CO2 [43]. Although logical, this option is not
always practical or financially feasible.
Another area for malfunction is the liners. Ultimately, over time they will fail [97]. A truly
sustainable landfill would ensure that W&RP products are safely assimilated into the
environment [97]. Although this might not be possible in the long term (gas release and geo-
membrane failures), it is at the political level where criteria need to be established and
enforced to ensure that the environmental impacts are minimal [97]. Fundamentally, there are
plenty of existing, operating landfills which need to be “cleaned up” and engineered landfills
can offer some help in this respect. Also, the new and innovative WRPtE technologies (clean
incineration or plasma gasification) still do produce a certain amount of waste as by-product,
which require landfill. Hence, landfills may still be required in the foreseeable future.
2.5.6 Conclusions – Energy Recycling
In summary, waste-related products to energy technologies are far from perfect. However
newer conversion and emission cleaning technologies have shown to be leagues ahead of
their predecessors. Furthermore, when it comes down to the disposal of W&RP, the
alternatives are WRPtE vs. landfill. Both have their pros and cons, but the reality remains:
• WRPtE is a form of ‘energy recycling’, where landfills represent wasted resources and energy
• Landfill gas capture has been proven flawed at best • Both processes produce solid, liquids and gaseous by-products that require treatment
however, WRPtE is performed in controlled environments where these things can be mitigated
Furthermore, within the hierarchy of WRPtE, incineration is the least desirable (less efficient,
more problems with emissions) and newer, higher temperature process are better (such as
plasma gasification). For some of the more traditional technologies, the electrical conversion
efficiencies are included in Table 2-18.
In general organics are better suited for biochemical conversions and more complex
hydrocarbons (e.g. plastics) for thermochemical processes. In almost all cases, physical
processing is required in order to sort out the required products. Within an SIWRM scheme,
this can actually promote recycling, reuse and ensure that W&RP are being used as they
should. Figure 2-15 gives an example of a sorting and biochemical WRPtE facility. It should

THE ANALENERGY R
be note
going to
Table 2-
Convers
CombusGrate fiFluidizeGasificaDowndrUpdraftFluidizegasificaFluidizegasificaFluidizegasificaAnaeroDigesteDigeste
Figure 2
LYSYS OF THERECOVERY OF
ed however,
o recycling
18: Conversi
ion Process
stion iring ed bed combuation raft-gasificatiot-gasification ed bed ation—atmosped bed ation—atmosped bed ation—pressurobic Digestioner er
-15: Example
E POTENTIAL OF MUNICIPAL W
, that the pl
or further th
ion efficiency
Pow
Steaustion Stea
on Gas Gas
pheric Gas
pheric Comcycle
rized Comcycle
n Gas Gas
e of a sorting
OF MATERIAL AWASTE IN CAN
lastics and m
hermal proc
of electricity
wer Cycle S
am cycle 0am cycle 0
engine <engine 0
engine 0
mbined e 5
mbined e 5
-engine 0
g and WRPtE
AND NADA
2-52
metals bein
cessing.
y generation p
ize (MWe)
.11 - 150
.5 – 200
<5 .5 - 50
.5 – 200
– 200
– 300
.05 - 30
E facility
CHAPTE
ng sent to ‘l
processes
Efficiency (%)
17 - 37% 17 - 33%
20 - 30% 25 - 30%
20 - 35%
30 - 45%
40 - 50%
20 - 50% 10 - 16%
ER 2: SUSTAINAWASTE R
landfill’, an
Efficiency F
eff = 2.3365*eff = 2.3383*
- -
eff = 1.7021*
eff = 3.8902*
eff = 1.2537*
- -
ABLE AND INTRELATED MANA
nd should in
Formula (%)
*Ln(MWe) + *Ln(MWe) +
*Ln(MWe) +
*Ln(MWe) +
*Ln(MWe) +
Sou
TEGRATED AGEMENT
n fact be
21.642 20.204
24.298
23.423
39.981
urce: [98]
THE ANALYSYS OF THE POTENTIAL OF MATERIAL AND ENERGY RECOVERY OF MUNICIPAL WASTE IN CANADA
CHAPTER 2: SUSTAINABLE AND INTEGRATED WASTE RELATED MANAGEMENT
2-53
2.6 Conclusions
In this chapter, the concept of sustainable & integrated waste-related management was
presented. From this discussion it has become clear that waste-related management has been
around for centuries, and it has evolved out need for survival (keeping disease, rodents and
animals away from cities). However, since the industrial revolution we have been extracting
resources and wasting them at exponentially increasing rates. This has caused a stress on our
environment and we are now faced with the dilemma of dealing with the effects of our
“progress”. For this reason, modern waste-related management strategies are needed more
than ever.
The traditional waste-related management hierarchy has gotten us to this point, but it is no
longer enough, primarily because it’s misused and secondly because it does not address the
bigger picture inherent in the sustainable development context. A major shift is required in
the way we perceive and generate waste-related products. The first step is minimisation and
prevention. This can only be achieved by changing our habits, i.e. consuming less and buying
durable products with minimal packaging. Inevitably, some waste & recoverable products
will always be generated and diversion from disposal is essential, i.e. reusing, composting
and recycling. Recycling is a last diversion resort since it is energy intensive and degrades the
quality of the materials the more it gets recycled. Finally, there will always be certain
amounts of residual waste & recoverable products requiring disposal.
There are two ways to dispose of these residual materials: waste-related products to energy or
landfill. It has been shown that landfills offer few benefits over energy recycling. Considering
transportation and land costs, environmental accidents, operating lifetime and clear
overstatement of the landfill gas capture potential, landfills have become less and less
popular. Waste-related products to energy facilities on the other hand are not ideal either.
They produce toxic emissions, solid and liquid hazardous by-products and they are
expensive. However, these unwanted elements are produced in closed environments with
emission cleaning technologies and hence are more readily controllable. In addition, useful
energy is created which actually has a positive effect on the environment since the
atmospheric emissions as a whole caused by WRPtE facilities offset those from other power
generation. For the same energy generated, WRPtE facilities have proven to be better in
terms of global warming, human toxicity, acidification and photochemical oxidation.

THE ANALYSYS OF THE POTENTIAL OF MATERIAL AND ENERGY RECOVERY OF MUNICIPAL WASTE IN CANADA
CHAPTER 2: SUSTAINABLE AND INTEGRATED WASTE RELATED MANAGEMENT
2-54
WRPtE facilities offer a tangible solution for our residual waste issues. Depending on the
inputs and desired outputs there exist many different technologies, ranging from anaerobic
digestion, basic incineration to newer plasma gasification processes.
Each technology has its merits and drawbacks, which depend a lot on how the facilities are
operated. But in general, the higher temperature processes offer the best energy conversion
and pollution control. Plasma gasification is proving to be a cost effective, environmentally
sound and innovative solution to our residual waste problems.
Anaerobic digestion (with energy production) or aerobic digestion (composting) should
happen in any case, regardless of one’s position on WRPtE. Organics comprise over 1/3 of
our municipal waste & recoverable products and are the main drivers of landfill gas and
odours. They should never be sent to landfill. Simply by excluding these from the W&RP
stream, the disposal system is significantly reduced.
In essence this chapter has shown that current waste-related management systems are flawed
and need revision. We can never achieve a sustainable development without applying a new
hierarchy and a broader spectrum of initiatives that encompass the entire waste-related
stream. At the forefront is reduction. The concepts of ownership and accountability should be
rigorously applied, i.e. if you produce it, buy it or throw it away, you should be responsible
for it.

THE ANALYSYS OF THE POTENTIAL OF MATERIAL AND ENERGY RECOVERY OF MUNICIPAL WASTE IN CANADA
CHAPTER 3: CANADIAN SUSTAINABLE ANDINTEGRATED WASTE-RELATED MANAGEMENT POLICY
3-1
CHAPTER 3: CANADIAN SUSTAINABLE AND INTEGRATED WASTE-RELATED MANAGEMENT POLICY
3.1 Introduction
Canada is a vast country, with a low population density. Each province and territory is
responsible to set its own waste-related management policy and the regions or municipalities
must develop their own plans based on their local needs. As a result it is difficult to have
unified and consolidated targets across the nation.
As described in the previous chapter, many of the modern day applications of Sustainable &
Integrated Waste-Related Management (SIWRM) require strong leadership, public education,
inter-departmental cooperation and public funding. This chapter will investigate these
elements in Canada by discussing federal and provincial strategies and policies relating to
this topic.
Canada is also one of the greater producers of waste & recoverable products in the world, as
seen in Chapter 1. The details of the current MW&RP situation in Canada are explored in this
chapter with comparisons made between the provinces and territories. Canada’s performance
is also compared with other countries in the world.
The goal of this chapter is to elaborate on the current Canadian geo-political climate
regarding waste-related management and give some recommendations on how things could
be improved based on the hierarchy discussed in Chapter 2. The conclusions of which will be
combined with those of Chapter 4 to help guide Canada towards a more sustainable future.
3.2 Canadian Performance
Canada is blessed with a large amount of land and a low population density. The country
covers 9,017,699 km2 with a population of 31,612,897 (2006), hence a population density of
3.5 people/km2. Only six metropolitan areas in the country have over 1 million inhabitants,
which account for more than half the country’s population, living on less than 0.5% of the
land (average urban population density of 375 per km2). Many areas of the country are
remote and sparsely populated. For example, the Yukon, Nunavut and Northwest Territories
(NWT) have less than 0.03 inhabitants per km2. Removing the 3 territories and the major
metropolises from the calculations, the balance of rural Canada is populated by 2.8 people per
km2. Table 3-1 shows a breakdown of Canada’s pertinent population statistics.
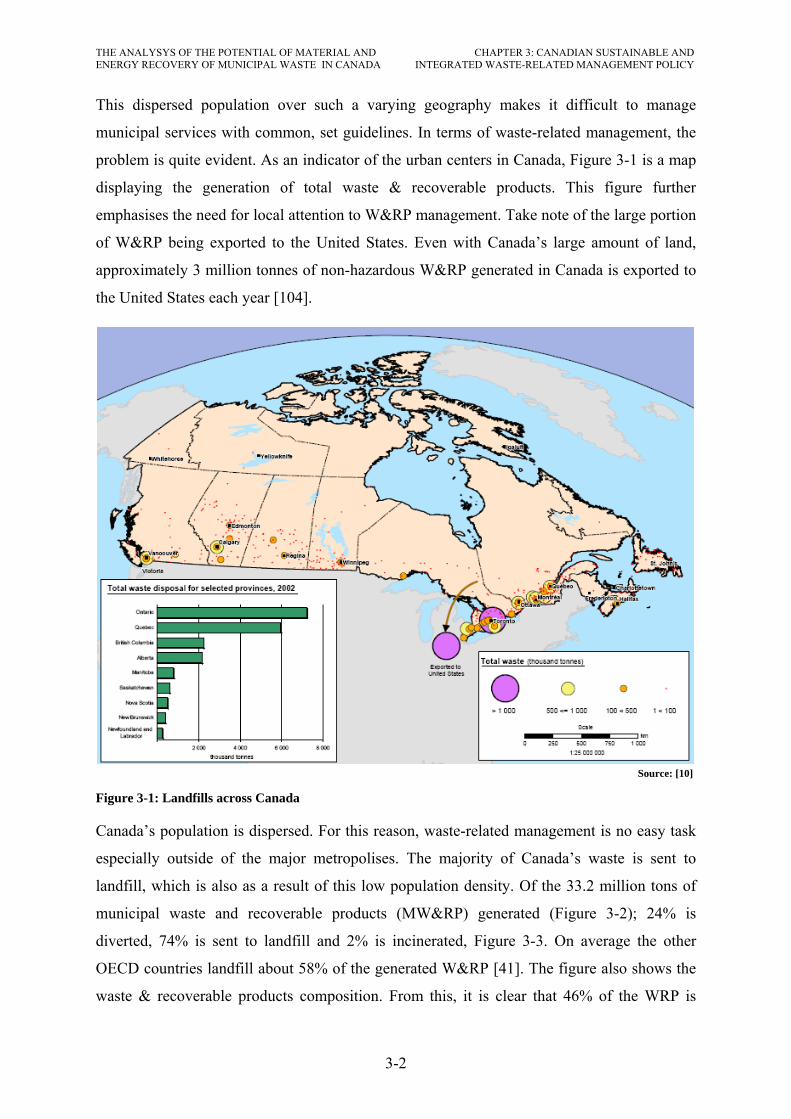
THE ANALYSYS OF THE POTENTIAL OF MATERIAL AND ENERGY RECOVERY OF MUNICIPAL WASTE IN CANADA
CHAPTER 3: CANADIAN SUSTAINABLE ANDINTEGRATED WASTE-RELATED MANAGEMENT POLICY
3-2
This dispersed population over such a varying geography makes it difficult to manage
municipal services with common, set guidelines. In terms of waste-related management, the
problem is quite evident. As an indicator of the urban centers in Canada, Figure 3-1 is a map
displaying the generation of total waste & recoverable products. This figure further
emphasises the need for local attention to W&RP management. Take note of the large portion
of W&RP being exported to the United States. Even with Canada’s large amount of land,
approximately 3 million tonnes of non-hazardous W&RP generated in Canada is exported to
the United States each year [104].
Figure 3-1: Landfills across Canada
Canada’s population is dispersed. For this reason, waste-related management is no easy task
especially outside of the major metropolises. The majority of Canada’s waste is sent to
landfill, which is also as a result of this low population density. Of the 33.2 million tons of
municipal waste and recoverable products (MW&RP) generated (Figure 3-2); 24% is
diverted, 74% is sent to landfill and 2% is incinerated, Figure 3-3. On average the other
OECD countries landfill about 58% of the generated W&RP [41]. The figure also shows the
waste & recoverable products composition. From this, it is clear that 46% of the WRP is
Source: [10]

THE ANALYSYS OF THE POTENTIAL OF MATERIAL AND ENERGY RECOVERY OF MUNICIPAL WASTE IN CANADA
CHAPTER 3: CANADIAN SUSTAINABLE ANDINTEGRATED WASTE-RELATED MANAGEMENT POLICY
3-3
recyclable (paper, plastic, metal and glass), 28% compostable and 8% wood. In essence,
without knowing what the ‘other’ WRP are, 82% of the total could be diverted and the
remaining 18% would need to be disposed. Canada is diverting only 24% when it could
conceivably reach 82%...there’s much room for improvement.
Table 3-1: Population across Canada
City Populationa Area (km2)b Population Density Major Cities Toronto, Ontario 2,503,281 630 3,972.4 Montreal, Quebec 1,854,442 499 3,714.9 Calgary, Alberta 988,193 727 1,360.2 Ottawa, Ontario 846,802 3,274 258.7 Edmonton, Alberta 730,372 684 1,067.2 Winnipeg, Manitoba 633,451 464 1,365.2 Vancouver, British Columbia 578,041 115 5,039.0 Hamilton, Ontario 504,559 1,117 451.6 Quebec City, Quebec 491,142 454 1,081.2 Total 9,130,283 7,964 1,146.4 28.9% 0.1% Major Metropolitan Areas Toronto, Ontario 5,113,149 5,904 866.1 Montreal, Quebec 3,635,571 4,259 853.6 Vancouver, British Columbia 2,116,581 2,877 735.6 Ottawa, Ontario & Gatineau, Quebec 1,130,761 5,716 197.8 Edmonton, Alberta 1,034,945 9,418 109.9 Calgary, Alberta 1,079,310 5,107 211.3 Quebec City, Quebec 715,515 3,277 218.4 Winnipeg, Manitoba 694,668 5,303 131.0 Hamilton, Ontario 692,911 1,372 505.1 Total 16,213,411 43,233 375.0 51.3% 0.5% Rest of Canada Yukon, Nunavut and NWT 101,310 3,547,801 0.03 0.3% 39.3% Rest of Canada 15,298,176 5,426,665 2.8 48.4% 60.2% Canada 31,612,897 9,017,699 3.5 a Population excludes census data for one or more incompletely enumerated Indian reserves or Indian settlements. b Area does not include lakes and river.
Source: Statistics Canada Census 2006 [99]
Canada only has 7 main W&RP incineration facilities, 5 of which have energy recovery. The
total throughput of these 7 facilities is 763,000 tons of W&RP per year [13]. Two newer
technology facilities are being built, a Plasma gasification plant in Ottawa, ON and a
gasification plant in Edmonton, AB. Unfortunately, statistics show that the existing facilities
are heavy polluters, which release dioxins and furans, Table 2-8. However, it is estimated that
Canada’s landfills are responsible for about 38% of the country’s total methane emissions
[67].
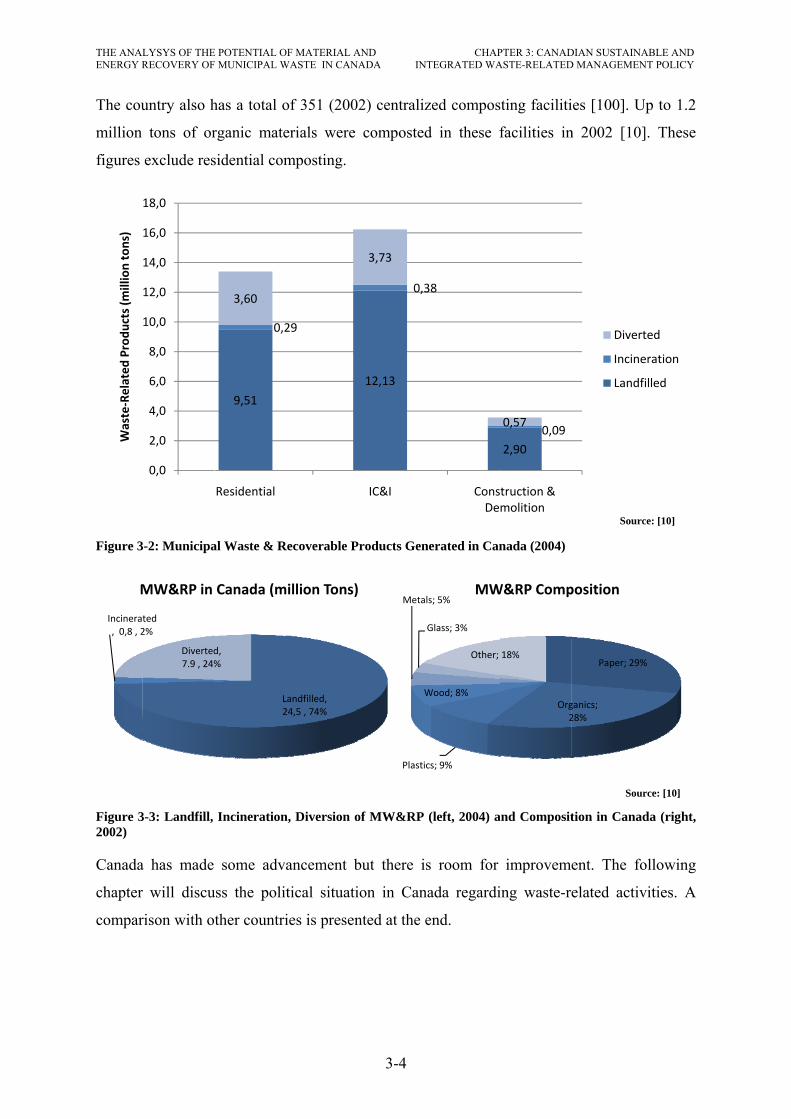
THE ANALENERGY R
The cou
million
figures
Figure 3
Figure 32002)
Canada
chapter
compar
Waste‐Related
Produ
cts (m
illion tons)
Incinerat, 0,8 , 2
M
LYSYS OF THERECOVERY OF
untry also h
tons of or
exclude res
-2: Municipa
3-3: Landfill,
a has made
will discu
rison with o
0,0
2,0
4,0
6,0
8,0
10,0
12,0
14,0
16,0
18,0
ted2%
Diverted7.9 , 24%
MW&RP in
E POTENTIAL OF MUNICIPAL W
has a total o
rganic mate
sidential com
al Waste & R
Incineration
some adv
uss the polit
ther countri
9,51
0,2
3,60
Residential
L2
d, %
Canada (m
OF MATERIAL AWASTE IN CAN
of 351 (200
erials were
mposting.
Recoverable P
n, Diversion o
ancement b
tical situati
ies is presen
29
Landfilled, 24,5 , 74%
million Tons)
AND NADA INT
3-4
02) centraliz
composted
Products Gen
of MW&RP (
but there is
ion in Cana
nted at the e
12,13
0,3
3,73
IC&I
)
Plastic
W
Metals
G
CHAPTEGRATED WA
zed compos
d in these f
erated in Can
(left, 2004) a
s room for
ada regardi
end.
38
ConsDe
cs; 9%
Wood; 8%
s; 5%
Glass; 3%
Other;
MW
PTER 3: CANADASTE-RELATED
ting faciliti
facilities in
nada (2004)
nd Composit
improveme
ing waste-re
2,900,09
0,57
truction & molition
Org2
18%
W&RP Comp
DIAN SUSTAINAD MANAGEMEN
ies [100]. U
n 2002 [10]
tion in Canad
ent. The fo
elated activ
Divert
Incine
Landf
Paper; 29%
ganics; 28%
position
Sourc
Sour
ABLE ANDNT POLICY
Up to 1.2
]. These
da (right,
ollowing
vities. A
ted
eration
filled
%
ce: [10]
rce: [10]

THE ANALYSYS OF THE POTENTIAL OF MATERIAL AND ENERGY RECOVERY OF MUNICIPAL WASTE IN CANADA
CHAPTER 3: CANADIAN SUSTAINABLE ANDINTEGRATED WASTE-RELATED MANAGEMENT POLICY
3-5
3.3 Canadian waste policy
Before understanding the direction Canada’s policy makers have chosen with regards to
waste-relate management, it is important to have an overview of the current organizational
structure.
In general, waste disposal and diversion in Canada is a shared responsibility among all levels
of government. The Federal government regulates international and interprovincial/territorial
exchanges of waste and recyclables. Provinces and territories regulate the intra-
provincial/intra-territorial movement of waste and recyclables in addition to licensing the
producers, transporters and treatment facilities within their authority. Furthermore, the
provinces/territories are responsible to set out minimum environmental guidelines with
respect to the handling and disposal of this waste.
It is bestowed upon the municipalities to develop their own waste-related management plans
to align with the respective provincial or territorial guidelines. It’s acceptable and even
encouraged to develop inter-municipal agreements to help bear the burden of waste-related
diversion, transportation and disposal infrastructures.
In this structure lies the problem. The National government leaves it up to each municipality
to develop its own plans for waste disposal. This allows for many different approaches to the
problem, some of which are excellent examples of technology that meet the most stringent
sustainable values of WRM, whereas some barely achieve minimum environmental standards
set out by the provincial/territorial governments.
3.3.1 Federal
The Canadian federal government has two main departments which set and regulate
environmental initiatives and regulations, Environment Canada (EC) and the Canadian
Council of Ministers of the Environment (CCME). EC is a federal agency which mainly sets
out general goals for the country. For WRM it is engaged in such activities as sustainable
development, GHG emission cuts, toxic substances, international movement and funding.
The CCME is a collective of provincial and territorial ministers of the environment which set
out minimum environmental criteria, produces reports and sets guidelines for a multitude of
environmental issues.
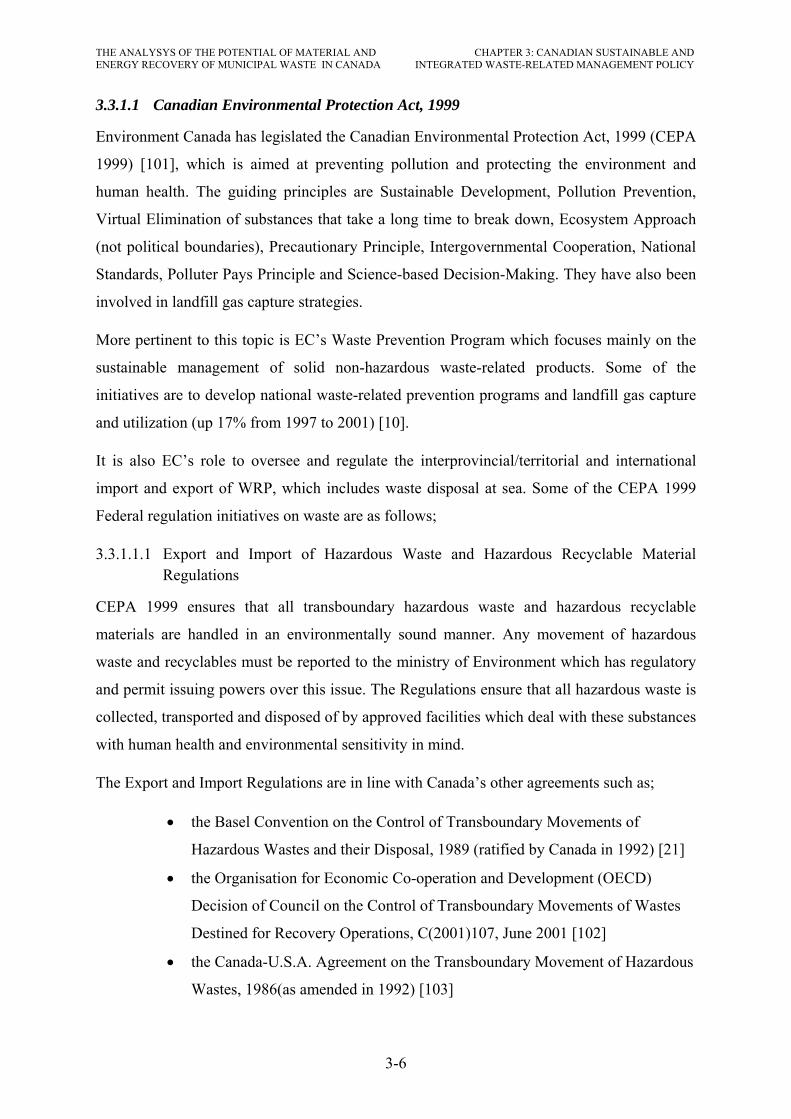
THE ANALYSYS OF THE POTENTIAL OF MATERIAL AND ENERGY RECOVERY OF MUNICIPAL WASTE IN CANADA
CHAPTER 3: CANADIAN SUSTAINABLE ANDINTEGRATED WASTE-RELATED MANAGEMENT POLICY
3-6
3.3.1.1 Canadian Environmental Protection Act, 1999
Environment Canada has legislated the Canadian Environmental Protection Act, 1999 (CEPA
1999) [101], which is aimed at preventing pollution and protecting the environment and
human health. The guiding principles are Sustainable Development, Pollution Prevention,
Virtual Elimination of substances that take a long time to break down, Ecosystem Approach
(not political boundaries), Precautionary Principle, Intergovernmental Cooperation, National
Standards, Polluter Pays Principle and Science-based Decision-Making. They have also been
involved in landfill gas capture strategies.
More pertinent to this topic is EC’s Waste Prevention Program which focuses mainly on the
sustainable management of solid non-hazardous waste-related products. Some of the
initiatives are to develop national waste-related prevention programs and landfill gas capture
and utilization (up 17% from 1997 to 2001) [10].
It is also EC’s role to oversee and regulate the interprovincial/territorial and international
import and export of WRP, which includes waste disposal at sea. Some of the CEPA 1999
Federal regulation initiatives on waste are as follows;
3.3.1.1.1 Export and Import of Hazardous Waste and Hazardous Recyclable Material Regulations
CEPA 1999 ensures that all transboundary hazardous waste and hazardous recyclable
materials are handled in an environmentally sound manner. Any movement of hazardous
waste and recyclables must be reported to the ministry of Environment which has regulatory
and permit issuing powers over this issue. The Regulations ensure that all hazardous waste is
collected, transported and disposed of by approved facilities which deal with these substances
with human health and environmental sensitivity in mind.
The Export and Import Regulations are in line with Canada’s other agreements such as;
• the Basel Convention on the Control of Transboundary Movements of
Hazardous Wastes and their Disposal, 1989 (ratified by Canada in 1992) [21]
• the Organisation for Economic Co-operation and Development (OECD)
Decision of Council on the Control of Transboundary Movements of Wastes
Destined for Recovery Operations, C(2001)107, June 2001 [102]
• the Canada-U.S.A. Agreement on the Transboundary Movement of Hazardous
Wastes, 1986(as amended in 1992) [103]
THE ANALYSYS OF THE POTENTIAL OF MATERIAL AND ENERGY RECOVERY OF MUNICIPAL WASTE IN CANADA
CHAPTER 3: CANADIAN SUSTAINABLE ANDINTEGRATED WASTE-RELATED MANAGEMENT POLICY
3-7
3.3.1.1.2 Development of regulatory framework for the Export and Import of Non-Hazardous Wastes
Although still in the works, Environment Canada is developing a framework for the
Regulation of the Export and Import of non-hazardous wastes, which mainly consists of
municipal solid waste. The regulations will be consistent with Canada’s international
obligations and focus on a similar approval and tracking program as for the hazardous waste.
At the moment the government has published its “Development of Regulatory Options for the
Export and Import of Prescribed Non-Hazardous Wastes Destined for Final Disposal:
Options Paper” [24] was published in 2000 for consultation. The subsequent stakeholder
meetings have been held and the “Proposed Regulatory Provisions for the Export and Import
of Non-Hazardous Waste: Consultation Document” [104] was published in 2005. The
conclusions are still awaited.
In these documents, it was found that presently information on transboundary non-hazardous
waste for disposal is difficult to obtain, due mainly to the utilisation of private WRM firms
which do not report their activities. Furthermore, it was observed that the provinces of
Newfoundland, Prince Edward Island, Nova Scotia, Quebec, Manitoba and Alberta reported
no waste being exported or imported, although confirming data was scarce. It is clear that
regulations are needed.
3.3.1.1.3 Regulations for the Inter-Provincial Movements of Hazardous Waste and Hazardous Recyclable Material
The Interprovincial Movement of Hazardous Waste Regulations [105] is set in place to
monitor the movement of hazardous waste between provinces and territories. The regulations
are currently being revised to be in line with the Import Export Regulations and with regard
to the definition of hazardous waste. Unfortunately the main focus of this legislation oversees
the movement of hazardous waste only.
3.3.1.1.4 Regulate waste disposal at sea
CEPA 1999 prohibits the disposal of waste by Canadian ships in national and international
waters and the disposal of waste from other ships in Canadian waters unless given a permit to
do so. The only substances allowed for disposal at sea are dredged material from waterways,
fisheries waste, ships, inert geological matter, uncontaminated organic matter and bulky
substances that are primarily composed of iron, steel, concrete or other similar matter.

THE ANALYSYS OF THE POTENTIAL OF MATERIAL AND ENERGY RECOVERY OF MUNICIPAL WASTE IN CANADA
CHAPTER 3: CANADIAN SUSTAINABLE ANDINTEGRATED WASTE-RELATED MANAGEMENT POLICY
3-8
Incineration at sea is also prohibited except under emergency situations or if the waste is
generated on the ship in question or a structure such as an off-shore oil platform.
3.3.1.2 Canadian Council of Ministers of the Environment
The Canadian Council of Ministers of the Environment (CCME) has a potentially more
tangible role when it comes to WRM since its work is at both national and inter-
governmental levels. The related initiatives of the CCME include guidelines for compost
quality, principles for extended producer responsibilities including national packaging
protocols, principles for electronic products stewardship, several guidelines on hazardous
waste and recyclables and emission guidelines for waste incinerators.
One of the most important initiatives of the CCME, which fits into the sustainable WRM
principles, is the National Packaging Protocol [32]. The goal was to reduce packaging waste
by 50% from 1990 to 2000. The voluntary goal was achieved by reducing packaging and
using recyclable materials at the producer level and encouraging recycling programs at the
consumer level. The initiative was a success, but highlighted the difficulties in having a
unified national plan with regard to WRM.
Unfortunately, the CCME has a broad mandate that encompasses a large variety of needs in a
vast country, and it can only focus on a small number of items every year. Hence, the duty
falls upon the provinces and territories to dictate more accurately the minimal environmental
requirements for WRM.
3.3.1.3 Waste-Related Products to Energy
With regards to WRPtE facilities, the federal government gives grants, produces
environmental studies on certain technologies but does not layout any comprehensive waste-
to-energy policies. This topic is still under great discussion and has been passed on to the
provinces and territories.
3.3.2 Provincial and Territorial
Canada has 10 provinces and 3 territories in just under 10 million km2 of territory with a vast
variety in climate, geography, resources and lifestyles. For this reason each province/territory
has jurisdiction over its own environmental standards and minimum waste-related
management guidelines with regard to the environment in order to better suit local needs.
Understandably, this can be a lot of information to digest. This section will summarize the

THE ANALYSYS OF THE POTENTIAL OF MATERIAL AND ENERGY RECOVERY OF MUNICIPAL WASTE IN CANADA
CHAPTER 3: CANADIAN SUSTAINABLE ANDINTEGRATED WASTE-RELATED MANAGEMENT POLICY
3-9
highlights for each province and territory. They are summarised by geographical region:
Atlantic, Central, Prairies, Western and Northern Canada.
As a matter of comparison, Figure 3-4, Figure 3-5 and Figure 3-6 present the disposal and
diversion of MW&RP for each province and territory by ratio, total and per capita,
respectively. These tables consider only municipal waste & recoverable products, which
include; residential, IC&I and construction & demolition sources. They do not include
hazardous waste or materials not entering the waste stream (e.g. paper mill waste which is
processed by the company itself). Unfortunately it’s difficult to compare the exact numbers
since each level of government has its own figures derived from varying base points and
measuring methods. These figures may vary in the later text, but for comparison purposes the
information presented is from Statistics Canada, the national body on the topic of statistics, so
the relative performance of each province/territory is still valid.
Table 3-2 gives the generated and diversion tonnage of W&RP per province and territory in
Canada for 2004. Once again these figures consider only waste entering the waste-related
stream (residential, IC&I, construction & demolition). Canadians generate on average about 1
ton per capita each year of W&RP and divert only 23.7%. The bad news is that projections
show that we are generating more W&RP. The good news is that Canadians are also
increasing their diversion rates.
Figure 3-4: Diversion and disposal of MW&RP, by province (2004)
0%
10%
20%
30%
40%
50%
60%
70%
80%
90%
100%
ON QC BC AB MB SK NS NB NL PEI TERs
Diverted
Disposal
Source: [27]

THE ANALYSYS OF THE POTENTIAL OF MATERIAL AND ENERGY RECOVERY OF MUNICIPAL WASTE IN CANADA
CHAPTER 3: CANADIAN SUSTAINABLE ANDINTEGRATED WASTE-RELATED MANAGEMENT POLICY
3-10
Figure 3-5: Total municipal waste & recoverable products generated by provinceix (2004)
Figure 3-6: MW&RP generation per capita, by province (2004)
ix PEI and Yukon, Nunavut & Northwest Territories were removed for confidentiality
0
2
4
6
8
10
12
14
ON QC BC AB MB SK NS NB NL
W&RP
(million tons)
Diverted
Disposal
0
200
400
600
800
1000
1200
1400
AB QC ON CAN MB BC SK NL NB NS
W&RP
per cap
ita pe
r year (k
g/pe
rs)
Diverted
Disposal
Source: [27]
Source: [27]

THE ANALYSYS OF THE POTENTIAL OF MATERIAL AND ENERGY RECOVERY OF MUNICIPAL WASTE IN CANADA
CHAPTER 3: CANADIAN SUSTAINABLE ANDINTEGRATED WASTE-RELATED MANAGEMENT POLICY
3-11
Table 3-2: W&RP generated and diverted by province and territory
MW&RP (2004) Change from 2002 Generated Diverted Generated Diverted Province/Territory tons kg/per % % %
Newfoundland and Labrador 435,356 841 8.1 7.0 16.2
Prince Edward Island x x 34.8 x 45.5 Nova Scotia 620,283 662 35.5 6.7 14.7 New Brunswick 585,977 779 24.5 7.7 10.0 Quebec3 8,290,060 1098 25.7 9.2 22.2 Ontario 12,959,107 1043 22.5 8.8 28.2 Manitoba 1,162,667 993 20.2 4.5 8.7 Saskatchewan 966,274 972 13.7 6.0 14.2 Alberta 3,833,219 1204 19.6 7.0 9.5 British Columbia 4,093,028 974 30.6 4.8 2.7 Yukon, NWT and Nunavut x x 11.6 x 31.6
Canada 33,155,662 1037 23.7 7.9 18.4 Source: [27]
On the topic of finances in this sector, Figure 3-7 shows the expenditures on behalf of local
governments per capita. The Canadian average is about 60$ per person in 2004. It can be seen
that in all cases that this trend is rising. Another interesting correlation is that between
expenditures and diversion rate (Table 3-2). In most cases the provinces above the national
spending average are also above the diversion average. New Brunswick (NB) and Ontario
(ON) are the exception, but the relationship is still close.
Figure 3-7: Expenditure on MW&RP services per capita – Local Government (2004)
0
10
20
30
40
50
60
70
80
90
NS BC QC ON NB AB MB SK NL CAN
Expe
nditure (CAN $/cap
ita)
2002
2004
Source: [27]
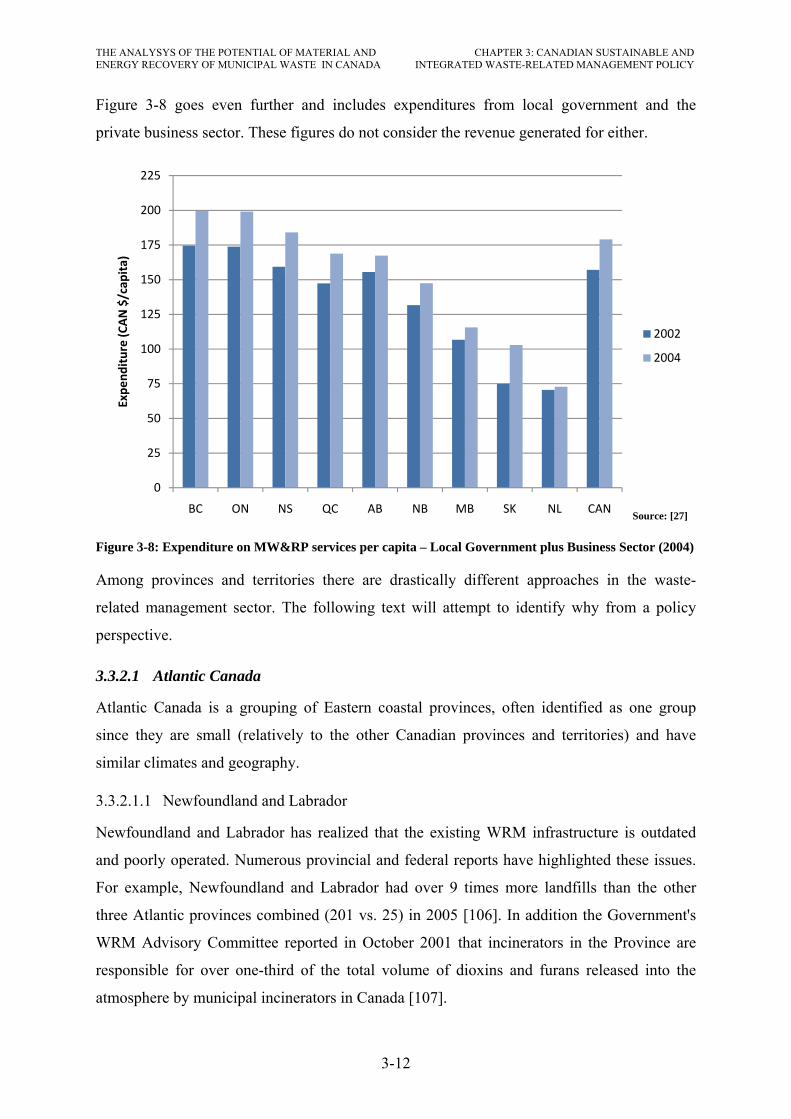
THE ANALYSYS OF THE POTENTIAL OF MATERIAL AND ENERGY RECOVERY OF MUNICIPAL WASTE IN CANADA
CHAPTER 3: CANADIAN SUSTAINABLE ANDINTEGRATED WASTE-RELATED MANAGEMENT POLICY
3-12
Figure 3-8 goes even further and includes expenditures from local government and the
private business sector. These figures do not consider the revenue generated for either.
Figure 3-8: Expenditure on MW&RP services per capita – Local Government plus Business Sector (2004)
Among provinces and territories there are drastically different approaches in the waste-
related management sector. The following text will attempt to identify why from a policy
perspective.
3.3.2.1 Atlantic Canada
Atlantic Canada is a grouping of Eastern coastal provinces, often identified as one group
since they are small (relatively to the other Canadian provinces and territories) and have
similar climates and geography.
3.3.2.1.1 Newfoundland and Labrador
Newfoundland and Labrador has realized that the existing WRM infrastructure is outdated
and poorly operated. Numerous provincial and federal reports have highlighted these issues.
For example, Newfoundland and Labrador had over 9 times more landfills than the other
three Atlantic provinces combined (201 vs. 25) in 2005 [106]. In addition the Government's
WRM Advisory Committee reported in October 2001 that incinerators in the Province are
responsible for over one-third of the total volume of dioxins and furans released into the
atmosphere by municipal incinerators in Canada [107].
0
25
50
75
100
125
150
175
200
225
BC ON NS QC AB NB MB SK NL CAN
Expe
nditure (CAN $/cap
ita)
2002
2004
Source: [27]

THE ANALYSYS OF THE POTENTIAL OF MATERIAL AND ENERGY RECOVERY OF MUNICIPAL WASTE IN CANADA
CHAPTER 3: CANADIAN SUSTAINABLE ANDINTEGRATED WASTE-RELATED MANAGEMENT POLICY
3-13
The provinces’ most recent initiative is its 2002 WRM Strategy [108] which outlines the
following goals:
• divert 50% of the materials currently going to disposal by 2010
• reduce the number of waste disposal sites by 80%
• eliminate open burning at disposal sites by 2005 and phase out the use of incinerators
by 2008
• phase out use of unlined landfill sites by 2010
• full province-wide modern WRM by 2010
Unfortunately, the province is likely to fall short of its goals. The Auditor General of
Newfoundland and Labrador reports in 2005 [106] that it does not foresee the province
achieving its goals due to:
• lack of guidance (the province has not set-out plans, targets or benchmarks to achieve
these goals)
• misplaced priorities (not recycling paper and organic which represent 67% of the total
waste, for example)
• Lack of funding
Overall, the province has recognized that it has a long way to go with regard to its WRM
strategy, but is seemingly missing the right leadership and guidelines to do so. In addition
there is no mention of using waste as an energy source and engineered landfill sites still top
the list of solutions.
3.3.2.1.2 Nova Scotia
The province states that it ranks amongst the best governments in the world in WRM. On the
Environment and Labour website it claims “Nova Scotia is too good to waste.” [109]. Figure
3-4 furthers that claim by showing that it leads the country in waste diversion, and a news
release from the department in September 2000 [110] sates that is has achieved its 50% waste
diversion target. Unfortunately, supporting documentation of this achievement cannot be
found. Furthermore, it is unclear what the diversion rate in recent years is.
At the outset, the government of Nova Scotia set out in 1995 its Solid Waste-Resource
Management Strategy stating waste diversion targets and measures, improvement and
reduction of landfills along with more stringent guidelines for incinerators. It seems as though
there has been a degree of success with regard to waste diversion. For example, 90% of

THE ANALYSYS OF THE POTENTIAL OF MATERIAL AND ENERGY RECOVERY OF MUNICIPAL WASTE IN CANADA
CHAPTER 3: CANADIAN SUSTAINABLE ANDINTEGRATED WASTE-RELATED MANAGEMENT POLICY
3-14
residents have curb-side organic waste collection and a electronic recovery program was
implemented in 2007. Also, by 2005 there were 7 landfills in the province, versus 40 in 1995.
The Strategy also identified that all incinerators would be required to produce energy from
waste and not inhibit diversion strategies. It is unclear what the state of their facilities are and
hence we are led to believe that most waste incinerators are used in the industrial sectors and
energy is most likely recovered from them, since it is the current trend.
The province seems to be moving in the right direction, but the 1995 WRM strategy is
outdated and requires revision. No further Provincial targets have been set and the existing
plan does not address innovations in waste-to-energy technologies.
3.3.2.1.3 Prince Edward Island
The province of Prince Edward Island is in fact a national leader in terms of WRM. It is the
only province in Canada to have full source separation material pick-up to every home and
business. It even states that in 2006 it achieved a 64% diversion rate, which ranks among the
best in Canada [111]. Figure 3-4 supports this claim.
The Environmental Act 1988 is the main regulation behind WRM in the province. The
province however, commissioned the crown owned Island WRM Corporation (IWMC) [111]
to manage and operate this service for the residential and commercial sectors. From its
inception in the early 1990’s it has implemented some solid strategies through its Waste
Watch Program. Landfills and incinerators are subjected to more stringent regulations, the 3
stream source separation of waste at all households has enabled the high diversion rates
experienced and hazardous WRM programs are some of the many successful initiatives.
It should be noted that PEI is a small province of 138,000 (2007) residents over 5,680 km2 of
land. In essence it is much easier with a small land mass and population to implement such
programs. It has only 2 landfill sites and one incinerator
However, its incineration plant is located in the provincial capital Charlottetown. The heat
from the process is used in the adjacent hospital, government and private buildings. This
proves that waste-to-energy facilities can be used, even close to urban centres, as a useful
energy source without great environmental and social impacts. For this, it should be
recognized as a role model for other Canadian jurisdictions.

THE ANALYSYS OF THE POTENTIAL OF MATERIAL AND ENERGY RECOVERY OF MUNICIPAL WASTE IN CANADA
CHAPTER 3: CANADIAN SUSTAINABLE ANDINTEGRATED WASTE-RELATED MANAGEMENT POLICY
3-15
3.3.2.1.4 New Brunswick
The province of New Brunswick was relatively forward thinking when in 1987 it adopted its
New Brunswick's Solid WRM Plan. This plan identified the need to eliminate the
uncontrolled waste disposal methods applied at the time throughout the province. The idea
was to separate the province into 12 regions, each with their own Solid WRM Commissions.
The responsibility was given to them so they could develop their own strategies, to conform
with the Clean Environment Act. As a result several landfills were eliminated, the remaining
ones were cleaned up and recycling was initiated in order to achieve the 50% diversion target
by 2000, set out by the CCME.
However, other than Figure 3-4, it is not clear what the province’s current waste diversion
rate is. And furthermore, no new targets have been set since the 1987 plan.
In 2001 the Department of Environment and Local Government published their Waste
Reduction & Diversion - An Action Plan [112], which describes a 10 point plan to improve
WRM in the province. Some of the points discuss setting province wide standards for
recycling, leading by example, enforcing the regional approach, getting involved at a national
level and putting a ban on landfills. If these issues have been addressed at a provincial level it
is not clear from the available information.
In fact, the only report on the topic seems to be the recent Climate Change Action Plan 2007-
2012 [113]. Improving diversion (including recycling and compost) was at the top of the list,
saying that there is still work to do in these areas. The topic of landfill gas capturing to
produce energy was also discussed. It turns out that 1 out of 6 landfills in the province
currently captures and flares the off gas. Waste-to-energy efforts do not seem to be a top
priority.
3.3.2.2 Central Canada
Central Canada comprised of Ontario and Quebec is by far the most populated area of the
country. The majority of the population is located to the south, near the American border.
Consequently it is a dense region with a lot of potential for integrated waste-related
management solutions.
3.3.2.2.1 Quebec
The Province of Quebec has set out its guidelines through the Environment Quality Act and
the Québec Residual Materials Management Policy 1998-2008 [114]. In this document, the

THE ANALYSYS OF THE POTENTIAL OF MATERIAL AND ENERGY RECOVERY OF MUNICIPAL WASTE IN CANADA
CHAPTER 3: CANADIAN SUSTAINABLE ANDINTEGRATED WASTE-RELATED MANAGEMENT POLICY
3-16
Quebec government lays out its plan to divert waste from the landfills and states minimum
standards for waste disposal facilities.
The main objectives are;
• Divert 65% of all waste from landfills. This will be achieved by encouraging the
manufacturers to follow their products during their entire life-cycle, and being
accountable for the waste they produce. The responsibility of the citizen is to be
informed about their role and use of the city recycling and composting services
available to them. Encourage all parties involved to participate in the decision making
of their WRM plans, at a municipal level. To achieve the 65% diversion goal, the
policy states the following diversion goals must be met;
o Municipalities:
60% of glass, plastics, metals, fibres, bulky waste and putrescible
material
75% of oils, paints, and pesticides (household hazardous materials)
50% of textiles; 80 percent of non-refillable beer and soft drink
containers
o Industrial, commercial and institutional establishments:
85 percent of tires2
95 percent of metals and glass
70 percent of plastics and fibres, including wood material
60 percent of putrescible material
o Construction, renovation and demolition sector:
60 percent of all recoverable resources
• Close most of the “trench landfills”. These are unmonitored pits in the sand or soil
where waste is either buried or often burned. Only remote areas will be exempt.
• Instate new minimum requirements for landfills. The leachate must be collected and
treated before being released into the environment. The biogas must also be collected
and treated.
In terms of WRPtE facilities however, the Law describes minimum environmental standards
for waste disposal which are represented by engineered landfill sites. Incinerations, digestion,
gasification and other technologies are discussed briefly in terms of pollution, but no
standards are set for energy production from W&RP. Even in the engineered landfill sites, the
THE ANALYSYS OF THE POTENTIAL OF MATERIAL AND ENERGY RECOVERY OF MUNICIPAL WASTE IN CANADA
CHAPTER 3: CANADIAN SUSTAINABLE ANDINTEGRATED WASTE-RELATED MANAGEMENT POLICY
3-17
biogas only needs to be captured. After that it can be flared, burned to heat some of the
facilities’ processes or to produce electricity, but none of this is required by law.
3.3.2.2.2 Ontario
Ontario generates about 13 million tons per year of MW&RP, by far the most in the country,
Figure 3-5. This accounts for 39% of the MW&RP generated in the country, albeit it is also
home to 38% of the population of Canada. For this reason, Ontario is at par with the national
average with respect to generation per capita, about 1043 kg/yr, Figure 3-6. In the same vein,
they are also responsible for raising the national MW&RP generation average.
The Environmental Protection Act 1990 [115] is the starting point for all initiatives relating
to waste-related products. Even back in the 1980’s, the province mandated municipalities to
develop waste-related diversion strategies. Since then, the largest efforts have been to
increase recycling for the residential and IC&I sectors. As of the early 1990’s Ontario made
regulations to enforce minimum recycling and composting efforts for all jurisdictions [116].
However, Ontario only diverts 22.5% of the WRP from disposal [27].
The Waste Diversion Act, 2002 [117] helped create Waste Diversion Ontario (WDO) [118].
This organization is responsible to develop, implement and operate programs in order to
achieve the province’s 60% waste diversion target by 2008. The group is comprised of
municipal, industry and non-governmental representatives. In 2004, “Ontario’s 60% Waste
Diversion Goal: A Discussion Paper” [116] was released for public and stakeholders input. It
will be interesting to see the 2008 waste statistics when they become available.
On the disposal topic, the Ontario government released a statement on March 23rd, 2007
[119] saying that it will speed up the Environmental Assessment process of waste-related
management facilities under the new WRM Project Regulation. In short it states that;
• Small recycling facilities will not need to undergo an Environmental Assessment
• Rural landfills or expansions between 40,000 & 100,000 cubic meters would go
through a screening process
• Proponents of new waste technology do not need an Environmental Assessment as
long as they meet the provinces air emission standards
On one side, this speeds up the approval process, but also makes it easy for landfill promoters
to keep doing what they are doing, not to mention that it will slow down the acceptance
process for newer W&RP conversion technologies. The only thing is that Ontario Regulation

THE ANALYSYS OF THE POTENTIAL OF MATERIAL AND ENERGY RECOVERY OF MUNICIPAL WASTE IN CANADA
CHAPTER 3: CANADIAN SUSTAINABLE ANDINTEGRATED WASTE-RELATED MANAGEMENT POLICY
3-18
232/98 requires that any landfill that has a total capacity over 3.0 million cubic meters must
collect the landfill gas, smaller facilities are exempt [120].
One interesting initiative that has been quite successful in the province has been run by The
Beer Store. The Beer Store is the sole distributor of beer in the province, while another body
regulates and distributes other alcohols. The Beer Store has been using a user-pay system for
recovering bottles for 80 years now. The user pays a deposit at purchase of the beer and
receives it back upon returning the empty bottles. Not only do they take beer bottles, but
everything they sell including bottle caps and packaging. They recover about 91% of all
bottles and cans sold and they take plastic back as well [121]. The glass bottles are washed
and re-used 12 to 15 times before being recycled into a new bottle [121]. All other materials
are recycled. This is a great example of Extended-Producer-Responsibility.
3.3.2.3 The Prairies
The Prairies, (Manitoba, Saskatchewan and Alberta) are located in the centre of Canada and
are mainly comprised of flat land and lakes. They cover a large land area and are sparsely
populated (3 people/km2). For this reason, waste collection and management is a challenge.
In addition, Alberta is home of the famous tar sands, a waste generation and environmental
pollution issue on its own.
3.3.2.3.1 Manitoba
In 1989 the Minister of Environment committed to achieving a 50% waste diversion rate by
2000. They passed the Waste Reduction and Prevention Act in 1990 to implement the
required measures to achieve this. Subsequently, various initiatives were implemented such
as composting, household recycling, used tire recycling and used oil collection. These actions
are still in effect today, however the province had only achieved a 22% diversion in 2002, as
published in their 2005 Provincial Sustainability Report [122]. The same report highlights
that the province ranks poorly in terms of waste generation and diversion compared to the
other provinces.
Furthermore, the guidance on WRM in the province seems scattered at best. The Ministry of
Conservation has been reporting on the WRM activities in their State of the Environment
reports every 2 years since 1991. However, the latest report dates from 1997. In their 1993
report, it is stated “The composition of our municipal solid waste is not known…” [123]. It is
difficult to set targets and benchmarks if this information is missing, and hence this statement

THE ANALYSYS OF THE POTENTIAL OF MATERIAL AND ENERGY RECOVERY OF MUNICIPAL WASTE IN CANADA
CHAPTER 3: CANADIAN SUSTAINABLE ANDINTEGRATED WASTE-RELATED MANAGEMENT POLICY
3-19
indicates the status of their strategies at the time. It might help explain why they have fallen
short of their targets.
Since the 1990 Act, the Sustainable Development Act 1998 was developed, but no new
targets have been set or clear strategies implemented. However, another Department sates on
its web site that the province is investigating the feasibility of waste-to-energy technologies,
namely fluidized bed gasification for the disposal of hazardous waste to produce energy and
new technologies are being developed for high purity molecular distillation [124].
3.3.2.3.2 Saskatchewan
Despite its dispersed population, since 1988 Saskatchewan has been able to promote waste
diversion due to its WRM infrastructure. This is in large part due to the province’s
acknowledgement of the problems associated with these practices back in the 1970’s. In 1984
the Municipal Refuse Management Regulations (MRMR) came into force, attempting to
govern landfills from an environmental perspective. Despite this, there were still 654 active
landfill sites in 1994, many of which still burned unsorted garbage [125].
The province is struggling to get a handle on their waste situation, but the dispersed
population still requires small communities to fend for themselves. An example of this is in
the town of Nipawin in central Saskatchewan, which has recently abandoned its paper and
cardboard recycling program due to lack of infrastructure and funding [33]. The city can’t
help them and they are losing money.
However most of the regional WRM bodies have banded together under the Association of
Regional WRM Authorities of Saskatchewan to act as a unified voice to the government and
industry [126]. This has allowed smaller communities to work together in finding workable
solutions to their waste problems.
The latest Environmental and Protection Act, 2002 has helped the MRMR to further improve
and regulate the way waste and hazardous materials should transported and disposed. The
Clean Air Act further regulates open burning and incineration to ensure minimum
environmental and human precautions. However, the province has far to go and is still
amongst the nation’s largest polluters per capita and far behind when it comes to waste
diversion and waste-to-energy initiatives.

THE ANALYSYS OF THE POTENTIAL OF MATERIAL AND ENERGY RECOVERY OF MUNICIPAL WASTE IN CANADA
CHAPTER 3: CANADIAN SUSTAINABLE ANDINTEGRATED WASTE-RELATED MANAGEMENT POLICY
3-20
3.3.2.3.3 Alberta
Alberta in 1971 was the first in Canada to create an Environmental Department which
oversaw the WRM practices. However, over the past 20 years the province has seen an
economic and population boom. Consequently the existing infrastructure is at its limits.
Currently, Albertans produce more waste than any other province per capita and their
diversion rate is amongst the worst. The province has recognized this and is attempting to
change the way waste is perceived in their Too Good to Waste strategy [127]. The current
trend is that waste diversion and environmentally sound disposal are only considered when
traditional landfills become too expensive.
With an abundance of private landfills, the disposal market has become competitive and
hence reduced tipping fees. Another problem is that the waste disposal infrastructure is
subsidized. The diversion infrastructure is also subsidized, but it receives less than 15% of
what the disposal system receives [127]. Clearly this promotes bad habits.
On the up side, the three largest waste generators in the province also show the highest
recovery rates. The agriculture, oil & gas and forestry sectors are responsible for 49%, 23%
and 14% of the total waste generated in the province, respectively. The recovery rate for the
agriculture, oil & gas and forestry sectors are 92%, 38% and 65%, respectively. The
residential and commercial wastes show recovery rates of a little more than 20%, significant
improvements are required here [9]. The oil & gas sector could also be improved since it is
growing at an alarming rate.
Under the recent Waste Not campaign, the government has set out to decrease the waste sent
to landfills to 500 kg/person by 2010 and plans to achieve this by increasing pollution
prevention, improving the sustainable WRM infrastructure, better public awareness and
ensuring that waste related activities protect human health and the environment.
3.3.2.4 Western Canada
Western Canada is defined as British Columbia (and sometimes part of Alberta).
3.3.2.4.1 British Columbia
British Columbia, on the Pacific coast, ranks in the top 3 for most waste diversion and for
least waste generated in Canada. The biggest factor that seems to explain this is the
province’s foresight in WRM planning. It is evident by the amount and quality of information
available on the topic that the government has taken this responsibility very seriously.

THE ANALYSYS OF THE POTENTIAL OF MATERIAL AND ENERGY RECOVERY OF MUNICIPAL WASTE IN CANADA
CHAPTER 3: CANADIAN SUSTAINABLE ANDINTEGRATED WASTE-RELATED MANAGEMENT POLICY
3-21
The WRM Act (now the Environmental Management Act) was amended in 1989, and
recognised the value of a regional structure. The regional districts were required to develop
and submit their plans by the end of 1995, for approval by the Ministry of Environment. The
strategies were to include initiatives to achieve the 50% diversion rate by 2000 and this by
highlighting the hierarchy of the 3 R’s concept. Furthermore, in 1993 the province set out the
Landfill Criteria for MW&RP [128]. The regulations required the regions to audit their
existing landfills and identify non-conforming sites, describe in detail the planned new ones
and explain how they were going to conform to environmental standards (including
corrective measures for existing, non-conforming sites) in their 1995 Regional Solid WRM
Plans.
Since then the provincial government has been working arduously at keeping track of
progress, lots of information is being collected and compiled every year in the Municipal
Waste Tracking Reports [129]. This, more than anything else, helps leaders make decisions
on the treatment of waste-related products in the province and consequently contributes to the
success of their waste diversion achievements.
In terms of waste-to-energy facilities, an incinerator which produces steam for electricity and
other processes is located near the major urban center of Vancouver and accepts 24% of the
region’s waste [130]. The Environmental Management Act has enabled such facilities to be
built and monitored, and more are planned the available land becomes scarce.
3.3.2.5 Northern Canada
Northern Canada is comprised of three territories; Yukon Territory, Northwest Territories and
Nunavut. It is by far the least populated and largest area in the Country. It covers 40% of the
total land but is occupied by 0.3% of the Canadian people for a population density of 0.03
people per km2. As a result, this small, dispersed, isolated and vast land area of Canada does
not rank well on the waste diversion strategies.
On the other hand, in this part of the country the environment is of utmost importance, since
many people still live off the land. So they have been able to establish some important
guidelines for WRM, landfill requirements, open burning restrictions and GHG emission
reduction plans, amongst others. Follow these references for more information [131], [132],
[133].

THE ANALYSYS OF THE POTENTIAL OF MATERIAL AND ENERGY RECOVERY OF MUNICIPAL WASTE IN CANADA
CHAPTER 3: CANADIAN SUSTAINABLE ANDINTEGRATED WASTE-RELATED MANAGEMENT POLICY
3-22
3.3.3 Municipal/Regional
Across Canada it is bestowed upon the municipalities or regions to develop their own WRM
plans. Considering the number of municipalities they will not be discussed individually.
However, it is at this level were practical approaches to waster-related management are
developed and implemented based on targets set by the provinces and country.
3.4 Canadian Waste-Related-Products-to-Energy Policy
On a national scale, there are no targets or requirements to produce energy from W&RP. In a
country like Canada with a wealth of energy sources and large land mass there has been no
pressing reason to implement WRPtE facilities. A study by the C.D. Howe Institute,
concluded that Canada landfills 79% of its W&RP, compared to an average 58% for the other
OECD 2004 countries [41].
Canada is lagging behind other countries such as the US and the Europeans with regard to
WRPtE: “Only three per cent of Canada's solid waste is processed to generate electricity,
compared to thirteen per cent in the US” [134]. This amounts to about 0.8 million tons in
2002 in Canada. There exist only a few operational WRPtE facilities in Canada;
• Brampton facility, Ontario operated by Algonquin Power Energy From Waste Inc has
a generating capacity of 15 MW
• Burnaby, just outside Vancouver, French-owned Veolia ES Waste-to-Energy Inc
• Quebec City, Quebec
• Charlottetown, New Brunswick
• Ottawa, Ontario
In general, these facilities have been localised near the generation of W&RP to alleviate
landfills and transportation costs; all in an effort to keep treatment and disposal operations
near the source. Yet all these have been implemented on a need basis, not part of a unified
goal. Certain provincial legislations across the country are entertaining the idea of
incineration, gasification or digestion, but so far no standards for producing energy have been
set (provincial or national).
There has been some progress on landfill gas collection. In 2001 it is estimated that 342 ktons
were captured across the country mitigating an estimated 7.2 megatons of CO2eq [10].
However, these numbers have been put into question in the last chapter and will be again in
the next one. It is uncertain if the captured gas was converted into energy or simply flared.
THE ANALYSYS OF THE POTENTIAL OF MATERIAL AND ENERGY RECOVERY OF MUNICIPAL WASTE IN CANADA
CHAPTER 3: CANADIAN SUSTAINABLE ANDINTEGRATED WASTE-RELATED MANAGEMENT POLICY
3-23
In the 2002 Climate Change Plan for Canada, the federal government had set out strategies
and targets to meet its Kyoto commitment. In this, a minimum 10% of new electricity
generation capacity is to come from emerging renewable energy sources, such as WRPtE by
2012. Unfortunately, the current government has revoked this plan (to the point where the
report is no longer available online) without putting an alternative in its place. The
government’s latest Sustainable Development Strategy 2007-2009 [135] offers no real
measures for improving the situation.
The IEA has noted that in Canada “Provinces have more jurisdiction over energy than the
sub-national governments of other federal countries in the IEA.” [136]. This does to some
extent explain the lack of federal WRPtE strategies, but cannot be used as an excuse. If a
country like Canada is not able to enforce a policy, then we are doomed since climate change
requires global cooperation.
In conclusion, there are no Canadian waste-related products to energy policies. It is up to the
provinces to formulate their plans, targets and regulations. As an example, the province of
Ontario’s approach is presented next in greater detail.
3.4.1 The Ontario example
As stated previously, most jurisdictions in Canada have not fully investigated the WRPtE
potential. Ontario is no different. However, the Ontario government has recently passed
legislation to help WRPtE facilities circumvent full Environmental Assessments and
hopefully speed up their application. They do still need to abide by the province’s air
emission regulations, but, the new W&RP-to-energy facilities in Ontario will not need to go
through an Environmental Assessment if they “have predictable environmental effects that
can be readily mitigated” [119] or if there is little public opposition to the project.
It is too early to know what effects this will have on the promotion of WRPtE facilities, but it
is safe to assume that tried, tested technologies such as landfills may escape full
Environmental Assessments, whereas new technologies may be faced with much longer
application processes further inhibiting the integration of waste-related products as an energy
source in the province.
Ontario has currently one waste-to-energy facility in full operation [137], located in
Brampton [138]. It can produce 15 MW of electrical energy by incinerating non-recyclables
such as MW&RP. The facility is privately owned with power sold to the provincial utilities.

THE ANALYSYS OF THE POTENTIAL OF MATERIAL AND ENERGY RECOVERY OF MUNICIPAL WASTE IN CANADA
CHAPTER 3: CANADIAN SUSTAINABLE ANDINTEGRATED WASTE-RELATED MANAGEMENT POLICY
3-24
The reoccurring problem with WRM in Canada is the lack of cooperation between all levels
of government. In the city of Ottawa however, the government of Ontario has invested $4
million in cooperation with the city and Plasco Energy Inc. (a WRPtE technology innovator)
in a pilot plasma gasification plant [86]. Located beside the city’s aging landfill, they have
completed the final stages of commissioning and are accepting MW&RP for testing. The
proprietary technology was developed in Ottawa (with Spanish cooperation) and is the first of
its kind in Canada. It far exceeds the environmental requirements set out by the province. If
all goes well it may be the beginning of some important policy changes, which might cascade
across the country. This project is a great example of how government, municipalities and
industry can come together, promote Canadian technologies and improve the way we deal
with W&RP.
3.5 Canada vs. the World
Up to this point it has been shown that local Canadian jurisdictions have developed disparate
methods to deal with their W&RP. Although a seemingly scattered approach, is it working?
The best way would be to compare some of the key indicators with other nations. The
following section discusses this topic.
3.5.1 Waste & Recoverable Product Generation & Diversion
As discussed in the first chapter figures, even within Canadian data, are contradictory and
often hard to confirm. Results in municipal, provincial and national reports can differ by large
amounts. Until now, this has not been much of a problem since conclusions could still be
drawn. For comparison on the world stage however, it becomes even more difficult to
validate data from various sources. For this reason, some of the data may conflict with
previously presented figures. However, for relative comparison the information is still valid
since it is from the same source.
Figure 3-9 shows the MW&RP generated on a per capita basis for certain countries. Among
the worst producers are Canada and the United States. These figures represent the W&RP
that enters the waste stream overseen by the municipal authorities or their affiliates, which
includes household, institutional and commercial wastes.
Figure 3-9 does not represent the recycling and diversion efforts of the countries; it does
indicate however the level of W&RP generated and subsequently is an indicator of the
wastefulness of a nation. In the long run this is all that matters. Waste generation globally is

THE ANALYSYS OF THE POTENTIAL OF MATERIAL AND ENERGY RECOVERY OF MUNICIPAL WASTE IN CANADA
CHAPTER 3: CANADIAN SUSTAINABLE ANDINTEGRATED WASTE-RELATED MANAGEMENT POLICY
3-25
on the rise, and hence recycling is not the solution, reduction is. Consequently, it is clear that
Canada does not rank well with respect to other countries and is not heading in the right
direction.
Figure 3-9: Municipal Solid Waste Generated per capita per year
Japan is at the other end of the range. They generate almost 40% less W&RP than Canadians
and almost 50% less than Americans.
On the topic of diversion and final disposal, Figure 3-10 shows the percentage distribution of
MW&RP diverted, incinerated and sent to landfill for countries in Europe. It can be seen that
at one end of the spectrum Croatia does little diversion and almost no incineration, whereas
The Netherlands and Switzerland have almost negligible waste-related products sent to
landfill and display some important diversion efforts. Canada is in the middle with regards to
MW&RP sent to landfill, but also shows very little incineration. One important thing to note
is that most countries with the highest diversion rates also have high incineration proportions.
This tends to support the premise that incineration and diversion can co-exists and
complement one another.
0
100
200
300
400
500
600
700
800
United States
Australia
Den
mark
Switzerland
Canada
Norway
Nethe
rlands
United Kingdo
m
Austria
Ireland
Belgium
Germany
EU‐25(a)
France
Italy
Finland
Swed
en
Japan
kg/pers/yr
Weighted average
Adapted from [28], EU-25 from [12]

THE ANALYSYS OF THE POTENTIAL OF MATERIAL AND ENERGY RECOVERY OF MUNICIPAL WASTE IN CANADA
CHAPTER 3: CANADIAN SUSTAINABLE ANDINTEGRATED WASTE-RELATED MANAGEMENT POLICY
3-26
Figure 3-10: Distribution of waste-related activities in various countries
Figure 3-11: Distribution of waste-related activities in selected countries
Figure 3-11 takes a closer look at the numbers shown in Figure 3-10 and shows that countries
like Sweden, Denmark, Netherlands and Switzerland landfill only a small portion of their
MW&RP. Switzerland in fact landfills less than 0.5% of its municipal waste & recoverable
products, diverting almost half and incinerating the rest. The Netherlands divert over 60% of
0%
10%
20%
30%
40%
50%
60%
70%
80%
90%
100%
Diverted
Incineration
Landfill
74% 55% 46% 42% 38% 17% 10% 9% 4% 3% 0%
2%
12%18% 19% 20%
24% 33%
47% 54%
34%
51%
24% 33% 36% 39% 42% 59% 57% 44% 41% 64% 48%
0%
10%
20%
30%
40%
50%
60%
70%
80%
90%
100%
Diverted
Incineration
Landfill
Source: [27], [11], [12]
Sources: [27], [11], [12]

THE ANALYSYS OF THE POTENTIAL OF MATERIAL AND ENERGY RECOVERY OF MUNICIPAL WASTE IN CANADA
CHAPTER 3: CANADIAN SUSTAINABLE ANDINTEGRATED WASTE-RELATED MANAGEMENT POLICY
3-27
the W&RP and landfill less than 3% of the remainder. It is apparent that Canada’s efforts
leave a lot to be desired.
3.5.2 Energy Recycling
The previous figures represent energy recycling (WRPtE) on a relative basis. As an absolute
comparison, Canada doesn’t even rank on the world stage. Table 3-3 shows that amount of
WRPtE being used around the world. Europe, Japan and the USA stand out as the ones
investing much more than other nations.
Table 3-3: State of WRPtE around the world
Nation WRPtE
(million tons) EU 25 48.8 Japan 40.0 USA 26.3 Taiwan 7.0 Singapore 4.0 China 3.0 Switzerland & Norway 3.8
South Korea 1.0 All Others 9.0
Total 143 Source: [139]
Waste-related products to energy technologies are also more accepted in other countries than
here in Canada. For example the EU’s 2005 Biomass Action Plan perceives waste as an
“underused energy resources” [140]. It clarifies that it needs to be implemented within proper
WRM strategies that reduce the environmental impacts of using it as a fuel. The report goes
on to say that achieving the EU’s renewable energy targets without biomass “looks
impossible to achieve” [140].
Some of the reasons for Japan’s success (which are similar to those of Europe) include
environmental consciousness, expensive refuse disposal fees, and government subsidies for
WRPtE and requirements that W&RP must be treated close to the source [139]. Europe and
Japan have come to terms with the reality of waste-related management in today’s world,
where WRPtE or energy recycling become an integral part of the process.
3.5.3 Summary
It is clear that the nations with the highest WRPtE rates also show the best W&RP diversion,
the least landfill disposal and relatively less W&RP generated per capita. Canada does not
rank well. It is amongst the worst in all categories, compared to the other developed nations.
THE ANALYSYS OF THE POTENTIAL OF MATERIAL AND ENERGY RECOVERY OF MUNICIPAL WASTE IN CANADA
CHAPTER 3: CANADIAN SUSTAINABLE ANDINTEGRATED WASTE-RELATED MANAGEMENT POLICY
3-28
It can easily be concluded that Canada’s current waste-related management priorities need to
be revised.
3.6 Conclusion
In summary, the quantity of waste-related products generated is an indicator of the
inefficiency of a society [41]. This can be considered true for Canada as seen in previous
figures. It has been presented that the main problem is the current lack of cooperation
between the federal and provincial/territorial governments [41]. In theory the structure is
workable, but in reality there seems to be a disconnect between different levels of
governments or a lack of vision and leadership with regard to the environment.
This can easily be demonstrated by Canada’s commitment (or lack thereof) to the Kyoto
protocol. The country ratified the agreement with the goal of reducing GHG’s by 5.2% from
1990 levels by 2012. However, 2005 statistics show Canada is 25.3% above the 1990 level,
or 32.7% from its Kyoto target [141]. The main reason for this is that the Government of
Canada Action Plan [142] and the Moving Forward on Kyoto [143] plans have been scrapped
and nothing has replaced them. The cynics agree that as a nation we were not going to meet
our targets and these plans had no substance. On the other hand, supporters are furious since
no clear goals or plans are being developed to improve the state of affairs.
As attempted through the Kyoto agreement, the federal government is responsible for setting
clear and concise GHG targets. The provinces/territories on the other hand control the energy
policies. For this reason agreements are hard to reach. Intergovernmental cooperation is
required. The W&RP issue is no different.
This is not however the only problem. The consumer is also at fault, due to continued
wasteful habits. The solution is individual accountability, but the individual can only go so
far without clear direction.
The direction must come from the top. It is the responsibility of the Canadian Government to
lead the provincial governments down the path to sustainability. Waste-related management
is an integral part of this. The previous chapter explained that provinces are setting their own
diversion targets, simply due to economic and social pressures. But the extent of their
abilities to motivate change is limited to their jurisdictions and they rely on adhoc
interprovincial cooperation to promote any kind of unified goals.

THE ANALYSYS OF THE POTENTIAL OF MATERIAL AND ENERGY RECOVERY OF MUNICIPAL WASTE IN CANADA
CHAPTER 3: CANADIAN SUSTAINABLE ANDINTEGRATED WASTE-RELATED MANAGEMENT POLICY
3-29
Europe’s nations and Japan have successfully implemented waste-related management
strategies that, more or less, encompass all the facets of the SIWRM hierarchy. They produce
less, divert more, energy recycle as much as possible and landfill only what is required. This
is not to say that their methods are perfect, it merely shows that Canadians can do better.
Within the current government structures there is potential for Canada to promote change and
innovation and provide leadership for unified strategies. The idea that regions or
municipalities are responsible for their waste-related management plan is effective in
tailoring to local needs. Provinces and territories are best positioned to detail and enforce
goals and strategies. Nationally, some direction is required.
THE ANALYSYS OF THE POTENTIAL OF MATERIAL AND ENERGY RECOVERY OF MUNICIPAL WASTE IN CANADA
CHAPTER 4: GREENHOUSE GAS EMISSIONS FROMWASTE-RELATED MANAGEMENT
4-1
CHAPTER 4: GREENHOUSE GAS EMISSIONS FROM WASTE-RELATED MANAGEMENT
4.1 Introduction
One of the most important factors when discussing the concepts of sustainability is
Greenhouse Gas (GHG) emissions and this also applies to waste-related management. Waste-
related activities are large contributors to GHG emissions and many policy makers are now
considering this in their planning. It has been suggested that the emission cuts in this field
could be of the same order of magnitude as improvements in energy efficiency and electricity
generation [144]. In Canada landfill is the most popular method of disposal and in 2004 it is
estimated that 26 Mt of CO2eq (3.7% of the national total) were emitted from the disposal of
solid waste-related products on land [145].
There are many elements and variables to consider when estimating GHG emissions. This
chapter will attempt to consolidate and qualify all of these, in an effort to develop a model to
estimate GHG emissions for various waste-related management activities. The methodology
is based on one described in a paper published by the European Commission – EU: Waste
Management and Climate Change Options (2001) report [43]. Results obtained from previous
chapters and Canadian information is used in the model to evaluate the GHG emissions.
Seven scenarios are then modelled for the Canadian situation based on unsorted MW&RP as
well as its individual materials:
1. Base case – Status Quo
2. Maximum Landfill
3. Maximum diversion – Composting and Recycling
4. Maximum WRPtE – AD and incineration
5. Optimised diversion and WRPtE
6. Improved Base Case 1 – 2x Diversion, 2x WRPtE
7. Improved Base Case 2 – +20% Diversion & 50% WRPtE
The goal of this chapter is to develop a reasonable GHG emission model for various waste-
related management activities and determine which solutions are better from an emissions
perspective and then use the Canadian data to analyse and compare the seven scenarios.
THE ANALYSYS OF THE POTENTIAL OF MATERIAL AND ENERGY RECOVERY OF MUNICIPAL WASTE IN CANADA
CHAPTER 4: GREENHOUSE GAS EMISSIONS FROMWASTE-RELATED MANAGEMENT
4-2
4.2 Methodology
The calculation method used to obtain the GHG emissions relating to waste-related
management are based on the EU: Waste Management and Climate Change Options (2001)
report [43]. The purpose of this method is to quantify the effect of different waste-related
practices on climate change. The practices assessed in this paper are:
• Landfill of MW&RP, with various degrees of landfill gas recovery
• Incineration of MW&RP, mass-burn and gasification technologies are considered
with no energy recovery, heat only, electricity only or combined heat and power
• Composting of putrescible, either at home or at centralized facilities.
• Anaerobic digestion of putrescible, in a controlled environment to produce heat,
electricity or both
• Recycling of metal, paper, plastics, textiles and glass to make secondary materials
For each of these waste-related management practices the GHG effect of each product is
calculated individually per ton of material (i.e. if the material is separated at source). This
process is also applied for unsorted MW&RP, based on average Canadian data.
For each of the processes, emissions and sinks are summed to profile the GHG’s over the
whole cycle. Short cycle carbon (that which is assumed to be realised during degradation and
consumed during growth in equal amounts) is tabulated only for comparison purposes, but is
not included in the overall emissions of a process since it is considered carbon neutral.
The positive emission sources considered are:
• Methane emissions from landfill, due to the decomposition of organic material
• Emission of fossil CO2 during the combustion of plastics and textiles
• Emission of N2O during incineration
• Indirect emissions caused by the fuel consumed to collect, transport and process the
materials
The negative emission sinks considered are:
• Emissions avoided by displacing another process, for example;
o Incineration with energy recovery reduces the need for energy from other,
potentially more polluting sources
o Recycling avoids the energy consumed to extract and process raw materials

THE ANALYSYS OF THE POTENTIAL OF MATERIAL AND ENERGY RECOVERY OF MUNICIPAL WASTE IN CANADA
CHAPTER 4: GREENHOUSE GAS EMISSIONS FROMWASTE-RELATED MANAGEMENT
4-3
o Compost avoids emissions associated with other fertilizers
• Non-fossil carbon that is retained (sequestered) in the earth’s surface for longer than
the 100 year time horizon. This includes:
o The carbon from slowly degrading putrescible material, which remains in
landfill
o Carbon that remains in compost
Other environmental effects are not quantified in this analysis, but comments are made based
on previous analysis in this paper.
To generate different scenarios, Microsoft Excel is used to develop the calculation and
modify the inputs for the various scenarios described above.
4.2.1 Validation of the method used
In order to validate the above method, other Canadian reports on the global warming effects
of waste-related management are used for comparison. One such paper is the National
Inventory Report: Greenhouse Gases Sources and Sinks in Canada (2005) [145]. In that paper
the methane produced from landfills in 2004 was estimated to be 1,434,652 tons by using the
Scholl Canyon Model Representation of Landfill Degradation. That model is simple to use
and considers the time delay between disposal and methane production. However, the method
used in this paper was further simplified by assuming that generation of methane is
independent of time since we are observing things over a 100year horizon. The impact of
such an assumption is minimal at less than 1% difference, as shown in Table 4-2 below.
Therefore one ton of material will produce ‘x’ amount of methane, which can be expressed as
a single value.
One of the biggest potentials for error in determining the methane produced from landfills is
the quantity of Degradable Organic Carbon (DOC). This is calculated by considering the
Total Carbon (TC) in a material and the amount (from 0% to 100%) of this carbon that can
escape from the material during decomposition. In most organic materials, the portion of
carbon that will degrade is 100% (or near enough to). However, the carbon content of each
material (especially in municipal waste & recoverable products) can vary greatly depending
on geography, GDP, social and political situations, etc. Since these figures are not readily
available for Canadian MW&RP, they are adapted from the previous Table 2-3 using
American data for the purpose of this model. The difference between the Canadian DOC

THE ANALYSYS OF THE POTENTIAL OF MATERIAL AND ENERGY RECOVERY OF MUNICIPAL WASTE IN CANADA
CHAPTER 4: GREENHOUSE GAS EMISSIONS FROMWASTE-RELATED MANAGEMENT
4-4
figures (calculated using IPCC/OECD/IEA, 1997) and those used in this report are shown in
Table 4-1. Although the individual figures vary, the weighted averages using the Canadian
composition of MW&RP are very close.
Table 4-1: Degradable Organic Carbon in MW&RP Comparison
Degradable Organic Carbon (DOC, %)
Material Based on Canadian
Report [145] Based on EU Report
[43] and other Sources Paper 40% 35% Wood 30% Garden and Park Waste 17% 23% Food Waste (putrescible) 15% 18%
Average Putrescible 16% 21% Textiles 40% 19% Miscellaneous combustibles 22% 28% Fines N/A 9% Other (Miscellaneous non-combustibles, Plastic, Glass Metals) N/A 0%
MW&RP - Unsorted 21% 20%
To validate the EU model used, the DOC values from Table 4-1 are inserted into the model
for landfills developed in this paper. Table 4-2 compares these results to the methane
generation value of the Canadian Report. By using the Canadian DOC data in the EU model,
the error is less than 1% compared to the report data. Furthermore, using the DOC values
obtained from other sources, the generated CH4 has decreased by about 0.6%. Considering
the small deviations in methane production, it is assumed that the EU method used in the
model is acceptable for the purposes of this study.
Table 4-2: CH4 generated from landfills in Canada comparing methods of calculation
CH4 Generated
Source of information DOC
%
kg/ton of raw
MW&RP
Tons based on
2004
Difference
% Canadian GHG Report (2005) [145] N/A N/A 1,434,652 0.00% EU Model [43] with Canadian GHG Report DOC % 20.9% 59.0 1,448,183 0.94% EU Model [43] with adjusted DOC % 19.9% 58.1 1,426,482 0.57%
Another Canadian report is also available for comparison purposes; Determination of the
Impact of WRM Activities on Greenhouse Gas Emissions (2005) [144]. This paper has a
similar approach to the methods used in the EU model, with different considerations for each
process. Therefore, parallels will be drawn with this report throughout this paper.

THE ANALYSYS OF THE POTENTIAL OF MATERIAL AND ENERGY RECOVERY OF MUNICIPAL WASTE IN CANADA
CHAPTER 4: GREENHOUSE GAS EMISSIONS FROMWASTE-RELATED MANAGEMENT
4-5
4.2.2 Common information
Throughout the following process certain information, such as the composition of waste, is
used consistently. The following tables are referenced throughout the rest of the paper.
As discussed many times previously, the composition and carbon content of MW&RP varies
greatly. For this study, the average Canadian composition obtained in Figure 1-4 is used. The
carbon content is more difficult to define with available Canadian information. Therefore the
data described in Table 2-3, based on American information, is used throughout. This is an
acceptable assumption considering the commonalities between our societies and is validated
in Table 4-2 of the previous section. This information is summarised in Table 4-3. It should
be noted that all values are assumed on a wet basis.
Heating values are determined by using the following equations:
33.9 144 13.9 10.5
2.44 9
Where C, H, O and S are carbon, hydrogen, oxygen, and sulphur respectively, expressed as a
percentage of the total mass on a wet basis. The moisture content ‘w’ is also expressed as a
percentage of the total mass on a wet basis. All values are taken from Table 2-3.
Table 4-3: Composition of MW&RP in Canada and heating value
Share (%)
Carbone
(%)
Heating Value (MJ/kg)
Material Base Adj d Diversion/Disposal Method Gross Net Paper & Cardboard 29.0 27.9 Reuse, recycling or thermal conversion 34.7 14.1 12.5
Yard Trimmings 7.6 7.3 Thermal conversion 23.3 9.7 8.0 Organics 28.2 27.1 Biochemical WRPtE or Composting 17.9 8.0 5.9 Plastics 9.2 8.9 Reuse, recycling or thermal conversion 56.4 29.3 27.2 Glass 3.4 3.2 Reuse, recycling N/A N/A N/A Metals a 4.6 4.4 Reuse, recycling N/A N/A N/A Textiles 2.4 2.3 Reuse, recycling or thermal conversion 37.2 16.1 14.4 Other b 15.7 15.1 Reuse, recycling or thermal conversion 24 10.0 8.4 Not Consideredc 0.0 3.7
MW&RP-Unsorted 100.0 100.0 27 11.7 10.1
33.2 million tons, 2004 a Metals are comprised of 4% ferrous and 1% non-ferrous metals. Information based on [58]. b Other is assumed to be 7% misc. combustibles, 2% misc. non-combustibles and 6% fines (dust). Information based on [58]. c Not considered are; White goods, Electronics, Tires, Construction & Demolition Waste. d The adjusted percentage is used to calculate the GHG’s for the scenarios. In the Canadian data for recycling there are various small categories which cannot be attributed to exact materials, therefore a small share of each material is assumed to be part of the not considered category. Both percentages are used throughout the analysis. e Carbon content and Heating values taken from Table 2-3.

THE ANALYSYS OF THE POTENTIAL OF MATERIAL AND ENERGY RECOVERY OF MUNICIPAL WASTE IN CANADA
CHAPTER 4: GREENHOUSE GAS EMISSIONS FROMWASTE-RELATED MANAGEMENT
4-6
Another important factor is energy offset by using waste-related products to energy
technologies. The benefits of such offsets are generally seen when avoiding energy
production from dirty sources such as coal and diesel fuel, since they generate more
emissions per kWh of electricity produced. In Canada, a large share (almost 60%) of the
electricity comes from hydro power. Hydro being a relatively clean energy source, makes the
average CO2eq/kWh generated fairly low (250 CO2eq/kWh) compared to other countries
such as the EU at 450 CO2eq/kWh for example. So in Canada, any energy offset from
WRPtE has a smaller effect than in other countries with higher average emissions. Most of
the hydro power is concentrated in the provinces of Quebec and British Columbia and
consequently energy offsets in various regions of the country would have varying benefits.
However, since this is a macro approach to the Canadian waste-related GHG’s, the Canadian
average is used throughout these calculations. Table 4-4 shows the distribution of electricity
generation in Canada.
Table 4-4: Electricity production share - GHG emissions by source
Emissions (g CO2/kWh) Energy Source Share [146] Per [147] Weighted
Hydro 58% 11 6.4 Coal 19% 975 185.3 Nuclear 12% 24 2.9 Natural Gas 6% 608 36.5 Fuel Oil 3% 742 22.3 Wind and other 2% 32 0.6
Total Canada 100% 253.9 Total EU [43] 450.0
4.2.3 Transportation/Mobilisation
In general the collection, transportation and mobilisation aspects of MW&RP are very
difficult to estimate with a country as large as Canada. As a starting point, the EU table for
transportation is used and some of the values are taken for this analysis. Whenever possible,
the data is extrapolated or adjusted for the Canadian example.
Table 4-5: Vehicle type assumptions
Vehicle Type Payload (t)
Average Emission (kg CO2/km)
Car 0.05 0.21 Small truck (ST) 5 0.45 Large Truck (LT) 20 0.84 Refuse Collection Vehicle (RCV) 6.67 0.71
Source: [148]
THE ANALYSYS OF THE POTENTIAL OF MATERIAL AND ENERGY RECOVERY OF MUNICIPAL WASTE IN CANADA
CHAPTER 4: GREENHOUSE GAS EMISSIONS FROMWASTE-RELATED MANAGEMENT
4-7
The emissions generated from the transportation and mobilisation of MW&RP for various
processes are summarised in Table 4-6. The emissions per kilometre are based on the
estimates taken from Table 4-5.
4.2.3.1 Landfill:
In Canada landfills are generally located relatively close to the source, considering the vast
amount of land and low population density. In the case of major cities it is assumed that the
average distance is 60km from generator to disposal. However, as seen in Table 3-1 only
about 50% of the population lives in major cities. The rest of the population is greatly
dispersed. At one time, smaller villages would have each had a small open pit for MW&RP
landfills and hence small travel distances. However, newer legislation is generally banning
these uncontrolled facilities and increasingly MW&RP in rural Canada must travel greater
distances before it reaches a more controlled facility. In rural Canada it is currently assumed
that MW&RP travels about 100km for 50% of the Canadian population. Therefore on
average MW&RP travels about 80km’s from source to landfill.
In most Canadian cities MW&RP are delivered to landfill by the same truck that picks them
up, sometimes called Refuse Collection Vehicles (RCV). However, in some of the larger
cities such as Toronto some of the waste is sent to a transfer stations where it is put into a
larger truck and shipped greater distances to other landfill sites. For the Toronto case about
4% (or one million tons per year) of our Canadian MW&RP is sent 60km’s to a transfer
station, then another 360km’s to the United States in larger trucks. Since national figures are
not available for these types of activities, it is assumed that about 6% of Canadian MW&RP
undergoes a similar process. This is based on reasonable quantities for the largest cities in
Canada.
Overall, the emissions related to the transport of MW&RP in Canada are estimated to be 9.3
kg CO2eq per ton of material. Comparing this value to that obtained in the Canadian report
[144] of 0.01 ton CO2eq per ton of material, the numbers agree quite well.
4.2.3.2 WRPtE
Transportation from the source to a WRPtE facility is as difficult to define as for the distance
to landfill, especially since Canada has few of these facilities. However, experience has
shown that WRPtE sites need to be located close to major sources (i.e. major cities) in order
to be financially feasible. Therefore for the purpose of this analysis, it is assumed that all
major cities have a WRPtE close to or near the city, and in some cases (i.e. Ottawa, Ontario)
THE ANALYSYS OF THE POTENTIAL OF MATERIAL AND ENERGY RECOVERY OF MUNICIPAL WASTE IN CANADA
CHAPTER 4: GREENHOUSE GAS EMISSIONS FROMWASTE-RELATED MANAGEMENT
4-8
the facilities are beside the landfill. Using the landfill transportation logic, it can be assumed
that 50% of the MW&RP would travel 60km at all major cities. For the rural MW&RP
facilities this may not be feasible therefore it would need to travel to larger cities via transfer
stations. It is assumed that 50% of the MW&RP would travel 100km to a RTS then another
100km to the WRPtE facility.
Ash and other hazardous contaminants are produced as by-products of WRPtE, the quantity
of which depends greatly on the characteristics of the feedstock and the technology used. As
discussed previously, anywhere between 10% and 25% of solids can be collected, based on
the initial mass. As an average, it is assumed that 15% ash is collected, of which 50% is
usable for the market and the balance goes to landfill. Another 4% is considered to be
hazardous and must be disposed of accordingly. Since most WRPtE sites are nearby to
landfills, which in most cases also are hazardous sites, the transportation of these materials is
assumed to be 5km.
During the thermal processing of MW&RP, metals are also left behind as solids. The ferrous
metals are typically removed and sent for recycling. In general 98% of the ferrous metal can
feasibly be recovered, however not all facilities do this [144]. Therefore it is assumed that
90% of the ferrous metal in MW&RP is recovered and sent for recycling. For the metal
recycling, the distance is much greater as discussed later, and is assumed to be 400km’s.
4.2.3.3 Composting and Anaerobic Digestion
Composting is fairly common in Canada, depending on whether a person has a garden and
the seasonal conditions. Rural residents are more likely to compost than city folk. However,
no figures are available relating to the quantity of on-site composting done. Considering the
50% rural, 50% urban population scenario, and knowing that not all people compost, it is
assumed that 1/3 compost at home. Therefore, there are no emissions associated to
transportation in this case. The remaining 2/3 organics are assumed to be collected either for
composting or anaerobic digestion at central facilities. Since the least likely to compost are
urban dwellers, it is assumed that the central facilities are at an average of 60km from the
source.
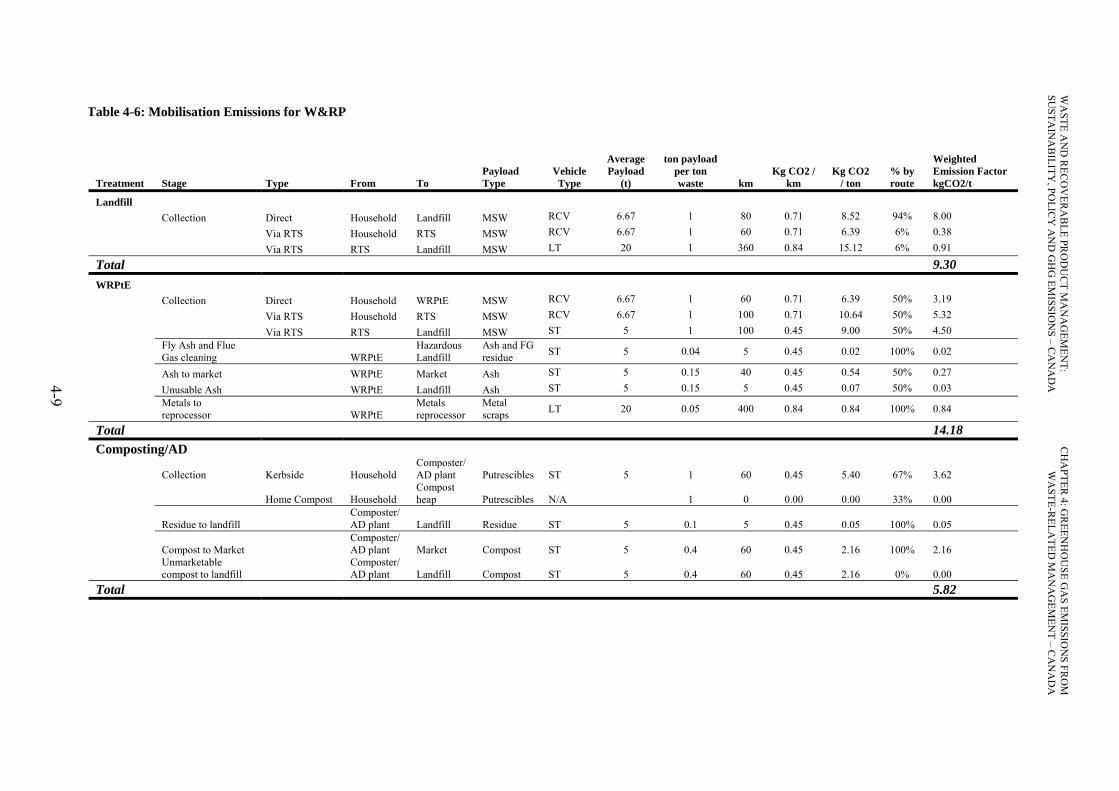
Table 4-6: Mobilisation Emissions for W&RP
Treatment Stage Type From To Payload Type
Vehicle Type
Average Payload
(t)
ton payload per ton waste km
Kg CO2 / km
Kg CO2 / ton
% by route
Weighted Emission Factor kgCO2/t
Landfill Collection Direct Household Landfill MSW RCV 6.67 1 80 0.71 8.52 94% 8.00
Via RTS Household RTS MSW RCV 6.67 1 60 0.71 6.39 6% 0.38
Via RTS RTS Landfill MSW LT 20 1 360 0.84 15.12 6% 0.91
Total 9.30 WRPtE
Collection Direct Household WRPtE MSW RCV 6.67 1 60 0.71 6.39 50% 3.19
Via RTS Household RTS MSW RCV 6.67 1 100 0.71 10.64 50% 5.32
Via RTS RTS Landfill MSW ST 5 1 100 0.45 9.00 50% 4.50 Fly Ash and Flue Gas cleaning WRPtE
Hazardous Landfill
Ash and FG residue ST 5 0.04 5 0.45 0.02 100% 0.02
Ash to market WRPtE Market Ash ST 5 0.15 40 0.45 0.54 50% 0.27
Unusable Ash WRPtE Landfill Ash ST 5 0.15 5 0.45 0.07 50% 0.03
Metals to reprocessor WRPtE
Metals reprocessor
Metal scraps LT 20 0.05 400 0.84 0.84 100% 0.84
Total 14.18 Composting/AD
Collection Kerbside Household Composter/AD plant Putrescibles ST 5 1 60 0.45 5.40 67% 3.62
Home Compost Household Compost heap Putrescibles N/A 1 0 0.00 0.00 33% 0.00
Residue to landfill Composter/ AD plant Landfill Residue ST 5 0.1 5 0.45 0.05 100% 0.05
Compost to Market Composter/ AD plant Market Compost ST 5 0.4 60 0.45 2.16 100% 2.16
Unmarketable compost to landfill
Composter/ AD plant Landfill Compost ST 5 0.4 60 0.45 2.16 0% 0.00
Total 5.82
4-9
WA
STE AN
D R
ECO
VER
AB
LE PRO
DU
CT M
AN
AG
EMEN
T: SU
STAIN
AB
ILITY, PO
LICY
AN
D G
HG
EMISSIO
NS – C
AN
AD
A C
HA
PTER 4: G
REEN
HO
USE G
AS EM
ISSION
S FRO
MW
ASTE-R
ELATED
MA
NA
GEM
ENT – C
AN
AD
A

Table 4-6: Mobilisation Emissions for W&RP (cont’d)
Treatment Stage Type From To Payload Type
Vehicle Type
Average Payload
(t)
ton payload per ton waste km
Kg CO2 / km
Kg CO2 / ton
% by route
Weighted Emission Factor kgCO2/t
Recycling
Collection Kerbside Household MRF Mixed recyclables ST 5 1 80 0.45 7.20 100% 7.20
Residue to landfill MRF Landfill Residue ST 5 0.45 0.02 100% 0.02 5 0.45
MRF to reprocessor Paper MRF Paper reprocessor Paper LT 20 0.95 400 0.84 15.96 100% 15.96
Glass MRF Glass reprocessor Glass cullet LT 20 0.95 400 0.84 15.96 100% 15.96
Ferrous metal MRF
Ferrous metal reprocessor
Ferrous scrap LT 20 0.95 400 0.84 15.96 100% 15.96
Aluminum MRF Aluminum reprocessor
Aluminum scrap LT 20 0.95 400 0.84 15.96 100% 15.96
Plastic MRF Plastic reprocessor
Plastic feedstock LT 20 0.95 400 0.84 15.96 100% 15.96
Collection point to reprocessor Textiles
Collection point
Textile reprocessor Textiles LT 20 0.95 400 0.84 15.96 100% 15.96
HHW site etc to reprocessor WEEE
HHW site etc
WEEE reprocessor WEEE LT 20 1 400 0.84 16.80 100% 16.80
Total Paper 23.18 Glass 23.18 Ferrous metal 23.18 Aluminium 23.18 Plastic 23.18 Textiles 23.18
WA
STE AN
D R
ECO
VER
AB
LE PRO
DU
CT M
AN
AG
EMEN
T: SU
STAIN
AB
ILITY, PO
LICY
AN
D G
HG
EMISSIO
NS – C
AN
AD
AC
HA
PTER 4: G
REEN
HO
USE G
AS EM
ISSION
S FRO
MW
ASTE-R
ELATED
MA
NA
GEM
ENT – C
AN
AD
A
4-10

THE ANALYSYS OF THE POTENTIAL OF MATERIAL AND ENERGY RECOVERY OF MUNICIPAL WASTE IN CANADA
CHAPTER 4: GREENHOUSE GAS EMISSIONS FROMWASTE-RELATED MANAGEMENT
4-11
4.2.3.4 Recycling
Data for transportation distances of recycled material is not readily available. In general,
curb-side collection of unsorted recyclables is common in Canada and so the average of
80kms defined in the landfill section will be used. Furthermore, the recycling plants are few
and far between and so an average of 400kms is assumed from collection point to re-
processing plant.
4.2.4 Landfill
Determining the effect that landfills have on greenhouse gases is subject to much debate and
uncertainty. There are numerous factors that affect the degradation of putrescible. In landfills
these effects are event greater. For example annual rain fall, compaction, depth of pit, ratio of
organics, etc., can all affect the degradation rate. Furthermore, some studies [144], [43] even
suggest that some biogenic carbon will not degrade within the 100 year time horizon, which
can then be considered as sequestered carbon, ultimately acting as a carbon sink. However,
the level of sequestration is highly uncertain and can only be estimated at best.
As discussed in the validation section of the methodology, the DOC (degradable organic
carbon) within the waste-related material determines the quantity of carbon that could
potentially degrade under normal conditions. Then by assuming that a certain portion of the
DOC will actually be degraded the DDOC (Dismissible DOC) can be determined. The
DDOC can be defined as the actual carbon degradation potential based on the original total
carbon content. The balance of carbon which does not degrade can then be considered as
sequestered.
Table 4-8 & Table 4-9 demonstrate the values assumed and the calculation used to determine
the emissions and sinks for landfills. This example is the Base Case, as defined in Table 4-7.
In an effort to establish sensitivity to the DDOC, the average value is taken for the scenarios,
except on the base case. For the base case, high and low DDOC values are compared for
discussion purposes only, as can be seen in Table 4-10.
Three principal scenarios are compared in this analysis;
• Base Case: using known Canadian data for landfill gas collection. In 2004, the
estimated landfill gas collection rate was estimated to be 22% based on collected
data from landfill operators [145]. Of the captured gas, only about 50% was used
for energy recovery

THE ANALYSYS OF THE POTENTIAL OF MATERIAL AND ENERGY RECOVERY OF MUNICIPAL WASTE IN CANADA
CHAPTER 4: GREENHOUSE GAS EMISSIONS FROMWASTE-RELATED MANAGEMENT
4-12
• Best Case: assuming that 80% of the emitted landfill gas is collected and that 90%
of that gas is used for energy production
• Restoration layer: is a futuristic approach to landfills, where a restoration layer is
placed on top of the landfill. This allows escaping CH4 to oxidize by being in
contact with methanogens located in the restoration layer. In this case, it is
assumed 90% of the uncollected methane is oxidized
Table 4-7: Scenario information
Energy Source Base Case
Best Case
Restoration Layer Unit Source
Fraction of landfill carbon decaying to methane 50 50 50 % [43] CH4 collected in Canadian landfills (2004) 22 80 80 % [145] Percentage of uncollected methane oxidised 10 10 90 % [43] Percentage of collected LFG vented without combustion 0.15 0.15 0.15 % [145]
Percentage of collected LFG utilised for energy 51 90 90 % [145] Percentage of collected LFG flared 49 10 10 % [145] LFG electricity generation efficiency 30 30 30 % [43] Heating value of methane 15.4 15.4 15.4 kWh/kg Canadian average avoided emissions 0.25 0.25 0.25 kg eCO2/kWh
For all cases, it is assumed that 50% of the DDOC is converted into methane and the other
50% into CO2. As seen in In general organics are better suited for biochemical conversions
and more complex hydrocarbons (e.g. plastics) for thermochemical processes. In almost all
cases, physical processing is required in order to sort out the required products. Within an
SIWRM scheme, this can actually promote recycling, reuse and ensure that W&RP are being
used as they should. Figure 2-15 gives an example of a sorting and biochemical WRPtE
facility. It should be noted however, that the plastics and metals being sent to ‘landfill’, and
should in fact be going to recycling or further thermal processing.
Table 2-18, the electrical conversion efficiency for AD ranges from 10% to 16% of the initial
feedstock with a CO2 / CH4 mix. Therefore, if only methane is being collected than the LFG
electricity generation efficiency can be doubled to 30% for 100% methane.
The calculations and results for all three (3) scenarios are shown in Table 4-10. The short
cycle CO2 is ignored from the total flux. All other figures are calculated from the other tables
and summed to show the total GHG flux in eCO2/tonne of material. Unsorted MW&RP is
also shown and is weighted based on the average composition of Canadian data. Energy Use
is included as 1 kg CO2eq per ton for the machinery used at landfills. The avoided energy is
the displaced energy based on the average Canadian energy mix.
THE ANALYSYS OF THE POTENTIAL OF MATERIAL AND ENERGY RECOVERY OF MUNICIPAL WASTE IN CANADA
CHAPTER 4: GREENHOUSE GAS EMISSIONS FROMWASTE-RELATED MANAGEMENT
4-13
The sensitivity analysis for the DDOC range is also shown in Table 4-10. It is clear that the
DDOC has a large effect on the net GHG flux. This is mainly due to the amount of methane
generated and released into the atmosphere. The average will be used henceforth, but it
demonstrates the effect these assumptions can have on the projected emissions of organics in
landfills.
Figure 4-1, Figure 4-2 and Figure 4-3 show the GHG fluxes for all three cases. Figure 4-4
compares all 3 scenarios.
It is clear that landfills, as they are currently operated, have a positive greenhouse gas effect.
On the other hand if improvements and best practices are applied, landfills can in fact become
GHG sinks. However, as seen in the previous chapters, it is estimated that only 19% of
methane generated in landfills can be captured, Table 2-17. Therefore a methane capture of
80% may in fact be a little aggressive and potentially impossible (or unfeasible).
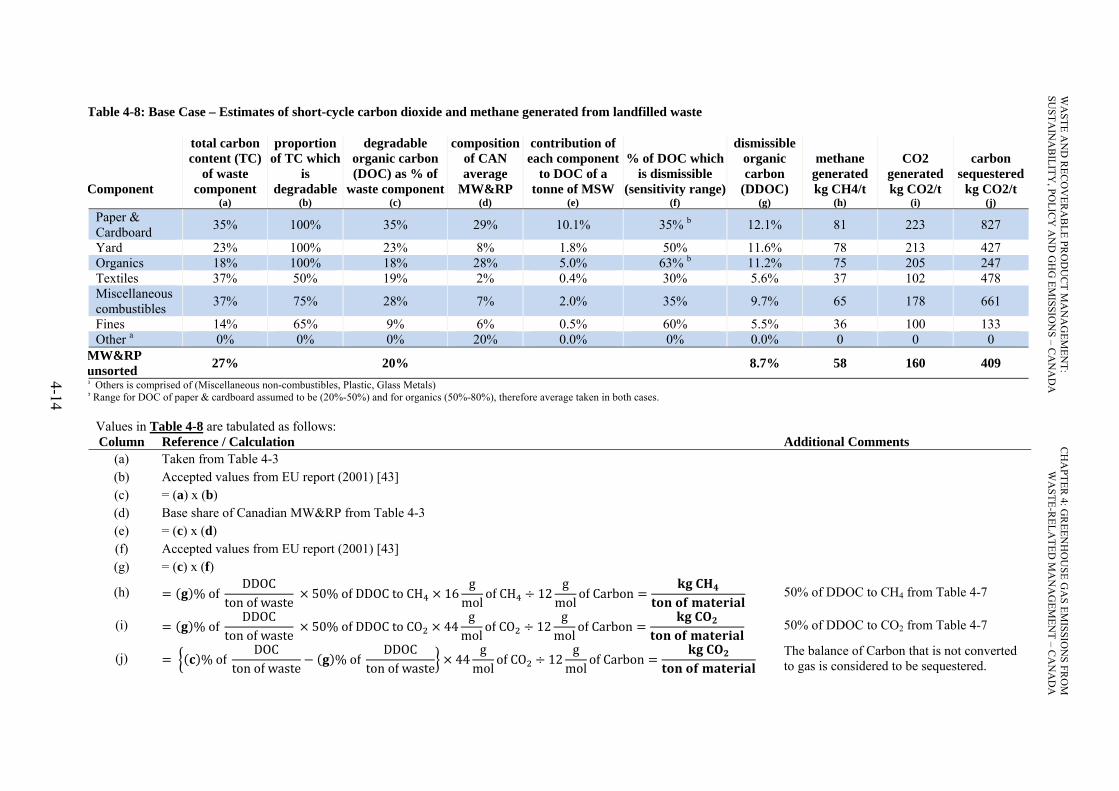
Table 4-8: Base Case – Estimates of short-cycle carbon dioxide and methane generated from landfilled waste
Component
total carbon content (TC)
of waste component
proportion of TC which
is degradable
degradable organic carbon (DOC) as % of
waste component
composition of CAN average
MW&RP
contribution of each component
to DOC of a tonne of MSW
% of DOC which is dismissible
(sensitivity range)
dismissible organic carbon
(DDOC)
methane generated kg CH4/t
CO2 generated kg CO2/t
carbon sequestered
kg CO2/t (a) (b) (c) (d) (e) (f) (g) (h) (i) (j)
Paper & Cardboard 35% 100% 35% 29% 10.1% 35% b 12.1% 81 223 827
Yard 23% 100% 23% 8% 1.8% 50% 11.6% 78 213 427 Organics 18% 100% 18% 28% 5.0% 63% b 11.2% 75 205 247 Textiles 37% 50% 19% 2% 0.4% 30% 5.6% 37 102 478 Miscellaneous combustibles 37% 75% 28% 7% 2.0% 35% 9.7% 65 178 661
Fines 14% 65% 9% 6% 0.5% 60% 5.5% 36 100 133 Other a 0% 0% 0% 20% 0.0% 0% 0.0% 0 0 0
MW&RP unsorted 27% 20% 8.7% 58 160 409 a Others is comprised of (Miscellaneous non-combustibles, Plastic, Glass Metals) b Range for DOC of paper & cardboard assumed to be (20%-50%) and for organics (50%-80%), therefore average taken in both cases.
Values in Table 4-8 are tabulated as follows: Column Reference / Calculation Additional Comments
(a) Taken from Table 4-3 (b) Accepted values from EU report (2001) [43] (c) = (a) x (b) (d) Base share of Canadian MW&RP from Table 4-3 (e) = (c) x (d) (f) Accepted values from EU report (2001) [43] (g) = (c) x (f)
(h) % ofDDOC
ton of waste 50% of DDOC to CH 16g
mol of CH 12g
mol of Carbon 50% of DDOC to CH4 from Table 4-7
(i) % ofDDOC
ton of waste 50% of DDOC to CO 44g
mol of CO 12g
mol of Carbon 50% of DDOC to CO2 from Table 4-7
(j) % ofDOC
ton of waste % ofDDOC
ton of waste 44g
mol of CO 12g
mol of Carbon The balance of Carbon that is not converted to gas is considered to be sequestered.
4-14
WA
STE AN
D R
ECO
VER
AB
LE PRO
DU
CT M
AN
AG
EMEN
T: SU
STAIN
AB
ILITY, PO
LICY
AN
D G
HG
EMISSIO
NS – C
AN
AD
A C
HA
PTER 4: G
REEN
HO
USE G
AS EM
ISSION
S FRO
MW
ASTE-R
ELATED
MA
NA
GEM
ENT – C
AN
AD
A

Table 4-9: Base Case – Estimates of CO2 and methane released from landfill waste and electricity generated from landfill gas
Component
CH4 generated kg/t waste material
CO2 generated kg/t waste material
CH4 collected
kg/t waste material
CH4 oxidised
kg/t waste material
CH4 released
kg/t waste material
CH4 used for energy kg/t waste material
Product of combustion CO2
released kg/t waste material
Short term CO2 released
kg/t waste material
Electricity generated
kWh/t waste material
Avoided emissions kg CO2/t waste
material (a) (b) (c) (d) (e) (f) (g) (h) (i) (j) Paper 81 223 18 6 57 9 49 289 42 11 Yard 78 213 17 6 55 9 47 277 40 10 Organics 75 205 16 6 52 8 45 267 38 10 Textiles 37 102 8 3 26 4 22 133 19 5 Miscellaneous Combustibles 65 178 14 5 45 7 39 231 33 8
Fines 36 100 8 3 26 4 22 130 19 5 MW&RP Unsorted 58 160 13 5 41 6 35 207 30 8
Values in Table 4-9 are tabulated as follows: Column Reference / Calculation Additional Comments
(a) Taken from Table 4-8 column (h) (b) Taken from Table 4-8 column (i) (c) = (a) x CH4 collected in Canadian landfills (2004) Value from Table 4-7 (d) = {(a) – (c)} x Percentage of uncollected methane oxidised Value from Table 4-7 (e) = (a) – (c) – (d) + (c) x Percentage of collected LFG vented without combustion Value from Table 4-7 (f) = (c) x Percentage of collected LFG utilised for energy Value from Table 4-7
(g) Percentage of collected LFG flared 44g
mol of CO 16g
mol of CH Value from Table 4-7
(h) 44g
mol of CO 16g
mol of CH
(i) LFG electricity generation efficiency Heating value of methanekWh
kg Values from Table 4-7
(j) Canadian average avoided emissionskg eCO
kWh Value from Table 4-7
4-15
WA
STE AN
D R
ECO
VER
AB
LE PRO
DU
CT M
AN
AG
EMEN
T: SU
STAIN
AB
ILITY, PO
LICY
AN
D G
HG
EMISSIO
NS – C
AN
AD
A C
HA
PTER 4: G
REEN
HO
USE G
AS EM
ISSION
S FRO
MW
ASTE-R
ELATED
MA
NA
GEM
ENT – C
AN
AD
A

Table 4-10: Landfill Net GHG Emissions with Sensitivity Analysis (kg CO2eq/t material treated)
Waste-related management option
Waste component
Short cycle CO2 Fossil CO2
Short cycle C sequestered
Sum of fossil C and sequestered C
CH4 emission
N2O emission
Total GHG flux Landfill GWP=0 Process
Energy use
Avoided energy and materials
Transport / mobilisation GWP = -1
(CO2eq) GWP=21
(CO2eq) GWP=310
(a) (b) (c) (d) (e) (f) (g) (h) (i) (j) Landfill gas collected and used for electricity generation. Base case assumptions.
Paper & Cardboard 289 0 1 -10.6 9.3 -827 -827 1,194 0 367
Yard Trimmings 277 0 1 -10.2 9.3 -427 -427 1,145 0 718
Organics 267 0 1 -9.8 9.3 -247 -246 1,102 0 856 Plastic 0 0 1 0.0 9.3 0 10 0 0 10 Glass 0 0 1 0.0 9.3 0 10 0 0 10 Metal 0 0 1 0.0 9.3 0 10 0 0 10 Textiles 133 0 1 -4.9 9.3 -478 -472 549 0 77 Other a 157 0 1 -5.7 9.3 -357 -352 647 0 295 MW&RP 207 0 1 -7.6 9.3 -409 -406 858 0 452
Sensitivity Analysis Low DDOC MW&RP 157 0 1 -5.7 9.3 -487 -483 647 0 165 High DDOC MW&RP 264 0 1 -9.7 9.3 -321 -320 1,093 0 773 Best Practice gas Collection MW&RP 291 0 1 -49.2 9.3 -409 -448 221 0 -226
Restoration Layer MW&RP 316 0 1 -49.2 9.3 -409 -448 26 0 -422 a Other is the weighted average of miscellaneous combustibles and non-combustibles and fines.
Values in Table 4-10 are tabulated as follows: Column Reference / Calculation Column Reference / Calculation
(a) Taken from Table 4-9 column (h) (f) Taken from Table 4-7 column (j) (b) Accepted values from EU report (2001) [43] (g) = Sum of columns (b) through (f) (c) Accepted values from EU report (2001) [43] (h) = CH4 released kg/t waste material (from Table 4-9 column (e)) x 21 eCO2 GWP of CH4 (d) Taken from Table 4-9 column (j) (i) = N2O released kg/t waste material x 310 eCO2 Global Warming Potential of N2O (e) Taken from Table 4-6 (j) = Sum of columns (g) through (i)
4-16
WA
STE AN
D R
ECO
VER
AB
LE PRO
DU
CT M
AN
AG
EMEN
T: SU
STAIN
AB
ILITY, PO
LICY
AN
D G
HG
EMISSIO
NS – C
AN
AD
A C
HA
PTER 4: G
REEN
HO
USE G
AS EM
ISSION
S FRO
MW
ASTE-R
ELATED
MA
NA
GEM
ENT – C
AN
AD
A

THE ANALYSYS OF THE POTENTIAL OF MATERIAL AND ENERGY RECOVERY OF MUNICIPAL WASTE IN CANADA
CHAPTER 4: GREENHOUSE GAS EMISSIONS FROMWASTE-RELATED MANAGEMENT
4-17
Figure 4-1: Base Case - Current Canadian Emissions from Landfill
Figure 4-2: Best Case - All Landfill Sites Capture Methane
Paper & Cardboard
Yard Trimmings Organics MW&RP
CH4 emission 1.194 1.145 1.102 858Short cycle C sequestered -827 -427 -247 -409Transport/mobilisation 9,3 9,3 9,3 9,3Avoided energy and materials -10,6 -10,2 -9,8 -7,6Energy use 1 1 1 1Process 0 0 0 0Net Flux 367 718 856 452
367
718856
452
-1000
-500
0
500
1000
1500
GH
G e
mis
sion
Flu
x (k
g C
O2
eq /
ton)
Paper Wood Putrescible MW&RPCH4 emission 308 295 284 221Short cycle C sequestered -827 -427 -247 -409Transport/mobilisation 9,3 9,3 9,3 9,3Avoided energy and materials -68,4 -65,6 -63,2 -49,2Energy use 1 1 1 1Process 0 0 0 0Net Flux -577 -187 -15 -226
‐577
‐187
‐15
‐226
-1.000
-800
-600
-400
-200
0
200
400
GH
G e
mis
sion
Flu
x (k
g C
O2
eq /
ton)

THE ANALYSYS OF THE POTENTIAL OF MATERIAL AND ENERGY RECOVERY OF MUNICIPAL WASTE IN CANADA
CHAPTER 4: GREENHOUSE GAS EMISSIONS FROMWASTE-RELATED MANAGEMENT
4-18
Figure 4-3: Restoration Layer is applied to all Landfills
Figure 4-4: Comparison of Emissions for three (3) Landfill Scenarios
Paper Wood Putrescible MW&RPCH4 emission 36 35 33 26Short cycle C sequestered -827 -427 -247 -409Transport/mobilisation 9,3 9,3 9,3 9,3Avoided energy and materials -68,4 -65,6 -63,2 -49,2Energy use 1 1 1 1Process 0 0 0 0Net Flux -849 -448 -266 -422
-849
-448
-266
-422
-1.000
-500
0
500
GH
G e
mis
sion
Flu
x (k
g C
O2
eq /
ton)
Base Case Best Case Restoration Layer
CH4 emission 858 221 26Short cycle C sequestered -409 -409 -409Transport/mobilisation 9 9 9Avoided energy and materials -8 -49 -49Energy use 1 1 1Process 0 0 0Net Flux 452 -226 -422
452
‐226‐422
-1.000
-500
0
500
1.000
GH
G e
mis
sion
Flu
x (k
g C
O2
eq /
ton)

THE ANALYSYS OF THE POTENTIAL OF MATERIAL AND ENERGY RECOVERY OF MUNICIPAL WASTE IN CANADA
CHAPTER 4: GREENHOUSE GAS EMISSIONS FROMWASTE-RELATED MANAGEMENT
4-19
4.2.5 Incineration
There exist many technologies for the thermal conversion of MW&RP, each have their pros
and cons. But most importantly certain processes are better suited for certain types of
feedstock. This is more important for material with high moisture content, such as organics
and yard trimmings which should undergo biochemical processing (e.g. AD).
When assessing the incineration of MW&RP (or any biomass for that matter) it is important
to be aware of the composition. As discussed earlier, hazardous products can be present in the
feedstock and some can be created as a result of the process. For the purpose of comparing
the global warming effect of incineration, it is assumed that the MW&RP is sorted prior to
combustion to remove the hazardous components. This is true in practice since not all
materials present in MW&RP should be incinerated. Most facilities will do so to stabilize the
energy content of the fuel by removing non-combustibles (for recycling if possible) and high
moisture organics.
It was also shown previously that newer technologies can minimize most harmful emissions
created during the process. Coupled with appropriate flue cleaning technologies, the overall
emissions can be well below environmental limits. Consequently, the only emissions
considered in this analysis are that of fossil CO2 and N2O.
Table 4-11 shows the raw data used to calculate the emissions from incineration. Values for
N2O are sparse and depend on the technology used. The value of 0.05 kg/t is taken from the
EU report [43]. The estimates for the % fossil carbon of ‘textiles’ and ‘others’ was also taken
from the same report.
As discussed in the transportation section, a portion of the input MW&RP is collected ferrous
metal which can be sent to recycling. In this case, the avoided energy and material considered
is taken from the recycling estimates further on. This is factored into the weighted MW&RP
only for comparison purposes. Table 4-12 summarizes the calculation for the incineration,
without energy recovery.
The main purpose of MW&RP incineration is not only to reduce the volume, but also create
some useful energy. This makes the whole process more attractive and financially feasible.
The net heating value (wet) of each product is taken from Table 4-3 and used to assess the
avoided energy emissions. A comparison for various processes and efficiencies is shown in
Table 4-13 with the net GHG flux. Two technologies (mass burn and gasification) are
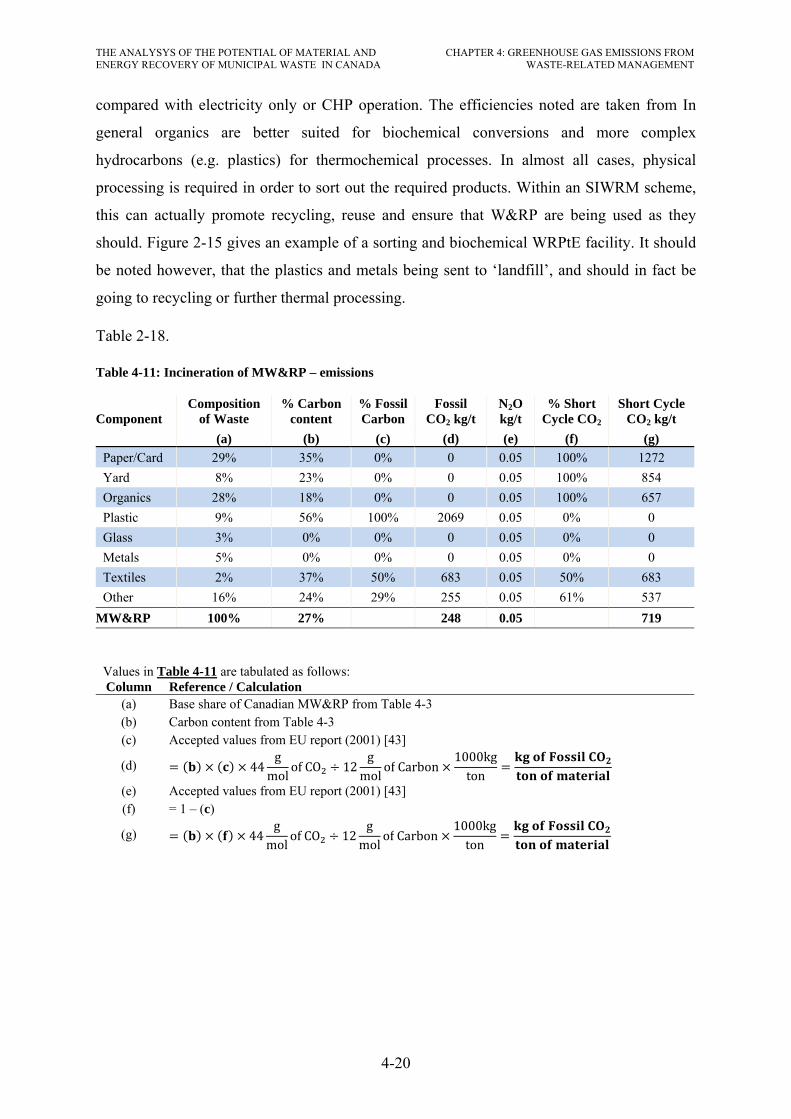
THE ANALYSYS OF THE POTENTIAL OF MATERIAL AND ENERGY RECOVERY OF MUNICIPAL WASTE IN CANADA
CHAPTER 4: GREENHOUSE GAS EMISSIONS FROMWASTE-RELATED MANAGEMENT
4-20
compared with electricity only or CHP operation. The efficiencies noted are taken from In
general organics are better suited for biochemical conversions and more complex
hydrocarbons (e.g. plastics) for thermochemical processes. In almost all cases, physical
processing is required in order to sort out the required products. Within an SIWRM scheme,
this can actually promote recycling, reuse and ensure that W&RP are being used as they
should. Figure 2-15 gives an example of a sorting and biochemical WRPtE facility. It should
be noted however, that the plastics and metals being sent to ‘landfill’, and should in fact be
going to recycling or further thermal processing.
Table 2-18.
Table 4-11: Incineration of MW&RP – emissions
Component Composition
of Waste % Carbon
content % Fossil Carbon
Fossil CO2 kg/t
N2O kg/t
% Short Cycle CO2
Short Cycle CO2 kg/t
(a) (b) (c) (d) (e) (f) (g) Paper/Card 29% 35% 0% 0 0.05 100% 1272 Yard 8% 23% 0% 0 0.05 100% 854 Organics 28% 18% 0% 0 0.05 100% 657 Plastic 9% 56% 100% 2069 0.05 0% 0 Glass 3% 0% 0% 0 0.05 0% 0 Metals 5% 0% 0% 0 0.05 0% 0 Textiles 2% 37% 50% 683 0.05 50% 683 Other 16% 24% 29% 255 0.05 61% 537
MW&RP 100% 27% 248 0.05 719
Values in Table 4-11 are tabulated as follows: Column Reference / Calculation
(a) Base share of Canadian MW&RP from Table 4-3 (b) Carbon content from Table 4-3 (c) Accepted values from EU report (2001) [43]
(d) 44g
mol of CO 12g
mol of Carbon1000kg
ton
(e) Accepted values from EU report (2001) [43] (f) = 1 – (c)
(g) 44g
mol of CO 12g
mol of Carbon1000kg
ton

Table 4-12: Incineration Net GHG Emissions – No energy recovery (kg CO2eq/t material treated)
Waste-related management option Component
Short cycle CO2 Fossil CO2
Short cycle C sequestered
Sum of fossil C and sequestered C
CH4 emission
N2O emission
Total GHG flux
(GWP=0) Process Energy
use Avoided energy and materials
Transport / mobilisation (GWP=-1) GWP=21 GWP=310
(a) (b) (c) (d) (e) (f) (g) (h) (i) (i)
Mass Burn - No Energy Recovery 0% Elec – 0% Heat
Paper/cardboard 1,272 0 0 0.0 14.2 0 14 0 15.5 30 Yard 854 0 0 0.0 14.2 0 14 0 15.5 30 Putrescibles 657 0 0 0.0 14.2 0 14 0 15.5 30 Plastic 0 2,069 0 0.0 14.2 0 2,083 0 15.5 2,099 Glass 0 0 0 0.0 14.2 0 14 0 15.5 30 Metals* 0 0 0 -881 14.2 0 -867 0 15.5 -851 Textiles 683 683 0 0.0 14.2 0 697 0 15.5 712 Other 537 255 0 0.0 14.2 0 269 0 15.5 285
MW&RP 719 248 0 -40.7 14.2 0 221 0 0 221
* Avoided energy and materials for metals includes greenhouse gas emissions avoided by recovering ferrous metal from combustion residues and replaced energy that would have come from other sources. For steel, 1 ton recovered = 1,223 kg of CO2 avoided. Ferrous metals are 80% of the metals and only 90% of ferrous metals can be recovered. Which means 1,223*90%*80% = 881 kg CO2/ton of metal.
Values in Table 4-12 are tabulated as follows: Column Reference / Calculation Additional Comments
(a) Taken from Table 4-11 column (g) (b) Taken from Table 4-11 column (d) (c) Accepted values from EU report (2001) [43]
(d) 1 Net Heating Value
MJkg
1hr3600s
1000 kJMJ
1000 kgton Average Energy Production Emissions
kg COkWh
% Energy Conversion Eff
Net Heating Values from Table 4-3 Average Energy Production Emissions for Cana from Table 4-4 Energy Conversion Eff from Table 2-18
(e) Taken from Table 4-6 (f) = 0 because there is no short cycle carbon sequestered as part of the incineration process (g) = Sum of columns (b) through (f) (h) = 0 because all carbon is converted to either short cycle or fossil CO2 (i) = N2O released kg/t waste material x 310 eCO2 Global Warming Potential of N2O N2O release from Table 4-11 (j) = Sum of columns (g) through (i)
4-21
WA
STE AN
D R
ECO
VER
AB
LE PRO
DU
CT M
AN
AG
EMEN
T: SU
STAIN
AB
ILITY, PO
LICY
AN
D G
HG
EMISSIO
NS – C
AN
AD
A C
HA
PTER 4: G
REEN
HO
USE G
AS EM
ISSION
S FRO
MW
ASTE-R
ELATED
MA
NA
GEM
ENT – C
AN
AD
A

Table 4-13: Incineration Net GHG Emissions – Various energy recovery (kg CO2eq/t material treated)
Incineration (mass Burn) Gasification0% Elec - 0% Heat 18% Elec - 0% Heat 18% Elec - 50% Heat 30% Elec - 0% Heat 30% Elec - 50% Heat
Waste-related component
Avoided energy and materials
Total GHG flux
Avoided energy and materials
Total GHG flux
Avoided energy and materials
Total GHG flux
Avoided energy and materials
Total GHG flux
Avoided energy and materials
Total GHG flux
Paper/cardboard 0 30 -159 -129 -600 -571 -265 -235 -706 -677 Yard 0 30 -101 -71 -381 -352 -168 -139 -449 -419 Putrescibles 0 30 -75 -46 -285 -256 -126 -96 -336 -306 Plastic 0 2,099 -345 1,754 -1,304 795 -575 1,524 -1,534 565 Glass 0 30 0 30 0 30 0 30 0 30 Metal -881 -851 -881 -851 -881 -851 -881 -851 -881 -851 Textiles 0 712 -183 529 -691 22 -305 408 -812 -100 Other 0 285 -107 178 -403 -118 -178 107 -474 -189
MW&RP -41 221 -169 93 -524 -262 -254 8 -609 -348
Values in Table 4-13 are tabulated as follows: Column Reference / Calculation Additional Comments
Avoided energy and materials
1 Net Heating ValueMJkg
1hr3600s
1000 kJMJ
1000 kgton
Average Energy Production Emissions kg CO
kWh% Energy Conversion Eff
These above formula is used for all materials, except for metal as per note in Table 4-12
Net Heating Values from Table 4-3 Average Energy Production Emissions for Canada from Table 4-4 Energy Conversion Eff from Table 2-18
Total GHG flux
All values calculated using the same method as in Table 4-12, except the values for “Avoided energy and materials” changes depending on the process efficiency.
4-22
WA
STE AN
D R
ECO
VER
AB
LE PRO
DU
CT M
AN
AG
EMEN
T: SU
STAIN
AB
ILITY, PO
LICY
AN
D G
HG
EMISSIO
NS – C
AN
AD
A C
HA
PTER 4: G
REEN
HO
USE G
AS EM
ISSION
S FRO
MW
ASTE-R
ELATED
MA
NA
GEM
ENT – C
AN
AD
A

THE ANALYSYS OF THE POTENTIAL OF MATERIAL AND ENERGY RECOVERY OF MUNICIPAL WASTE IN CANADA
CHAPTER 4: GREENHOUSE GAS EMISSIONS FROMWASTE-RELATED MANAGEMENT
4-23
4.2.6 Composting
The purpose of composting is to aerate the putrescible material during decomposition so that
any carbon can be released and oxidized into CO2. Since the carbon is considered biogenic or
short cycle, the CO2 emissions can be ignored (net zero). Some carbon may even be
sequestered in the compost which would then act as a carbon sink. However, there is
immense debate over the quantity and duration of sequestration [144], [43]. Since this
analysis spans 100 years, some studies suggest that there is no carbon left in the compost
after that period of time. Others suggest that all carbon has been released way before the 100
years is up. On the other hand, this depends on a plethora of environmental factors which
cannot all be properly assessed. Some other reports identify that large amounts of carbon can
be sequestered in compost. For example the Canadian study concluded that 0.27 tonnes of
CO2eq per tonne of putrescible waste can be sequestered during compost [144]. However,
these values are not over the 100 year time frame of this study.
Considering the method used in this paper, the approach elaborated in the European study
[43] is applied here. Based on all the analysed research, it was concluded that on average
8.2% of the carbon remaining in the fertilizer after composting will be sequestered. This
represents 22 kg CO2/tonne of putrescible sequestered, which is 10 times less than the
Canadian report. The numbers used in this report are calculated based on the average
retention of 8.2% in compost within the 100 year time frame. The results of this are shown in
Table 4-15. The methodology to calculate the emissions is consistent with the technique
applied for landfills.
The solid by-product of composting can be used as a fertilizer. Typically compost contains
nitrogen (N), phosphorous (P) and potassium (K) which is essential to plant growth.
Although the concentrations of these later in compost is low compared to inorganic
fertilizers, there is nevertheless merit to compost used as a fertilizer. Consequently, it can be
assumed that compost will displace the need for other inorganic fertilisers. Table 4-14 is a
summary of the avoided emissions associated with using compost as a fertiliser.
The emissions associated with three different methods (Open, Closed and Home Composting)
are presented in Table 4-16. Open and closed composting is done at centralised facilities
where machinery is used to turn and aerate the compost. The difference being that open
composting is performed outdoors, exposed to the environment, whereas closed composting
is done indoors, in a relatively more controlled environment. The machinery used to till the

THE ANALYSYS OF THE POTENTIAL OF MATERIAL AND ENERGY RECOVERY OF MUNICIPAL WASTE IN CANADA
CHAPTER 4: GREENHOUSE GAS EMISSIONS FROMWASTE-RELATED MANAGEMENT
4-24
compost contributes to the emission flux. Based on the EU study, the emissions are estimated
to be 13kg CO2eq/ton for open composting and 18kg CO2eq/ton for closed. The emissions for
closed composting are slightly higher due to those associated with the building and its
services.
Table 4-14: Potential greenhouse gas emissions avoided in fertiliser manufacture if compost displaces mineral fertiliser.
Nutrient element
kg CO2 equiv/kg element
Nutrient content in compost kg/tonne
fresh weight
Avoided emission kg CO2 equiv / tonne of compost
(1:1 replacement) N 5.29 6.2 -32.8 P 0.52 2 -1.0 K 0.38 4.5 -1.7
Total -35.5 Source: [43]
In addition to the energy use for open and closed composting, there are transportation
emissions from the curb-side collection to the facility and from the facility to the fertiliser
usage point. The home composting method avoids all the transportation and energy use
emissions since the whole process is done at home.
In all cases, composting is shown to have a negative GHG flux due to the carbon
sequestration and the avoided fertiliser use. The most favourable, being of course, home
composting since transportation emissions and additional energy use is avoided. These values
are quite different from the results obtained in the Canadian report since it assumed a much
higher sequestration rate.
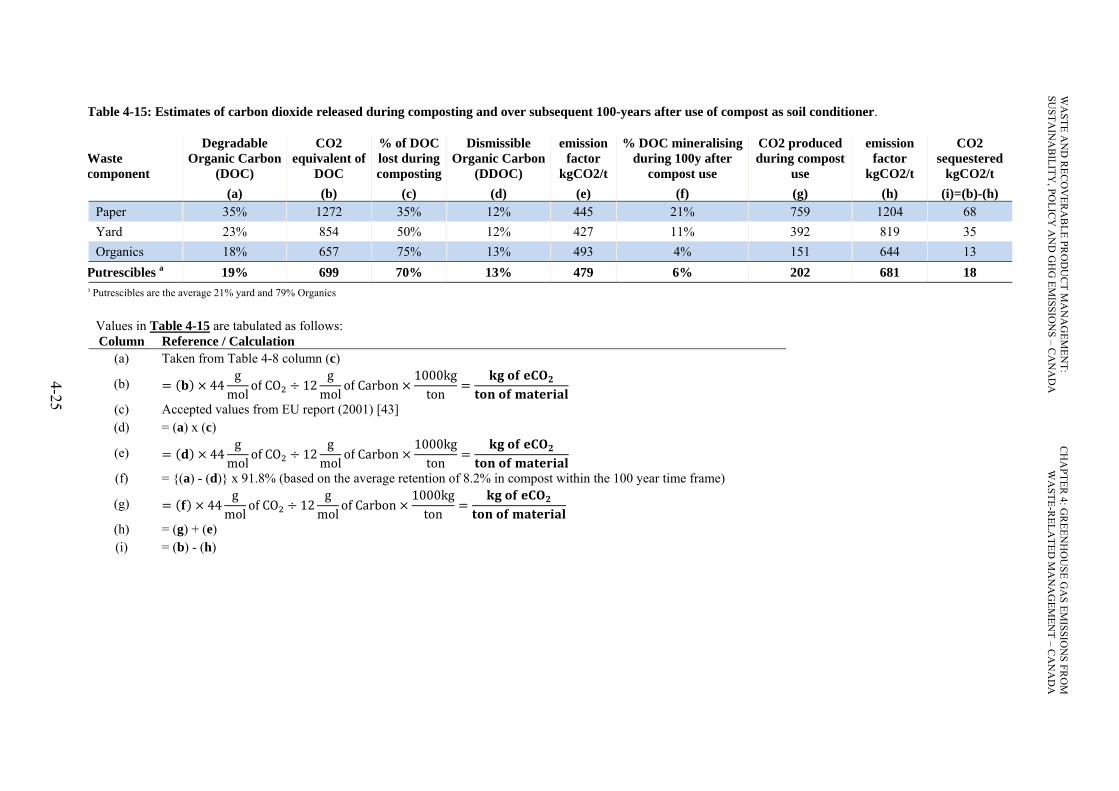
Table 4-15: Estimates of carbon dioxide released during composting and over subsequent 100-years after use of compost as soil conditioner.
Waste component
Degradable Organic Carbon
(DOC)
CO2 equivalent of
DOC
% of DOC lost during composting
Dismissible Organic Carbon
(DDOC)
emission factor
kgCO2/t
% DOC mineralising during 100y after
compost use
CO2 produced during compost
use
emission factor
kgCO2/t
CO2 sequestered
kgCO2/t (a) (b) (c) (d) (e) (f) (g) (h) (i)=(b)-(h)
Paper 35% 1272 35% 12% 445 21% 759 1204 68 Yard 23% 854 50% 12% 427 11% 392 819 35 Organics 18% 657 75% 13% 493 4% 151 644 13
Putrescibles a 19% 699 70% 13% 479 6% 202 681 18 a Putrescibles are the average 21% yard and 79% Organics
Values in Table 4-15 are tabulated as follows: Column Reference / Calculation
(a) Taken from Table 4-8 column (c)
(b) 44g
mol of CO 12g
mol of Carbon1000kg
ton
(c) Accepted values from EU report (2001) [43] (d) = (a) x (c)
(e) 44g
mol of CO 12g
mol of Carbon1000kg
ton
(f) = {(a) - (d)} x 91.8% (based on the average retention of 8.2% in compost within the 100 year time frame)
(g) 44g
mol of CO 12g
mol of Carbon1000kg
ton
(h) = (g) + (e) (i) = (b) - (h)
4-25
WA
STE AN
D R
ECO
VER
AB
LE PRO
DU
CT M
AN
AG
EMEN
T: SU
STAIN
AB
ILITY, PO
LICY
AN
D G
HG
EMISSIO
NS – C
AN
AD
A C
HA
PTER 4: G
REEN
HO
USE G
AS EM
ISSION
S FRO
MW
ASTE-R
ELATED
MA
NA
GEM
ENT – C
AN
AD
A
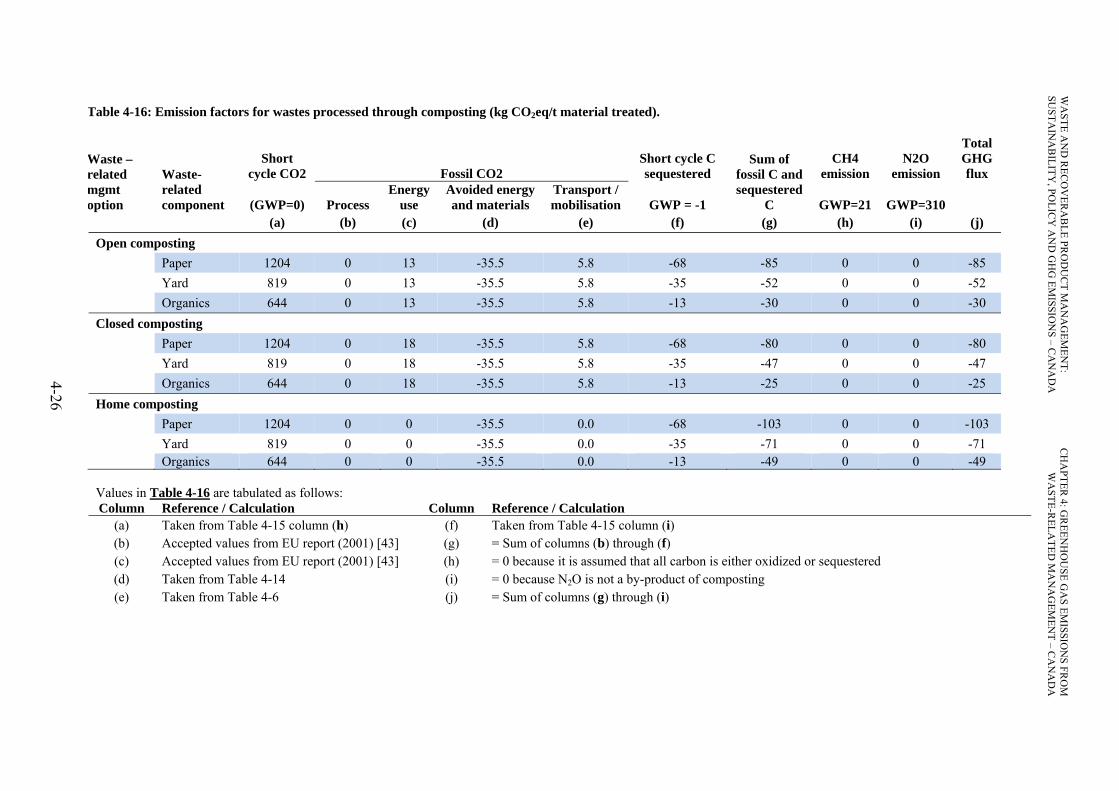
Table 4-16: Emission factors for wastes processed through composting (kg CO2eq/t material treated).
Waste –related mgmt option
Waste-related component
Short cycle CO2 Fossil CO2
Short cycle C sequestered
Sum of fossil C and sequestered
C
CH4 emission
N2O emission
Total GHG flux
(GWP=0) Process Energy
use Avoided energy and materials
Transport / mobilisation GWP = -1 GWP=21 GWP=310
(a) (b) (c) (d) (e) (f) (g) (h) (i) (j) Open composting
Paper 1204 0 13 -35.5 5.8 -68 -85 0 0 -85 Yard 819 0 13 -35.5 5.8 -35 -52 0 0 -52 Organics 644 0 13 -35.5 5.8 -13 -30 0 0 -30
Closed composting Paper 1204 0 18 -35.5 5.8 -68 -80 0 0 -80 Yard 819 0 18 -35.5 5.8 -35 -47 0 0 -47 Organics 644 0 18 -35.5 5.8 -13 -25 0 0 -25
Home composting Paper 1204 0 0 -35.5 0.0 -68 -103 0 0 -103 Yard 819 0 0 -35.5 0.0 -35 -71 0 0 -71 Organics 644 0 0 -35.5 0.0 -13 -49 0 0 -49
Values in Table 4-16 are tabulated as follows: Column Reference / Calculation Column Reference / Calculation
(a) Taken from Table 4-15 column (h) (f) Taken from Table 4-15 column (i) (b) Accepted values from EU report (2001) [43] (g) = Sum of columns (b) through (f) (c) Accepted values from EU report (2001) [43] (h) = 0 because it is assumed that all carbon is either oxidized or sequestered (d) Taken from Table 4-14 (i) = 0 because N2O is not a by-product of composting (e) Taken from Table 4-6 (j) = Sum of columns (g) through (i)
4-26
WA
STE AN
D R
ECO
VER
AB
LE PRO
DU
CT M
AN
AG
EMEN
T: SU
STAIN
AB
ILITY, PO
LICY
AN
D G
HG
EMISSIO
NS – C
AN
AD
A C
HA
PTER 4: G
REEN
HO
USE G
AS EM
ISSION
S FRO
MW
ASTE-R
ELATED
MA
NA
GEM
ENT – C
AN
AD
A

THE ANALYSYS OF THE POTENTIAL OF MATERIAL AND ENERGY RECOVERY OF MUNICIPAL WASTE IN CANADA
CHAPTER 4: GREENHOUSE GAS EMISSIONS FROMWASTE-RELATED MANAGEMENT
4-27
4.2.7 Anaerobic Digestion
Anaerobic digestion is the process of organic decomposition in the absence of oxygen. This is
what typically occurs in landfills. In this case however the decomposition is accelerated (by
increasing temperature and moisture) and occurs in a closed and controlled environment. This
allows the collection of methane for useful energy. The process is also similar to composting,
in the sense that a fertiliser type solid is produced as a by-product. Therefore the logic used
for landfills and composting applies in estimating the GHG flux of the AD process.
A portion of the biogenic carbon is degraded during the AD process. This quantity is similar
to that estimated in composting, except in that 50-75% of the carbon is converted to methane
in this case. This methane is then converted into either electricity, heat or both. The avoided
emissions from the methane production are summed with the fertiliser emissions saved, as
calculated in composting. The results of these calculations are presented in Table 4-17. In
addition, AD uses some energy to support the process, so only a portion of the recovered
energy is available for export. The rest of the analysis is the same as composting. The results
are summed in Table 4-18.
Table 4-17: Table: Avoided emissions from AD
Parameter Paper &
Cardboard Yard
Trimmings Organics Unit (a) Methane content of Biogass 60 60 60 %
(b) Dismissible organic carbon (from composting) 12.1 11.6 13.4 %
(c) CH4 in Biogass (based on composting) 97.1 93.2 107.6 kgCH4/ton (d) CO2 in Biogass (based on composting) 178.1 170.8 197.2 kgCO2/ton
Energy Calculations (e) Calorific Value of Biogass 1349.0 1293.9 1494.2 kWh/t (f) Electricity generated (30% efficiency) 404.7 388.2 448.3 kWh/t
(g) Electricity for export (67% of elec. generated) 271.1 260.1 300.3 kWh/t
(h) Average Electricity Emission 0.25 0.25 0.25 kg CO2eq/kWh (i) Heat recovered for CHP option (50%) 674.5 646.9 747.1 kWh/t
(j) Heat exported for CHP option (65% of heat recovered) 438.4 420.5 485.6 kWh/t
(k) Average Heat emissions 0.28 0.28 0.28 kg CO2eq/kWh Avoided emissions
(l) From electricity export 68.8 66.0 76.3 kg CO2eq/kWh (m) From heat export 122.8 117.7 136.0 kg CO2eq/kWh (n) Energy and Materials (Compost) 35.5 35.5 35.5 kg CO2eq/kWh
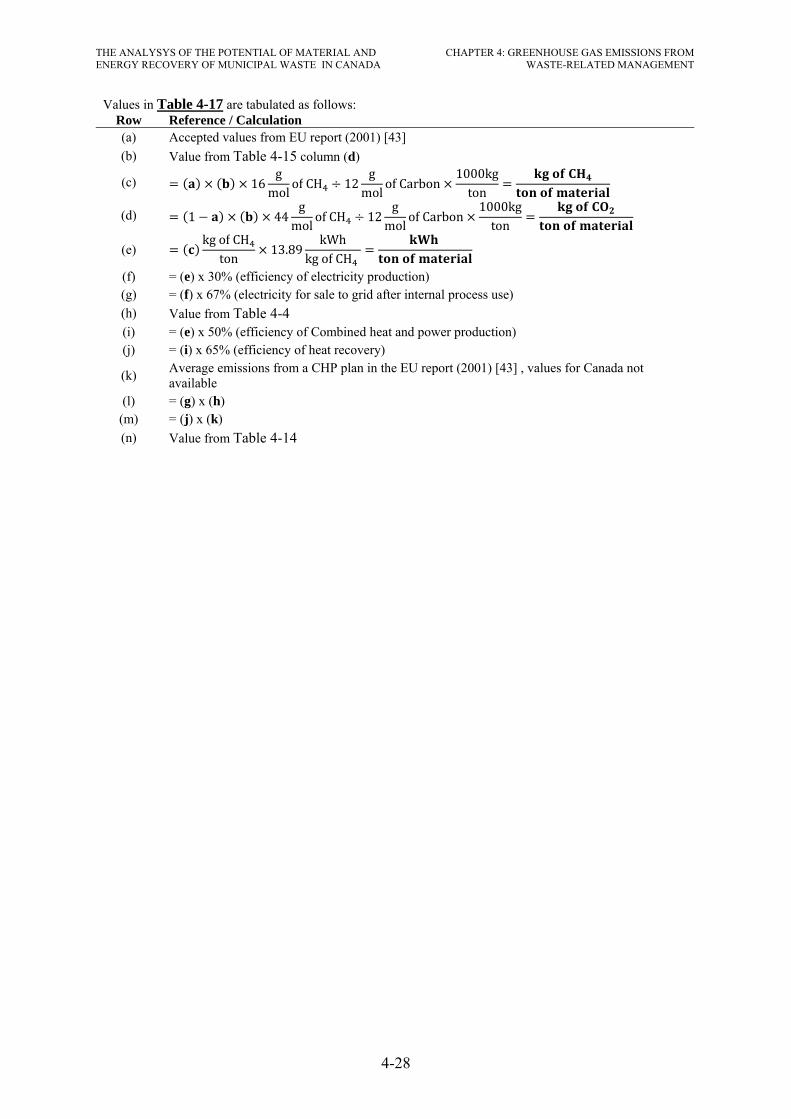
THE ANALYSYS OF THE POTENTIAL OF MATERIAL AND ENERGY RECOVERY OF MUNICIPAL WASTE IN CANADA
CHAPTER 4: GREENHOUSE GAS EMISSIONS FROMWASTE-RELATED MANAGEMENT
4-28
Values in Table 4-17 are tabulated as follows: Row Reference / Calculation (a) Accepted values from EU report (2001) [43] (b) Value from Table 4-15 column (d)
(c) 16g
mol of CH 12g
mol of Carbon1000kg
ton
(d) 1 44g
mol of CH 12g
mol of Carbon1000kg
ton
(e) kg of CH
ton 13.89kWh
kg of CH
(f) = (e) x 30% (efficiency of electricity production) (g) = (f) x 67% (electricity for sale to grid after internal process use) (h) Value from Table 4-4 (i) = (e) x 50% (efficiency of Combined heat and power production) (j) = (i) x 65% (efficiency of heat recovery)
(k) Average emissions from a CHP plan in the EU report (2001) [43] , values for Canada not available
(l) = (g) x (h) (m) = (j) x (k) (n) Value from Table 4-14

Table 4-18: Emission factors for waste & recoverable products processed through AD (kg CO2eq/t material treated)
Waste –related mgmt option Component
Short cycle CO2 Fossil CO2
Short cycle C sequestered Sum of fossil C
and sequestered C
CH4 emission
N2O emission
Total GHG flux
(GWP=0) ProcessEnergy
use Avoided energy and materials
Transport / mobilisation (GWP=-1) GWP=21 GWP=310
(a) (b) (c) (d) (e) (f) (g) (h) (i) (j) AD – Electricity Recovered Only Paper 937 0 0 -104.4 5.8 -67.8 -166.4 0 0 -166 Yard
Trimming 563 0 0 -101.6 5.8 -35.0 -130.8 0 0 -131
Organics 348 0 0 -111.8 5.8 -13.5 -119.5 0 0 -119 AD – Electricity & Heat Recovered Paper 937 0 0 -227.1 5.8 -67.8 -289.1 0 0 -289 Yard
Trimming 563 0 0 -219.3 5.8 -35.0 -248.5 0 0 -249
Putrescible 348 0 0 -247.8 5.8 -13.5 -255.4 0 0 -255
Values in Table 4-18 are tabulated as follows: Column Reference / Calculation Column Reference / Calculation
(a) = (d) from Table 4-17 + (g) from Table 4-15 This is a combination of AD and composting CO2 generated (f) Taken from Table 4-15 column (i)
(b) = 0 because process is self sustaining [43] (g) = Sum of columns (b) through (f) (c) = 0 because process is self sustaining [43] (h) = 0 because it is assumed that all carbon is either oxidized or sequestered
(d) = (l) + (n) from Table 4-15 for Elec Only = (l) + (m) + (n) from Table 4-15 for CHP (i) = 0 because N2O is not a by-product of composting
(e) Taken from Table 4-6 (j) = Sum of columns (g) through (i)
4-29
WA
STE AN
D R
ECO
VER
AB
LE PRO
DU
CT M
AN
AG
EMEN
T: SU
STAIN
AB
ILITY, PO
LICY
AN
D G
HG
EMISSIO
NS – C
AN
AD
A C
HA
PTER 4: G
REEN
HO
USE G
AS EM
ISSION
S FRO
MW
ASTE-R
ELATED
MA
NA
GEM
ENT – C
AN
AD
A

THE ANALYSYS OF THE POTENTIAL OF MATERIAL AND ENERGY RECOVERY OF MUNICIPAL WASTE IN CANADA
CHAPTER 4: GREENHOUSE GAS EMISSIONS FROMWASTE-RELATED MANAGEMENT
4-30
4.2.8 Recycling
The purpose of recycling is to minimize the need for new resources and avoid the emissions
associated with processing raw materials. The avoided energy and materials is the net
emissions saved by recycling materials vs. producing virgin materials. The emissions
associated with extracting raw minerals and processing them into raw products such as
metals, plastics or glass are considered to be avoided. The resources required to separate and
process recyclables into usable metals, plastics or glass are considered to be positive
emissions. In both cases the transportation costs are considered, as explained above. The
summation of these emissions is presented in Table 4-19.
Table 4-19: Recycling - Avoided Energy and Materials - Summary
Material
Avoided energy and materials (kg
CO2eq/ton) Reference Paper a 336 Canada [144] HDPE 2,303 Canada [144] PET 3,653 Canada [144] Glass 133 Canada [144] Ferrous metal 1,223 Canada [144] Aluminum 6,513 Canada [144] Textiles 3,203 EU [43] a Carbon sequestration ignored from report figures.
The data for offset emissions shown in Table 4-19 are taken from the Canadian Report –
Determination of the Impact of Waste Management Activities on Greenhouse Gas Emissions:
2005 Update [144]. In general the avoided material and energy estimates are much more
accurate than those of the EU report, since the provincial share of virgin and recycled
products is taken into account, including the provincial energy mix. The only estimate taken
from the EU report is that of textiles, since the Canadian report does not address this.
Also, the avoided emissions estimated for paper in the Canadian report are found to be quite
high and are adjusted for this analysis. The Canadian report estimates the avoided emissions
for paper to be on average 2,978 CO2eq/ton. In that report however, it is assumed that 2,665
CO2eq/ton is sequestered. Their rational is that recycling paper avoids the need to cut new
trees. Consequently the trees that are not cut are removing CO2 from the atmosphere, creating
a sink. Although this holds some truth in the short term, it is not accurate over the 100 year
time frame.

THE ANALYSYS OF THE POTENTIAL OF MATERIAL AND ENERGY RECOVERY OF MUNICIPAL WASTE IN CANADA
CHAPTER 4: GREENHOUSE GAS EMISSIONS FROMWASTE-RELATED MANAGEMENT
4-31
Assuming that not cutting a tree for paper creates a carbon sink is trivial. This statement
assumes that this tree is already dedicated to capturing the emissions created by the paper
process, which cannot be assumed as accurate. In essence, for this statement to be true, new
trees would need to be planted with the resources generated from the paper process to act as a
carbon sink. Over the 100 year time frame the trees that are not cut for this GHG balance
would die and release the sequestered carbon back into the atmosphere. The trees would
therefore be neutral on their own.
Furthermore, in Canada, the forestry industry must plant trees replacing what it cuts. By this
process the carbon sink pool remains constant, and in that sense cannot be assumed as a sink.
Therefore, for this analysis, the sequestration aspect for paper recycling of the Canadian
study is omitted. The avoided energy and materials represents only the harvesting and
processing savings.
Based on the avoided energy and materials and the transportation emissions, the GHG flux of
recycling is shown in Table 4-20. The process and energy use components have been
included in the avoided energy and materials balance. Recycling demonstrated some
important savings in greenhouse gas emissions compared to the other MW&RP management
practices.
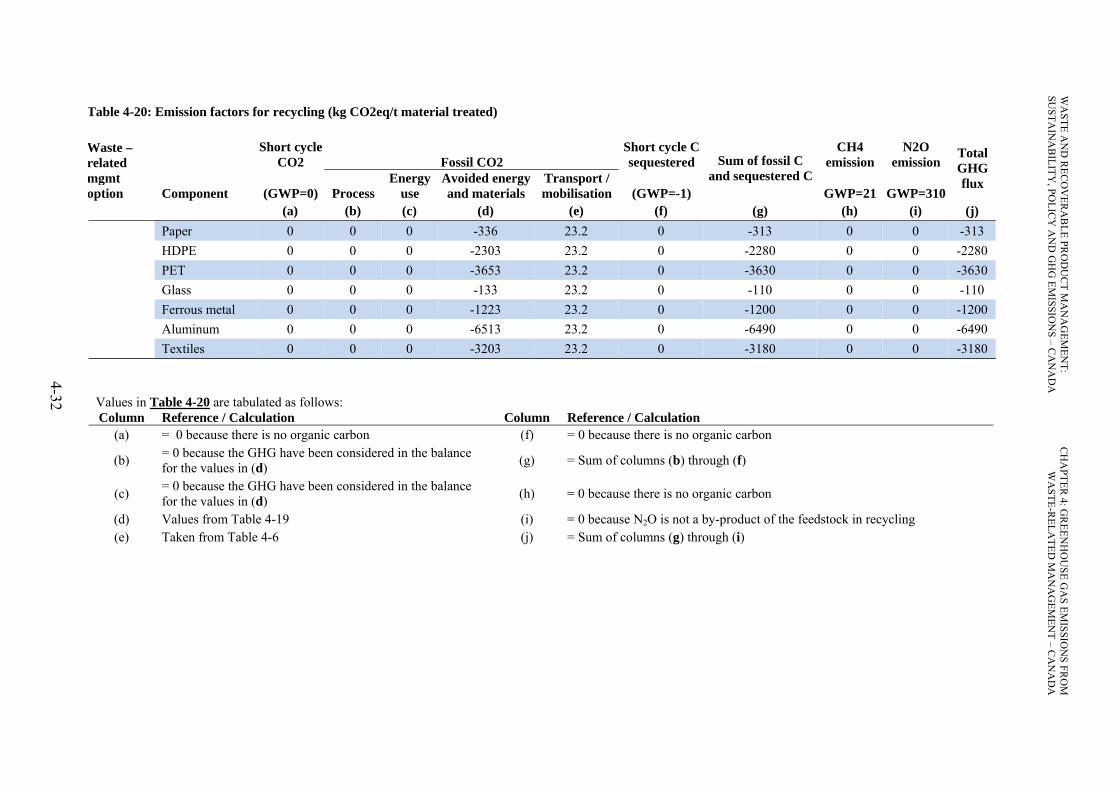
Table 4-20: Emission factors for recycling (kg CO2eq/t material treated)
Waste –related mgmt option Component
Short cycle CO2 Fossil CO2
Short cycle C sequestered Sum of fossil C
and sequestered C
CH4 emission
N2O emission
Total GHG flux
(GWP=0) Process Energy
use Avoided energy and materials
Transport / mobilisation (GWP=-1) GWP=21 GWP=310
(a) (b) (c) (d) (e) (f) (g) (h) (i) (j) Paper 0 0 0 -336 23.2 0 -313 0 0 -313 HDPE 0 0 0 -2303 23.2 0 -2280 0 0 -2280 PET 0 0 0 -3653 23.2 0 -3630 0 0 -3630 Glass 0 0 0 -133 23.2 0 -110 0 0 -110 Ferrous metal 0 0 0 -1223 23.2 0 -1200 0 0 -1200 Aluminum 0 0 0 -6513 23.2 0 -6490 0 0 -6490 Textiles 0 0 0 -3203 23.2 0 -3180 0 0 -3180
Values in Table 4-20 are tabulated as follows: Column Reference / Calculation Column Reference / Calculation
(a) = 0 because there is no organic carbon (f) = 0 because there is no organic carbon
(b) = 0 because the GHG have been considered in the balance for the values in (d) (g) = Sum of columns (b) through (f)
(c) = 0 because the GHG have been considered in the balance for the values in (d) (h) = 0 because there is no organic carbon
(d) Values from Table 4-19 (i) = 0 because N2O is not a by-product of the feedstock in recycling (e) Taken from Table 4-6 (j) = Sum of columns (g) through (i)
4-32
WA
STE AN
D R
ECO
VER
AB
LE PRO
DU
CT M
AN
AG
EMEN
T: SU
STAIN
AB
ILITY, PO
LICY
AN
D G
HG
EMISSIO
NS – C
AN
AD
A C
HA
PTER 4: G
REEN
HO
USE G
AS EM
ISSION
S FRO
MW
ASTE-R
ELATED
MA
NA
GEM
ENT – C
AN
AD
A
THE ANALYSYS OF THE POTENTIAL OF MATERIAL AND ENERGY RECOVERY OF MUNICIPAL WASTE IN CANADA
CHAPTER 4: GREENHOUSE GAS EMISSIONS FROMWASTE-RELATED MANAGEMENT
4-33
4.3 Comparison
Based on the methodology explained above and the calculations performed, the various
waste-related management practices can now be compared. Table 4-21 summarizes the net
GHG fluxes for each MW&RP component. In general recycling is by far the most favourable,
since the extraction and refinement of raw resources is very energy intensive. In addition,
there are many other avoided environmental effects associated with recycling which are not
quantified here, which is also the case with the other processes. The following text will
simply discuss the results obtained.
In general, the net GHG emissions are reduced as better technology is applied to the various
waster-related management activities. It is not hard to imagine that as technology and
techniques progress, the processes will improve and become more efficient. However, some
of the technological assumptions made here may never achieve their full potential in reality.
For example, the gasification of MW&RP with combined heat and electricity recovery may
never be applied to all potential feedstock due to financial, social, geographical or even
political reasons. Therefore the emission estimates in these cases should be seen as best case
scenarios, but not necessarily practical approaches. This logic will be applied in the following
analysis.
4.3.1 Landfill
The 3 scenarios compared for landfills – Base case, Best case and Restoration Layer – have
an increasingly dramatic effect on the GHG flux. The base case (current Canadian situation)
demonstrates the largest positive effect on global warming within the landfill options and
compared to the other alternatives. Once landfill gas collection is increased from 22% to 80%
(Best Case) the released methane is converted to CO2, creating a much smaller positive GHG
flux. For the Restoration layer, the uncollected methane is oxidized further improving the
negative flux of the process. However, the last two options may not be feasible in reality.
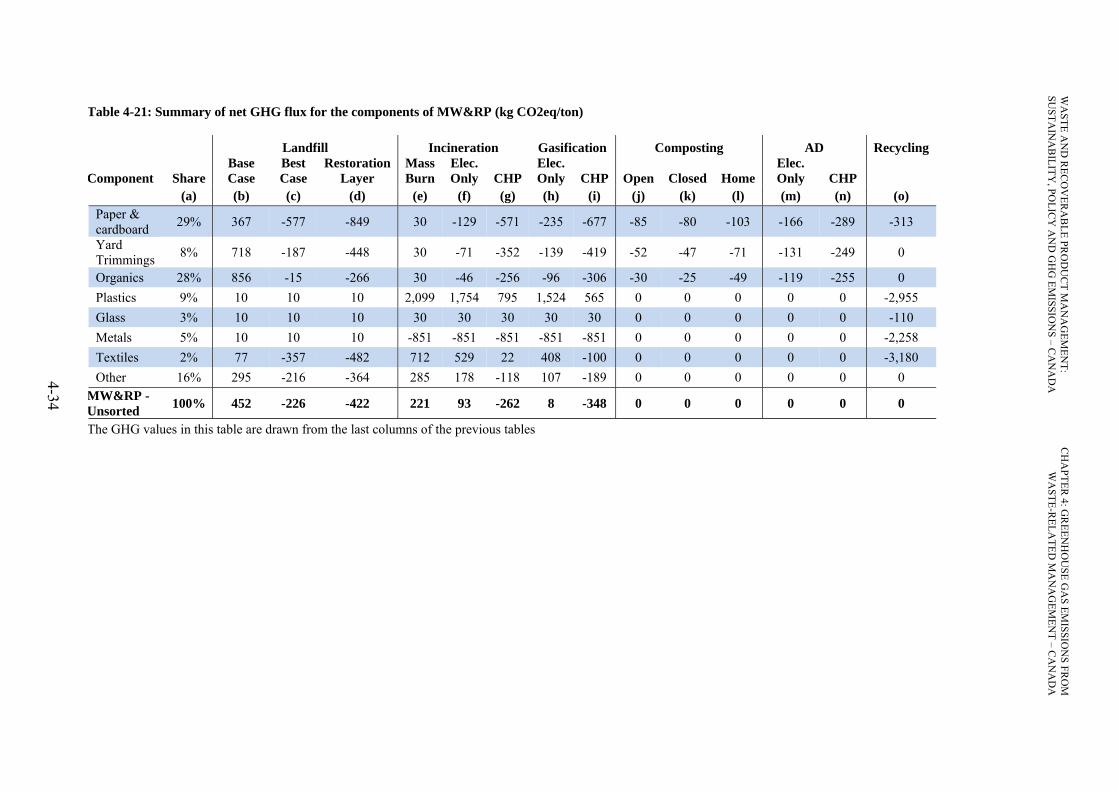
Table 4-21: Summary of net GHG flux for the components of MW&RP (kg CO2eq/ton)
Landfill Incineration Gasification Composting AD Recycling
Component Share Base Case
Best Case
Restoration Layer
Mass Burn
Elec. Only CHP
Elec. Only CHP Open Closed Home
Elec. Only CHP
(a) (b) (c) (d) (e) (f) (g) (h) (i) (j) (k) (l) (m) (n) (o) Paper & cardboard 29% 367 -577 -849 30 -129 -571 -235 -677 -85 -80 -103 -166 -289 -313
Yard Trimmings 8% 718 -187 -448 30 -71 -352 -139 -419 -52 -47 -71 -131 -249 0
Organics 28% 856 -15 -266 30 -46 -256 -96 -306 -30 -25 -49 -119 -255 0 Plastics 9% 10 10 10 2,099 1,754 795 1,524 565 0 0 0 0 0 -2,955 Glass 3% 10 10 10 30 30 30 30 30 0 0 0 0 0 -110 Metals 5% 10 10 10 -851 -851 -851 -851 -851 0 0 0 0 0 -2,258 Textiles 2% 77 -357 -482 712 529 22 408 -100 0 0 0 0 0 -3,180 Other 16% 295 -216 -364 285 178 -118 107 -189 0 0 0 0 0 0
MW&RP - Unsorted 100% 452 -226 -422 221 93 -262 8 -348 0 0 0 0 0 0
The GHG values in this table are drawn from the last columns of the previous tables
4-34
WA
STE AN
D R
ECO
VER
AB
LE PRO
DU
CT M
AN
AG
EMEN
T: SU
STAIN
AB
ILITY, PO
LICY
AN
D G
HG
EMISSIO
NS – C
AN
AD
A C
HA
PTER 4: G
REEN
HO
USE G
AS EM
ISSION
S FRO
MW
ASTE-R
ELATED
MA
NA
GEM
ENT – C
AN
AD
A
THE ANALYSYS OF THE POTENTIAL OF MATERIAL AND ENERGY RECOVERY OF MUNICIPAL WASTE IN CANADA
CHAPTER 4: GREENHOUSE GAS EMISSIONS FROMWASTE-RELATED MANAGEMENT
4-35
As discussed previously, the theoretical maximum landfill gas capture is thought to be only
19% over the lifetime of the products. The current Canadian figures estimate that 22% of the
landfill gas is collected. This could however be overstated. First, the methane generated could
have been underestimated. Secondly, the reported capture figures were recorded for that year
and are not averaged over the life of the landfill. Based on the known degradation of organics
in landfills, the process still occurs 100 years after being landfilled. Therefore a 22% capture
of landfill gas may be an overstatement over the lifespan on the site.
With regard to the restoration layer, this appears to be an effective way to mitigate methane
release into the atmosphere. But being only a futuristic approach, it has not been proven in
practice and so it is considered unfeasible for the subsequent calculations.
Another important factor of the landfill GHG flux is the level of biogenic carbon that is
assumed to be degraded or sequestered. This factor depends on the degree of DDOC, which
can vary greatly and is subject to much debate. Table 4-10 shows the effect of the DDOC on
the emissions. For unsorted MW&RP the net GHG emission vary from 165 to 773 kg
CO2eq/ton for low and high DDOC figures, respectively. The greater the DDOC, the more
carbon is released and consequently the quantity of methane increases. Knowing the
deviation range in these figures, the averages are used for all the scenarios.
In other words the Base Case for landfills seems to be the only reasonable estimate of current
and future emissions for this type of waste-related activity. Therefore, landfills are by far the
least favourable disposal method.
4.3.2 Incineration
Similar to landfills, as the technology improves, the net GHG emissions are reduced.
However, this is directly related to the amount of energy recovery (energy recycling). In the
case of incineration with no energy recovery the emissions for unsorted MW&RP are
strongly positive. It represents about half of the net GHG emissions of landfills but is
estimated as the second worst waste-related management alternative. Regardless, the
conclusion can still be made that, on average, incineration with no energy recovery is better
than landfills. If energy recovery is applied, the process is far more favourable than landfill.
In addition, it was previously seen that incineration has many advantages over landfills in
relation to other environmental impacts.
THE ANALYSYS OF THE POTENTIAL OF MATERIAL AND ENERGY RECOVERY OF MUNICIPAL WASTE IN CANADA
CHAPTER 4: GREENHOUSE GAS EMISSIONS FROMWASTE-RELATED MANAGEMENT
4-36
As for the various technologies applied, it is clear that a combined heat and power process is
more advantageous than only one of the two or none. In practice it is much easier to produce
electricity than it is to recover heat. For heat to be recovered there needs to be a demand close
to the incineration source or have a centralised heating system. This can be useful for places
like hospitals which have a continuous supply of hazardous waste and a need to heat and
power. On larger scale facilities in cities it is not as easy to distribute the heat. Although it is
greatly advantageous to apply CHP technologies, it is assumed that in Canada only
incineration with electricity recovery is reasonably applicable in these scenarios. However, it
is foreseeable that future incinerators will be located closer to the source and consequently
gasification technologies with CHP recovery are quite probable.
Another important note is that incinerators will never use unsorted MW&RP as a fuel source,
since not all materials are suitable for combustion. Therefore, incineration is not a single
solution to the waste-related problems. Considering that sorting is a precursor to incineration,
this approach is well suited to be used in tandem with other solutions, such as AD and
recycling.
4.3.3 Composting and AD
The net GHG emissions for both anaerobic digestion and composting are all negative, due to
carbon sequestration and avoided inorganic fertiliser use. The emissions are further reduced
by minimising process energy (home composting vs. open or closed) or increasing the energy
recovery (AD CHP vs. Elec. only). In all cases, it is more favourable to use anaerobic
digestion of the organics since energy is recovered. But the same issue as with incineration
applies with AD, regarding proximity of the facility to point of use. Farms for example are
excellent locations for AD facilities.
Although AD is better from a GHG flux perspective, many people prefer to compost at home
to produce their own fertiliser. But on a macro scale, the model shows that AD is more
favourable overall, with the same fertiliser outputs. Centralised AD facilities with electricity
recovery may be the most advantageous solution for organics.
In addition this process only applies to organic materials such as yard trimming, food scraps
and paper. Separation is required and so it is well suited for use with other waste-related
processes.

THE ANALYSYS OF THE POTENTIAL OF MATERIAL AND ENERGY RECOVERY OF MUNICIPAL WASTE IN CANADA
CHAPTER 4: GREENHOUSE GAS EMISSIONS FROMWASTE-RELATED MANAGEMENT
4-37
4.3.4 Recycling
Recycling shows the highest avoided emissions for all applicable products. It is the most
favourable waste-related management option, compared to the other disposal processes (note
that reuse is still more favourable than recycling in the hierarchy). On the other hand, a
portion of the recyclables (10%) will always be unusable due to the degradation in material
quality over time. Therefore recycling cannot be used as the only solution. It also needs to be
applied with other processes.
4.3.5 Material specific
The following is a brief discussion of the favoured processes based on the type of material.
4.3.5.1 Unsorted MW&RP
As a starting point, unsorted MW&RP is generally only suitable for landfill or incineration
since all other processes are more component specific. Incineration requires some degree of
separation prior to combustion but it can process most materials if required. Figure 4-5 shows
a comparison of these two waste-related activities. By far, landfills with current standards
have the largest positive GHG flux. Future landfill techniques may drastically improve this,
but as discussed, this is unlikely.
Figure 4-5: GHG Flux of landfill vs. incineration of unsorted MW&RP
452
-226
-422
22193
-262
8
-348-500-400-300-200-100
0100200300400500
Net
GH
G F
lux
(kg
CO
2eq/
ton)
GHG Flux Landfill vs. Incineration - Unsorted MW&RP

THE ANALYSYS OF THE POTENTIAL OF MATERIAL AND ENERGY RECOVERY OF MUNICIPAL WASTE IN CANADA
CHAPTER 4: GREENHOUSE GAS EMISSIONS FROMWASTE-RELATED MANAGEMENT
4-38
In general it is more favourable to incinerate MW&RP even with current technology. With
CHP facilities, the offset utilities make the process quite advantageous.
In both these cases, it assumes that no separation (at source or centralized) is being done.
Since all the other waste-related processes require material separation the subsequent analysis
assumes that this is the case. The figures for unsorted MW&RP are included only for
discussion purposes.
4.3.5.2 Organics
Organics (food scraps, yard trimmings, paper & cardboard) are assumed to be comprised of
biogenic carbon. In essence all this carbon is considered as short cycle. Consequently, if
allowed to decompose properly it has no net effect on the GHG emissions. Disposing of
organics in landfills prevents this organic decomposition and promotes the creation of
methane, which is very difficult to control and capture. That said, organics should never go to
landfill since they have such a positive impact on the GHG emissions.
Figure 4-6, Figure 4-7 & Figure 4-8 compare all the analysed processes for paper &
cardboard, yard trimmings and food scraps respectively. The most favourable destination for
organics is either incineration, composting or AD. But the probability of high moisture
organics (food scraps and some yard trimmings) being used in incinerators is low, since
drying the material requires more energy and some heating value can be lost during
drying/storage. In practice, it is more probable that high moisture organics will be either
composted or sent for AD.
With regards to paper & cardboard, there is also a value in recycling which cannot be
ignored. These materials are suitable for incineration but depending on the efficiency of the
heat recovery system, it may be more beneficial to recycle paper & cardboard.
4.3.5.3 Recyclables
For all recyclable materials (plastics, glass, metals and some textiles) it is far more favourable
to recover and recycle compared to any other processes. However, a certain portion (10%)
still needs to be disposed of due to attrition. Therefore, landfill or incineration still needs to
be considered in tandem with recycling.

THE ANALYSYS OF THE POTENTIAL OF MATERIAL AND ENERGY RECOVERY OF MUNICIPAL WASTE IN CANADA
CHAPTER 4: GREENHOUSE GAS EMISSIONS FROMWASTE-RELATED MANAGEMENT
4-39
Figure 4-6: GHG flux of Paper & cardboard
Figure 4-7: GHG flux of Yard Trimmings
367
-577
-849
30
-129
-571
-235
-677
-85 -80 -103-166
-289 -313
-1.000
-800
-600
-400
-200
0
200
400
600N
et G
HG
Flu
x (k
g C
O2e
q/to
n)GHG Flux of Paper & Cardboard
718
-187
-448
30
-71
-352
-139
-419
-52 -47 -71-131
-249
-600
-400
-200
0
200
400
600
800
Net
GH
G F
lux
(kg
CO
2eq/
ton)
GHG Flux of Yard Trimmings

THE ANALYSYS OF THE POTENTIAL OF MATERIAL AND ENERGY RECOVERY OF MUNICIPAL WASTE IN CANADA
CHAPTER 4: GREENHOUSE GAS EMISSIONS FROMWASTE-RELATED MANAGEMENT
4-40
Figure 4-8: GHG Flux of Food Scraps
4.3.5.4 Others
Others are a mix of miscellaneous combustibles, non-combustibles and fines. Since the
composition is not exactly known, it is assumed to be suitable for either landfill of
incineration. Based on the figures of Table 4-21, any form of incineration is more favourable
than the base case of landfill.
4.4 Scenarios
The following section uses the GHG estimates previously calculated to compare various
waste-related management scenarios for Canada. The scenarios are all based on 2004
Canadian data as follows:
1. Base case – Current Situation
2. Maximum diversion – Composting and Recycling
3. Maximum WRPtE – AD and incineration
4. Optimised diversion and WRPtE
5. Improved Base Case 1 – 2x Diversion, 2x WRPtE
6. Improved Base Case 2 – +20% Diversion & 50% WRPtE
7. Maximum Landfill
856
-15
-266
30
-46-256
-96
-306
-30 -25 -49-119
-255-400
-200
0
200
400
600
800
1.000N
et G
HG
Flu
x (k
g C
O2e
q/to
n)GHG Flux of Organics

THE ANALYSYS OF THE POTENTIAL OF MATERIAL AND ENERGY RECOVERY OF MUNICIPAL WASTE IN CANADA
CHAPTER 4: GREENHOUSE GAS EMISSIONS FROMWASTE-RELATED MANAGEMENT
4-41
The Base Case considers only current Canadian data and waste-related management
practices. This would mean that of the generated MW&RP in 2004, 74.0% went to landfill,
2.3% was incinerated and 23.7% was diverted. The diverted information is taken from
Statistics Canada [27]. The rest of the products sent to landfill or incineration were scaled
based on the remaining balance. Table 4-22 summarizes the emissions for each product based
on this information.
The subsequent 2 scenarios are extremes of various waste-related management practices
(maximum diversion & maximum WRPtE), which are derived from the first base case. The
purpose is simply to demonstrate the limits of the related emissions if one single practice is
observed. The conclusions are presented for discussion purposes.
The scenario with Maximum Diversion assumes that all possible material is recycled or
composted. In this case, all recyclables including paper and cardboard are recycled and all
organics are composted. With regards to the recyclables, a 10% attrition rate is assumed, and
the materials are sent to landfill. All others are sent to landfill. The summary of this scenario
is presented in Table 4-23.
For Maximum WRPtE the energy recovery is maximised, based on reasonable technology
assumption discussed early. All organics are sent to an AD facility with electrical production
only. All other carbon materials are sent to incineration with only electricity produced.
Ferrous metals are recovered from the incineration process and sent to recycling (not shown
in summary, but included in the GHG flux for incineration). Glass is sent to landfill. The
summary of this scenario is shown in Table 4-24.
Next, the Optimised scenario combines the best of the previous extremes scenario. The
scenario assumes that the materials are being sorted and sent to the most appropriate facility
based on their GHG potential. In this case, all recyclables are sent for recycling. 10% of the
recyclables are disposed of (due to attrition): metals and glass are sent to landfill and plastics
and textiles are incinerated. All organics are sent to a digester and the ‘other’ material is
incinerated. The results of this scenario are presented in Table 4-25.
The following two scenarios are more realistic, whereas they are practical improvements on
the Base Case.
The first of these practical scenarios (scenario #5) assumes that the diversion rate is doubled
from the base case, from 23.7% to 43.7% (the totals are not exactly doubled since the ‘Not
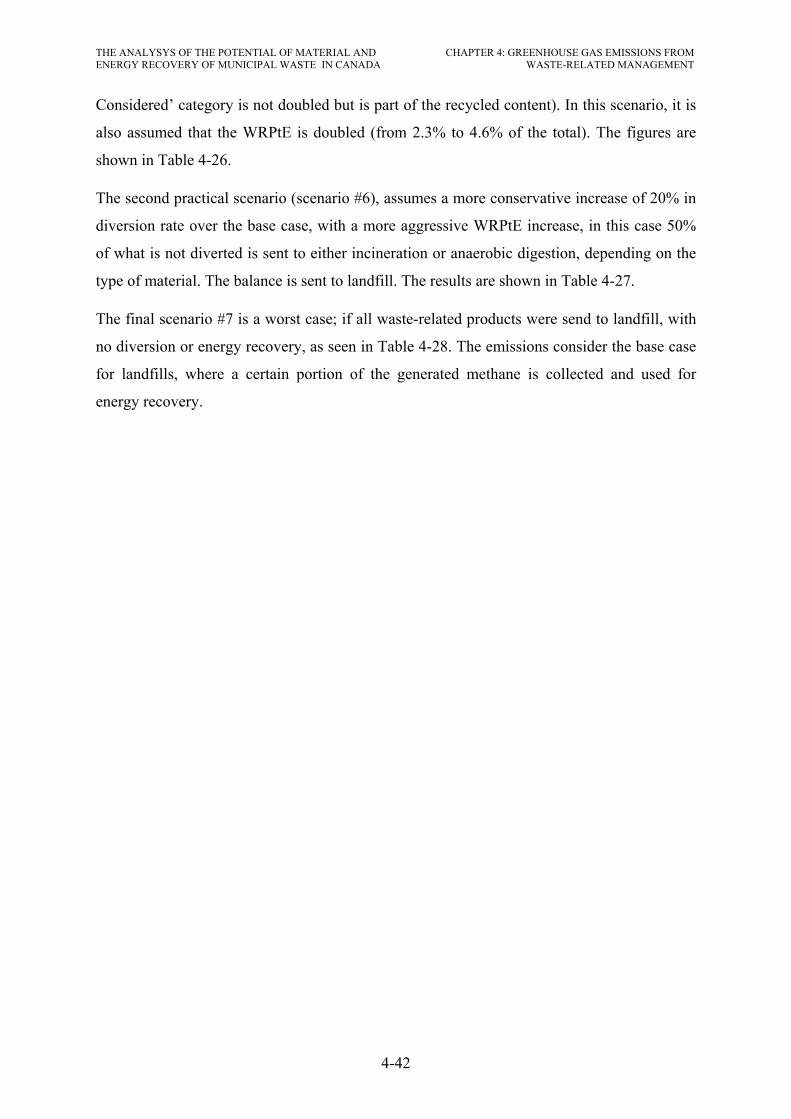
THE ANALYSYS OF THE POTENTIAL OF MATERIAL AND ENERGY RECOVERY OF MUNICIPAL WASTE IN CANADA
CHAPTER 4: GREENHOUSE GAS EMISSIONS FROMWASTE-RELATED MANAGEMENT
4-42
Considered’ category is not doubled but is part of the recycled content). In this scenario, it is
also assumed that the WRPtE is doubled (from 2.3% to 4.6% of the total). The figures are
shown in Table 4-26.
The second practical scenario (scenario #6), assumes a more conservative increase of 20% in
diversion rate over the base case, with a more aggressive WRPtE increase, in this case 50%
of what is not diverted is sent to either incineration or anaerobic digestion, depending on the
type of material. The balance is sent to landfill. The results are shown in Table 4-27.
The final scenario #7 is a worst case; if all waste-related products were send to landfill, with
no diversion or energy recovery, as seen in Table 4-28. The emissions consider the base case
for landfills, where a certain portion of the generated methane is collected and used for
energy recovery.

Table 4-22: GHG Summary - Base Case
Material Destination (ton) Net GHG Emission (ton CO2eq) Disposed Diverted Landfill Incinerate Compost AD Recycle Total
Material Generated Landfill Incinerate Compost AD Recycle Base Case Elec. Only Open
Elec. Only
(a) (b) (c) (d) (e) (f) (g) (h) (i) (j) (k) (h) Paper & cardboard 9,254,437 5,788,562 179,028 0 0 3,286,848 2,124,694 -23,133 0 0 -1,028,338 1,073,223
Yard Trimmings 2,414,201 2,341,775 72,426 0 0 1,682,500 -5,161 0 0 0 1,677,339 Organics 8,986,193 7,097,536 219,511 1,669,145 0 6,076,544 -10,056 -50,412 0 0 6,016,075 Plastics 2,950,690 2,679,512 82,871 0 0 188,307 27,586 145,332 0 0 -556,447 -383,529 Glass 1,072,978 653,478 20,211 0 0 399,290 6,728 600 0 0 -43,922 -36,594
Metals 1,475,345 537,961 16,638 0 0 920,746 5,538 -14,159 0 0 -2,079,044 -2,087,665
Textiles 766,106 743,123 22,983 0 0 57,139 12,168 0 0 0 69,307 Other 5,001,152 4,690,335 145,062 0 0 165,755 1,385,505 25,856 0 0 0 1,411,361 a Not Considered 1,234,559 0 0 0 0 1,234,559 0 0 0 0 0 0
Total 33,155,662 24,532,282 758,730 1,669,145 0 6,195,505 11,366,234 131,447 -50,412 0 -3,707,751 7,739,517 Share 100.00% 74.0% 2.3% 5.0% 0.0% 18.7% a Not Considered (White goods, Electronics, Tires, Construction & Demolition Waste)
For Table 4-22 the values were tabulated as follows: Column Reference / Calculation Column Reference / Calculation
(a) Adapted from Canadian data [27] (g) = (b) x (b) of Table 4-21
(b) = {(a) – (f)} x 97% (share of disposed W&RP sent to landfill in Canada) (h) = (c) x (f) of Table 4-21
(c) = {(a) – (f)} x 3% (share of disposed W&RP sent to incineration in Canada) (i) = (d) x (j) of Table 4-21
(d) From Canadian data [27] (j) = (e) x (m) of Table 4-21 (e) From Canadian data [27] (k) = (f) x (o) of Table 4-21 (f) From Canadian data [27] (h) = Sum of (g) through (h)
4-43
WA
STE AN
D R
ECO
VER
AB
LE PRO
DU
CT M
AN
AG
EMEN
T: SU
STAIN
AB
ILITY, PO
LICY
AN
D G
HG
EMISSIO
NS – C
AN
AD
A C
HA
PTER 4: G
REEN
HO
USE G
AS EM
ISSION
S FRO
MW
ASTE-R
ELATED
MA
NA
GEM
ENT – C
AN
AD
A

Table 4-23: GHG Summary - Maximum diversion
Material Destination (ton) Net GHG Emission (ton CO2eq) Disposed Diverted Landfill Incinerate Compost AD Recycle Total
Material Generated Landfill Incinerate Compost AD Recycle Base Case
Elec. Only Open
Elec. Only
(a) (b) (c) (d) (e) (f) (g) (h) (i) (j) (k) (h) Paper & cardboard 9,254,437 925,444 0 0 0 8,328,994 339,684 0 0 0 -2,605,845 -2,266,161
Yard Trimmings 2,414,201 0 0 2,414,201 0 0 0 0 -124,905 0 0 -124,905 Organics 8,986,193 0 0 8,986,193 0 0 0 0 -271,404 0 0 -271,404 Plastics 2,950,690 295,069 0 0 0 2,655,621 3,038 0 0 0 -7,847,361 -7,844,323 Glass 1,072,978 107,298 0 0 0 965,680 1,105 0 0 0 -106,225 -105,120 Metals 1,475,345 147,535 0 0 0 1,327,811 1,519 0 0 0 -2,998,196 -2,996,677 Textiles 766,106 76,611 0 0 0 689,496 5,891 0 0 0 -2,192,471 -2,186,580 Other 5,001,152 5,001,152 0 0 0 0 1,477,319 0 0 0 0 1,477,319 a Not Considered 1,234,559 0 0 0 0 1,234,559 0 0 0 0 0 0
Total 33,155,662 6,553,107 0 11,400,394 0 15,202,161 1,828,556 0 -396,309 0 -15,750,098 -14,317,851 Share 100.0% 19.8% 0.0% 34.4% 0.0% 45.9% a Not Considered (White goods, Electronics, Tires, Construction & Demolition Waste)
For Table 4-23 the values were tabulated as follows: Column Reference / Calculation Column Reference / Calculation
(a) Adapted from Canadian data [27] (g) = (b) x (b) of Table 4-21
(b) = (a) x 10% of recyclables (due to attrition sent to landfill) This excludes yard trimmings and organics (h) = (c) x (f) of Table 4-21
(c) = 0, Material disposed must go to landfill (i) = (d) x (j) of Table 4-21 (d) = Only yard trimmings and organics (j) = (e) x (m) of Table 4-21 (e) = 0, AD not considered in this scenario (k) = (f) x (o) of Table 4-21
(f) = (a) – (b) This excludes yard trimmings and organics (h) = Sum of (g) through (h)
4-44
WA
STE AN
D R
ECO
VER
AB
LE PRO
DU
CT M
AN
AG
EMEN
T: SU
STAIN
AB
ILITY, PO
LICY
AN
D G
HG
EMISSIO
NS – C
AN
AD
A C
HA
PTER 4: G
REEN
HO
USE G
AS EM
ISSION
S FRO
MW
ASTE-R
ELATED
MA
NA
GEM
ENT – C
AN
AD
A

Table 4-24: GHG Summary - Maximum WRPtE
Material Destination (ton) Net GHG Emission (ton CO2eq) Disposed Diverted Landfill Incinerate Compost AD Recycle Total
Material Generated Landfill Incinerate Compost AD Recycle Base Case
Elec. Only Open Elec. Only
(a) (b) (c) (d) (e) (f) (g) (h) (i) (j) (k) (h) Paper & cardboard 9,254,437 0 0 0 9,254,437 0 0 0 0 -1,539,546 0 -1,539,546
Yard Trimmings 2,414,201 0 0 0 2,414,201 0 0 0 0 -315,703 0 -315,703
Organics 8,986,193 0 0 0 8,986,193 0 0 0 0 -1,073,441 0 -1,073,441 Plastics 2,950,690 0 2,950,690 0 0 0 0 5,174,638 0 0 0 5,174,638 Glass 1,072,978 1,072,978 0 0 0 0 11,047 0 0 0 0 11,047 Metals 1,475,345 0 1,475,345 0 0 0 0 -1,255,539 0 0 0 -1,255,539 Textiles 766,106 0 766,106 0 0 0 0 405,608 0 0 0 405,608 Other 5,001,152 0 5,001,152 0 0 0 0 891,410 0 0 0 891,410 a Not Considered 1,234,559 0 0 0 0 1,234,559 0 0 0 0 0 0
Total 33,155,662 1,072,978 10,193,293 0 20,654,831 1,234,559 11,047 5,216,116 0 -2,928,690 0 2,298,473 Share 100.0% 3.2% 30.7% 0.0% 62.3% 3.7%
a Not Considered (White goods, Electronics, Tires, Construction & Demolition Waste)
For Table 4-24 the values were tabulated as follows: Column Reference / Calculation Column Reference / Calculation
(a) Adapted from Canadian data [27] (g) = (b) x (b) of Table 4-21
(b) All materials are used to create energy. Glass cannot do this, it is sent to landfill. (h) = (c) x (f) of Table 4-21
(c) Plastics, metals, textiles and others are incinerated (i) = (d) x (j) of Table 4-21 (d) Nothing composted (j) = (e) x (m) of Table 4-21 (e) Organics are sent for AD (k) = (f) x (o) of Table 4-21 (f) Only the not considered is recycled. (h) = Sum of (g) through (h)
4-45
WA
STE AN
D R
ECO
VER
AB
LE PRO
DU
CT M
AN
AG
EMEN
T: SU
STAIN
AB
ILITY, PO
LICY
AN
D G
HG
EMISSIO
NS – C
AN
AD
A C
HA
PTER 4: G
REEN
HO
USE G
AS EM
ISSION
S FRO
MW
ASTE-R
ELATED
MA
NA
GEM
ENT – C
AN
AD
A

Table 4-25: GHG Summary - Optimised Waste-Related Management
Material Destination (ton) Net GHG Emission (ton CO2eq) Disposed Diverted Landfill Incinerate Compost AD Recycle Total
Material Generated Landfill Incinerate Compost AD Recycle Base Case
Elec. Only Open Elec. Only
(a) (b) (c) (d) (e) (f) (g) (h) (i) (j) (k) (h) Paper & cardboard 9,254,437 0 0 0 925,444 8,328,994 0 0 0 -153,955 -2,605,845 -2,759,800
Yard Trimmings 2,414,201 0 0 0 2,414,201 0 0 0 0 -315,703 0 -315,703
Organics 8,986,193 0 0 0 8,986,193 0 0 0 0 -1,073,441 0 -1,073,441 Plastics 2,950,690 0 295,069 0 0 2,655,621 0 517,464 0 0 -7,847,361 -7,329,897 Glass 1,072,978 107,298 0 0 0 965,680 1,105 0 0 0 -106,225 -105,120 Metals 1,475,345 147,535 0 0 0 1,327,811 1,519 0 0 0 -2,998,196 -2,996,677 Textiles 766,106 0 76,611 0 0 689,496 0 40,561 0 0 -2,192,471 -2,151,910 Other 5,001,152 0 5,001,152 0 0 0 0 891,410 0 0 0 891,410 a Not Considered 1,234,559 0 0 0 0 1,234,559 0 0 0 0 0 0
Total 33,155,662 254,832 5,372,831 0 12,325,838 15,202,161 2,624 1,449,434 0 -1,543,099 -15,750,098 -15,841,139 Share 100.0% 0.8% 16.2% 0.0% 37.2% 45.9% a Not Considered (White goods, Electronics, Tires, Construction & Demolition Waste)
For Table 4-25 the values were tabulated as follows: Column Reference / Calculation Column Reference / Calculation
(a) Adapted from Canadian data [27] (g) = (b) x (b) of Table 4-21 (b) 10% of glass and metals are sent to landfill due to attrition (h) = (c) x (f) of Table 4-21
(c) 10% of plastics, textiles and others are incinerated due to attrition (i) = (d) x (j) of Table 4-21
(d) Nothing composted (j) = (e) x (m) of Table 4-21 (e) Maximum organics are sent to AD (only 10% of paper) (k) = (f) x (o) of Table 4-21 (f) Maximum recycling is done (less attrition). (h) = Sum of (g) through (h)
4-46
WA
STE AN
D R
ECO
VER
AB
LE PRO
DU
CT M
AN
AG
EMEN
T: SU
STAIN
AB
ILITY, PO
LICY
AN
D G
HG
EMISSIO
NS – C
AN
AD
A C
HA
PTER 4: G
REEN
HO
USE G
AS EM
ISSION
S FRO
MW
ASTE-R
ELATED
MA
NA
GEM
ENT – C
AN
AD
A

Table 4-26: GHG Summary - Diversion x2, WRPtE x2
Material Destination (ton) Net GHG Emission (ton CO2eq) Disposed Diverted Landfill Incinerate Compost AD Recycle Total
Material Generated Landfill Incinerate Compost AD Recycle Base Case
Elec. Only Open
Elec. Only
(a) (b) (c) (d) (e) (f) (g) (h) (i) (j) (k) (h) Paper & cardboard 9,254,437 2,322,686 358,055 0 0 6,573,696 852,543 -46,267 0 0 -2,056,675 -1,250,399
Yard Trimmings 2,414,201 2,269,349 144,852 0 0 0 1,630,464 -10,322 0 0 0 1,620,142
Organics 8,986,193 5,208,880 439,023 3,338,290 0 0 4,459,574 -20,112 -100,824 0 0 4,338,637 Plastics 2,950,690 2,408,333 165,743 0 0 376,614 24,794 290,664 0 0 -1,112,894 -797,436 Glass 1,072,978 233,977 40,421 0 0 798,580 2,409 1,200 0 0 -87,844 -84,235 Metals 1,475,345 -399,423 33,276 0 0 1,841,492 -4,112 -28,318 0 0 -4,158,089 -4,190,519 Textiles 766,106 720,140 45,966 0 0 0 55,372 24,336 0 0 0 79,708 Other 5,001,152 4,379,518 290,124 0 0 331,510 1,293,691 51,712 0 0 0 1,345,403 a Not Considered 1,234,559 0 0 0 0 1,234,559 0 0 0 0 0 0
Total 33,155,662 17,143,460 1,517,461 3,338,290 0 11,156,451 8,314,734 262,893 -100,824 0 -7,415,502 1,061,301 Share 100.0% 51.7% 4.6% 10.1% 0.0% 33.6% a Not Considered (White goods, Electronics, Tires, Construction & Demolition Waste)
For Table 4-26 the values were tabulated as follows: Column Reference / Calculation Column Reference / Calculation
(a) Adapted from Canadian data [27] (g) = (b) x (b) of Table 4-21 (b) = (a) – (c) – (d) – (e) – (f) (h) = (c) x (f) of Table 4-21 (c) = (c) from Table 4-22 x 2 (i) = (d) x (j) of Table 4-21 (d) = (d) from Table 4-22 x 2 (j) = (e) x (m) of Table 4-21 (e) = (e) from Table 4-22 x 2 (k) = (f) x (o) of Table 4-21 (f) = (f) from Table 4-22 x 2 (h) = Sum of (g) through (h)
4-47
WA
STE AN
D R
ECO
VER
AB
LE PRO
DU
CT M
AN
AG
EMEN
T: SU
STAIN
AB
ILITY, PO
LICY
AN
D G
HG
EMISSIO
NS – C
AN
AD
A C
HA
PTER 4: G
REEN
HO
USE G
AS EM
ISSION
S FRO
MW
ASTE-R
ELATED
MA
NA
GEM
ENT – C
AN
AD
A
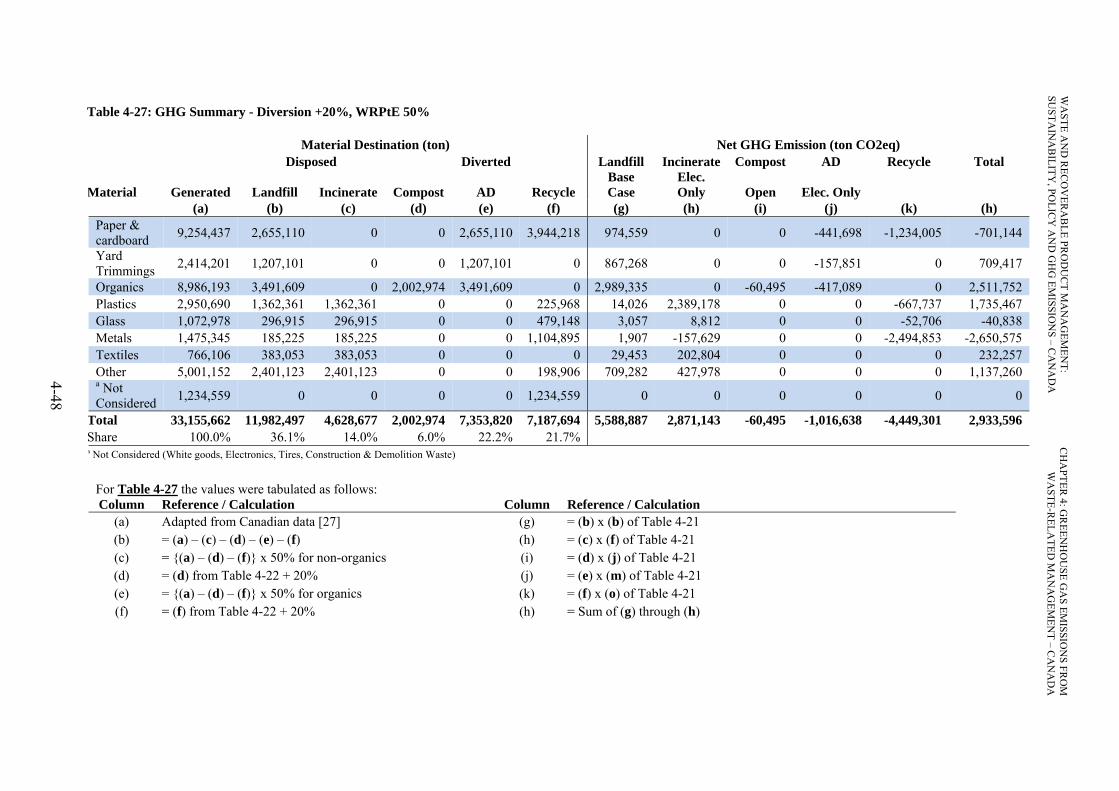
Table 4-27: GHG Summary - Diversion +20%, WRPtE 50%
Material Destination (ton) Net GHG Emission (ton CO2eq) Disposed Diverted Landfill Incinerate Compost AD Recycle Total
Material Generated Landfill Incinerate Compost AD Recycle Base Case
Elec. Only Open Elec. Only
(a) (b) (c) (d) (e) (f) (g) (h) (i) (j) (k) (h) Paper & cardboard 9,254,437 2,655,110 0 0 2,655,110 3,944,218 974,559 0 0 -441,698 -1,234,005 -701,144
Yard Trimmings 2,414,201 1,207,101 0 0 1,207,101 0 867,268 0 0 -157,851 0 709,417
Organics 8,986,193 3,491,609 0 2,002,974 3,491,609 0 2,989,335 0 -60,495 -417,089 0 2,511,752 Plastics 2,950,690 1,362,361 1,362,361 0 0 225,968 14,026 2,389,178 0 0 -667,737 1,735,467 Glass 1,072,978 296,915 296,915 0 0 479,148 3,057 8,812 0 0 -52,706 -40,838 Metals 1,475,345 185,225 185,225 0 0 1,104,895 1,907 -157,629 0 0 -2,494,853 -2,650,575 Textiles 766,106 383,053 383,053 0 0 0 29,453 202,804 0 0 0 232,257 Other 5,001,152 2,401,123 2,401,123 0 0 198,906 709,282 427,978 0 0 0 1,137,260 a Not Considered 1,234,559 0 0 0 0 1,234,559 0 0 0 0 0 0
Total 33,155,662 11,982,497 4,628,677 2,002,974 7,353,820 7,187,694 5,588,887 2,871,143 -60,495 -1,016,638 -4,449,301 2,933,596 Share 100.0% 36.1% 14.0% 6.0% 22.2% 21.7% a Not Considered (White goods, Electronics, Tires, Construction & Demolition Waste)
For Table 4-27 the values were tabulated as follows: Column Reference / Calculation Column Reference / Calculation
(a) Adapted from Canadian data [27] (g) = (b) x (b) of Table 4-21 (b) = (a) – (c) – (d) – (e) – (f) (h) = (c) x (f) of Table 4-21 (c) = {(a) – (d) – (f)} x 50% for non-organics (i) = (d) x (j) of Table 4-21 (d) = (d) from Table 4-22 + 20% (j) = (e) x (m) of Table 4-21 (e) = {(a) – (d) – (f)} x 50% for organics (k) = (f) x (o) of Table 4-21 (f) = (f) from Table 4-22 + 20% (h) = Sum of (g) through (h)
4-48
WA
STE AN
D R
ECO
VER
AB
LE PRO
DU
CT M
AN
AG
EMEN
T: SU
STAIN
AB
ILITY, PO
LICY
AN
D G
HG
EMISSIO
NS – C
AN
AD
A C
HA
PTER 4: G
REEN
HO
USE G
AS EM
ISSION
S FRO
MW
ASTE-R
ELATED
MA
NA
GEM
ENT – C
AN
AD
A
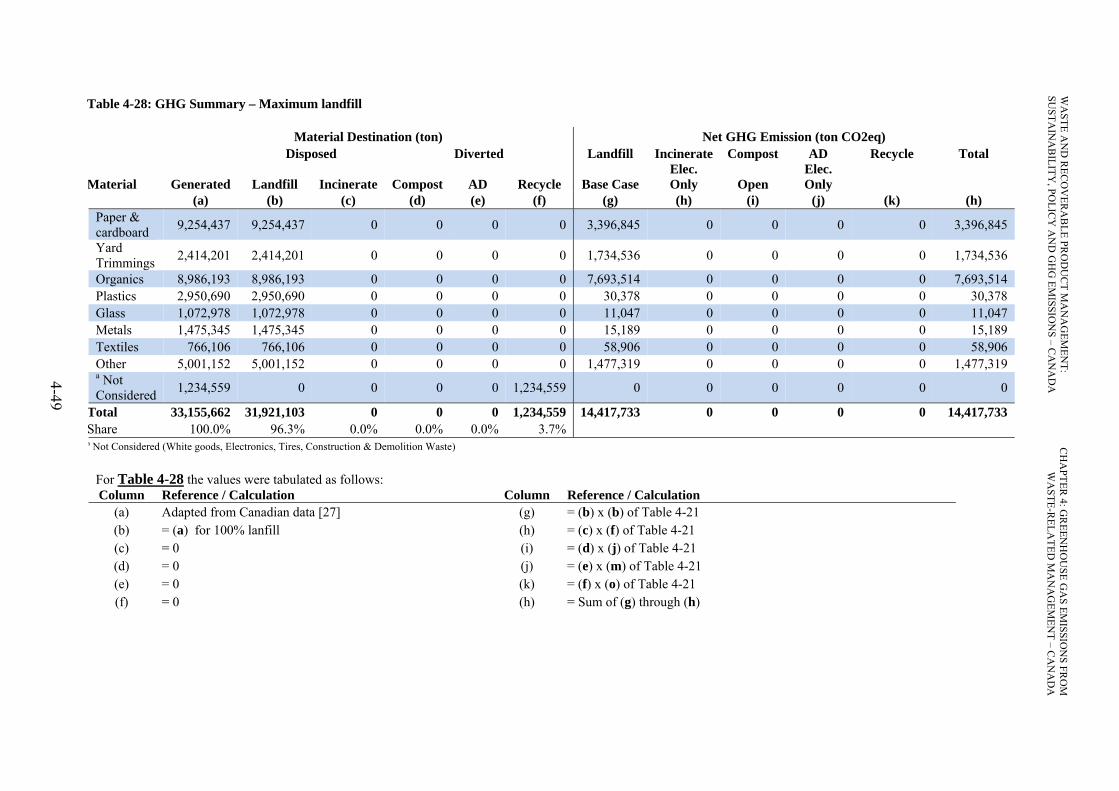
Table 4-28: GHG Summary – Maximum landfill
Material Destination (ton) Net GHG Emission (ton CO2eq) Disposed Diverted Landfill Incinerate Compost AD Recycle Total
Material Generated Landfill Incinerate Compost AD Recycle Base Case Elec. Only Open
Elec. Only
(a) (b) (c) (d) (e) (f) (g) (h) (i) (j) (k) (h) Paper & cardboard 9,254,437 9,254,437 0 0 0 0 3,396,845 0 0 0 0 3,396,845
Yard Trimmings 2,414,201 2,414,201 0 0 0 0 1,734,536 0 0 0 0 1,734,536
Organics 8,986,193 8,986,193 0 0 0 0 7,693,514 0 0 0 0 7,693,514 Plastics 2,950,690 2,950,690 0 0 0 0 30,378 0 0 0 0 30,378 Glass 1,072,978 1,072,978 0 0 0 0 11,047 0 0 0 0 11,047 Metals 1,475,345 1,475,345 0 0 0 0 15,189 0 0 0 0 15,189 Textiles 766,106 766,106 0 0 0 0 58,906 0 0 0 0 58,906 Other 5,001,152 5,001,152 0 0 0 0 1,477,319 0 0 0 0 1,477,319 a Not Considered 1,234,559 0 0 0 0 1,234,559 0 0 0 0 0 0
Total 33,155,662 31,921,103 0 0 0 1,234,559 14,417,733 0 0 0 0 14,417,733 Share 100.0% 96.3% 0.0% 0.0% 0.0% 3.7% a Not Considered (White goods, Electronics, Tires, Construction & Demolition Waste)
For Table 4-28 the values were tabulated as follows: Column Reference / Calculation Column Reference / Calculation
(a) Adapted from Canadian data [27] (g) = (b) x (b) of Table 4-21 (b) = (a) for 100% lanfill (h) = (c) x (f) of Table 4-21 (c) = 0 (i) = (d) x (j) of Table 4-21 (d) = 0 (j) = (e) x (m) of Table 4-21 (e) = 0 (k) = (f) x (o) of Table 4-21 (f) = 0 (h) = Sum of (g) through (h)
4-49
WA
STE AN
D R
ECO
VER
AB
LE PRO
DU
CT M
AN
AG
EMEN
T: SU
STAIN
AB
ILITY, PO
LICY
AN
D G
HG
EMISSIO
NS – C
AN
AD
A C
HA
PTER 4: G
REEN
HO
USE G
AS EM
ISSION
S FRO
MW
ASTE-R
ELATED
MA
NA
GEM
ENT – C
AN
AD
A
THE ANALYSYS OF THE POTENTIAL OF MATERIAL AND ENERGY RECOVERY OF MUNICIPAL WASTE IN CANADA
CHAPTER 4: GREENHOUSE GAS EMISSIONS FROMWASTE-RELATED MANAGEMENT
4–50
4.5 Results & Conclusions
The scenarios described above clearly show that the current Canadian waste-related
management has a significant positive effect on the GHG emissions produced. The results
also show that incineration alone in not the best alternative. Although better than the current
predominately landfill scenario, incineration still generates greenhouse gases and has a net
positive GHG flux.
Recycling is an important part of a sustainable waste-related management scenario. The
negative effect it has on GHG cannot be ignored. However, with recycling there will always
be a portion of unusable material, which in the case of the Optimized scenario, shows that
there is still a value to WRPtE in a sustainable waste-related management program. The
results for all seven scenarios are summarised in Table 4-29.
Table 4-29: Summary of GHG flux for four scenarios
Scenario
Generated Base Case
Divert +20%,
WRPtE 50%
Max Diversion
Max WRPtE Optimised
Divert x2
WRPtE x2
Max Landfill
Material (ktons) (ktons of CO2eq, based on 2004 data) Paper / cardboard 9,612 1,073 -701 -2,266 -1,540 -2,760 -1,250 3,397
Yard Waste 2,507 1,677 709 -125 -316 -316 1,620 1,735 Organics 9,333 6,016 2,512 -271 -1,073 -1,073 4,339 7,694 Plastics 3,065 -384 1,735 -7,844 5,175 -7,330 -797 30 Glass 1,114 -37 -41 -105 11 -105 -84 11
Metals 1,532 -2,088 -2,651 -2,997 -1,256 -2,997 -4,191 15
Textiles 796 69 232 -2,187 406 -2,152 80 59 Other 5,194 1,411 1,137 1,477 891 891 1,345 1,477 Not Considereda 1,235 0 0 0 0 0 0 0
Total 34,389 7,740 2,934 -14,318 2,298 -15,841 1,061 14,418 a (White goods, Electronics, Tires, Construction & Demolition Waste)
It is important to remember that the estimated emissions for these scenarios do not consider
any other benefits or drawbacks relating to the environment. This information should be used
in conjunction with the analysis done in the previous chapters, and most importantly the
hierarchy of sustainable waste-related management must be observed.

THE ANALYSYS OF THE POTENTIAL OF MATERIAL AND ENERGY RECOVERY OF MUNICIPAL WASTE IN CANADA
CHAPTER 4: GREENHOUSE GAS EMISSIONS FROMWASTE-RELATED MANAGEMENT
4–51
In summary, the following major conclusions can be drawn from this process:
1. Each material in MW&RP is best suited for a specific process and no process is
optimised for unsorted MW&RP.
2. In order to achieve any positive results, waste-related products need to be sorted;
either at the source or at central facilities.
3. Recycling is by far the favoured solution for paper, metals, plastics, glass and textiles
due to the significant materials and energy required during the extraction and
production of new things.
4. Organics and yard waste are better suited for composting and in some cases are
suitable for energy conversion via anaerobic digestion.
5. There will always be the need for disposal, either from attrition (degradation in
quality of materials as they are recycled) and ash or residue from WRPtE processes.
But these amounts are small and WRPtE is always a good first step instead of landfill.
In summary, the model developed in this chapter has allowed the greenhouse gasses
associated with the waste-related industry to be quantified over the 100 year time horizon. By
analysing each process and its components the bigger picture of the waste-related
management activities can be considered. Furthermore, the overall benefits of one process
over another are abundantly clear. The results obtained give credence to the conclusions of
the previous chapters and the importance of a SIWRM hierarchy.
Although many qualified assumptions were made in order to account for the regional
uncertainty of the data, the results are still credible and allow for future adjustments to be
made as information comes available. As well, comparable results from other reports were
used to substantiate the methods used in this model.

THE ANALYSYS OF THE POTENTIAL OF MATERIAL AND ENERGY RECOVERY OF MUNICIPAL WASTE IN CANADA
CHAPTER 5: CONCLUSIONS ANDRECOMMENDATIONS
5-1
CHAPTER 5: CONCLUSIONS AND RECOMMENDATIONS
5.1 Overview
Throughout this paper it has become clear that traditional waste-related management
practices are no longer sufficient to meet the needs of today or future generations. A proper
integrated and sustainable approach is required, which has the ability to include all waste-
related products. At the outset, even the current use of the word waste should be revisited
since it has the tendency to imply that a product is no longer useful. The word waste is often
used to describe something that is no longer useful to the user or owner, but in most cases it is
still useful to others and so labelling it waste in the first place is erroneous. Going one step
further it has even been proposed that classifying a material waste can actually hinder
sustainable waste-related practices.
Waste-related products are no longer what they used to be. Pre-industrial revolution, waste
was in fact products that no longer had any use and were generally organic. Since humanity
has been able to produce more than it needs, our waste has also changed to include non-
biodegradable components such as metals, plastics, glass, textiles, etc. So it is only logical
that the way we deal with and refer to waste changes.
Unfortunately, our wasteful habits (generation and disposal) have gone unchecked for quite
some time. The prime movers in the waste-related industry have been financial and political.
Recycling and other so called environmentally sound practices have been implemented to
help reduce the load on landfills and avoid building more, further from urban centers.
However we are now at a crossroad, where the environmental impacts of our traditional
waste-related management approach must be considered.
The sustainable and integrated waste-related management approach not only respects the
environment, but also attempts to include all aspects of these activities and stakeholders, in an
effort to minimise generation and disposal of waste-related products and maximise recovery
and re-use. Ultimately the quantity of waste-related products going for disposal is an
indicator of inefficiencies in a society. SIWRM improves the efficiency of waste related
management and must be an integral part of any sustainable effort.
The updated SIWRM hierarchy attempts to discourage disposal by revealing that waste &
recoverable products going for disposal are wasted resources. Of primary importance in this
hierarchy is prevention and minimisation of waste & recoverable products: reduction of
THE ANALYSYS OF THE POTENTIAL OF MATERIAL AND ENERGY RECOVERY OF MUNICIPAL WASTE IN CANADA
CHAPTER 5: CONCLUSIONS ANDRECOMMENDATIONS
5-2
demand for new products, promotion of durable products, prevention of wasteful product
generation, and minimisation of what is ultimately discarded. Importantly, these principles
need to be applied at the appropriate levels of government, through public education, national
initiatives, and participation of industry with incentives to promote the right behaviours.
Once we minimise the quantity of waste-related products that are no longer useful, the
balance must then be either sent for disposal or diverted, the preferred option. Diversion is
beneficial since it ensures that a product will be employed in another useful purpose, as
opposed to being thrown in the trash. However, in most cases additional energy and resources
may be required to transport, transform and/or re-package a diverted product. This is why re-
using products in their current state is the preferred diversion method. The next best option is
to process products into raw material so they can be recycled into new products. This still
avoids a large amount of energy and resources required for the extraction and processing of
raw materials and hence is still favourable compared to disposal.
Not all waste-related products can be prevented and/or minimised. Some organics, such as a
paper and wood can be re-used or recycled, but others such as food scraps and yard waste
need to be dealt with. These items, which are considered carbon neutral, should never go to
landfills. Instead they should be diverted from the waste stream and composted. Even better,
some very simple technologies exist to recover methane from the decomposition of organics
which can offset emissions from other energy producers. It can be argued that composting or
anaerobic digestion are disposal methods, but in reality they both can be considered re-use or
recycling processes. In composting, the organic carbon is oxidised and returns to the
atmosphere as CO2 to continue the photosynthesis process for the growth of other plants. In
AD, the methane generated is captured to produce useful energy. In both cases nutritious
fertilisers are created. Therefore, diverting organics from disposal is considered as re-use and
recycling.
In any event, almost all products that are no longer useful to the original owner can be
diverted from disposal.
Even with optimal prevention, minimisation and diversion there will always be some disposal
to deal with. Although undesirable the reality is that some products, due to attrition, will
eventually require disposal. Modern habits necessitate disposal methods for now and the
foreseeable future, until we can fully implement SIWRM systems. Some disposal methods

THE ANALYSYS OF THE POTENTIAL OF MATERIAL AND ENERGY RECOVERY OF MUNICIPAL WASTE IN CANADA
CHAPTER 5: CONCLUSIONS ANDRECOMMENDATIONS
5-3
are better than others and wherever energy can be recovered, the waste can be considered a
resource. Landfills are always a last resort.
Converting waste-related products to energy requires many considerations. There are many
different technologies which are best suited for different types of products. It is important to
match each waste-related product with an appropriate technology, depending on input (paper,
plastic, organics, etc.) and desired output (gas, electricity, heat, etc.). Typically, the WRPtE
can be separated into two categories: biochemical and thermal.
Biochemical WRPtE, such as anaerobic digestion, is fairly passive and has few
environmental side effects. It uses the natural decomposition action of organic carbon to
generate energy. Organic material is allowed to decompose under an oxygen starved and
controlled environment to increase methane output and speed up decomposition. Although
additional energy is required to collect, transport and process organics in AD facilities, it has
its merits over composting, depending on the application.
Thermal WRPtE has the potential to create more environmental side effects since high
temperatures are required to transform the waste-related products. Most of the environmental
concerns relate to the potentially harmful emissions and toxic solid and liquid by-products.
However it has been shown that most of these effects can be mitigated using modern flue
cleaning and combustion technologies, such as plasma gasification. Furthermore any energy
generated from WRPtE facilities, offsets emissions from power generating plants and
consequently reduces the generated emissions. Another advantage of this process is that
waste-related products can be treated close to the source to reduce the volume of the residual
waste and minimise transportation.
Modern landfills are also capable of capturing methane to generate heat and/or electricity.
But this assumes that organics have been sent to landfills, and in any waste-related
management system this should never happen. Furthermore, it’s proposed that the estimates
for the recoverable energy are grossly overestimated, making this disposal method
unfavourable. Regardless, there will always be a need for the disposal of residual wastes.
Even the most efficient SIWRM system, will generate a portion of waste that is no longer
useful due to attrition and by-products from thermal processing. In general however, these
products should be inert and should have gone through a full and useful life. Landfills,
although undesirable in the modern context, must be part of any SIWRM scheme.

THE ANALYSYS OF THE POTENTIAL OF MATERIAL AND ENERGY RECOVERY OF MUNICIPAL WASTE IN CANADA
CHAPTER 5: CONCLUSIONS ANDRECOMMENDATIONS
5-4
Integral to any SIWRM strategy is the greenhouse gas effect of the various processes. Within
this context, the benefits and drawbacks of each activity becomes even clearer. Without a
doubt recycling is the best alternative for metals, plastics, glass, textiles and sometimes paper
& cardboard. Organics, yard trimmings, paper & cardboard are suitable for energy recycling.
The unknown balance classified as ‘other’ can be incinerated for energy recovery and to
minimise the volume.
The point remains however, that each waste-related product is better suited for one process
over another and consequently sorting is a pre-requisite. Sorting allows for the right products
to go to the right process in order to minimise our requirements for new resources and
energy.
In Canada, the current W&RP management structure (federal, provincial/territorial, regional)
is quite good in adapting to local economies and requirements. But a unified Canadian
strategy is desperately needed. The provinces/territories are doing the best they can to treat
W&RP in an environmentally, socially, economically and politically sound manner.
However, they have no goals or targets to achieve other than the ones they set for themselves.
This is why the figures on this topic vary so greatly from coast to coast.
The federal government’s current involvement is too weak. Environment Canada has put
together its Waste Prevention Program, a good start but it lacks benchmarks and targets. The
program is more of a tool than a statement of unified objectives. The CCME, although doing
some positive things for the environment, has not focussed on the topic of waste-related
products and management. The National Packaging Protocol was a success, but where are we
now? What is the next step?
The federal government needs to step up, set minimum standards and goals for the country.
This means adopting the SIWRM hierarchy and putting in place measures and targets for
each component from prevention down to landfill. In addition more funding to encourage
newer technologies should be provided.
The provinces and territories should not be left to fend for themselves. The environment is a
global issue. It is the responsibility of the national leaders to act as one voice for Canada’s
environmental policy and waste & recoverable products must be an integral part of this
policy.
THE ANALYSYS OF THE POTENTIAL OF MATERIAL AND ENERGY RECOVERY OF MUNICIPAL WASTE IN CANADA
CHAPTER 5: CONCLUSIONS ANDRECOMMENDATIONS
5-5
5.2 Conclusions
MW&RP accounts for only a small portion of the total W&RP we generate globally (5% to
26% depending on the country). If 15% is taken as an average, Canadians produced 33.2
million tons of MW&RP and 221.0 million tons of waste-related products, or 1,037 and 6,913
kg/person respectively, and we are generating more each year (13.9% increase from 2002 to
2006). We are amongst the largest generators per capita in the world and are only surpassed
by a few nations such as the USA and Australia.
Based on the Canadian GHG inventory report, the waste-related industry accounts for 3.7%
of the overall emissions generated (from a total of 747 Mton CO2eq). This value is diminished
because of the energy industry in Canada which constitutes 81.5% of all GHG emissions. But
the fact remains that the emissions relating to W&RP are an important consideration in a
sustainability policy and potential cuts in this sector are estimated to be in the same order of
magnitude as those due to energy efficiency.
Using the model developed in Chapter 4, it has been estimated that the net emissions
associated with the Municipal Waste & Recoverable Product industry accounts for 7.7 Mton
CO2eq. This is based on the 2004 data of 33.2 million tons of MW&RP generated which is
comprised of an average diversion rate of 23.7% (composting and recycling), 74.0% sent to
landfill and 2.3% incinerated. This net emissions generated might seem small, but it is
important to remember that MW&RP only accounts for a fraction of the total and some
processes are considered as emission sinks.
Using the estimated GHG emissions calculated for the base case scenario, the comparative
benefits are clear. In the optimised scenario, where every product is sorted and sent to its
optimum process the net emissions could be -15.8 Mt CO2eq. In this scenario 83.0% is
diverted (AD and recycling), 16.2% is incinerated (with electricity recovery) and 0.8% is sent
to landfill (these scenario’s include the ‘Not considered’ category). Not only is the optimised
scenario far better, but it actually contributes as a sink, to offset some of the other emissions
being released to the environment. This is primarily due to the benefits of recycling and
avoided new energy and resources required for the extraction and processing of raw
materials. The net GHG emission for the seven scenarios are summarised in Figure 5-1.
Ultimately, recycling and AD yield the best results, which support all diversion efforts.

THE ANALYSYS OF THE POTENTIAL OF MATERIAL AND ENERGY RECOVERY OF MUNICIPAL WASTE IN CANADA
CHAPTER 5: CONCLUSIONS ANDRECOMMENDATIONS
5-6
Figure 5-1: Comparison of the various scenarios
Figure 5-2: GHG Flux of landfill vs. incineration of unsorted MW&RP
Base Case
Max Landfill
Max Diversio
n
Max WRPtE
Optimised
Diversion x2
WRPtE x2
Diversion +20%, WRPtE
50%Landfill 11.366 14.418 1.829 11 3 8.315 5.589Incineration 131 0 0 5.216 1.449 263 2.871Compost -50 0 -396 0 0 -101 -60AD 0 0 0 -2.929 -1.543 0 -1.017Recycling -3.708 0 -15.750 0 -15.750 -7.416 -4.449Net 7.740 14.418 -14.318 2.298 -15.841 1.061 2.934
7.740 14.418
‐14.318
2.298
‐15.841
1.061
2.934
-20.000
-15.000
-10.000
-5.000
0
5.000
10.000
15.000
20.000G
HG
em
issi
on
(kto
n C
O2
eq)
452
221
93
-262
8
-348-400
-300
-200
-100
0
100
200
300
400
500
Landfill: Base Case
Incineration: Mass Burn
Incineration: Elec. Only
Incineration: CHP
Gasification: Elec. Only
Gasification: CHP
Net
GH
G F
lux
(kg
CO
2eq/
ton)
GHG Flux Landfill vs. Incineration - Unsorted MW&RP

THE ANALYSYS OF THE POTENTIAL OF MATERIAL AND ENERGY RECOVERY OF MUNICIPAL WASTE IN CANADA
CHAPTER 5: CONCLUSIONS ANDRECOMMENDATIONS
5-7
In the scenarios WRPtE is clearly better than landfills, but still has a positive effect on the
GHG flux. However, it is important to remember that the offset energy for the WRPtE
process only considers modest electricity generation efficiency and no heat recovery. This
was done to give a reasonable picture of the current potential for energy recycling.
Figure 5-2 is taken from a previous comparison in Chapter 4. It shows that even the mass
burn of unsorted MW&RP (no energy recovery) produces fewer emissions than a typical
landfill model. Going one step further, newer gasification technologies with CHP energy
recycling can have an appreciable effect as a GHG sink.
Based on the optimised scenario, if all MW&RP were diverted or incinerated based on their
potential, it is estimated that approximately 92.5% of what is generated could be recovered
for useful purposes (85.4% which is composted, AD or recycled and 7.1% incinerated with
electricity generation). Table 5-1 summarises the potential based on 2004 MW&RP statistics.
In this case a 10% attrition rate is assumed for recyclables. If this material can be thermally
converted then it will produce ash, which is estimated at 15% of the initial mass.
Furthermore, 50% of the ash is assumed to the diverted for asphalt. The remainder is residual
waste which requires disposal in landfills. There is no residual waste from organics, since the
by-products can be reused in their entirety for numerous applications.
Table 5-1: Theoretical residual waste
Share c Disposal (%) Diverted (%)
Material (%) Diversion/Disposal Method Landfill IncinerateAD /
Compost RecyclePaper & Cardboard 29 90% recycling, 10% AD 0.0 0.0 2.9 26.1Yard Trimmings 8 100% AD 0.0 0.0 7.6 0.0Organics 28 100% AD 0.0 0.0 28.2 0.0Plastics 9 90% recycle, 10% WRPtE 0.0 0.9 0.0 8.3Glass 3 90% recycle, 10% landfill 0.3 0.0 0.0 3.0Metals a 5 90% recycle, 10% landfill 0.5 0.0 0.0 4.2Textiles 2 90% recycle, 10% WRPtE 0.0 0.2 0.0 2.2Other b 16 15% recycle (misc. non-comb.),
46% WRPtE (misc. comb.), 38% landfill (fines)
6.0 7.2 0.0 2.4
Direct Total 100 6.8 8.4 38.6 46.2Ash from WRPtE 15% of Initial mass -1.3 50% recycle, 50% landfill 0.6 0.6
Total 7.5 7.1 38.6 46.8 Disposal 14.6% Diverted 85.4% 33.2 million tons, 2004 4.8 Mt 28.3 Mt
a Metals are comprised of 4% ferrous and 1% non-ferrous metals. Information based on [58]. b Other is assumed to be 7% misc. combustibles, 2% misc. non-combustibles and 6% fines (dust). Information based on [58]. c The Share, excludes the ‘Not Considered’ category discussed earlier and used in the previous figure.

THE ANALYSYS OF THE POTENTIAL OF MATERIAL AND ENERGY RECOVERY OF MUNICIPAL WASTE IN CANADA
CHAPTER 5: CONCLUSIONS ANDRECOMMENDATIONS
5-8
Of course the ability to recover 92.5% of all MW&RP generated might be a non-realistic
scenario, but considering only 26.0% is currently being recovered, there is room for
improvement.
In summary, the Canadian waste-related policy leaves much to be desired. Considering that:
1. Each Canadian generates about 1ton of MW&RP per year, amongst the highest in the
world
2. Canadians divert and energy recycle far less than other countries
3. Even with Canada’s large amount of land, approximately 3 million tonnes of non-
hazardous W&RP generated in Canada is exported to the United Sates
4. On average, Canada recovers 26.0% of all MW&RP going to landfill, with a
potential of 92.5%
5. The waste-related management industry in Canada, if managed properly, could be a
GHG sink, but instead contributes 3.7% of the Canadian GHG emissions
6. WRPtE is generally non-existent and new policies might incent developers to build
landfills instead of energy recycling facilities.
In has been shown throughout this paper that waste-related management is a complex topic
which requires leadership, partnership and analysis in a modern context. In Canada there
appears to be no clear direction in terms of common national policy, initiatives, targets or
incentives. The regions are doing the best they can to satisfy their constituents, but do not
have the bigger picture of a truly sustainable & integrated waste-related management
strategy. The following section offers some recommendations on how Canada can work
towards a sustainable future.
5.3 Recommendations for Canada
Canada has a lot of potential and room for improvement in its waste-related management
strategies. Some major changes and strong leadership would be required to motivate the
public towards a sustainable future, starting with a national strategy regarding the
environment. Integral to this strategy should be improvements to the current waste-related
management initiatives. The following are suggested improvements based on the analysis in
this paper.
The major improvements required are fairly simple; Accountability and Cooperation. All
levels of government, manufacturers, large industry, and consumers all need to get involved
THE ANALYSYS OF THE POTENTIAL OF MATERIAL AND ENERGY RECOVERY OF MUNICIPAL WASTE IN CANADA
CHAPTER 5: CONCLUSIONS ANDRECOMMENDATIONS
5-9
and do their part. A major paradigm shift is required to change the way waste is perceived,
what is consumed, what is generated and what effect it has on the environment. Individuals,
corporations, and governments also need to be responsible for their actions. The first step is
education about the full consequences of our consumer lifestyles. Once we are all on the
same page, then it’s time to change our habits.
For that to happen however, leadership is required to promote and support a common goal we
can all be proud of working towards…together. The following is a list of changes or
recommendations which are integral to a SIWRM strategy. These initiatives are summarised
by level of government in Table 5-2.
Some of the elements that should be further investigated to improve the Canadian waste-
related management policies are;
• Redefining waste and Sustainable & Integrated Waste-related Management
• Intergovernmental cooperation
• Public education, changing lifestyle, reducing consumption
• Banning of export/import, if waste is a local problem, it should be treated locally
• Extended producer responsibility, manufacturer pays for LCA of his products
• Life-cycle costing of products reflected on labels
• Produce durable, repairable and reusable products
• User-pay systems to tax and charge lifestyle not income. Canadians receive few price
signals about the W&RP they produce [41]
• Diversion targets and recycled content
• Minimum WRPtE requirements
• Maintain and increase funding for R&D on Canadian Technologies
• Improve measuring, reporting and monitoring. Canada holds an excellent record in
measuring, reporting and monitoring energy efficiency [136]. But clearly this is not
true for W&RP since it was previously seen that some interprovincial import/exports
are not all accounted for
• Develop recovery programs for various items (e.g. used tires, paints, electronics
batteries, other hazardous materials, etc.)

Table 5-2: Responsibility of the various governments in W&RP
Method Role & Responsibility
Federal Provincial/Territorial Regional Minimization/Prevention
• Accountability • Reduce consumption • Public Education • Promote durable and reusable
products • Lead a simpler lifestyle • Extended producer
responsibility • Use recyclables in new products • Life-cycle costing of materials
• Publish guides to clean living • Ban import/export of ‘waste’ • Set-up minimum standards for quality of
products (e.g. warranties) and quantity of recyclables used in all products sold
• Make producers assume the diversion and disposal cost of their products
• Enforce LCA labels on all products sold in Canada
• Tax and charge lifestyle, not income
• Promote clean living/LCA awareness
• Ban import/export of ‘waste’ • Enforce manufacturers and
industry to include waste disposal in cost of products.
• Give incentives for use of recyclable materials.
• Tax and charge lifestyle, not income
• Avoid transporting ‘waste’ away, dispose close to source.
• Instate user-pay fees (charge for waste disposal)
Diversion
• Reuse products • Divert organics for energy
recycling • Divert organics for composting • Recycle non-reusable materials
• Set minimum diversion goals for the country
• Invest in biochemical WRPtE technologies
• Promote durable products • Create a recycling market by enforcing
minimum recycled content in goods
• Enforce and develop diversion strategies
• Invest in biochemical WRPtE technologies
• Develop composting infrastructure
• Participate in promoting re-use (urban flea markets)
• Develop WRPtE and composting infrastructure
• User-pay fees and/or fines for not recycling
• Source separation
Disposal
• Promote WRPtE (energy
recycling) • Disposal close to the source • Landfill as a last resort
• Set minimum energy recycling targets • Set minimum environmental standards • Invest in WRPtE technologies • Research and promote ‘clean’ WRPtE • Promote engineer landfills
• Enforce and develop energy recycling strategies
• Invest in WRPtE technologies • Set & enforce minimum
environmental standards
• Keep disposal close to the source
• Educate public on WRPtE • Investigate combining waste
streams
5–10
WA
STE AN
D R
ECO
VER
AB
LE PRO
DU
CT M
AN
AG
EMEN
T: SU
STAIN
AB
ILITY, PO
LICY
AN
D G
HG
EMISSIO
NS – C
AN
AD
A C
HA
PTER 5: C
ON
CLU
SION
S AN
DR
ECO
MM
END
ATIO
NS

THE ANALYSYS OF THE POTENTIAL OF MATERIAL AND ENERGY RECOVERY OF MUNICIPAL WASTE IN CANADA
LITERATURE & REFERENCES
I
LITERATURE & REFERENCES
1 J. Pitchel, Waste management practices: municipal, hazardous, and industrial, CRC Press, Boca Raton, 2005.
2 World Mapper, Waste Collected Map No. 307. <URL: http://www.worldmapper.org> [last accessed: March 2, 2010]
3 EEA, Europe’s environment: the third assessment, EEA, Copenhagen, 2003.
4 EEA, Indicator Fact Sheet Signals 2001– Chapter Waste, EEA, Copenhagen, 2003.
5 Kaiser Family Foundation, Global Health Facts, Urban population. <URL: http://www.globalhealthfacts.org> [last accessed: March 2, 2010].
6 J. L. Price, J. B. Joseph, Demand Management – A Basis for Waste Policy: A Critical Review of the Applicability of the Waste Hierarchy in Terms of Achieving Sustainable Waste Management, Sustainable Development, 2000, vol. 8, pages from 96 to 105, October 1999.
7 UN, Environmental Indicators – Municipal Waste Collection. <URL: http://unstats.un.org > [last accessed: March 2, 2010].
8 WASTEC, Municipal Solid Waste: Background. <URL: http://www.environmentalistseveryday.org> [last accessed: March 2, 2010]
9 Environment Alberta, Waste Facts. <URL: http://environment.alberta.ca/> [last accessed: March 2, 2010].
10 Statistics Canada, Human Activity and the Environment: Annual Statistics 2005., Minister of Statistics Canada, 2005.
11 USA EPA, Municipal Solid Waste Generation,Recycling, and Disposal in the United States: Facts and Figures for 2006. <URL: http://www.epa.gov > [last accessed: March 2, 2010].
12 European Commission, Europe in figures: Eurostat yearbook 2006-07, Office for Official Publications of the European Communities, Luxembourg, 2007.
13 Environment Canada, Overview of Municipal Solid Waste (MSW) Management in Canada. <URL: http://www.ec.gc.ca/wmd-dgd/> [last accessed: March 16, 2008].
14 OECD, Working Group on Waste Prevention and Recycling: Towards waste prevention performance indicators. (2004)1-final. < http://www.olis.oecd.org >. [last accessed: 3 March, 2010]
15 R. U. Ayres, Technology and Environment: Industrial metabolism, National Academy Press, Washington, DC., 1989
16 P. Hawken, A.B. Lovins, L.H. Lovins, Natural Capitalism: Creating the Next Industrial Revolution. Little Brown, Boston, 1999, p. 416.
17 J.K. Seadon, Integrated waste management – Looking beyond the solid waste horizon, Waste Management 2006, vol. 26 issue 12, pages 1327 to 1336.
18 C.G. Hempel, Philosophy of Natural Science, Prentice Hall, Upper Saddle River, NJ, 1966, pages 85 to 89.
19 J. Martin, J.J. Odell, Object-Oriented Methods: a Foundation. PTR Prentice Hall, Englewood Cliffs, NJ, 1995, pages 11 to 21.
THE ANALYSYS OF THE POTENTIAL OF MATERIAL AND ENERGY RECOVERY OF MUNICIPAL WASTE IN CANADA
LITERATURE & REFERENCES
II
20 L. Bontoux, F. Leon, The legal definition of waste and its impact on waste management in Europe, Office for Official Publications of the European Communities, Luxembourg, 1997.
21 Basel Convention, Basel Convention on the Control of Transboundary Movements of Hazardous Wastes and Their Disposal. < http://www.basel.int/index.html>. [last accessed: 3 March, 2010]
22 Environment Canada, Waste Management Municipal Solid Waste (MSW). <URL: http://www.ec.gc.ca/wmd-dgd/> [last accessed: March 3, 2010].
23 European Union Law, Directive 2006/12/EC of the European Parliament and of the Council, <URL: http://eur-lex.europa.eu> [last accessed: March 3, 2010].
24 Environment Canada, CEPA: Development of Regulatory Options for the Export and Import of Prescribed Non-Hazardous Wastes Destined for Final Disposal, <URL: http:// www.ec.gc.ca> [last accessed: March 3, 2010].
25 E. Pongrácz, V.J. Pohjola, Re-defining waste, the concept of ownership and the role of waste management., Resources, Conservation and Recycling, 2004, vol. 40 issue 2, pages 141 to 153, January 2004.
26 S. Sakai, S.E. Sawell, A.J. Chandker, T.T. Eighmy, D.S. Kosson, J. Vehlow, H.A. van der Sloot, J. Harlen, O, Hjelmar., World Trends in Municipal Solid Waste Management., Waste Management, 1996, vol. 16 issues 5-6, Pages 341 to 350.
27 Statistics Canada, Waste Management Industry Survey: Business and Government Sectors 2004., Minister of Statistics Canada, 2007.
28 Nation Master, Environment Statistics – Municipal waste generation (most recent) by country., <URL: http://www.nationmaster.com> [last accessed: March 3, 2010].
29 Waste Online, History of waste and recycling information sheet., <URL: http://www.wasteonline.org.uk > [last accessed: March 3, 2010].
30 D.T. Brown, What is Sustainable Integrated Waste Management?, <URL: http://www.brocku.ca > [last accessed: March 3, 2010].
31 Commission of the European Communities, Communication from the Commission to the Council and to Parliament: A community Strategy for Waste Management, SEC (89) 934 final., EU Communities, Brussels, 1989.
32 CCME, National Packaging Protocol – Final Report (2000)., <URL: http://www.ccme.ca> [last accessed: March 3, 2010].
33 Saskatchewan Waste Reduction Council, Paper Recycling Presents Challenges., <URL: http://www.saskwastereduction.ca> [last accessed: March 3, 2010].
34 ACCRR, Waste and Resources – Europe and Waste., <URL: http://resourcities.acrplus.org> [last accessed: March 3, 2010].
35 International Solid Waste Association, Technical Policy 1 - Integrated Waste Management. <URL: https://www.iswa.org> [last accessed: March 3, 2010].
36 J. Korhonen, L. Okkonen, V. Niutanen, Industrial ecosystems indicators – direct and indirect effects of integrated waste and by-product management and energy production. Clean Technologies and Environmental Policy, 2004, vol. 6 issue 3, pages 162 to 173.

THE ANALYSYS OF THE POTENTIAL OF MATERIAL AND ENERGY RECOVERY OF MUNICIPAL WASTE IN CANADA
LITERATURE & REFERENCES
III
37 New Zealand Ministry for the Environment, The New Zealand Waste Strategy. Ministry for the Environment, Wellington, New Zealand, 2002.
38 L. Skyttner, General Systems Theory–An Introduction., MacMillan Press, 1996, Great Britain.
39 V. Belgiorno, G. De Feo, C. Della Rocca, R.M.A. Napoli, Energy from gasification of solid wastes., Waste Management, 2003, vol. 23 issues 1, Pages 1 to 15.
40 G. Monbiot, Heat: How to Stop the Planet from Burning, Anchor Canada, 2007
41 M. Kelleher, J. Robins, J. Dixie, Taking Out the Trash: How To Allocate the Costs Fairly, C.D. Howe Institute Commentary, July 2005, No. 213.
42 Enviros RIS International Ltd. Waste Diversion Impacts of Bag Limits and PAYT Systems in North America (April 2001). <URL: http://www.wdo.ca> [last accessed: March 3, 2010].
43 A. Smith, K. Brown, S. Ogilvie, K. Rushton and J. Bates for the European Commission, Waste Management Options and Climate Change., Office for Official Publications of the European Communities, Luxembourg, 2001.
44 A. Knox for the Ontario Environmental Industry Association, An Overview of Incineration and EFW Technology as Applied to the Management of Municipal Solid Waste (MSW). (February 2005). <URL: http://www.oneia.ca> [last accessed: March 3, 2010].
45 A. Nag, K. Vizayakumar, Environmental Education and Solid Waste Management., New Age International, New Delhi, 2005.
46 Greenpeace, Incineration., <URL: http://www.greenpeace.org> [last accessed: March 3, 2010].
47 F. McDougall, P. White, M. Franke, P. Hindle, Integrated Solid Waste Management: a Life Cycle Inventory - second edition., Blackwell Science, Oxford, 2001.
48 Eunomia for Friends of the Earth, A changing climate for energy from waste: final report for Friends of the Earth (2006)., <URL: http://www.foe.co.uk > [last accessed: March 3, 2010].
49 German Federal Ministry for the Environment, Nature Conservation and Nuclear Safety, Waste Incineration – A Potential Danger? (2005)., <URL: http://www.bmu.de > [last accessed: March 3, 2010].
50 German Federal Ministry for the Environment, Nature Conservation and Nuclear Safety, The contribution of waste management to sustainable development in Germany - Section on municipal waste., <URL: http://www.bmu.de > [last accessed: March 3, 2010].
51 Bath and North East Somerset Council, Council meeting of 14 October, 1999, B&NES Waste Strategy – Energy From Waste Incineration. , <URL: https://www.bathnes.gov.uk > [last accessed: March 3, 2010].
52 S.M. Al-Salem, P. Lettieri, J. Baeyens, Recycling and recovery routes of plastic solid waste (PSW): A review., Waste Management, 2009, vol. 29, pages 2625–2643.
53 A. Porteous, LCA Study of Municipal Solid Waste Components. Report prepared for Energy Technology, Support Unit (ETSU), Harwell, Oxfordshire, July 1992.

THE ANALYSYS OF THE POTENTIAL OF MATERIAL AND ENERGY RECOVERY OF MUNICIPAL WASTE IN CANADA
LITERATURE & REFERENCES
IV
54 P. McKendry, Energy production from biomass (part 1): overview of biomass. Bioresource Technology 2002, vol. 83 issue 1, pages 37 to 46.
55 Ontario Ministry of the Environment, Ontario’s 60% Waste Diversion Goal - A Discussion Paper., Queen’s Printer for Ontario, 2004.
56 P. Baggio, M. Baratieri, A. Gasparella, G.A. Longo, Energy and environmental analysis of an innovative system based on municipal solid watse pyrolysis and combined cycle, Applied Thermal Engineering, 2008, vol. 28 issue 1, pages 136 to 144.
57 P. De Filippis, C. Borgianni, M. Paolucci, F. Pochetti, Prediction of syngas quality for two-stage gasification of selected waste feedstocks, Waste Management, 2004, vol. 24 issue 6, pages 633 to 639.
58 OECD 1999, OECD Environmental Data 1999, Chapter 7, Waste.
59 S.J. Burnley, The use of Chemical composition data in waste management planning – A case Study., Waste Management, 2007, vol.27 issue 3, pages 327 to 336.
60 Wikipedia, Municipal solid waste., <URL: http://en.wikipedia.org> [last accessed: March 3, 2010].
61 Wikipedia, Composting., <URL: http://en.wikipedia.org> [last accessed: March 3, 2010].
62 Mother Earth News, July/August 1981, DIY Water Heating with Compost., <URL: http://www.motherearthnews.com> [last accessed: March 3, 2010].
63 P. McKendry, Energy production from biomass (part 2): conversion technologies., Bioresource Technology, 2002, vol. 83 issue 1, pages 47 to 54.
64 G. Boyle, Renewable Energy: Power for a Sustainable Future., Oxford University Press, 1996.
65 J. Coombs, Bioconversion Assessment Study. CPL Scientific Ltd, 1999, UK (Air-CT92-8007).
66 M.R. Beychok, A data Base of Dioxins and Furan Emissions from Municipal Refuse Incinerators., Atmospheric Environment, 1987, vol. 21 no.1, pages 29 to 36.
67 Canadian Council of Ministers of the Environment, Dioxins and Furans CWS Development Committee, Status of Activities Related to Dioxins and Furans Canada-Wide Standards (October 2004)., <URL: www.ccme.ca> [last accessed: March 3, 2010].
68 H.W. Rogers, Incinerator Air Emissions: Inhalation Exposure Perspectives., Environmental Health, 1995, vol. 58.
69 US EPA, Evaluation of Emissions from the Burning of Household Waste in Barrels., US EPA, November 1997.
70 UK Environment Agency 2000, briefing note from the APSWG (Associate Parliamentary Sustainable Waste Group) by Neil Carrigan and Prof. Chris Coggins
71 UK Parliament, Incineration of Household Waste., Post 149, December 2000, London.

THE ANALYSYS OF THE POTENTIAL OF MATERIAL AND ENERGY RECOVERY OF MUNICIPAL WASTE IN CANADA
LITERATURE & REFERENCES
V
72 A. Porteous, Why energy from waste incineration is an essential component of environmentally responsible waste management., Waste Management, 2005, vol. 25 issue 4, pages 451 to 459
73 S. Consonni, M. Giugliano, M. Grosso, Alternative strategies for energy recovery from MSW - Part B-Emission and cost estimates., Waste Management, 2005, vol. 25 issue 2, pages 137 to 148.
74 Wikipedia, Incineration., <URL: http://en.wikipedia.org> [last accessed: March 3, 2010].
75 D. Schneider, Sustainable Power Generation – Gasification and Waste incineration., University of Zagreb – FSB, December 2005. Class notes.
76 Ontario Minister of Environment, GUIDELINE A-7: Combustion and Air Pollution Control Requirements for New Municipal Waste Incinerators., <URL: http://www.ene.gov.on.ca> [last accessed: March 3, 2010].
77 P. McKendry, Energy production from biomass (part 3): gasification technologies., Bioresource Technology, 2002, vol. 83 issue 1, pages 55 to 63
78 C. Della Rocca, I processi e le tecnologie di gassificazione delle biomasse e dei rifiuti solidi., Civil Engineering Degree Thesis, Universita` degli Studi di Salerno, 2001.
79 Juniper Consultancy Services Ltd., Pyrolysis & Gasification of Waste. A Worldwide Technology & Business Review., Juniper, 2000.
80 Wikipedia, Gasification., <URL: http://en.wikipedia.org> [last accessed: March 3, 2010].
81 A.V. Bridgwater, Catalysis in thermal biomass conversion. Applied Catalysis A: General, 1994, vol. 116 issue 1-2, pages 5 to 47.
82 Global Alliance for Incinrators Alternatives, Incinerators in Disguise., <URL: http://www.no-burn.org> [last accessed: March 16, 2008].
83 K. Moustakas et al., Demonstration plasma gasification/vitrification system for effective hazardous waste treatment., Journal of hazardous Materials, 2005 vol. 123 issue 1-3, pages 120-126.
84 Bert Lemmens et al., Assessment of plasma gasification of high caloric waste streams., Waste Management, 2007, vol. 27 issue 11, pages 1562 to 1569.
85 B. Calaminus, R. Stahlberg, Continuous in-line gasification/vitrification process for thermal waste treatment: process technology and current status of projects.’ Waste management, 1998, vol. 18 issues 6-8, pages 547–556.
86 Plasco Energy Group, <URL: http://www.plascoenergygroup.com/> [last accessed: March 3, 2010].
87 Y.J. Park, J. Heo, Vitrification of fly-ash from municipal solid waste incinerator, Journal of Hazardous Materials, 2002, vol. 91 issues 1-3, pages 83 to 93.
88 W.D. Monnery, C.F. Nikiforuk, Economic Sulphur Recovery in the 0.1 to 20t/d Range, Proceedings Sulphur 2003, Banff, Alberta.
89 C. Cline, et al., Biological Process for H2S removal from Gas Steams – The Shell-Pacques/Thiopaq Gas Desulphurization Process., Lawrence Reid Gas Conditioning Conference, 2003, Norman, Oklahoma, USA.

THE ANALYSYS OF THE POTENTIAL OF MATERIAL AND ENERGY RECOVERY OF MUNICIPAL WASTE IN CANADA
LITERATURE & REFERENCES
VI
90 Y. Liu, Novel Incineration Technology Integrated with Drying, Pyrolysis, Gasification, and Combustion of MSW and Ashes Vitrification., Environmental Science & Technology, 2005, vol. 39 issue 10, pages 3855 to 3863.
91 T-H Kwak, et al., Environmental aspects of gasification of Korean municipal solid waste in a pilot plant, Fuel, 2006, vol. 85 issues 14-15, pages 2012 to 2017.
92 Enviro-access, Environmental Fact Sheets: Waste and residue treatment / recycling : Engineered Landfill Site - Cintec Environnement Inc. (F4-01-04)., <URL: http://www.enviroaccess.ca > [last accessed: March 3, 2010].
93 Prasadha Pamunah Limbah Industri, Environmental Protection System., <URL: http://www.ppli-indo.com > [last accessed: March 3, 2010].
94 P. Kjeldsen, et al., Present and Long-Tern Composition of MSW Landfill Leachate: A Review., Critical Reviews in Environmental Science and Technology, 2002, Vol. 32 issue 4, pages 297 to 336.
95 V. Popov, A new landfill system for cheaper landfill gas purification., Renewable Energy, 2005, vol. 30 issue 7, pages 1021 to 1029.
96 P. Anderson, The Landfill Gas Energy Recovery Hoax., Abstract for 2006 Landfill Methane Outreach Conference.
97 K. Westlake, Sustainable Landfill – Possibility of Pipe-Dream?, Waste Management & Research, 1997, vol. 15 issue 5, pages 453 to 461.
98 P. Fowler, et al., Modeling the energy potential of biomass – H2RES., International Journal of Hydrogen Energy, 2009, vol. 34 issue 16, pages 7027 to 7040.
99 Statistics Canada, 2006 Cencus release topics., <URL: http://www12.statcan.ca> [last accessed: March 3, 2010].
100 Statistics Canada, Waste Management Industry Survey: Business and Government Sectors 2002., Minister of Statistics Canada, 2004.
101 Environment Canada, Canadian Environmental Protection Act, 1999 (CEPA 1999) <URL: http://www.ec.gc.ca/ceparegistry/> [last accessed: March 3, 2010].
102 OECD, Concerning the revsion of descision C(92)39/Final in the control of transboundary movements of wastes destinded for recovery operations., C(2001)107/Final.
103 Environment Canada, Waste Management: Canada-U.S.A. Agreement., <URL: http://www.ec.gc.ca/wmd-dgd/> [last accessed: March 3, 2010].
104 Environment Canada, CEPA, Proposed Regulatory Provisions for the Export and Import of Non-Hazardous Waste - Consultation Document., <URL: http://www.ec.gc.ca/ceparegistry/> [last accessed: March 3, 2010].
105 Environment Canada, CEPA, Interprovincial Movement of Hazardous Waste Regulations., <URL: http://www.ec.gc.ca/ceparegistry/> [last accessed: March 3, 2010].
106 Auditor General of Newfoundland and Labrador, Solid Waste Management (2004)., <URL: http://www.ag.gov.nl.ca/ag/> [last accessed: March 3, 2010].
107 Government of Newfoundland and Labrador, Waste Management Advisory Committee presents report to Environment Minister., News Release, 31 October 2001, <URL: http://www.releases.gov.nl.ca > [last accessed: March 3, 2010].

THE ANALYSYS OF THE POTENTIAL OF MATERIAL AND ENERGY RECOVERY OF MUNICIPAL WASTE IN CANADA
LITERATURE & REFERENCES
VII
108 Government of Newfoundland and Labrador, Waste Management Strategy., Department of Enviroment, April 2002.
109 Nova Scotia – Environment, Recycling and Waste., <URL: http://www.gov.ns.ca > [last accessed: March 3, 2010].
110 Nova Scotia – Department of Environment, Nova Scotia Leads Canada in Recycling and Composting., News Release, 26 September 2000, <URL: http://www.gov.ns.ca/news > [last accessed: March 3, 2010].
111 IWMC, Annal Report 2006., <URL: http://www.iwmc.pe.ca > [last accessed: March 3, 2010].
112 New Brunswick - Department of the Environment, Waste Reduction & Diversion - An Action Plan., <URL: http://www.gnb.ca/elg-egl > [last accessed: March 3, 2010].
113 New Brunswick - Department of the Environment, Climate Change Action Plan 2007-2012., <URL: http://www.gnb.ca > [last accessed: March 3, 2010].
114 Developpement durable Environment et Parcs, Québec Residual Materials Management Policy, 1998-2008., <URL: http://www.mddep.gouv.qc.ca > [last accessed: March 3, 2010].
115 Ontario – Environmental Protection Act, Ontario Regulation 524/98 – Certificate of Approval Exemptions – Air, <URL: http://www.e-laws.gov.on.ca > [last accessed: March 3, 2010].
116 Ontario –Ministry of the Environment, Ontario’s 60% Diversion Goal - A Discussion Paper., June 2004, <URL: http://www.ene.gov.on.ca > [last accessed: March 3, 2010].
117 Ontario, CHAPTER 6: An Act to promote the reduction, reuse and recycling of waste., <URL: http://www.e-laws.gov.on.ca > [last accessed: March 3, 2010].
118 Waste Diversion Ontario, <URL: http://www.wdo.ca/ > [last accessed: March 3, 2010].
119 Ontario –Ministry of the Environment, Province's New Rules Help Municipalities Manage Waste Better., News Release, 23 March 2007, Toronto, <URL: http://ogov.newswire.ca > [last accessed: March 3, 2010].
120 Ontario –Ministry of the Environment, Landfill Standards Guideline., <URL: http://www.ene.gov.on.ca > [last accessed: March 3, 2010].
121 The Beer Store, Environmental Leadership., <URL: http://www.thebeerstore.ca > [last accessed: March 4, 2010].
122 Manitoba Conservation, 2005 Provincial Sustainability Report for Manitoba, <URL: http://www.gov.mb.ca > [last accessed: March 4, 2010].
123 Manitoba Conservation, State of the Environment Reports 1993, <URL: http://www.gov.mb.ca > [last accessed: March 4, 2010].
124 Manitoba Conservation, Manitoba’s Environmental Advantages: Waste Management, <URL: http://www.gov.mb.ca > [last accessed: March 4, 2010].
125 Government of Saskatchewan, Environment., <URL: http://www.environment.gov.sk.ca> [last accessed: March 4, 2010].
126 Arwmas, <URL: http://www.arwmas.ca/> [last accessed: March 4, 2010].

THE ANALYSYS OF THE POTENTIAL OF MATERIAL AND ENERGY RECOVERY OF MUNICIPAL WASTE IN CANADA
LITERATURE & REFERENCES
VIII
127 Environment Alberta, Too Good to Waste. <URL: http://environment.alberta.ca/> [last accessed: March 4, 2010].
128 Ministry of Environment - BC, Landfill Criteria For Municipal Solid Waste., June 1993 <URL: http://www.env.gov.bc.ca /> [last accessed: March 4, 2010].
129 Ministry of Environment - BC, Waste Reduction., <URL: http://www.env.gov.bc.ca /> [last accessed: March 4, 2010].
130 Greater Vancouver Regional District, Solid Waste Management Annual Report 2004., <URL: http://public.metrovancouver.org > [last accessed: March 13, 2008].
131 Yukon Government, Environment Act., <URL: http://www.environmentyukon.gov.yk.ca > [last accessed: March 4, 2010].
132 Northwest Territories, Environment and Natural Resources., <URL: http://www.enr.gov.nt.ca > [last accessed: March 4, 2010].
133 Nunavut, Environment., <URL: http://www.gov.nu.ca > [last accessed: March 4, 2010].
134 London Chamber of Commerce, Waste to Energy (WTE)., News Release, 6 May 2007, <URL: http://www.londonchamber.com > [last accessed: March 3, 2010].
135 Canadian Environmental Assessment Agency, Sustainable Development Strategy 2007-2009., <URL: http://www.ceaa-acee.gc.ca > [last accessed: March 3, 2010].
136 IEA, Energy Policies of IEA Countries: Canada – 2004 Review., OECD/IEA, 2004
137 Ontario Ministry of the Environment, Landfills, Garbage, Incinerators, Recyling and Composting., <URL: http://www.ene.gov.on.ca > [last accessed: March 4, 2010].
138 Algonquin Power, <URL: http://www.algonquinpower.com > [last accessed: March 4, 2010].
139 Waste-To-Energy Research Council, The Global WTE Report to NAWTEC 14., <URL: http://www.seas.columbia.edu > [last accessed: March 4, 2010].
140 Commission of the European Communities, Communication from the Commission: Biomass action plan, SEC (2005) 1573l., EU Communities, Brussels, 2005.
141 Environnent Canada, Canada's 2005 Greenhouse Gas Inventory: A Summary of Trends., <URL: http://www.ec.gc.ca > [last accessed: March 4, 2010].
142 Government of Canada, Government of Canada Action Plan 2000 on Climate change, 2000, Government of Canada.
143 Government of Canada, Moving Forward on Climate Change: A Plan for Honouring our Kyoto Commitment., 2005, Majesty the Queen in Right of Canada.
144 ICF Consulting, Determination of the Impact of Waste Management Activities on Greenhouse Gas Emissions: 2005 Update., Environment Canada and Natural Resources Canada, October 2005.
145 Environment Canada, National Inventory Report: Greenhouse Gas Sources and Sinks in Canada 1990-2005., Her Majesty the Queen in Right of Canada, 2007.
146 Canadian Electrical Association, Power Generation in Canada: A Guide., Canadian Electricity Association, 2006

THE ANALYSYS OF THE POTENTIAL OF MATERIAL AND ENERGY RECOVERY OF MUNICIPAL WASTE IN CANADA
LITERATURE & REFERENCES
IX
147 H. Hondo, Life Cycle GHG emission analysis of power generation systems: Japanese case., Energy, 2005, vol. 30 issues 11-12, pages 2042 to 2056.
148 S. Latham, G. Mudge, Life Cycle Research Programme for Waste Management: Inventory development for waste management operations - waste transport and other vehicle use (final report)., TRL Report, 1997.