university of são paulo luiz de queiroz college of agriculture€¦ · this emerging pest of...
TRANSCRIPT

University of São Paulo “Luiz de Queiroz” College of Agriculture
The reunion of two lineages of the Neotropical brown stinkbug in soybean lands in the heart of Brazil
Patricia Lima Soares
Dissertation presented to obtain the degree of Master in Science. Area: Entomology
Piracicaba 2017

Patricia Lima Soares Agronomist
The reunion of two lineages of the Neotropical brown stinkbug in soybean lands in the heart of Brazil
versão revisada de acordo com a resolução CoPGr 6018 de 2011
Advisor: Prof. Dr. ALBERTO SOARES CORREA
Dissertation presented to obtain the degree of Master in Science. Area: Entomology
Piracicaba 2017

2
Dados Internacionais de Catalogação na Publicação DIVISÃO DE BIBLIOTECA – DIBD/ESALQ/USP
Soares, Patricia Lima
The reunion of two lineages of the Neotropical brown stinkbug in soybean lands in the heart of Brazil / Patricia Lima Soares. - - versão revisada de acordo com a resolução CoPGr 6018 de 2011.- - Piracicaba, 2017.
56 p.
Dissertação (Mestrado) - Escola Superior de Agricultura “Luiz de Queiroz”.
1. Soja 2. Genética de populações 3. Filogeografia 4. Expansão de domínio 5. Mitocôndrias 6. Modelagem 7. Bioma Cerrado 8. Mata Atlântica I. Título

3
I offer to all who gave me support during this stage of my life,
In special to my daughter, Lívia
In you I found the inspiration to go further

4
ACKNOWLEDGMENTS
To God for the gift of life.
To Dr. Alberto Soares Corrêa for the guidance, friendship, and patience during
my time in his lab.
To Dr. Celso Omoto also for the friendship and for all support from his
Laboratory team that was essential for me to carry out this work.
To the co-authors, thank you for providing your contribution to this research
and for the opportunity of learning from you.
To the Molecular Ecology Lab team (ESALQ/USP) for both the friendship and
knowledge exchange, most especially to Frederico N. S. Santos and to Dayana R.
Sousa for helping and training me at the beginning of this journey.
To all collaborators who helped collecting insect samples: Alex Bordignon,
Bruno Zachrisson, Celso Omoto, Eder Henrique Silva, Guilherme B. Pavan,
Guilherme Rossi, José Francisco Farinha, José Netto, Juscelino Gomes, Laercio
Zenati, Luciana Barboza Silva, Maikon G. Baptistella, Maíne A. Lerner, Marina
Rondon, Matheus Tonelli, Miriam S. Vidotti, Natália Leite, Osmar Arias, Pablo
Gontijo, Rodrigo L. Brogin, Rogério Machado, Taciana Azevedo, Vinícius E. N.
Ferreira, Edson Trebien. Thank you for making this work possible.
To Escola Superior de Agricultura “Luiz de Queiroz”/Universidade de São
Paulo (ESALQ/USP) for the opportunity to carry out my studies and my reasearch.
To all the professors from the department of Entomology and Acarology
ESALQ/USP for the knowledge shared.
To Prof. Anete P. de Souza and her team at the Laboratory of Genetic and
Molecular Analysis of Unicamp for the passion and effort to carry out the special
course that helped me develop my technical skills.
To Coordenação de Aperfeiçoamento de Pessoal de Nível Superior (CAPES)
for granting the scholarship.
To doctors Ana Beatriz Zanardo, Felipe Domingues, graduate students
Mariana R. Durigan, Rogério Nascimento and José Bruno Malaquias, thank you for
the friendship and shared knowledge always with much disposition.
To Erick Cordeiro for his love, friendship, and care. You brought a new
meaning to my life.

5
To my best friend Mayara Araujo for the true friendship and encouragement.
Thank you.
To all people who directly or indirectly contributed to the achievement of this
work, my sincere thanks.

6
CONTENTS
RESUMO .................................................................................................................... 7
ABSTRACT ................................................................................................................. 8
1. INTRODUCTION GERAL ....................................................................................... 9
REFERENCIAS ........................................................................................................ 13
2. CAPÍTULO 1: THE REUNION OF TWO LINEAGES OF THE NEOTROPICAL
BROWN STINKBUG IN SOYBEAN LANDS IN HEART OF BRAZIL .................... 2117
2.1 INTRODUCTION ................................................................................................ 17
3. RESULTS ............................................................................................................. 21
4. DISCUSSION ....................................................................................................... 33
5. MATERIAL AND METHODS .............................................................................. 377
5.1. Sample collection and DNA extraction ............................................................. 377
5.2. PCR amplification and DNA sequencing .......................................................... 377
5.3. Assembly of sequence datasets ...................................................................... 388
5.4. Genealogical inferences .. ............................................................................... 388
5.5. Diversity statistics .............................................................................................. 39
5.6. Divergence dating .............................................................................................. 39
5.7. Population Structure .......................................................................................... 39
5.8. Demographic statistics inferred for mitochondrial data ...................................... 40
5.9. Environmental features and soybean expansion modelling the current
mitochondrial lineage distribution .............................................................................. 40
6. CONCLUSION........................................................................................................43
REFERENCES ......................................................................................................... 45
APPENDIXES……………………………………………………………………………….53

7
RESUMO
O reencontro de duas linhagens do Neotropical percevejo-marrom em cultivos de soja no coração do Brasil
O ritmo acelerado da conversão de áreas naturais em sistemas
agronômicos é motivo de grande preocupação e as consequências para conservação e manejo de pragas ainda não são totalmente compreendidas. Examinamos regiões de genes mitocondriais (COI e Cytb) e nucleares (ITS1) de 21 populações de Euschistus heros para investigar a diversidade genética, a estrutura genética e a história demográfica dessa praga emergente de soja na América do Sul. Duas linhagens profundamente divergentes que se separaram no Plioceno (4.5 My) foram encontradas amplamente distribuidas na América do Sul. A linhagem norte é mais antiga, mais diversificada e predomina na Amazônia e Caatinga, enquanto a linhagem sul é mais jovem, menos diversificada e prevalente nos biomas da Mata Atlântica e Chaco. O contato secundário está ocorrendo principalmente no Cerrado, uma importante fronteira agrícola. As populações de E. heros estão se expandindo em tamanho e área, mas são fortemente afetadas pelas variáveis ambientais. As mudanças históricas durante o Plio-Pleistoceno criaram significativa diferenciação genética entre as populações de E. heros, que se encontram estruturadas nos biomas. As populações atuais estão se expandindo em diferentes taxas, misturando populações altamente diversas com populações menos diversas em regiões de agricultura intensiva. Assim, indivíduos adaptados a diferentes condições ambientais e grandes monoculturas podem combinar-se em uma população de pragas panmítica e difícil de controlar. Palavras-chave: Soja; Genética de populações; Filogeografia; Expansão
de domínio; Mitocôndrias; Modelagem; Bioma Cerrado; Mata Atlântica

8
ABSTRACT
The reunion of two lineages of the Neotropical brown stinkbug in soybean lands in heart of Brazil
The rapid pace of conversion of natural areas to agronomic systems is a matter of great concern, and the consequences for conservation and pest management are not yet fully understood. We examined mitochondrial (COI and Cytb) and nuclear (ITS1) gene regions of 21 Euschistus heros populations to investigate the genetic diversity, genetic structure, and the demographic history of this emerging pest of soybean crops in South America. Two deep divergent lineages that separated in the Pliocene (4.5 My) have been found over a wide area. The northern lineage is older, more diverse, and prevalent in the Amazon and Caatinga, while the southern lineage is younger, less diverse, and prevalent in the Atlantic Forest and Chaco biomes. The secondary contact is occurring mainly in the Cerrado, an important agriculture frontier. Euschistus heros populations are expanding in size and range, but are strongly affected by environment variables. Historical changes during the Plio-Pleistocene created significant genetic differentiation between E. heros populations, which differentiated further in several biomes. The present populations are expanding at different rates, mixing highly diverse populations with less-diverse populations in regions of intensive farming. This, individuals adapted to different environmental conditions and to large monocultures might currently be combining into a panmictic and hard-to-control pest population. Keywords: Soybean; Population genetics; Phylogeography; Range expansion;
Mitochondria; Modelling; Biome Cerrado; Atlantic Forest

9
1. INTRODUÇÃO GERAL
Filogeografia foi conceituada por Avise (2000) como o estudo dos processos
históricos que podem ser responsáveis pela distribuição geográfica contemporânea
dos indivíduos. Esse campo de estudos combina dados genéticos, ecológicos e
informações geográficas para extrair informações da história evolutiva de uma
população natural de um determinado organismo (Beheregaray, 2008). Abordagens
filogeográficas são comumente empregadas para identificar e delimitar áreas com
histórias evolutivas singulares, definir unidades biogeográficas e prioridades para
conservação biológicas (Myers et al., 2000; Lamoreux et al., 2006; Hickerson et al.,
2010). Dentro deste contexto, neste trabalho, aplicamos os conceitos filogeográficos
para entendermos o intrigante sucesso na expansão populacional e no domínio de
uma espécie de inseto-praga de grande importância econômica, endêmica e
amplamente distribuída na América do Sul, o Euschistus heros (Fabr., 1974)
(Hemiptera: Heteroptera: Pentatomidae).
Vegetação, altitude, latitude, condições climáticas e alterações antrópicas na
paisagem são variáveis que agem diretamente nas populações naturais de
diferentes organismos (Kozak et al., 2008). No último século o homem alterou
drasticamente a paisagem, convertendo habitats nativos em áreas de cultivo
caracterizada pela expansão das cadeias produtivas de carne, grãos e algodão em
direção às regiões Centro-Oeste e Norte do Brasil (Klink et al., 1993). Um exemplo
disso, é a expressiva expansão das áreas de cultivo de soja, Glycine max (L.) Merrill,
nos últimos 40 anos (Gibbs et al., 2015).
A cultura da soja, inicialmente cultivada apenas no sul do Brasil, devido as
limitações de temperatura e fotoperíodo dos primeiros cultivares introduzidos no
Brasil, está atualmente presente até do extremo sual ao extremo norte do país. O
cultivo intensivo e extensivo da soja, contribui para alterações ambientais e
mudanças de cenários que podem trazer vantagens e desvantagens adaptativas
para diversos organismos (Zockun, 1980; Fearnside, 2006). A soja desempenha
importante papel econômico social como uma das principais commodities que
produzimos e exportamos no pais. No entanto, a fragmentação da vegetação nativa
pode eventualmente limitar o alcance geográfico e diminuir a diversidade genética
de espécies endêmicas com baixa capacidade de dispersão ou, por outro lado, pode

10
fornecer recursos adequados para que algumas espécies prosperem no novo
ambiente (Klink et al., 1994; Tabarelli et al., 2004; Schiesar et al., 2013).
Nesse contexto, E. heros, popularmente conhecido como percevejo-marrom,
é um interessante modelo de estudo, não apenas pela sua crescente importância
econômica, mas também por alguns aspectos ecológicos e comportamentais. Os
percevejos pentatomídeos normalmente apresentam alta polifagia (Smaniotto and
Panizzi 2015). Euschistus heros é associado a pelo menos 21 espécies de plantas
hospedeiras distribuídas entre 11 famílias, no entanto, tem preferência por
leguminosas (Link and Grazia 1987; Smaniotto & Panizzi, 2015). Dentre o complexo
de percevejos fitófagos que atacam a cultura da soja, essa espécie tem se
destacado pela maior abundância, danos e dificuldade de controle (Panizzi et al.,
2012). Durante o ciclo de cultivo da soja, essa espécie completa três gerações e
próximo a colheita, adultos reprodutivos, dispersam para hospedeiros alternativos
nas proximidades da lavoura (plantas daninhas ou cultivadas), onde podem
completar uma quarta geração (Smaniotto and Panizzi 2015). Porém, os adultos em
estado de quiescência, permanecem na área durante os meses mais frios (outono,
inverno), sob folhas caídas no solo, sem se alimentarem e reproduzirem até o início
da próxima safra (Cividanes et al., 1994; Panizzi & Vivam, 1997). Diante disso, a
capacidade de dispersão dessa espécie, ainda pouco investigada, é considerada
limitada (Aldrich, 1990).
Nativo da região tropical, o E. heros era raramente relatado antes da década
de 70. No entanto, atualmente o E. heros é a principal praga do complexo de
percevejos que atacam a cultura da soja, ocorrendo altas infestações nas principais
regiões produtoras (Panizzi, 2015). Mais recentemente tem incidido com maior
frequência e intensidade em cultivos de algodão, crescendo em importância nessa
cultura no Centro-Oeste do Brasil (Panizzi, 2002; Soria et al., 2010; Panizzi et al.,
2012). Como essa espécie de percevejo, com baixa capacidade de dispersão,
relatado pela primeira vez no sul do Brasil, em poucas décadas teve sua ocorrência
amplamente relatada na América do Sul? Até o momento a hipótese é de que a
expansão de domínio de espécie está associada ao evento recente de expansão da
soja para as regiões Central, Nordeste e Norte do Brasil (Panizzi 2015).
Diante disso, buscamos responder (a) como a diversidade genética das
populações de E. heros está distribuída geograficamente?; (b) quais são os

11
processos históricos que moldaram a atual estruturação genética das populações
naturais de E. heros?; e finalmente, (c) como os processos recentes impactam a
estrutura genética das populações naturais de E. heros?

12

13
REFERÊNCIAS
1. Avise, J. C.. Phylogeography: The History and Formation of Species. Harvard
University Press, Cambridge. (2000).
2. Aldrich, J.R. Dispersal of the southern green stink bug, Nezara viridula (L.)
(Heteroptera: Pentatomidae), by hurricane Hugo. Proc. Entomol. Soc. Wash.
Washington, 92, 757-759 (1990).
3. Beheregaray, L. B. (2008). Twenty years of phylogeography: the state of the
field and the challenges for the Southern Hemisphere. Molecular Ecology,
17(17), 3754-3774.
4. Cividanes, F.J.; Parra, J.R.P. Zoneamento ecológico de Nezara viridula (L.),
Piezodorus guildinii (West.) e Euschistus heros (Fabr.) (Heteroptera:
Pentatomidae) em quatro estados produtores de soja do Brasil. Anais da
Sociedade Entomológica do Brasil 23, 219-226 (1994).
5. Gibbs, H. K. et al. Brazil’s Soy Moratorium. Supply-chain governance is
needed to avoid deforestation. Environment and Development. Science 347,
377-378 (2015).
6. Hickerson, M. J. et al. Yoder Phylogeography’s past, present, and future: 10
years after Avise, 2000. Molecular Phylogenetics and Evolution 54, 291–301
(2010).
7. Klink, C. A., Moreira, A. G. & Solbrig, O. T. Ecological impacts of agricultural
development in Brazilian cerrados. In: The World’s Savannas: Economic
Driving Forces, Ecological Constraints, and Policy Options for Sustainable
Land Use, ed. M.D. Young & O.T. Solbrig. Paris, France: Man and the
Biosphere, 259-82 (1993).
8. Klink, C. A., Macedo, R. H. & Mueller, C. C. Cerrado: Processo de ocupação e
implicações para a conservação e utilização da sua diversidade biológica.
Brasilia, Brazil: World Wide Fund for Nature (WWF-Brasil): 104 (1994).

14
9. Kozak, K. H., Graham, C. H., & Wiens, J. J. (2008). Integrating GIS-based
environmental data into evolutionary biology. Trends in Ecology & Evolution,
23(3), 141-148.
10. Lamoreux, J. F. et al. Global tests of biodiversity concordance and the
importance of endemism. Nature 440, 212–214. (2006).
11. Link, D. & Grazia, J. Pentatomídeos da região central do Rio Grande do Sul
(Heteroptera). Anais da Sociedade Entomológica do Brasil 16, 115-129
(1987).
12. Myers, N., Mittermeier, R. A., Mittermeier, C. G., da Fonseca, G. A. B. & Kent,
J. Biodiversity hotspots for conservation priorities. Nature 403, 853–854
(2000).
13. Panizzi A.R. & Vivan L.M. Seasonal abundance of the neotropical brown stink
bug, Euschistus heros, in overwintering sites, and the breaking of dormancy.
Entomologia Experimentalis Applicata 82, 213-217 (1997).
14. Panizzi, A. R.; Bueno, A. F. & Silva, F. A. C. Insetos que atacam vagens e
grãos. In: Soja: manejo integrado de insetos e outros artrópodes-praga.
Brasília, DF: Embrapa 5, 335-420 (2012).
15. Panizzi, A. R. Growing problems with stink bugs (Hemiptera: Heteroptera:
Pentatomidae): species invasive to the US and potential neotropical invaders.
American Entomologist 61, 223-233 (2015).
16. Panizzi, A.R. Stink bugs on soybean in northeastern Brazil and a new record
on the southern green stink bug, Nezara viridula (L.) (Heteroptera:
Pentatomidae). Neotropical Entomology 31, 331-332 (2002).Avise, J. C.
(2000). Phylogeography: the history and formation of species. Harvard
university press.
17. Schiesari, L., Waichman, A., Brock, T., Adams, C. & Grillitsch, B. Pesticide
use and biodiversity conservation in the Amazonian agricultural frontier.
Philosophical Transactions Royal Society B 368, 20120378 (2013).

15
18. Smaniotto, L. F. & Panizzi, A. R. Interactions of selected species of stink bugs
(Hemiptera: Heteroptera: Pentatomidae) from leguminous crops with plants in
the Neotropics. Florida eEntomologist 98, 7-17 (2015).
19. Soria, M. F. Degrande, P. E. & Panizzi, A. R. Algodoeiro invadido. Revista
Cultivar 131, 18-20 (2010).
20. Tabarelli, M., Da Silva, J. M. C. & Gascon, C. Forest fragmentation,
synergisms and the impoverishment of neotropical forests. Biodiversity &
Conservation 13, 1419-1425 (2004).
21. Zockun, M. H. G. P. A Expansão da Soja no Brasil: Alguns Aspectos da
Produção. São Paulo, Brazil: Instituto de Pesquisas Econômicas da
Universidade de São Paulo, 243 (1980).

16
17
2. THE REUNION OF TWO LINEAGES OF THE NEOTROPICAL BROWN STINKBUG IN SOYBEAN LANDS IN HEART OF BRAZIL
*Submitted to Scientific Reports
2.1 Introduction
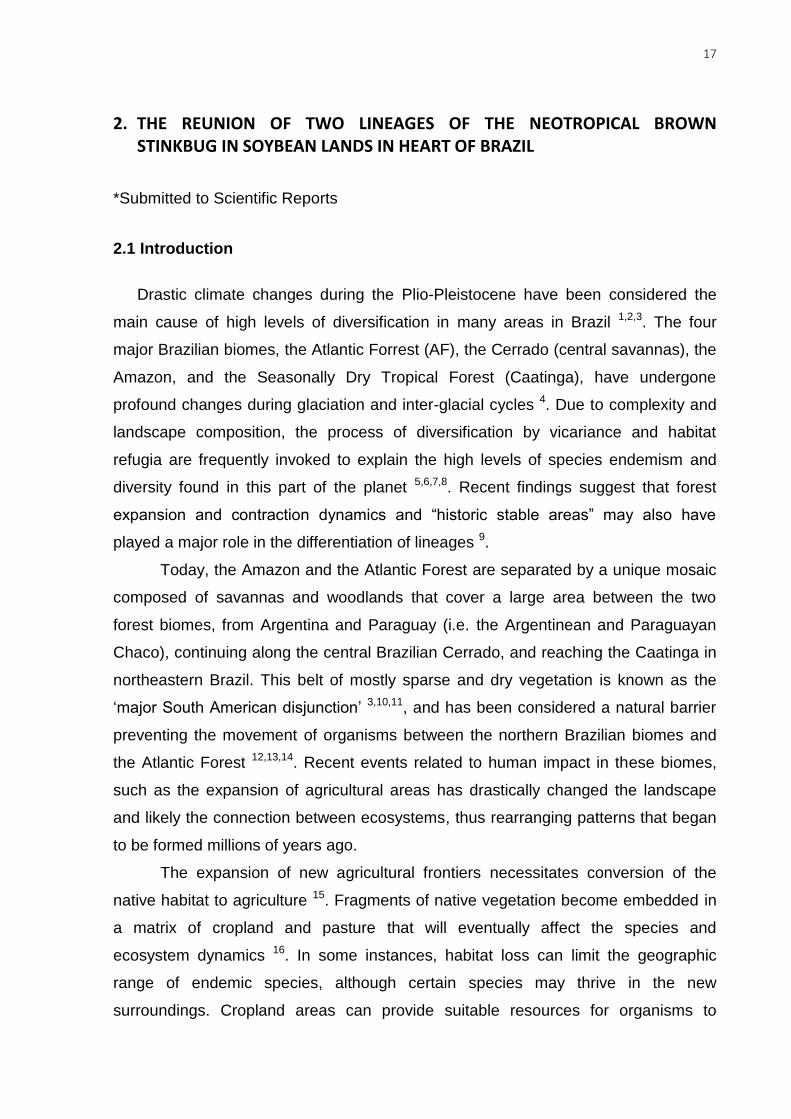
Drastic climate changes during the Plio-Pleistocene have been considered the
main cause of high levels of diversification in many areas in Brazil 1,2,3. The four
major Brazilian biomes, the Atlantic Forrest (AF), the Cerrado (central savannas), the
Amazon, and the Seasonally Dry Tropical Forest (Caatinga), have undergone
profound changes during glaciation and inter-glacial cycles 4. Due to complexity and
landscape composition, the process of diversification by vicariance and habitat
refugia are frequently invoked to explain the high levels of species endemism and
diversity found in this part of the planet 5,6,7,8. Recent findings suggest that forest
expansion and contraction dynamics and “historic stable areas” may also have
played a major role in the differentiation of lineages 9.
Today, the Amazon and the Atlantic Forest are separated by a unique mosaic
composed of savannas and woodlands that cover a large area between the two
forest biomes, from Argentina and Paraguay (i.e. the Argentinean and Paraguayan
Chaco), continuing along the central Brazilian Cerrado, and reaching the Caatinga in
northeastern Brazil. This belt of mostly sparse and dry vegetation is known as the
‘major South American disjunction’ 3,10,11, and has been considered a natural barrier
preventing the movement of organisms between the northern Brazilian biomes and
the Atlantic Forest 12,13,14. Recent events related to human impact in these biomes,
such as the expansion of agricultural areas has drastically changed the landscape
and likely the connection between ecosystems, thus rearranging patterns that began
to be formed millions of years ago.
The expansion of new agricultural frontiers necessitates conversion of the
native habitat to agriculture 15. Fragments of native vegetation become embedded in
a matrix of cropland and pasture that will eventually affect the species and
ecosystem dynamics 16. In some instances, habitat loss can limit the geographic
range of endemic species, although certain species may thrive in the new
surroundings. Cropland areas can provide suitable resources for organisms to

18
exploit, as did the expansion of soybean cultivation in Brazil in recent decades 17.
Soybean crops were limited to southern Brazil (i.e. Atlantic Forest), and only in the
early 1970s did advances in farming methods and new varieties allow soybean
farmers to expand into a new and important frontier, the Cerrado 18,19,20.
Farming in the Cerrado has had both negative and positive impacts over the
last 40 years. The expansion of soybean crops caused great environmental impacts
such as fragmentation and the loss of natural areas, a matter of great concern for
ecologists and conservationists 2,21,22. On the other hand, Brazil is the second largest
soybean producer after the USA, and soybeans account for an important share of its
GDP 23. For these reasons, it is important to understand both the impacts of soybean
expansion on connecting natural populations, and the influx of pest insects from
natural areas into soybean croplands.
The Neotropical brown stink bug, Euschistus heros (Fabr. 1798) (Hemiptera:
Pentatomidae), is one of the most important pests of soybeans 24. Living in markedly
different environments such as the Amazon Forest, Cerrado, Caatinga and Atlantic
Forest, E. heros is native to the Neotropics and is widespread in South America 25.
The dispersal ability of E. heros is not well known, but is considered to be limited,
which might be associated with its limited flight activity and diapause behavior 26,27.
This polyphagous pest feeds on Fabaceae, Solanaceae, Brassicaceae, Compositae,
and Malvaceae, however, high population densities are often associated with
soybean crops 28,29,30,31. Rarely reported before the 1970s 24,32,33, since then E. heros
has increased in abundance and is now found in all major soybean-producing
regions24. Recently, this pest was recorded in Argentina 34 and Paraguay 24, raising
concerns regarding a possible range expansion to other locations in South, Central
and North America 24.
Here we present a genealogy of mitochondrial and nuclear DNA sequences
from E. heros. We addressed several questions regarding the genetic diversity,
population structure, and demographic history of E. heros populations in Brazil and
Paraguay, examining the potential role of past events in the differentiation of
lineages, and the recent events (i.e. soybean expansion) promoting the admixture of
ancient lineages. Our first objective was to determine the genetic distribution,
studying population divergence and population structure. Second, we investigated
the demographic history of E. heros in different biomes in South America. Finally, we

19
used a modelling approach to explore how the environmental variables and soybean
expansion can explain the genetic pattern of current populations of E. heros in Brazil.

20

21
3. RESULTS
Genealogical inferences. The genealogical relationships among the 111
mitochondrial haplotypes found indicate the presence of two well-supported E. heros
lineages separated by 52 mutational steps and an estimated genetic distance of D=
0.042 (Fig. 1A). The southern lineage (S) haplotypes were mainly distributed in
southern regions of South America (Fig. 1B). Small percentages of lineage S
haplotypes were also found in the central and northeast region of Brazil (Fig. 1B),
which characterizes a wide range of habitats distribution (Table 1). The northern
lineage (N) was distributed mainly through northern and northeastern regions of
South America and it was not present in Paraguay or Southern Brazil (Table 1). A
total of 91 haplotypes were identified as private haplotypes; the most frequent
variants were H2 and H38 (n = 8), both from lineage S (Table 1).
The analyses for the ITS1 region revealed a single nucleotide polymorphism
variation separating the haplotypes. There were only six haplotypes, separated
among themselves by a one-step mutation (Fig. 1C and Supplementary material S2).
We created two alternative ITS1 sequences for all individuals that showed ambiguity
in the polymorphic site to recreate the heterozygotes. Compared to the mitochondrial
network, the ITS1 network had lower haplotype diversity. Haplotype HA was the most
frequent (70.16%) and was widely distributed across all regions (Table 1). Haplotype
HC was found in the South and Central region of South America, and associated the
individuals previously identified as mitochondrial lineage S (Table 1 and
Supplementary Fig S2). Haplotype HD (21.77%) could be found only in Northern
region of continent, and associated the individuals previously identified as
mitochondrial lineage N and lineage S (Table 1). The single haplotypes HB, HE and
HF were found in the population RS1, MT1, and MT2, respectively (Table 1). The
sharing of nuclear haplotypes by specimens from both mitochondrial lineages may be
an indication that insects can interbreed (Figure 1C).

22
Figure 1. Median-joining network and geographic distribution of Euschistus
heros haplotypes in South America. Network of 159 concatenated mitochondrial
COI-Cytb sequences. Size of haplotype circles reflects sample size, and gray nodes
represent missing haplotypes. Colors indicate the two mitochondrial lineages of
haplotypes: in green, lineage N (northern) and in blue, lineage S (southern). Number
of mutation steps is shown as hatch marks. (B) Geographic distributions of the
mitochondrial haplotypes. Circles represent the proportion of each lineage. (C)
Network of 124 nuclear ITS1 region sequences. The haplotype color is referent the
mitochondrial lineages of the individual that ITS1 sequence was obtained.

23
Table 1. Sampling localities of E. heros, with code, biomes, mitochondrial haplotype from two concatenated genes (COI + CytB),
haplotype nuclear ITS1 region, and geographic coordinates.
ID Locations (City, State) Code Biome mtDNA haplotypes (n)* ITS1 haplotypes
(n) Latitude (S) Longitude (W)
1 Teutônia, RS RST Atlantic Forest H1; H2(2); H3; H4; H5; H6; H7; H8 HA(4); HB 29°26'48.83" 51°48'50.44"
2 Santa Bárbara do Sul, RS RSSB Atlantic Forest H9; H10; H11; H12; H13; H14; H15; H16; H17 HA(5) 28°22'01.95" 53°15'06.23"
3 Chopinzinho, PR PRC Atlantic Forest H18; H19(2); H20(3); H21; H22(4); H23; H24; H25 HA(6); HC(3) 25°51'23.28" 52°32'14.01"
4 Cornélio Procópio, PR PRCP Atlantic Forest H2(3); H20; H26; H27; H28; H29 HA(3) 23°10'57.89" 50°38'44.37"
5 Anhembi, SP SPA Atlantic Forest H23; H30(2); H31; H32; H33 HA(3) 22°47'17.09" 48°07'52.29"
6 Lavras, MG MGL Atlantic Forest H27; H43; H44; H45 HA(2); HC 21°14'54.56" 45°00'04.95"
7 General Higinio Morínigo, PY PY Chaco H2; H20; H38; H105; H106; H107; H108; H109; H110; H111
HA(3); HC(2) 25°09'19.55" 55°29'59.24"
8 Costa Rica, MS MSCR Cerrado H3; H30; H37; H48; H49 HA(2); HC 18°32'37.15" 53°07'45.17"
9 Jaboticabal, SP SPJ Cerrado H2; H30; H34; H35; H36; H37; H38(2) HA(8) 21°15'09.05" 48°19'32.43"
10 Capitólio, MG MGC Cerrado H21; H30; H39(2); H40; H41; H42 HA(6); HD 20°36'50.88" 46°02'52.35"
11 Santa Juliana, MG MGSJ Cerrado H38(2); H46; H47 - 19°18'40.47" 47°31'57.69"
12 Padre Bernardo, GO GOPB Cerrado H18; H38; H39; H50; H51; H52 HA(6); HD(3) 15°09'39.38" 48°17'01.46"
13 Rondonópolis, MT MTR Cerrado H39; H53; H54; H55; H56; H57; H58 HA(7); HD; HE 16°27'55.71" 54°38'19.04"
14 Sorriso, MT MTS Amazon Forest H39; H50(2); H59; H60; H61; H62 HA(7); HD(2); HF 12°32'34.61" 55°43'17.53"
15 Cerejeiras, RO ROC Amazon Forest H2; H3; H60; H63; H64; H65; H66 HA(5) 13°11'14.64" 60°49'02.48"
16 Paragominas, PA PAP Amazon Forest H67; H68(4); H69; H70; H71(2); H72 HA(4); HD(4) 03°00'09.95" 47°21'11.19"
17 Correntina, BA BAC Caatinga H38(2); H60; H73; H74; H75; H76; H77 HA(8); HD(2) 13°20'33.19" 44°38'08.06"
18 São Desidério, BA BASD Caatinga H78; H79; H80; H81; H82 HA(3); HD(5) 12°21'27.47" 44°58'38.23"
19 Luís Eduardo Magalhães, BA BALE Caatinga H61; H83; H84; H85; H86; H87; H88; H89; H90 HA(3); HD(6) 12°05'25.63" 45°46'49.94"
20 Bom Jesus, PI PIB Caatinga H91; H92; H93; H94; H95; H96; H97; H98; H99 - 09°04'17.95" 44°21'33.65"
21 Bom Jesus, PI BJPI Caatinga H96; H100(2); H101; H102; H103; H104 HA(2); HD(3) 09°04'17.95" 44°21'33.65"
*Italic haplotype = South lineage; Bold haplotype = North lineage.

24
Diversity statistics. Extensive mitochondrial diversity was found within these South
American E. heros populations. From 159 concatenated mitochondrial sequences of
COI and Cytb analyzed, 111 haplotypes were found; most (82%) of these haplotypes
were private and only 18% were shared among individuals. The overall haplotype
diversity, nucleotide diversity and mean number of nucleotide differences were h =
0.991, π = 0.03312 and K = 32.892, respectively (Table 2). The haplotype diversity
was similar in lineage N (h = 0.984) and lineage S (h = 0.982); however, lineage N (π
= 0.0090) had higher nucleotide diversity than lineage S (π = 0.0062). For the
different biomes, the haplotype diversity among biomes (groups) was considered low,
ranging from 0.967 in the Amazon to 1.000 in the Chaco. For nucleotide diversity, a
higher amplitude was found among biomes, ranging from 0.00627 in the Atlantic
Forest to 0.03147 in the Amazon Forest (Table 2). Locations where both lineages
were present had the highest levels of nucleotide diversity and mean numbers of
nucleotide differences. Sequence analysis of the ITS1 region of E. heros identified
six haplotypes with a haplotype diversity of 0.461, nucleotide diversity of 0.0008 and
mean number of nucleotide differences of 0.499 (Table 2). The haplotype diversity
and nucleotide diversity were higher in lineage N (h = 0.503; π = 0.0008) than lineage
S (h = 0.355; π = 0.0006), previously defined by the mitochondrial network. Among
biomes, the highest diversity was observed in the Chaco (h = 0.600; π = 0.0009) and
the lowest diversity in the Atlantic Forest (h = 0.315; π = 0.0005) (Table 2). Amazon
Forest, Caatinga and Cerrado have higher nucleotide diversity due to mixing of the
two lineages in these areas.

25
Table 2. Measures of genetic diversity for E. heros based on two concatenated
mitochondrial genes (COI-CytB) and ITS1 region.
Geographical regions
Sample size (N)
Haplotype number (H)
Haplotype diversity (h)
Nucleotide diversity (π)
Average of nucleotide
difference (K)
COI-CytB
Pooled 159 111 0.991 0.0331 32.892
Atlantic Forest 50 36 0.979 0.0063 6.224
Chaco 10 10 1.000 0.0066 6.511
Cerrado 37 27 0.970 0.0256 25.396
Amazon Forest 24 18 0.967 0.0315 31.246
Caatinga 38 35 0.996 0.0252 25.007
Lineage N 57 42 0.984 0.0090 8.921
Lineage S 102 69 0.982 0.0062 6.198
ITS1 region
Pooled 124 6 0.461 0.0008 0.499
Atlantic Forest 28 3 0.315 0.0005 0.325
Chaco 5 2 0.600 0.0009 0.600
Cerrado 36 4 0.340 0.0006 0.357
Amazon Forest 23 3 0.466 0.0008 0.490
Caatinga 32 2 0.516 0.0008 0.516
Lineage N 50 2 0.503 0.0008 0.503
Lineage S 74 6 0.355 0.0006 0.382
*Lineage were previously defined by mitochondrial network.
Mitochondrial divergence dating. The estimated age of origin of the lineage S
(southern lineage) clade was 4.5 Myr (95% C.I 2.801–6.453 Myr), during the
Pliocene, with intense diversification in the Pleistocene and Holocene (Fig. 2B).
Population Structure. Lineage N haplotypes were associated mainly with the
Amazon Forest and Caatinga, with one, more recent clade (CW) associated with the
central region of Brazil where the Cerrado, the Caatinga and the Amazon forest are
in transitioning areas (Fig. 2A and Fig. 2C). Lineage S occurs predominantly in the
Atlantic Forest and Chaco, with a lower frequency in the Cerrado, Caatinga and
Amazon Forest biomes (Fig. 2A and Fig. 2C).

26
Figure 2. Bayesian coalescent tree for Euschistus heros (A) Geographic and
biome distribution each sampled population of E. heros (see Table 1). (B) Bayesian
phylogeny tree of 159 concatenated mitochondrial sequences (COI-Cytb). Gray bars
at nodes indicate 95% highest probability density intervals (HPD) confidence

27
intervals for nodal age. (C) Bayesian phylogeny tree showing posterior probability
values (> 75) and biome where individuals were sampled (taxon names provided in
Table 1).
Table 3. Analysis of molecular variance (AMOVA) for genetic structure of E. heros
based on two concatenated mitochondrial genes (COI+Cytb) and ITS1.
Source of variation d.f. Variance
components
Percentage
variance
Fixation indices
(p-value)
(a) COI-CytB
Among populations 20 9.550 56.57 ΦST = 0.566 (p=0.00)
Within populations 138 7.333 43.43
Total 158 16.883
Among biomes 4 8.342 45.07 ΦCT = 0.450 (p=0.00)
Among populations within biomes 16 2.836 15.32 ΦSC = 0.278 (p=0.00)
Within populations 138 7.333 39.61 ΦST = 0.603 (p=0.00)
Total 158 18.511
(b) ITS1 region
Among populations 18 0.050 20.18 ΦST = 0.201(p=0.00)
Within populations 105 0.201 79.82
Total 123 0.252
Among biomes 4 0.045 17.30 ΦCT = 0.173 (p=0.00)
Among populations within biomes 14 0.014 5.49 ΦSC = 0.066 (p=0.07)
Within populations 105 0.201 77.21 ΦST = 0.227 (p=0.00)
Total 123 0.260
At the regional scale, the E. heros populations showed high genetic structure,
as assessed by the Analysis of Molecular Variance (AMOVA). Differences among
populations accounted for most of the genetic variances in mtDNA (56.57%, P <
0.001) and a high and significant value in ITS1 regions (20.18%, P < 0.001) (Table
3). The hypothesis that the genetic variation is structured by biomes was tested,
showing that 45.07% of the mtDNA total variance was distributed among biomes

28
(ΦCT = 0.450, P < 0.001). Furthermore, the larger portion of genetic variation within
populations (39.61%, ΦST = 0.603) indicates overall genetic differentiation in these
populations (Table 3). Analysis of the ITS1 region supported the mitochondrial data,
showing a significant structuring by biome (ΦCT = 0.173, P < 0.001), in which most of
the genetic variation was within populations (Table 3).
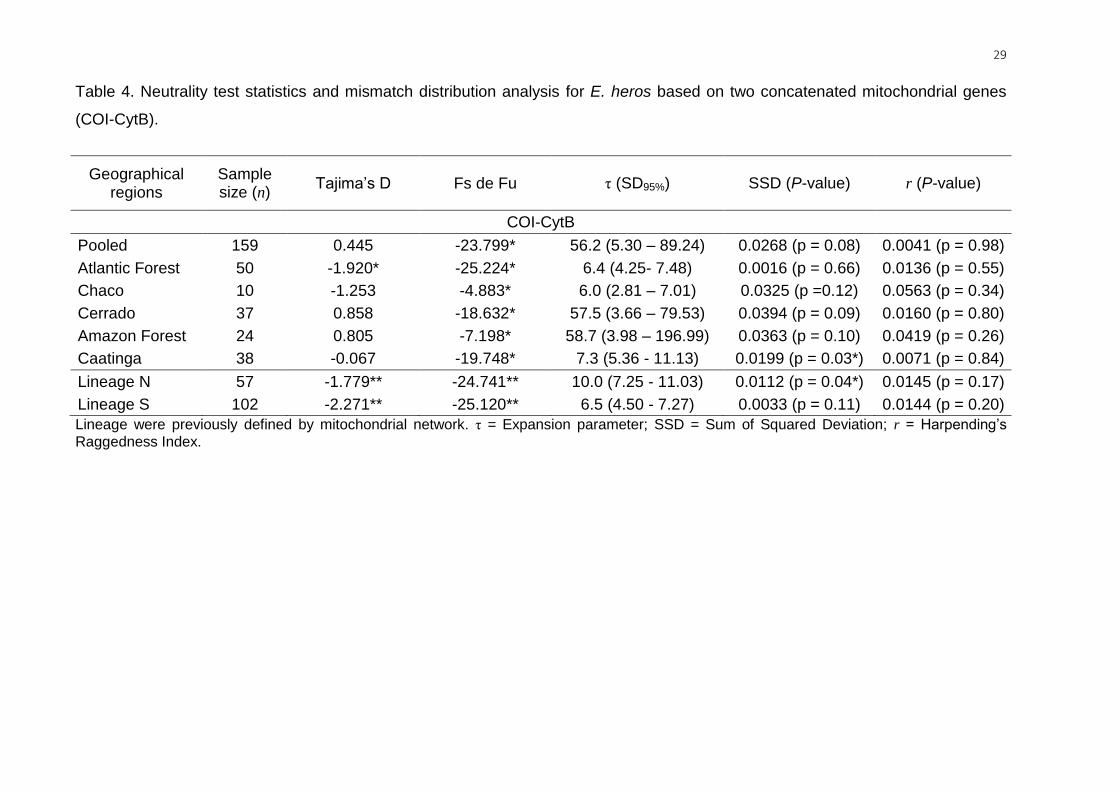
Demographic statistics inferred for mitochondrial genes. Considering the two
lineages, significant negative values were found in both Tajima’s D and Fu’s Fs
neutrality tests, indicating population expansion or purifying selection. Considering
the biomes, the neutrality test statistics did not fully agree with one another. Fu’s Fs
statistic was significantly negative for all biomes, but only the Atlantic Forest biome
had a significant negative Tajima’s D value (Table 4).
For the lineages, the mismatch distribution analysis resulted in a nonsignificant
SSD (P > 0.05), indicating a recent demographic expansion of lineage S but not
lineage N (P = 0.04). For the biomes, a nonsignificant SSD (P > 0.05) was also found
for the E. heros populations in all biomes but the Caatinga (P = 0.03) (Table 4). The
nonsignificant raggedness index (P > 0.17) supports the spatial-expansion model of
populations of lineages, biomes, and the entire group (all populations combined)
(Table 4). The τ values were higher in the Cerrado and in the Amazon Forest, τ =
57.5 and τ = 58.7, respectively, compared to the other three biomes, Atlantic Forest
(τ = 6.4), Chaco (τ = 6.0) and Caatinga (τ = 7.3) (Table 4).
29
Table 4. Neutrality test statistics and mismatch distribution analysis for E. heros based on two concatenated mitochondrial genes
(COI-CytB).
Geographical regions
Sample size (n)
Tajima’s D Fs de Fu τ (SD95%) SSD (P-value) r (P-value)
COI-CytB
Pooled 159 0.445 -23.799* 56.2 (5.30 – 89.24) 0.0268 (p = 0.08) 0.0041 (p = 0.98)
Atlantic Forest 50 -1.920* -25.224* 6.4 (4.25- 7.48) 0.0016 (p = 0.66) 0.0136 (p = 0.55)
Chaco 10 -1.253 -4.883* 6.0 (2.81 – 7.01) 0.0325 (p =0.12) 0.0563 (p = 0.34)
Cerrado 37 0.858 -18.632* 57.5 (3.66 – 79.53) 0.0394 (p = 0.09) 0.0160 (p = 0.80)
Amazon Forest 24 0.805 -7.198* 58.7 (3.98 – 196.99) 0.0363 (p = 0.10) 0.0419 (p = 0.26)
Caatinga 38 -0.067 -19.748* 7.3 (5.36 - 11.13) 0.0199 (p = 0.03*) 0.0071 (p = 0.84)
Lineage N 57 -1.779** -24.741** 10.0 (7.25 - 11.03) 0.0112 (p = 0.04*) 0.0145 (p = 0.17)
Lineage S 102 -2.271** -25.120** 6.5 (4.50 - 7.27) 0.0033 (p = 0.11) 0.0144 (p = 0.20)
Lineage were previously defined by mitochondrial network. τ = Expansion parameter; SSD = Sum of Squared Deviation; r = Harpending’s
Raggedness Index.

30
The expansion of populations in the Amazon Forest, Chaco, Caatinga,
Cerrado and Atlantic Forest occurred within the last 500 years, corresponding to a
recent expansion during the Quaternary according to the Bayesian skyline plot
analysis (Fig. 3). The Chaco and Atlantic Forest populations remained stable during
the past 100 years, while the Caatinga and Cerrado populations are still expanding.
According to the effective population size (Ne), the Atlantic Forest population is the
largest, followed by the Caatinga. The Cerrado, Amazon Forest and Chaco
populations have similar sizes, but the Cerrado population is still expanding very
rapidly, while the Chaco is expanding slowly and the Amazon is now contracting (Fig.
3).
Figure 3. Bayesian skyline plot (BSP) showing population size dynamics for
Euschistus heros in five biomes. The y-axis indicates effective population size
(Ne) scaled by mutation rate (µ) as a function of time. Black horizontal line shows
median BSP estimate, and gray area shows upper and lower 95% highest posterior
density limits.
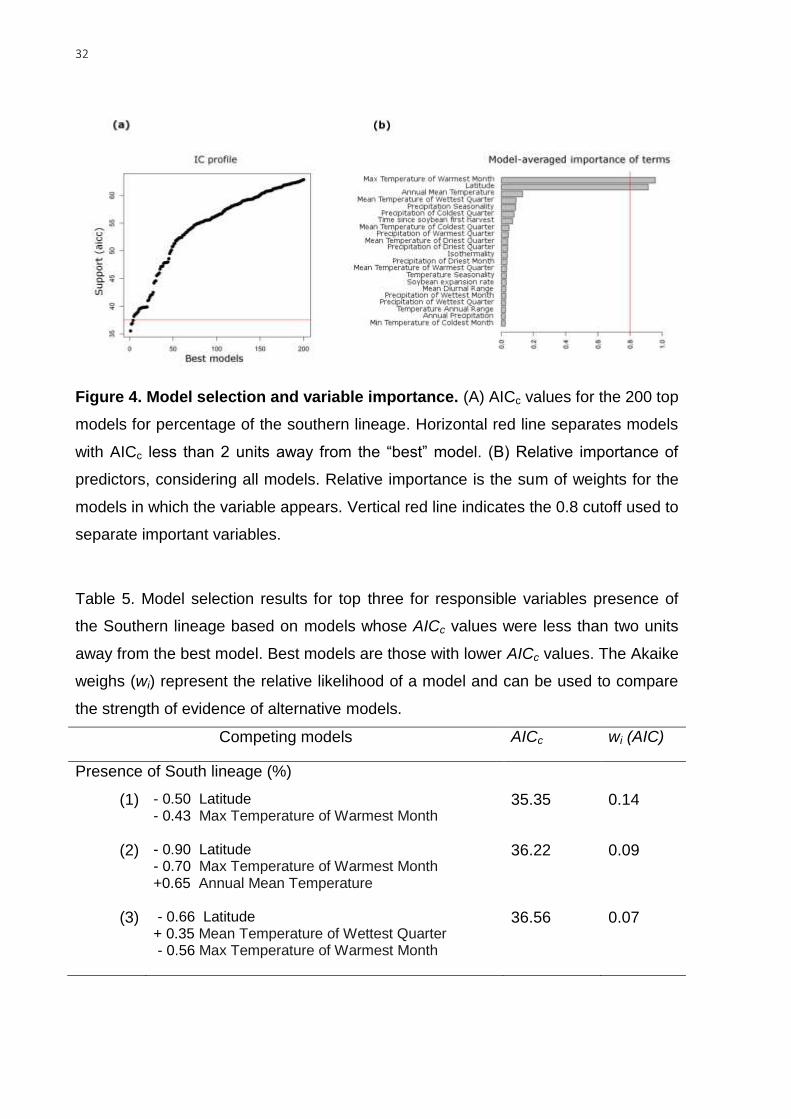
Environmental features and soybean expansion modelling the current
mitochondrial lineage distribution. Three models passed the cutoff (i.e. models
that were less than 2 units away from the “best” model) to explain the presence (%)

31
of the southern lineage at a given location (i.e. the probability of finding an individual
from the southern lineage). The best predictors were the “max temperature of the
warmest month”, “latitude”, and the “annual mean temperature” (Fig. 4 and Table 5).
The most important variables were the “max temperature of the warmest month” and
“latitude”, which received the highest score in all top models. The model performance
improved when the “annual mean temperature” was excluded, i.e. AICc (36.22 and
35.35) and wi (0.09 and 0.14) (Table 5). The best selected model (AICc = 35.35) was
22.29 units away from the null model (AICc = 57.64). The variable “latitude” (0.50)
was more important than the “max temperature of warmest month” (0.43) in the best
model according to the z-scored beta (null deviance=18 on 18 d.f., residual
deviance=4.04 on 16 d.f.) (Table 5). Latitude (0.9) was also the most important
variable in the second-best model compared to the “max temperature of the warmest
month” (0.7) and the “annual mean temperature” (0.65) (null deviance 18 on 18 d.f.,
residual deviance= 3.469 on 15 d.f.) and in the third-best model (0.66) compared to
“mean temperature of wettest quarter” (0.35) and “max temperature of the warmest
month” (0.56) (null deviance 18 on 18 d.f., residual deviance= 3.531 on 15 d.f.). None
of the three best model included soybean variables. The two soybean variables,
“time since soybean first harvest” and “soybean expansion rate”, ranked 7th and 16th
in overall importance. The “time since soybean first harvest” was strong correlated
with the “latitude” (r = 0.90, d.f. = 17, P = 0.000), “max temperature of the warmest
month” (r = 0.61, d.f. = 17, P = 0.005), and the “annual mean temperature” (r = 0.76,
d.f. = 17, P = 0.000).
32
Figure 4. Model selection and variable importance. (A) AICc values for the 200 top
models for percentage of the southern lineage. Horizontal red line separates models
with AICc less than 2 units away from the “best” model. (B) Relative importance of
predictors, considering all models. Relative importance is the sum of weights for the
models in which the variable appears. Vertical red line indicates the 0.8 cutoff used to
separate important variables.
Table 5. Model selection results for top three for responsible variables presence of
the Southern lineage based on models whose AICc values were less than two units
away from the best model. Best models are those with lower AICc values. The Akaike
weighs (wi) represent the relative likelihood of a model and can be used to compare
the strength of evidence of alternative models.
Competing models AICc wi (AIC)
Presence of South lineage (%)
(1) - 0.50 Latitude - 0.43 Max Temperature of Warmest Month
35.35 0.14
(2) - 0.90 Latitude - 0.70 Max Temperature of Warmest Month +0.65 Annual Mean Temperature
36.22 0.09
(3) - 0.66 Latitude + 0.35 Mean Temperature of Wettest Quarter - 0.56 Max Temperature of Warmest Month
36.56 0.07

33
4. DISCUSSION
Our results revealed two deep divergent lineages of E. heros in South
America. The two COI-Cytb haplotype groups are separated by 52 mutational steps
and have an estimated genetic distance of 4.2% (K2P). Even though the number of
mutation steps separating the two E. heros lineages is exceptionally high, raising the
question of the possible presence of cryptic species, the genetic distance is still
within the intraspecific range found in beetles, moths and true bugs 35,36,37,38.
Furthermore, the sharing of ITS1 alleles, the presence of admixture lineages in
laboratory and the morphological examination support the hypothesis of a single
species that encompasses the two divergent lineages.
The two E. heros lineages are geographically separated from one another,
with one clade clustering the northernmost populations (i.e. northern and
northeastern regions), and a second clade clustering the southernmost populations
(i.e. southern and southeastern regions). Both mitochondrial lineages expanded to
form a mixed zone upon secondary contact in the central and southwestern regions.
It is not clear when the reunion occurred, but the formerly isolated populations seem
to have come into contact before reproductive isolation was complete 39,40. A related
point to consider is that all but one of the northern haplotypes found in the Cerrado
(CW) were phylogenetically grouped together in one clade, indicating a subgroup
differentiation. The central-western (CW) subgroup likely occupied the region much
earlier than the southern lineage arrived and before the first soybean fields were
established. This is strong evidence against the hypothesis that the E. heros
expansion was purely associated with the expansion of soybean cultivation during
the 1970s.
The divergence time of the two main clades is estimated as occurring during
the Pliocene (i.e. 4.5 Myr). This divergence seems to be associated with a cooling
and drying of the global environment, which caused the separation of the Amazon
Forest from the southern part of the Atlantic Forest and the consequent expansion of
grasslands and savannas 41. Temperature cycles were also associated with more
recent diversification events during the Pleistocene (i.e. differentiation of the CW
group). Deep sequence divergence dating to the Pliocene is also reported for other
organisms in the Neotropics 42,43, and phylogeographic structure has been found in
amphibians in the Atlantic Forest 3, reptiles in the Cerrado 44, and plants 4,45.

34
Spatial genetic structuring by biomes was also found among subpopulations of
E. heros. Separation into the Amazon Forest, Caatinga, Cerrado, Atlantic Forest and
Chaco biomes seems to be the best way to explain the genetic variance
hierarchically. Thus, separating insects by biomes can help us to understand the
pattern of lineage mixing, diversity and demographic history. The haplotype diversity
of E. heros was high and similar among biomes and lineages. This pattern is the
result of the high number of private haplotypes found in E. heros populations in all
biomes. The higher nucleotide diversity of lineage N compared to lineage S can be
explained under the ‘historic climate’ stability models, where a stable environment
such as Amazon Forest can offer conditions for a population to persist, resulting in
elevated intraspecific genetic diversity 46,47. Unstable regions, on the other hand,
would be associated with recent or multiple-event colonization, resulting in lower
intraspecific genetic diversity and signatures of expansion 4. Therefore, the northern
biomes (Amazon Forest and Caatinga) was the most stable environment, while the
Atlantic Forest was the least stable environment. Another consideration is that
lineage S is associated with areas that have undergone intense transformation due to
agricultural practices, and has experienced population dynamics linked with farming
cycles and control tactics.
Although E. heros’ limited dispersal capacity likely helped to preserve the
pattern formed during the late Tertiary and Quaternary as an outcome of the climatic
changes, the last 100 years were an important turning point for E. heros populations
(i.e. soybean introduction and expansion of farming starting at the end of the 19th
century). It is plausible that farming and trade routes have increased the admixture
process in certain areas, especially the Cerrado and the connecting areas, even
though there are still large areas where the two lineages have not yet encountered
each other, showing that the pattern is still well preserved.
Recent signals of expansion were detected for E. heros lineages and in all
biomes sampled. The inferences regarding population growth were supported by the
neutrality tests, the unimodal mismatch distribution and the demographic expansion
parameters (τ). Spatial expansion is also occurring, given that no significant
Raggedness values were found. Apart from differences in test sensitivity, the lack of
full agreement between tests for E. heros in each biome might be an indication of a
more complex scenario. Multiple processes affecting local diversity and the noise
from human intervention causing population reduction, population subdivision,

35
bottlenecks, and facilitation of dispersal resulting in the secondary contact might
affect the precise demographic estimations for a species 48,49,50.
We also conducted a Bayesian Skyline analysis to test the hypothesis of
recent expansion in all biomes and to determine how the effective sizes of the
populations behaved over time. The period of E. heros population growth in all areas
overlaps with the period of intense changes caused by the increase of urban
occupation and agriculture area in South America 51. It may be that the resulting habit
loss not only did not affect E. heros populations negatively, but rather was been
advantageous. One possible hypothesis to explain the success of E. heros is shifting
hosts from natural areas to agricultural fields, especially soybeans but also cotton
and bean fields 31. A second hypothesis would be the occurrence of a latitudinal cline
for one or more traits 52,53,54. The species association with environmental gradients
should also be considered, given possible differences in traits and adaptions such as
reproductive diapause 27,55,56.
We used environmental and soybean variables to make phylogeographic
inferences to predict the predominance of lineage S over lineage N at a given
location. Selected models had similar AICc scores and considerably reduced
numbers of variables, down to 4 for the percentage of lineage S models. The two
most important variables were the maximum temperature of warmest month and
latitude. Temperature is known to affect this species as well as the photoperiod,
which might induce quiescence behavior and other possible differences in
physiological responses. Latitude on the other hand, can be correlated with
geographic distance, environmental gradients, and agricultural gradients, as in the
case of the soybean expansion. Our data support the predictions of the latitudinal-
gradient hypothesis, even though distinct demographic scenarios can be expected at
different times of E. heros' evolutionary history. The time since soybean first harvest
correlates with latitude and other bioclimatic variables, which likely decreased the
importance of this variable in the model.
The reunion of the two long-separated lineages might bring unforeseen
consequences for one of the largest soybean-producing regions in the world. The two
lineages are united again in central Brazil, where an agricultural revolution started in
the 1970s and continues today, pushing soybean fields northward 57. It is possible
that the northern and southern populations of E. heros are exchanging adaptations in
admixture zones. However, knowledge of the differences between both lineages is

36
limited, because their presence was unknown until this point 58,59. The changing
status of E. heros from a secondary to a primary pest in soybean crops and the
reasons for this are poorly understood. In recent years, the increase of population
densities in soybean fields, the shorter quiescence period, larger host range (i.e.
damage in cotton crops) and pesticide tolerance/resistance have been frequently
reported in E. heros populations 30,31,60. These concerns increase in a scenario of GM
soybean introduction, no-till management, and expansion to hotspot diversity areas.

37
5. MATERIAL AND METHODS
5.1. Sample collection and DNA extraction
One hundred fifty-nine specimens of E. heros were collected between
12/2015 and 07/2016 from 21 different localities across five South American biomes.
Twenty sampling sites were in Brazil and one site in Paraguay. Specimens were
collected as adults, from the canopy of soybeans, using a beating cloth under the
plants. Individuals were preserved in ethanol (> 95%) at –20°C until laboratory
manipulation after which the remaining tissue from all specimens was stored at –
80°C. DNA was extracted from the head tissue of an adult specimen using the CTAB
modified protocol 61.
5.2. PCR amplification and DNA sequencing
Fragments of two mitochondrial and one nuclear region were amplified by
polymerase chain reaction (PCR), using specific mitochondrial primers developed for
this project and ITS1 primers previously developed 62. The Cytochrome c Oxidase
Subunit 1 (COI) fragment was amplified using the forward primer (5'-
GTGGCTGATGTGAAGTATGCTC-3') and the reverse primer (5'-
ACCGCACATGCATTTGTAATAA-3'), and the Cytochrome b (Cytb) fragment was
amplified using the forward primer (5'-GGATATGTTTTACCTTGAGGACA-3') and the
reverse primer (5'-GGAATTGATCGTAAGATTGCGTA-3'). To amplify the ITS1
rnDNA region (18S partial – ITS1 complete – 5.8S partial) we used the forward
primer CAS18SF1 (5'- TACACACCGCCCGTCGTACTA-3') and the reverse primer
CAS5p8sB1d (5'- ATGTGCGTTCRAAATGTCGATGTTCA-3'). The PCR reactions
were performed in a total volume of 25 μL containing 80 ng total DNA, 1.5 mM/μL
MgCl2, 0.1 mM/μL dNTPs, 0.4 pmol/μL of each primer, 1 U of Taq DNA Polymerase
(Synapse Inc.) and Buffer (10X Taq DNA Buffer). PCR cycles consisted of
denaturation at 95°C for 3 min, followed by 35 cycles with denaturation at 95°C for 30
s, annealing at 54°C for 40 s, polymerization at 72°C for 1.5 min and final extension
at 72°C for 10 min. Subsequently, the PCR products were separated on agarose gel
(1.5% w/v) and observed under ultraviolet light. The amplicons were purified using
0.33 μL EXO I, 0.33 μL FastAp and 0.34 μL of ultra-pure water together with 10 μL of

38
each PCR product, held at 37°C for 30 min, then at 80°C for 15 min. The PCR
product Sanger sequencing was performed by the Animal Biotechnology Laboratory
at ESALQ, University of São Paulo.
5.3. Assembly of sequence datasets
All sequences were aligned and edited manually using the software
Sequencher 4.0.1 (Gene Codes Corp., Ann Harbor, MI, USA). To eliminate missing
data, sequences were interrupted at 607 bp for the COI gene, 386 bp for the Cytb
gene and 638 bp (18S partial – 52 bp; ITS1 complete – 416 bp; 5.8S partial – 170
bp) for the ITS1 region. There were no insertions or deletions in the sequences
obtained. All sequences (datasets) obtained in this study will be deposited in NCBI-
GenBank (https://www.ncbi.nlm.nih.gov/genbank/).
The presence of nuclear paralogs of mitochondrial origin (termed numts) 63
was inspected in the mitochondrial gene fragments, using the software MEGA v.5.2
64. Three signatures of numts were searched: (i) indels that introduce frameshifts, (ii)
out-of-place inframe stop codons that lead to premature termination of protein
translation, and (iii) lack of codon position substitution bias toward the 3rd position,
that lead to a higher rate of non-synonymous mutations. The presence of signatures
(i) and (ii) is enough to consider a given sequence a numt. No numts were detected
in the COI or CtyB sequences; therefore, we included all mitochondrial sequences in
our analysis. The posterior analyses were performed using concatenated
mitochondrial genes (COI-Cytb).
5.4. Genealogical inferences
The genealogical relationships between haplotypes of the mitochondrial and
ITS1 regions were reconstructed by a network of median-joining haplotypes, using
the PopArt software 65. Preliminary analysis revealed two putative mitochondrial
lineages associated with E. heros populations in Brazil and Paraguay. The genetic
distance (D) between the two mitochondrial lineages was inferred by dividing the
haplotypes in two groups and calculating the 2-parameter Kimura method (K2P) in
MEGA v.5.2 software 64.

39
5.5. Diversity statistics
The diversity analysis was performed by dividing individuals into two groups
according to the mitochondrial lineages, or into five groups according to the biome to
which the individuals belonged: Amazon Forest, Cerrado, Caatinga, Atlantic Forest,
and Chaco. Number of haplotypes, haplotype diversity (h), nucleotide diversity (π),
and the mean number of nucleotide differences (S) were estimated using the DNAsp
v.5 66.
5.6. Divergence dating
We estimated the relative age of divergence between the two mitochondrial
lineages using the Bayesian relaxed phylogenetic approach implemented in BEAST
v.1.8.4 67, based on the combined mitochondrial genes. The substitution model was
determined using the software PARTITIONFINDER version 1.1.1. 68 that selected the
GTR+G+I model. A strict molecular-clock model to estimate the substitution rate and
coalescent tree priors set to the constant size model were implemented. We used the
insect molecular clock (mean = 0.0177, SD = 0.001) 69 that corresponds to 3.54%
pairwise divergence per Myr. Three independent runs were performed for 150 million
generations, sampling every 1000 steps and discarding 20% as burn-in. TRACER
v.1.6 was used to determine convergence, measure the effective sample size (ESS),
and calculate the mean and 95% highest posterior density interval (HPD) for
divergence times. Effective sample size (ESS) for all parameters exceeded 200, and
the three runs converged to similar distributions. Runs were then combined with
LogCombiner v.1.4.7 67.
5.7. Population Structure
Variance Analysis (AMOVA) was performed in Arlequin with parametric
bootstrap (1000 replicates) using a 5% significance level 70. The analyses were
conducted to examine the presence of genetic structure among individuals,
considering all sites sampled (non-hierarchical), among populations according to the
sampled location (populations) and among biomes in three hierarchical levels.

40
5.8. Demographic statistics inferred for mitochondrial data
Tajima's D and Fu's Fs neutrality tests were calculated using Arlequin v.3.5 70.
Both tests used 1,000 permutations using coalescing simulations. Fu’s Fs statistic
was considered significant at the 95% confidence level when the P-value was less
than 0.02. For each biome, we also estimated tau (τ) with its 95% confidence
intervals, using a generalized least-squares approach and 1,000 coalescent
simulations in Arlequin v. 3.5. The parameter τ denotes the age of the expansion (t),
so that t = τ/2u; u = μLg 71. The parameter μ represents the estimated mutation rate, L
is the length of the sequence, and g is the generation time. For E. heros, we did not
estimate t directly, because the number of generations per year cannot be estimated
straightforwardly. Thus, if we assume that the estimated mutation rate has not
changed in E. heros (substitution rate = 1.345%), then u will be a constant and we
can consider that a smaller value of τ is an indicator of a newly established
population, and a larger value of τ of an older one.
We conducted a mismatch distribution analysis using a spatial expansion
model. The sum of square of deviations (SSD), raggedness index (r) statistics, and
their associated P-value were calculated using Arlequin v.3.5. A nonsignificant SSD
value means that the hypothesis of population expansion cannot be rejected, and a
nonsignificant raggedness index indicates a good fit of the data to the spatial
expansion model. We also used a Bayesian Skyline Plot (BSP) in Beast to
reconstruct the demographic history, using TRACER v.1.6, based on the COI-Cytb
data using 10 groups. We used the same substitution model and molecular-clock
model that were used to estimate the divergence time.
5.9. Environmental features and soybean expansion modelling the current
mitochondrial lineage distribution
We used a model selection approach to identify and select variables that could
be influencing the presence of a lineage at a given location 72,73. Therefore, our
response variable was the proportion of the southern lineage S calculated at each
location as a percentage of the total composition. As predictor variables, we used the
“latitude”, 19 WorldClim variables based on all pixels of a CFR at 30 arc-second
image 74, and two soybean variables. The soybean variables consisted of the

41
estimation of the time since the first harvest and the yield increase rate of soybean
production, given cultivated area. We used linear regression to compile data from
different sources and to estimate the two soybean variables using the regression
slope and the predicted year when the cultivated area was 100 hectares
(Supplementary Table S1 and Fig. S1) 57,75,76.
We evaluated the fit and plausibility of possible candidate models using glmulti
77. We used a selection considering only the main effect, keeping the 200 best
models. The criterion for selection was the corrected Akaike Information Criterion
(AICc) 78. We selected models with AICc less than two units away from the best
model. We also evaluated the Akaike weight of the best models, to assess the
probability that the model is the best 79. All variables were standardized by z-score,
and the significance of each predictor was assessed by a GLM. We also assessed
the importance of each variable by summing the Akaike weight for the models in
which the variable appeared. Variables that appear many times in the top models,
tend to be more important. We used the cutoff of 0.8 to separate the most important
variables under the weight criterion 72,73.

42

43
6. CONCLUSION
Data reveals two E. heros lineages in South America, which are deeply
divergent and geographically separated;
Euschistus heros populations are hyperdiversed and structured by biomes;
Latitude, Max Temperature of Warmest Month, Annual Mean Temperature,
Annual Mean Temperature, and Mean Temperature of Wettest Quarter are the
variables that best explain the geographical distribution of the lineages in South
America.

44

45
REFERENCES
1. Mittermeier, R. A. et al. Hotspots Revisited: Earth’s biologically richest and most
endangered terrestrial ecoregions. Washington. Cemex 1, 392 (2005).
2. Myers, N., Mittermeier, R. A., Mittermeier, C. G., da Fonseca, G. A. B. & Kent, J.
Biodiversity hotspots for conservation priorities. Nature 403, 853-858 (2000).
3. Thomé, M. T. C. et al. Phylogeography of endemic toads and post-pliocene
persistence of the Brazilian Atlantic Forest. Molecular Phylogenetics and Evolution
55, 1018-1031 (2010).
4. Werneck, F. P. The diversification of eastern South American open vegetation
biomes: Historical biogeography and perspectives. Quaternary Science Reviews
30, 1630-1648 (2011).
5. Haffer, J. Speciation in Amazonian forest birds. Science 165, 131-137 (1969).
6. Bennett, K. D. & Provan, J. What do we mean by ‘refugia’? Quaternary Science
Reviews 27, 2449-2455 (2008).
7. Hewitt, G. M. The genetic legacy of the Quaternary ice ages. Nature 405, 907-913
(2000).
8. Carnaval, A. C. & Moritz, C. Historical climate modeling predicts patterns of
current biodiversity in the Brazilian Atlantic forest. Journal of Biogeography 35,
1187-1201 (2008).
9. Leite, Y. L. R. et al. Neotropical forest expansion during the last glacial period
challenges refuge hypothesis. PNAS 113, 1008-1013 (2016).
10. Costa, L. The historical bridge between the Amazon and the Atlantic Forest of
Brazil: a study of molecular phylogeography with small mammals. Journal of
Biogeography 30, 71-86 (2003).
11. Brieger, F. G. Contribuição à fitogeografia do Brasil com referência especial as
orquídeas. Anais do XX Congresso Nacional de Botânica, 41-44 (1969).
12. Moojen, J. Speciation in the Brazilian Spiny Rats (Genus Proechimys, Family
Echimyidae). University of Kansas Publications, Museum of Natural History 1,
301-406 (1948).
13. Mori, S. A., Boom, B. M. & Prance, G. T. Distributional patterns and conservation
of eastern Brazilian coastal forest tree species. Brittonia 33, 233-245 (1981).
14. Por, D. F. Sooretama, the Atlantic rain forest of Brazil. SPB Academic Publishing,
(1992).

46
15. Schiesari, L., Waichman, A., Brock, T., Adams, C. & Grillitsch, B. Pesticide use
and biodiversity conservation in the Amazonian agricultural frontier. Philosophical
Transactions Royal Society B 368, 20120378 (2013).
16. Tabarelli, M., Da Silva, J. M. C. & Gascon, C. Forest fragmentation, synergisms
and the impoverishment of neotropical forests. Biodiversity & Conservation 13,
1419-1425 (2004).
17. Paterniani, E. & Malavolta, E. La conquista del ‘cerrado’ en el Brasil. Victoria de la
investigación científica. Interciencia 24, 173-181 (1999).
18. Klink, C.A. De Grão em Grão: O Cerrado Perde Espaço. Brasilia, Brazil: World
Wide Fund for Nature (WWF-Brasil): 66 (1995).
19. Klink, C. A., Macedo, R. H. & Mueller, C. C. Cerrado: Processo de ocupação e
implicações para a conservação e utilização da sua diversidade biológica. Brasilia,
Brazil: World Wide Fund for Nature (WWF-Brasil): 104 (1994).
20. Spehar, C. R. Impact of strategic genes in soybean on agricultural development in
the Brazilian tropical savannahs. Field Crops Research 1, 141-146 (1995).
21. Klink, C. A., Moreira, A. G. & Solbrig, O. T. Ecological impacts of agricultural
development in the Brazilian Cerrados. The World’s savannas: Economic driving
forces, ecological constraints and policy options for sustainable land in the
Biosphere 12, (eds Young, M. D. & Solbrig O. T.) 259–283 (Parthenon Publishing,
London. 1993).
22. Fearnside, P. M. Soybean cultivation as a threat to the environment in Brazil.
Environmental Conservation 28, 23-38 (2001).
23. Brazilian Institute of Geography and Statistics - IBGE.
http://www.ibge.gov.br/home/ (2017).
24. Panizzi, A. R. Growing problems with stink bugs (Hemiptera: Heteroptera:
Pentatomidae): species invasive to the US and potential neotropical invaders.
American Entomologist 61, 223-233 (2015).
25. Panizzi, A. R. & Slansky Jr, F. Review of phytophagous pentatomids (Hemiptera:
Pentatomidae) associated with soybean in the Americas. Florida Entomologist 68,
184-214 (1985).
26. Aldrich, J. R. Dispersal of the southern green stink bug, Nezara viridula (L.)
(Heteroptera: Pentatomidae), by hurricane Hugo. Proceedings of the
Entomological Society of Washington 92, 757-759 (1990).

47
27. Mourão, A. P. M. & Panizzi, A. R. Photophase influence on the reproductive
diapause, seasonal morphs, and feeding activity of Euschistus heros (Fabr., 1798)
(Hemiptera: Pentatomidae). Brazilian Journal of Biology 62, 231-238 (2002).
28. Link, D. & Grazia, J. Pentatomídeos da região central do Rio Grande do Sul
(Heteroptera). Anais da Sociedade Entomológica do Brasil 16, 115-129 (1987).
29. Panizzi, A. R. Stink bugs on soybean in northeastern Brazil and a new record on
the southern green stink bug, Nezara viridula (L.) (Heteroptera: Pentatomidae).
Neotropical Entomology 31, 331-332 (2002).
30. Soria, M. F. Degrande, P. E. & Panizzi, A. R. Algodoeiro invadido. Revista Cultivar
131, 18-20 (2010).
31. Smaniotto, L. F. & Panizzi, A. R. Interactions of selected species of stink bugs
(Hemiptera: Heteroptera: Pentatomidae) from leguminous crops with plants in the
Neotropics. Florida Entomologist 98, 7-17 (2015).
32. Rolston, L. H. Revision of the genus Euschistus in Middle America (Hemiptera,
Pentatomidae, Pentatomini). Revisión del género Euschistus en Centroamérica
(Hemiptera, Pentatomidae, Pentatomini). Entomologica Americana 48, 1-102
(1974).
33. Panizzi, A. R. et al. Insetos da soja no Brasil. EMBRAPA Soja - Boletim de
Pesquisa e Desenvolvimento (INFOTECA-E) (1977).
34. Saluso, A., Xavier, L., Silva, F. A. C. & Panizzi, A. R. An invasive pentatomid pest
in Argentina: Neotropical brown stink bug, Euschistus heros (F.) (Hemiptera:
Pentatomidae). Neotropical Entomology 40, 704-705 (2011).
35. Brown, J. M., Pellmyr, O., Thompson, J. N. & Harrison, R. G. Phylogeny of Greya
(Lepidoptera: Prodoxidae), based on nucleotide sequence variation in
mitochondrial cytochrome oxidase I and II: congruence with morphological data.
Molecular Biology and Evolution 11, 128-141 (1994).
36. Langor, D. W. & Sperling, F. A. H. Mitochondrial DNA sequence divergence in
weevils of the Pissodes strobi species complex (Coleoptera: Curculionidae). Insect
Molecular Biology 6, 255-265 (1997).
37. Park, D. S., Foottit, R., Maw, E. & Hebert, P. D. Barcoding bugs: DNA-based
identification of the true bugs (Insecta: Hemiptera: Heteroptera). PLoS One 6,
e18749 (2011).

48
38. Raupach, M. J. et al. Building-up of a DNA barcode library for true bugs (Insecta:
Hemiptera: Heteroptera) of Germany reveals taxonomic uncertainties and
surprises. PLoS One 9, e106940 (2014).
39. Coyne, J. A. & Orr, H. A. Speciation. Sinauer, (Sunderland, MA, 2004).
40. Sedghifar, A., Brandvain, Y. & Ralph, P. Beyond clines: lineages and haplotype
blocks in hybrid zones. Molecular Ecology 25, 2559-2576 (2016).
41. Haywood, A. M., & Valdes, P. J. Vegetation cover in a warmer world simulated
using a dynamic global vegetation model for the Mid-Pliocene. Palaeogeography,
Palaeoclimatology, Palaeoecology 237, 412-427 (2006).
42. Bermingham, E. & Martin, A. P. Comparative mtDNA phylogeography of
neotropical freshwater fishes: testing shared history to infer the evolutionary
landscape of lower Central America. Molecular Ecology 7, 499-517 (1998).
43. Da Silva, M. N. F. & Patton, J. L. Molecular phylogeography and the evolution and
conservation of Amazonian mammals. Molecular Ecology 7, 475-486 (1998).
44. Santos, M. G., Nogueira, C., Giugliano, L. G. & Colli, G. R. Landscape evolution
and phylogeography of Micrablepharus atticolus (Squamata, Gymnophthalmidae),
an endemic lizard of the Brazilian Cerrado. Journal of Biogeography 41, 1506-
1519 (2014).
45. Garcia, M. G. et al. Molecular evidence of cryptic speciation, historical range
expansion, and recent intraspecific hybridization in the Neotropical seasonal forest
tree Cedrela fissilis (Meliaceae). Molecular Phylogenetics and Evolution 61, 639-
649 (2011).
46. Carnaval, A. C. & Moritz, C. Historical climate modelling predicts patterns of
current biodiversity in the Brazilian Atlantic forest. Journal of Biogeography 35,
1187-1201 (2008).
47. Carnaval, A. C., Hickerson, M. J., Haddad, C. F., Rodrigues, M. T. & Moritz, C.
Stability predicts genetic diversity in the Brazilian Atlantic forest hotspot. Science
323, 785-789 (2009).
48. Bremer, J. R. A., Viñas, J., Mejuto, J., Ely, B. & Pla, C. Comparative
phylogeography of Atlantic bluefin tuna and swordfish: the combined effects of
vicariance, secondary contact, introgression, and population expansion on the
regional phylogenies of two highly migratory pelagic fishes. Molecular
Phylogenetics and Evolution 36, 169-187 (2005).

49
49. Marí-Mena, N., Lopez-Vaamonde, C., Naveira, H., Auger-Rozenberg, M. A. & Vila,
M. Phylogeography of the Spanish moon moth Graellsia isabellae (Lepidoptera:
Saturniidae). BMC Evolutionary Biology 16, 139 (2016).
50. Corrêa, A. S., Vinson, C. C., Braga, L. S., Guedes, R. N. C. & de Oliveira, L. O.
Ancient origin and recent range expansion of the maize weevil Sitophilus zeamais,
and its genealogical relationship to the rice weevil S. oryzae. Bulletin of
Entomological Research 107, 9-20 (2017).
51. Laurance, W. F., Sayer, J. & Cassman, K. G. Agricultural expansion and its
impacts on tropical nature. Trends in Ecology & Evolution 29, 107-116 (2014).
52. Tyukmaeva, V. I., Salminen, T. S., Kankare, M., Knott, K. E. & Hoikkala, A.
Adaptation to a seasonally varying environment: a strong latitudinal cline in
reproductive diapause combined with high gene flow in Drosophila montana.
Ecology and Evolution 1, 160-168 (2011).
53. Hut, R. A., Paolucci, S., Dor, R., Kyriacou, C. P. & Daan, S. Latitudinal clines: an
evolutionary view on biological rhythms. Proceedings of the Royal Society of
London B: Biological Sciences 280, 20130433 (2013).
54. Paolucci, S., Zande, L. & Beukeboom, L. W. Adaptive latitudinal cline of
photoperiodic diapause induction in the parasitoid Nasonia vitripennis in Europe.
Journal of Evolutionary Biology 26, 705-718 (2013).
55. Ruberson, J. R., Yeargan, K. V. & Newton, B. L. Variation in diapause responses
between geographic populations of the predator Geocoris punctipes (Heteroptera:
Geocoridae). Annals of the Entomological Society of America 94, 116-122 (2001).
56. Pegoraro, M. et al. Geographical analysis of diapause inducibility in European
Drosophila melanogaster populations. Journal of Insect Physiology 98, 238-244
(2017).
57. Companhia Nacional de Abastecimento - CONAB. Séries Históricas de Área
Plantada, Produtividade e Produção, Relativas às Safras 1976/77 a 2015/16 de
soja http://www.conab.gov.br/conteudos.php?a=1252 (2017).
58. Lombaert, E. et al. A. Bridgehead effect in the worldwide invasion of the biocontrol
harlequin ladybird. PloS one 5, e9743 (2010).
59. Rius, M. & Darling, J. A. How important is intraspecific genetic admixture to the
success of colonising populations? Trends in Ecology & Evolution 29, 233-242
(2014).

50
60. Sosa-Gómez, D. R. et al. Insecticide susceptibility of Euschistus heros
(Heteroptera: Pentatomidae) in Brazil. Journal of Economic Entomology 102,
1209-1216 (2009).
61. Clark, T. L., Meinke, L. J. & Foster, J.E. Molecular phylogeny of Diabrotica beetles
(Coleoptera: Chrysomelidae) inferred from analysis of combined mitochondrial and
nuclear DNA sequences. Insect Molecular Biology 10, 303-314 (2001).
62. Ji, Y. J., Zhang, D’X. & He, L. J. Evolutionary conservation and versatility of a new
set of primers for amplifying the ribosomal internal transcribed spacer regions in
insects and other invertebrates. Molecular Ecology Resources 3, 581-585 (2003).
63. Lopez, J. V., Yuhki, N., Masuda, R., Modi, W. & O’Brien, S. J. Numt, a recent
transfer and tandem amplification of mitochondrial DNA to the nuclear genome of
the domestic cat. Journal of Molecular Evolution 39, 174-190 (1994).
64. Tamura, K. et al. MEGA5: molecular evolutionary genetics analysis using
maximum likelihood, evolutionary distance and maximum parsimony methods.
Molecular Biology and Evolution 28, 2731-2739 (2011).
65. Leigh, J. W. & Bryant, D. POPART: full‐feature software for haplotype network
construction. Methods in Ecology and Evolution 6, 1110-1116 (2015).
66. Librado, P. & Rozas, J. DnaSP v5: a software for comprehensive analysis of DNA
polymorphism data. Bioinformatics 25, 1451-1452 (2009).
67. Drummond, A. J. & Rambaut, A. BEAST: Bayesian evolutionary analysis by
sampling trees. BMC Evolutionary Biology 7, 214 (2007).
68. Lanfear, R., Calcott, B., Ho, S. Y. & Guindon, S. PartitionFinder: combined
selection of partitioning schemes and substitution models for phylogenetic
analyses. Molecular Biology and Evolution 29, 1695-1701 (2012).
69. Papadopoulou, A., Anastasiou, I. & Vogler, A. P. Revisiting the insect
mitochondrial molecular clock: the mid-Aegean trench calibration. Molecular
Biology and Evolution 27, 1659-1672 (2010).
70. Excoffier, L. & Lischer, H. E. L. Arlequin suite ver 3.5: a new series of programs to
perform population genetics analyses under Linux and Windows. Molecular
Ecology Resources 10, 564-567 (2010).
71. Rogers, A. R. & Harpending, H. Population growth makes waves in the distribution
of pairwise genetic differences. Molecular Biology & Evolution 9, 552-569 (1992).
72. Anderson, D. R. Information Theory and Entropy. Model Based Inference in the
Life Sciences: A Primer on Evidence, 51-82 (2008).

51
73. Burnham, K. P. & Anderson, D. R. Model selection and multimodel inference: a
practical information-theoretic approach. Springer Science & Business Media
(2003).
74. Hijmans, R. J., Cameron, S. E., Parra, J. L., Jones, P. G. & Jarvis, A. Very high
resolution interpolated climate surfaces for global land areas. International Journal
of Climatology 25, 1965-1978 (2005).
75. Conceição, A. O. A expansão da soja no Rio Grande do Sul 1975-75.
(Dissertation). Porto Alegre. Universidade Federal do Rio Grande do Sul. FEE
(1986).
76. Pissinato, B. A cultura de cana-de-açúcar no Estado de São Paulo entre 1950 e
2010: evolução histórica da área e da produtividade. (Dissertation) Universidade
de São Paulo (2013).
77. Calcagno, V. & de Mazancourt, C. glmulti: an R package for easy automated
model selection with (generalized) linear models. Journal of Statistical Software
34, 1-29 (2010).
78. Johnson, J. B. & Omland, K. S. Model selection in ecology and evolution. Trends
in Ecology & Evolution 19, 101-108 (2004).
Wagenmakers, E. J. & Farrell, S. AIC model selection using Akaike weights.
Psychonomic Bulletin & Review 11, 192-196 (2004).

52

53
APPENDIXES
Figure. S1 – Median-joining network and geographic distribution of Euschistus
heros nuclear ITS1 haplotypes in South America. (A) Network of 124 nuclear
ITS1 region sequences. Size of haplotype circles reflects sample size and number of
mutation steps is shown as hatch marks. (B) Geographic distributions of the ITS
haplotypes. Circles represent the proportion of each haplotype.

54
Figure S2 - Soybean expansion rate. Year as a function of soybean cultivated area
(x 1000ha) in eleven states in Brazil.

55
Table S1 - Summary of regression Analysis for soybean area expansion in Brazil.
Year as function of cultivated area.
Location β Str.error t-value P AdjR2 Predict
year†
MT 161.73* 10.22 15.82 P<0.001 0.83 1974 MS 40.18* 3.22 12.48 P<0.001 0.79 1963 GO 73.62* 2.95 24.92 P<0.001 0.93 1975 BA 27.21* 1.52 17.85 P<0.001 0.87 1973 PI 23.93* 2.21 10.82 P<0.001 0.82 1993
MG 25.87* 0.96 26.94 P<0.001 0.93 1969 SP 12.88* 1.07 11.98 P<0.001 0.73 1954 PR 92.37* 825 22.27 P<0.001 0.90 1963 RS 72.94* 6.14 11.87 P<0.001 0.71 1948 RO 7.26* 0.70 10.35 P<0.001 0.79 1991 PA 17.84* 2.65 6.72 P<0.001 0.71 2000

56
Table S2 - Environmental variables used as predictors based on WorldClim.
Variables Description
BIO1 = Annual Mean Temperature
BIO2 = Mean Diurnal Range (Mean of monthly (max temp - min temp))
BIO3 = Isothermality (BIO2/BIO7) (* 100)
BIO4 = Temperature Seasonality (standard deviation *100)
BIO5 = Max Temperature of Warmest Month
BIO6 = Min Temperature of Coldest Month
BIO7 = Temperature Annual Range (BIO5-BIO6)
BIO8 = Mean Temperature of Wettest Quarter
BIO9 = Mean Temperature of Driest Quarter
BIO10 = Mean Temperature of Warmest Quarter
BIO11 = Mean Temperature of Coldest Quarter
BIO12 = Annual Precipitation
BIO13 = Precipitation of Wettest Month
BIO14 = Precipitation of Driest Month
BIO15 = Precipitation Seasonality (Coefficient of Variation)
BIO16 = Precipitation of Wettest Quarter
BIO17 = Precipitation of Driest Quarter
BIO18 = Precipitation of Warmest Quarter
BIO19 = Precipitation of Coldest Quarter