university of pune - project report
TRANSCRIPT
Energy Saving Algorithm for TV based onDistraction Detection approach
Swapna PhadRishiraj Randive
April 2011

Contents
1 Introduction 21.1 Electricity in India . . . . . . . . . . . . . . . . . . . . . . . . . . . 3
1.1.1 Electricity and Television . . . . . . . . . . . . . . . . . . . . 41.2 Literature Survey . . . . . . . . . . . . . . . . . . . . . . . . . . . . 61.3 Comparative Analysis . . . . . . . . . . . . . . . . . . . . . . . . . 71.4 Motivation . . . . . . . . . . . . . . . . . . . . . . . . . . . . . . . . 8
2 Project Block Diagram and Explanation 92.1 System Explaination . . . . . . . . . . . . . . . . . . . . . . . . . . 92.2 Proposed Approach . . . . . . . . . . . . . . . . . . . . . . . . . . . 13
2.2.1 Webcam and Video to Frame Converter . . . . . . . . . . . 142.2.2 Facial Feature Extraction and Processing . . . . . . . . . . . 142.2.3 Brightness Control of TV . . . . . . . . . . . . . . . . . . . 15
3 Analysis of Setup 173.1 Issues and Modifications . . . . . . . . . . . . . . . . . . . . . . . . 173.2 Database . . . . . . . . . . . . . . . . . . . . . . . . . . . . . . . . . 18
4 Result Analysis 194.1 Experiments . . . . . . . . . . . . . . . . . . . . . . . . . . . . . . . 194.2 Conclusion . . . . . . . . . . . . . . . . . . . . . . . . . . . . . . . . 24
5 Future Scope 26
I

List of Figures
1.1 Electricity Generation in India[6]. It indicates that Coal(non-renewableenergy source) accounts for over 52% of India’s electricity production 3
1.2 Energy Consumption and Generation.It shows that energy con-sumption is increasing as compared to energy generation. . . . . . . 4
2.1 General Schematic Diagram Explaining the Working Approach [16] 92.2 Different Considerations of mouth. It shows the maximum width,
maximum height and the height between top lip and bottom lip.Depending on their values, we decide whether the viewer is talkingor yawning . . . . . . . . . . . . . . . . . . . . . . . . . . . . . . . . 11
2.3 General Block Diagram showing the flow of our system . . . . . . . 122.4 Flowchart for the Process with Different Considerations, indicating
conditions to keep TV in ON position and conditions to turn off theTV. . . . . . . . . . . . . . . . . . . . . . . . . . . . . . . . . . . . 13
2.5 Block Diagram showing Modulewise Working . . . . . . . . . . . . . 142.6 14 bits of RC-5 protocol . . . . . . . . . . . . . . . . . . . . . . . . 162.7 General logic levels used to represent bit 1 and o . . . . . . . . . . . 16
4.1 Pie chart showing different things people do while watching TV. Itshows that most of the people eat while watching TV . . . . . . . . 21
4.2 Correct result for open and close eyes . . . . . . . . . . . . . . . . . 224.3 Wrong result due to violation of assumption . . . . . . . . . . . . . 224.4 Wrong result for close and partially open eyes . . . . . . . . . . . . 234.5 Results for Eye Open/Close Algorithm. Horizontal line shown in
the Bar graph is the Threshold which decides whether the Eyes areOpen or Close. . . . . . . . . . . . . . . . . . . . . . . . . . . . . . 23
4.6 Correct result for open and close eyes . . . . . . . . . . . . . . . . . 244.7 Wrong results . . . . . . . . . . . . . . . . . . . . . . . . . . . . . . 24
II

List of Tables
1.1 Table showing power consumption of different TV’s . . . . . . . . . 5
4.1 Result of face detection algorithm. It shows that accuracy is highestfor one viewer and least for more than 5 . . . . . . . . . . . . . . . 19
4.2 Result for blinking rate and distraction time . . . . . . . . . . . . . 20
III

Acknowledgements
It is our great pleasure in expressing our sincere and deep gratitude towards ourguide Dr. Sanjay Patil, for his insightful suggestions, constant inspiration andvaluable guidance which has led to successful completion of this project.
We would also like to thank Ms. Dhanashree Gawali, Project co-ordinator forextending her help by her suggestion that helped us focus on our objective. Wegot great support from our Lab assistant Mrs. Pradnya Bodakhe and Maske kaka.
Finally we are thankful to all the staff and non staff members of Electronics andTelecommunication Department for providing the opportunity and resources towork on this project.
IV

Abstract
Number of devices (such as, mobiles, television, computers, music systems) anindividual is using are on rise. It is possible to reduce the power consumed bya device by monitoring and controlling the device. This project presents a novelapproach on reducing the power consumed by entertainment devices, when theseare not being used. Although the research project can be applied to both typesof entertainment devices - audio-visual (television, and computers) as well as onlyaudio (music systems), current work focusses on reporting results for television.Our system on the basis of orientation and distraction of the viewer will decidethe brightness and contrast of the television either same or reduce. This in-turnwill reduce the power consumption of the device. The algorithm blocks consists ofidentifying the presence of a viewer, his/her focus on watching the current program,and then decision making sub-block to reduce the brightness and contrast, if thetelevision goes unviewed for a stipulated time duration. Accuracy of each sub-block is reported for identifying the presence of viewer, experiments indicate anaccuracy of 83.33% for one viewer, and 59.16% for viewers between 2 to 5, and15.38% for more than 5 viewers. Thus system is most accurate for one person andleast for more than 5 person. We transcripted the videos on the basis of whichwe decided the distraction threshold to be 5 seconds. The experiment which wasconducted using GUI provided us a evidence that people do some other task whilewatching TV and are not 100% focused. This confirms that our system is viable.The features which we have considered for deciding the distraction level of theviewer are: eyes, mouth, eyebrows and head orientation. But now we have donethe experiments only with the eyes and provided the results for the same. We havesucceded in declaring the result as to whether the eyes are open or close, hencecan give a judgement whether person is intereseted in program. Further our workwill consider the remaining features one by one and carry out the experiments onthese features.
1

Chapter 1
Introduction
The energy required by a household equipment is on a increase, as the use ofpower hungry devices is on rise. The current research focusses on reducing energyconsumption by the entertainment device.
Televisions, which are typical electronic appliances in the home, can achieve energysaving by reducing the brightness of the screen. However, unless the user adjustsit, the TV maintains the same brightness. So it is not an effective and efficientapproach. Furthermore, we often tend to watch TV while doing other activitiessuch as using a computer or reading a book. This means that when we do some-thing else, we often do not look at the TV. This tendency wastes electricity. Tosolve this problem, we propose an “Energy-Saving TV System.”
This system on the basis of orientation and distraction of the viewer will decide thebrightness and contrast of the television either same or reduce. This in-turn willreduce the power consumption of the device. The algorithm identifies the presenceof a viewer, his/her focus on watching the current program, and then decides toreduce the brightness and contrast, if the television goes unviewed for a stipulatedtime duration.Next section presents the current situation of energy-saving appliances and thevarious ways by which we can reduce energy consumption of Television.
2

Fig. 1.1: Electricity Generation in India[6]. It indicates that Coal(non-renewableenergy source) accounts for over 52% of India’s electricity production
1.1 Electricity in India
India is world’s 6th largest energy consumer, accounting for 3.4% of global energyconsumption. Due to India’s economic rise, the demand for energy has grown at anaverage of 3.6 % per annum over the past 30 years.[6] In June 2010, the installedpower generation capacity of India stood at 162,366 MW[1] while the per capitaenergy consumption stood at 612 kWH. The country’s annual energy productionincreased from about 190 billion KWH in 1986 to more than 680 billion KWH in[2]2006. The Indian government has set an ambitious target to add approximately78,000 MW of installed generation capacity by [3]2012. The total demand for elec-tricity in India is expected to cross 950,000 MW by [4]2030. In 2004-05, electricitydemand outstripped supply by 7-11%. Due to shortage of electricity, power cutsare common throughout India which in turn has adversely affected the country’seconomic growth. Despite many measures taken by Government, there are stillpower cuts in rural areas for more than 6 to 8 hours. From the figure 1.1 it is clearthat most of the Electricity generation in India is from Coal and then from Hydroelectric power plants. As per figure 1.1, Coal accounts for over 52% of India’selectricity production, but it is a non-renewable energy source thus affecting theenvironment. Even with more coal being mined, people still are using more energythan can be produced. Figure 1.2 shows the graph of energy consumption andgeneration in India. It is clearly understood that consumption is increasing day
3
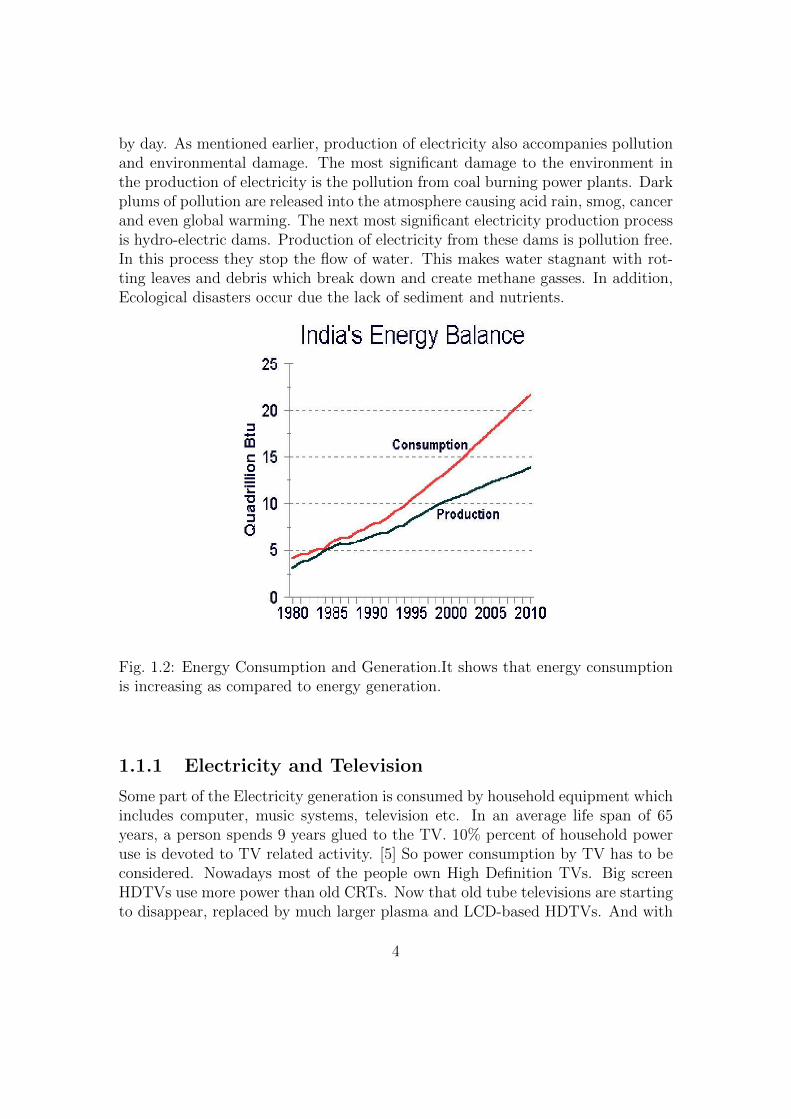
by day. As mentioned earlier, production of electricity also accompanies pollutionand environmental damage. The most significant damage to the environment inthe production of electricity is the pollution from coal burning power plants. Darkplums of pollution are released into the atmosphere causing acid rain, smog, cancerand even global warming. The next most significant electricity production processis hydro-electric dams. Production of electricity from these dams is pollution free.In this process they stop the flow of water. This makes water stagnant with rot-ting leaves and debris which break down and create methane gasses. In addition,Ecological disasters occur due the lack of sediment and nutrients.
Fig. 1.2: Energy Consumption and Generation.It shows that energy consumptionis increasing as compared to energy generation.
1.1.1 Electricity and Television
Some part of the Electricity generation is consumed by household equipment whichincludes computer, music systems, television etc. In an average life span of 65years, a person spends 9 years glued to the TV. 10% percent of household poweruse is devoted to TV related activity. [5] So power consumption by TV has to beconsidered. Nowadays most of the people own High Definition TVs. Big screenHDTVs use more power than old CRTs. Now that old tube televisions are startingto disappear, replaced by much larger plasma and LCD-based HDTVs. And with
4

the increasing popularity of TV based entertainment options, such as video gameconsoles, digital video recorders, and streaming on demand video devices, moreand more electricity is being spent on TV related activity. Those devices use quitea bit of power, but typically the biggest energy consumer in our entertainmentcenter is the TV itself.The power used by an active television is determined by three factors:
1. Screen size
2. Technology type (plasma or LCD)
3. Picture brightness (which nearly always depends on user-selected picturesettings).
Now one-by-one we will elaborate these factors:
� Screen size: Bigger TV uses more power. A 32-inch LCD uses about halfas much power as a 52-inch LCD. Almost all TVs comes with the powerratings written on them.
� Technology type: Plasma TV uses more power than LCD TVs. PlasmaTV consume, on an average, roughly two to three times more electricity toproduce an image of the same brightness as LCD. The table below showsaverage power consumption by HDTVs with different technology. It can beseen Plasma consumes more power than other two. But people refer PlasmaTVs as the picture quality is much better than others. LCD (LED) consumesleast power.
TV Technology Power ConsumptionPlasma 301 WattsLCD (standard) 111 WattsLCD (LED) 101 Watts
Table 1.1: Table showing power consumption of different TV’s
� Picture settings: Brighter pictures consumes more power, and since lightoutput is primarily a function of the picture settings available on all TVs,this is the one factor that any user can control regardless of television. Ourapproach will regulate picture settings to reduce power consumption of TV.Reducing the light output of TV we can cut power usage by as much ashalf, and as long as you don’t overdo it, but enjoy excellent picture quality.The principal settings that matter are contrast (“picture”) and backlight(or “cell light” on Samsung plasmas). Both directly controls light output.Nearly every TV has a contrast control, but the backlight control is availableonly in latest models of LCD. In LCDs with both backlight and contrastcontrols, backlight is the main determinant of light output and power use.
5
Counterintuitively, the brightness control has less of an impact on TVs lightoutput than the other two settings do.A couple of Sony models, such as the KDL-EX700 series have a “presencesensor” that automatically turns off the picture, and eventually the TV itself,when you leave the room. Also, TVs have provision like turn off picture andlisten only audio. So there has been taken some steps in this field to savethe energy.
1.2 Literature Survey
In this section we will disscuss about the issues related to face detection and whatthe literaure referred for this project.Human face detection problem has received significant attention during the pastseveral years because of wide range of commercial and law enforcement applica-tions. Face detection is a computer technology that determines the locations andsizes of human faces in arbitrary (digital) images. It detects facial features andignores anything else, such as buildings, trees and bodies. Face detection can beregarded as a more general case of face localization. In face localization, the taskis to find the location and size of a known number of faces (usually one). In recentyears, research based on pattern recognition methods have been proposed to detecthuman faces in still images and videos. Many Human face detection techniquesare developed. Some of them are based on:
� Neural networks [7, 8]
� Support vectormachines [9, 10]
� Hidden Markov models [11, 12]
� Fisherspace/subspace linear discriminant analysis (LDA) [13]
� Principle component analysis (PCA) [14] and
� Bayesian or maximum-likelihood (ML) classification methods [8].
These approaches range from very simple algorithms to composite high levelapproaches. Rowley et al.[7] presented a neural-network based upright frontal facedetection system using a bootstrap algorithm. Sung and Poggio [8] described adistribution-based modeling of face and non-face patterns using a multilayer per-ceptron (MLP) classifier. They developed a successful example-based learningsystem for detecting vertical frontal views of human faces in complex scenes. Os-una et al. [9] demonstrated a decomposition algorithm to train support vectormachines for frontal human face detection in images over large database. Guoet al. [10] proposed a binary tree structure for recognizing human faces after ex-tracting features and learning the discrimination functions via SVMs. Uzunov et
6
al. [15] described an adequate feature extraction method in a face detection sys-tem. The optimal atomic decompositions are selected from various dictionariesof anisotropic wavelet packets using the adaptive boosting algorithm (AdaBoost).Their method demonstrated a fast learning process with high detection accuracy.Early face-detection algorithms focused on the detection of frontal human faces,whereas newer algorithms attempt to solve the more general and difficult problemof multi-view face detection, That is, the detection of faces that are either rotatedalong the axis from the face to the observer (in-plane rotation), or rotated alongthe vertical or left-right axis (out-of-plane rotation), or both. The newer algo-rithms take into account the variations in the image or video by factors such asface appearance, lighting, and pose. Since 2002, face Detection can be performedfairly reliably such as with OpenCV’s Face Detector, working approximately at90-95% of clear photos of a person looking forward at the camera. It is usuallyharder to detect a person’s face when they are viewed from the side or at an angle,and sometimes this requires 3D Head Pose Estimation. It can also be very difficultto detect a person’s face in cases like the photo is not very bright, some part ofthe face is brighter, the image is blurred or the viewer is wearing glasses. Thereare some issues with face detection like illumination, background, pose angle andocclusion.
1.3 Comparative Analysis
While proceeding with our work, we came across a paper which was extactly simi-lar to our project. After analysing the paper, we came to know that our approachis different from theirs. In the following line the paper which was similar to oursis being described. Ryo Ariizumi et al proposed an “Energy-Saving TV System”[16] based on the recognition of user’s faces.We compare these two projects and explain how the two are different from eachother. Our project uses different programming languages like VB.net and matlabwhereas to develop the prototype of their system, face detection program OpenCVwas used. This was the first difference between the two.Second difference is that they have focussed only on the direction of the viewer’sface. Their system recognizes the face direction of the TV user and when the useris not looking at the TV, the system will reduce the brightness automatically. Onthe other hand, when the system detects user’s attention to the TV, the brightnesswill increase. On the other hand our project focusses on reducing the brightnessof the TV on the basis of the distraction of the viewer.
7

1.4 Motivation� At times power devices remain ON unnecessarily.
� Power consumed by Entertainment Devices (Televisions and computers) canbe reduced by controlling the brightness.
� Viewers are not focussed 100% while watching TV.
In this section we will describe the work related to this project. Our ultimateaim is to reduce the brightness so that the power consumed by entertainmentdevices is significantly reduced. To achieve this, we have divided our task in parts.We focussed on one part at a time and aiming for the desired output. Once thedesired output from every module is available then we will try to merge them alland see the output.Modulewise explanation is given in the next chapter.
8

Chapter 2
Project Block Diagram andExplanation
2.1 System Explaination
The in general working scenario of the system is as shown in the pictorial repre-sentation of real life application. The viewer may vary from 1 to 5 or even morethan 5 in some conditions.
Fig. 2.1: General Schematic Diagram Explaining the Working Approach [16]
Television’s power consumption can be reduced by observing the viewer andusing face detection to know whether viewer is interested or not. People whilewatching TV, do some other work also, like reading newspapers, eating, using cellphones etc. Therefore we first have to identify that whether the person sitting
9

infront of TV is interested in watching TV or is distracted. Like if the person isfor some time engaged in activity other than program viewing the TV brightnesscan be lowered. Hence, we first need to detect the face.Now here is the need to explain the difference between distraction and interest asfar as our approach is concerned. A person is said to be distracted if his/her interestis evoked in some activity other than the one he/she is working on. The reasonbehind distraction may be external (mobile is ringing, ringing of doorbell) or theviewer from within (sleepy or thinking of something else) is disturbed/distracted.Now comes the interest part which can be defined as the degree of involvement ofa person in a particular task. While defining interest we have started with someassumptions like constant intensity of light, the person who is watching the TVis in normal sitting position facing the camera, allowed head rotation: -30 to 30degrees of in-plane rotation, -10 to 10 degrees out-of-plane rotation, the person isnot wearing glasses.
For detecting the interest (involvement) of the viewer, we have taken into ac-count some features which will directly or indirectly help us to meet the desiredgoal.
Features are:
1. Eye
2. Mouth
3. Eyebrow
4. Head orientation
Eyes movement can give a variety of information such as fixation, saccade, eyemovement (height and width), blinking frequency, pupil diameter, gaze directionand rotation. Fixation is maintaining a visual gaze at one location. Fixationaleye movement contributes to maintaining visibility by stimulating neurons in theearly areas of the brain continuously. Human will usually alternate fixation andsaccade. Saccade is when eyes move in a quick phase. The frequency of an emittedsignal changes in a very fast shift. Both eyes are moving in the same directionquickly and simultaneously.In human science and psychology studies, it has proved that mouth movement isa good indicator of a humans state of mind. Mouth movement can show a dif-ferent type of body language. Rongben has monitored the relationship betweenmouth movement and driver fatigue or distraction using a camera. Normally themouth is hardly open when the driver is alert. The maximum width (W(max))and maximum height (H(max)) can indicate different levels of distraction. Theheight (H(m)) between top lip and the bottom lip varies greatly when one is talk-ing, yawning or even thinking.
10

Fig. 2.2: Different Considerations of mouth. It shows the maximum width, max-imum height and the height between top lip and bottom lip. Depending on theirvalues, we decide whether the viewer is talking or yawning
Now keeping in mind the above mentioned assumptions we will list out theconditions which we have considered as to whether the viewer is interested or not.
� EYE
Interested if:
– Blinkrate is normal.
Not interested if:
– Blinkrate drops down as compared to the normal rate.
– The eyes are closed for a predefined threshold.
� MOUTH
Interested if:
– The mouth is in normal position i.e; mouth opening is constant.
Not interested if:
– The blinking rate is increased as compared to the normal position (talk-ing).
– The mouth opening is taking place periodically for a particular duration(yawning).
� HEAD ORIENTATIONInterested if:
– Frontal faced
– Blinking rate within specified range.
11

Not interested if:
– Head tilted/rotated beyond specified threshold.
Below is the block diagram showing general process of the system.
Fig. 2.3: General Block Diagram showing the flow of our system
From the above block diagram we see that the video from the camera is givento the face detection block. It detects the number of viewers sitting in front of theTV. Then the proceeding blocks will decide whether the viewers are distracted orinterested. And on the basis of distraction detection we adjust the picture settingsof the TV.
On basis of discussion till now the total process can be representation in thefigure 2.4. The Face detection algorithm includes boundary detection for face andthen deciding whether distracted or not. If there can be more than one personwatching TV, then algorithm will check for all viewers being distracted for morethan 20 minutes to turn off the TV. Thus, ensuring energy saving.
12

Fig. 2.4: Flowchart for the Process with Different Considerations, indicating con-ditions to keep TV in ON position and conditions to turn off the TV.
2.2 Proposed Approach
Previous section dealt with the general description of our project. Currently, wehave divided our task in several parts and dealing with one at time. So we will
13

now explain it step by step. Module-wise working can be better understood byreferring the block diagram shown in figure 2.5.
Fig. 2.5: Block Diagram showing Modulewise Working
2.2.1 Webcam and Video to Frame Converter
Webcam takes video of the person sitting in front. Video specification are asfollows:
� Resolution: 640 X 480 (VGA)� Video format: .wmv� Video device: Sony visual communication camera.� Audio device: Microphone (Realtek high defination)� Video bit rate: 1024 kbps� Video frame rate: 15 frames/second� Audio bit rate: 128 kbps
Video from the webcam is given to the video to frame converter which providesframe of .jpg format. Specifications of video to frame converter are:
� Ouptut size: Original size� Output rate: Adjustable
2.2.2 Facial Feature Extraction and Processing
We provide frames to the FaceSDK open source software which gives facial fea-ture co-ordinates. With the help of these co-ordinates eye and mouth regionsare cropped. Using morphlogical processing on cropped image we have decidedwhether the eyes and mouth are open or close. At present the distraction is decidedon the basis of eyes only. And as far as mouth is concerned we are just declaringwhether it is open/close. If the eyes are closed for some predefined threshold thenaccording to the flowchart shown in figure 2.4 we say that the viewer is distracted.And if the person remains distracted for some stipulated time then we decreasethe brightness of TV. Even after adjusting the picture setting if the person is stilldistracted then timer check is carried out and if it exceeds 15 minutes then oursystem switches it off.
14

2.2.3 Brightness Control of TV
This section introduces the two main user adjustments of a video monitor, bright-ness and contrast. We will explain the effect of these controls on picture repro-duction and how to set them. This applies to computer monitors, studio videomonitors, and television receivers.Unfortunately, the labels brightness and contrast are misleading with respect totheir functions: The control called brightness mainly affects reproduced contrast,and the control called contrast ideally affects only brightness. The misleading la-bels have led to a great deal of confusion about how to set up a monitor for goodreproduction.The brightness control, more properly called Black level, adds or subtracts an off-set, or bias, into the red, green, and blue signals. This control should be adjusted sothat black picture content displays as true black on your monitor. Misadjustmentof this control is the most common problem of poor quality picture reproduction oncomputer monitors, video monitors, and television sets. Later in this section, wewill explain how to set this control properly. The setting is somewhat dependentupon ambient light. Modern display equipment is sufficiently stable that frequentadjustment is unnecessary.The contrast control, preferably called picture, applies a scale factor (gain) to thered, green, and blue signals. It affects the luminance (proportional to intensity)that is reproduced for a full white input signal. Once brightness is set correctly,contrast should be set for comfortable viewing brightness.LCD displays have controls labeled brightness and contrast, but these controlshave different functions than the like-named controls of a CRT display. In LCD,the brightness control typically alters the backlight luminance, thereby effectingcontrol over what in a CRT would be adjusted by contrast. The remainder of thissection applies just to CRTs.
Monitor adjustment: A monitor is properly adjusted when it meets two con-ditions. First, a black input signal - in desktop computing, RGB code [0, 0, 0]- should produce true black, so as to maximize the contrast ratio of the display.Second, a white input signal - in desktop computing, RGB code [255, 255, 255] -should produce the desired luminance.The easiest way to adjust a monitor is to perform the following four steps insequence:
� Turn the contrast control to minimum.
� Display a black picture.
� Adjust the brightness control to reproduce black correctly.
� Adjust the contrast control to display the brightness level that is desired.
15
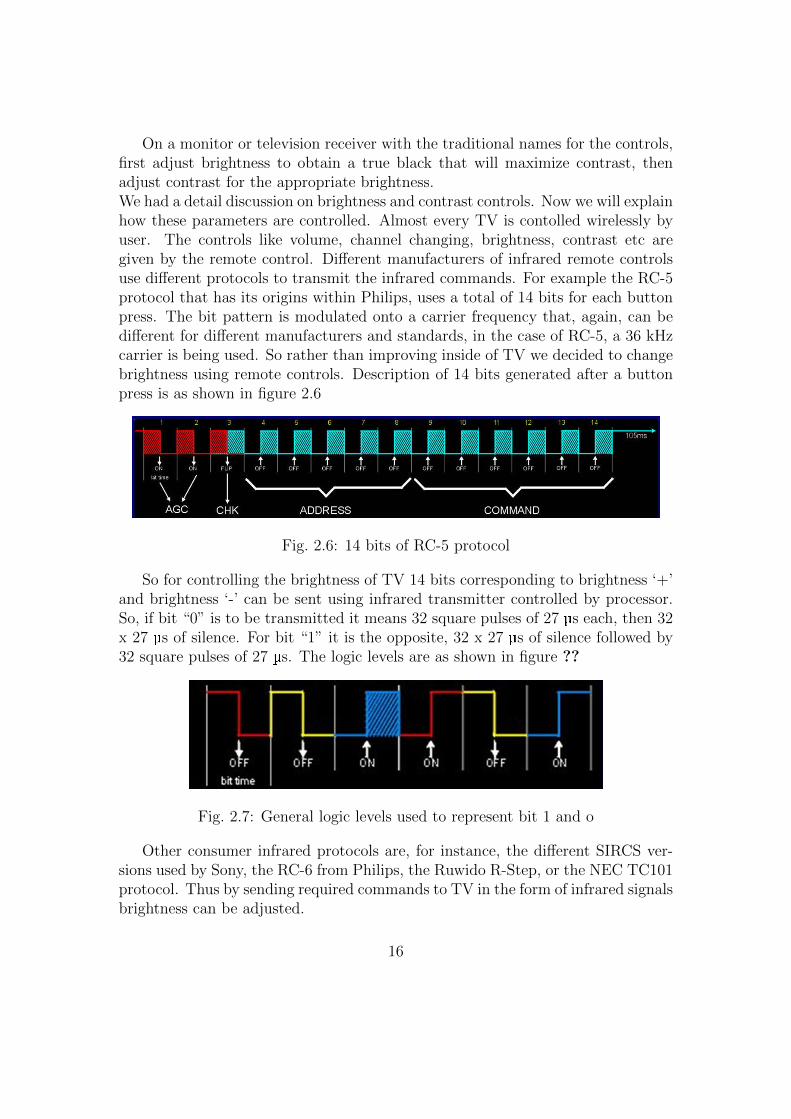
On a monitor or television receiver with the traditional names for the controls,first adjust brightness to obtain a true black that will maximize contrast, thenadjust contrast for the appropriate brightness.We had a detail discussion on brightness and contrast controls. Now we will explainhow these parameters are controlled. Almost every TV is contolled wirelessly byuser. The controls like volume, channel changing, brightness, contrast etc aregiven by the remote control. Different manufacturers of infrared remote controlsuse different protocols to transmit the infrared commands. For example the RC-5protocol that has its origins within Philips, uses a total of 14 bits for each buttonpress. The bit pattern is modulated onto a carrier frequency that, again, can bedifferent for different manufacturers and standards, in the case of RC-5, a 36 kHzcarrier is being used. So rather than improving inside of TV we decided to changebrightness using remote controls. Description of 14 bits generated after a buttonpress is as shown in figure 2.6
Fig. 2.6: 14 bits of RC-5 protocol
So for controlling the brightness of TV 14 bits corresponding to brightness ‘+’and brightness ‘-’ can be sent using infrared transmitter controlled by processor.So, if bit “0” is to be transmitted it means 32 square pulses of 27 µs each, then 32x 27 µs of silence. For bit “1” it is the opposite, 32 x 27 µs of silence followed by32 square pulses of 27 µs. The logic levels are as shown in figure ??
Fig. 2.7: General logic levels used to represent bit 1 and o
Other consumer infrared protocols are, for instance, the different SIRCS ver-sions used by Sony, the RC-6 from Philips, the Ruwido R-Step, or the NEC TC101protocol. Thus by sending required commands to TV in the form of infrared signalsbrightness can be adjusted.
16

Chapter 3
Analysis of Setup
This section includes the various problems which took place while proceeding withthe project.So now we will list out the various issues followed by the modifications.
3.1 Issues and Modifications
� First we had decided to use OpenCV but as our main aim is to make deci-sion about the viewer’s distraction so we used FaceSDK. It is a open sourcesoftware. We used its Facial feature detection code in VB .NET which wasproviding the facial features.
� To detect distraction we needed features which VB .NET was providing usbut the decision whether the eyes are open or close cannot be decided asit was locating the eyeballs even if the eyes were closed. So to make thedecision we shifted to matlab where we were able to use image processingtools.
� While deciding whether the mouth is open or close we faced a problem whichwill be explained in the following lines.Using the co-ordinates which were provided by VB .NET we tried to cropthe mouth region in matlab. To crop the mouth region we have to specifythe width as well as height for the cropping window.If the person is opening or closing the mouth it is obivious that the croppingwindow’s height should also change according to the state of mouth. But tochange the height of the cropping window according to the state of mouthwas little bit difficult.If we try to keep the window height maximum (height when the mouth isfully open) then we get the unwanted information when the mouth is closed
17

which is not suitable for the algorithm which we are using for detectingmouth open/close. So in future our one of the work will be to overcome thisproblem.
For the analysis of the project and to back the conclusion made, the algorithmwas evaluated on database.
3.2 Database
� Collected and tested images with varying number of faces.We collected some images from internet and some we already had. We havetested 60 photos with number of faces varying from 1 to 5 in it with theFaceSDK software and accuracy of the face detection algorithm was calcu-lated.
� Videos of people watching different kind of programs.People who were watching these programs were our classmates. These videoshelped us to understand the general gestures of people while watching TVlike the decreased blinking rate when watching something interesting.
� GUI using Matlab was developed which included general questions aboutTV viewing habits.This database was collected in college itself. This survey helped us to under-stand the general behaviour of people while watching TV like eating, talkingor doing something on mobile etc.
� Videos for detecting eye open or close.This database was collected under constant conditions like the face of vieweris not moving which mean that the person sitting in front was told to look atthe camera and the light intensity was also constant. The people were askedto sit at the same place. This implies that the environment was same for all.Spectacles wearing people were not considered. The video consisted only theface part. We took this database to test our eye open/close algorithm.
Using the database explained above we carried out some experiments and anal-ysed the results to make our approach correct and more realistic.
18

Chapter 4
Result Analysis
This section includes the experiments conducted and the corresponding results.
4.1 Experiments
� Using the database consisting of varying number of faces in the images, wecalculated the accuracy of our face detection algorithm. The result of thisexperiment is shown below in the tabular form:
Numberof faces inphoto
Total photos tested Accuracy(%)
1 60 83.332 60 73.333 60 58.334 60 56.665 60 48.33More than 51 65 15.38
Table 4.1: Result of face detection algorithm. It shows that accuracy is highestfor one viewer and least for more than 5
The first face identification sub-block has an accuracy of 83.33% for oneviewer, and 59.16% for viewers between 2 to 5, and 15.38% for more than 5viewers. It can be observed from the result table that accuracy is highest forone person and least for more than 5.
19

� In the second database we showed different kind of programs to the viewerso that we get different facial expressions. These expressions vary accordingto the viewer as to whether that part of program is interesting or not forthat particular subject.We noted down the distraction time and the blinking rate of the viewer.Distraction time was noted so that after analysing it we can decide thethreshold. This threshold is nothing but the distraction threshold i.e; afterexceeding this threshold we say that the person is distracted. For the resultrefer table 4.2.
Clip no 001 Rate ofblinking
Time of distrac-tion
Total no.of dis-traction
Type ofa clipshown
1st person to left 4 [00:44 - 00:47] 10 Movie[1:22 - 1:27][2:56 - 3:00][3:10 - 3:44(Phone)][4:20 - 4:24][4:41 - 4:44][6:32 - 6:39][7:10 - 7:17][7:19 - 7:30(Yawn)]
Table 4.2: Result for blinking rate and distraction time
� GUI using Matlab was generated to see what the people usually do whilewatching TV. Around 40 students were asked to answer the questions inGUI . The Pie-chart in figure 4.1 shows the result of this survey.
From the pie-chart it is clear that most of the people eat while watching TV.Other categories are also shown but the one which is prominent is eatingwhile watching TV. These observations make it clear that most of the peopleare not fully concentrated on TV. As for example eating requires movementof head or eyes or even sometimes you have to get up and go to the kitchento bring something.
20
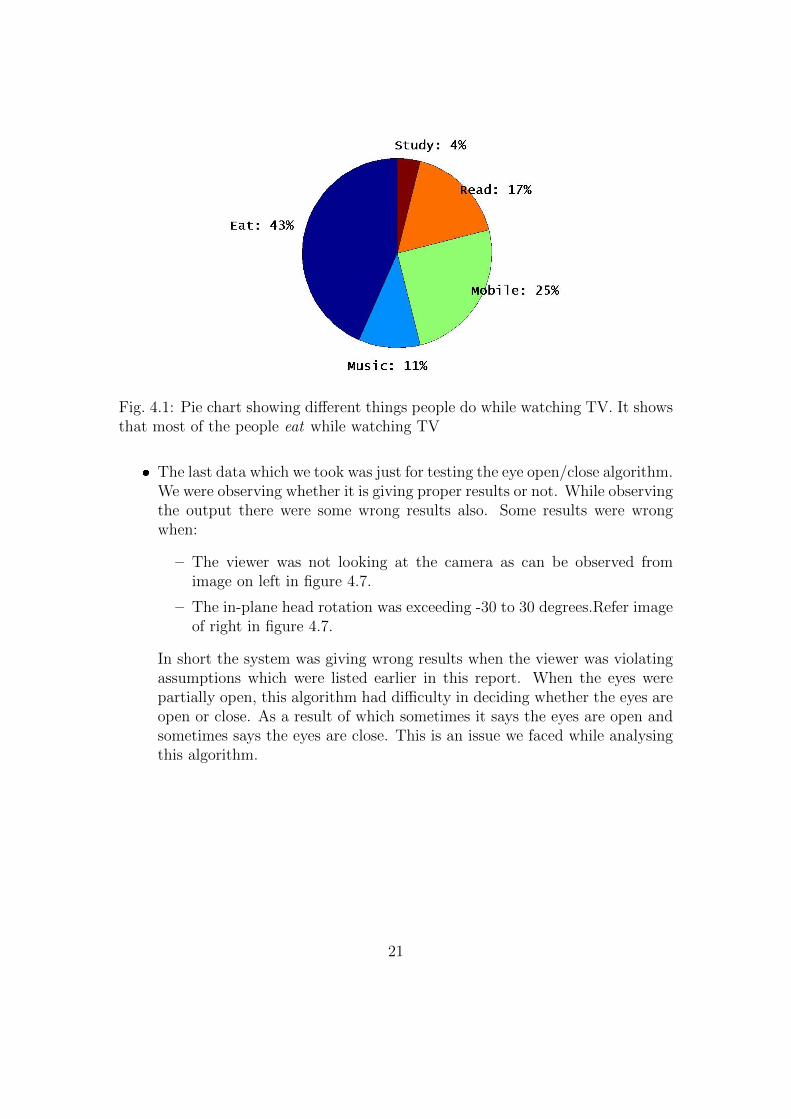
Fig. 4.1: Pie chart showing different things people do while watching TV. It showsthat most of the people eat while watching TV
� The last data which we took was just for testing the eye open/close algorithm.We were observing whether it is giving proper results or not. While observingthe output there were some wrong results also. Some results were wrongwhen:
– The viewer was not looking at the camera as can be observed fromimage on left in figure 4.7.
– The in-plane head rotation was exceeding -30 to 30 degrees.Refer imageof right in figure 4.7.
In short the system was giving wrong results when the viewer was violatingassumptions which were listed earlier in this report. When the eyes werepartially open, this algorithm had difficulty in deciding whether the eyes areopen or close. As a result of which sometimes it says the eyes are open andsometimes says the eyes are close. This is an issue we faced while analysingthis algorithm.
21

Below are the positive and negative results of this experiment:
Fig. 4.2: Correct result for open and close eyes
Fig. 4.3: Wrong result due to violation of assumption
22
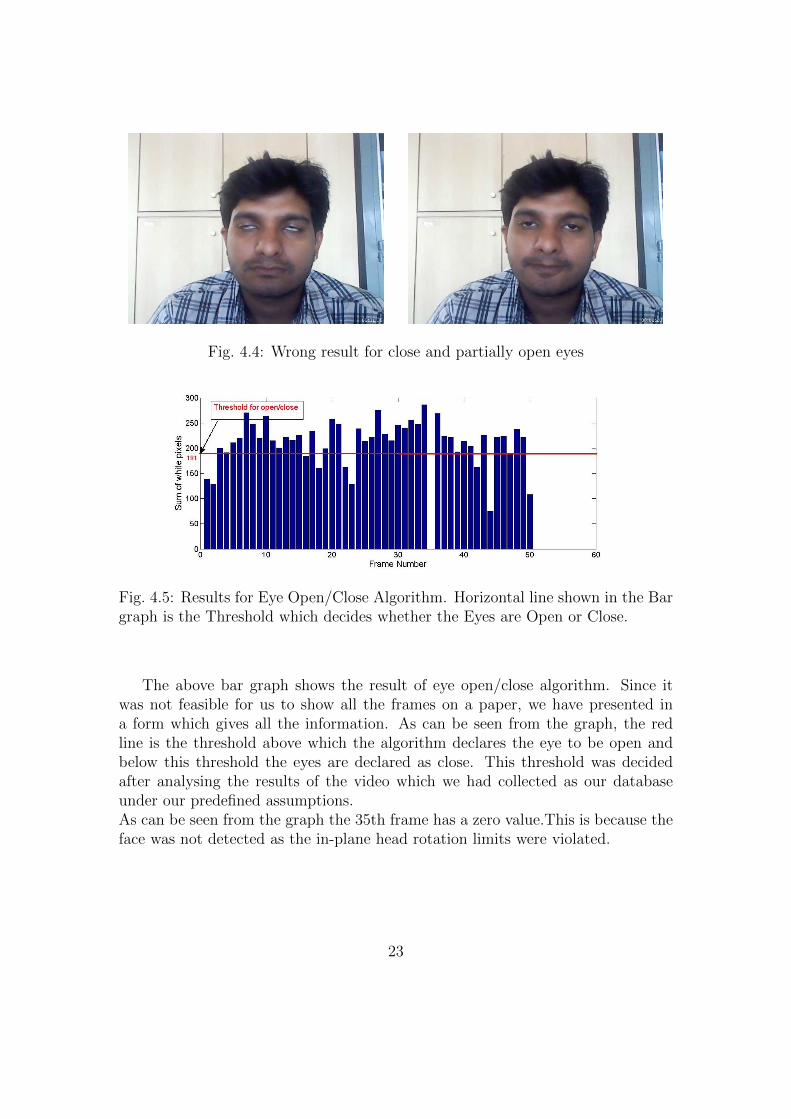
Fig. 4.4: Wrong result for close and partially open eyes
Fig. 4.5: Results for Eye Open/Close Algorithm. Horizontal line shown in the Bargraph is the Threshold which decides whether the Eyes are Open or Close.
The above bar graph shows the result of eye open/close algorithm. Since itwas not feasible for us to show all the frames on a paper, we have presented ina form which gives all the information. As can be seen from the graph, the redline is the threshold above which the algorithm declares the eye to be open andbelow this threshold the eyes are declared as close. This threshold was decidedafter analysing the results of the video which we had collected as our databaseunder our predefined assumptions.As can be seen from the graph the 35th frame has a zero value.This is because theface was not detected as the in-plane head rotation limits were violated.
23
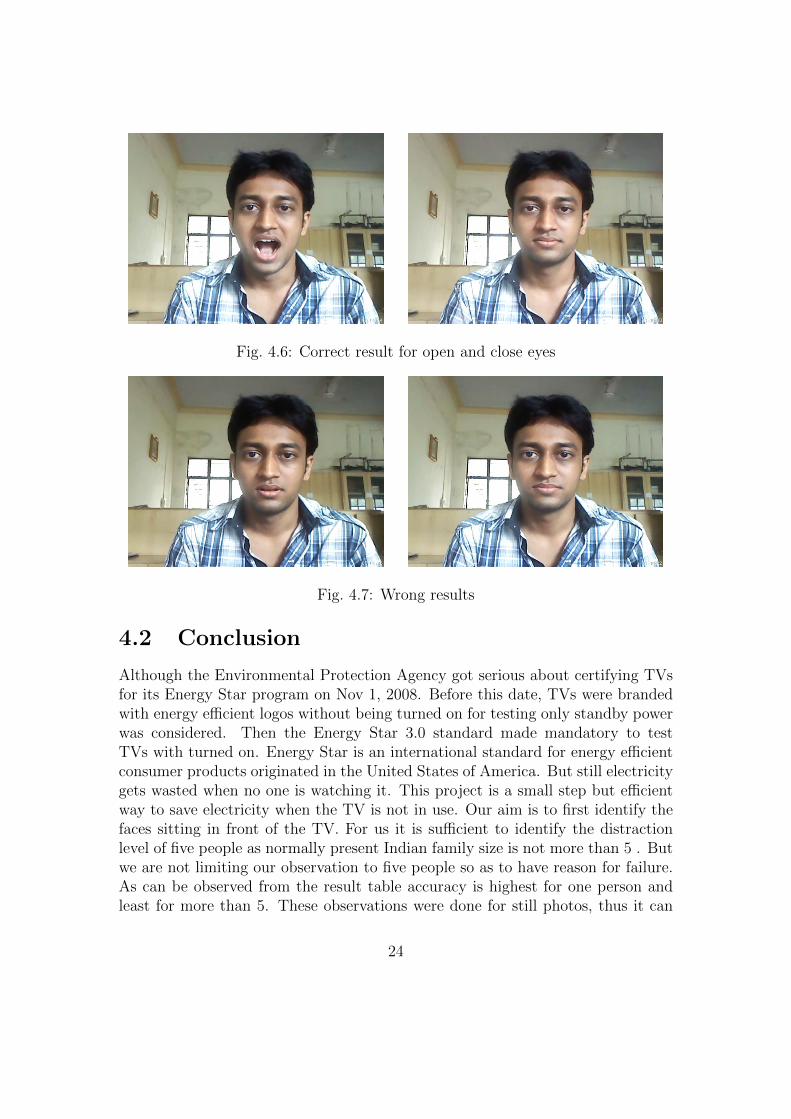
Fig. 4.6: Correct result for open and close eyes
Fig. 4.7: Wrong results
4.2 Conclusion
Although the Environmental Protection Agency got serious about certifying TVsfor its Energy Star program on Nov 1, 2008. Before this date, TVs were brandedwith energy efficient logos without being turned on for testing only standby powerwas considered. Then the Energy Star 3.0 standard made mandatory to testTVs with turned on. Energy Star is an international standard for energy efficientconsumer products originated in the United States of America. But still electricitygets wasted when no one is watching it. This project is a small step but efficientway to save electricity when the TV is not in use. Our aim is to first identify thefaces sitting in front of the TV. For us it is sufficient to identify the distractionlevel of five people as normally present Indian family size is not more than 5 . Butwe are not limiting our observation to five people so as to have reason for failure.As can be observed from the result table accuracy is highest for one person andleast for more than 5. These observations were done for still photos, thus it can
24

be improved to detect faces in real time for our application. We have also testedeye open/close algorithm which declares whether the eyes are open or close. Andit is giving satisfactory results.So now our next step is to take into account all theremaining features and complete the task of distraction detection so that it can beimplemented for energy conservation. Now at this point we are only dealing withTV. And in future this can be modified for other entertainment devices.
25
Chapter 5
Future Scope
� This time we are following modulewise procedure which means that we havedivided the whole project in parts and then working on those parts. We needto ensure that our every module works properly. Once the desired result isacheived from every stage then the task which remains is to integrate all andrun as one whole system. This will be our first future work which we wouldlike to complete.
� Issues while considering face detection would be illumination effect, differentfacial expression, head orientation, distraction level changes person to per-son.We have not considered all the above issues, instead we have put someconstraints on our system. But taking into account all the issues mentionedabove will make the face detection algorithm more powerful and efficient.Soovercoming these issues will be our one of the future work.
� Presently we are dealing with Television, but this work can also be extendedfor other entertainment devices.
We have generated distraction detection algorithm which tells us whether theviewer who is watching TV is distracted or not. Using this information we canconserve energy by reducing the brightness of TV. Using same concept with somemodifications we can implement it for new applications.Some of the applications can be:
� To see the involvement of students in a particular class.
� To detect driver distraction.
� To see which is the most viewed channel.
In addition, there could be many more applications built on similar line.
26

Bibliography
[1] Central Electricity Authority Load Generation Balance Report 2010-11
[2] Energy Information Administrator report on India, energy data, statistics andanalysis: Oil, Gas, Electricity, Coal pp. 7-9 Aug. 2010.
[3] KWR International, Inc. Kumar Amitav Chaliha, Indian Electricity-Miles togo Aug. 2007.
[4] Energy News, India envisages about 950,000 MW power required by 2030 Jul.2006.
[5] Study by PG&E in California.
[6] World Coal Institute coal report The coal resource: A comprehensive overviewof coal, pp.13-17 Jun. 2009.
[7] H. A. Rowley, S. Baluja, and T. Kanade, Neural network-based face detection,IEEE Trans. on Pattern Analysis and Machine Intelligence, vol. 20, pp. 23-38Jan. 1998.
[8] K. K. Sung, and T. Poggio, Example-based learning for view-based human facedetection, IEEE Trans. on Pattern Analysis and Machine Intelligence, vol. 20,pp. 39-51 Jan. 1998.
[9] E. Osuna, R. Freund, and F. Girosi, Training support vector machines: an ap-plication to face detection, IEEE Computer Society Conf. on Computer Visionand Pattern Recognition (CVPR97), pp. 130-136 1997.
[10] G. Guo, S. Li, and K. Chan, Face recognition by support vector machines,Fourth IEEE Int. Conf. on Automatic Face and Gesture Recognition, pp. 196-201, 2000.
[11] A. Nefian, and M. Hayes, Face detection and recognition using hidden markovmodels, IEEE Int. Conf. on Image Processing (ICIP98), vol. 1, pp. 141-145,1998.
27

[12] F. Samaria, and S. Young, HMM based architecture for face identification,Image and Computer Vision, vol. 12, pp. 537-583 Oct. 1994.
[13] P. Belhumeur, J. Hespanha, and D. Krigman, Eigenfaces vs. fisherfaces: recog-nition using class specific linear projection, IEEE Trans. on Pattern Analysisand Machine Intelligence, vol. 19, pp. 711-720, Jul 1997.
[14] M. A. Turk, and A. P. Pentland, Face recognition using eigenfaces,IEEE Computer Society Conf. on Computer Vision and Pattern Recognition(CVPR91), pp. 586-591 1991.
[15] V. Uzunov, A. Gotchev, K. Egiazarian, and J. Astola, Face detection by op-timal atomic decomposition, SPIE Symposium on Optics and Photonics 2005.
[16] R ARIIZUMI, S KANEDA and H HAGA, Energy Saving of TV by FaceDetection, in Proceedings of PETRA, 2008
[17] Luxand Inc, www.luxand.com 2005.
28