university of papua new guinea international economics lecture 7: trade models iv – the standard...
TRANSCRIPT

University of Papua New Guinea
International Economics
Lecture 7: Trade Models IV – The Standard Trade Model

The University of Papua New GuineaSlide 2
Lecture 7: Trade Models IV – The Standard Trade Model Michael Cornish
Overview
• Introduction
• Setting up the Model
• Adding in the Trade
• Using the Model

The University of Papua New GuineaSlide 3
Lecture 7: Trade Models IV – The Standard Trade Model Michael Cornish
IntroductionSo far:• The Ricardian Model:
– How comparative advantage leads to gains from trade
• The Specific Factors Model– Tracks distributional effects of trade in the short-
run• The Heckscher-Ohlin Model
– Tracks distributional effects of trade in the long-run– Shows that differences in resource endowments
drive trade
The University of Papua New GuineaSlide 4
Lecture 7: Trade Models IV – The Standard Trade Model Michael Cornish
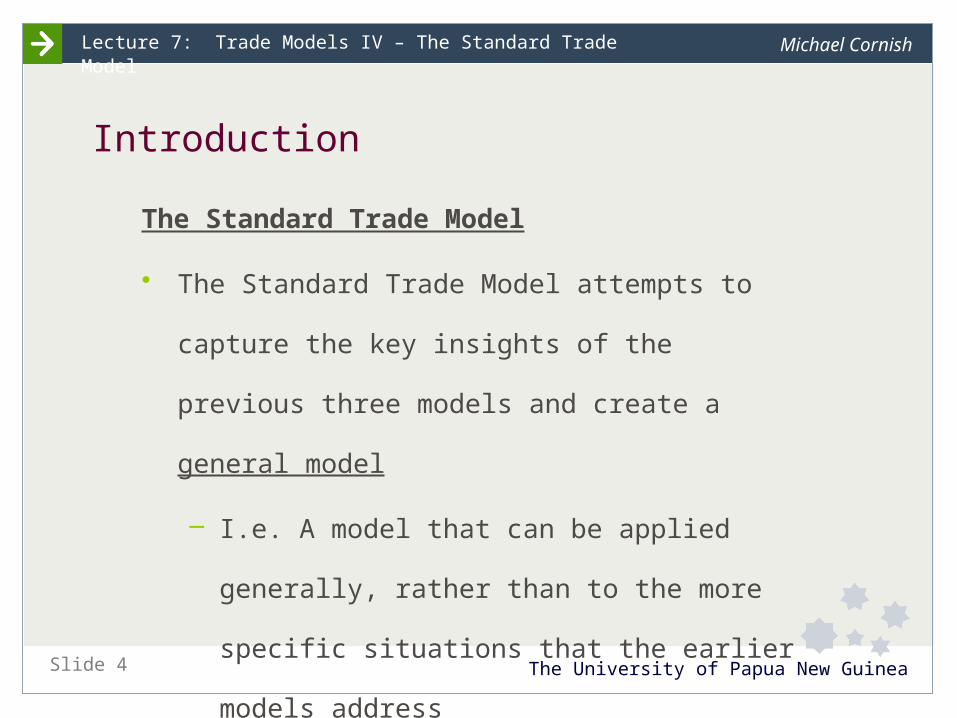
Introduction
The Standard Trade Model
• The Standard Trade Model attempts to capture
the key insights of the previous three models
and create a general model
– I.e. A model that can be applied generally,
rather than to the more specific situations
that the earlier models address
The University of Papua New GuineaSlide 5
Lecture 7: Trade Models IV – The Standard Trade Model Michael Cornish
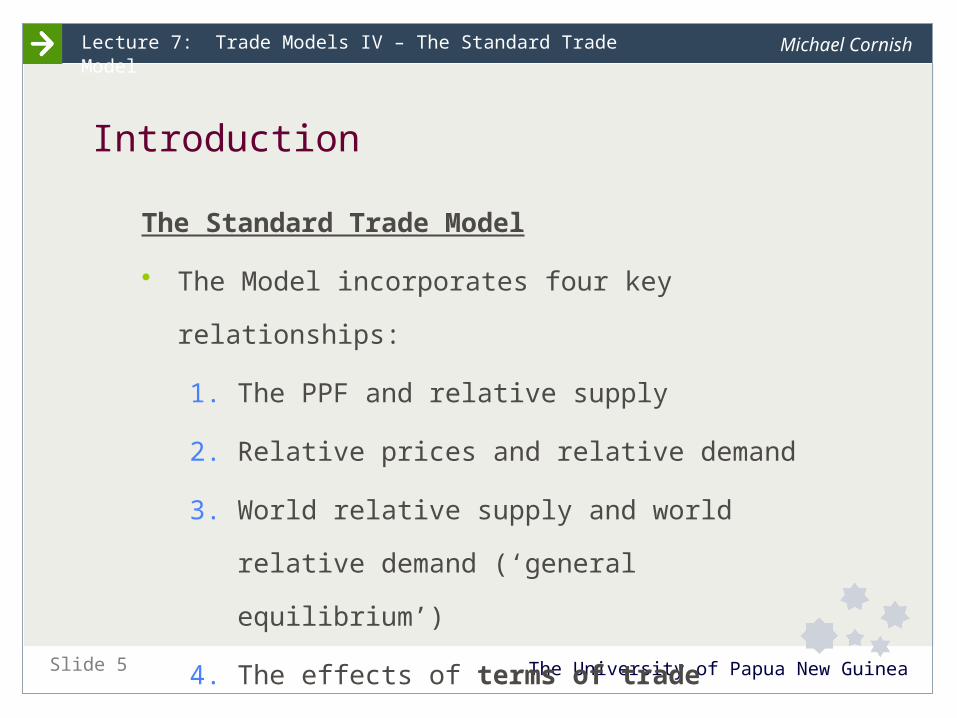
Introduction
The Standard Trade Model
• The Model incorporates four key relationships:
1. The PPF and relative supply
2. Relative prices and relative demand
3. World relative supply and world relative
demand (‘general equilibrium’)
4. The effects of terms of trade

The University of Papua New GuineaSlide 6
Lecture 7: Trade Models IV – The Standard Trade Model Michael Cornish
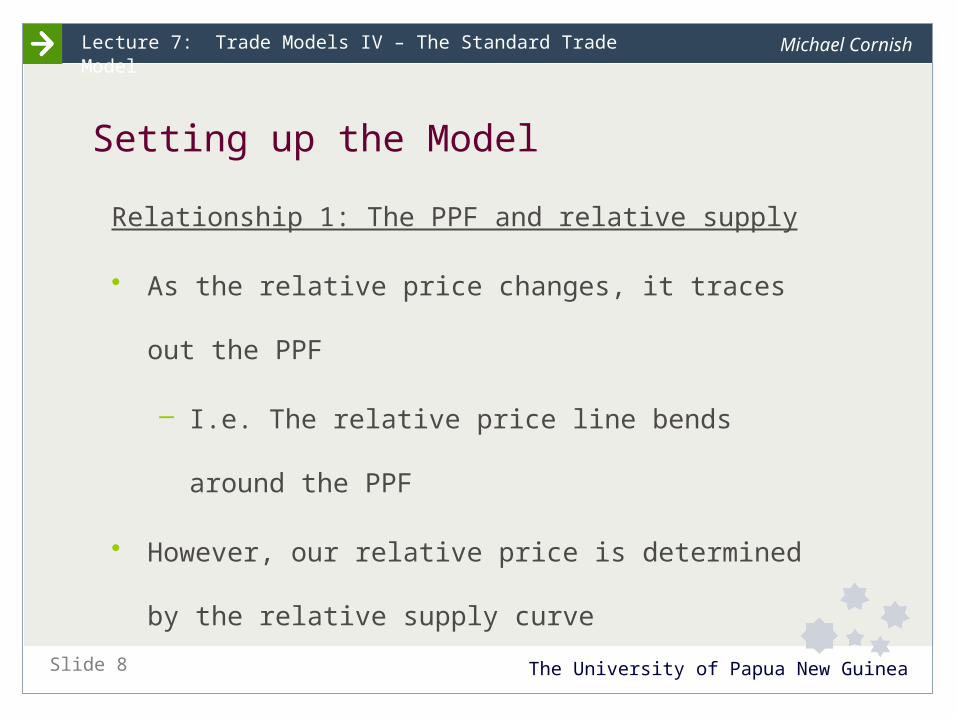
Setting up the Model
Relationship 1: The PPF and relative supply
• Let’s use cloth and food again as our two products
• Like the Heckscher-Ohlin Model, our PPF is
outwards-bending and we produce where we
maximise the value of our production
– This is where the isovalue line is tangential to
the PPF
– Our isovalue lines all have: Slope = – PC / PF

The University of Papua New GuineaSlide 7
Lecture 7: Trade Models IV – The Standard Trade Model Michael Cornish
Slope of isovalue lines
= – PC / PF
The University of Papua New GuineaSlide 8
Lecture 7: Trade Models IV – The Standard Trade Model Michael Cornish
Setting up the Model
Relationship 1: The PPF and relative supply
• As the relative price changes, it traces out the PPF
– I.e. The relative price line bends around the PPF
• However, our relative price is determined by the
relative supply curve

The University of Papua New GuineaSlide 9
Lecture 7: Trade Models IV – The Standard Trade Model Michael Cornish

The University of Papua New GuineaSlide 10
Lecture 7: Trade Models IV – The Standard Trade Model Michael Cornish
Setting up the Model
Relationship 2: Relative prices and relative demand
• In autarky, where producers maximise value is also
where we maximise benefit to consumers
– In short, supply = demand !
• Thus, value of output (V):
V = (PC * QSC) + (PF * QSF) = (PC * QDC) + (PF * QDF)
[where QS = Q supplied; QD = Q demanded/consumed]
Note: The textbook uses ‘D’ rather than QD as notation for quantity demanded/consumed

The University of Papua New GuineaSlide 11
Lecture 7: Trade Models IV – The Standard Trade Model Michael Cornish
Setting up the Model
Relationship 2: Relative prices and relative demand
• However, when we add trade into the Model,
consumers can now consume anywhere along the
world relative price line (slope = – P*C / P*F)
– The world relative price line is also the isovalue line
with trade
• For this reason, the world relative price line is
sometimes called the trade line or line of trade

The University of Papua New GuineaSlide 12
Lecture 7: Trade Models IV – The Standard Trade Model Michael Cornish
Setting up the Model
Relationship 2: Relative prices and relative demand
• This also means that although the value of
domestic production is equal to the value of
domestic consumption, they are now at different
points
• We determine where domestic consumption is
along the trade line by introducing the concept of
indifference curves

The University of Papua New GuineaSlide 13
Lecture 7: Trade Models IV – The Standard Trade Model Michael Cornish
Introducing indifference curves

The University of Papua New GuineaSlide 14
Lecture 7: Trade Models IV – The Standard Trade Model Michael Cornish
Setting up the ModelIndifference curves
• All points along a curve measure the same level of
utility (satisfaction from consumption)
– This means that consumers are indifferent about
where they consume on the same curve
– Often called ‘utility curves’
• Rules:
– Cannot intersect (always parallel)
– Utility functions are ordinal not cardinal
(e.g. U = 10 is not twice the utility of U = 5)

The University of Papua New GuineaSlide 15
Lecture 7: Trade Models IV – The Standard Trade Model Michael Cornish
Setting up the Model
Indifference curves
• Shape:
– Inwards-bending, which means diminishing
marginal utility
– Straight indifference curves are possible: this
means that the products are perfect substitutes
– Right-angled indifference curves are also
possible: this means that the products are
perfect complements
The University of Papua New GuineaSlide 16
Lecture 7: Trade Models IV – The Standard Trade Model Michael Cornish
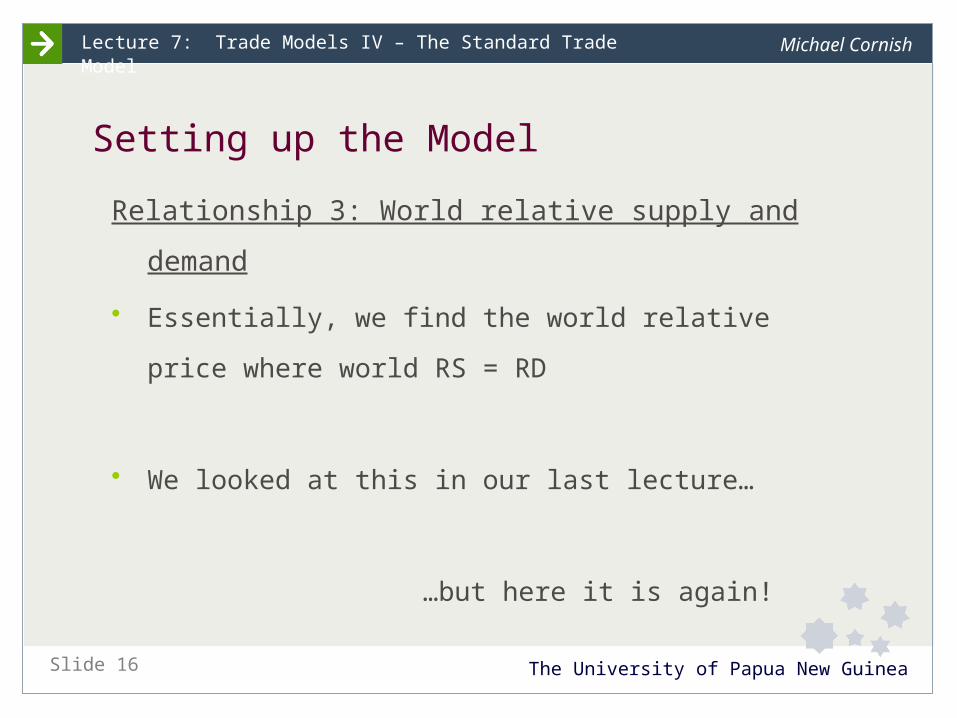
Setting up the Model
Relationship 3: World relative supply and demand
• Essentially, we find the world relative price where
world RS = RD
• We looked at this in our last lecture…
…but here it is
again!

The University of Papua New GuineaSlide 17
Lecture 7: Trade Models IV – The Standard Trade Model Michael Cornish
Remember:We assume that RD
is the same everywhere in the world (this means
the same consumer preferences)

The University of Papua New GuineaSlide 18
Lecture 7: Trade Models IV – The Standard Trade Model Michael Cornish
Setting up the Model
Relationship 4: The effect of terms of trade
• Terms of trade = price of exports / price of imports
= PX / PM
• A rise in a country’s terms of trade [PX or PM]
leads to an increase in welfare
• A fall in a country’s terms of trade [PX or PM]
leads to a decrease in welfare
– Both are measured by where a country can
consume

The University of Papua New GuineaSlide 19
Lecture 7: Trade Models IV – The Standard Trade Model Michael Cornish
RS = Domestic RSAs the terms of trade
increase [(PC/PF)], welfare increases [D3 => D1= > D2]
The University of Papua New GuineaSlide 20
Lecture 7: Trade Models IV – The Standard Trade Model Michael Cornish
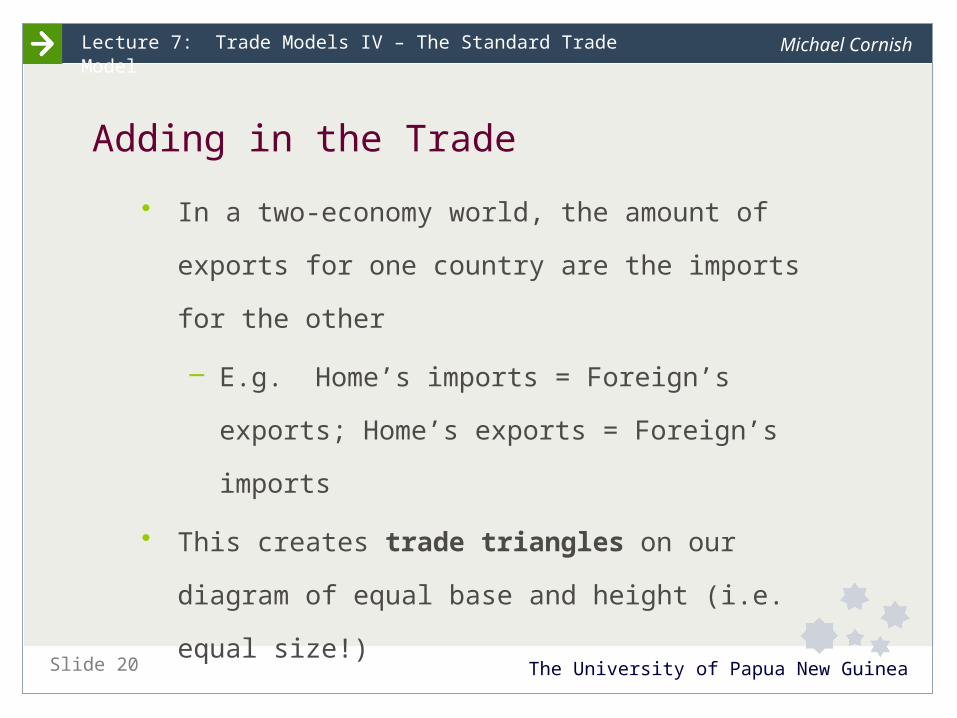
Adding in the Trade
• In a two-economy world, the amount of
exports for one country are the imports for the
other
– E.g. Home’s imports = Foreign’s exports;
Home’s exports = Foreign’s imports
• This creates trade triangles on our diagram
of equal base and height (i.e. equal size!)

The University of Papua New GuineaSlide 21
Lecture 7: Trade Models IV – The Standard Trade Model Michael Cornish
Trade triangles [in green]

The University of Papua New GuineaSlide 22
Lecture 7: Trade Models IV – The Standard Trade Model Michael Cornish
Using the Model
• Now that we have the Standard Trade Model
all worked out, let’s do things with it!
• First, let’s look at the effect of economic
growth on the Model
• Growth inevitably has a bias towards one
product or the other (‘biased growth’)

The University of Papua New GuineaSlide 23
Lecture 7: Trade Models IV – The Standard Trade Model Michael Cornish
Using the Model
• There are two main reasons for growth:
– Technological progress in one sector will
expand the PPF more in that product’s
direction [as per the Ricardian Model]
– An increase in a factor endowment will
expand the PPF more in the direction of the
product that uses that factor intensively
[as per the Heckscher-Ohlin Model]

The University of Papua New GuineaSlide 24
Lecture 7: Trade Models IV – The Standard Trade Model Michael Cornish

The University of Papua New GuineaSlide 25
Lecture 7: Trade Models IV – The Standard Trade Model Michael Cornish
Note:These are domestic
RS curves

The University of Papua New GuineaSlide 26
Lecture 7: Trade Models IV – The Standard Trade Model Michael Cornish
...and these are world RS curves!

The University of Papua New GuineaSlide 27
Lecture 7: Trade Models IV – The Standard Trade Model Michael Cornish
Using the Model
• Note from the last slide that the product bias
of the economic growth leads to a fall in the
relative price of that product
• One the face of it, this seems like a bad thing
for the country that exports that product
– But you have to remember that there is
also a volume effect with economic growth

The University of Papua New GuineaSlide 28
Lecture 7: Trade Models IV – The Standard Trade Model Michael Cornish
Using the Model
• So it depends which change is bigger:
PC/PF , or QC
• For a small economy, the quantity effect (QC)
would usually be bigger
• However, if the price effect (PC/PF; a drop in
its terms of trade) is bigger than the quantity
effect, then we get immiserising growth
– I.e. growth that is bad, and makes you
miserable!