university of louisiana system - nicholls state … of supervisors, university of louisiana system...
TRANSCRIPT
University of Louisiana System
GRAD Act Annual Report
FY 2014-2015 (Year 5)
Submitted to the
Board of Supervisors, University of Louisiana System
April 1, 2015
and to the
Louisiana Board of Regents,
May 1, 2015
2
Table of Contents
Student Success
Narrative Page 3
1.a. Implement policies established by the institution's management board to achieve cohort graduation rate and graduation productivity goals that are
consistent with institutional peers.
Page 8
1.b. Increase the percentage of program completers at all levels each year. Page 14
1.c. Develop partnerships with high schools to prepare students for postsecondary education. Page 19
1.d. Increase passage rates on licensure and certification exams and workforce foundational skills. Page 20
Articulation & Transfer
Narrative Page 23
2.a Phase in increased admission standards and other necessary policies by the end of the 2012 Fiscal Year in order to increase student retention and
graduation rates for transfer students.
Page 28
2.b Provide feedback to community colleges and technical college campuses on the performance of associate degree recipients enrolled at the institution. Page 32
2.c Develop referral agreements with community colleges and technical college campuses to redirect students who fail to qualify for admission into the
institution.
Page 33
2.d Demonstrate collaboration in implementing articulation and transfer requirements provided in R.S. 17:3161 through 3169. Page 33
Workforce and Economic Development
Narrative Page 34
3.a Eliminate academic programs offerings that have low student completion rates as identified by the Board of Regents or are not aligned with current or
strategic workforce needs of the state, region, or both as identified by the Louisiana Workforce Commission.
Page 37
3.b Increase use of technology for distance learning to expand educational offerings. Page 38
3.d Percent of completers found employed. Number of students completing an undergraduate award identified in Board of Regents CRINPROG, by award
level. Number of above students found employed. Calculated percent, per award level.
Page 40
Institutional Efficiency and Accountability
Narrative Page 41
4.a Eliminate remedial education course offerings and developmental study programs unless such courses or programs cannot be offered at a community
college in the same geographical area.
Page 43
4.b Eliminate associate degree program offerings unless such programs cannot be offered at a community college in the same geographic area or when the
Board of Regents has certified educational or workforce needs.
Page 44
4.c Upon entering the initial performance agreement, adhere to a schedule established by the institution's management board to increase nonresident tuition
amounts that are not less than the average tuition amount charged to Louisiana residents attending peer institutions in other Southern Regional
Education Board states and monitor the impact of such increases on the institution.
Page 45
4.d Designate centers of excellence as defined by the Board of Regents which have received a favorable academic assessment from the Board of Regents and
have demonstrated substantial progress toward meeting the following goals Page 45
Section 5 Report Page 47
3
1. STUDENT SUCCESS
Narrative (3-5 pages)
• An explanation for any targeted measure(s) in this objective for which the institution is not reporting having met or improved for the
reporting year.
N/A
• Student success policies/programs/initiatives implemented/continued during the reporting year.
Nicholls State University students enter the university through the University College program. University College provides a centralized Advising
Center with personnel trained to serve students in transition and to provide ancillary academic services intended to support student progress towards a
degree. The Academic Advising Center employs seven full-time staff with faculty rank at the instructor level or higher. All of the staff possess at
least a master’s or have a master’s in progress. Most of the Academic Advising Center staff have counseling or education backgrounds. University
College’s Advising Center has laid the foundation for an invigorated freshman seminar. The role of the professional advisor is one of advocacy for
the student/advisee.
Professional advisors work closely with students to understand all of the issues facing the student and potentially becoming a roadblock to student
persistence to graduation. Using Grades First, professional advisors will stay in contact with and monitor all advisees throughout their career at
Nicholls making appropriate referrals to needed resources and/or faculty. Professional advisors will have appointments available for their advisees,
but will still accept drop in visits when possible. Advisees must meet with their professional advisor at least once per semester in order to be cleared
for registration. All professional advisors are be thoroughly trained, supervised, and assessed by the Coordinator of the Academic Advising Center.
In the spring 2014 and spring 2015 semesters, the Academic Advising Center served as an approved site for interns from the General Family and
Consumer Sciences Program internship program. These interns developed and conducted an intense, at-risk mentoring program targeted at assisting
students who were readmitted after an academic suspension or who were student athletes designated as at-risk. Interns met with students on a weekly
or bi-weekly basis and discussed campus resources and success skills with students as needed. This program is planned as ongoing and the Advising
Center will accept interns as requested by the department.
The Tutorial and Academic Enhancement Center, located in Peltier Hall and a unity of University College Academic Services, utilizes Brainfuse, a
suite of tutoring services and tools designed for today's college student. This suite consists of free and paid tutoring services. The Tutorial and
Academic Enhancement Center will continue to tutor students who prefer in-person tutoring or writing help, Brainfuse has been added to increase
student access to quality tutors.
Free Services: Students enjoy the following online services free of charge.

4
Test Center (Free): Provides unlimited access to an ever-expanding library of online assessments of college-level skills. Results are provided
instantly and students can share the results with a tutor for targeted skills building. Test Center also includes authoring tools for instructors to
easily create and share online tests.
FlashBulb (Free): Allows students to create their own flashcards for efficient self-study. Students have 24/7 access to an extensive library of
online flashcard sets in virtually every subject
Online Study Groups (Free): Students and instructors can easily schedule online study groups or hold virtual office hours in the Brainfuse
online classroom.
Brainwave (Free): This tool allows users to record their activity on the Brainfuse Notepad for note-taking purposes or share it with others.
Brainwave is ideal for recording solutions to math or science problems, class projects, or any other concept involving motion, sequence, or
animation.
Paid Services: Students purchase two hours of services for $55 in the following areas:
Live Online Tutoring (Paid Service): Students have access to live, on-demand homework help from Brainfuse-certified tutors in a variety
of college subjects. Tutors and students communicate in real-time through the Brainfuse Online Classroom. Subjects tutored: Math,
Writing, Reading, Science (Human Anatomy and Physiology, Biology, Microbiology, Chemistry, Organic Chemistry, Physics, etc.),
Business (Accounting, Economics, Finance, etc.), Health Professions (Allied Health studies, Pharmacy studies, Nursing studies, Medical
Terminology, Pathology, Pharmacology, Test Prep, etc,), Computers in Technology (Access, Excel, Word, PowerPoint), English for
Speakers of Other Languages, Spanish, History.
24/7 Question Center (Paid Service): The 24/7 Question Center is ideal for students who have questions outside of service hours or who
require a detailed, structured explanation of a difficult academic concept. Students simply submit their question (and even attach
supporting documents) and Brainfuse will respond within approximately 24 hours.
Basic Skills Building (Paid Service): This transition program is designed to individually and systematically build essential skills for
college success. Areas of focus include mathematics, critical reading, and writing. The transition program consists of the following
components:
o Online Assessment: Students take an online assessment to determine areas of focus. Assessments can be customized to fit within an
institution’s objectives.
o Individualized Tutoring Plan: Each student receives an individualized tutoring plan based on assessments results.
o Live Tutoring: Students meet with Brainfuse tutors in live, online sessions to achieve mastery of the skills highlighted in the tutoring
plan.
o Progress Reporting: Regular online assessments, automatic attendance tracking, and tutor post-session reports allow the Brainfuse
curriculum team and school administrators to track student progress in order to maximize program effectiveness.
Online Writing Lab (Paid Service):
o Premium Writing Lab: Students submit their writing through Brainfuse’s secure file sharing feature and within 24 hours,
Brainfuse writing specialists evaluate it according to a customized rubric. Rubrics can be customized to a particular institution’s
evaluative preferences.

5
o Live Writing Lab: Students who want more immediate feedback have the option to login with a live tutor and use Brainfuse’s file
sharing feature to receive live, one-to-one writing assistance. This writing lab is particularly useful during the preparatory stages
of the writing process.
Brainfuse Higher Education tutors undergo a rigorous training and certification process. All tutors have bachelor's degrees, and over 80% have
master's degrees or higher. On average, a typical Brainfuse tutor has taught or tutored for over a decade. [Description of services courtesy of
Brainfuse.com.]
The Department of Languages and Literature has continued to offer English 100 as a pilot program. It has now been added to the Nicholls Course
Catalog as the course enables students to earn credit for English 101 and is thus transferable. Students with an ACT score of 16/17 qualify to take
English 100 and upon successful completion earn credit for English 101. For the 2013-14 academic years, 10 sections of English 100 were offered,
three each fall and two each spring. The Department experimented with one web-based section in the fall 2014. Because of increased demand for
this course, two other full-time instructors have been trained to teach this course, in addition to the instructor who initially piloted the course. For
2013-14, there was a 62.35% completion rate, which falls within the national average for accelerated learning programs.
In the Department of Mathematics, a fully integrated, extended section pilot course continues to be offered for concurrent delivery of developmental
and college-level instruction. The pilot was initiated based partially on information provided by Complete College America and Education
Commission of the States. Rather than separating college and pre-college content, the course integrates subject matter from both levels. Selected
algebra topics from both developmental content and introductory college-level content have been chosen and blended with content from the general
education quantitative analysis course already offered at Nicholls. Various instructional techniques have been employed for student success, such as
computer lab exercises, collaborative learning, and study plans. The pilot course permits admission of many students who do not quite meet the
admission standard with regard to the ACT subscore in mathematics. The course can be used toward completion of University general education
requirements in mathematics. The Department recently received a grant for construction of a modern mathematics classroom specifically designed to
accommodate group work. This facility is available throughout the week for mathematics students to congregate and study, with professors and with
one another. This initiative should aid retention and success in mathematics courses, especially pilot classes such as the one described. Rates for
successful completion of the pilot course in AY 2013-2014 run from 60% to 70%.
The BSN program uses the comprehensive assessment and remediation program offered by Health Education Systems, Inc. (HESI) as an academic
measuring tool. Entry-level students through graduating seniors utilize the testing program; individual as well as aggregate data, both formative and
summative, are obtained. Individual data are utilized to assess student learning and provide an impetus for student-managed preparation and
remediation and is a component of student advising. Course-specific aggregate data are monitored and shared with the faculty to inform course
improvement and student outcomes. Additionally, to enhance student learning, case studies and electronic adaptive quizzing offered through HESI
are infused throughout the courses and are prerequisite to the proctored tests. Also, a component of the testing program is required-remediation for
students scoring less than established benchmarks. The value of valid, nationally standardized testing is realized as the BSN individual course scores
and the program’s composite scores are compared to the national average scores. Of note, the BSN program has moved from using Assessment

6
Technologies Institute, LLC (ATI) assessment and remediation program to HESI effective fall 2014 relative to its currency of content aligned to the
National Council Licensure Exam-RN (NCLEX-RN).
The Department of Art established a new graphic design Internship relationship with the World War II Museum. In addition, they have initiated a
fundraiser to generate scholarship funds and student development grants.
Departments of the College of Arts and Sciences have created new degree program concentration areas to align with workforce needs and student
demands. The Department of Government and Social Sciences has created a new concentration in Social Work in response to 23% projection of
employment needs in the area of social services (Louisiana Job Works). For its B.S. in Biology, the Department of Biological Sciences has launched
a new concentration, Cellular and Molecular Biology, which immediately drew new enrollees. For its B.S. in Chemistry, the Department of Physical
Sciences has responded to increased curricular requirements of Schools of Pharmacy by creating a Pre-Pharmacy Concentration.
• Data-based evaluation, including student performance, conducted to ascertain effectiveness during the reporting year.
Continuing from the 2013-14 academic year, Nicholls State University continues to utilize LiveText, an online assessment system, to assess its
general education curriculum. The software is introduced to students in the UNIV 101 course by the professional advisors. Use of the software will
progress with the students through the general education curriculum and will assess their basic competencies along the way. Through course
embedded assessment, the university will get a more complete view of the achievement levels of general education competencies while using
assignments already being done for the class. Because the University will be using LiveText as the platform to collect the assessments, the students
will also benefit from this process. Not only will students be able to track their own growth toward meeting the outcomes, they will also be able to
create e-portfolios that reflect their accomplishments in a variety of disciplines and assignments. Input from the faculty will also guide program
decision, revision, and development, which, in the end, will directly benefit the students’ performance and outcomes. Development of the e-portfolios
will begin in UNIV 101 with the inclusion of an assessed career interview project. Beginning in the fall 2013, data was collected for this assessment
and students scored at the benchmark level at higher than expected rates. The interview project continues to be assessed as a baseline assessment for
career portfolios and is also linked to several General Education Learning Outcomes.
Within the College of Nursing and Allied Health, the Department of Nursing BSN program and the Department of Allied Health Sciences four
degree programs utilize LiveText, a university assessment initiative. Specifically, the BSN program continues participation in LiveText whereby key
assignments throughout the program are linked to the Commission on Collegiate Nursing Education’s standards for accreditation, the Essentials of
Baccalaureate Education, and student learning outcomes. The Communicative Disorders program continues to use LiveText for all clinical courses
to track, monitor, and report on student outcomes for each of these courses. The Dietetics program pilot tested the use of LiveText in its Dietetics
390 course and is moving forward with further implementation in DIET 459 Senior Seminar course for development of electronic portfolios Rubrics
provide the mechanism for student evaluation and a component of program assessment. Defined elements within the rubrics are measured to indicate
proficiency. Additionally, LiveText provides the opportunity for the assessment of inter-rater consistency among faculty in the evaluation of
assignments which further supports use of data and alignment with expected student outcomes.
7
• Tracking/monitoring/reporting mechanisms implemented/continued during the reporting year.
Student Progress Report distributed through GradesFirst are utilized every fall and spring semester to help identify at-risk students earlier. Through
the system, progress reports are sent out on students identified by the Academic Advising Center as needing additional guidance. Those include dual
enrolled high school students, athletes, suspension or probation students, and any students in the new pilot program for English and Math. Narrowing
the student lists make it easier for faculty to respond. The student list is received by course and section making it easy for them to navigate. The
faculty member records the number of absences, the anticipated grades based on current performance and any comments regarding the student’s
performance. Faculty can add students not on the list who are showing signs of distress in their course. Response rates for the 2014 calendar year
were: 45% response rate for spring 2014, and a 47% response rate for fall 2014. . The Advising Center staff will continue to undertake initiatives to
increase response rates for progress report campaigns in future semesters.
In an effort to track and identify students who may be at-risk that are a part of the pilot program in math and English, the Academic Advising Center
receives progress reports for all students enrolled in the pilot classes and uses these reports to connect students to resources as needed. As long as the
pilot program exists on campus, this initiative will be ongoing. The College of Business, as required by AACSB International, had implemented more
indirect measures keep track of students and their successes. Additionally, we have implemented employers and alumni assessment processes. The
BSN program began participation by all faculty in GradesFirst in spring of 2015 as a mechanism of communication and consistency in advising to
enhance student success.
• Development/use of external feedback reports during the reporting year.
Feedback reports to high schools have been developed. A sample report can be found on the Assessment and Institutional Research web page. The
report provides each high school with information on how the graduates from each year are performing in the college setting. The reports contain
information on GPA, academic standing, progression and graduation rates.
The South Central Louisiana Association of School Superintendents (SCLASS) meets monthly in the College of Education, and the College of
Education has renewed the field experience agreements with districts. Candidates are required to acquire 180 hours of field experiences prior to
student teaching. There are three levels of field experiences with student teaching being the calumniating experience. The field experiences are not
different requirements; however, we re-validate the articulation agreements with districts in our network.
To authenticate field experiences further, several methods courses in the Elementary 1-5 and the Secondary 6-12 programs are housed on the K-12
campuses. Methods professors and partner teachers are collaborating to refine the field experiences. The goal is to strengthen the collaboration
between the College of Education and districts in the region. Faculty members from the College of Education are also active participants of
curriculum committees in local districts aligned with the previously cited goal.

8
a. Implement policies established by the institution's management board to achieve cohort graduation rate and graduation productivity
goals that are consistent with institutional peers.
1.a.i Retention of first-time, full-time, degree-seeking students, 1st to 2
nd Year Retention Rate (Targeted)
Baseline Year 1 Year 2 Year 3 Year 4 Year 5 Year 6
Term of Data Fall 08 to
Fall 09
Fall 09 to
Fall 10
Fall 10 to
Fall 11
Fall 11 to
Fall 12
Fall 12 to
Fall 13
Fall 13 to
Fall 14
Fall 14 to
Fall 15
# in Fall
Cohort
1219 1213 1050 983 1035 1055
# Retained to
2nd
Fall
semester
824 853 748 698 702 733
Rate 67.6% 70.3% 71.2% 71.0% 67.8% 69.5%
Target 68.1% (66.1%
- 70.1%)
68.6% (66.6%
- 70.6%)
69.1% (67.1%
- 71.1%)
69.6% (67.6%
- 71.6%)
70.1% (68.1%
- 72.1%)
70.6% (68.6%
- 72.6%) Actual Fall 09 to
Fall 10
Actual Fall 10 to
Fall 11
Actual Fall 11 to
Fall 12
Avg of Prior
Three Years
Actual Fall 12 to
Fall 13
Actual Fall 13 to
Fall 14
Avg of Most
Recent Two Yrs
Target Met? YES YES YES YES YES
9
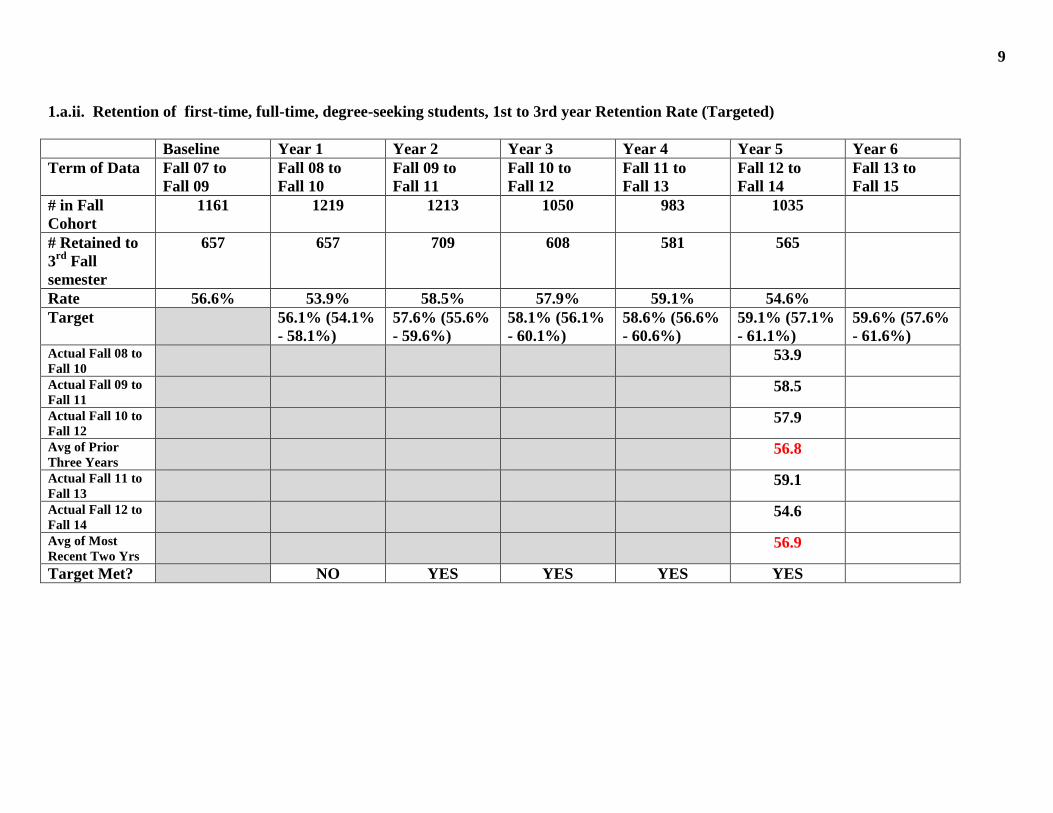
1.a.ii. Retention of first-time, full-time, degree-seeking students, 1st to 3rd year Retention Rate (Targeted)
Baseline Year 1 Year 2 Year 3 Year 4 Year 5 Year 6
Term of Data Fall 07 to
Fall 09
Fall 08 to
Fall 10
Fall 09 to
Fall 11
Fall 10 to
Fall 12
Fall 11 to
Fall 13
Fall 12 to
Fall 14
Fall 13 to
Fall 15
# in Fall
Cohort
1161 1219 1213 1050 983 1035
# Retained to
3rd
Fall
semester
657 657
709 608 581 565
Rate 56.6% 53.9% 58.5% 57.9% 59.1% 54.6%
Target 56.1% (54.1%
- 58.1%)
57.6% (55.6%
- 59.6%)
58.1% (56.1%
- 60.1%)
58.6% (56.6%
- 60.6%)
59.1% (57.1%
- 61.1%)
59.6% (57.6%
- 61.6%) Actual Fall 08 to
Fall 10 53.9
Actual Fall 09 to
Fall 11 58.5
Actual Fall 10 to
Fall 12 57.9
Avg of Prior
Three Years 56.8
Actual Fall 11 to
Fall 13 59.1
Actual Fall 12 to
Fall 14 54.6
Avg of Most
Recent Two Yrs 56.9
Target Met? NO YES YES YES YES

10
1.a.iv. Graduation Rate: Same institution graduation rate as defined and reported by the NCES Graduation Rate Survey (Targeted)
Baseline Year 1 Year 2 Year 3 Year 4 Year 5 Year 6
Term of Data Fall 2002
cohort
through Fall
2008
Fall 2003
cohort
through Fall
2009
Fall 2004
cohort
through Fall
2010
Fall 2005
cohort
through Fall
2011
Fall 2006
cohort
through Fall
2012
Fall 2007
cohort
through Fall
2013
Fall 2008
cohort
through Fall
2014
# in Fall
Cohort
1404 1391 1574 1171 1069 1156
# Graduated
within 150%
of time
374 406 451 450 421 477
Rate 26.6% 29.2% 28.7% 38.4% 39.4% 41.3%
Target 28.0% (26.0%
- 30.0%)
30.0% (28.0%
- 32.0%)
35.0% (33.0%
- 37.0%)
35.5% (33.5%
- 37.5%)
36.0% (34.0%
- 38.0%)
36.5% (34.5%
- 38.5%) Actual Fall 00
cohort
Actual Fall 01
cohort
Actual Fall 02
cohort
Avg of Prior
Three Years
Actual Fall 03
cohort
Actual Fall 04
cohort
Avg of Most
Recent Two Yrs
Target Met? YES YES YES YES YES

11
1.a.vi. Academic Productivity: Award Productivity (Targeted)
Baseline Year 1 Year 2 Year 3 Year 4 Year 5 Year 6
Term of Data AY 08-09 AY 09-10 AY 10-11 AY 11-12 AY 12-13 AY 13-14 AY 14-15
FTE UG
Enrollment
5957.6 6064.8 5907.6 5653.2 5432.5 5314.8
Expected # of
Awards*
1489.4 1516.2 1476.9 1413.3 1358.1 1328.69
# Awards 1036 1091 1111 1067 1169 1195
Ratio of
Awards/ FTE
.1739 .1799 .1881 .1887 .2152 .2248
Award
Productivity*
69.6% 72.0% 75.2% 75.5% 86.1% 89.9%
Target 70.0% (68.0%
- 72.0%)
70.0% (68.0%
- 72.0%)
70.0% (68.0%
- 72.0%)
70.0% (68.0%
- 72.0%)
70.0% (68.0%
- 72.0%)
70.0% (68.0%
- 72.0%) Actual Fall 00
cohort
Actual Fall 01
cohort
Actual Fall 02
cohort
Avg of Prior
Three Years
Actual Fall 03
cohort
Actual Fall 04
cohort
Avg of Most
Recent Two Yrs
Target Met? YES YES YES YES YES
* Expected # of awards = UG FTE/4. Award productivity = # awards/expected # of awards.
12
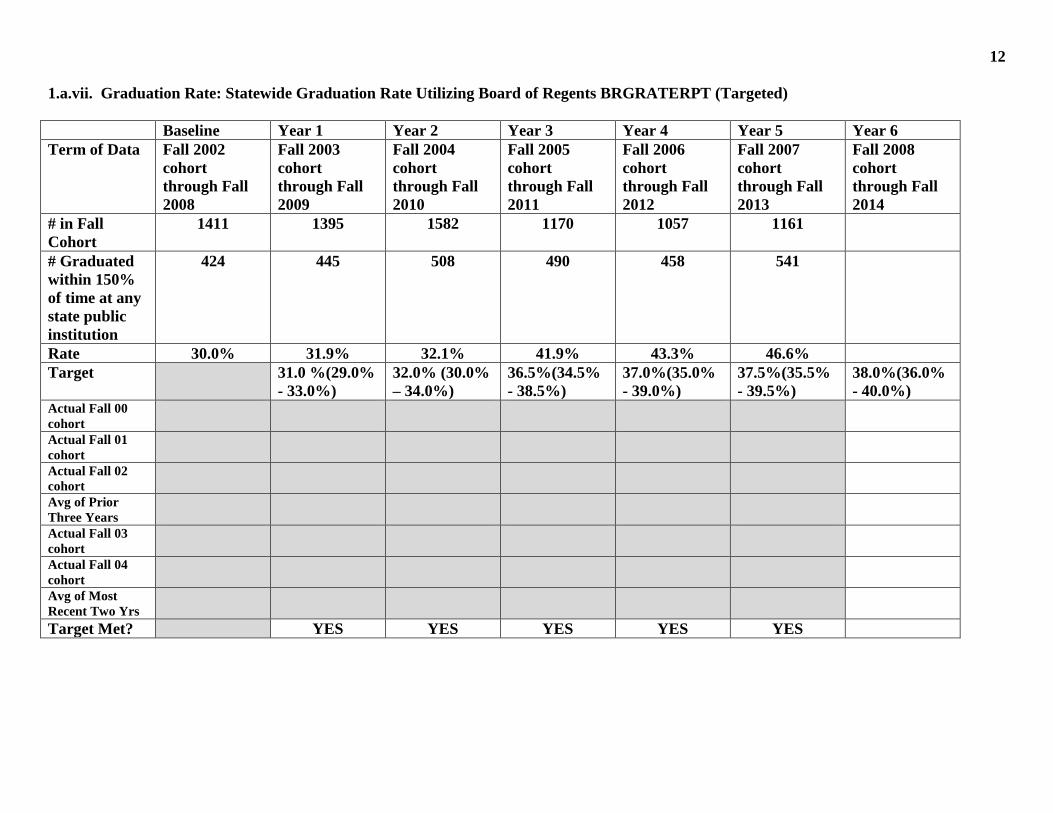
1.a.vii. Graduation Rate: Statewide Graduation Rate Utilizing Board of Regents BRGRATERPT (Targeted)
Baseline Year 1 Year 2 Year 3 Year 4 Year 5 Year 6
Term of Data Fall 2002
cohort
through Fall
2008
Fall 2003
cohort
through Fall
2009
Fall 2004
cohort
through Fall
2010
Fall 2005
cohort
through Fall
2011
Fall 2006
cohort
through Fall
2012
Fall 2007
cohort
through Fall
2013
Fall 2008
cohort
through Fall
2014
# in Fall
Cohort
1411 1395 1582 1170 1057
1161
# Graduated
within 150%
of time at any
state public
institution
424 445 508 490 458 541
Rate 30.0% 31.9% 32.1% 41.9% 43.3% 46.6%
Target 31.0 %(29.0%
- 33.0%)
32.0% (30.0%
– 34.0%)
36.5%(34.5%
- 38.5%)
37.0%(35.0%
- 39.0%)
37.5%(35.5%
- 39.5%)
38.0%(36.0%
- 40.0%) Actual Fall 00
cohort
Actual Fall 01
cohort
Actual Fall 02
cohort
Avg of Prior
Three Years
Actual Fall 03
cohort
Actual Fall 04
cohort
Avg of Most
Recent Two Yrs
Target Met? YES YES YES YES YES
13
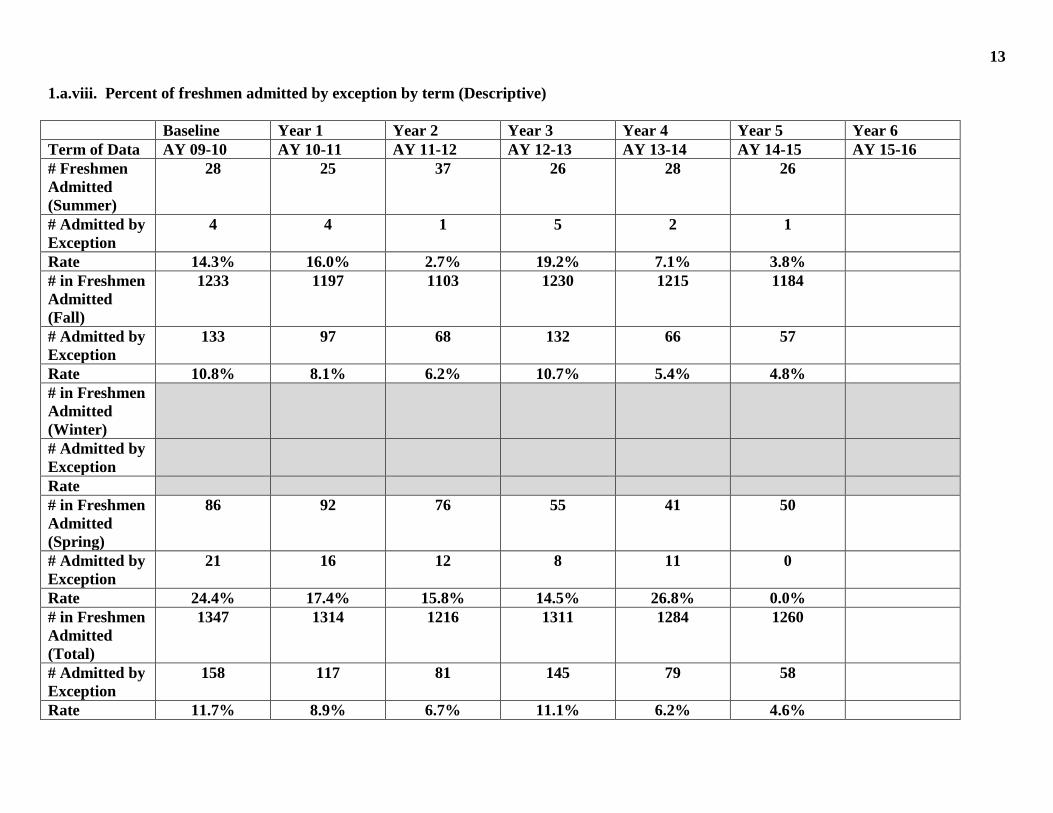
1.a.viii. Percent of freshmen admitted by exception by term (Descriptive)
Baseline Year 1 Year 2 Year 3 Year 4 Year 5 Year 6
Term of Data AY 09-10 AY 10-11 AY 11-12 AY 12-13 AY 13-14 AY 14-15 AY 15-16
# Freshmen
Admitted
(Summer)
28 25 37 26 28 26
# Admitted by
Exception
4 4 1 5 2 1
Rate 14.3% 16.0% 2.7% 19.2% 7.1% 3.8%
# in Freshmen
Admitted
(Fall)
1233 1197 1103 1230 1215 1184
# Admitted by
Exception
133 97 68 132 66 57
Rate 10.8% 8.1% 6.2% 10.7% 5.4% 4.8%
# in Freshmen
Admitted
(Winter)
# Admitted by
Exception
Rate
# in Freshmen
Admitted
(Spring)
86 92 76 55 41 50
# Admitted by
Exception
21 16 12 8 11 0
Rate 24.4% 17.4% 15.8% 14.5% 26.8% 0.0%
# in Freshmen
Admitted
(Total)
1347 1314 1216 1311 1284 1260
# Admitted by
Exception
158 117 81 145 79 58
Rate 11.7% 8.9% 6.7% 11.1% 6.2% 4.6%
14
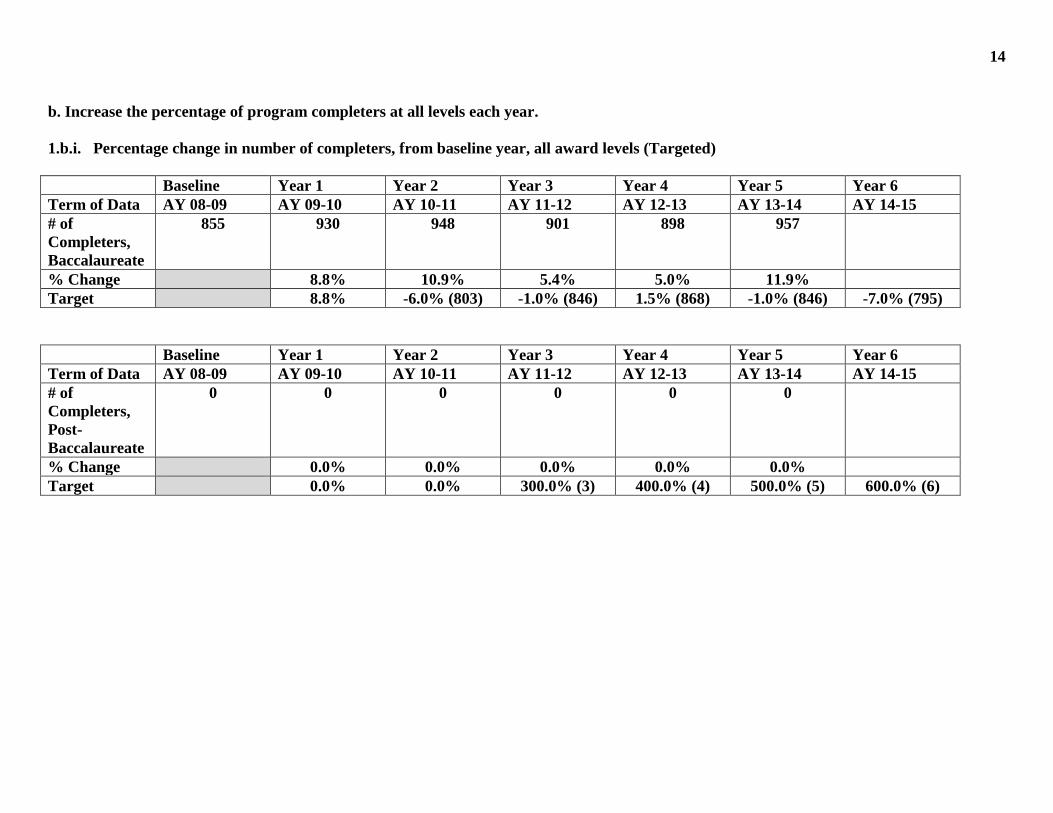
b. Increase the percentage of program completers at all levels each year.
1.b.i. Percentage change in number of completers, from baseline year, all award levels (Targeted)
Baseline Year 1 Year 2 Year 3 Year 4 Year 5 Year 6
Term of Data AY 08-09 AY 09-10 AY 10-11 AY 11-12 AY 12-13 AY 13-14 AY 14-15
# of
Completers,
Baccalaureate
855 930 948 901 898 957
% Change 8.8% 10.9% 5.4% 5.0% 11.9%
Target 8.8% -6.0% (803) -1.0% (846) 1.5% (868) -1.0% (846) -7.0% (795)
Baseline Year 1 Year 2 Year 3 Year 4 Year 5 Year 6
Term of Data AY 08-09 AY 09-10 AY 10-11 AY 11-12 AY 12-13 AY 13-14 AY 14-15
# of
Completers,
Post-
Baccalaureate
0 0 0 0 0 0
% Change 0.0% 0.0% 0.0% 0.0% 0.0%
Target 0.0% 0.0% 300.0% (3) 400.0% (4) 500.0% (5) 600.0% (6)

15
Baseline Year 1 Year 2 Year 3 Year 4 Year 5 Year 6
Term of Data AY 08-09 AY 09-10 AY 10-11 AY 11-12 AY 12-13 AY 13-14 AY 14-15
Total,
Undergraduate
Completers
855 930 948 901 898 957
% Change 8.8% 10.9% 5.4% 5.0% 11.9%
Target 8.8% -6.0% (803)
(-8.0 - -4.0%)
-0.7% (849)
(-2.7% - 1.3%)
2.0% (872)
(0.0% - 4.0%)
-0.5% (851)
(-2.5%- 1.5%)
-6.3% (801)
(-8.3%- -4.3%) Actual AY 06-07 Actual AY 07-08 Actual AY 08-09 Avg of Prior
Three Years
Actual AY 09-10 Actual AY 10-11 Avg of Most
Recent Two Yrs
Target Met? YES YES YES YES YES
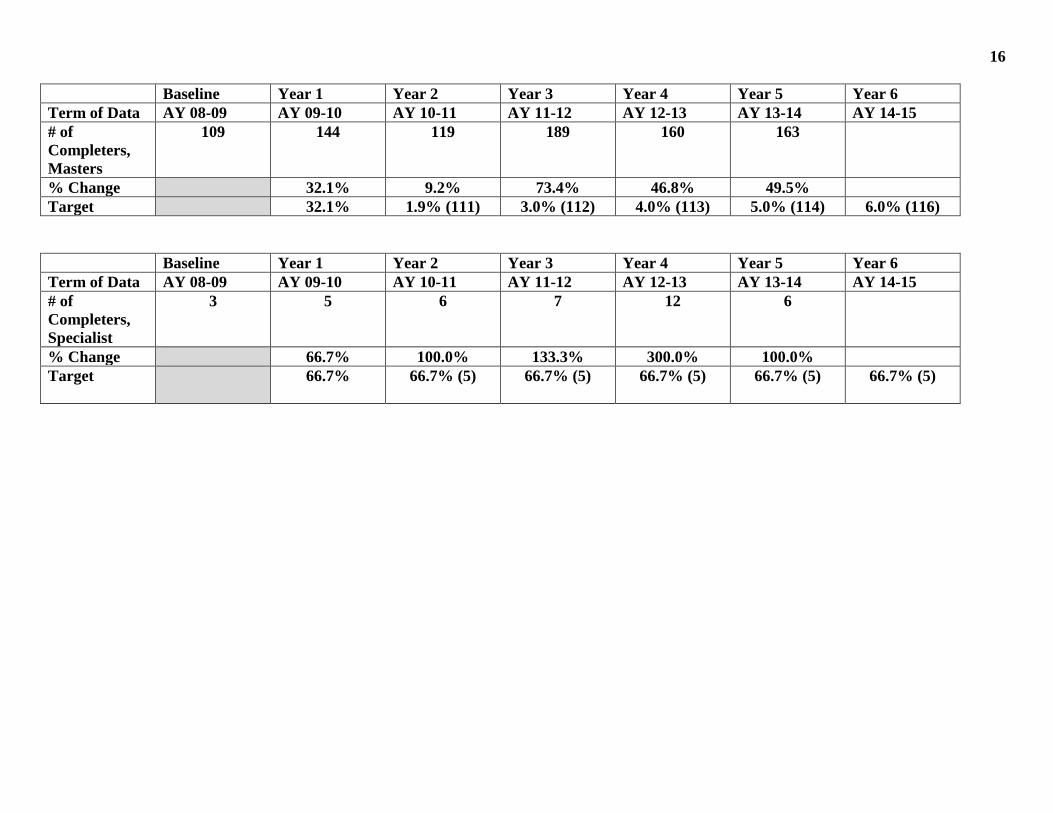
16
Baseline Year 1 Year 2 Year 3 Year 4 Year 5 Year 6
Term of Data AY 08-09 AY 09-10 AY 10-11 AY 11-12 AY 12-13 AY 13-14 AY 14-15
# of
Completers,
Masters
109 144 119 189 160 163
% Change 32.1% 9.2% 73.4% 46.8% 49.5%
Target 32.1% 1.9% (111) 3.0% (112) 4.0% (113) 5.0% (114) 6.0% (116)
Baseline Year 1 Year 2 Year 3 Year 4 Year 5 Year 6
Term of Data AY 08-09 AY 09-10 AY 10-11 AY 11-12 AY 12-13 AY 13-14 AY 14-15
# of
Completers,
Specialist
3 5 6 7 12 6
% Change 66.7% 100.0% 133.3% 300.0% 100.0%
Target 66.7% 66.7% (5) 66.7% (5) 66.7% (5)
66.7% (5)
66.7% (5)

17
Baseline Year 1 Year 2 Year 3 Year 4 Year 5 Year 6
Term of Data AY 08-09 AY 09-10 AY 10-11 AY 11-12 AY 12-13 AY 13-14 AY 14-15
Total,
Graduate
Completers
112 149 125 196 172 169
% Change 33.0% 11.6% 75.0% 53.6% 50.9%
Target 33.0% 3.6% (116) 4.5% (117) 5.4% (118) 6.3% (119) 8.0% (121) Actual AY 06-07 Actual AY 07-08 Actual AY 08-09 Avg of Prior
Three Years
Actual AY 09-10 Actual AY 10-11 Avg of Most
Recent Two Yrs
Target Met? YES YES YES YES YES
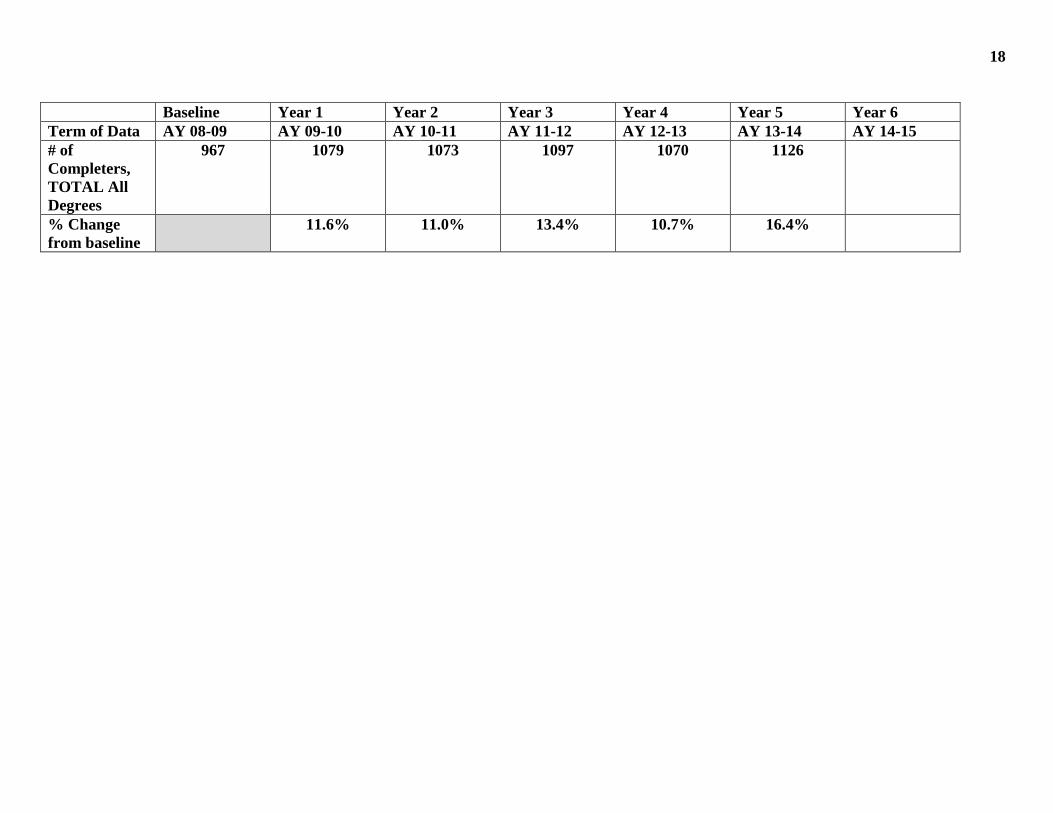
18
Baseline Year 1 Year 2 Year 3 Year 4 Year 5 Year 6
Term of Data AY 08-09 AY 09-10 AY 10-11 AY 11-12 AY 12-13 AY 13-14 AY 14-15
# of
Completers,
TOTAL All
Degrees
967 1079 1073 1097 1070 1126
% Change
from baseline
11.6% 11.0% 13.4% 10.7% 16.4%

19
1.c.i. Number of high school students enrolled at the postsecondary institution while still in high school (as defined in Board of Regents’
SSPS, student level “PR”), by semester/term (Descriptive)
Baseline Year 1 Year 2 Year 3 Year 4 Year 5 Year 6
Term of Data AY 08-09 AY 09-10 AY 10-11 AY 11-12 AY 12-13 AY 13-14 AY 14-15
Summer 10 6 4 5 1 1
Fall 285 318 212 148 147 121
Winter
Spring 211 167 135 149 141 165
TOTAL 506 491 351 302 289 287
1.c.ii. Number of semester credit hours in which high school students enroll, by semester/term (Descriptive)
Baseline Year 1 Year 2 Year 3 Year 4 Year 5 Year 6
Term of Data AY 08-09 AY 09-10 AY 10-11 AY 11-12 AY 12-13 AY 13-14 AY 14-15
Summer 44 24 29 31 3 3
Fall 988 1248 709 467 461 463
Winter
Spring 967 685 544 559 675 844
TOTAL 1999 1957 1282 1057 1139 1310
1.c.iii. Number of semester credit hours completed by high school students with a grade of A,B, C, D, F or P, by semester/term (Descriptive)
Baseline Year 1 Year 2 Year 3 Year 4 Year 5 Year 6
Term of Data AY 08-09 AY 09-10 AY 10-11 AY 11-12 AY 12-13 AY 13-14 AY 14-15
Summer 41 24 29 25 3 3
Fall 898 1194 709 434 418 403
Winter
Spring 926 602 544 493 585 817
TOTAL 1865 1820 1282 952 1006 1223

20
1.d.i. Passages rates on licensure exams (Tracked)
DISCIPLINE
EXAM THAT MUST BE
PASSED UPON
GRADUATION TO
OBTAIN
EMPLOYMENT
ENTITY THAT GRANTS
REQUIRED
LICENSURE/CERTIFICATION
(source for reporting)
BASELINE
YEAR
Passage Rate
MOST
RECENT
YEAR*
# Students
who took
exam
# Students
who met
standards
for passage
Calculated
Passage
Rate**
Athletic Training Board of Certification
Exam (BOC) Board of Certification (BOC)
25%
May 2013 –
April 2014 7 5 71.4%
Dietician
Commission on
Registration (CDR)
National Registered
Dietitian Exam
Commission on Dietetic
Registration of the American
Dietetics Association 50%
January 2014
– December
2014 6 4 66.7%
*Most Recent Year = most recent year’s data published by entity that grants licensure/certification; this should be one year later than what was reported as baseline in Year 1 of
GRAD act
**Calculated Passage Rate = # students who met standards for passage/# students who took exam
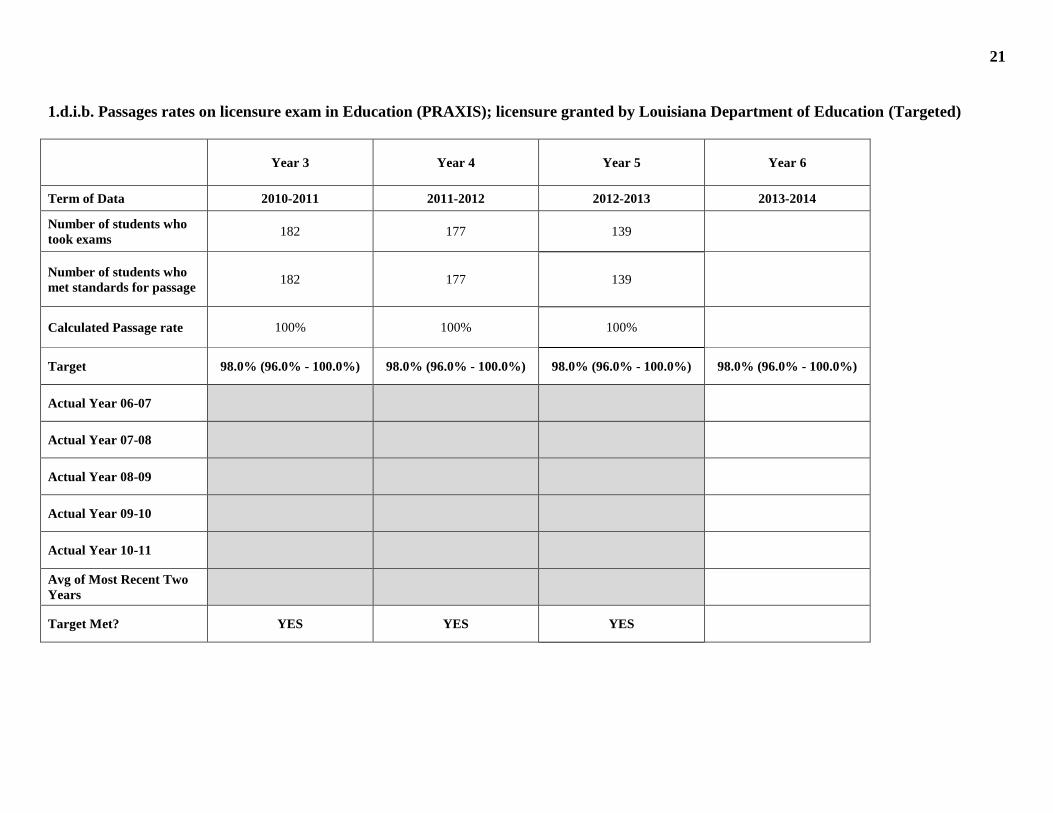
21
1.d.i.b. Passages rates on licensure exam in Education (PRAXIS); licensure granted by Louisiana Department of Education (Targeted)
Year 3 Year 4 Year 5 Year 6
Term of Data 2010-2011 2011-2012 2012-2013 2013-2014
Number of students who
took exams 182 177 139
Number of students who
met standards for passage 182 177 139
Calculated Passage rate 100% 100% 100%
Target 98.0% (96.0% - 100.0%) 98.0% (96.0% - 100.0%) 98.0% (96.0% - 100.0%) 98.0% (96.0% - 100.0%)
Actual Year 06-07
Actual Year 07-08
Actual Year 08-09
Actual Year 09-10
Actual Year 10-11
Avg of Most Recent Two
Years
Target Met? YES YES YES

22
1.d.i.d. Passages rates on licensure exam in Nursing (NCLEX-RN); licensure granted by Louisiana State Board of Nursing (Targeted)
Year 3 Year 4 Year 5 Year 6
Term of Data CY 2011 CY 2012 CY 2013 CY 2014
Number of students who
took exams 73 93 112
Number of students who
met standards for passage 68 91 96
Calculated Passage Rate 93.2% 97.9% 85.7%
Target 87.0% (85.0% - 89.0%) 87.3%(85.3% - 89.3%) 87.6% (85.6% - 89.6%) 88.0% (86.0% - 90.0%)
Actual Year 2007
Actual Year 2008
Actual Year 2009
Avg of Prior Three Years
Actual Year 2010
Actual Year 2011
Avg of Most Recent Two
Years
Target Met? YES YES YES

23
2. ARTICULATION AND TRANSFER
Narrative (3-5 pages)
Articulation and transfer policies/programs/initiatives implemented/continued during the reporting year, especially as they relate to the
Louisiana Transfer Degree programs.
The College of Arts and Sciences and Fletcher Technical Community College continues development of a “+2” program in Criminal Justice. The
program will be designed to seamlessly transition graduates of the A.S. program in Criminal Justice at Fletcher into a two-year junior and senior level
curriculum at Nicholls that will earn students the Bachelor of Science in Criminal Justice.
The College of Business has implemented articulation agreements with the Business and Technology Division of Delgado Community College and
the Business Technology Division of Elaine P. Nunez Community College. Delgado has approximately 750 students in its two year program in
business. Many of these students go on to complete four degree programs in business. Given Nicholls close proximity with New Orleans, and the
new online degree in general business, these should prove to be very successful partnerships.
Nicholls recently signed an agreement with Delgado Community College (DCC) which expresses the intent of both institutions to create a two-plus-
two articulation for DCC students majoring in the Culinary Arts, Associate of Applied Science program. Upon completion of the program, these
students would then transfer to the Chef John Folse Culinary Institute at Nicholls to earn a bachelor’s degree in culinary arts. This agreement will
also establish cross-enrollment opportunities for DCC students. .
In the spring of 2014, the Department of Languages and Literature and the University of New Orleans English Department co-wrote and signed an
initial Memorandum of Understanding to co-create an on-line M. A. in English through “consortial” participation. The curricular focus of this
program will be professional writing.
Nicholls State University entered into an academic partnership with a memorandum of agreement as the fourth member institution of the
Intercollegiate Consortium for a Master of Science in Nursing (ICMSN) in fall of 2012 with Nicholls admitting its first MSN cohort in spring of
2013. The academic partnership among the four Louisiana universities is designed to prepare advanced practice nurses, nurse executives, and nurse
educators through a model of shared governance, resources, and curricula. Table 1 reflects current enrollment in the MSN program; the first cohort
has an anticipated graduation date of May 2015.
Table 1. Master of Science in Nursing Program Enrollment

24
Semester Cohort Concentration # Applicants # Admits # Still Enrolled
Fall 2014 FNP 14 9 9
Fall 2014 PMHNP 4 3 2
Fall 2014 Nurse Executive 0 0 0
Fall 2014 Nursing Education 3 3 2
Spring 2015 FNP 24 17 17
Spring 2015 PMHNP 1 0 0
Spring 2015 Nurse Executive 0 0 0
Spring 2015 Nursing Education 1 1 1
The history program's affiliation with the National World War II Museum in New Orleans, Louisiana, enables history faculty to work with
representatives from the museum on study abroad courses and research courses using museum archives. The affiliation allows students to earn
college credit from Nicholls while studying in Europe and New Orleans. The courses are designed to for any student looking to expand his or her
historical knowledge, sharpen research and debate skills, develop leadership skills, and experience intensive international travel with a diverse group
of students, faculty, and mentors from across the country. In addition, the history program has also entered into an agreement with the Regional
Military Museum in Houma, Louisiana, to provide service learning internship opportunities involving research and public service. The program is
currently in the progress of formalizing an agreement with Laurel Valley Plantation in Thibodaux, Louisiana, to provide service learning internship
opportunities.
Data-based evaluation, including student performance, conducted to ascertain effectiveness during the reporting year.
Within the university’s student information system, data is collected on transfer students’ previous institutions. The collection of this data allows
Nicholls to track cohorts from transferring institutions to help supply data back to that institution. Outcomes and assessment reports have being
developed to provide additional feedback by institution. The feedback report can be found on the Assessment and Institutional Research webpage.
The reports give information back to the community college on the first semester performance of its transfers. The reports are only posted if the
number of transfer is sufficient as to not violate privacy issues. The report includes information on GPA and retention, as well as grade distribution
by subject and level of the course. The feedback reports are a work in progress and Nicholls will seek feedback on possible additions to the report
from our two year partners.
Retention of transfer student who are full-time, degree-seeking with a sophomore status after one year at Nicholls State University was 70.5%. The
increase in advising services and orientation programs will help to ensure that the transfer students continue to have the resources necessary to

25
succeed when they enter Nicholls. An examination of Nicholls’ graduates shows students transferring to Nicholls are a substantial part of our degrees
awarded. Nicholls State has implemented changes to ease the process for transfer students, giving them a one-stop center to answer their questions,
address their concerns, and help to keep them on track. Nicholls is committed to a student-centered approach to the process.
Tracking/monitoring/reporting mechanisms implemented/continued during the reporting year, especially as they pertain to student
transfer issues.
The Transfer Center plays a key role in helping transfer students get their four-year career started at Nicholls. Students with less than 30 hours attend
the university’s orientation program with other first-time freshmen. These students are then enrolled into Nicholls’ University College and are
advised through the Advising Center. Their progress is tracked by the professional advisors. Those with more than 30 hours attend a special
orientation. They are enrolled into the academic college associated with their chosen major and advised in that college.
Nicholls’ student information system, Banner, now has the capability to show students their progress towards degree through the self-service module
available to student on the web interface. Transfer students can now see how their credits fit into any degree plan and what needs to be completed at
Nicholls to receive their degree. The plan is broken down into general education requirements, university requirements and requirements for the
specific degree program. “What-if” scenarios can be generated to show a student how their credits fit into any degree program. This new system
allows for better advising for the student since faculty have access to this tool.
The Office of Assessment and Institutional Research has developed a new report to track students who applied to Nicholls and did not meet
admissions requirements. Students were tracked through National Student Clearinghouse (NSC). Nicholls was able to take 244 students who were
denied admissions in Fall 2012 and track them through NSC. National Student Clearinghouse showed of those 95 did attend a two year school: 38
to Delgado Community College, 32 to Fletcher Technical Community College, 5 to River Parishes Community College, 6 to South Louisiana
Community College, and 15 to Baton Rouge Community College. Thirteen students were enrolled in both two-year and four-year schools. Twenty-
seven actually enrolled in another four-year school. Unfortunately, seventy-eight did not enrolled in any form of higher education as tracked by
National Student Clearinghouse, which reflects an improvement since ninety-seven were not enrolled on the last report. Access is improving but
there is more work to be done on the communication between all institutions.
Nicholls also uses the Board of Regents’ Retention/Exit/Transfer Reports to track the transfer rates of students to and from the university. The Office
of Assessment and Institutional Research is working on a redevelopment of the university’s Fact Book to better guide the newly developed Strategic
Plan. The plan aligns with the Master Plan and is focused on student attainment, with a focus on transfer student successes. The Transfer Center, as
well as representation from Fletcher Technical Community College, will play a key role in developing the information to be tracked in the annually
produced Fact Book.
26
Development/use of agreements/external feedback reports during the reporting year.
Nicholls State University continues to work very closely with Fletcher Technical Community College. The university continues to maintain the
A.G.S. to bachelor’s agreement and is seeing increasing numbers of students participating in the cross-enrollment program. In addition, Nicholls
has established an identical relationship with River Parishes Community College. Students from both institutions have the opportunity to earn 60
credits applicable to the A.G.S. degree and a preselected program at Nicholls. Participation in the A.G.S. programs do require some cross
enrollment; however, the majority of credits may be earned at the community college. The primary advantages to this type of cooperation between
the institutions is that it gives students the opportunity to earn a two-year degree prior to transfer and to do so with no loss of credits.
Nicholls has also established an agreement with South Central Louisiana Technical College. The agreement provides the opportunity for technical
college students in the Process Production Technology program to take petroleum services and safety technology courses at Nicholls. Admitted
under visitor status, these students may complete Nicholls courses that are transferable to the technical college. The agreement also lays the
groundwork for eventual transfer of these students to Nicholls.
Nicholls maintains the Transfer Student Resource Center to assist in meeting the unique needs of transfer students. The staff of the center is
responsible for assisting students with transcript evaluation, course articulation, conducting transfer orientation, and general academic advising. The
center staff is also responsible for providing students with all information regarding the transfer process and the options and opportunities available at
Nicholls. Additional resources are available on the Transfer web site with a link “For Louisiana Community and Technical College Students.” This
web page outlines for Louisiana transfer students additional information regarding agreements with particular schools, as well as statewide
articulation guides. Information on the Louisiana Transfer Degrees is also available through this resource. Nicholls currently lists Louisiana
Transfer Degree Guides for sixteen programs.
Feedback reports to community colleges have been developed. Reports are compiled early in the spring semester and report on transfer students who
entered Nicholls during the fall semester. It reports student performance in specific general education courses by level and overall GPA. It also
reports retention to the spring semester. Discussions with Fletcher Technical Community College are continuing as these feedback reports are
developed, in hopes to make it as useful as possible to the community colleges.
When a student is declined admission to Nicholls State University, they are contacted through email Students are encouraged to consider attending
one of Louisiana’s community colleges to continue their education. A link is provided to the Admissions webpage, Partners in Education. Contact
information is available to River Parishes Community College, South Louisiana Community College, Baton Rouge Community College, Fletcher
Technical Community College, Nunez Community College, and Delgado Community College. Nicholls has begun the process of creating a bridge
27
program with Fletcher Technical Community College. This program will allow students denied admission to Nicholls, and while attending Fletcher,
to receive some of the same benefits and privileges as Nicholls students.

28
a. Phase in increased admission standards and other necessary policies in order to increase transfer student retention and graduation rates.
2.a.i.a. 1st to 2nd year retention rate of baccalaureate degree-seeking transfer students (Tracked)
Baseline Year 1 Year 2 Year 3 Year 4 Year 5 Year 6
Term of Data AY 08-09 AY 09-10 AY 10-11 AY 11-12 AY 12-13 AY 13-14 AY 14-15
# enrolled 474 518 497 434 396 416
# retained to
next Fall
semester
343 363 341 287 278 262
Rate 72.4% 70.1% 68.5% 66.1% 70.2% 63.0% Numbers reflect students who entered any time during the year cited and retained to the following fall. This is an unduplicated count.
29
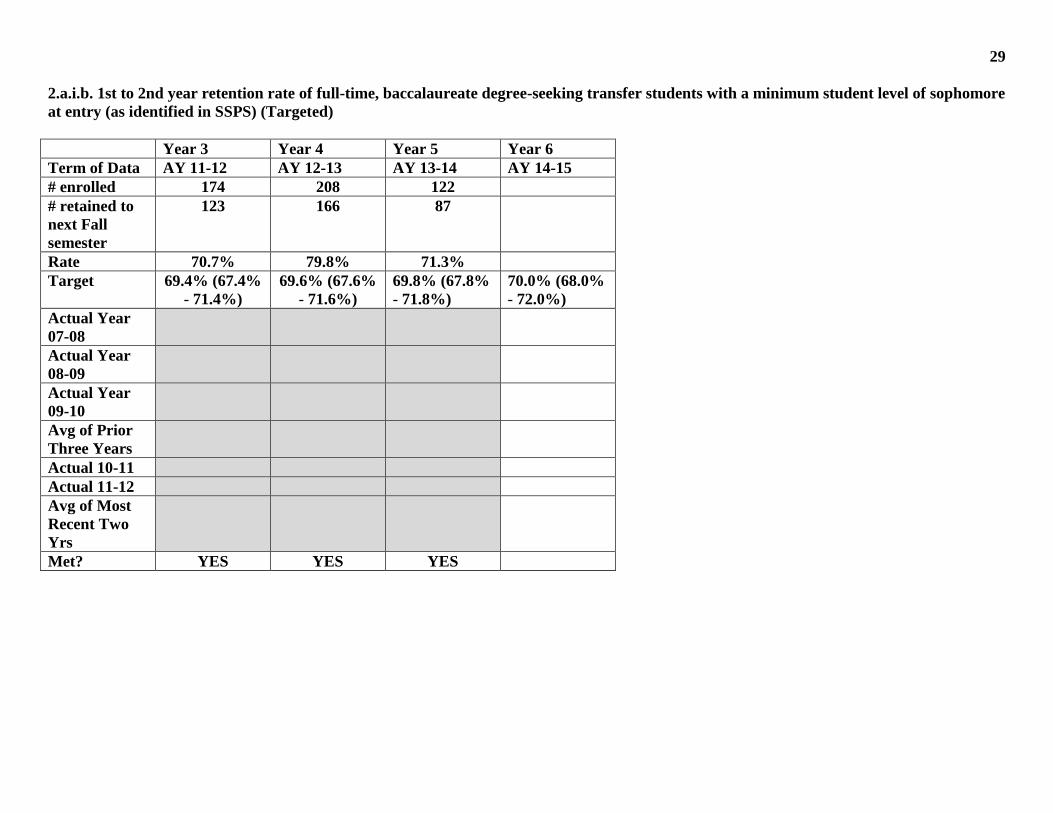
2.a.i.b. 1st to 2nd year retention rate of full-time, baccalaureate degree-seeking transfer students with a minimum student level of sophomore
at entry (as identified in SSPS) (Targeted)
Year 3 Year 4 Year 5 Year 6
Term of Data AY 11-12 AY 12-13 AY 13-14 AY 14-15
# enrolled 174 208 122
# retained to
next Fall
semester
123 166 87
Rate 70.7% 79.8% 71.3%
Target 69.4% (67.4%
- 71.4%)
69.6% (67.6%
- 71.6%)
69.8% (67.8%
- 71.8%)
70.0% (68.0%
- 72.0%)
Actual Year
07-08
Actual Year
08-09
Actual Year
09-10
Avg of Prior
Three Years
Actual 10-11
Actual 11-12
Avg of Most
Recent Two
Yrs
Met? YES YES YES

30
2.a.ii. Number of baccalaureate graduates that began as transfer students (Descriptive)
Baseline Year 1 Year 2 Year 3 Year 4 Year 5 Year 6
Term of Data AY 08-09 AY 09-10 AY 10-11 AY 11-12 AY 12-13 AY 13-14 AY 14-15
# of bacc
completers
855 930 948 901 898 957
# who began
as transfers
226 267 263 252 226 229
Percentage
who began as
transfers
26.4% 28.7% 27.7% 28.0% 25.2% 23.9%

31
2.a.iii. Percent of transfer students admitted by exception (Descriptive)
Baseline Year 1 Year 2 Year 3 Year 4 Year 5 Year 6
Term of Data AY 09-10 AY 10-11 AY 11-12 AY 12-13 AY 13-14 AY 14-15 AY 15-16
# Transfers
Admitted
(Summer)
60 60 48 56 43 47
# Admitted by
Exception
5 14 4 5 1 4
Rate 8.3% 23.3% 8.3% 8.9% 2.3% 8.5%
# Transfers
Admitted
(Fall)
306 324 285 271 267 280
# Admitted by
Exception
77 34 32 49 19 42
Rate 25.2% 10.5% 11.2% 18.1% 7.1% 15.0%
# Transfers
Admitted
(Winter)
# Admitted by
Exception
Rate
# Transfers
Admitted
(Spring)
189 142 164 153 180 134
# Admitted by
Exception
55 32 19 25 18 20
Rate 29.1% 22.5% 11.6% 16.3% 10.0% 14.9%
# Transfers
Admitted
(TOTAL)
555 526 497 480 490 461
# Admitted by
Exception
137 80 55 79 38 66
Rate 24.7% 15.2% 11.1% 16.5% 7.8% 14.3%
32
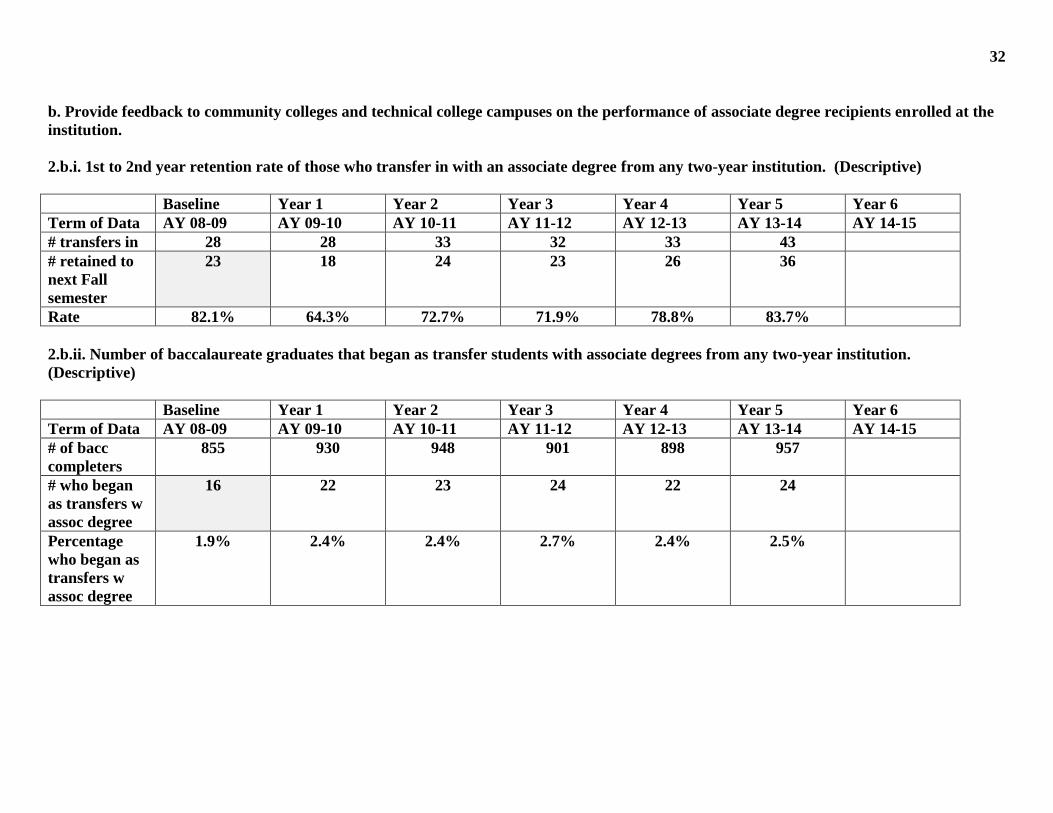
b. Provide feedback to community colleges and technical college campuses on the performance of associate degree recipients enrolled at the
institution.
2.b.i. 1st to 2nd year retention rate of those who transfer in with an associate degree from any two-year institution. (Descriptive)
Baseline Year 1 Year 2 Year 3 Year 4 Year 5 Year 6
Term of Data AY 08-09 AY 09-10 AY 10-11 AY 11-12 AY 12-13 AY 13-14 AY 14-15
# transfers in 28 28 33 32 33 43
# retained to
next Fall
semester
23 18 24 23 26 36
Rate 82.1% 64.3% 72.7% 71.9% 78.8% 83.7%
2.b.ii. Number of baccalaureate graduates that began as transfer students with associate degrees from any two-year institution.
(Descriptive)
Baseline Year 1 Year 2 Year 3 Year 4 Year 5 Year 6
Term of Data AY 08-09 AY 09-10 AY 10-11 AY 11-12 AY 12-13 AY 13-14 AY 14-15
# of bacc
completers
855 930 948 901 898 957
# who began
as transfers w
assoc degree
16 22 23 24 22 24
Percentage
who began as
transfers w
assoc degree
1.9% 2.4% 2.4% 2.7% 2.4% 2.5%

33
c. Develop referral agreements with community colleges and technical college campuses to redirect students who fail to qualify for admission
into the institution.
2.c.i. Number of students referred at any time during the given academic year to two-year colleges and technical colleges. (Descriptive)
Baseline Year 1 Year 2 Year 3 Year 4 Year 5 Year 6
Term of Data AY 09-10 AY 10-11 AY 11-12 AY 12-13 AY 13-14 AY 14-15 AY 15-16
# of students
referred
159 342 315 266 321 204
d. Demonstrate collaboration in implementing articulation and transfer requirements provided in R.S. 17:3161 through 3169.
2.d.iii. 1st to 2nd year retention rate of those who transfer with AALT, ASLT, or AST degrees (Descriptive)
Baseline Year 1 Year 2 Year 3 Year 4 Year 5 Year 6
Term of Data AY 08-09 AY 09-10 AY 10-11 AY 11-12 AY 12-13 AY 13-14 AY 14-15
# of transfer
degree
students
enrolled
0 0 0 1 0 2
# retained to
next Fall
semester
0 0 0 0 0 1
Rate 0% 0% 0% 0% 0% 50.0%
2.d.iv. Number of degree graduates that began as transfer students with AALT, ASLT, or AST degrees (Descriptive)
Baseline Year 1 Year 2 Year 3 Year 4 Year 5 Year 6
Term of Data AY 08-09 AY 09-10 AY 10-11 AY 11-12 AY 12-13 AY 13-14 AY 14-15
# of
completers
who began as
transfer
degree
students
0 0 0 0 0 1
34
3. WORKFORCE AND ECONOMIC DEVELOPMENT
Narrative (2-4 pages, not including separate narrative for Element 3.c.)
Activities conducted during the reporting year to identify programs that have low number of completers or are not aligned with current
or strategic regional and/or state workforce needs.
.N/A
Activities conducted during the reporting year to identify/modify/initiate programs that are aligned with current or strategic workforce
needs as defined by Regents* utilizing Louisiana Workforce Commission and Louisiana Economic Development published forecasts.
The College of Arts and Sciences is developing three programs aligned with workforce needs: B.S. in Criminal Justice, B.S. in Computing
Technology, and an M.A. in Professional Writing. In addition, the college has begun offering courses to participants of tours and residencies offered
by the World War II museum.
The Department of Art constantly assesses workforce needs through the internship program (Art 457), AIGA New Orleans' Annual Portfolio Review,
service learning and site visits to regional design firms. This assessment is used to develop new projects and secure new technology relevant to the
graphic design workforce. We have expanded our curriculum to include more multimedia coursework including web design and motion graphics, a
response to the recent growth of production companies moving to Louisiana. We have adapted upper level classes to include social media projects to
address growth in this sector of visual communication. The Department of Art also supplies the surrounding communities with Art Educators. The
senior capstone courses (Art 496, 497, 498) includes theory, criticism, and art history addressing the need for better critical thinking and writing skills
throughout the workforce. The new Bachelor of Fine Arts emphasis in art history supports workforce needs in the areas of Museum Technicians,
Curators, and Arts Administration in several fields. In addition, the department has updated its technology in the graphic design lab, including
equipment to allow students to study sound and video editing, providing students with state of the art experience in professional skills.
The College of Business has developed a Maritime Management Concentration within its Management curriculum. The program received all
necessary approvals and began in fall 2013. In its second year, enrollment has double to 90 students in this concentration. Coupled with the
Management degree, the Maritime Management track prepares the student for a career in general management in the maritime industry, with
particular focus on the oil and gas sector and requirements of the ship owner, as well as periphery businesses. The student will receive exposure to
commercial, legal, regulatory, economic, financial and other areas unique to this sector of the shipping industry. Developed and funded solely
through a collaborative effort between regional maritime related firms and the College of Business, the program is designed to create additional value
for both students and employers. While the program has a focus on maritime issues, it is incorporated into the four year management degree. As a

35
result, students maintain flexibility in pursuing careers in not only the maritime industry but also in those that support the industry and the business
world in general.
The College of Business has also developed a PBC (Post Baccalaureate Certificate) in Applied Business Administration as an online program
designed for individuals who have earned a baccalaureate degree and are seeking functional competency in business administration. The program
focuses on those individuals who are working in an organization or in their own business who are in need of a general understanding of the basic
business disciplines of accounting, economics, business law, marketing and management and should not be considered as equivalent to a
comprehensive business degree programs offered by Nicholls State University College of Business.
The Department of Languages and Literature’s active engagement with the University of New Orleans English Department in the creation of a
collaborative M. A. in English with a focus on professional writing is a direct response to workforce needs. The M. A. will be offered exclusively on-
line, using both Nicholls and UNO faculty resources. Hopefully this combined opportunity will attract students both within the state and nationally
as it is designed to better prepare highly qualified teachers in both areas of concentration and to prepare students who are interested in entering the
workforce in the much sought after fields of technical and professional writing.
The Department of Languages and Literature added a new area of concentration: film studies. In addition, this area of concentration is also offered
as a minor. This discipline is an appealing option for students at Nicholls, given its proximity to New Orleans and the new “Hollywood South” film
industry. The introductory film course, ENGL 240, is popular each semester, and three and four hundred level film courses deal with a variety of
issues and themes. In conjunction with the study of film, the department now offers a course in screenwriting. The department has one full-time
assistant professor who heads the concentration in film and advises the program. In addition, the department also has an adjunct whose expertise is in
screenwriting and directing, has won an award for her original film at the New Orleans Film Festival, and has been invited to Cannes to present her
film.
The English program has updated its rhetoric and professional writing concentration to add more classes that involve professional and technical
writing. A new course in advanced technical writing has been included; special topics technical writing courses have been added specifically for
culinary and petroleum sciences students. An updated curriculum for English 468, scientific writing, has been developed to meet the needs of
nursing, dietetics, and pre-med and pre-vet students. We have also added a course in grant writing and an internship program for students in the
rhetoric and professional writing concentration. Thus far, in addition to having the experience as interns, some of our graduating interns have been
offered full-time positions. In foreign languages, the department began offering a course in medical Spanish appealing to nursing students who will
need such a skill in an area with a changing demographic.
Activities conducted during the reporting year with local Workforce Investment Board.
Nicholls submits all of its academic programs for review by WIB. We have had the opportunity to assist some students to receive aid from this
resource. We have active contracts with a few of the boards, as the need arises.
36
Other means of tracking students into the workforce outside of the 2012 Employment Outcomes Report.
Nicholls conducts an Exit Survey of all graduating students every semester. The survey asks students about their plans after graduation, regarding
employment or education. For the 2013-14 academic year, 38.9% of the graduates reported they were employed in their degree field. 29.6%
reported they were employed outside their degree field. This survey is conducted at the end of the last semester for graduating students. Many have
not yet explored career possibilities yet.
Improved technology/expanded distance learning offerings during the reporting year.
In the fall of 2013, Nicholls State University officially launched Nicholls Online, with nine programs being offered completely online. Courses are
delivered in 8-week sessions, giving students five entry points into the system. Nicholls Online was developed when Nicholls became aware of a
large number of students who had stopped out of college, some with an accumulation of course credit, who expressed a need for a more flexible
delivery method of courses. Nicholls Online caters to working professionals, or parents, who cannot adhere to a traditional face-to-face schedule. It
has grown rapidly proving the need for such programs. Additional programs are being developed, including a Post-Baccalaureate Certificate in
Business Administration being launched in the fall of 2014. Fall 2014 enrollment in Nicholls Online was 324, 86% increase over Fall 2013.
In fall of 2012, Nicholls joined the Intercollegiate Consortium for a Master of Science in Nursing (ICMSN) consortium to offer its students a Master
of Science in Nursing completely online. The MSN program is accredited by the Commission on Collegiate Nursing Education (CCNE). The
consortium universities, McNeese State University, Nicholls State University, Southeastern Louisiana University, and University of Louisiana at
Lafayette work collaboratively to provide a comprehensive curriculum preparing graduates to participate in a number of opportunities in the health
care profession. Theory based courses taught through distance online learning (web-based) technology allow for flexible course completion. Faculty
members are expertly engaged in distance education, clinical practice, research, and mentor students in the following specialty concentrations:
Family Nurse Practitioner; Psychiatric/Mental Health Nurse Practitioner; Nurse Executive; and Nursing Education.

37
a. Eliminate academic programs offerings that have low student completion rates as identified by the Board of Regents or are not aligned
with current or strategic workforce needs of the state, region, or both as identified by the Louisiana Workforce Commission.
3.a.i. Number of programs eliminated as a result of institutional or Board of Regents review (Descriptive)
Baseline Year 1 Year 2 Year 3 Year 4 Year 5 Year 6
Term of Data AY 09-10 AY 10-11 AY 11-12 AY 12-13 AY 13-14 AY 14-15 AY 15-16
# of
eliminated
programs
7 1 1
0 0
0
3.a.ii. Number of programs modified or added to meet current or strategic workforce needs, as identified by the institution in collaboration
with LWC and LED (Descriptive)
Baseline Year 1 Year 2 Year 3 Year 4 Year 5 Year 6
Term of Data AY 09-10 AY 10-11 AY 11-12 AY 12-13 AY 13-14 AY 14-15 AY 15-16
# of programs
modified or
added
1 2 3 8 4 0
3.a.iii. Percent of programs aligned with workforce and economic development needs as identified by Regents* utilizing LWC or LED
published forecasts. (Descriptive)
Baseline Year 1 Year 2 Year 3 Year 4 Year 5 Year 6
Term of Data AY 09-10 AY 10-11 AY 11-12 AY 12-13 AY 13-14 AY 14-15 AY 15-16
# of programs,
all degree
levels
51 55 62 60
# of programs
aligned with
needs
51 55 62 60
% of
programs
aligned
100% 100% 100% 100%

38
b. Increase use of technology for distance learning to expand educational offerings.
3.b.i. Number of course sections with 50% and with 100% instruction through distance education (Tracked)
Baseline Year 1 Year 2 Year 3 Year 4 Year 5 Year 6
Term of Data AY 08-09 AY 09-10 AY 10-11 AY 11-12 AY 12-13 AY 13-14 AY 14-15
# of course
sections that
are 50-99%
distance
delivered
6 45 105 38 54 99
# of course
sections that
are 100%
distance
delivered
155 223 264 349 453 542
3.b.ii. Number of students enrolled in courses with 50% and with 100% instruction through distance education, duplicated headcount
(Tracked)
Baseline Year 1 Year 2 Year 3 Year 4 Year 5 Year 6
Term of Data AY 08-09 AY 09-10 AY 10-11 AY 11-12 AY 12-13 AY 13-14 AY 14-15
# of students
enrolled in
courses that
are 50-99%
distance
delivered
113 1,114 2,086 885 1,180 2,320
# of students
enrolled in
courses that
are 100%
distance
delivered
3,511 5,061 5,690 7,009 8,345 10,896

39
3.b.iii. Number of programs offered through 100% distance education by award level (Tracked Years 3 &4; Targeted Years 5 and 6)
Year 3 Year 4 Year 5 Year 6
Term of Data AY 12-13* AY 13-14 AY 14-15 AY 15-16
Associate 0 1 2
Baccalaureate 1 0 7
Post-
Baccalaureate
0 2 1
Grad Cert 1 2
Masters 2 2 3
PMC 2 3 1
Specialist 0 0 0
TOTAL 5 9 16
Target (Total
Programs)
1 (0-2) 4 (3-5) 5 (4-6) 6 (5-7)
Actual Year
08-09
Actual Year
09-10
Actual Year
10-11
Avg of Prior
Three Years
Actual Year
11-12
Actual Year
12-13
Avg of Most
Recent Two
Yrs
MET? YES YES YES
*per January 2013 BoR accreditation status report

40
3.d.i. Percent of completers found employed. Number of students completing an undergraduate award identified in Board of Regents
CRINPROG, by award level. Number of above students found employed. Calculated percent, per award level.
Year 3 Year 4 Year 5 Year 6
Term of Data 2010-11
Graduates
2011-12
Graduates
2011-12
Graduates*
2013-14
Graduates
# of Associate Degrees Awarded 107 123 123
# of Associate Degree completers found employed in Q2 78 91 91
Percent Associate Degree Completers Employed Q2 72.9% 74.0% 74.0%
# of Baccalaureate Degrees Awarded 953 904 904
# of Baccalaureate Degree completers found employed in Q2 667 683 683
Percent Baccalaureate Degree Completers Employed Q2 70.0% 74.4% 74.4%
# of Masters Degrees Awarded 119 189 189
# of Masters Degree completers found employed in Q2 83 144 144
Percent Masters Degree Completers Employed Q2 69.7% 76.2% 76.2%
# of Total Degrees Awarded 1,179 1,216 1,216
# of Total Degree completers found employed in Q2 828 918 918
Percent Total Degree Completers Employed Q2 70.2% 75.5% 75.5%
*There was no update to the Employment Outcomes Report for the 2012-13 graduates from LWC through the BOR.
41
4. Institutional Efficiency and Accountability
Narrative Report (1-2 pages)
Preparation/progress during the reporting year for the elimination of developmental course offerings and associate degrees, including
collaboration with 2-year colleges.
Nicholls currently has five associate degree programs. The associate degree in General Studies can now be obtained completely online and is being
used to recruit back students who are close to attaining it to give those students a degree. It may even inspire some to continue working towards the
baccalaureate degree.
Eliminating the following four associate degree programs at Nicholls would create a substantial loss in terms of meeting local and regional workforce
needs. In addition, significant physical infrastructure is needed for each program, something that Fletcher is not able to provide without significant
investment and increase in capacity. Thus, at this time, there are no discussions with Fletcher on providing these programs.
1. The Chef John Folse Culinary Institute offers one associate degree in Culinary Arts. The courses apply directly to the baccalaureate degree in
Culinary Arts. The associate degree is sometimes helpful when the Nicholls students are competing with students from two-year colleges for an
internship. It would be cost prohibitive for Fletcher to offer this program given the infrastructure needs, including kitchens, equipment, Bistro
facilities, and faculty. Furthermore, this program is heavily supported by donations and fund raising efforts. The associate degree is provided at
no additional cost by Nicholls since all courses are also a part of the baccalaureate program.
2. The Petroleum Engineering Technology and Safety Management department offers two associate degrees, one in Petroleum Services and one in
Safety Technology. The courses in both programs apply directly to the baccalaureate degree in Petroleum Services. Since many of the students
in the program are currently employed in the industry, the associate degree is usually a stepping stone to the baccalaureate degree. Flexible
delivery of instruction allows students with both 7-and-7 and 14-and-14 oil field schedules the opportunity to obtain their degreex. Because of
the nature of the work and the program, the associate degree gives them a credential to be achieved at the midpoint of the program. Fletcher’s
program has a focus on deep water activities but does not currently have the technology infrastructure to offer distance education learning and the
course scheduling flexibility to accommodate the oil industry crew change rotation.
3. The Associate degree program in Child Development and Preschool Management prepares graduates to teach in a child care center, teach in a
Head Start setting, serve as a paraprofessional teacher in the public school system, and own/direct a licensed child care facility. Thus the program
serves an important work force development role for the region served by Nicholls State University. The Associate degree program is an integral
component of Nicholls’ two-plus-two program leading to a Bachelors degree in the Birth to Five/Early Interventionist Education program. All
course work completed towards earning the Associate degree may be used towards a Bachelors degree at Nicholls. The University provides
building facilities and recently expended approximately $87,000 renovating our Generations Teaching Generations (GTG) day care and preschool
facilities. The GTG center is fully licensed by the State of Louisiana to provide day care and preschool services. Recreating comparable facilities
42
and hiring appropriately trained staff in order to meet current State licensure requirements in another higher education setting would create
significant costs to that institution.
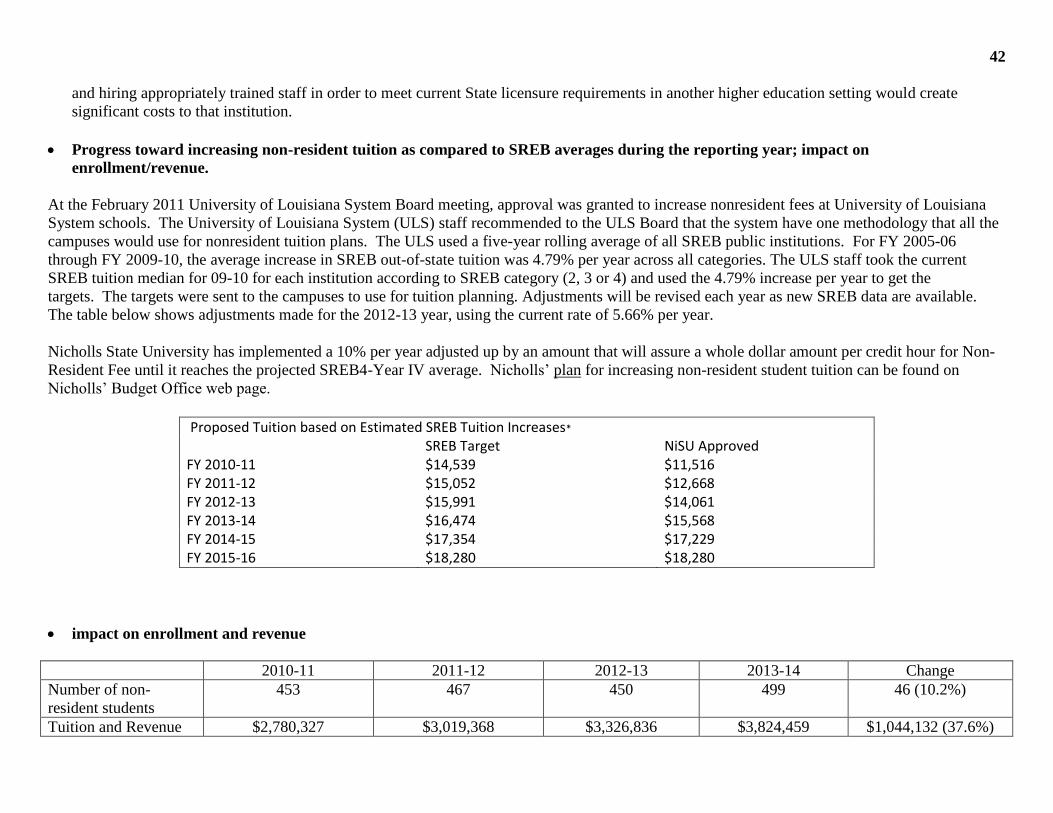
Progress toward increasing non-resident tuition as compared to SREB averages during the reporting year; impact on
enrollment/revenue.
At the February 2011 University of Louisiana System Board meeting, approval was granted to increase nonresident fees at University of Louisiana
System schools. The University of Louisiana System (ULS) staff recommended to the ULS Board that the system have one methodology that all the
campuses would use for nonresident tuition plans. The ULS used a five-year rolling average of all SREB public institutions. For FY 2005-06
through FY 2009-10, the average increase in SREB out-of-state tuition was 4.79% per year across all categories. The ULS staff took the current
SREB tuition median for 09-10 for each institution according to SREB category (2, 3 or 4) and used the 4.79% increase per year to get the
targets. The targets were sent to the campuses to use for tuition planning. Adjustments will be revised each year as new SREB data are available.
The table below shows adjustments made for the 2012-13 year, using the current rate of 5.66% per year.
Nicholls State University has implemented a 10% per year adjusted up by an amount that will assure a whole dollar amount per credit hour for Non-
Resident Fee until it reaches the projected SREB4-Year IV average. Nicholls’ plan for increasing non-resident student tuition can be found on
Nicholls’ Budget Office web page.
Proposed Tuition based on Estimated SREB Tuition Increases*
SREB Target NiSU Approved FY 2010-11 $14,539 $11,516 FY 2011-12 $15,052 $12,668 FY 2012-13 $15,991 $14,061 FY 2013-14 $16,474 $15,568 FY 2014-15 $17,354 $17,229 FY 2015-16 $18,280 $18,280
impact on enrollment and revenue
2010-11 2011-12 2012-13 2013-14 Change
Number of non-
resident students
453 467 450 499 46 (10.2%)
Tuition and Revenue $2,780,327 $3,019,368 $3,326,836 $3,824,459 $1,044,132 (37.6%)

43
a. Eliminate remedial education course offerings and developmental study programs unless such courses or programs cannot be offered at a
community college in the same geographical area.
4.a.i. Number of developmental/remedial course sections offered at the institution (Tracked)
Baseline Year 1 Year 2 Year 3 Year 4 Year 5 Year 6
Term of Data AY 09-10 AY 10-11 AY 11-12 AY 12-13 AY 13-14 AY 14-15 AY 15-16
Course sections in
mathematics
19 0 0 0 0 0
Course sections in
English
7 0 0 0 0 0
Other developmental
course sections
0 0 0 0 0 0
TOTAL 2 0 0 0 0 0
4.a.ii. Number of students enrolled in developmental/remedial courses, duplicated headcount (Tracked)
Baseline Year 1 Year 2 Year 3 Year 4 Year 5 Year 6
Term of Data AY 09-10 AY 10-11 AY 11-12 AY 12-13 AY 13-14 AY 14-15 AY 15-16
Enrollment in dev
mathematics
704 0 0 0 0 0
Enrollment in dev
English
146 0 0 0 0 0
Enrollment in other
developmental
courses
0 0 0 0 0 0
TOTAL 791 0 0 0 0 0

44
b. Eliminate associate degree program offerings unless such programs cannot be offered at a community college in the same geographic area
or when the Board of Regents has certified educational or workforce needs.
4.b.i. Number of active associate degree programs offered at the institution (Tracked)
Baseline Year 1 Year 2 Year 3 Year 4 Year 5 Year 6
Term of Data AY 09-10 AY 10-11 AY 11-12 AY 12-13 AY 13-14 AY 14-15 AY 15-16
Number of associate
degree programs
6 5 5 5 5 5
4.b.ii. Number of students (headcount) enrolled in active associate degree programs (Tracked)
Baseline Year 1 Year 2 Year 3 Year 4 Year 5 Year 6
Term of Data AY 09-10 AY 10-11 AY 11-12 AY 12-13 AY 13-14 AY 14-15 AY 15-16
Number of students
enrolled
320 227 260 200 195 184
Number includes only students enrolled in active degree programs and it is an unduplicated count of all students enrolled for the year including summer.

45
c. Upon entering the initial performance agreement, adhere to a schedule established by the institution's management board to increase
nonresident tuition amounts that are not less than the average tuition amount charged to Louisiana residents attending peer institutions in
other Southern Regional Education Board states and monitor the impact of such increases on the institution.
4.c.i. Total tuition and fees charged to non-resident students (Tracked)
Baseline Year 1 Year 2 Year 3 Year 4 Year 5 Year 6
Term of Data AY 09-10 AY 10-11 AY 11-12 AY 12-13 AY 13-14 AY 14-15 AY 15-16
Non-resident
tuition/fees (full-time)
$10,431 $11,516 $12,668 $14,061 $15,568 $17,229
Peer non-resident
tuition/fees (full-time)
$13,904 $14,539 $15,083 $16,231 $16,904
$17,354
Percentage difference
-33.3% -26.3% -19.1% -15.4% -7.9% -0.7%
d. Designate centers of excellence as defined by the Board of Regents which have received a favorable academic assessment from the Board
of Regents and have demonstrated substantial progress toward meeting the following goals:
Offering a specialized program that involves partnerships between the institution and business and industry, national laboratories,
research centers, and other institutions.
Aligning with current and strategic statewide and regional workforce needs as identified by the Louisiana Workforce Commission
and Louisiana Economic Development.
Having a high percentage of graduates or completers each year as compared to the state average percentage of graduates and that of
the institution's peers.
Having a high number of graduates or completers who enter productive careers or continue their education in advanced degree
programs, whether at the same or other institution.
Having a high level of research productivity and technology transfer.
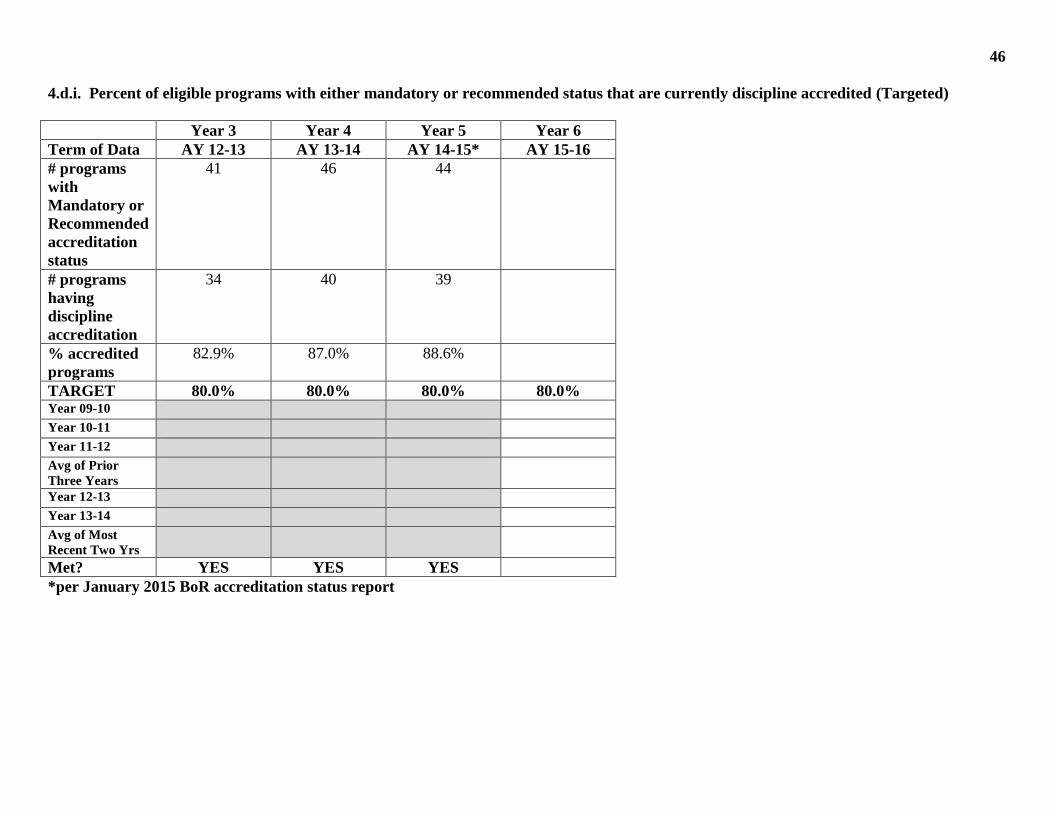
46
4.d.i. Percent of eligible programs with either mandatory or recommended status that are currently discipline accredited (Targeted)
Year 3 Year 4 Year 5 Year 6
Term of Data AY 12-13 AY 13-14 AY 14-15* AY 15-16
# programs
with
Mandatory or
Recommended
accreditation
status
41 46 44
# programs
having
discipline
accreditation
34 40 39
% accredited
programs
82.9% 87.0% 88.6%
TARGET 80.0% 80.0% 80.0% 80.0% Year 09-10 Year 10-11 Year 11-12 Avg of Prior
Three Years
Year 12-13 Year 13-14 Avg of Most
Recent Two Yrs
Met? YES YES YES
*per January 2015 BoR accreditation status report
47
Organizational Data
Submitted to
the Board of Supervisors of the
University of Louisiana System and
the Louisiana Board of Regents
In partial fulfillment of the requirements of Act 741
Louisiana GRAD Act
Section 5
Nicholls State University
University of Louisiana System
April 1, 2014

48
Number of students by classification
Headcount, undergraduate students and graduate/professional school students
Source: Enrollment data submitted by the institutions to the Statewide Student Profile System (SSPS), Board of Regents summary
report SSPSLOAD , Fall 2014
Undergraduate headcount 5696
Graduate headcount 618
Total headcount 6,314
Annual FTE (full-time equivalent) undergraduate and graduate/professional school students
Source: 2014-2015 Budget Request data submitted to Board of Regents as per SCHBRCRPT.
Undergraduate FTE 5,256.2
Graduate FTE 449.8
Total FTE 5,706.0

49
a. Number of instructional staff members
Number and FTE instructional faculty
Source: Employee data submitted by the institutions to the Employee Salary (EMPSAL) Data System, file submitted to Board of
Regents in fall 2014. Instructional faculty is determined by Primary Function = “IN” (Instruction) and EEO category = “2”
(Faculty). FTE is determined utilizing the Campus Percent Effort (CPE) field.
Total Headcount Faculty 292
FTE Faculty 256.7
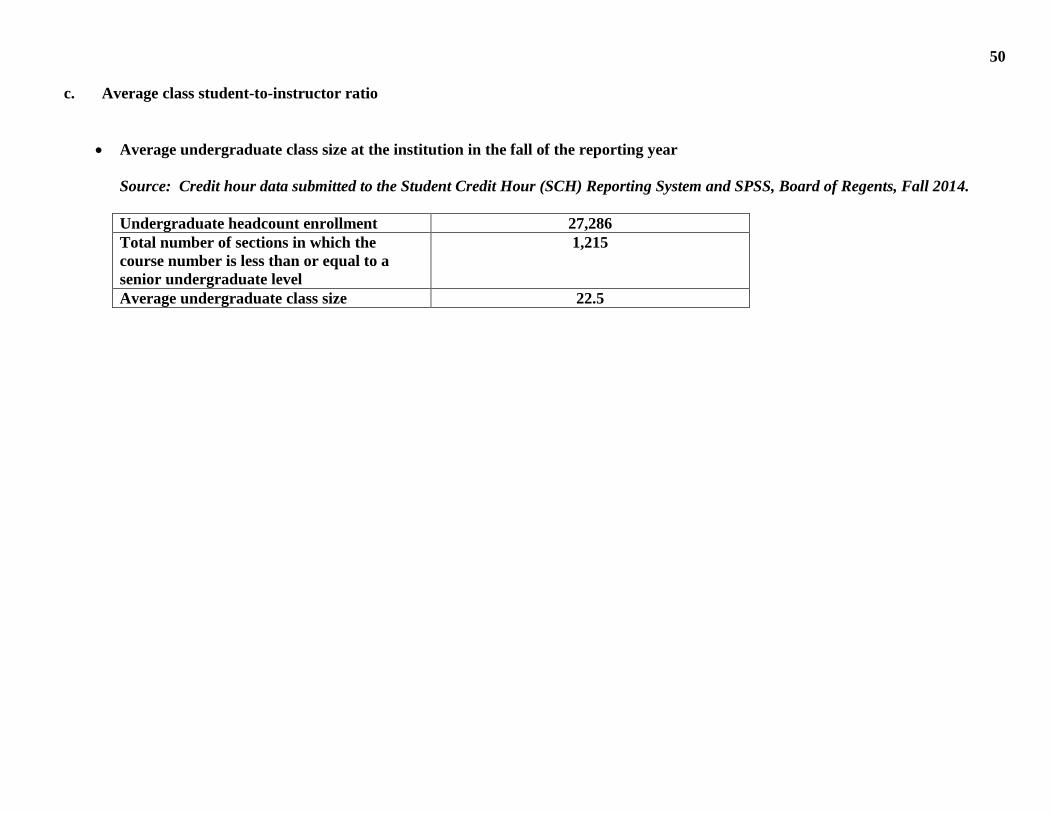
50
c. Average class student-to-instructor ratio
Average undergraduate class size at the institution in the fall of the reporting year
Source: Credit hour data submitted to the Student Credit Hour (SCH) Reporting System and SPSS, Board of Regents, Fall 2014.
Undergraduate headcount enrollment 27,286
Total number of sections in which the
course number is less than or equal to a
senior undergraduate level
1,215
Average undergraduate class size 22.5

51
d. Average number of students per instructor
Ratio of FTE students to FTE instructional faculty
Source: Budget Request information 2014-2015 as per SCHBRCRPT and Employee Salary (EMPSAL) Data System, Board of
Regents, Fall 2014.
Total FTE enrollment 5,706.0
FTE instructional faculty 256.7
Ratio of FTE students to FTE faculty 22.2 to 1

52
e. Number of non-instructional staff members in academic colleges and departments
Number and FTE non-instructional staff members by academic college (or school, if that is the highest level of academic
organization for some units)
Source: Employee data submitted to the Employee Salary (EMPSAL) Data System, submitted to Board of Regents in fall 2014, EEO
category = “1” (Executive, Administrative, Managerial) and a Primary Function not equal to “IN” (Instruction). This item reports
staff members that are an integral part of an academic college or equivalent unit.
Name of College/School Number of non-
instructional staff
FTE non-instructional
staff
College of Arts &
Sciences
1 1
College of Business
Administration
1 1
College of Education 4 4
College of Nursing &
Allied Health
1 1
University College 1 1
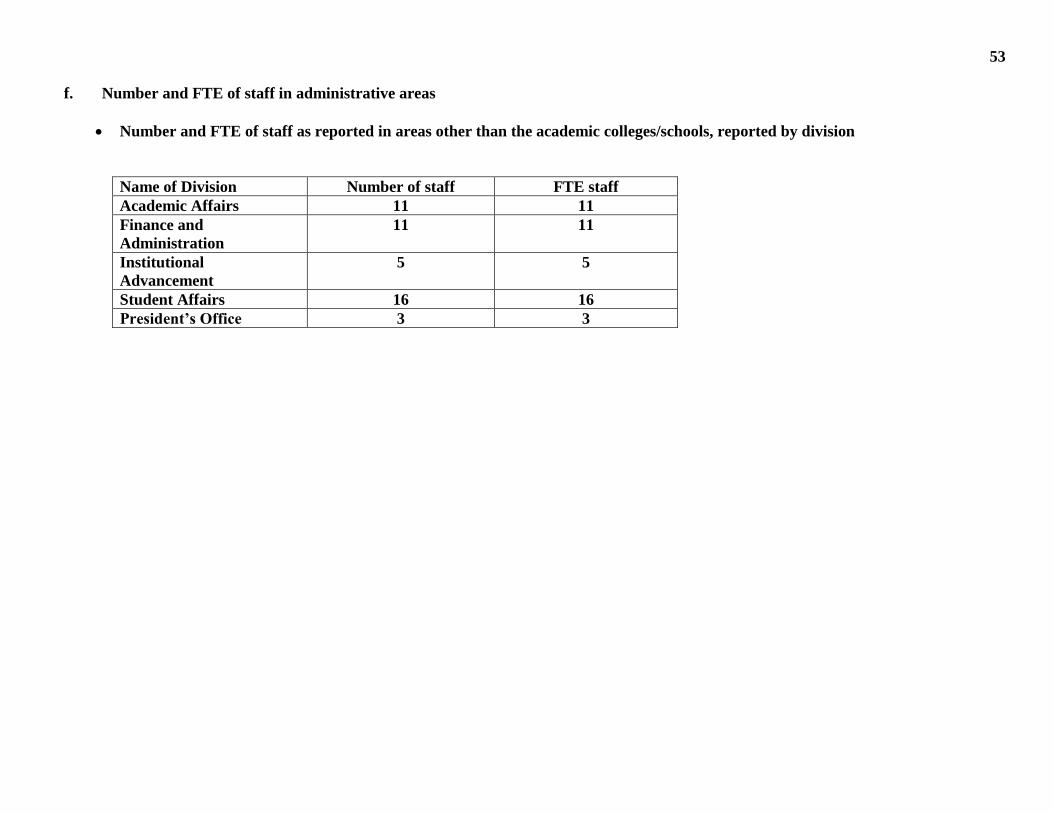
53
f. Number and FTE of staff in administrative areas
Number and FTE of staff as reported in areas other than the academic colleges/schools, reported by division
Name of Division Number of staff FTE staff
Academic Affairs 11 11
Finance and
Administration
11 11
Institutional
Advancement
5 5
Student Affairs 16 16
President’s Office 3 3

54
President
Provost and Vice
President for
Academic Affairs
Chief of Staff
Vice President for
University
Advancement
Vice President for
Student Affairs and
Enrollment Services
Dean, College of Arts and
Sciences
Dean, College of Business
Administration
Dean, College of
Education
Dean, College of Nursing
and Allied Health
Dean, University College
Asst VP of
Facilities
Executive Director of
Planning and Inst.
Effectiveness
Dean, Student Services
Chief Information
Officer
Internal Auditor
Athletic
Director Chief
Financial
Officer
g. Organization chart containing all departments and personnel in the institution down to the second level of the organization below
the president, chancellor, or equivalent position (as of Fall 2014).

55
h. Salaries of all personnel identified in subparagraph (g) above and the date, amount, and type of all increases in salary received since
June 30, 2008
A chart listing the title, fall Total Base Salary, and a history of any salary changes (within the same position) since June 30, 2008.
Position Total Base
Salary, reported
Fall 2009
Total Base
Salary, reported
Fall 2010
Total Base
Salary, reported
Fall 2011
Total Base
Salary, reported
Fall 2012
Total Base
Salary, reported
Fall 2013
Total Base
Salary, reported
Fall 2014
President 201,596 201,596 201,596 201,596 N/A 225,000
Provost, Vice
President,
Academic Affairs
142,567 N/A
Position
Eliminated
N/A N/A N/A N/A
Vice President,
Academic Affairs
N/A
142,000
Position Created
to Replace
Provost
Interim
Appointment
158,000
Permanent
Appointment
10/04/2011
158,000 158,000 105,000
Interim
Appointment
Executive Vice
President
N/A
142,000
Position Created
to Replace
Associate
Provost
Interim
Appointment
10/30/10
142,000
Interim
Appointment
Continued
158,000
Permanent
Appointment
12/08/2011
201,596
Interim President
Temporary
Appointment
N/A
Position
Eliminated
Associate Provost 118,509 N/A
Position
Eliminated
N/A N/A N/A N/A
Chief of Staff N/A N/A N/A N/A N/A Vacant
New Position
Dean, College of
Arts and Sciences
118,356 118,356 116,000
Interim
121,500
Permanent
121,500 121,500

56
Appointment Appointment
7/1/2011
Dean, College of
Business
Administration
140,200 140,200 140,200 140,200 140,200 140,200
Dean, College of
Education
110,400
Interim
Appointment
110,400
Interim
Appointment
110,400
Interim
Appointment
112,500
Permanent
Appointment
8/16/12
112,500
112,500
Dean, College of
Nursing and
Allied Health
116,600 116,600 116,600 116,600 120,000 120,000
Dean, University
College
116,400
Increase from
110,400 to
116,400 Effecive
7/01/09 for
Increased
Responsibilities
and Elimination
of Dean Position
in John Folse
Culinary
Institute
116,400 116,400 116,400 120,000 120,000
Assist Vice
President,
Facilities
93,553 93,553 93,553 93,553 93,553 93,553
Vice President,
Finance and
Administration
131,707 131,707 N/A
Position
Eliminated
N/A
N/A N/A
Assoc Vice
President, Finance
& CFO
N/A
N/A 120,000
Position
replaced VP,
Finance and
Administration
120,000 120,000 N/A
Position
Eliminated
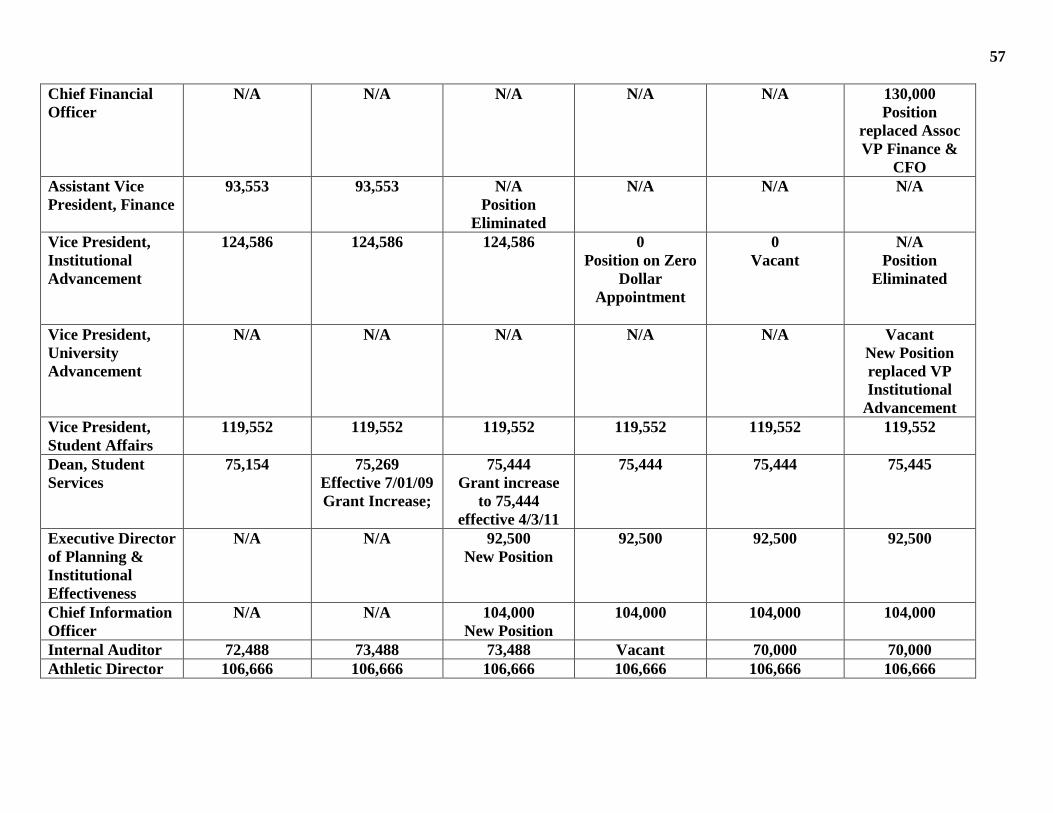
57
Chief Financial
Officer
N/A N/A N/A N/A N/A 130,000
Position
replaced Assoc
VP Finance &
CFO
Assistant Vice
President, Finance
93,553 93,553 N/A
Position
Eliminated
N/A N/A N/A
Vice President,
Institutional
Advancement
124,586 124,586 124,586 0
Position on Zero
Dollar
Appointment
0
Vacant
N/A
Position
Eliminated
Vice President,
University
Advancement
N/A
N/A
N/A
N/A
N/A
Vacant
New Position
replaced VP
Institutional
Advancement
Vice President,
Student Affairs
119,552 119,552 119,552 119,552 119,552 119,552
Dean, Student
Services
75,154 75,269
Effective 7/01/09
Grant Increase;
75,444
Grant increase
to 75,444
effective 4/3/11
75,444 75,444 75,445
Executive Director
of Planning &
Institutional
Effectiveness
N/A N/A 92,500
New Position
92,500 92,500 92,500
Chief Information
Officer
N/A N/A 104,000
New Position
104,000 104,000 104,000
Internal Auditor 72,488 73,488 73,488 Vacant 70,000 70,000
Athletic Director 106,666 106,666 106,666 106,666 106,666 106,666

58
A cost performance analysis
Note: The Board of Regents will provide the data items i. and iii. – vi. Item ii. will be reported by the institution.
i. Total operating budget by function, amount, and percent of total, reported in a
manner consistent with the National Association of College and University Business
Officers guidelines.
As reported on Form BOR-1 during the Operational Budget Process.
Expenditures by Function Amount Percentage
Instruction $ 24,840,115 47.6%
Research $ 393,750 0.8%
Public Service $ 0 0.0%
Academic Support $ 5,386,784 10.3%
Student Services $ 2,490,575 4.8%
Institutional Services $ 6,509,280 12.5%
Scholarships/Fellowships $ 4,792,667 9.1%
Plant Operations/Maintenance $ 5,680,608 10.9%
Total E&G Expenditures $ 50,063,779 96.0%
Transfers out of agency $ 0 0.0%
Athletics $ 2,059,482 4.0%
Other $ 11,238 0.0%
Total Expenditures $ 51,872,987 100.0%
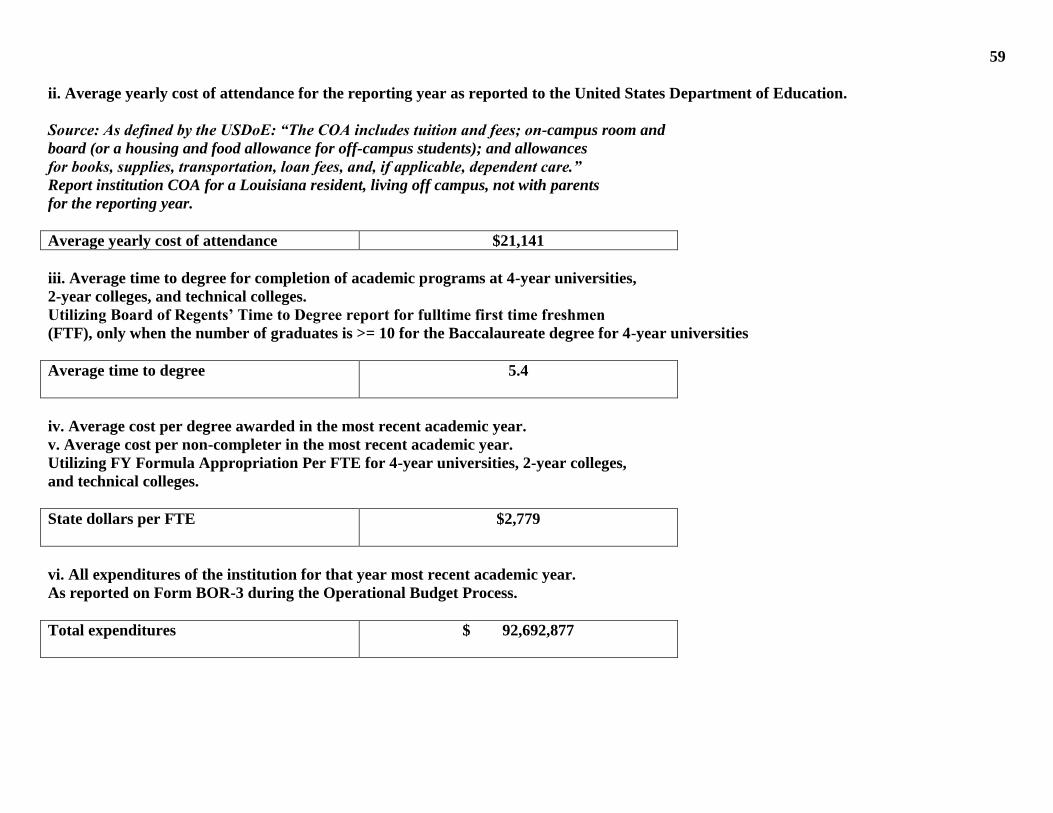
59
ii. Average yearly cost of attendance for the reporting year as reported to the United States Department of Education.
Source: As defined by the USDoE: “The COA includes tuition and fees; on-campus room and
board (or a housing and food allowance for off-campus students); and allowances
for books, supplies, transportation, loan fees, and, if applicable, dependent care.”
Report institution COA for a Louisiana resident, living off campus, not with parents
for the reporting year.
Average yearly cost of attendance $21,141
iii. Average time to degree for completion of academic programs at 4-year universities,
2-year colleges, and technical colleges.
Utilizing Board of Regents’ Time to Degree report for fulltime first time freshmen
(FTF), only when the number of graduates is >= 10 for the Baccalaureate degree for 4-year universities
Average time to degree
5.4
iv. Average cost per degree awarded in the most recent academic year.
v. Average cost per non-completer in the most recent academic year.
Utilizing FY Formula Appropriation Per FTE for 4-year universities, 2-year colleges,
and technical colleges.
State dollars per FTE
$2,779
vi. All expenditures of the institution for that year most recent academic year.
As reported on Form BOR-3 during the Operational Budget Process.
Total expenditures
$ 92,692,877