university of guelph working group on responsible …
TRANSCRIPT
UNIVERSITY OF GUELPH WORKING GROUP ON RESPONSIBLE INVESTING
Tuesday, January 27, 2015
9:00 a.m. - 11:00 a.m.
University Club Boardroom University Centre, 5th Floor
AGENDA
Page
1. Overview of WGRI Mandatea) Overview of WGRI Mandate [M.A. Chambers w. V. Hodgkinson/D. O'Leary]
2. Overview on Responsible Investinga) Overview on Responsible Investing [D. O'Leary]
3. Review the Investment Profile of the University's Endowmentsa) Review the Investment Profile of the University's Endowments [D. O'Leary]
4. Overview of Endowment Investment Policya) Overview of Endowment Investment Policy [D. O'Leary]
5. Examples of Responsible Investing Policies at other CanadianUniversities
a) Examples of Responsible Investing Policies at other Canadian Universities [D. O'Leary]
6. Review Preliminary Work Plan Schedule & Key Milestones andDetermine Next Steps, including Communication & ConsultationStrategies[M.A. Chambers w. V. Hodgkinson/D. O'Leary]
3-7
9
11-46
47-55
57-85
Page 1 of 85

Page 2 of 85

UNIVERSITYSECRETARIAT To: Members, Working Group on Responsible Investing From: Vicki Hodgkinson, University Secretary Subject: 1. Overview of WGRI Mandate
Meeting: Tuesday, January 27, 2015 Enclosed is the mandate document approved by the Board of Governors in October 2014 that prompted the establishment of the ad hoc Working Group on Responsible Investing. Members will review the document together to support development of a shared understanding about the role and responsibilities of the Working Group. The membership of the Working Group is as follows: 3 individuals appointed by the Board of Governors from among Governors, Trustees, or Board Investment Experts on the Investment Subcommittee, one of whom will be appointed as Chair
Mary Anne Chambers, Chair, Working Group (Governor) Nancy Croitoru (Governor) Virginia McLaughlin (Trustee)
2 members of the Senior Administration and a member of University staff appointed by the President
Don O’Leary, VP (Finance, Administration & Risk) John Miles, AVP (Finance & Integrated Planning) Erin Skimson, Director, Catalyst Centre
2 students, one appointed by the Central Student Association and one by the Graduate Student Association
Cass Andrew (CSA) Adina Bujold (GSA)
2 faculty, appointed by Senate Ben Bradshaw, Dept of Geography Patrick Case, Dept of Political Science
1 University of Guelph alumnus/alumna, as appointed by the Governance Committee
Karen Kuwahara, B.A.Sc. '76
Working Group Support Vicki Hodgkinson, University Secretary
Brief biographies for each member are in preparation and will be made available to the Working Group and be posted on the University Secretariat web-site with other information about the activities of the Working Group (http://bit.ly/1zsnuSj) as soon as they are all available. N:\BOG\BOG Standing Commitees & Sub-Committees\Finance Committee\Ad Hoc Working Group on Responsible Investing\Meeting Packages\January 27 2015\Cover Memo\item 1_Mandate.docx
Overview of WGRI Mandate [M.A. Chambers w.
Page 3 of 85

Page 4 of 85

Page 1 of 3
October 2014
University of Guelph
Working Group on Responsible Investing Preamble In recent years there has been increasing interest in the practice of “responsible investing” especially for organizations with large holdings of investments held for endowment or similar purposes. Many universities now have adopted policies that recognize various types of actions that can be used to engage in “responsible investing”. Most recognize and rely on the following description of RI from the “Principles for Responsible Investing” (PRI), part of an initiative involving the UNEP Finance Initiative and UN Global Compact: “Responsible investment is an approach to investment that explicitly acknowledges the relevance to the investor of environmental, social and governance (ESG) factors, and the long-term health and stability of the market as a whole. It recognizes that the generation of long-term sustainable returns is dependent on stable, well-functioning and well governed social, environmental and economic systems. Responsible investment requires investors and companies to take a wider view, acknowledging the full spectrum of risks and opportunities facing them, in order to allocate capital in a manner that is aligned with the short and long-term interests of their client and beneficiaries.” There is also mounting evidence that consideration of ESG factors is not inconsistent with the achievement of strong long-term financial portfolio returns. In this context, the Board of Governors wishes to consider development of a policy on responsible investment for the University’s Endowment Fund portfolio. To this end, it is recommended that an ad hoc Working Group on Responsible Investing be established with the following mandate and membership. Mandate The mandate of the ad hoc Working Group on Responsible Investing (WGRI) is to facilitate the Board of Governors’ desire to consider a policy on Responsible Investing (RI) that will be applied to the University’s Endowment Fund. The specific objective of the WGRI will be to prepare a report on RI for consideration by the Finance Committee that includes recommendations on options for a RI policy
Overview of WGRI Mandate [M.A. Chambers w.
Page 5 of 85

Page 2 of 3
The Finance Committee will have the responsibility to make a recommendation to the Board of Governors on any changes to relevant University policies and procedures affecting the University’s Endowment Fund. Final decisions on any recommendations emerging from the process will be made by the Board of Governors. In arriving at this outcome the WGRI will undertake a process of investigating existing policies in other jurisdictions with particular focus on universities in Canada. In exploring options, the WGRI may consider policy and process options that are considered among ‘best practices’ among major North American or Canadian universities and/or organizations in the not-for-profit sector in regards to RI.
In its deliberations the WGRI must consider the following factors as paramount in developing recommendations on any RI policy for the University’ Endowment Fund:
The members of the Board of Governors have a legal responsibility to act in a prudent
and effective manner in the oversight of managing the Endowment Fund portfolio. A major test of this responsibility includes ensuring policies and procedures provide for the highest return for the Endowment Funds and are subject to acceptable levels of risk.
The Endowment Fund must be managed in the best interests of the beneficiaries of the Fund and the policies and operational procedures regarding the investment of the Endowment Fund must reflect the University’s fiduciary responsibilities and related expectations of donors to the University.
Any RI policy recommendations must complement the mission, aims, values and governance culture of the University. While it is helpful to look at the “best practices” in RI polices, there is no ‘one-size-fits-all’ model and the feasibility of any policy recommendations must be based on University of Guelph’s current investment objectives, existing policies, and related procedures for the University’s Endowment Fund.
Composition of the ad hoc Working Group on Responsible Investing The WGRI will be comprised of the following members:
3 individuals appointed by the Board of Governors from among Governors, Trustees, or Board Investment Experts on the Investment Subcommittee, one of whom will be appointed as Chair
2 members of the Senior Administration and a member of University staff appointed by the President
2 students, one appointed by the Central Student Association and one by the Graduate Student Association
2 faculty, appointed by Senate 1 University of Guelph alumnus/alumna, as appointed by the Governance Committee
Overview of WGRI Mandate [M.A. Chambers w.
Page 6 of 85

Page 3 of 3
In conducting its work, the WGRI will develop a work plan that includes meeting the “Key Milestones” noted below. Resources available to the WGRI include personnel from the University Administration as well as relevant knowledgeable internal and external experts in the area, which may include members of the University community. Resources to support the operations and investigations of the WGRI will be provided by the Office of the Vice-President (Administration, Finance & Risk) and the University Secretariat. Preliminary Work Plan & Schedule The following preliminary work plan schedule will guide the establishment and progress of the WGRI:
KEY MILESTONES COMPLETION DATES 1. Board of Governors confirms
establishment of WGRI including proposed role & mandate and timelines via Finance and Governance Committees
October 2014
2. WGRI membership is confirmed November/December 2014 3. WGRI confirms a work plan consistent
with its role & mandate, timelines December 2014
4. Investigations, Consultation & Preparation of Report
Communications November 2014 – April 2015
Consultations with Stakeholders & Experts
January & February 2015
Final Report to Finance Committee
April 2015
5. Finance & Governance Committee Deliberations
April 2015 – September 2015
6. Presentation of recommendations to BOG by Finance Committee & Governance Committee for approval
October 2015
Approved by the Board of Governors, October 23, 2014 N:\BOG\BOG Standing Commitees & Sub-Committees\Finance Committee\Ad Hoc Working Group on Responsible Investing\Working Group on RI_Mandate & membership_Final.docx
Overview of WGRI Mandate [M.A. Chambers w.
Page 7 of 85

Page 8 of 85
UNIVERSITYSECRETARIAT To: Members, Working Group on Responsible Investing From: Vicki Hodgkinson, University Secretary Subject: 2. Overview of Responsible Investing
Meeting: Tuesday, January 27, 2015
Members will be provided with a brief overview of the “responsible investing” landscape, giving particular attention to the definition offered in the Working Group’s mandate document and referencing some of the ‘best practices’ resource materials available. In preparation for the meeting, Working Group members are invited to refer to the following web-based resources:
UNEP Finance Initiative and UN Global Compact http://www.unpri.org/
Coalition of Universities for Responsible Investing http://curi.ca/
Responsible Investment Association (Canada) http://riacanada.ca/
(These links are also posted on the “Useful Links” web-page for the Working Group on Responsible Investing: http://bit.ly/15asmOq At the meeting, Working Group members may wish to suggest other on-line resources that could be included among the “Useful Links”.)
N:\BOG\BOG Standing Commitees & Sub-Committees\Finance Committee\Ad Hoc Working Group on Responsible Investing\Meeting Packages\January 27 2015\Cover Memo\item 2_Responsible Investing.docx
Overview on Responsible Investing [D. O'Leary]
Page 9 of 85

Page 10 of 85

UNIVERSITYSECRETARIAT To: Members, Working Group on Responsible Investing From: Vicki Hodgkinson, University Secretary Subject: 3. Review the Investment Profile of the University’s Endowment 4. Overview of Endowment Investment Policy
Meeting: Tuesday, January 27, 2015 Referencing the enclosed documents, the Working Group will review the current investment profile for the University’s endowments as well as the current “Endowments Investment Policy”. N:\BOG\BOG Standing Commitees & Sub-Committees\Finance Committee\Ad Hoc Working Group on Responsible Investing\Meeting Packages\January 27 2015\Cover Memo\item 3 & 4_Endowment Investment Ref.docx
Review the Investment Profile of the University's
Page 11 of 85

Page 12 of 85

Shares Description Industry % ofEquity
Price MarketValue(000)
Russell Sector Scheme CAD
CAD
CntryCode
TECHNOLOGY 5.243,576 ALPHA NETWORKS INC TWD10 COMMUNICATIONS TECHNOLOGY 0.0 0.66 29 FA
1,000 BEL FUSE INC COMMUNICATIONS TECHNOLOGY 0.0 31.67 32 NA 4,642 CISCO SYSTEMS INC COMMUNICATIONS TECHNOLOGY 0.1 32.22 150 NA
35,515 D-LINK TWD10 COMMUNICATIONS TECHNOLOGY 0.0 0.68 24 FA 95 HARRIS CORP COMMUNICATIONS TECHNOLOGY 0.0 83.19 8 NA
349 JUNIPER NETWORKS INC COMMUNICATIONS TECHNOLOGY 0.0 25.85 9 NA 4,500 PLANTRONICS INC COMMUNICATIONS TECHNOLOGY 0.1 61.41 276 NA 1,509 QUALCOMM INC COMMUNICATIONS TECHNOLOGY 0.1 86.09 130 NA
430 ADOBE SYSTEMS INC COMPUTER SERVICES SOFTWARE & SYSTEMS 0.0 84.20 36 NA 162 AKAMAI TECHNOLOGIES INC COMPUTER SERVICES SOFTWARE & SYSTEMS 0.0 72.92 12 NA
2,400 ALTEN NPV COMPUTER SERVICES SOFTWARE & SYSTEMS 0.1 49.54 119 EF 1,211 ASSECO POLAND SA PLN1 COMPUTER SERVICES SOFTWARE & SYSTEMS 0.0 16.63 20 EG
207 AUTODESK INC COMPUTER SERVICES SOFTWARE & SYSTEMS 0.0 69.56 14 NA 291 CA INC COMPUTER SERVICES SOFTWARE & SYSTEMS 0.0 35.27 10 NA
1,500 CACI INTERNATIONAL INC COMPUTER SERVICES SOFTWARE & SYSTEMS 0.1 99.82 150 NA 146 CITRIX SYSTEMS INC COMPUTER SERVICES SOFTWARE & SYSTEMS 0.0 73.90 11 NA 553 COGNIZANT TECHNOLOGY SOLUTIONS COMPUTER SERVICES SOFTWARE & SYSTEMS 0.0 60.99 34 NA 128 COMPUTER SCIENCES CORP COMPUTER SERVICES SOFTWARE & SYSTEMS 0.0 73.03 9 NA
11,459 COMPUTER SCIENCES CORP COMPUTER SERVICES SOFTWARE & SYSTEMS 0.4 73.03 837 NA 63,000 DIGITAL CHINA HOLDINGS LTD SHS COMPUTER SERVICES SOFTWARE & SYSTEMS 0.0 1.07 68 FH
1,898 FACEBOOK INC COMPUTER SERVICES SOFTWARE & SYSTEMS 0.1 90.37 172 NA 67 F5 NETWORKS INC COMPUTER SERVICES SOFTWARE & SYSTEMS 0.0 151.11 10 NA
259 GOOGLE INC COMPUTER SERVICES SOFTWARE & SYSTEMS 0.1 609.70 158 NA 259 GOOGLE INC COMPUTER SERVICES SOFTWARE & SYSTEMS 0.1 614.64 159 NA 259 INTUIT INC COMPUTER SERVICES SOFTWARE & SYSTEMS 0.0 106.78 28 NA
7,483 MICROSOFT CORP COMPUTER SERVICES SOFTWARE & SYSTEMS 0.2 53.80 403 NA 21,825 MICROSOFT CORP COMPUTER SERVICES SOFTWARE & SYSTEMS 0.5 53.80 1,174 NA
1,080 NIIT TECHNOLOGIES INR10 COMPUTER SERVICES SOFTWARE & SYSTEMS 0.0 6.80 7 FI 2,937 ORACLE CORP COMPUTER SERVICES SOFTWARE & SYSTEMS 0.1 52.09 153 NA 6,521 POLARIS CONSULTING AND COMPUTER SERVICES SOFTWARE & SYSTEMS 0.0 3.15 21 FI 3,601 PROGRESS SOFTWARE CORP COMPUTER SERVICES SOFTWARE & SYSTEMS 0.1 31.30 113 NA 2,996 PTC INC COMPUTER SERVICES SOFTWARE & SYSTEMS 0.1 42.45 127 NA
171 RED HAT INC COMPUTER SERVICES SOFTWARE & SYSTEMS 0.0 80.08 14 NA 533 SALESFORCE.COM INC COMPUTER SERVICES SOFTWARE & SYSTEMS 0.0 68.70 37 NA 627 SYMANTEC CORP COMPUTER SERVICES SOFTWARE & SYSTEMS 0.0 29.71 19 NA 139 TERADATA CORP COMPUTER SERVICES SOFTWARE & SYSTEMS 0.0 50.59 7 NA
4,400 TIETO OYJ ORD NPV COMPUTER SERVICES SOFTWARE & SYSTEMS 0.1 30.15 133 SF 99 VERISIGN INC COMPUTER SERVICES SOFTWARE & SYSTEMS 0.0 66.02 7 NA
800 YAHOO! INC COMPUTER SERVICES SOFTWARE & SYSTEMS 0.0 58.50 47 NA 5,324 APPLE INC COMPUTER TECHNOLOGY 0.3 127.85 681 NA
Page 1 of 34 Source: The Bank of New York Mellon Corporation1/13/2015 1:01:20 PM EST
UGYG30000000 - Univ of Guelph Endow Fund
TOTAL EQUITY HOLDINGS Report ID:Reporting Currency: CAD
IEQS0002
12/31/2014
Review
the Investment
Profile of the U
niversity's P
age 13 of 85

Shares Description Industry % ofEquity
Price MarketValue(000)
Russell Sector Scheme CAD
CAD
CntryCode
TECHNOLOGY 5.28,651 ASUSTEK COMPUTER INC TWD10 COMPUTER TECHNOLOGY 0.0 12.70 110 FA
64,035 CAL-COMP ELECTRONICS(THAILAND) COMPUTER TECHNOLOGY 0.0 0.10 6 FB 99,364 COMPAL ELECTRONIC INC TW$10 COMPUTER TECHNOLOGY 0.0 0.81 81 FA
4,000 EIZO CORPORATION COMPUTER TECHNOLOGY 0.0 22.80 91 FJ 15,221 ELITEGROUP COMPUT TWD10 COMPUTER TECHNOLOGY 0.0 0.98 15 FA
1,847 EMC CORP/MA COMPUTER TECHNOLOGY 0.0 34.45 64 NA 39,311 GIGA-BYTE TECHNOLOGY CO TWD10 COMPUTER TECHNOLOGY 0.0 1.36 53 FA 1,694 HEWLETT-PACKARD CO COMPUTER TECHNOLOGY 0.0 46.48 79 NA 4,300 INSIGHT ENTERPRISES INC COMPUTER TECHNOLOGY 0.1 29.99 129 NA
836 INTERNATIONAL BUSINESS MACHINE COMPUTER TECHNOLOGY 0.1 185.83 155 NA 67,204 INVENTEC CORP TWD10 COMPUTER TECHNOLOGY 0.0 0.78 53 FA 46,375 JU TENG INTERNATIONAL HOLDING COMPUTER TECHNOLOGY 0.0 0.57 26 FH 29,842 LITE-ON TECHNOLOGY CORP TWD10 COMPUTER TECHNOLOGY 0.0 1.33 40 FA 44,150 MICRO STAR INTL TWD10 COMPUTER TECHNOLOGY 0.0 1.25 55 FA
283 NETAPP INC COMPUTER TECHNOLOGY 0.0 48.01 14 NA 16,660 PRIMAX ELECTRONICS LTD COMPUTER TECHNOLOGY 0.0 1.42 24 FA
200 SANDISK CORP COMPUTER TECHNOLOGY 0.0 113.49 23 NA 297 SEAGATE TECHNOLOGY COMPUTER TECHNOLOGY 0.0 77.02 23 NA
19,778 TPV TECHNOLOGY USD0.01 COMPUTER TECHNOLOGY 0.0 0.25 5 FH 198 WESTERN DIGITAL CORP COMPUTER TECHNOLOGY 0.0 128.22 25 NA
57,515 WISTRON CORP TWD10 COMPUTER TECHNOLOGY 0.0 1.05 60 FA 282 ELECTRONIC ARTS INC ELECTRONIC ENTERTAINMENT 0.0 54.46 15 NA 555 SAMSUNG ELECTRONICS CO LTD ELECTRONICS 0.3 1398.35 776 FK
25,150 TAIWAN SURFACE MOUNTING ELECTRONICS 0.0 1.54 39 FA 281 AMPHENOL CORP ELECTRONICS COMPONENTS 0.0 62.33 18 NA
5,140 CHECKPOINT SYSTEMS INC ELECTRONICS COMPONENTS 0.0 15.90 82 NA 25,196 CHIN-POON INDUSTRIAL TWD10 ELECTRONICS COMPONENTS 0.0 1.85 47 FA 38,960 CORETRONICS CORP TWD10 ELECTRONICS COMPONENTS 0.0 1.58 61 FA
1,164 CORNING INC ELECTRONICS COMPONENTS 0.0 26.56 31 NA 2,459 DAE DUCK ELECTRONICS CO KRW500 ELECTRONICS COMPONENTS 0.0 9.46 23 FK
47,681 HON HAI PRECISION INDUSTRY CO ELECTRONICS COMPONENTS 0.1 3.22 154 FA 20,203 ITEQ CORP TWD10 ELECTRONICS COMPONENTS 0.0 0.88 18 FA
3,473 PHISON ELECTRONICS CORP TWD10 ELECTRONICS COMPONENTS 0.0 8.03 28 FA 14,647 RADIANT OPTO-ELECT TWD10 ELECTRONICS COMPONENTS 0.0 3.72 54 FA
4,916 REUNERT ORD R0.10 ELECTRONICS COMPONENTS 0.0 6.08 30 KS 15,264 TAIFLEX SCIENTIFIC TWD10 ELECTRONICS COMPONENTS 0.0 1.66 25 FA
369 TE CONNECTIVITY LTD ELECTRONICS COMPONENTS 0.0 73.26 27 NA 13,650 TE CONNECTIVITY LTD ELECTRONICS COMPONENTS 0.4 73.26 1,000 ES
960,000 TONGDA GROUP HLDGS HKD0.01 ELECTRONICS COMPONENTS 0.1 0.14 132 FH 22,571 TRIPOD TECHNOLOGY CORP TWD10 ELECTRONICS COMPONENTS 0.0 2.28 51 FA
Page 2 of 34 Source: The Bank of New York Mellon Corporation1/13/2015 1:01:20 PM EST
UGYG30000000 - Univ of Guelph Endow Fund
TOTAL EQUITY HOLDINGS Report ID:Reporting Currency: CAD
IEQS0002
12/31/2014
Review
the Investment
Profile of the U
niversity's P
age 14 of 85

Shares Description Industry % ofEquity
Price MarketValue(000)
Russell Sector Scheme CAD
CAD
CntryCode
TECHNOLOGY 5.268,861 TRULY INTL HLDGS HKD0.10 ELECTRONICS COMPONENTS 0.0 0.46 32 FH 10,351 ZHEN DING TECHNOLOGY HOLDING ELECTRONICS COMPONENTS 0.0 3.12 32 FA
1,106 APPLIED MATERIALS INC PRODUCTION TECHNOLOGY EQUIPTMENT 0.0 28.86 32 NA 149 KLA-TENCOR CORP PRODUCTION TECHNOLOGY EQUIPTMENT 0.0 81.45 12 NA 144 LAM RESEARCH CORP PRODUCTION TECHNOLOGY EQUIPTMENT 0.0 91.90 13 NA
13,622 TEST RESEARCH INC TWD10 PRODUCTION TECHNOLOGY EQUIPTMENT 0.0 1.87 25 FA 84,635 ADVANCED SEMI ENGR TWD10 (ASE) SEMICONDUCTORS & COMPONENTS 0.1 1.40 118 FA
277 ALTERA CORP SEMICONDUCTORS & COMPONENTS 0.0 42.79 12 NA 283 ANALOG DEVICES INC SEMICONDUCTORS & COMPONENTS 0.0 64.31 18 NA
22,242 ARDENTEC CORPORATION TWD10 SEMICONDUCTORS & COMPONENTS 0.0 0.96 21 FA 230 AVAGO TECHNOLOGIES LTD SEMICONDUCTORS & COMPONENTS 0.0 116.51 27 NA 489 BROADCOM CORP SEMICONDUCTORS & COMPONENTS 0.0 50.19 25 NA
22,477 INTEGRATED DEVICE TECHNOLOGY I SEMICONDUCTORS & COMPONENTS 0.2 22.70 510 NA 4,389 INTEL CORP SEMICONDUCTORS & COMPONENTS 0.1 42.03 184 NA
64,549 KING YUAN ELECTRONICS CO LTD SEMICONDUCTORS & COMPONENTS 0.0 0.93 60 FA 217 LINEAR TECHNOLOGY CORP SEMICONDUCTORS & COMPONENTS 0.0 52.82 11 NA 182 MICROCHIP TECHNOLOGY INC SEMICONDUCTORS & COMPONENTS 0.0 52.25 10 NA 974 MICRON TECHNOLOGY INC SEMICONDUCTORS & COMPONENTS 0.0 40.55 40 NA
4,500 MICROSEMI CORP SEMICONDUCTORS & COMPONENTS 0.1 32.87 148 NA 469 NVIDIA CORP SEMICONDUCTORS & COMPONENTS 0.0 23.22 11 NA
45,881 POWERTECH TECHNOLO TWD10 SEMICONDUCTORS & COMPONENTS 0.0 1.99 91 FA 36,964 SIGURD MICROELECTR TWD10 SEMICONDUCTORS & COMPONENTS 0.0 1.13 42 FA
1,507 SILICON WORKS CO LTD SEMICONDUCTORS & COMPONENTS 0.0 26.34 40 FK 6,424 TAIWAN MASK CORP TWD10 SEMICONDUCTORS & COMPONENTS 0.0 0.37 2 FA
959 TEXAS INSTRUMENTS INC SEMICONDUCTORS & COMPONENTS 0.0 61.93 59 NA 240 XILINX INC SEMICONDUCTORS & COMPONENTS 0.0 50.14 12 NA
29,677 CELESTICA INC TECHNOLOGY: MISC 0.2 13.65 405 NC 44,330 PEGATRON CORP TECHNOLOGY: MISC 0.1 2.68 119 FA 39,439 BYD ELECTRONIC INTERNATIONAL TELECOMMUNICATIONS EQUIPMENT 0.0 1.12 44 FH 15,959 CHINA FIBER OPTIC NETWORK TELECOMMUNICATIONS EQUIPMENT 0.0 0.31 5 FH
91 INTOPS CO KRW500 TELECOMMUNICATIONS EQUIPMENT 0.0 17.07 2 FK 192 MOTOROLA SOLUTIONS INC TELECOMMUNICATIONS EQUIPMENT 0.0 77.70 15 NA
21,600 PACE PLC ORD5P TELECOMMUNICATIONS EQUIPMENT 0.1 6.27 135 EX 7,026 WISTRON NEWEB CORP TELECOMMUNICATIONS EQUIPMENT 0.0 2.46 17 FA
HEALTH CARE 7.01,446 ABBVIE INC BIOTECHNOLOGY 0.0 75.80 110 NA
180 ALEXION PHARMACEUTICALS INC BIOTECHNOLOGY 0.0 214.31 39 NA 691 AMGEN INC BIOTECHNOLOGY 0.1 184.50 127 NA
Page 3 of 34 Source: The Bank of New York Mellon Corporation1/13/2015 1:01:20 PM EST
UGYG30000000 - Univ of Guelph Endow Fund
TOTAL EQUITY HOLDINGS Report ID:Reporting Currency: CAD
IEQS0002
12/31/2014
Review
the Investment
Profile of the U
niversity's P
age 15 of 85

Shares Description Industry % ofEquity
Price MarketValue(000)
Russell Sector Scheme CAD
CAD
CntryCode
HEALTH CARE 7.0492 BAXTER INTERNATIONAL INC BIOTECHNOLOGY 0.0 84.89 42 NA 214 BIOGEN IDEC INC BIOTECHNOLOGY 0.0 393.17 84 NA 725 CELGENE CORP BIOTECHNOLOGY 0.0 129.56 94 NA 400 LONZA GROUP AG CHF1(REGISTERED BIOTECHNOLOGY 0.0 130.79 52 ES
1,300 MIRACA HOLDINGS INC BIOTECHNOLOGY 0.0 50.33 65 FJ 67 REGENERON PHARMACEUTICALS INC BIOTECHNOLOGY 0.0 475.17 32 NA
7,345 AMSURG CORP HEALTH CARE FACILITIES 0.2 63.39 466 NA 156 DAVITA HEALTHCARE PARTNERS INC HEALTH CARE FACILITIES 0.0 87.73 14 NA
7,794 HANGER INC HEALTH CARE FACILITIES 0.1 25.37 198 NA 24,200 PRIMARY HEALTH CARE NPV HEALTH CARE FACILITIES 0.0 4.46 108 AA
89 TENET HEALTHCARE CORP HEALTH CARE FACILITIES 0.0 58.69 5 NA 83 UNIVERSAL HEALTH SERVICES INC HEALTH CARE FACILITIES 0.0 128.87 11 NA
2,653 UNIVERSAL HEALTH SERVICES INC HEALTH CARE FACILITIES 0.2 128.87 342 NA 319 AETNA INC HEALTH CARE MANAGEMENT SERVICES 0.0 102.89 33 NA 245 ANTHEM INC HEALTH CARE MANAGEMENT SERVICES 0.0 145.56 36 NA 237 CIGNA CORPORATION COM HEALTH CARE MANAGEMENT SERVICES 0.0 119.20 28 NA 139 HUMANA INC HEALTH CARE MANAGEMENT SERVICES 0.0 166.36 23 NA 871 UNITEDHEALTH GROUP INC HEALTH CARE MANAGEMENT SERVICES 0.0 117.09 102 NA
15,850 UNITEDHEALTH GROUP INC HEALTH CARE MANAGEMENT SERVICES 0.8 117.09 1,856 NA 7,692 AIR METHODS CORP HEALTH CARE SERVICES 0.2 51.00 392 NA
276 CERNER CORP HEALTH CARE SERVICES 0.0 74.89 21 NA 2,742 ENSIGN GROUP INC/THE HEALTH CARE SERVICES 0.1 51.41 141 NA
666 EXPRESS SCRIPTS HOLDING CO HEALTH CARE SERVICES 0.0 98.07 65 NA 211 MCKESSON CORP HEALTH CARE SERVICES 0.0 240.43 51 NA
2,900 NICHII GAKKAN CO JPY50 HEALTH CARE SERVICES 0.0 9.24 27 FJ 1,900 PARAMOUNT BED HOLDINGS CO LTD HEALTH CARE: MISC 0.0 30.91 59 FJ 4,200 PROVIDENCE SERVICE CORP/THE HEALTH CARE: MISC 0.1 42.21 177 NA
174 BECTON DICKINSON AND CO MEDICAL & DENTAL INSTRUMENTS & SUPPLIES 0.0 161.18 28 NA 1,204 BOSTON SCIENTIFIC CORP MEDICAL & DENTAL INSTRUMENTS & SUPPLIES 0.0 15.35 18 NA 2,375 COLTENE HOLDING AG CHF5(REGD) MEDICAL & DENTAL INSTRUMENTS & SUPPLIES 0.1 73.44 174 ES
68 CR BARD INC MEDICAL & DENTAL INSTRUMENTS & SUPPLIES 0.0 192.99 13 NA 128 DENTSPLY INTERNATIONAL INC MEDICAL & DENTAL INSTRUMENTS & SUPPLIES 0.0 61.70 8 NA
97 EDWARDS LIFESCIENCES CORP MEDICAL & DENTAL INSTRUMENTS & SUPPLIES 0.0 147.54 14 NA 1,785 HILL-ROM HOLDINGS INC MEDICAL & DENTAL INSTRUMENTS & SUPPLIES 0.0 52.84 94 NA 1,900 HOGY MEDICAL CO Y50 MEDICAL & DENTAL INSTRUMENTS & SUPPLIES 0.0 53.13 101 FJ
78 PATTERSON COS INC MEDICAL & DENTAL INSTRUMENTS & SUPPLIES 0.0 55.71 4 NA 260 ST JUDE MEDICAL INC MEDICAL & DENTAL INSTRUMENTS & SUPPLIES 0.0 75.32 20 NA
2,350 STERIS CORP MEDICAL & DENTAL INSTRUMENTS & SUPPLIES 0.1 75.11 177 NA 271 STRYKER CORP MEDICAL & DENTAL INSTRUMENTS & SUPPLIES 0.0 109.26 30 NA 154 ZIMMER HOLDINGS INC MEDICAL & DENTAL INSTRUMENTS & SUPPLIES 0.0 131.37 20 NA
Page 4 of 34 Source: The Bank of New York Mellon Corporation1/13/2015 1:01:20 PM EST
UGYG30000000 - Univ of Guelph Endow Fund
TOTAL EQUITY HOLDINGS Report ID:Reporting Currency: CAD
IEQS0002
12/31/2014
Review
the Investment
Profile of the U
niversity's P
age 16 of 85

Shares Description Industry % ofEquity
Price MarketValue(000)
Russell Sector Scheme CAD
CAD
CntryCode
HEALTH CARE 7.0303 AGILENT TECHNOLOGIES INC MEDICAL EQUIPMENT 0.0 47.42 14 NA 185 CAREFUSION CORP MEDICAL EQUIPMENT 0.0 68.73 13 NA
6,100 CAREFUSION CORP MEDICAL EQUIPMENT 0.2 68.73 419 NA 411 COVIDIEN PLC MEDICAL EQUIPMENT 0.0 118.47 49 NA
1,724 GREATBATCH INC MEDICAL EQUIPMENT 0.0 57.10 98 NA 33 INTUITIVE SURGICAL INC MEDICAL EQUIPMENT 0.0 612.64 20 NA
894 MEDTRONIC INC MEDICAL EQUIPMENT 0.0 83.63 75 NA 4,765 OPTO CIRCUITS INDIA INR10 MEDICAL EQUIPMENT 0.0 0.46 2 FI
103 PERKINELMER INC MEDICAL EQUIPMENT 0.0 50.65 5 NA 363 THERMO FISHER SCIENTIFIC INC MEDICAL EQUIPMENT 0.0 145.12 53 NA
91 VARIAN MEDICAL SYSTEMS INC MEDICAL EQUIPMENT 0.0 100.20 9 NA 2,249 COVANCE INC MEDICAL SERVICES 0.1 120.27 270 NA
77 LABORATORY CORP OF AMERICA HOL MEDICAL SERVICES 0.0 124.98 10 NA 131 QUEST DIAGNOSTICS INC/DE MEDICAL SERVICES 0.0 77.67 10 NA
1,367 ABBOTT LABORATORIES PHARMACEUTICALS 0.0 52.14 71 NA 241 ACTAVIS PLC PHARMACEUTICALS 0.0 298.15 72 NA 270 ALLERGAN INC/UNITED STATES PHARMACEUTICALS 0.0 246.23 67 NA 189 AMERISOURCEBERGEN CORP PHARMACEUTICALS 0.0 104.43 20 NA
14,150 AMERISOURCEBERGEN CORP PHARMACEUTICALS 0.7 104.43 1,478 NA 3,400 ASTRAZENECA ORD USD0.25 PHARMACEUTICALS 0.1 82.27 280 EX 2,925 AUROBINDO PHARMA LTD PHARMACEUTICALS 0.0 20.84 61 FI 1,506 BRISTOL-MYERS SQUIBB CO PHARMACEUTICALS 0.0 68.37 103 NA
300 CARDINAL HEALTH INC PHARMACEUTICALS 0.0 93.51 28 NA 64 CHONG KUN DANG CP KRW2500 PHARMACEUTICALS 0.0 63.02 4 FK
165 CHONG KUN DANG PHARMACEUTICAL PHARMACEUTICALS 0.0 68.81 11 FK 889 ELI LILLY & CO PHARMACEUTICALS 0.0 79.91 71 NA
1,370 GILEAD SCIENCES INC PHARMACEUTICALS 0.1 109.18 150 NA 7,400 GLAXOSMITHKLINE ORD GBP0.25 PHARMACEUTICALS 0.1 24.85 184 EX
154 HOSPIRA INC PHARMACEUTICALS 0.0 70.94 11 NA 2,541 JOHNSON & JOHNSON PHARMACEUTICALS 0.1 121.12 308 NA 6,000 KYORIN HOLDINGS INC PHARMACEUTICALS 0.1 21.61 130 FJ
106 MALLINCKRODT PLC PHARMACEUTICALS 0.0 114.70 12 NA 4,700 MEDIPAL HOLDINGS CORP PHARMACEUTICALS 0.0 13.57 64 FJ 2,588 MERCK & CO INC PHARMACEUTICALS 0.1 65.78 170 NA 1,000 MERCK KGAA NPV PHARMACEUTICALS 0.0 109.91 110 ED 1,300 MOCHIDA PHARMACEUTICAL Y50 PHARMACEUTICALS 0.0 63.08 82 FJ
340 MYLAN INC/PA PHARMACEUTICALS 0.0 65.29 22 NA 7,800 NICHI-IKO PHARMACEUTICAL CO LT PHARMACEUTICALS 0.1 18.11 141 FJ 1,200 NOVARTIS AG CHF0.50 (REGD) PHARMACEUTICALS 0.1 107.65 129 ES
18,195 NOVARTIS AG CHF0.50 (REGD) PHARMACEUTICALS 0.9 107.65 1,959 ES
Page 5 of 34 Source: The Bank of New York Mellon Corporation1/13/2015 1:01:20 PM EST
UGYG30000000 - Univ of Guelph Endow Fund
TOTAL EQUITY HOLDINGS Report ID:Reporting Currency: CAD
IEQS0002
12/31/2014
Review
the Investment
Profile of the U
niversity's P
age 17 of 85

Shares Description Industry % ofEquity
Price MarketValue(000)
Russell Sector Scheme CAD
CAD
CntryCode
HEALTH CARE 7.03,300 OTSUKA HOLDINGS CO LTD PHARMACEUTICALS 0.1 34.94 115 FJ
128 PERRIGO CO PLC PHARMACEUTICALS 0.0 193.61 25 NA 5,720 PFIZER INC PHARMACEUTICALS 0.1 36.08 206 NA 1,136 PHARMSTANDARD GDR (EACH REPR1 PHARMACEUTICALS 0.0 7.01 8 IR 2,184 RICHTER GEDEON NYRT PHARMACEUTICALS 0.0 15.69 34 EM 4,930 ROCHE HLDG AG GENUSSCHEINE NPV PHARMACEUTICALS 0.7 314.61 1,551 ES 3,000 SANOFI PHARMACEUTICALS 0.1 106.04 318 EF
19,953 SELCUK ECZA DEPOSU TICARET VE PHARMACEUTICALS 0.0 1.07 21 ET 1,555 SHANGHAI PHARMACEUTICALS PHARMACEUTICALS 0.0 2.61 4 FC 1,885 SIEGFRIED HLDG AG CHF2 PHARMACEUTICALS 0.2 188.84 356 ES 2,300 STADA ARZNEIMITTEL AG ORD NPV PHARMACEUTICALS 0.0 35.39 81 ED 3,500 SUZUKEN CO LTD Y50 PHARMACEUTICALS 0.1 32.27 113 FJ 3,500 TEVA PHARMACEUTICAL IND ILS0.1 PHARMACEUTICALS 0.1 66.08 231 FZ 6,200 TOHO HOLDINGS CO LTD PHARMACEUTICALS 0.0 16.95 105 FJ
218 VERTEX PHARMACEUTICALS INC PHARMACEUTICALS 0.0 137.60 30 NA 455 ZOETIS INC PHARMACEUTICALS 0.0 49.84 23 NA
CONSUMER DISCRETIONARY 11.387,800 AIMIA INC ADVERTISING AGENCIES 0.6 14.61 1,283 NC
7,000 HARTE-HANKS INC ADVERTISING AGENCIES 0.0 8.96 63 NA 380 INTERPUBLIC GROUP OF COS INC/T ADVERTISING AGENCIES 0.0 24.06 9 NA 294 NIELSEN N V ADVERTISING AGENCIES 0.0 51.81 15 NA 225 OMNICOM GROUP INC ADVERTISING AGENCIES 0.0 89.73 20 NA
12,025 OMNICOM GROUP INC ADVERTISING AGENCIES 0.5 89.73 1,079 NA 33,618 SINOMEDIA HOLDING LIMITED ADVERTISING AGENCIES 0.0 0.65 22 FH
8,105 TELEPERFORMANCE EUR2.50 ADVERTISING AGENCIES 0.3 79.09 641 EF 3,005 VIAD CORP ADVERTISING AGENCIES 0.0 30.88 93 NA 2,800 AISIN SEIKI CO Y50 AUTO PARTS 0.1 42.07 118 FJ
206 BORGWARNER INC AUTO PARTS 0.0 63.65 13 NA 26,900 DANA HOLDING CORP AUTO PARTS 0.3 25.18 677 NA 18,929 DANA HOLDING CORP AUTO PARTS 0.2 25.18 477 NA
5,600 DELPHI AUTOMOTIVE PLC AUTO PARTS 0.2 84.23 472 EX 269 DELPHI AUTOMOTIVE PLC AUTO PARTS 0.0 84.23 23 NA
1,848 DONG YANG MECHATRO KRW500 AUTO PARTS 0.0 7.97 15 FK 139 GENUINE PARTS CO AUTO PARTS 0.0 123.43 17 NA
1,501 HANIL E-HWA CO LTD/NEW AUTO PARTS 0.0 14.49 22 FK 605 JOHNSON CONTROLS INC AUTO PARTS 0.0 55.99 34 NA
3,700 KEIHIN CORP NPV AUTO PARTS 0.0 17.34 64 FJ 18,769 MINTH GRP HKD0.10 AUTO PARTS 0.0 2.40 45 FC
Page 6 of 34 Source: The Bank of New York Mellon Corporation1/13/2015 1:01:20 PM EST
UGYG30000000 - Univ of Guelph Endow Fund
TOTAL EQUITY HOLDINGS Report ID:Reporting Currency: CAD
IEQS0002
12/31/2014
Review
the Investment
Profile of the U
niversity's P
age 18 of 85

Shares Description Industry % ofEquity
Price MarketValue(000)
Russell Sector Scheme CAD
CAD
CntryCode
CONSUMER DISCRETIONARY 11.32,743 S&T DYNAMICS CO LTD KRW2500 AUTO PARTS 0.0 8.98 25 FK
688 SEOYEON CO LTD AUTO PARTS 0.0 12.75 9 FK 4,100 TOKAI RIKA DENKI Y50 AUTO PARTS 0.0 24.61 101 FJ
22,929 APOLLO TYRES LTD AUTO SERVICES 0.0 4.10 94 FI 75,946 GAJAH TUNGGAL TBK PT AUTO SERVICES 0.0 0.13 10 FL
249 GOODYEAR TIRE & RUBBER CO/THE AUTO SERVICES 0.0 33.09 8 NA 11,500 TOYO TIRE & RUBBER Y50 AUTO SERVICES 0.1 23.05 265 FJ 20,000 YOKOHAMA RUBBER CO Y50 AUTO SERVICES 0.1 10.67 213 FJ
1,600 BAYERISCHE MOTOREN WERKE (BMW) AUTOMOBILES 0.1 125.82 201 ED 3,700 DAIMLER AG ORD NPV AUTOMOBILES 0.2 96.66 358 ED
84,072 DONGFENG MOTOR GROUP CIE LTD AUTOMOBILES 0.1 1.64 138 FC 55,457 DRB-HICOM BERHAD ORD MYR1 AUTOMOBILES 0.0 0.58 32 FN
3,494 FORD MOTOR CO AUTOMOBILES 0.0 17.95 63 NA 1,225 GENERAL MOTORS CO AUTOMOBILES 0.0 40.43 50 NA
12,520 GREAT WALL MOTOR COMPANY LTD AUTOMOBILES 0.0 6.59 82 FC 5,000 HONDA MOTOR CO NPV AUTOMOBILES 0.1 34.06 170 FJ
486 HYUNDAI MTR CO AUTOMOBILES 0.0 178.09 87 FK 15,914 JIANGLING MOTORS 'B'CNY1 AUTOMOBILES 0.0 4.58 73 FC
900 RENAULT REGIE NATIONALE DES AUTOMOBILES 0.0 84.84 76 EF 3,695 TATA MOTORS LTD AUTOMOBILES 0.1 48.97 181 FI 1,300 VOLKSWAGEN AG ORD NPV AUTOMOBILES 0.1 252.42 328 ED
199 CABLEVISION SYSTEMS CORP CABLE TELEVISION SERVICES 0.0 23.91 5 NA 2,339 COMCAST CORP CABLE TELEVISION SERVICES 0.1 67.19 157 NA
15,325 COMCAST CORP CABLE TELEVISION SERVICES 0.5 67.19 1,030 NA 14,245 COMCAST CORP CABLE TELEVISION SERVICES 0.4 66.67 950 NA
456 DIRECTV CABLE TELEVISION SERVICES 0.0 100.42 46 NA 92 SCRIPPS NETWORKS INTERACTIVE I CABLE TELEVISION SERVICES 0.0 87.18 8 NA
36,400 SHAW COMMUNICATIONS INC CABLE TELEVISION SERVICES 0.5 31.35 1,141 NC 18,400 SKY PERFECT JSAT HLDG INC NPV CABLE TELEVISION SERVICES 0.1 6.91 127 FJ
255 TIME WARNER CABLE INC CABLE TELEVISION SERVICES 0.0 176.12 45 NA 8,300 GREAT CANADIAN GAMING CORP CASINOS & GAMBLING 0.1 20.65 171 NC
14,142 GREAT CANADIAN GAMING CORP CASINOS & GAMBLING 0.1 20.65 292 NC 4,500 HEIWA CORP NPV CASINOS & GAMBLING 0.0 23.21 104 FJ
174,331 REXLOT HOLDINGS LTD CASINOS & GAMBLING 0.0 0.09 16 FH 109 GARMIN LTD CONSUMER ELECTRONICS 0.0 61.19 7 NA
62 HARMAN INTERNATIONAL INDUSTRIE CONSUMER ELECTRONICS 0.0 123.60 8 NA 1,632 TONLY ELECTRONICS HOLDINGS LTD CONSUMER ELECTRONICS 0.0 0.89 1 FH 1,026 EBAY INC CONSUMER SERVICES: MISC 0.0 65.00 67 NA
13,525 EBAY INC CONSUMER SERVICES: MISC 0.4 65.00 879 NA 250 H&R BLOCK INC CONSUMER SERVICES: MISC 0.0 39.01 10 NA
Page 7 of 34 Source: The Bank of New York Mellon Corporation1/13/2015 1:01:20 PM EST
UGYG30000000 - Univ of Guelph Endow Fund
TOTAL EQUITY HOLDINGS Report ID:Reporting Currency: CAD
IEQS0002
12/31/2014
Review
the Investment
Profile of the U
niversity's P
age 19 of 85

Shares Description Industry % ofEquity
Price MarketValue(000)
Russell Sector Scheme CAD
CAD
CntryCode
CONSUMER DISCRETIONARY 11.3395 AVON PRODUCTS INC COSMETICS 0.0 10.88 4 NA 203 ESTEE LAUDER COS INC/THE COSMETICS 0.0 88.26 18 NA
4,800 MANDOM CORP SHS Y50 COSMETICS 0.1 38.26 184 FJ 2,100 ORIFLAME COSMETICS SDR EACH COSMETICS 0.0 16.05 34 EL
248 DISCOVERY COMMUNICATIONS INC DIVERSIFIED MEDIA 0.0 39.06 10 NA 135 DISCOVERY COMMUNICATIONS INC DIVERSIFIED MEDIA 0.0 39.90 5 NA
24,447 LOPEZ HOLDINGS CORP PHP1 DIVERSIFIED MEDIA 0.0 0.17 4 FP 453 NEWS CORP DIVERSIFIED MEDIA 0.0 18.17 8 NA 761 TIME WARNER INC DIVERSIFIED MEDIA 0.0 98.94 75 NA
1,683 TWENTY FIRST CENTURY FOX INC DIVERSIFIED MEDIA 0.0 44.48 75 NA 2,300 AARON'S INC DIVERSIFIED RETAIL 0.0 35.41 81 NA
345 AMAZON.COM INC DIVERSIFIED RETAIL 0.1 359.46 124 NA 2,900 BIG LOTS INC DIVERSIFIED RETAIL 0.1 46.35 134 NA
913 CANADIAN TIRE CORP LTD DIVERSIFIED RETAIL 0.1 122.74 112 NC 397 COSTCO WHOLESALE CORP DIVERSIFIED RETAIL 0.0 164.18 65 NA 275 DOLLAR GENERAL CORP DIVERSIFIED RETAIL 0.0 81.89 23 NA 187 DOLLAR TREE INC DIVERSIFIED RETAIL 0.0 81.52 15 NA 210 E-MART CO LTD DIVERSIFIED RETAIL 0.0 213.92 45 FK
87 FAMILY DOLLAR STORES INC DIVERSIFIED RETAIL 0.0 91.74 8 NA 14,400 HOME RETAIL GROUP ORD GBP0 DIVERSIFIED RETAIL 0.0 3.75 54 EX
183 KOHL'S CORP DIVERSIFIED RETAIL 0.0 70.70 13 NA 313 MACY'S INC DIVERSIFIED RETAIL 0.0 76.15 24 NA
5,785 MAGAZINE LUIZA SA DIVERSIFIED RETAIL 0.0 3.36 19 LB 266,400 METRO HLDGS SGD1 DIVERSIFIED RETAIL 0.1 0.80 212 FM
9,200 NORDSTROM INC DIVERSIFIED RETAIL 0.4 91.95 846 NA 128 NORDSTROM INC DIVERSIFIED RETAIL 0.0 91.95 12 NA 578 TARGET CORP DIVERSIFIED RETAIL 0.0 87.92 51 NA
1,434 WAL-MART STORES INC DIVERSIFIED RETAIL 0.1 99.47 143 NA 16,200 TECHNICOLOR ENTERTAINMENT 0.0 6.50 105 EF
335 VIACOM INC ENTERTAINMENT 0.0 87.16 29 NA 1,416 WALT DISNEY CO/THE ENTERTAINMENT 0.1 109.10 155 NA 8,200 BOVIS HOMES GROUP ORD 50P HOMEBUILDING 0.1 15.97 131 EX 6,300 BROOKFIELD RESIDENTIAL HOMEBUILDING 0.1 27.87 176 NC
15,000 DR HORTON INC HOMEBUILDING 0.2 29.29 439 NA 301 DR HORTON INC HOMEBUILDING 0.0 29.29 9 NA 162 LENNAR CORP HOMEBUILDING 0.0 51.90 8 NA
26,109 MRV ENGENHARIA COM STK NPV HOMEBUILDING 0.0 3.27 85 LB 303 PULTEGROUP INC HOMEBUILDING 0.0 24.86 8 NA 193 MARRIOTT INTERNATIONAL INC/DE HOTEL/MOTEL 0.0 90.38 17 NA 162 STARWOOD HOTELS & RESORTS WORL HOTEL/MOTEL 0.0 93.90 15 NA
Page 8 of 34 Source: The Bank of New York Mellon Corporation1/13/2015 1:01:20 PM EST
UGYG30000000 - Univ of Guelph Endow Fund
TOTAL EQUITY HOLDINGS Report ID:Reporting Currency: CAD
IEQS0002
12/31/2014
Review
the Investment
Profile of the U
niversity's P
age 20 of 85

Shares Description Industry % ofEquity
Price MarketValue(000)
Russell Sector Scheme CAD
CAD
CntryCode
CONSUMER DISCRETIONARY 11.374,308 TA ENTERPRISES BHD MYR1 HOTEL/MOTEL 0.0 0.23 17 FN 24,137 TA GLOBAL BHD HOTEL/MOTEL 0.0 0.10 2 FN
112 WYNDHAM WORLDWIDE CORP HOTEL/MOTEL 0.0 99.33 11 NA 6,700 WYNDHAM WORLDWIDE CORP HOTEL/MOTEL 0.3 99.33 666 NA
74 WYNN RESORTS LTD HOTEL/MOTEL 0.0 172.30 13 NA 11,838 TCL MULTIMEDIA TECHNOLOGY HOUSEHOLD APPLIANCE 0.0 0.52 6 FH
71 WHIRLPOOL CORP HOUSEHOLD APPLIANCE 0.0 224.40 16 NA 246 NEWELL RUBBERMAID INC HOUSEHOLD EQUIP & PRODUCTS 0.0 44.12 11 NA 125 LEGGETT & PLATT INC HOUSEHOLD FURNISHINGS 0.0 49.35 6 NA
56 MOHAWK INDUSTRIES INC HOUSEHOLD FURNISHINGS 0.0 179.95 10 NA 409 CARNIVAL CORP LEISURE TIME 0.0 52.50 21 NA
90 EXPEDIA INC LEISURE TIME 0.0 98.87 9 NA 2,392 LIFE TIME FITNESS INC LEISURE TIME 0.1 65.58 157 NA
152 ROYAL CARIBBEAN CRUISES LTD LEISURE TIME 0.0 95.47 14 NA 48 THE PRICELINE GROUP INC/THE LEISURE TIME 0.0 1320.65 63 NA
101 TRIPADVISOR INC LEISURE TIME 0.0 86.47 9 NA 339 WHISTLER BLACKCOMB HLGS INC LEISURE TIME 0.0 20.52 7 NC
41 FOSSIL GROUP INC LUXURY ITEMS 0.0 128.26 5 NA 118,476 HENGDELI HOLDINGS LTD LUXURY ITEMS 0.0 0.22 26 FH
102 TIFFANY & CO LUXURY ITEMS 0.0 123.77 13 NA 12,783 AMVIG HOLDINGS LIMITED HKD0.01 PRINTING AND COPYING SERVICES 0.0 0.50 6 FH 20,085 AXEL SPRINGER SE PUBLISHING 0.6 70.19 1,410 ED 20,015 DAILY MAIL & GENERAL TRUST 'A' PUBLISHING 0.1 14.89 298 EX
205 GANNETT CO INC PUBLISHING 0.0 36.98 8 NA 7,575 QUEBECOR INC PUBLISHING 0.1 31.94 242 NC 5,230 SCHIBSTED ASA PUBLISHING 0.2 73.18 383 SN
433 CBS CORP RADIO & TV BROADCASTERS 0.0 64.10 28 NA 33,038 MEDIA PRIMA BHD MYR1 RADIO & TV BROADCASTERS 0.0 0.58 19 FN 27,813 MEDIASET ESPANA COMUNICACION RADIO & TV BROADCASTERS 0.2 14.64 407 EE 58,200 SOUTHERN CROSS MEDIA GROUP RADIO & TV BROADCASTERS 0.0 1.07 62 AA 88,352 TV AZTECA SAB DE CV RADIO & TV BROADCASTERS 0.0 0.49 43 LM 17,615 BRUNSWICK CORP/DE RECREATIONAL VEHICLES & BOATS 0.5 59.37 1,046 NA
195 HARLEY-DAVIDSON INC RECREATIONAL VEHICLES & BOATS 0.0 76.34 15 NA 2,073 BRAVO BRIO RESTAURANT GROUP IN RESTAURANTS 0.0 16.11 33 NA
28 CHIPOTLE MEXICAN GRILL INC RESTAURANTS 0.0 792.83 22 NA 120 DARDEN RESTAURANTS INC RESTAURANTS 0.0 67.91 8 NA
9,325 DARDEN RESTAURANTS INC RESTAURANTS 0.3 67.91 633 NA 883 MCDONALD'S CORP RESTAURANTS 0.0 108.53 96 NA
2,000 RED ROBIN GOURMET BURGERS INC RESTAURANTS 0.1 89.16 178 NA 679 STARBUCKS CORP RESTAURANTS 0.0 95.03 65 NA
Page 9 of 34 Source: The Bank of New York Mellon Corporation1/13/2015 1:01:20 PM EST
UGYG30000000 - Univ of Guelph Endow Fund
TOTAL EQUITY HOLDINGS Report ID:Reporting Currency: CAD
IEQS0002
12/31/2014
Review
the Investment
Profile of the U
niversity's P
age 21 of 85
Shares Description Industry % ofEquity
Price MarketValue(000)
Russell Sector Scheme CAD
CAD
CntryCode
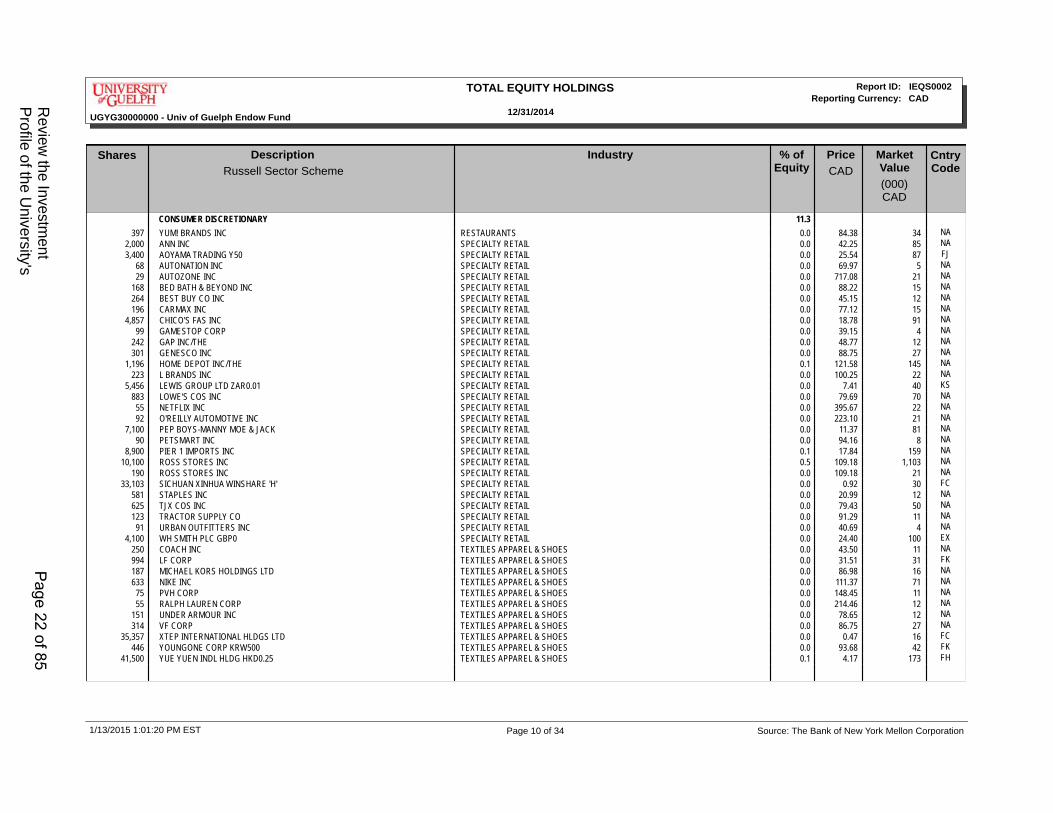
CONSUMER DISCRETIONARY 11.3397 YUM! BRANDS INC RESTAURANTS 0.0 84.38 34 NA
2,000 ANN INC SPECIALTY RETAIL 0.0 42.25 85 NA 3,400 AOYAMA TRADING Y50 SPECIALTY RETAIL 0.0 25.54 87 FJ
68 AUTONATION INC SPECIALTY RETAIL 0.0 69.97 5 NA 29 AUTOZONE INC SPECIALTY RETAIL 0.0 717.08 21 NA
168 BED BATH & BEYOND INC SPECIALTY RETAIL 0.0 88.22 15 NA 264 BEST BUY CO INC SPECIALTY RETAIL 0.0 45.15 12 NA 196 CARMAX INC SPECIALTY RETAIL 0.0 77.12 15 NA
4,857 CHICO'S FAS INC SPECIALTY RETAIL 0.0 18.78 91 NA 99 GAMESTOP CORP SPECIALTY RETAIL 0.0 39.15 4 NA
242 GAP INC/THE SPECIALTY RETAIL 0.0 48.77 12 NA 301 GENESCO INC SPECIALTY RETAIL 0.0 88.75 27 NA
1,196 HOME DEPOT INC/THE SPECIALTY RETAIL 0.1 121.58 145 NA 223 L BRANDS INC SPECIALTY RETAIL 0.0 100.25 22 NA
5,456 LEWIS GROUP LTD ZAR0.01 SPECIALTY RETAIL 0.0 7.41 40 KS 883 LOWE'S COS INC SPECIALTY RETAIL 0.0 79.69 70 NA
55 NETFLIX INC SPECIALTY RETAIL 0.0 395.67 22 NA 92 O'REILLY AUTOMOTIVE INC SPECIALTY RETAIL 0.0 223.10 21 NA
7,100 PEP BOYS-MANNY MOE & JACK SPECIALTY RETAIL 0.0 11.37 81 NA 90 PETSMART INC SPECIALTY RETAIL 0.0 94.16 8 NA
8,900 PIER 1 IMPORTS INC SPECIALTY RETAIL 0.1 17.84 159 NA 10,100 ROSS STORES INC SPECIALTY RETAIL 0.5 109.18 1,103 NA
190 ROSS STORES INC SPECIALTY RETAIL 0.0 109.18 21 NA 33,103 SICHUAN XINHUA WINSHARE 'H' SPECIALTY RETAIL 0.0 0.92 30 FC
581 STAPLES INC SPECIALTY RETAIL 0.0 20.99 12 NA 625 TJX COS INC SPECIALTY RETAIL 0.0 79.43 50 NA 123 TRACTOR SUPPLY CO SPECIALTY RETAIL 0.0 91.29 11 NA
91 URBAN OUTFITTERS INC SPECIALTY RETAIL 0.0 40.69 4 NA 4,100 WH SMITH PLC GBP0 SPECIALTY RETAIL 0.0 24.40 100 EX
250 COACH INC TEXTILES APPAREL & SHOES 0.0 43.50 11 NA 994 LF CORP TEXTILES APPAREL & SHOES 0.0 31.51 31 FK 187 MICHAEL KORS HOLDINGS LTD TEXTILES APPAREL & SHOES 0.0 86.98 16 NA 633 NIKE INC TEXTILES APPAREL & SHOES 0.0 111.37 71 NA
75 PVH CORP TEXTILES APPAREL & SHOES 0.0 148.45 11 NA 55 RALPH LAUREN CORP TEXTILES APPAREL & SHOES 0.0 214.46 12 NA
151 UNDER ARMOUR INC TEXTILES APPAREL & SHOES 0.0 78.65 12 NA 314 VF CORP TEXTILES APPAREL & SHOES 0.0 86.75 27 NA
35,357 XTEP INTERNATIONAL HLDGS LTD TEXTILES APPAREL & SHOES 0.0 0.47 16 FC 446 YOUNGONE CORP KRW500 TEXTILES APPAREL & SHOES 0.0 93.68 42 FK
41,500 YUE YUEN INDL HLDG HKD0.25 TEXTILES APPAREL & SHOES 0.1 4.17 173 FH
Page 10 of 34 Source: The Bank of New York Mellon Corporation1/13/2015 1:01:20 PM EST
UGYG30000000 - Univ of Guelph Endow Fund
TOTAL EQUITY HOLDINGS Report ID:Reporting Currency: CAD
IEQS0002
12/31/2014
Review
the Investment
Profile of the U
niversity's P
age 22 of 85

Shares Description Industry % ofEquity
Price MarketValue(000)
Russell Sector Scheme CAD
CAD
CntryCode
CONSUMER DISCRETIONARY 11.3103 HASBRO INC TOYS 0.0 63.69 7 NA 308 MATTEL INC TOYS 0.0 35.84 11 NA
CONSUMER STAPLES 8.1161,356 BAKRIE SUMATERA PLANTATIONS AGRICULTURE FISHING & RANCHING 0.0 0.00 1 FL
17,308 CHINA CULIANGWANG HKD0.1 AGRICULTURE FISHING & RANCHING 0.0 0.06 1 FH 1,000 EAST ASIATIC COMPANY LTD DKK70 AGRICULTURE FISHING & RANCHING 0.0 9.79 10 SD
37,346 GFPT PUBLIC CO LTD AGRICULTURE FISHING & RANCHING 0.0 0.63 23 FB 253,331 JAPFA COMFEED INDONESIA TBK PT AGRICULTURE FISHING & RANCHING 0.0 0.09 23 FL
142 BROWN-FORMAN CORP BEVERAGE: BREWERS & DISTILLERS 0.0 101.74 14 NA 56,590 CAMPARI EUR0.10 BEVERAGE: BREWERS & DISTILLERS 0.2 7.23 409 EI
152 CONSTELLATION BRANDS INC BEVERAGE: BREWERS & DISTILLERS 0.0 113.71 17 NA 32,185 DIAGEO ORD 28 101/108P BEVERAGE: BREWERS & DISTILLERS 0.5 33.38 1,074 EX 36,374 DUKANG DISTILLERS HOLDINGS LTD BEVERAGE: BREWERS & DISTILLERS 0.0 0.10 4 FC
6,155 HEINEKEN HOLDING EUR1.6 BEVERAGE: BREWERS & DISTILLERS 0.2 72.78 448 EN 8,500 HEINEKEN NV EUR1.60 BEVERAGE: BREWERS & DISTILLERS 0.3 82.62 702 EN
145 MOLSON COORS BREWING CO BEVERAGE: BREWERS & DISTILLERS 0.0 86.31 12 NA 3,579 COCA-COLA CO/THE BEVERAGE: SOFT DRINKS 0.1 48.90 175 NA
202 COCA-COLA ENTERPRISES INC BEVERAGE: SOFT DRINKS 0.0 51.22 10 NA 176 DR PEPPER SNAPPLE GROUP INC BEVERAGE: SOFT DRINKS 0.0 83.02 15 NA 110 KEURIG GREEN MOUNTAIN INC BEVERAGE: SOFT DRINKS 0.0 153.35 17 NA
6,684 MCLEOD RUSSEL INDIA LTD INR5 BEVERAGE: SOFT DRINKS 0.0 4.33 29 FI 131 MONSTER BEVERAGE CORP BEVERAGE: SOFT DRINKS 0.0 125.50 16 NA
1,359 PEPSICO INC BEVERAGE: SOFT DRINKS 0.1 109.52 149 NA 14,200 AHOLD(KON)NV EUR0.01 DRUG & GROCERY STORE CHAINS 0.1 20.68 294 EN
1,041 CVS HEALTH CORPORATION DRUG & GROCERY STORE CHAINS 0.1 111.55 116 NA 3,900 DELHAIZE GROUP DRUG & GROCERY STORE CHAINS 0.1 84.70 330 EB 7,997 EMPIRE CO LTD DRUG & GROCERY STORE CHAINS 0.3 87.62 701 NC
40,800 JEAN COUTU GROUP (PJC) INC DRUG & GROCERY STORE CHAINS 0.5 28.31 1,155 NC 446 KROGER CO/THE DRUG & GROCERY STORE CHAINS 0.0 74.37 33 NA
23,560 LOBLAW COMPANIES LTD DRUG & GROCERY STORE CHAINS 0.7 62.17 1,465 NC 42,800 METCASH LIMITED NPV DRUG & GROCERY STORE CHAINS 0.0 1.76 75 AA
4,603 METRO INC DRUG & GROCERY STORE CHAINS 0.2 93.30 429 NC 1,800 MINISTOP CO Y50 DRUG & GROCERY STORE CHAINS 0.0 15.43 28 FJ
42,100 MORRISON (W) SUPMKT ORD 10P DRUG & GROCERY STORE CHAINS 0.1 3.33 140 EX 4,100 PANTRY INC/THE DRUG & GROCERY STORE CHAINS 0.1 42.92 176 NA
209 SAFEWAY INC DRUG & GROCERY STORE CHAINS 0.0 40.68 9 NA 36,400 SAINSBURY (J) ORD GBP0.2857142 DRUG & GROCERY STORE CHAINS 0.1 4.46 162 EX
5,400 SPARTANNASH CO DRUG & GROCERY STORE CHAINS 0.1 30.28 163 NA
Page 11 of 34 Source: The Bank of New York Mellon Corporation1/13/2015 1:01:20 PM EST
UGYG30000000 - Univ of Guelph Endow Fund
TOTAL EQUITY HOLDINGS Report ID:Reporting Currency: CAD
IEQS0002
12/31/2014
Review
the Investment
Profile of the U
niversity's P
age 23 of 85

Shares Description Industry % ofEquity
Price MarketValue(000)
Russell Sector Scheme CAD
CAD
CntryCode
CONSUMER STAPLES 8.139,000 TESCO ORD 5P DRUG & GROCERY STORE CHAINS 0.1 3.41 133 EX
790 WALGREENS BOOTS ALLIANCE INC DRUG & GROCERY STORE CHAINS 0.0 88.26 70 NA 1,700 WELCIA HOLDINGS CO LTD NPV DRUG & GROCERY STORE CHAINS 0.0 34.54 59 FJ
327 WHOLE FOODS MARKET INC DRUG & GROCERY STORE CHAINS 0.0 58.40 19 NA 1,352 X5 RETAIL GROUP NV DRUG & GROCERY STORE CHAINS 0.0 14.13 19 EN
997 ASTRAL FOODS ORD ZAR0.01 FOODS 0.0 17.51 17 KS 163 CAMPBELL SOUP CO FOODS 0.0 50.96 8 NA
13,808 CHINA FISHERY GROUP USD0.05 FOODS 0.0 0.24 3 FC 386 CONAGRA FOODS INC FOODS 0.0 42.02 16 NA 741 DAESANG CORP KRW1000 FOODS 0.0 35.20 26 FK
80,525 DANONE FOODS 0.6 15.26 1,229 EF 76,000 FIRST PACIFIC CO US$0.01 FOODS 0.0 1.15 87 FH
5,700 FUJI OIL CO LTD/OSAKA Y50 FOODS 0.0 14.86 85 FJ 548 GENERAL MILLS INC FOODS 0.0 61.77 34 NA
22,470 GLOBAL BIO-CHEM TE HKD0.10 FOODS 0.0 0.04 1 FH 134 HERSHEY CO/THE FOODS 0.0 120.38 16 NA 122 HORMEL FOODS CORP FOODS 0.0 60.34 7 NA
92 JM SMUCKER CO/THE FOODS 0.0 116.96 11 NA 229 KELLOGG CO FOODS 0.0 75.80 17 NA 535 KRAFT FOODS GROUP INC FOODS 0.0 72.58 39 NA
13,777 LEIN HWA INDUSTRIAL TWD10 FOODS 0.0 0.75 10 FA 117 MCCORMICK & CO INC/MD FOODS 0.0 86.06 10 NA 183 MEAD JOHNSON NUTRITION CO FOODS 0.0 116.45 21 NA
1,525 MONDELEZ INTERNATIONAL INC FOODS 0.0 42.07 64 NA 12,075 NESTLE SA FOODS 0.5 85.03 1,027 ES 13,610 NESTLE SA FOODS 0.5 85.03 1,157 ES 14,700 NICHIREI Y50 FOODS 0.0 5.28 78 FJ 15,000 NIPPON FLOUR MILLS CO Y50 FOODS 0.0 5.17 78 FJ
48 SAM YANG GENEX CO KRW5000 FOODS 0.0 100.95 5 FK 43 SAMYANG CORP/NEW FOODS 0.0 65.02 3 FK
534 SYSCO CORP FOODS 0.0 45.97 25 NA 266 TYSON FOODS INC FOODS 0.0 46.43 12 NA
14,551 UNILEVER NV FOODS 0.3 45.75 666 EN 15,875 UNILEVER PLC FOODS 0.3 46.89 744 EX
5,832 UNILEVER PLC ORD GBP0.031111 FOODS 0.1 47.46 277 EX 7,400 WESTON (GEORGE) LTD FOODS 0.3 100.35 743 NC
584 ARCHER-DANIELS-MIDLAND CO FRUIT & GRAIN PROCESSING 0.0 60.23 35 NA 117 CLOROX CO PERSONAL CARE 0.0 120.70 14 NA 778 COLGATE-PALMOLIVE CO PERSONAL CARE 0.0 80.14 62 NA
4,610 HENKEL AG & CO KGAA NPV(BR) PERSONAL CARE 0.2 112.74 520 ED
Page 12 of 34 Source: The Bank of New York Mellon Corporation1/13/2015 1:01:20 PM EST
UGYG30000000 - Univ of Guelph Endow Fund
TOTAL EQUITY HOLDINGS Report ID:Reporting Currency: CAD
IEQS0002
12/31/2014
Review
the Investment
Profile of the U
niversity's P
age 24 of 85

Shares Description Industry % ofEquity
Price MarketValue(000)
Russell Sector Scheme CAD
CAD
CntryCode
CONSUMER STAPLES 8.1338 KIMBERLY-CLARK CORP PERSONAL CARE 0.0 133.82 45 NA
2,453 PROCTER & GAMBLE CO/THE PERSONAL CARE 0.1 105.50 259 NA 12,500 TATE & LYLE ORD 25P SUGAR 0.1 10.89 136 EX
3,203 TONGAAT-HULETT LTD ORD ZAR1 SUGAR 0.0 17.31 55 KS 1,794 ALTRIA GROUP INC TOBACCO 0.0 57.07 102 NA
13,723 IMPERIAL TOBACCO GROUP ORD 10P TOBACCO 0.3 51.22 703 EX 1,913 KT&G CORP TOBACCO 0.1 80.19 153 FK
327 LORILLARD INC TOBACCO 0.0 72.90 24 NA 1,410 PHILIP MORRIS INTERNATIONAL IN TOBACCO 0.1 94.34 133 NA 5,455 PHILIP MORRIS INTERNATIONAL IN TOBACCO 0.2 94.34 515 NA
280 REYNOLDS AMERICAN INC TOBACCO 0.0 74.44 21 NA
ENERGY 12.0256,834 ADARO ENERGY TBK IDR100 COAL 0.0 0.10 25 FL
209 CONSOL ENERGY INC COAL 0.0 39.16 8 NA 1 INNER MONGOLIA YITAI COAL CO COAL 0.0 1.66 FC
340,000 SHOUGANG FUSHAN RESOURCES COAL 0.0 0.25 86 FH 68 FIRST SOLAR INC ENERGY EQUIPMENT 0.0 51.65 4 NA
138 EQT CORP GAS PIPELINE 0.0 87.68 12 NA 16,167 GAZPROM OAO-SPON ADR GAS PIPELINE 0.0 5.39 87 IR
1,542 KINDER MORGAN INC/DELAWARE GAS PIPELINE 0.0 49.01 76 NA 609 SPECTRA ENERGY CORP GAS PIPELINE 0.0 42.04 26 NA
61 DIAMOND OFFSHORE DRILLING INC OFFSHORE DRILLING & OTHER SERVICES 0.0 42.52 3 NA 229 NOBLE CORP PLC OFFSHORE DRILLING & OTHER SERVICES 0.0 19.19 4 NA 309 TRANSOCEAN LTD OFFSHORE DRILLING & OTHER SERVICES 0.0 21.23 7 NA
4,000 AMEC FOSTER WHEELER PLC OIL WELL EQUIPMENT & SERVICES 0.0 15.41 62 EX 393 BAKER HUGHES INC OIL WELL EQUIPMENT & SERVICES 0.0 64.94 26 NA
18,160 CALFRAC WELL SERVICES LTD OIL WELL EQUIPMENT & SERVICES 0.1 10.01 182 NC 179 CAMERON INTERNATIONAL CORP OIL WELL EQUIPMENT & SERVICES 0.0 57.85 10 NA
28,400 ENERFLEX LTD OIL WELL EQUIPMENT & SERVICES 0.2 16.39 465 NC 213 ENSCO PLC OIL WELL EQUIPMENT & SERVICES 0.0 34.69 7 NA
66,900 ENSIGN ENERGY SERVICES INC OIL WELL EQUIPMENT & SERVICES 0.3 10.20 682 NC 18,085 ENSIGN ENERGY SERVICES INC OIL WELL EQUIPMENT & SERVICES 0.1 10.20 184 NC
212 FMC TECHNOLOGIES INC OIL WELL EQUIPMENT & SERVICES 0.0 54.25 12 NA 769 HALLIBURTON CO OIL WELL EQUIPMENT & SERVICES 0.0 45.55 35 NA
9,515 HALLIBURTON CO OIL WELL EQUIPMENT & SERVICES 0.2 45.55 433 NA 98 HELMERICH & PAYNE INC OIL WELL EQUIPMENT & SERVICES 0.0 78.09 8 NA
92,330 HONGHUA GROUP LTD HKD0.10 OIL WELL EQUIPMENT & SERVICES 0.0 0.15 14 FC 263 NABORS INDUSTRIES LTD SHS OIL WELL EQUIPMENT & SERVICES 0.0 15.03 4 NA
Page 13 of 34 Source: The Bank of New York Mellon Corporation1/13/2015 1:01:20 PM EST
UGYG30000000 - Univ of Guelph Endow Fund
TOTAL EQUITY HOLDINGS Report ID:Reporting Currency: CAD
IEQS0002
12/31/2014
Review
the Investment
Profile of the U
niversity's P
age 25 of 85

Shares Description Industry % ofEquity
Price MarketValue(000)
Russell Sector Scheme CAD
CAD
CntryCode
ENERGY 12.0391 NATIONAL OILWELL VARCO INC OIL WELL EQUIPMENT & SERVICES 0.0 75.90 30 NA
10,500 PROSAFE SE EUR0.25 OIL WELL EQUIPMENT & SERVICES 0.0 3.55 37 SN 1,168 SCHLUMBERGER LTD OIL WELL EQUIPMENT & SERVICES 0.1 98.93 116 NA
11,725 SCHLUMBERGER LTD OIL WELL EQUIPMENT & SERVICES 0.5 98.93 1,160 NA 4,500 SEACOR HOLDINGS INC OIL WELL EQUIPMENT & SERVICES 0.2 85.49 385 NA
13,421 TOTAL ENERGY SERVICES INC OIL WELL EQUIPMENT & SERVICES 0.1 12.98 174 NC 604 ALEXANDRIA MINERAL OILS OIL: CRUDE PRODUCERS 0.0 9.90 6 KE 460 ANADARKO PETROLEUM CORP OIL: CRUDE PRODUCERS 0.0 95.56 44 NA 342 APACHE CORP OIL: CRUDE PRODUCERS 0.0 72.59 25 NA
236,200 BLACKPEARL RESOURCES INC OIL: CRUDE PRODUCERS 0.1 1.16 274 NC 375 CABOT OIL & GAS CORP OIL: CRUDE PRODUCERS 0.0 34.30 13 NA
43,600 CANADIAN NATURAL RESOURCES LTD OIL: CRUDE PRODUCERS 0.7 35.92 1,566 NC 21,692 CANADIAN NATURAL RESOURCES LTD OIL: CRUDE PRODUCERS 0.3 35.92 779 NC 68,500 CANADIAN OIL SANDS LTD OIL: CRUDE PRODUCERS 0.3 10.42 714 NC 37,491 CANADIAN OIL SANDS LTD OIL: CRUDE PRODUCERS 0.2 10.42 391 NC
2,600 CARRIZO OIL & GAS INC OIL: CRUDE PRODUCERS 0.1 48.18 125 NA 471 CHESAPEAKE ENERGY CORP OIL: CRUDE PRODUCERS 0.0 22.67 11 NA
79 CIMAREX ENERGY CO OIL: CRUDE PRODUCERS 0.0 122.77 10 NA 320 DENBURY RESOURCES INC OIL: CRUDE PRODUCERS 0.0 9.42 3 NA 349 DEVON ENERGY CORP OIL: CRUDE PRODUCERS 0.0 70.90 25 NA
17,100 DEVON ENERGY CORP OIL: CRUDE PRODUCERS 0.5 70.90 1,212 NA 497 EOG RESOURCES INC OIL: CRUDE PRODUCERS 0.0 106.64 53 NA
8,356 GRAN TIERRA ENERGY INC OIL: CRUDE PRODUCERS 0.0 4.46 37 NA 2,184 LINN CO LLC OIL: CRUDE PRODUCERS 0.0 12.01 26 NA
67,000 MEG ENERGY CORP OIL: CRUDE PRODUCERS 0.6 19.55 1,310 NC 2,419 NATIONAL REFINERY PKR10 OIL: CRUDE PRODUCERS 0.0 2.14 5 FQ
125 NEWFIELD EXPLORATION CO OIL: CRUDE PRODUCERS 0.0 31.41 4 NA 327 NOBLE ENERGY INC OIL: CRUDE PRODUCERS 0.0 54.94 18 NA 704 OCCIDENTAL PETROLEUM CORP OIL: CRUDE PRODUCERS 0.0 93.37 66 NA
17,178 OIL & NATURAL GAS INR05 OIL: CRUDE PRODUCERS 0.0 6.26 108 FI 6,590 OIL INDIA LTD OIL: CRUDE PRODUCERS 0.0 10.58 70 FI
18,400 PACIFIC RUBIALES ENERGY CORP OIL: CRUDE PRODUCERS 0.1 7.19 132 NC 35,800 PEYTO EXPLORATION & DEV CORP OIL: CRUDE PRODUCERS 0.5 33.47 1,198 NC
135 PIONEER NATURAL RESOURCES CO OIL: CRUDE PRODUCERS 0.0 172.41 23 NA 18,900 PREMIER OIL ORD GBP0.125 OIL: CRUDE PRODUCERS 0.0 3.02 57 EX 14,783 PTT EXPLORATION & PRODUCTION OIL: CRUDE PRODUCERS 0.0 3.94 58 FB
150 QEP RESOURCES INC OIL: CRUDE PRODUCERS 0.0 23.42 4 NA 10,450 QEP RESOURCES INC OIL: CRUDE PRODUCERS 0.1 23.42 245 NA
153 RANGE RESOURCES CORP OIL: CRUDE PRODUCERS 0.0 61.91 9 NA 321 SOUTHWESTERN ENERGY CO OIL: CRUDE PRODUCERS 0.0 31.61 10 NA
Page 14 of 34 Source: The Bank of New York Mellon Corporation1/13/2015 1:01:20 PM EST
UGYG30000000 - Univ of Guelph Endow Fund
TOTAL EQUITY HOLDINGS Report ID:Reporting Currency: CAD
IEQS0002
12/31/2014
Review
the Investment
Profile of the U
niversity's P
age 26 of 85

Shares Description Industry % ofEquity
Price MarketValue(000)
Russell Sector Scheme CAD
CAD
CntryCode
ENERGY 12.034,700 TOURMALINE OIL CORP OIL: CRUDE PRODUCERS 0.6 38.70 1,343 NC 62,100 BP PLC ORD USD0.25 OIL: INTEGRATED 0.2 7.42 461 EX 86,500 CENOVUS ENERGY INC OIL: INTEGRATED 0.9 23.97 2,073 NC 21,770 CENOVUS ENERGY INC OIL: INTEGRATED 0.2 23.97 522 NC
1,716 CHEVRON CORP OIL: INTEGRATED 0.1 129.93 223 NA 3 CHINA PETROLEUM & CHEMICAL COR OIL: INTEGRATED 0.0 93.83 FC
278,076 CHINA PETROLEUM AND CHEMICAL OIL: INTEGRATED 0.1 0.93 260 FC 1,117 CONOCOPHILLIPS OIL: INTEGRATED 0.0 79.99 89 NA 6,990 CONOCOPHILLIPS OIL: INTEGRATED 0.3 79.99 559 NA
15,648 ECOPETROL SA NPV OIL: INTEGRATED 0.0 1.01 16 LL 9,900 ENI EUR OIL: INTEGRATED 0.1 20.34 201 EI 3,844 EXXON MOBIL CORP OIL: INTEGRATED 0.2 107.08 412 NA 5,556 GAZPROM NEFT JSC OIL: INTEGRATED 0.0 13.05 73 IR
231 HESS CORP OIL: INTEGRATED 0.0 85.50 20 NA 13,886 IMPERIAL OIL LTD OIL: INTEGRATED 0.3 50.05 695 NC
3,524 LUKOIL OAO OIL: INTEGRATED 0.1 44.42 157 IR 437 MAGYAR OLAJ ES GAZIPARE OIL: INTEGRATED 0.0 51.25 22 EM 613 MARATHON OIL CORP OIL: INTEGRATED 0.0 32.77 20 NA 151 MURPHY OIL CORP OIL: INTEGRATED 0.0 58.51 9 NA
7,100 MURPHY OIL CORP OIL: INTEGRATED 0.2 58.51 415 NA 24,582 PETROLEO BRASILEIRO SA OIL: INTEGRATED 0.0 4.37 107 LB 10,274 PTT PUBLIC COMPANY THB10 OIL: INTEGRATED 0.1 11.41 117 FB
8,600 REPSOL SA OIL: INTEGRATED 0.1 21.79 187 EE 18,700 ROYAL DUTCH SHELL PLC OIL: INTEGRATED 0.3 40.33 754 EX 32,306 ROYAL DUTCH SHELL PLC OIL: INTEGRATED 0.6 38.77 1,252 EX
7,100 STATOIL ASA NOK2.50 OIL: INTEGRATED 0.1 20.27 144 SN 26,092 SUNCOR ENERGY INC OIL: INTEGRATED 0.4 36.90 963 NC
9,915 SURGUTNEFTEGAZ ADR EACH REPR OIL: INTEGRATED 0.0 4.92 49 IR 4,140 TATNEFT-SPONSORED ADR OIL: INTEGRATED 0.1 28.38 117 IR 6,400 TOTAL SA EUR2.5 OIL: INTEGRATED 0.2 59.59 381 EF
22,925 TOTAL SA EUR2.5 OIL: INTEGRATED 0.6 59.59 1,366 EF 611 WILLIAMS COS INC/THE OIL: INTEGRATED 0.0 52.05 32 NA
58,313 BANGCHAK PETROLEUM PUBLIC CO OIL:REFINING & MRKTING 0.0 1.12 65 FB 2,672 CHENNAI PETRO CP INR10 OIL:REFINING & MRKTING 0.0 1.29 3 FI
12,430 JX HOLDINGS INC OIL:REFINING & MRKTING 0.0 4.54 56 FJ 254 MARATHON PETROLEUM CORP OIL:REFINING & MRKTING 0.0 104.54 27 NA 568 MOTOR OIL HELLAS CORINTH OIL:REFINING & MRKTING 0.0 9.11 5 EH
6,100 NESTE OIL OYJ EUR3.4 OIL:REFINING & MRKTING 0.1 28.11 172 SF 189 ONEOK INC OIL:REFINING & MRKTING 0.0 57.67 11 NA 502 PHILLIPS 66 OIL:REFINING & MRKTING 0.0 83.05 42 NA
Page 15 of 34 Source: The Bank of New York Mellon Corporation1/13/2015 1:01:20 PM EST
UGYG30000000 - Univ of Guelph Endow Fund
TOTAL EQUITY HOLDINGS Report ID:Reporting Currency: CAD
IEQS0002
12/31/2014
Review
the Investment
Profile of the U
niversity's P
age 27 of 85

Shares Description Industry % ofEquity
Price MarketValue(000)
Russell Sector Scheme CAD
CAD
CntryCode
ENERGY 12.032,734 PTT GLOBAL CHEMICAL PCL OIL:REFINING & MRKTING 0.0 1.80 59 FB
2,674 SASOL NVP OIL:REFINING & MRKTING 0.1 43.15 115 KS 115 TESORO CORP OIL:REFINING & MRKTING 0.0 86.12 10 NA 473 VALERO ENERGY CORP OIL:REFINING & MRKTING 0.0 57.33 27 NA
MATERIALS AND PROCESSING 6.81,070 ALCOA INC ALUMINUM 0.0 18.29 20 NA
66,917 CHINA LESSO GROUP HOLDINGS LTD BUILDING MATERIALS 0.0 0.57 38 FC 56 MARTIN MARIETTA MATERIALS INC BUILDING MATERIALS 0.0 127.78 7 NA
323 MASCO CORP BUILDING MATERIALS 0.0 29.19 9 NA 120 VULCAN MATERIALS CO BUILDING MATERIALS 0.0 76.13 9 NA 241 INGERSOLL-RAND PUBLIC LIMITED BUILDING: CLIMATE CONTROL 0.0 73.42 18 NA
1,295 BIRLA CORP INR10 CEMENT 0.0 8.19 11 FI 164,000 CHINA RESOURCES CEMENT CEMENT 0.1 0.75 123 FH
12,400 ADEKA CORPORATION CHEMICALS: DIVERSIFIED 0.1 13.83 172 FJ 61 AIRGAS INC CHEMICALS: DIVERSIFIED 0.0 133.41 8 NA
8,420 AKZO NOBEL NV EUR2 CHEMICALS: DIVERSIFIED 0.3 80.80 680 EN 1,000 ARKEMA EUR10 CHEMICALS: DIVERSIFIED 0.0 77.18 77 EF 6,800 ASHLAND INC CHEMICALS: DIVERSIFIED 0.4 138.71 943 NA 2,700 AXIALL CORP CHEMICALS: DIVERSIFIED 0.1 49.19 133 NA 2,600 BASF SE CHEMICALS: DIVERSIFIED 0.1 97.94 255 ED 2,857 CABOT CORP CHEMICALS: DIVERSIFIED 0.1 50.80 145 NA 1,006 DOW CHEMICAL CO/THE CHEMICALS: DIVERSIFIED 0.0 52.83 53 NA
135 EASTMAN CHEMICAL CO CHEMICALS: DIVERSIFIED 0.0 87.86 12 NA 245 ECOLAB INC CHEMICALS: DIVERSIFIED 0.0 121.06 30 NA 822 EI DU PONT DE NEMOURS & CO CHEMICALS: DIVERSIFIED 0.0 85.64 70 NA 121 FMC CORP CHEMICALS: DIVERSIFIED 0.0 66.05 8 NA
38,541 FUFENG GROUP LTD HKD0.10 CHEMICALS: DIVERSIFIED 0.0 0.50 19 FC 99,569 GRAND PACIFIC PETROCHEMICAL CHEMICALS: DIVERSIFIED 0.0 0.62 62 FA
819 ISU CHEMICAL KRW5000 CHEMICALS: DIVERSIFIED 0.0 9.61 8 FK 51,000 KINGBOARD CHEM HLDG HK$0.10 CHEMICALS: DIVERSIFIED 0.0 1.96 100 FH 55,661 KINGBOARD LAMINATES HOLDINGS CHEMICALS: DIVERSIFIED 0.0 0.43 24 FH
182,366 LUMENA RESOURCES CORP CHEMICALS: DIVERSIFIED 0.0 0.19 34 FH 17,000 NIHON KAGAKU SANGY JPY50 CHEMICALS: DIVERSIFIED 0.1 8.18 139 FJ
108 SIGMA-ALDRICH CORP CHEMICALS: DIVERSIFIED 0.0 158.99 17 NA 20,000 TOAGOSEI CO LTD CHEMICALS: DIVERSIFIED 0.0 4.64 93 FJ
175 AIR PRODUCTS & CHEMICALS INC CHEMICALS: SPECIALTY 0.0 167.05 29 NA 271,000 HUABAO INTERNATIONAL HOLDINGS CHEMICALS: SPECIALTY 0.1 0.95 256 FH
74 INTERNATIONAL FLAVORS & FRAGRA CHEMICALS: SPECIALTY 0.0 117.40 9 NA
Page 16 of 34 Source: The Bank of New York Mellon Corporation1/13/2015 1:01:20 PM EST
UGYG30000000 - Univ of Guelph Endow Fund
TOTAL EQUITY HOLDINGS Report ID:Reporting Currency: CAD
IEQS0002
12/31/2014
Review
the Investment
Profile of the U
niversity's P
age 28 of 85

Shares Description Industry % ofEquity
Price MarketValue(000)
Russell Sector Scheme CAD
CAD
CntryCode
MATERIALS AND PROCESSING 6.8377 LYONDELLBASELL INDUSTRIES NV CHEMICALS: SPECIALTY 0.0 91.95 35 NA
7,507 METHANEX CORP CHEMICALS: SPECIALTY 0.2 53.37 401 NC 265 PRAXAIR INC CHEMICALS: SPECIALTY 0.0 150.06 40 NA
39,100 SOL ITL1000 CHEMICALS: SPECIALTY 0.2 9.33 365 EI 124 BALL CORP CONTAINERS & PACKAGING 0.0 78.96 10 NA
3,419 BEMIS CO INC CONTAINERS & PACKAGING 0.1 52.36 179 NA 151 MEADWESTVACO CORP CONTAINERS & PACKAGING 0.0 51.41 8 NA
7,202 MONDI PACKAGING SOUTH AFRICA L CONTAINERS & PACKAGING 0.0 3.68 26 KS 3,500 MYERS INDUSTRIES INC CONTAINERS & PACKAGING 0.0 20.39 71 NA
18,200 OWENS-ILLINOIS INC CONTAINERS & PACKAGING 0.3 31.26 569 NA 150 OWENS-ILLINOIS INC CONTAINERS & PACKAGING 0.0 31.26 5 NA 192 SEALED AIR CORP CONTAINERS & PACKAGING 0.0 49.14 9 NA
6,415 SONOCO PRODUCTS CO CONTAINERS & PACKAGING 0.1 50.62 325 NA 35,660 ANTOFAGASTA ORD GBP0.05 COPPER 0.2 13.59 485 EX
943 FREEPORT-MCMORAN INC COPPER 0.0 27.06 26 NA 2,048 KGHM POLSKA MIEDZ PLN 10 BR COPPER 0.0 35.49 73 EG 7,635 PARK ELEKTRIK MADENCIIIK COPPER 0.0 2.01 15 ET 1,800 BELDEN INC DIVERSIFIED MANUFACTURING 0.1 91.28 164 NA 2,800 LEONI AG NPV DIVERSIFIED MANUFACTURING 0.1 69.23 194 ED
45 CF INDUSTRIES HOLDINGS INC FERTILIZERS 0.0 315.67 14 NA 58,994 CHINA BLUECHEMICAL LIMITED FERTILIZERS 0.0 0.41 24 FC
751 DEEPAK FERTILISERS & FERTILIZERS 0.0 2.63 2 FI 5,770 GUJARAT STATE FERTILISERS & FERTILIZERS 0.0 1.93 11 FI
439 MONSANTO CO FERTILIZERS 0.0 138.38 61 NA 287 MOSAIC CO/THE FERTILIZERS 0.0 52.87 15 NA
15,271 POTASH CORP OF SASKATCHEWAN FERTILIZERS 0.3 41.07 627 NC 58,600 POTASH CORP OF SASKATCHEWAN FERTILIZERS 1.1 41.07 2,407 NC 45,975 POTASH CORP OF SASKATCHEWAN IN FERTILIZERS 0.8 40.91 1,881 NC 18,971 UPL LTD FERTILIZERS 0.1 6.36 121 FI
4,200 YARA INTL NOK1.70 FERTILIZERS 0.1 51.57 217 SN 3,641 WEST FRASER TIMBER CO LTD FOREST PRODUCTS 0.1 66.47 242 NC 3,615 GOLDCORP INC GOLD 0.0 21.51 78 NC
453 NEWMONT MINING CORP GOLD 0.0 21.89 10 NA 3,917 SIBANYE GOLD LTD GOLD 0.0 2.26 9 KS 1,200 AURUBIS AG ORD NPV METAL FABRICATING 0.0 65.23 78 ED
248 FASTENAL CO METAL FABRICATING 0.0 55.09 14 NA 60,877 KARDEMIR KARABUK DEMIR CELIK METAL FABRICATING 0.0 1.02 62 ET
129 PRECISION CASTPARTS CORP METAL FABRICATING 0.0 279.00 36 NA 9,160 VALLOUREC (USIN A TUB DE LOR METAL FABRICATING 0.1 31.89 292 EF
38,515 XING INTERNATIONAL HLDGS LTD METAL FABRICATING 0.0 0.41 16 FC
Page 17 of 34 Source: The Bank of New York Mellon Corporation1/13/2015 1:01:20 PM EST
UGYG30000000 - Univ of Guelph Endow Fund
TOTAL EQUITY HOLDINGS Report ID:Reporting Currency: CAD
IEQS0002
12/31/2014
Review
the Investment
Profile of the U
niversity's P
age 29 of 85

Shares Description Industry % ofEquity
Price MarketValue(000)
Russell Sector Scheme CAD
CAD
CntryCode
MATERIALS AND PROCESSING 6.8171,049 ANEKA TAMBANG TBK IDR500 METALS & MINERALS: DIVERSIFIED 0.0 0.10 17 FL
8,300 ANGLO AMERICAN METALS & MINERALS: DIVERSIFIED 0.1 21.68 180 EX 363 ASSORE LTD METALS & MINERALS: DIVERSIFIED 0.0 14.98 5 KS
9,200 BOLIDEN AB NPV (POST SPLIT) METALS & MINERALS: DIVERSIFIED 0.1 18.57 171 SS 2,347 MATERION CORP METALS & MINERALS: DIVERSIFIED 0.0 40.81 96 NA
12,300 MINERAL RESOURCES LTD METALS & MINERALS: DIVERSIFIED 0.0 7.18 88 AA 2,000 MINERALS TECHNOLOGIES INC METALS & MINERALS: DIVERSIFIED 0.1 80.44 161 NA 3,600 RIO TINTO LIMITED NPV METALS & MINERALS: DIVERSIFIED 0.1 54.98 198 AA 8,000 SUMITOMO METAL MNG NPV METALS & MINERALS: DIVERSIFIED 0.1 17.49 140 FJ
11,545 TECK RESOURCES LTD METALS & MINERALS: DIVERSIFIED 0.1 15.88 183 NC 87,842 TIMAH TBK PT IDR50 METALS & MINERALS: DIVERSIFIED 0.0 0.12 10 FL 20,443 VALE SA METALS & MINERALS: DIVERSIFIED 0.1 8.38 171 LB
125 PPG INDUSTRIES INC PAINTS & COATINGS 0.0 267.73 33 NA 74 SHERWIN-WILLIAMS CO/THE PAINTS & COATINGS 0.0 304.67 23 NA
385 INTERNATIONAL PAPER CO PAPER 0.0 62.06 24 NA 342 MONDI LTD PAPER 0.0 18.90 6 KS
9,400 MONDI PLC ORD EUR0.20 PAPER 0.1 18.96 178 EX 635 NEENAH PAPER INC PAPER 0.0 69.81 44 NA
21,500 PAPERLINX NPV PAPER 0.0 0.04 1 AA 32,411 SHANDONG CHENMING PAPER HLDGS PAPER 0.0 0.63 20 FC 6,300 SMURFIT KAPPA GROUP PLC ORD PAPER 0.1 26.21 165 EZ
32,359 FORMOSAN RUBBER GP TWD10 PLASTICS 0.0 1.21 39 FA 99 ALLEGHENY TECHNOLOGIES INC STEEL 0.0 40.27 4 NA
171,000 ARRIUM LTD STEEL 0.0 0.20 35 AA 17,981 BENGANG STEEL PLATES 'B' CNY1 STEEL 0.0 0.45 8 FC 43,539 CHONGQING IRON & STEEL CO LTD STEEL 0.0 0.26 11 FC
8,309 GPO SIMEC SA SER'B'NPV STEEL 0.0 3.99 33 LM 19,098 LION IND CORP MYR1(AFTER STEEL 0.0 0.17 3 FN
290 NUCOR CORP STEEL 0.0 56.81 16 NA 195 POSCO STEEL 0.0 290.31 57 FK 903 SEAH BESTEEL CORP STEEL 0.0 29.40 27 FK
2,100 VOESTALPINE AG STEEL 0.0 45.96 97 EA 1,889 SRF LIMITED INR10 SYNTHETIC FIBERS & CHEMICALS 0.0 16.06 30 FI
31,579 WEIQIAO TEXTILE CO 'H'CNY1 TEXTILE PRODUCTS 0.0 0.66 21 FC
PRODUCER DURABLES 15.235,200 BAE SYSTEMS ORD GBP0.025 AEROSPACE 0.1 8.52 300 EX
602 BOEING CO/THE AEROSPACE 0.0 150.55 91 NA 315 ELBIT SYSTEMS ILS1 AEROSPACE 0.0 70.84 22 FZ
Page 18 of 34 Source: The Bank of New York Mellon Corporation1/13/2015 1:01:20 PM EST
UGYG30000000 - Univ of Guelph Endow Fund
TOTAL EQUITY HOLDINGS Report ID:Reporting Currency: CAD
IEQS0002
12/31/2014
Review
the Investment
Profile of the U
niversity's P
age 30 of 85

Shares Description Industry % ofEquity
Price MarketValue(000)
Russell Sector Scheme CAD
CAD
CntryCode
PRODUCER DURABLES 15.2286 GENERAL DYNAMICS CORP AEROSPACE 0.0 159.40 46 NA
77 L-3 COMMUNICATIONS HOLDINGS IN AEROSPACE 0.0 146.18 11 NA 244 LOCKHEED MARTIN CORP AEROSPACE 0.0 223.04 54 NA
2,542 MOOG INC AEROSPACE 0.1 85.75 218 NA 965 NORTHROP GRUMMAN CORP AEROSPACE 0.1 170.71 165 NA 183 NORTHROP GRUMMAN CORP AEROSPACE 0.0 170.71 31 NA 280 RAYTHEON CO AEROSPACE 0.0 125.29 35 NA
1,800 RHEINMETAL AG NPV AEROSPACE 0.0 50.83 92 ED 121 ROCKWELL COLLINS INC AEROSPACE 0.0 97.85 12 NA
16,885 SAFRAN SA EUR0.20 AEROSPACE 0.5 71.83 1,213 EF 251 TEXTRON INC AEROSPACE 0.0 48.77 12 NA
2,800 THALES EUR3 AEROSPACE 0.1 63.06 177 EF 2,784 TRANSDIGM GROUP INC AEROSPACE 0.3 227.42 633 NA
770 UNITED TECHNOLOGIES CORP AEROSPACE 0.0 133.20 103 NA 50,900 AIR NEW ZEALAND NPV AIR TRANSPORT 0.1 2.24 114 AN
3,700 ATLAS AIR WORLDWIDE HOLDINGS I AIR TRANSPORT 0.1 57.10 211 NA 760 DELTA AIR LINES INC AIR TRANSPORT 0.0 56.97 43 NA 239 FEDEX CORP AIR TRANSPORT 0.0 201.14 48 NA
19,700 POSTNL NV AIR TRANSPORT 0.0 4.34 86 EN 616 SOUTHWEST AIRLINES CO AIR TRANSPORT 0.0 49.02 30 NA
49,659 TNT EXPRESS NV AIR TRANSPORT 0.2 7.77 386 EN 17,300 ACCENTURE PLC BACK OFF SUP HR & CONSULT 0.8 103.44 1,790 EZ
570 ACCENTURE PLC BACK OFF SUP HR & CONSULT 0.0 103.44 59 NA 438 AUTOMATIC DATA PROCESSING INC BACK OFF SUP HR & CONSULT 0.0 96.56 42 NA
9,448 CONVERGYS CORP BACK OFF SUP HR & CONSULT 0.1 23.59 223 NA 5,681 CONVERGYS CORP BACK OFF SUP HR & CONSULT 0.1 23.59 134 NA 1,519 CRA INTERNATIONAL INC BACK OFF SUP HR & CONSULT 0.0 35.12 53 NA
169 IRON MOUNTAIN INC BACK OFF SUP HR & CONSULT 0.0 44.78 8 NA 5,762 NAVIGANT CONSULTING INC BACK OFF SUP HR & CONSULT 0.0 17.80 103 NA
296 PAYCHEX INC BACK OFF SUP HR & CONSULT 0.0 53.48 16 NA 5,815 RITCHIE BROS AUCTIONEERS INC BACK OFF SUP HR & CONSULT 0.1 31.22 182 NC
62,922 RITCHIE BROS AUCTIONEERS INC BACK OFF SUP HR & CONSULT 0.9 31.15 1,960 NC 123 ROBERT HALF INTERNATIONAL INC BACK OFF SUP HR & CONSULT 0.0 67.62 8 NA
3,889 SYKES ENTERPRISES INC BACK OFF SUP HR & CONSULT 0.0 27.18 106 NA 3,069 AIRCASTLE LTD SHS COMMERCIAL SERVICES: RENTAL & LEASING 0.0 24.75 76 NA
471 EQSTRA HOLDINGS LTD NPV COMMERCIAL SERVICES: RENTAL & LEASING 0.0 0.34 KS 1,600 RYDER SYSTEM INC COMMERCIAL SERVICES: RENTAL & LEASING 0.1 107.54 172 NA
48 RYDER SYSTEM INC COMMERCIAL SERVICES: RENTAL & LEASING 0.0 107.54 5 NA 91 UNITED RENTALS INC COMMERCIAL SERVICES: RENTAL & LEASING 0.0 118.15 11 NA
321 PACCAR INC COMMERCIAL VEHICLES & PARTS 0.0 78.77 25 NA
Page 19 of 34 Source: The Bank of New York Mellon Corporation1/13/2015 1:01:20 PM EST
UGYG30000000 - Univ of Guelph Endow Fund
TOTAL EQUITY HOLDINGS Report ID:Reporting Currency: CAD
IEQS0002
12/31/2014
Review
the Investment
Profile of the U
niversity's P
age 31 of 85

Shares Description Industry % ofEquity
Price MarketValue(000)
Russell Sector Scheme CAD
CAD
CntryCode
PRODUCER DURABLES 15.214,650 PACCAR INC COMMERCIAL VEHICLES & PARTS 0.5 78.77 1,154 NA
2,500 RUSH ENTERPRISES INC COMMERCIAL VEHICLES & PARTS 0.0 37.12 93 NA 32,059 SINOTRUK (HONG KONG) LTD COMMERCIAL VEHICLES & PARTS 0.0 0.65 21 FH 11,300 ASTALDI SPA CONSTRUCTION 0.0 6.70 76 EI 5,906 AVENG LTD CONSTRUCTION 0.0 1.74 10 KS
24,900 CARILLION ORD GBP0.50 CONSTRUCTION 0.1 6.06 151 EX 102,936 CHINA COMMUNICATIONS CONST-H CONSTRUCTION 0.1 1.39 143 FC 137,903 CHINA RAILWAY CONSTRUCTION CONSTRUCTION 0.1 1.48 203 FC
950 DONGBU ENG & CONST KRW5000 CONSTRUCTION 0.0 1.06 1 FK 8,000 MAEDA ROAD CONSTRUCTION Y50 CONSTRUCTION 0.1 17.31 138 FJ 6,357 BARLOWORLD LTD ZAR0.05 DIVERSIFIED MANUFACTURING OPERATIONS 0.0 9.59 61 KS 6,051 BOUSTEAD HLDGS BHD MYR0.50 DIVERSIFIED MANUFACTURING OPERATIONS 0.0 1.60 10 FN
10,800 BRADKEN LIMITED NPV DIVERSIFIED MANUFACTURING OPERATIONS 0.0 4.48 48 AA 555 DANAHER CORP DIVERSIFIED MANUFACTURING OPERATIONS 0.0 99.27 55 NA 150 DOVER CORP DIVERSIFIED MANUFACTURING OPERATIONS 0.0 83.07 12 NA
5,350 DOVER CORP DIVERSIFIED MANUFACTURING OPERATIONS 0.2 83.07 444 NA 431 EATON CORP PLC DIVERSIFIED MANUFACTURING OPERATIONS 0.0 78.71 34 NA
9,116 GENERAL ELECTRIC CO DIVERSIFIED MANUFACTURING OPERATIONS 0.1 29.27 267 NA 9,861 HARSCO CORP DIVERSIFIED MANUFACTURING OPERATIONS 0.1 21.88 216 NA
10,100 HONEYWELL INTERNATIONAL INC DIVERSIFIED MANUFACTURING OPERATIONS 0.5 115.73 1,169 NA 711 HONEYWELL INTERNATIONAL INC DIVERSIFIED MANUFACTURING OPERATIONS 0.0 115.73 82 NA 326 ILLINOIS TOOL WORKS INC DIVERSIFIED MANUFACTURING OPERATIONS 0.0 109.69 36 NA
13,227 KOC HLDG TRY1 DIVERSIFIED MANUFACTURING OPERATIONS 0.0 6.14 81 ET 3,200 STANDEX INTERNATIONAL CORP DIVERSIFIED MANUFACTURING OPERATIONS 0.1 89.49 286 NA
582 3M CO DIVERSIFIED MANUFACTURING OPERATIONS 0.0 190.32 111 NA 5,425 3M CO DIVERSIFIED MANUFACTURING OPERATIONS 0.5 190.32 1,033 NA
12,297 AECOM ENGINEERING & CONTRACTING SERVICES 0.2 35.18 433 NA 16,600 BOART LONGYEAR GROUP NPV ENGINEERING & CONTRACTING SERVICES 0.0 0.16 3 AA 20,250 DOWNER EDI LTD NPV ENGINEERING & CONTRACTING SERVICES 0.0 4.47 91 AA
142 FLUOR CORP ENGINEERING & CONTRACTING SERVICES 0.0 70.22 10 NA 119 JACOBS ENGINEERING GROUP INC ENGINEERING & CONTRACTING SERVICES 0.0 51.76 6 NA
3,700 NEC SYS INT & CONS Y50 ENGINEERING & CONTRACTING SERVICES 0.0 24.16 89 FJ 47,000 NWS HOLDINGS LTD HKD1 ENGINEERING & CONTRACTING SERVICES 0.0 2.14 100 FC
198 QUANTA SERVICES INC ENGINEERING & CONTRACTING SERVICES 0.0 32.88 6 NA 9,965 SNC-LAVALIN GROUP INC ENGINEERING & CONTRACTING SERVICES 0.2 44.31 442 NC
25,500 SNC-LAVALIN GROUP INC ENGINEERING & CONTRACTING SERVICES 0.5 44.31 1,130 NC 7,625 CINTAS CORP ENVIRON MAINT & SEC SVCS 0.3 90.85 693 NA
88 CINTAS CORP ENVIRON MAINT & SEC SVCS 0.0 90.85 8 NA 600 G&K SERVICES INC ENVIRON MAINT & SEC SVCS 0.0 82.06 49 NA
181,643 G4S PLC ORD GBP0.25 ENVIRON MAINT & SEC SVCS 0.4 5.02 912 EX
Page 20 of 34 Source: The Bank of New York Mellon Corporation1/13/2015 1:01:20 PM EST
UGYG30000000 - Univ of Guelph Endow Fund
TOTAL EQUITY HOLDINGS Report ID:Reporting Currency: CAD
IEQS0002
12/31/2014
Review
the Investment
Profile of the U
niversity's P
age 32 of 85

Shares Description Industry % ofEquity
Price MarketValue(000)
Russell Sector Scheme CAD
CAD
CntryCode
PRODUCER DURABLES 15.24,600 NIPPON KANZAI CO Y50 ENVIRON MAINT & SEC SVCS 0.1 25.98 119 FJ
16,100 SECURITAS SER 'B' SEK1 ENVIRON MAINT & SEC SVCS 0.1 13.97 225 SS 77 STERICYCLE INC ENVIRON MAINT & SEC SVCS 0.0 151.82 12 NA
9,000 ITOCHU CORP Y50 INTL TRADE & DIV LOGISTIC 0.1 12.48 112 FJ 29,000 MARUBENI CORP Y50 INTL TRADE & DIV LOGISTIC 0.1 7.00 203 FJ 12,600 MITSUI & CO Y50 INTL TRADE & DIV LOGISTIC 0.1 15.66 197 FJ 29,200 SOJITZ CORPORATION NPV INTL TRADE & DIV LOGISTIC 0.0 1.63 48 FJ 19,200 SUMITOMO CORP NPV INTL TRADE & DIV LOGISTIC 0.1 12.00 230 FJ
400 BUCHER INDUSTRIES AG MACHINERY: AGRICULTURAL 0.1 290.13 116 ES 325 DEERE & CO MACHINERY: AGRICULTURAL 0.0 102.47 33 NA
36,560 FIRST TRACTOR CO 'H' CNY1 MACHINERY: AGRICULTURAL 0.0 0.85 31 FC 1,920 TURK TRAKTOR VE ZIRAAT MACHINERY: AGRICULTURAL 0.0 38.08 73 ET
550 CATERPILLAR INC MACHINERY: CONSTRUCTION & HANDLING 0.0 106.01 58 NA 53,100 FINNING INTERNATIONAL INC MACHINERY: CONSTRUCTION & HANDLING 0.6 25.23 1,340 NC 20,868 FINNING INTERNATIONAL INC MACHINERY: CONSTRUCTION & HANDLING 0.2 25.23 527 NC
124,132 LONKING HOLDINGS LTD MACHINERY: CONSTRUCTION & HANDLING 0.0 0.23 29 FC 14,452 UNITED TRACTORS TBK PT MACHINERY: CONSTRUCTION & HANDLING 0.0 1.62 23 FL
5,504 WAJAX CORP MACHINERY: CONSTRUCTION & HANDLING 0.1 30.77 169 NC 154 CUMMINS INC MACHINERY: ENGINES 0.0 166.98 26 NA
4,100 ALTRA INDUSTRIAL MOTION CORP MACHINERY: INDUSTRIAL 0.1 32.88 135 NA 15,482 ATS AUTOMATION TOOLING SYS INC MACHINERY: INDUSTRIAL 0.1 15.50 240 NC
160 FISCHER(GEORG) AG CHF10(REGD) MACHINERY: INDUSTRIAL 0.1 733.20 117 ES 4,200 JOY GLOBAL INC MACHINERY: INDUSTRIAL 0.1 53.88 226 NA
89 JOY GLOBAL INC MACHINERY: INDUSTRIAL 0.0 53.88 5 NA 2,400 KENNAMETAL INC MACHINERY: INDUSTRIAL 0.0 41.45 99 NA
500 RIETER HOLDINGS AG CHF10 MACHINERY: INDUSTRIAL 0.0 192.92 96 ES 138,206 SHANGHAI ELECTRIC GROUP CO LTD MACHINERY: INDUSTRIAL 0.0 0.62 85 FC
31,400 TOROMONT INDUSTRIES LTD MACHINERY: INDUSTRIAL 0.4 28.51 895 NC 53 SNAP-ON INC MACHINERY: TOOLS 0.0 158.38 8 NA
142 STANLEY BLACK & DECKER INC MACHINERY: TOOLS 0.0 111.28 16 NA 83 AVERY DENNISON CORP OFFICE SUPPLIES EQUIPMENT 0.0 60.09 5 NA
6,500 BROTHER INDUSTRIES LTD OFFICE SUPPLIES EQUIPMENT 0.1 21.29 138 FJ 1,900 LEXMARK INTERNATIONAL INC OFFICE SUPPLIES EQUIPMENT 0.0 47.80 91 NA
900 NEOPOST FRF4 OFFICE SUPPLIES EQUIPMENT 0.0 66.08 59 EF 182 PITNEY BOWES INC OFFICE SUPPLIES EQUIPMENT 0.0 28.23 5 NA
29,075 STEELCASE INC OFFICE SUPPLIES EQUIPMENT 0.3 20.79 604 NA 9,850 STEELCASE INC OFFICE SUPPLIES EQUIPMENT 0.1 20.79 205 NA
25,000 TOSHIBA TEC CORP NPV OFFICE SUPPLIES EQUIPMENT 0.1 8.04 201 FJ 5,960 UNITED STATIONERS INC OFFICE SUPPLIES EQUIPMENT 0.1 48.83 291 NA
974 XEROX CORP OFFICE SUPPLIES EQUIPMENT 0.0 16.05 16 NA
Page 21 of 34 Source: The Bank of New York Mellon Corporation1/13/2015 1:01:20 PM EST
UGYG30000000 - Univ of Guelph Endow Fund
TOTAL EQUITY HOLDINGS Report ID:Reporting Currency: CAD
IEQS0002
12/31/2014
Review
the Investment
Profile of the U
niversity's P
age 33 of 85

Shares Description Industry % ofEquity
Price MarketValue(000)
Russell Sector Scheme CAD
CAD
CntryCode
PRODUCER DURABLES 15.24,200 ALSTOM EUR7 (POST POWER TRANSMISSION EQUIP 0.1 37.65 158 EF 1,019 FSP TECHNOLOGY INC TWD10 POWER TRANSMISSION EQUIP 0.0 0.95 1 FA
41,160 HARBIN ELECTRIC CO LTD POWER TRANSMISSION EQUIP 0.0 0.72 30 FC 4,500 NITTO KOGYO CORP POWER TRANSMISSION EQUIP 0.0 22.74 102 FJ 5,800 NIKKISO CO Y50 PRODUCER DURABLES: MISC 0.0 10.82 63 FJ 1,719 PARK-OHIO HOLDINGS CORP PRODUCER DURABLES: MISC 0.1 73.00 125 NA
55 WW GRAINGER INC PRODUCER DURABLES: MISC 0.0 295.23 16 NA 21,200 CANADIAN NATIONAL RAILWAY CO RAILROADS 0.8 80.02 1,696 NC
904 CSX CORP RAILROADS 0.0 41.96 38 NA 100 KANSAS CITY SOUTHERN RAILROADS 0.0 141.34 14 NA 281 NORFOLK SOUTHERN CORP RAILROADS 0.0 126.96 36 NA 807 UNION PACIFIC CORP RAILROADS 0.1 137.98 111 NA
1,800 WEST JAPAN RAILWAY CO JPY50000 RAILROADS 0.0 55.18 99 FJ 158 ADT CORP/THE SCIENTIFIC INSTRUMENTS: CONTROL & FILTER 0.0 41.96 7 NA
87 ALLEGION PLC SCIENTIFIC INSTRUMENTS: CONTROL & FILTER 0.0 64.24 6 NA 128 FLIR SYSTEMS INC SCIENTIFIC INSTRUMENTS: CONTROL & FILTER 0.0 37.42 5 NA 124 FLOWSERVE CORP SCIENTIFIC INSTRUMENTS: CONTROL & FILTER 0.0 69.30 9 NA
97 PALL CORP SCIENTIFIC INSTRUMENTS: CONTROL & FILTER 0.0 117.23 11 NA 135 PARKER HANNIFIN CORP SCIENTIFIC INSTRUMENTS: CONTROL & FILTER 0.0 149.36 20 NA 123 ROCKWELL AUTOMATION INC SCIENTIFIC INSTRUMENTS: CONTROL & FILTER 0.0 128.80 16 NA
91 ROPER INDUSTRIES INC SCIENTIFIC INSTRUMENTS: CONTROL & FILTER 0.0 181.09 16 NA 380 TYCO INTERNATIONAL PLC SCIENTIFIC INSTRUMENTS: CONTROL & FILTER 0.0 50.80 19 NA
76 WATERS CORP SCIENTIFIC INSTRUMENTS: CONTROL & FILTER 0.0 130.56 10 NA 2,000 WATTS WATER TECHNOLOGIES INC SCIENTIFIC INSTRUMENTS: CONTROL & FILTER 0.1 73.48 147 NA
223 AMETEK INC SCIENTIFIC INSTRUMENTS: ELECTRICAL 0.0 60.96 14 NA 630 EMERSON ELECTRIC CO SCIENTIFIC INSTRUMENTS: ELECTRICAL 0.0 71.50 45 NA
7,800 EMERSON ELECTRIC CO SCIENTIFIC INSTRUMENTS: ELECTRICAL 0.3 71.50 558 NA 6,134 ENERSYS SCIENTIFIC INSTRUMENTS: ELECTRICAL 0.2 71.49 439 NA 7,155 GENERAL CABLE CORP SCIENTIFIC INSTRUMENTS: ELECTRICAL 0.1 17.26 123 NA
30,761 TIANNENG POWER INTL HKD0.10 SCIENTIFIC INSTRUMENTS: ELECTRICAL 0.0 0.31 9 FC 10,600 KEYSIGHT TECHNOLOGIES INC SCIENTIFIC INSTRUMENTS: GAUGES & METERS 0.2 39.11 415 NA
170 PENTAIR PLC SCIENTIFIC INSTRUMENTS: POLLUTION CONTROL 0.0 76.93 13 NA 229 REPUBLIC SERVICES INC SCIENTIFIC INSTRUMENTS: POLLUTION CONTROL 0.0 46.62 11 NA
4,500 REPUBLIC SERVICES INC SCIENTIFIC INSTRUMENTS: POLLUTION CONTROL 0.1 46.62 210 NA 387 WASTE MANAGEMENT INC SCIENTIFIC INSTRUMENTS: POLLUTION CONTROL 0.0 59.44 23 NA 165 XYLEM INC/NY SCIENTIFIC INSTRUMENTS: POLLUTION CONTROL 0.0 44.09 7 NA
1,722 HUNTINGTON INGALLS INDUSTRIES SHIPPING 0.1 130.26 224 NA 728 HUNTINGTON INGALLS INDUSTRIES SHIPPING 0.0 130.26 95 NA
2,750 TIDEWATER INC SHIPPING 0.0 37.54 103 NA 40,926 ANHUI EXPRESSWAY CO TRANSPORTATION MISCELLANEOUS 0.0 0.78 32 FC
Page 22 of 34 Source: The Bank of New York Mellon Corporation1/13/2015 1:01:20 PM EST
UGYG30000000 - Univ of Guelph Endow Fund
TOTAL EQUITY HOLDINGS Report ID:Reporting Currency: CAD
IEQS0002
12/31/2014
Review
the Investment
Profile of the U
niversity's P
age 34 of 85

Shares Description Industry % ofEquity
Price MarketValue(000)
Russell Sector Scheme CAD
CAD
CntryCode
PRODUCER DURABLES 15.2143,591 CHINA RAILWAY GROUP LIMITED TRANSPORTATION MISCELLANEOUS 0.1 0.95 137 FC
17,925 EXPEDITORS INTERNATIONAL OF WA TRANSPORTATION MISCELLANEOUS 0.4 51.67 926 NA 175 EXPEDITORS INTERNATIONAL OF WA TRANSPORTATION MISCELLANEOUS 0.0 51.67 9 NA
17,300 FIRSTGROUP ORD5P TRANSPORTATION MISCELLANEOUS 0.0 1.93 33 EX 4,252 IMPERIAL HOLDING ZAR0.04 TRANSPORTATION MISCELLANEOUS 0.0 18.52 79 KS
44,967 OHL MEXICO SAB DE CV TRANSPORTATION MISCELLANEOUS 0.0 2.15 97 LM 49,179 SICHUAN EXPRESSWAY 'H'CNY1 TRANSPORTATION MISCELLANEOUS 0.0 0.50 24 FC 20,500 TOLL HLDGS LIMITED NPV TRANSPORTATION MISCELLANEOUS 0.1 5.58 114 AA
633 UNITED PARCEL SERVICE INC TRANSPORTATION MISCELLANEOUS 0.0 128.76 81 NA 133 CH ROBINSON WORLDWIDE INC TRUCKERS 0.0 86.74 12 NA
4,300 NIPPON KONPO NPV TRUCKERS 0.0 17.13 74 FJ 12,000 SEINO HOLDINGS CO LTD TRUCKERS 0.1 11.77 141 FJ
2,700 WERNER ENTERPRISES INC TRUCKERS 0.0 36.08 97 NA 20,225 WERNER ENTERPRISES INC TRUCKERS 0.3 36.08 730 NA
FINANCIAL SERVICES 29.550 AFFILIATED MANAGERS GROUP INC ASSET MANAGEMENT & CUSTODIAN 0.0 245.83 12 NA
116 BLACKROCK INC ASSET MANAGEMENT & CUSTODIAN 0.0 414.14 48 NA 8,553 BROOKFIELD ASSET MGMT INC ASSET MANAGEMENT & CUSTODIAN 0.2 58.22 498 NC
17,300 CI FINANCIAL INC ASSET MANAGEMENT & CUSTODIAN 0.3 32.29 559 NC 356 FRANKLIN RESOURCES INC ASSET MANAGEMENT & CUSTODIAN 0.0 64.13 23 NA
6,100 GAM HOLDING LTD ASSET MANAGEMENT & CUSTODIAN 0.1 20.98 128 ES 1,700 HERCULES TECHNOLOGY GROWTH CAP ASSET MANAGEMENT & CUSTODIAN 0.0 17.23 29 NA
391 INVESCO LTD ASSET MANAGEMENT & CUSTODIAN 0.0 45.77 18 NA 91 LEGG MASON INC ASSET MANAGEMENT & CUSTODIAN 0.0 61.82 6 NA
201 NORTHERN TRUST CORP ASSET MANAGEMENT & CUSTODIAN 0.0 78.07 16 NA 3,537 ONEX CORP ASSET MANAGEMENT & CUSTODIAN 0.1 67.46 239 NC 1,900 PARGESA HLDGS SA CHF20(BR) ASSET MANAGEMENT & CUSTODIAN 0.1 89.81 171 ES
379 STATE STREET CORP ASSET MANAGEMENT & CUSTODIAN 0.0 90.92 34 NA 235 T ROWE PRICE GROUP INC ASSET MANAGEMENT & CUSTODIAN 0.0 99.45 23 NA
4,800 TCP CAPITAL CORP ASSET MANAGEMENT & CUSTODIAN 0.0 19.44 93 NA 2,390 WADDELL & REED FINANCIAL INC ASSET MANAGEMENT & CUSTODIAN 0.1 57.70 138 NA 8,800 3I GROUP PLC ORD GBP0.738636 ASSET MANAGEMENT & CUSTODIAN 0.0 8.13 72 EX 9,565 AFFIN HOLDINGS BERHAD BANKS: DIVERSIFIED 0.0 0.96 9 FN 5,064 ALLAHABAD BANK BANKS: DIVERSIFIED 0.0 2.44 12 FI
45,325 AMMB HOLDINGS BHD MYR1 BANKS: DIVERSIFIED 0.0 2.19 99 FN 6,097 ANDHRA BANK INR10 BANKS: DIVERSIFIED 0.0 1.74 11 FI
500 BANCFIRST CORP BANKS: DIVERSIFIED 0.0 73.42 37 NA 2,438 BANCO DAVIVIENDA SA BANKS: DIVERSIFIED 0.0 13.70 33 LL
Page 23 of 34 Source: The Bank of New York Mellon Corporation1/13/2015 1:01:20 PM EST
UGYG30000000 - Univ of Guelph Endow Fund
TOTAL EQUITY HOLDINGS Report ID:Reporting Currency: CAD
IEQS0002
12/31/2014
Review
the Investment
Profile of the U
niversity's P
age 35 of 85

Shares Description Industry % ofEquity
Price MarketValue(000)
Russell Sector Scheme CAD
CAD
CntryCode
FINANCIAL SERVICES 29.52,031 BANCO DAYCOVAL SA BANKS: DIVERSIFIED 0.0 3.66 7 LB
13,667 BANCO DO BRASIL SA BANKS: DIVERSIFIED 0.1 10.36 142 LB 7,991 BANCO DO ESTADO DO RIO GRANDE BANKS: DIVERSIFIED 0.0 6.32 50 LB 6,112 BANCO INDUSTRIAL E COMERCIAL S BANKS: DIVERSIFIED 0.0 2.48 15 LB 2,018 BANCO PINE SA PRF STK NPV BANKS: DIVERSIFIED 0.0 2.81 6 LB
17,000 BANCO SANTANDER SA BANKS: DIVERSIFIED 0.1 9.81 167 EE 2,277 BANCO SOFISA S A PFD SHS NPV BANKS: DIVERSIFIED 0.0 1.12 3 LB
49,000 BANGKOK BANK PCL BANKS: DIVERSIFIED 0.2 6.83 335 FB 10,848 BANGKOK BK PUB CO (LOCAL) BANKS: DIVERSIFIED 0.0 6.83 74 FB
415,537 BANK BUKOPIN PT COM BANKS: DIVERSIFIED 0.0 0.07 29 FL 26,200 BANK HAPOALIM B.M. ILS1 BANKS: DIVERSIFIED 0.1 5.48 143 FZ
188,973 BANK NEGARA INDONESIA PERSERO BANKS: DIVERSIFIED 0.0 0.57 108 FL 9,547 BANK OF AMERICA CORP BANKS: DIVERSIFIED 0.1 20.72 198 NA
552,781 BANK OF CHINA LTD CNY1 BANKS: DIVERSIFIED 0.2 0.65 361 FC 50,804 BANK OF COMMUNICATIONS CO LTD BANKS: DIVERSIFIED 0.0 1.08 55 FC 24,300 BANK OF NOVA SCOTIA BANKS: DIVERSIFIED 0.7 66.31 1,611 NC 16,650 BANK OF NOVA SCOTIA BANKS: DIVERSIFIED 0.5 66.31 1,104 NC
7,138 BANK OF QUEENSLAND LTD BANKS: DIVERSIFIED 0.0 11.54 82 AA 383,346 BANK PEMBANGUNAN DAERAH JAWA BANKS: DIVERSIFIED 0.0 0.07 26 FL 299,062 BANK TABUNGAN NEGARA PERSERO BANKS: DIVERSIFIED 0.0 0.11 34 FL
8,648 BARCLAYS AFRICA GROUP LTD BANKS: DIVERSIFIED 0.1 18.22 158 KS 34,300 BARCLAYS ORD GBP0.25 BANKS: DIVERSIFIED 0.1 4.40 151 EX
654 BB&T CORP BANKS: DIVERSIFIED 0.0 45.04 29 NA 5,113 BBCN BANCORP INC BANKS: DIVERSIFIED 0.0 16.66 85 NA
249,330 BCO DE CHILE ORD NPV BANKS: DIVERSIFIED 0.0 0.13 33 LC 18,000 BENDIGO & ADELAIDE BK LTD NPV BANKS: DIVERSIFIED 0.1 12.14 219 AA
BK MANDIRI IDR500 BANKS: DIVERSIFIED 0.0 1.01 FL 4,847 BK OF INDIA INR10(DEMAT) BANKS: DIVERSIFIED 0.0 5.54 27 FI 2,400 BNP PARIBAS EUR2 BANKS: DIVERSIFIED 0.1 69.04 166 EF 4,320 BS FINANCIAL GROUP INC BANKS: DIVERSIFIED 0.0 15.28 66 FK 3,472 CANARA BANK INR10 BANKS: DIVERSIFIED 0.0 8.23 29 FI 2,555 CATHAY GENERAL BANCORP BANKS: DIVERSIFIED 0.0 29.64 76 NA
14,000 CHIBA BANK Y50 BANKS: DIVERSIFIED 0.0 7.67 107 FJ 187,114 CHINA CITIC BANK CORPORATION H BANKS: DIVERSIFIED 0.1 0.93 174 FC 147,152 CHINA MINSHENG BANKING CORP BANKS: DIVERSIFIED 0.1 1.52 224 FC 167,246 CHONGQING RURAL COMMECRIAL H BANKS: DIVERSIFIED 0.1 0.72 121 FC
31,692 CIMB GROUP HOLDINGS BERHAD BANKS: DIVERSIFIED 0.0 1.84 58 FN 20,575 COMERICA INC BANKS: DIVERSIFIED 0.5 54.25 1,116 NA
163 COMERICA INC BANKS: DIVERSIFIED 0.0 54.25 9 NA 1,169 COMM BK OF QATAR QAR10 BANKS: DIVERSIFIED 0.0 21.79 25 GQ
Page 24 of 34 Source: The Bank of New York Mellon Corporation1/13/2015 1:01:20 PM EST
UGYG30000000 - Univ of Guelph Endow Fund
TOTAL EQUITY HOLDINGS Report ID:Reporting Currency: CAD
IEQS0002
12/31/2014
Review
the Investment
Profile of the U
niversity's P
age 36 of 85

Shares Description Industry % ofEquity
Price MarketValue(000)
Russell Sector Scheme CAD
CAD
CntryCode
FINANCIAL SERVICES 29.52,700 COMMERCE BANCSHARES INC/MO BANKS: DIVERSIFIED 0.1 50.37 136 NA 2,351 CORPORATION BK INR10 DEMAT BANKS: DIVERSIFIED 0.0 6.16 14 FI
10,369 CREDIT AGRICOLE SA EUR3 BANKS: DIVERSIFIED 0.1 15.08 156 EF 61,810 CTBC FINANCIAL HOLDING CO LTD BANKS: DIVERSIFIED 0.0 0.75 47 FA
1,870 CUSTOMERS BANCORP INC BANKS: DIVERSIFIED 0.0 22.54 42 NA 8,623 CVB FINANCIAL CORP BANKS: DIVERSIFIED 0.1 18.56 160 NA
16,000 DBS HLDGS SGD1 BANKS: DIVERSIFIED 0.1 18.01 288 FM 3,538 DEXIA NPV BANKS: DIVERSIFIED 0.0 0.04 EB 9,600 DNB ASA BANKS: DIVERSIFIED 0.1 17.10 164 SN
748 FIFTH THIRD BANCORP BANKS: DIVERSIFIED 0.0 23.60 18 NA 2,800 FIRST MERCHANTS CORP BANKS: DIVERSIFIED 0.0 26.35 74 NA 7,936 FIRST MIDWEST BANCORP INC/IL BANKS: DIVERSIFIED 0.1 19.82 157 NA 6,782 FNB CORP/PA BANKS: DIVERSIFIED 0.0 15.43 105 NA 9,300 FULTON FINANCIAL CORP BANKS: DIVERSIFIED 0.1 14.32 133 NA
500 GE MONEY BANK AG BANKS: DIVERSIFIED 0.0 64.11 32 ES 1,100 GERMAN AMERICAN BANCORP INC BANKS: DIVERSIFIED 0.0 35.35 39 NA 3,645 GP FIN SANT SERFIN SER 'B' BANKS: DIVERSIFIED 0.0 2.42 9 LM 7,690 HONG LEONG FIN MYR1 BANKS: DIVERSIFIED 0.0 5.47 42 FN
56,100 HSBC HOLDINGS PLC BANKS: DIVERSIFIED 0.3 10.99 617 EX 53,143 HSBC HOLDINGS PLC BANKS: DIVERSIFIED 0.3 10.99 584 EX
739 HUNTINGTON BANCSHARES INC/OH BANKS: DIVERSIFIED 0.0 12.18 9 NA 8,694 IDBI BANK LTD INR10 BANKS: DIVERSIFIED 0.0 1.34 12 FI 6,580 INDIAN BANK INR10 BANKS: DIVERSIFIED 0.0 4.00 26 FI
10,909 INDIAN OVERSEAS BK INR10 BANKS: DIVERSIFIED 0.0 1.14 12 FI 213,642 INDUSTRIAL & COMMERCIAL BANK O BANKS: DIVERSIFIED 0.1 0.85 181 FC
6,912 INDUSTRIAL BK OF KOREA KRW5000 BANKS: DIVERSIFIED 0.0 14.86 103 FK 14,500 ING GROEP N.V. CVA EUR0.24 BANKS: DIVERSIFIED 0.1 15.18 220 EN 15,037 ISRAEL DISCOUNT BANK ILS0.1 BANKS: DIVERSIFIED 0.0 1.86 28 FZ
5,735 ITAU UNIBANCO HOLDING SA BANKS: DIVERSIFIED 0.0 15.08 86 LB 2,518 JB FINANCIAL GROUP CO LTD BANKS: DIVERSIFIED 0.0 6.42 16 FK
12,741 KARNATAKA BANK INR10 BANKS: DIVERSIFIED 0.0 2.68 34 FI 1,732 KB FINANCIAL GROUP INC KRW5000 BANKS: DIVERSIFIED 0.0 38.09 66 FK
786 KEYCORP BANKS: DIVERSIFIED 0.0 16.10 13 NA 31,348 KIATNAKIN FIN & SECS THB10 BANKS: DIVERSIFIED 0.0 1.39 44 FB 46,492 KINGS TOWN BANK BANKS: DIVERSIFIED 0.0 1.20 56 FA
514 KJB FINANCIAL GROUP CO LTD BANKS: DIVERSIFIED 0.0 10.15 5 FK 786 KNB FINANCIAL GROUP CO LTD BANKS: DIVERSIFIED 0.0 12.54 10 FK
130,311 KRUNGTHAI BANK PUBLIC CO LTD BANKS: DIVERSIFIED 0.0 0.80 104 FB 1,400 LAKELAND FINANCIAL CORP BANKS: DIVERSIFIED 0.0 50.35 70 NA 4,232 LAURENTIAN BANK OF CANADA BANKS: DIVERSIFIED 0.1 49.97 211 NC
Page 25 of 34 Source: The Bank of New York Mellon Corporation1/13/2015 1:01:20 PM EST
UGYG30000000 - Univ of Guelph Endow Fund
TOTAL EQUITY HOLDINGS Report ID:Reporting Currency: CAD
IEQS0002
12/31/2014
Review
the Investment
Profile of the U
niversity's P
age 37 of 85

Shares Description Industry % ofEquity
Price MarketValue(000)
Russell Sector Scheme CAD
CAD
CntryCode
FINANCIAL SERVICES 29.53,900 M&T BANK CORP BANKS: DIVERSIFIED 0.3 145.50 567 NA
120 M&T BANK CORP BANKS: DIVERSIFIED 0.0 145.50 17 NA 2,543 MB FINANCIAL INC BANKS: DIVERSIFIED 0.0 38.06 97 NA
138,500 MIZUHO FINL GP NPV BANKS: DIVERSIFIED 0.1 1.96 271 FJ 5,500 NATL AUSTRALIA BK NPV BANKS: DIVERSIFIED 0.1 31.85 175 AA 1,446 NEDBANK GROUP LTD BANKS: DIVERSIFIED 0.0 24.93 36 KS
12,700 NORDEA BANK AB EUR0.39632 BANKS: DIVERSIFIED 0.1 13.45 171 SS 30,300 NORTH PACIFIC BANK LTD BANKS: DIVERSIFIED 0.1 4.52 137 FJ
9,906 ORIENTAL BANK OF COMMERCE BANKS: DIVERSIFIED 0.0 6.23 62 FI 3,193 OTP BANK HUF100 BANKS: DIVERSIFIED 0.0 16.92 54 EM 1,537 PARANA BANCO S/A PRF NPV BANKS: DIVERSIFIED 0.0 4.54 7 LB 2,190 PINNACLE FINANCIAL PARTNERS IN BANKS: DIVERSIFIED 0.0 45.80 100 NA
478 PNC FINANCIAL SERVICES GROUP I BANKS: DIVERSIFIED 0.0 105.67 50 NA 2,249 PROSPERITY BANCSHARES INC BANKS: DIVERSIFIED 0.1 64.12 144 NA 4,600 RAIFFEISEN BANK INTERNATIONAL BANKS: DIVERSIFIED 0.0 17.57 81 EA 1,250 REGIONS FINANCIAL CORP BANKS: DIVERSIFIED 0.0 12.23 15 NA
25,411 RHB CAPITAL BHD MYR1 BANKS: DIVERSIFIED 0.0 2.52 64 FN 10,508 ROYAL BANK OF CANADA BANKS: DIVERSIFIED 0.4 80.24 843 NC 23,000 ROYAL BANK OF CANADA BANKS: DIVERSIFIED 0.8 80.24 1,846 NC
2,300 S&T BANCORP INC BANKS: DIVERSIFIED 0.0 34.53 79 NA 76,412 SINOPAC HLDG TWD10 BANKS: DIVERSIFIED 0.0 0.48 36 FA
2,900 SOCIETE GENERALE EUR1.25 BANKS: DIVERSIFIED 0.1 49.04 142 EF 66,478 STANDARD CHARTERED ORD USD0.50 BANKS: DIVERSIFIED 0.5 17.39 1,156 EX
2,100 STOCK YDS BANCORP INC BANKS: DIVERSIFIED 0.0 38.62 81 NA 6,400 SUMITOMO MITSUI GR NPV BANKS: DIVERSIFIED 0.1 42.26 270 FJ
473 SUNTRUST BANKS INC BANKS: DIVERSIFIED 0.0 48.53 23 NA 9,800 SWEDBANK AB SEK'A' NPV BANKS: DIVERSIFIED 0.1 28.93 283 SS 8,649 SYNDICATE BANK INR10 BANKS: DIVERSIFIED 0.0 2.41 21 FI
23,502 T IS BANKASI SER'C'TRY1 BANKS: DIVERSIFIED 0.0 3.34 78 ET 156,707 TAISHIN FINANCIAL TWD10 BANKS: DIVERSIFIED 0.0 0.48 75 FA
13,387 TCF FINANCIAL CORP BANKS: DIVERSIFIED 0.1 18.40 246 NA 9,762 TCF FINANCIAL CORP BANKS: DIVERSIFIED 0.1 18.40 180 NA
600 TOMPKINS FINANCIAL CORP BANKS: DIVERSIFIED 0.0 64.05 38 NA 34,200 TORONTO DOMINION BANK BANKS: DIVERSIFIED 0.9 55.51 1,898 NC 19,562 TORONTO DOMINION BANK BANKS: DIVERSIFIED 0.5 55.51 1,086 NC
7,789 TURKIYE HALK BANKASI BANKS: DIVERSIFIED 0.0 6.89 54 ET 9,695 UCO BANK INR10 BANKS: DIVERSIFIED 0.0 1.55 15 FI
32,600 UNITED OVERSEAS BANK SG$1 BANKS: DIVERSIFIED 0.3 21.44 699 FM 1,624 US BANCORP BANKS: DIVERSIFIED 0.0 52.06 85 NA 5,958 VIJAYA BANK INR10 BANKS: DIVERSIFIED 0.0 0.92 6 FI
Page 26 of 34 Source: The Bank of New York Mellon Corporation1/13/2015 1:01:20 PM EST
UGYG30000000 - Univ of Guelph Endow Fund
TOTAL EQUITY HOLDINGS Report ID:Reporting Currency: CAD
IEQS0002
12/31/2014
Review
the Investment
Profile of the U
niversity's P
age 38 of 85
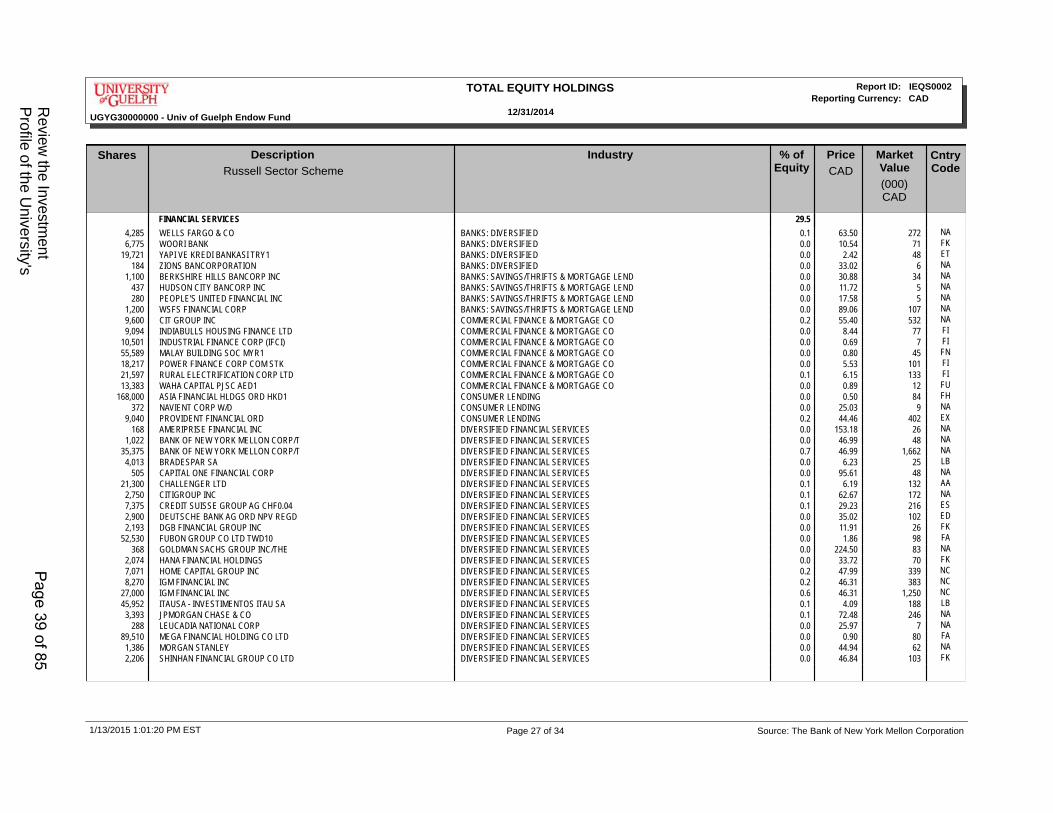
Shares Description Industry % ofEquity
Price MarketValue(000)
Russell Sector Scheme CAD
CAD
CntryCode
FINANCIAL SERVICES 29.54,285 WELLS FARGO & CO BANKS: DIVERSIFIED 0.1 63.50 272 NA 6,775 WOORI BANK BANKS: DIVERSIFIED 0.0 10.54 71 FK
19,721 YAPI VE KREDI BANKASI TRY1 BANKS: DIVERSIFIED 0.0 2.42 48 ET 184 ZIONS BANCORPORATION BANKS: DIVERSIFIED 0.0 33.02 6 NA
1,100 BERKSHIRE HILLS BANCORP INC BANKS: SAVINGS/THRIFTS & MORTGAGE LEND 0.0 30.88 34 NA 437 HUDSON CITY BANCORP INC BANKS: SAVINGS/THRIFTS & MORTGAGE LEND 0.0 11.72 5 NA 280 PEOPLE'S UNITED FINANCIAL INC BANKS: SAVINGS/THRIFTS & MORTGAGE LEND 0.0 17.58 5 NA
1,200 WSFS FINANCIAL CORP BANKS: SAVINGS/THRIFTS & MORTGAGE LEND 0.0 89.06 107 NA 9,600 CIT GROUP INC COMMERCIAL FINANCE & MORTGAGE CO 0.2 55.40 532 NA 9,094 INDIABULLS HOUSING FINANCE LTD COMMERCIAL FINANCE & MORTGAGE CO 0.0 8.44 77 FI
10,501 INDUSTRIAL FINANCE CORP (IFCI) COMMERCIAL FINANCE & MORTGAGE CO 0.0 0.69 7 FI 55,589 MALAY BUILDING SOC MYR1 COMMERCIAL FINANCE & MORTGAGE CO 0.0 0.80 45 FN 18,217 POWER FINANCE CORP COM STK COMMERCIAL FINANCE & MORTGAGE CO 0.0 5.53 101 FI 21,597 RURAL ELECTRIFICATION CORP LTD COMMERCIAL FINANCE & MORTGAGE CO 0.1 6.15 133 FI 13,383 WAHA CAPITAL PJSC AED1 COMMERCIAL FINANCE & MORTGAGE CO 0.0 0.89 12 FU
168,000 ASIA FINANCIAL HLDGS ORD HKD1 CONSUMER LENDING 0.0 0.50 84 FH 372 NAVIENT CORP W/D CONSUMER LENDING 0.0 25.03 9 NA
9,040 PROVIDENT FINANCIAL ORD CONSUMER LENDING 0.2 44.46 402 EX 168 AMERIPRISE FINANCIAL INC DIVERSIFIED FINANCIAL SERVICES 0.0 153.18 26 NA
1,022 BANK OF NEW YORK MELLON CORP/T DIVERSIFIED FINANCIAL SERVICES 0.0 46.99 48 NA 35,375 BANK OF NEW YORK MELLON CORP/T DIVERSIFIED FINANCIAL SERVICES 0.7 46.99 1,662 NA
4,013 BRADESPAR SA DIVERSIFIED FINANCIAL SERVICES 0.0 6.23 25 LB 505 CAPITAL ONE FINANCIAL CORP DIVERSIFIED FINANCIAL SERVICES 0.0 95.61 48 NA
21,300 CHALLENGER LTD DIVERSIFIED FINANCIAL SERVICES 0.1 6.19 132 AA 2,750 CITIGROUP INC DIVERSIFIED FINANCIAL SERVICES 0.1 62.67 172 NA 7,375 CREDIT SUISSE GROUP AG CHF0.04 DIVERSIFIED FINANCIAL SERVICES 0.1 29.23 216 ES 2,900 DEUTSCHE BANK AG ORD NPV REGD DIVERSIFIED FINANCIAL SERVICES 0.0 35.02 102 ED 2,193 DGB FINANCIAL GROUP INC DIVERSIFIED FINANCIAL SERVICES 0.0 11.91 26 FK
52,530 FUBON GROUP CO LTD TWD10 DIVERSIFIED FINANCIAL SERVICES 0.0 1.86 98 FA 368 GOLDMAN SACHS GROUP INC/THE DIVERSIFIED FINANCIAL SERVICES 0.0 224.50 83 NA
2,074 HANA FINANCIAL HOLDINGS DIVERSIFIED FINANCIAL SERVICES 0.0 33.72 70 FK 7,071 HOME CAPITAL GROUP INC DIVERSIFIED FINANCIAL SERVICES 0.2 47.99 339 NC 8,270 IGM FINANCIAL INC DIVERSIFIED FINANCIAL SERVICES 0.2 46.31 383 NC
27,000 IGM FINANCIAL INC DIVERSIFIED FINANCIAL SERVICES 0.6 46.31 1,250 NC 45,952 ITAUSA - INVESTIMENTOS ITAU SA DIVERSIFIED FINANCIAL SERVICES 0.1 4.09 188 LB
3,393 JPMORGAN CHASE & CO DIVERSIFIED FINANCIAL SERVICES 0.1 72.48 246 NA 288 LEUCADIA NATIONAL CORP DIVERSIFIED FINANCIAL SERVICES 0.0 25.97 7 NA
89,510 MEGA FINANCIAL HOLDING CO LTD DIVERSIFIED FINANCIAL SERVICES 0.0 0.90 80 FA 1,386 MORGAN STANLEY DIVERSIFIED FINANCIAL SERVICES 0.0 44.94 62 NA 2,206 SHINHAN FINANCIAL GROUP CO LTD DIVERSIFIED FINANCIAL SERVICES 0.0 46.84 103 FK
Page 27 of 34 Source: The Bank of New York Mellon Corporation1/13/2015 1:01:20 PM EST
UGYG30000000 - Univ of Guelph Endow Fund
TOTAL EQUITY HOLDINGS Report ID:Reporting Currency: CAD
IEQS0002
12/31/2014
Review
the Investment
Profile of the U
niversity's P
age 39 of 85
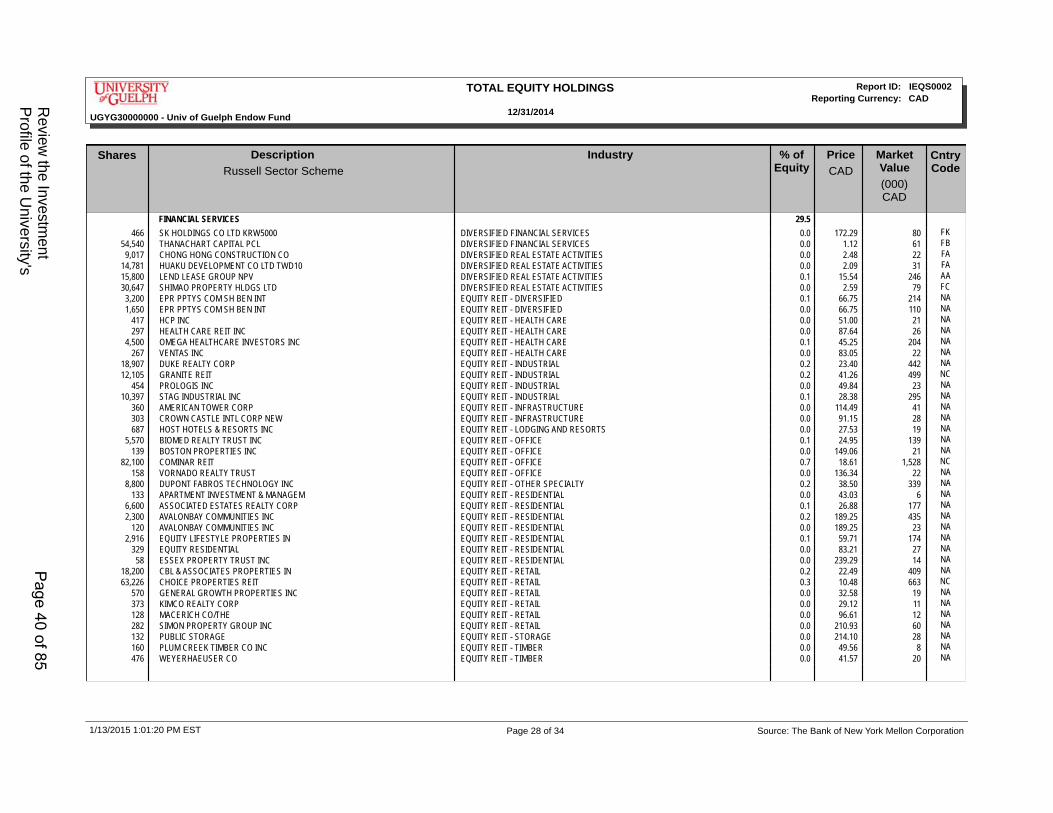
Shares Description Industry % ofEquity
Price MarketValue(000)
Russell Sector Scheme CAD
CAD
CntryCode
FINANCIAL SERVICES 29.5466 SK HOLDINGS CO LTD KRW5000 DIVERSIFIED FINANCIAL SERVICES 0.0 172.29 80 FK
54,540 THANACHART CAPITAL PCL DIVERSIFIED FINANCIAL SERVICES 0.0 1.12 61 FB 9,017 CHONG HONG CONSTRUCTION CO DIVERSIFIED REAL ESTATE ACTIVITIES 0.0 2.48 22 FA
14,781 HUAKU DEVELOPMENT CO LTD TWD10 DIVERSIFIED REAL ESTATE ACTIVITIES 0.0 2.09 31 FA 15,800 LEND LEASE GROUP NPV DIVERSIFIED REAL ESTATE ACTIVITIES 0.1 15.54 246 AA 30,647 SHIMAO PROPERTY HLDGS LTD DIVERSIFIED REAL ESTATE ACTIVITIES 0.0 2.59 79 FC
3,200 EPR PPTYS COM SH BEN INT EQUITY REIT - DIVERSIFIED 0.1 66.75 214 NA 1,650 EPR PPTYS COM SH BEN INT EQUITY REIT - DIVERSIFIED 0.0 66.75 110 NA
417 HCP INC EQUITY REIT - HEALTH CARE 0.0 51.00 21 NA 297 HEALTH CARE REIT INC EQUITY REIT - HEALTH CARE 0.0 87.64 26 NA
4,500 OMEGA HEALTHCARE INVESTORS INC EQUITY REIT - HEALTH CARE 0.1 45.25 204 NA 267 VENTAS INC EQUITY REIT - HEALTH CARE 0.0 83.05 22 NA
18,907 DUKE REALTY CORP EQUITY REIT - INDUSTRIAL 0.2 23.40 442 NA 12,105 GRANITE REIT EQUITY REIT - INDUSTRIAL 0.2 41.26 499 NC
454 PROLOGIS INC EQUITY REIT - INDUSTRIAL 0.0 49.84 23 NA 10,397 STAG INDUSTRIAL INC EQUITY REIT - INDUSTRIAL 0.1 28.38 295 NA
360 AMERICAN TOWER CORP EQUITY REIT - INFRASTRUCTURE 0.0 114.49 41 NA 303 CROWN CASTLE INTL CORP NEW EQUITY REIT - INFRASTRUCTURE 0.0 91.15 28 NA 687 HOST HOTELS & RESORTS INC EQUITY REIT - LODGING AND RESORTS 0.0 27.53 19 NA
5,570 BIOMED REALTY TRUST INC EQUITY REIT - OFFICE 0.1 24.95 139 NA 139 BOSTON PROPERTIES INC EQUITY REIT - OFFICE 0.0 149.06 21 NA
82,100 COMINAR REIT EQUITY REIT - OFFICE 0.7 18.61 1,528 NC 158 VORNADO REALTY TRUST EQUITY REIT - OFFICE 0.0 136.34 22 NA
8,800 DUPONT FABROS TECHNOLOGY INC EQUITY REIT - OTHER SPECIALTY 0.2 38.50 339 NA 133 APARTMENT INVESTMENT & MANAGEM EQUITY REIT - RESIDENTIAL 0.0 43.03 6 NA
6,600 ASSOCIATED ESTATES REALTY CORP EQUITY REIT - RESIDENTIAL 0.1 26.88 177 NA 2,300 AVALONBAY COMMUNITIES INC EQUITY REIT - RESIDENTIAL 0.2 189.25 435 NA
120 AVALONBAY COMMUNITIES INC EQUITY REIT - RESIDENTIAL 0.0 189.25 23 NA 2,916 EQUITY LIFESTYLE PROPERTIES IN EQUITY REIT - RESIDENTIAL 0.1 59.71 174 NA
329 EQUITY RESIDENTIAL EQUITY REIT - RESIDENTIAL 0.0 83.21 27 NA 58 ESSEX PROPERTY TRUST INC EQUITY REIT - RESIDENTIAL 0.0 239.29 14 NA
18,200 CBL & ASSOCIATES PROPERTIES IN EQUITY REIT - RETAIL 0.2 22.49 409 NA 63,226 CHOICE PROPERTIES REIT EQUITY REIT - RETAIL 0.3 10.48 663 NC
570 GENERAL GROWTH PROPERTIES INC EQUITY REIT - RETAIL 0.0 32.58 19 NA 373 KIMCO REALTY CORP EQUITY REIT - RETAIL 0.0 29.12 11 NA 128 MACERICH CO/THE EQUITY REIT - RETAIL 0.0 96.61 12 NA 282 SIMON PROPERTY GROUP INC EQUITY REIT - RETAIL 0.0 210.93 60 NA 132 PUBLIC STORAGE EQUITY REIT - STORAGE 0.0 214.10 28 NA 160 PLUM CREEK TIMBER CO INC EQUITY REIT - TIMBER 0.0 49.56 8 NA 476 WEYERHAEUSER CO EQUITY REIT - TIMBER 0.0 41.57 20 NA
Page 28 of 34 Source: The Bank of New York Mellon Corporation1/13/2015 1:01:20 PM EST
UGYG30000000 - Univ of Guelph Endow Fund
TOTAL EQUITY HOLDINGS Report ID:Reporting Currency: CAD
IEQS0002
12/31/2014
Review
the Investment
Profile of the U
niversity's P
age 40 of 85

Shares Description Industry % ofEquity
Price MarketValue(000)
Russell Sector Scheme CAD
CAD
CntryCode
FINANCIAL SERVICES 29.558 ALLIANCE DATA SYSTEMS CORP FINANCIAL DATA & SYSTEMS 0.0 331.32 19 NA
808 AMERICAN EXPRESS CO FINANCIAL DATA & SYSTEMS 0.0 107.76 87 NA 11,400 AMERICAN EXPRESS CO FINANCIAL DATA & SYSTEMS 0.6 107.76 1,229 NA
412 DISCOVER FINANCIAL SERVICES FINANCIAL DATA & SYSTEMS 0.0 75.85 31 NA 33 DUN & BRADSTREET CORP FINANCIAL DATA & SYSTEMS 0.0 140.10 5 NA
109 EQUIFAX INC FINANCIAL DATA & SYSTEMS 0.0 93.67 10 NA 2,263 FAIR ISAAC CORP FINANCIAL DATA & SYSTEMS 0.1 83.74 190 NA
258 FIDELITY NATIONAL INFORMATION FINANCIAL DATA & SYSTEMS 0.0 72.04 19 NA 221 FISERV INC FINANCIAL DATA & SYSTEMS 0.0 82.20 18 NA
2,400 GLOBAL PAYMENTS INC FINANCIAL DATA & SYSTEMS 0.1 93.51 224 NA 890 MASTERCARD INC FINANCIAL DATA & SYSTEMS 0.0 99.79 89 NA 246 MCGRAW HILL FINANCIAL INC FINANCIAL DATA & SYSTEMS 0.0 103.06 25 NA 167 MOODY'S CORP FINANCIAL DATA & SYSTEMS 0.0 110.97 18 NA
4,715 THOMSON REUTERS CORP FINANCIAL DATA & SYSTEMS 0.1 46.87 221 NC 44,800 THOMSON REUTERS CORP FINANCIAL DATA & SYSTEMS 0.9 46.87 2,100 NC
150 TOTAL SYSTEM SERVICES INC FINANCIAL DATA & SYSTEMS 0.0 39.33 6 NA 443 VISA INC FINANCIAL DATA & SYSTEMS 0.1 303.69 135 NA 474 WESTERN UNION CO/THE FINANCIAL DATA & SYSTEMS 0.0 20.74 10 NA
14,200 AEGON NV EUR0.12 INSURANCE: LIFE 0.1 8.77 125 EN 409 AFLAC INC INSURANCE: LIFE 0.0 70.76 29 NA
7,663 GREAT WEST LIFECO INC INSURANCE: LIFE 0.1 33.59 257 NC 7,663 HANWHA LIFE INSURANCE CO LTD INSURANCE: LIFE 0.0 8.74 67 FK 2,300 LEGAL & GENERAL GROUP ORD 2.5P INSURANCE: LIFE 0.0 4.49 10 EX
12,953 LINCOLN NATIONAL CORP INSURANCE: LIFE 0.4 66.80 865 NA 236 LINCOLN NATIONAL CORP INSURANCE: LIFE 0.0 66.80 16 NA
21,593 MMI HOLDINGS LTD INSURANCE: LIFE 0.0 3.00 65 KS 59,900 OLD MUTUAL PLC ORD INSURANCE: LIFE 0.1 3.44 206 EX
685,857 PANIN LIFE IDR125 INSURANCE: LIFE 0.0 0.03 19 FL 91,800 POWER CORP CANADA INSURANCE: LIFE 1.3 31.76 2,916 NC 12,582 POWER CORP CANADA INSURANCE: LIFE 0.2 31.76 400 NC
248 PRINCIPAL FINANCIAL GROUP INC INSURANCE: LIFE 0.0 60.16 15 NA 416 PRUDENTIAL FINANCIAL INC INSURANCE: LIFE 0.0 104.78 44 NA
7,872 SHIN KONG FINANCIAL TWD10 INSURANCE: LIFE 0.0 0.33 3 FA 800 SWISS LIFE HOLDING AG INSURANCE: LIFE 0.1 275.56 220 ES 117 TORCHMARK CORP INSURANCE: LIFE 0.0 62.74 7 NA 229 UNUM GROUP INSURANCE: LIFE 0.0 40.40 9 NA
1,700 ALLIANZ SE (SOCIETAS EUROPEAE) INSURANCE: MULTI-LINE 0.1 192.50 327 ED 1,271 AMERICAN INTERNATIONAL GROUP I INSURANCE: MULTI-LINE 0.0 64.87 82 NA
259 AON CORP INSURANCE: MULTI-LINE 0.0 109.84 28 NA 64 ASSURANT INC INSURANCE: MULTI-LINE 0.0 79.26 5 NA
Page 29 of 34 Source: The Bank of New York Mellon Corporation1/13/2015 1:01:20 PM EST
UGYG30000000 - Univ of Guelph Endow Fund
TOTAL EQUITY HOLDINGS Report ID:Reporting Currency: CAD
IEQS0002
12/31/2014
Review
the Investment
Profile of the U
niversity's P
age 41 of 85

Shares Description Industry % ofEquity
Price MarketValue(000)
Russell Sector Scheme CAD
CAD
CntryCode
FINANCIAL SERVICES 29.53,150 ASSURANT INC INSURANCE: MULTI-LINE 0.1 79.26 250 NA
18,300 AVIVA PLC GBP0.25 INSURANCE: MULTI-LINE 0.1 8.75 160 EX 5,600 AXA EUR2.29 INSURANCE: MULTI-LINE 0.1 26.92 151 EF 1,600 BALOISE HOLDING AG INSURANCE: MULTI-LINE 0.1 148.97 238 ES 9,875 BERKSHIRE HATHAWAY INC INSURANCE: MULTI-LINE 0.8 173.91 1,717 NA 1,655 BERKSHIRE HATHAWAY INC INSURANCE: MULTI-LINE 0.1 173.91 288 NA
41,017 CNP ASSURANCES EUR1 INSURANCE: MULTI-LINE 0.4 20.64 846 EF 451 GENWORTH FINANCIAL INC INSURANCE: MULTI-LINE 0.0 9.85 4 NA
2,000 HANNOVER RUECKVERSICHERUNG SE INSURANCE: MULTI-LINE 0.1 105.07 210 ED 392 HARTFORD FINANCIAL SERVICES GR INSURANCE: MULTI-LINE 0.0 48.29 19 NA
6,700 HCC INSURANCE HOLDINGS INC INSURANCE: MULTI-LINE 0.2 61.99 415 NA 3,300 HCC INSURANCE HOLDINGS INC INSURANCE: MULTI-LINE 0.1 61.99 205 NA 2,600 HORACE MANN EDUCATORS CORP INSURANCE: MULTI-LINE 0.0 38.43 100 NA 3,162 LIBERTY HLDGS ORD ZAR0.25 INSURANCE: MULTI-LINE 0.0 12.28 39 KS
272 LOEWS CORP INSURANCE: MULTI-LINE 0.0 48.67 13 NA 491 MARSH & MCLENNAN COS INC INSURANCE: MULTI-LINE 0.0 66.30 33 NA
1,031 METLIFE INC INSURANCE: MULTI-LINE 0.0 62.65 65 NA 2,840 MUENCHENER RUECKVERSICHERUNGS INSURANCE: MULTI-LINE 0.3 232.31 660 ED 1,200 MUENCHENER RUECKVERSICHERUNGS INSURANCE: MULTI-LINE 0.1 232.31 279 ED 3,778 PORTO SEGURO SA COM NPV INSURANCE: MULTI-LINE 0.0 13.25 50 LB 1,400 REINSURANCE GROUP OF AMERICA I INSURANCE: MULTI-LINE 0.1 101.49 142 NA 4,800 SCOR SE EUR7.876972 (POST INSURANCE: MULTI-LINE 0.1 35.31 169 EF 3,300 SWISS RE LTD INSURANCE: MULTI-LINE 0.1 97.51 322 ES 1,000 ZURICH INSURANCE GROUP AG INSURANCE: MULTI-LINE 0.2 363.33 363 ES 2,350 ZURICH INSURANCE GROUP AG INSURANCE: MULTI-LINE 0.4 363.33 854 ES
301 ACE LIMITED SHS INSURANCE: PROPERTY-CASUALTY 0.0 133.06 40 NA 381 ALLSTATE CORP/THE INSURANCE: PROPERTY-CASUALTY 0.0 81.37 31 NA
12,300 ALLSTATE CORP/THE INSURANCE: PROPERTY-CASUALTY 0.4 81.37 1,001 NA 19,000 AMLIN PLC ORD GBP0.28125 INSURANCE: PROPERTY-CASUALTY 0.1 8.64 164 EX
3,542 ARGO GROUP INTERNATIONAL INSURANCE: PROPERTY-CASUALTY 0.1 64.25 228 NA 3,950 ASPEN INSURANCE HOLDINGS INSURANCE: PROPERTY-CASUALTY 0.1 50.70 200 NA
214 CHUBB CORP INSURANCE: PROPERTY-CASUALTY 0.0 119.84 26 NA 134 CINCINNATI FINANCIAL CORP INSURANCE: PROPERTY-CASUALTY 0.0 60.03 8 NA
27,000 DIRECT LINE INSURANCE GROUP PL INSURANCE: PROPERTY-CASUALTY 0.1 5.26 142 EX 591 DONGBU INSURANCE KRW500 INSURANCE: PROPERTY-CASUALTY 0.0 57.96 34 FK
3,400 ENDURANCE SPECIALTY HLDGS LTD INSURANCE: PROPERTY-CASUALTY 0.1 69.31 236 NA 5,600 ENDURANCE SPECIALTY HLDGS LTD INSURANCE: PROPERTY-CASUALTY 0.2 69.31 388 NA
720 FAIRFAX FINANCIAL HOLDINGS LTD INSURANCE: PROPERTY-CASUALTY 0.2 608.78 438 NC 12,100 FNF GROUP INSURANCE: PROPERTY-CASUALTY 0.2 39.90 483 NA
2,586 HYUNDAI FIRE & MARINE INSURANCE: PROPERTY-CASUALTY 0.0 27.40 71 FK
Page 30 of 34 Source: The Bank of New York Mellon Corporation1/13/2015 1:01:20 PM EST
UGYG30000000 - Univ of Guelph Endow Fund
TOTAL EQUITY HOLDINGS Report ID:Reporting Currency: CAD
IEQS0002
12/31/2014
Review
the Investment
Profile of the U
niversity's P
age 42 of 85

Shares Description Industry % ofEquity
Price MarketValue(000)
Russell Sector Scheme CAD
CAD
CntryCode
FINANCIAL SERVICES 29.58,833 INTACT FINANCIAL CORP INSURANCE: PROPERTY-CASUALTY 0.3 83.85 741 NC
14,100 INTACT FINANCIAL CORP INSURANCE: PROPERTY-CASUALTY 0.5 83.85 1,182 NC 3,689 KOREAN REINSURANCE KRW500 INSURANCE: PROPERTY-CASUALTY 0.0 11.38 42 FK 2,507 LIG NON-LIFE INSURANCE CO LTD INSURANCE: PROPERTY-CASUALTY 0.0 28.87 72 FK 3,436 MERITZ FIRE & MARINE INSURANCE INSURANCE: PROPERTY-CASUALTY 0.0 13.12 45 FK
486 PROGRESSIVE CORP/THE INSURANCE: PROPERTY-CASUALTY 0.0 31.26 15 NA 37,625 PROGRESSIVE CORP/THE INSURANCE: PROPERTY-CASUALTY 0.5 31.26 1,176 NA
301 TRAVELERS COS INC/THE INSURANCE: PROPERTY-CASUALTY 0.0 122.60 37 NA 234 XL GROUP PLC INSURANCE: PROPERTY-CASUALTY 0.0 39.81 9 NA
18,189 CYS INVTS INC MORTGAGE REIT - DIVERSIFIED 0.1 10.10 184 NA 14,800 MFA FINANCIAL INC MORTGAGE REIT - DIVERSIFIED 0.1 9.25 137 NA 32,500 MFA FINANCIAL INC MORTGAGE REIT - DIVERSIFIED 0.1 9.25 301 NA 11,200 CAPSTEAD MORTGAGE CORP MORTGAGE REIT - RESIDENTIAL 0.1 14.22 159 NA 28,636 AGILE PROPERTY HLD HKD0.10 REAL ESTATE HOLDING AND DEVELOPMENT 0.0 0.66 19 FC 54,143 AP THAILAND PCL REAL ESTATE HOLDING AND DEVELOPMENT 0.0 0.21 11 FB
106,123 COUNTRY GARDEN HLDGS CO LTD REAL ESTATE HOLDING AND DEVELOPMENT 0.0 0.46 49 FH 3,541 CYRELA BRAZIL REAL COM NPV REAL ESTATE HOLDING AND DEVELOPMENT 0.0 4.82 17 LB
15,875 EVEN CONSTRUTORA E REAL ESTATE HOLDING AND DEVELOPMENT 0.0 2.37 38 LB 12,572 FARGLORY LAND DEVELOPMENT CO. REAL ESTATE HOLDING AND DEVELOPMENT 0.0 1.38 17 FA 31,608 GUANGZHOU R&F PROPERTIES REAL ESTATE HOLDING AND DEVELOPMENT 0.0 1.42 45 FC 69,010 KWG PROPERTY HOLDING LTD REAL ESTATE HOLDING AND DEVELOPMENT 0.0 0.79 55 FC
1,576 MORGUARD CORP REAL ESTATE HOLDING AND DEVELOPMENT 0.1 150.00 236 NC 46,630 SHENZHEN INVESTMEN HKD0.05 REAL ESTATE HOLDING AND DEVELOPMENT 0.0 0.33 16 FH 54,469 SINO-OCEAN LAND HLDGS HKD0.80 REAL ESTATE HOLDING AND DEVELOPMENT 0.0 0.66 36 FC
129,970 VISTA LAND & LIFES PHP1 REAL ESTATE HOLDING AND DEVELOPMENT 0.0 0.19 24 FP 130,075 YUEXIU PROPERTY COMPANY LTD REAL ESTATE HOLDING AND DEVELOPMENT 0.0 0.22 29 FH
254 CBRE GROUP INC REAL ESTATE SERVICES 0.0 39.67 10 NA 5,739 FIRSTSERVICE CORP REAL ESTATE SERVICES 0.2 59.28 340 NC 1,043 CHARLES SCHWAB CORP/THE SECURITIES BROKERAGE & SERVICES 0.0 34.97 36 NA
287 CME GROUP INC SECURITIES BROKERAGE & SERVICES 0.0 102.68 30 NA 1,146 DAISHIN SECURITIES CO KSWN5000 SECURITIES BROKERAGE & SERVICES 0.0 10.00 11 FK
262 E*TRADE FINANCIAL CORP SECURITIES BROKERAGE & SERVICES 0.0 28.09 7 NA 30,649 GMP CAPITAL INC SECURITIES BROKERAGE & SERVICES 0.1 6.35 195 NC
102 INTERCONTINENTAL EXCHANGE INC SECURITIES BROKERAGE & SERVICES 0.0 253.99 26 NA 107 NASDAQ OMX GROUP INC/THE SECURITIES BROKERAGE & SERVICES 0.0 55.55 6 NA
UTILITIES 5.0596 AES CORP/THE UTILITIES: ELECTRICAL 0.0 15.95 9 NA 220 AMEREN CORP UTILITIES: ELECTRICAL 0.0 53.43 12 NA
Page 31 of 34 Source: The Bank of New York Mellon Corporation1/13/2015 1:01:20 PM EST
UGYG30000000 - Univ of Guelph Endow Fund
TOTAL EQUITY HOLDINGS Report ID:Reporting Currency: CAD
IEQS0002
12/31/2014
Review
the Investment
Profile of the U
niversity's P
age 43 of 85

Shares Description Industry % ofEquity
Price MarketValue(000)
Russell Sector Scheme CAD
CAD
CntryCode
UTILITIES 5.0444 AMERICAN ELECTRIC POWER CO INC UTILITIES: ELECTRICAL 0.0 70.33 31 NA
9,980 ATCO LTD UTILITIES: ELECTRICAL 0.2 47.66 476 NC 709 CENTRAIS ELETRICAS SANTA UTILITIES: ELECTRICAL 0.0 6.49 5 LB
4,500 CESP-CIA ENERGETICA DE SAO PAU UTILITIES: ELECTRICAL 0.0 11.68 53 LB 3,760 CEZ CZK100 UTILITIES: ELECTRICAL 0.1 29.89 112 IC
83,732 CHINA POWER INTL HKD1 UTILITIES: ELECTRICAL 0.0 0.59 49 FH 6,995 CIA ENERGETICA DE MINAS GERAIS UTILITIES: ELECTRICAL 0.0 5.73 40 LB 6,925 CIA PARANAENSE DE ENERGIA UTILITIES: ELECTRICAL 0.0 15.64 108 LB
250 CMS ENERGY CORP UTILITIES: ELECTRICAL 0.0 40.25 10 NA 266 CONSOLIDATED EDISON INC UTILITIES: ELECTRICAL 0.0 76.46 20 NA
100,992 DATANG INTERNATIONAL POWER UTILITIES: ELECTRICAL 0.0 0.62 63 FC 530 DOMINION RESOURCES INC/VA UTILITIES: ELECTRICAL 0.0 89.07 47 NA 161 DTE ENERGY CO UTILITIES: ELECTRICAL 0.0 100.04 16 NA 642 DUKE ENERGY CORP NEW COM UTILITIES: ELECTRICAL 0.0 96.76 62 NA
5,000 E.ON SE NPV UTILITIES: ELECTRICAL 0.0 19.89 99 ED 7,500 EDF EUR0.5 UTILITIES: ELECTRICAL 0.1 31.99 240 EF
296 EDISON INTERNATIONAL UTILITIES: ELECTRICAL 0.0 75.84 22 NA 6,200 EL PASO ELECTRIC CO UTILITIES: ELECTRICAL 0.1 46.40 288 NA
50,700 ENEL EUR1 UTILITIES: ELECTRICAL 0.1 5.18 263 EI 164 ENTERGY CORP UTILITIES: ELECTRICAL 0.0 101.32 17 NA 780 EXELON CORP UTILITIES: ELECTRICAL 0.0 42.95 34 NA 382 FIRSTENERGY CORP UTILITIES: ELECTRICAL 0.0 45.16 17 NA
13,700 GREAT PLAINS ENERGY INC UTILITIES: ELECTRICAL 0.2 32.91 451 NA 72,568 HUANENG POWER INTL INC H SHS UTILITIES: ELECTRICAL 0.1 1.57 114 FC 14,747 HUB POWER CO PKRP10 UTILITIES: ELECTRICAL 0.0 0.90 13 FQ
4,881 LIGHT S A COM NPA UTILITIES: ELECTRICAL 0.0 7.42 36 LB 396 NEXTERA ENERGY INC UTILITIES: ELECTRICAL 0.0 123.11 49 NA 288 NORTHEAST UTILITIES UTILITIES: ELECTRICAL 0.0 61.99 18 NA 307 NRG ENERGY INC UTILITIES: ELECTRICAL 0.0 31.21 10 NA 229 PEPCO HOLDINGS INC UTILITIES: ELECTRICAL 0.0 31.19 7 NA 431 PG&E CORP UTILITIES: ELECTRICAL 0.0 61.67 27 NA
11,425 PG&E CORP UTILITIES: ELECTRICAL 0.3 61.67 705 NA 9,550 PINNACLE WEST CAPITAL CORP UTILITIES: ELECTRICAL 0.3 79.12 756 NA
100 PINNACLE WEST CAPITAL CORP UTILITIES: ELECTRICAL 0.0 79.12 8 NA 15,368 POLSKA GRUPA ENERGETYCZNA SA UTILITIES: ELECTRICAL 0.0 6.16 95 EG
604 PPL CORP UTILITIES: ELECTRICAL 0.0 42.08 25 NA 1,722 PUBLIC POWER CORP EUR4.60 (CR) UTILITIES: ELECTRICAL 0.0 7.57 13 EH
459 PUBLIC SERVICE ENTERPRISE GROU UTILITIES: ELECTRICAL 0.0 47.96 22 NA 129 SCANA CORP UTILITIES: ELECTRICAL 0.0 69.96 9 NA 817 SOUTHERN CO UTILITIES: ELECTRICAL 0.0 56.88 46 NA
Page 32 of 34 Source: The Bank of New York Mellon Corporation1/13/2015 1:01:20 PM EST
UGYG30000000 - Univ of Guelph Endow Fund
TOTAL EQUITY HOLDINGS Report ID:Reporting Currency: CAD
IEQS0002
12/31/2014
Review
the Investment
Profile of the U
niversity's P
age 44 of 85

Shares Description Industry % ofEquity
Price MarketValue(000)
Russell Sector Scheme CAD
CAD
CntryCode
UTILITIES 5.010,468 TAURON POLSKA ENERGIA SA UTILITIES: ELECTRICAL 0.0 1.65 17 EG
213 TECO ENERGY INC UTILITIES: ELECTRICAL 0.0 23.73 5 NA 19,321 TENAGA NASIONAL BHD MY$1-MSE UTILITIES: ELECTRICAL 0.0 4.57 88 FN
205 WISCONSIN ENERGY CORP UTILITIES: ELECTRICAL 0.0 61.09 13 NA 459 XCEL ENERGY INC UTILITIES: ELECTRICAL 0.0 41.60 19 NA 109 AGL RESOURCES INC UTILITIES: GAS DISTRIBUTORS 0.0 63.14 7 NA
6,108 AYGAZ TRY1 UTILITIES: GAS DISTRIBUTORS 0.0 4.87 30 ET 390 CENTERPOINT ENERGY INC UTILITIES: GAS DISTRIBUTORS 0.0 27.14 11 NA
32,000 CENTRICA ORD GBP0.061728395 UTILITIES: GAS DISTRIBUTORS 0.1 5.04 161 EX 1,950 ENERGEN CORP UTILITIES: GAS DISTRIBUTORS 0.1 73.85 144 NA 6,580 GAIL INDIA LTD UTILITIES: GAS DISTRIBUTORS 0.0 8.16 54 FI
287 NISOURCE INC UTILITIES: GAS DISTRIBUTORS 0.0 49.13 14 NA 210 SEMPRA ENERGY UTILITIES: GAS DISTRIBUTORS 0.0 128.98 27 NA
5,700 UGI CORP UTILITIES: GAS DISTRIBUTORS 0.1 43.99 251 NA 6,000 VECTREN CORP UTILITIES: GAS DISTRIBUTORS 0.1 53.55 321 NA
73 INTEGRYS ENERGY GROUP INC UTILITIES: MISCELLANEOUS 0.0 90.17 7 NA 344,355 AMERICA MOVIL SAB DE CV SER UTILITIES: TELECOMMUNICATIONS 0.2 1.29 444 LM
4,709 AT&T INC UTILITIES: TELECOMMUNICATIONS 0.1 38.91 183 NA 28,900 BT GROUP ORD GBP0.05 UTILITIES: TELECOMMUNICATIONS 0.1 7.25 210 EX
518 CENTURYLINK INC UTILITIES: TELECOMMUNICATIONS 0.0 45.84 24 NA 123,139 CHINA COMMUNICATIONS SERVICES UTILITIES: TELECOMMUNICATIONS 0.0 0.54 67 FC
20,272 CHINA MOBILE LTD UTILITIES: TELECOMMUNICATIONS 0.1 13.52 274 FH 7,560 CHORUS LTD UTILITIES: TELECOMMUNICATIONS 0.0 2.41 18 AN 7,828 ENTEL TELECOMUNICATION UTILITIES: TELECOMMUNICATIONS 0.0 11.64 91 LC 6,200 FREENET AG AG NPV(BR) UTILITIES: TELECOMMUNICATIONS 0.1 33.21 206 ED
910 FRONTIER COMMUNICATIONS CORP UTILITIES: TELECOMMUNICATIONS 0.0 7.73 7 NA 3,400 KDDI CORP Y5000 UTILITIES: TELECOMMUNICATIONS 0.1 73.78 251 FJ
253 LEVEL 3 COMMUNICATIONS INC UTILITIES: TELECOMMUNICATIONS 0.0 57.19 14 NA 4,798 MOBILE TELESYSTEMS OJSC UTILITIES: TELECOMMUNICATIONS 0.0 8.32 40 IR
10,962 MTN GROUP LTD ZAR 0.0001 UTILITIES: TELECOMMUNICATIONS 0.1 22.17 243 KS 5,400 NIPPON TEL & TEL CORP Y50000 UTILITIES: TELECOMMUNICATIONS 0.1 60.00 324 FJ
12,000 NTT DOCOMO INC UTILITIES: TELECOMMUNICATIONS 0.1 17.08 205 FJ 15,900 ROGERS COMMUNICATIONS INC UTILITIES: TELECOMMUNICATIONS 0.3 45.17 718 NC
3,774 SISTEMA JSFC GDR REPR 1/50 UTILITIES: TELECOMMUNICATIONS 0.0 6.03 23 IR 833 SK TELECOM KRW500 UTILITIES: TELECOMMUNICATIONS 0.1 282.41 235 FK
8,513 TELECOM EGYPT EGP10 UTILITIES: TELECOMMUNICATIONS 0.0 1.93 16 KE 4,338 TELEFONICA BRASIL SA UTILITIES: TELECOMMUNICATIONS 0.0 20.41 89 LB 6,800 TELEFONICA SA EUR1 UTILITIES: TELECOMMUNICATIONS 0.1 16.71 114 EE
35,900 TELIASONERA AB NPV UTILITIES: TELECOMMUNICATIONS 0.1 7.46 268 SS 14,232 TELKOM SA SOC LTD ZAR10 UTILITIES: TELECOMMUNICATIONS 0.0 7.01 100 KS
Page 33 of 34 Source: The Bank of New York Mellon Corporation1/13/2015 1:01:20 PM EST
UGYG30000000 - Univ of Guelph Endow Fund
TOTAL EQUITY HOLDINGS Report ID:Reporting Currency: CAD
IEQS0002
12/31/2014
Review
the Investment
Profile of the U
niversity's P
age 45 of 85

Shares Description Industry % ofEquity
Price MarketValue(000)
Russell Sector Scheme CAD
CAD
CntryCode
UTILITIES 5.015,268 TELUS CORP UTILITIES: TELECOMMUNICATIONS 0.3 41.89 640 NC 12,960 TURK TELEKOMUNIKASYON AS UTILITIES: TELECOMMUNICATIONS 0.0 3.60 47 ET
3,767 VERIZON COMMUNICATIONS INC UTILITIES: TELECOMMUNICATIONS 0.1 54.18 204 NA 9,004 VODACOM GROUP LIMITED ZAR0.01 UTILITIES: TELECOMMUNICATIONS 0.1 12.86 116 KS
547 WINDSTREAM HOLDINGS INC UTILITIES: TELECOMMUNICATIONS 0.0 9.54 5 NA 13,434 CIA SANEAMENTO BASICO DE SAO P UTILITIES: WATER 0.0 7.41 100 LB
2,766 CIA SANEAMENTO MINAS GERAIS UTILITIES: WATER 0.0 10.97 30 LB 62,789 MANILA WATER CO PHP1 UTILITIES: WATER 0.0 0.75 47 FP
OTHER 0.06,521 INTELLECT DESIGN A INR5 UNCLASSIFIED 0.0 1.51 10 FI
UNCLASSIFIED16,264 BOART LONGYEAR NPV SUB RIGHTS 0.0 0.00 AA 21,080 CENTRAL FUND CDA LTD 0.1 13.46 284 NC
Total Equities (CAD) $222,735,119
Page 34 of 34 Source: The Bank of New York Mellon Corporation1/13/2015 1:01:20 PM EST
UGYG30000000 - Univ of Guelph Endow Fund
TOTAL EQUITY HOLDINGS Report ID:Reporting Currency: CAD
IEQS0002
12/31/2014
Review
the Investment
Profile of the U
niversity's P
age 46 of 85

Financial Services Page 1 of 1 N.B.: This website changes frequently. Please refer to http://www.fin.uoguelph.ca/uploadFiles/F1220.pdf for the most recent version of this document.
Treasury Policy - FI 22.0 Endowment Investment Policy
Approved: Board of Governors Effective Date : June 5, 2014 Signature/Position: Assistant Vice-President, Finance and Integrated Planning TABLE OF CONTENTS 1. Purpose 2 2. Background 2 3. Governance 2 3.1 Oversight 2 Custodian 3 Investment Managers 3 4. Investment and Risk Management Framework 4 5. Policy Asset Mix and Ranges 5 6. Benchmark 5 7. Permitted Asset Classes 6 Currency Exposure 6 Liquidity 6 8. General Guidelines 6 Derivatives 6 Securities Lending 7 Voting Rights 7 Valuation of Investments 7 Performance Monitoring 8 9. Related Parties and Conflicts of Interest 8 Definition of Related Party 8 Related Party Transactions 8 Conflicts of Interest 9 10.Policy Review 9
Overview of Endowment Investment Policy [D.
Page 47 of 85

Financial Services Page 2 of 2 N.B.: This website changes frequently. Please refer to http://www.fin.uoguelph.ca/uploadFiles/F1220.pdf for the most recent version of this document.
1. Purpose This document constitutes the Investment Policy (the “Policy”) applicable to the assets in respect of the General Endowment Fund and the Heritage Fund (the “Endowment Funds”) of the University of Guelph (the “University”).
2. Background The primary objective of the University’s Endowment Funds is to provide a permanent source of funding by investing the principal amount of the gift and making a portion of the total investment return available for spending. In addition, the goal of the University of Guelph’s endowments is to preserve the purchasing power of the endowment account over the long-term. The realization of this objective is achieved in two ways: spending only a portion of total investment returns; and investing in asset classes (e.g., equities) that yield sufficient investment returns to provide inflation-protected spending. For the University’s General Endowment Fund, annual spending is limited to a portion of the total endowment asset value averaged over the most recent moving four-year period and, in the case of the Heritage Fund, annual spending is limited to a portion of the total real investment income averaged over a five-year period. The General Endowment Fund (GEF) consists of funds mainly from external, non-operating fund sources such as donations and government. The majority of these funds are designated for student aid in the form of scholarships and bursaries. Other designations include research support, endowed faculty chairs, equipment or library acquisitions and special academic activities such as support for visiting lecturers, student semester abroad programs and on-going support toward the operating costs of academic facilities. Spending from the GEF is governed by a Board of Governor’s approved policy that limits annual disbursements in order to preserve capital and the real spending capacity of these funds. The General Endowment Fund Management Policy is contained under separate cover. The Heritage Fund was created with the intention that the capital of the fund be held in perpetuity for University of Guelph strategic purposes. The main sources of growth for the Heritage Fund are proceeds of real estate sales, leases from designated properties and investment income earned on the capital of the fund. Spending is designated primarily for special projects of a limited duration. The primary objective of the Heritage Fund is to grow its capital in excess of inflation over time, in order to grow the amounts available for spending. A second objective is to generate investment return in the near-term which may be spent on approved projects. The Declaration of Trust for the Heritage Fund is contained under separate cover. The University’s Endowment Funds are managed as a single pool of investments in a number of different asset classes.
Overview of Endowment Investment Policy [D.
Page 48 of 85

Financial Services Page 3 of 3 N.B.: This website changes frequently. Please refer to http://www.fin.uoguelph.ca/uploadFiles/F1220.pdf for the most recent version of this document.
3. Governance 3.1 Oversight The University through its Board of Governors (the "Board") has ultimate responsibility for the Endowment Funds. The Board of Trustees of the Heritage Fund was established by the Board of Governors to oversee the investment and growth of the Heritage Fund. The Board has delegated responsibilities with respect to the Heritage Fund to the Board of Trustees which in turn has delegated investment responsibilities to its Investment Subcommittee (the “IS”), a subcommittee established by the Board of Governors. The Board, through its Finance Committee (Terms of Reference) has also delegated investment responsibilities to the IS in respect of the General Endowment Fund. The governing bodies (the “Governing Bodies”) for the Heritage Fund are therefore:
(a) The Board of Governors; (b) The Board of Trustees; and (c) The IS.
and for the General Endowment Fund:
(a) The Board of Governors; (b) The Finance Committee; and (c) The IS.
Terms of Reference for the IS are contained under separate cover; however, major responsibilities of the IS include: Review and recommend changes to the investment policies including asset allocation and allowable
investment classes; Appoint, review and replace, as necessary, investment managers; and Monitor and report on investment performance. In fulfilling its responsibilities, the IS is supported by employees of the University through the Office of the Vice-President Finance, Administration and Risk. In addition, the IS may rely on independent experts for certain aspects of the Endowment Fund’s operations where expert knowledge is required or where a perceived or actual conflict of interest exists. Custodian The custodian of the Endowment Funds (the “Custodian”) shall be a trust company duly registered in Canada. All investments and assets of the Endowment Funds shall be held by the Custodian. Investment Managers Assets of the Endowments Funds shall be managed by external investment managers (the “Managers”) as appointed by the IS. Each Manager shall invest the assets of the Endowment Funds, through the Custodian, in accordance with their Investment Manager Mandate and Performance Standards (the “Mandate”).
Overview of Endowment Investment Policy [D.
Page 49 of 85

Financial Services Page 4 of 4 N.B.: This website changes frequently. Please refer to http://www.fin.uoguelph.ca/uploadFiles/F1220.pdf for the most recent version of this document.
4. Investment and Risk Management Framework The following table summarizes the primary considerations that underlie the investment of the Endowment Funds.
Topic Assumptions
Asset Mix In managing investment risk, the Endowment Funds should be diversified across a broad range of financial assets. The risk and return characteristics of specific asset classes should be reviewed periodically to determine an appropriate asset allocation for each of the Endowment Funds and its impact on specific investment risk and return metrics (e.g., volatility of spending; likelihood of the Endowment Funds growing in excess of inflation).
Risk Premium In general, higher risk assets are expected to outperform assets with lower risk over long periods of time. Higher risk assets will be included in the policy allocation in a proportion sufficient to generate the desired rates of return, subject to total fund risk constraints.
Risk Diversification
It is recognized that risk and return are strongly related; and that the returns on the least risky asset classes will be lower than that of higher risk assets. Less volatile asset classes, such as fixed income, will be included in the portfolio for the purpose of reducing overall risk (volatility) of returns and stabilizing available spending.
Derivatives The use of derivative instruments should be limited to risk mitigation purposes (e.g., limiting currency exposures) and for efficient access to certain asset classes (e.g., index replication) and not for return enhancement. Therefore, hedge fund strategies which rely extensively on the use of derivatives to generate returns are excluded from policy allocation consideration.
Liquidity Less liquid assets are expected to carry a risk premium above more marketable securities to compensate for the lack of liquidity. Accordingly the Endowment Funds may be able to benefit from their long investment horizon by investing in instruments with lower liquidity.
Risk Control Investment activities require making effective decisions in the face of uncertainty. The IS recognizes that significant value comes from avoiding unproductive assets and other problem areas, and keeping permanent impairments to a minimum. An important way to control risk in this context is to hire high quality managers and assigning them mandates with guidelines that ensure risk is properly managed but avoid unnecessary constraints. Also, managers are monitored to reduce the risk of hiring and/or creating managers who charge “active” management fees, but generate returns similar to the index.
Active Management Style Bias
The IS has a value style bias and consequently the majority of its managers employ a value style approach to investing. Value investing takes on many forms, but generally means a process for selecting stocks which are trading for less than their intrinsic value. Value style strategies have proven over time to outperform all other styles of investing. The IS recognizes that having a preponderant weighting toward one style can, on occasion, introduce periods of underperformance on a total fund level. Members of the IS acknowledge that achieving superior performance in the long run may require a high tolerance for under-performance in the short run. The IS is therefore prepared to tolerate underperformance for a period of time if a manager’s style is out of favour or market conditions are not hospitable to a certain investment approach. The IS believes that passive investing or indexing is appropriate for certain asset classes and investment cycles.
Overview of Endowment Investment Policy [D.
Page 50 of 85

Financial Services Page 5 of 5 N.B.: This website changes frequently. Please refer to http://www.fin.uoguelph.ca/uploadFiles/F1220.pdf for the most recent version of this document.
5. Policy Asset Mix and Ranges The Target Asset Mix and Permitted Ranges for the Endowment Funds have been determined as set out in the following table. Allocations to Emerging Markets Equities and Infrastructure will be undertaken as suitable opportunities are identified. An “Interim Target Asset Mix” has been established to recognize that it will take a period of time to transition to the Final Target Asset Mix. The actual timeline to achieve the Final Target Asset Mix is subject to the availability of suitable products and the time it takes for Infrastructure commitments to become invested.
Component Asset Classes
Benchmark Index
Percentage of Fund at Market Values Interim Target
Asset Mix
Final Target
Asset Mix
Permitted Range
Min. Max.
Universe Bonds DEX Universe 30% 30% 10% 50%
Cash DEX 91 Day T-Bill 0% 0% 0% 20%
Total Fixed Income 30% 30% 20% 50%
Infrastructure To Be Determined 0% 7.5% 0% 10%
Canadian Equities S&P/TSX Composite 20% 17.5% 7.5% 27.5%
U.S. Equities S&P 500 ($Cdn) 25% 20% 10% 30%
International Equities
MSCI EAFE Net ($Cdn)
20% 20% 10% 30%
Emerging Markets Equities
MSCI EM ($Cdn) 5% 5% 0% 10%
Total Equities 70% 62.5% 50% 80%
An appropriate investment manager structure will be maintained to implement the Target Asset Mix within the corresponding asset class ranges. If the asset mix deviates outside the permitted ranges at the end of any quarter, the IS will rebalance to bring the asset mix back within the permitted ranges as soon as practical.
6. Benchmark The total fund benchmark is based on a blend of the individual underlying asset class indices in their proportions represented in the Target Asset Mix.
Overview of Endowment Investment Policy [D.
Page 51 of 85
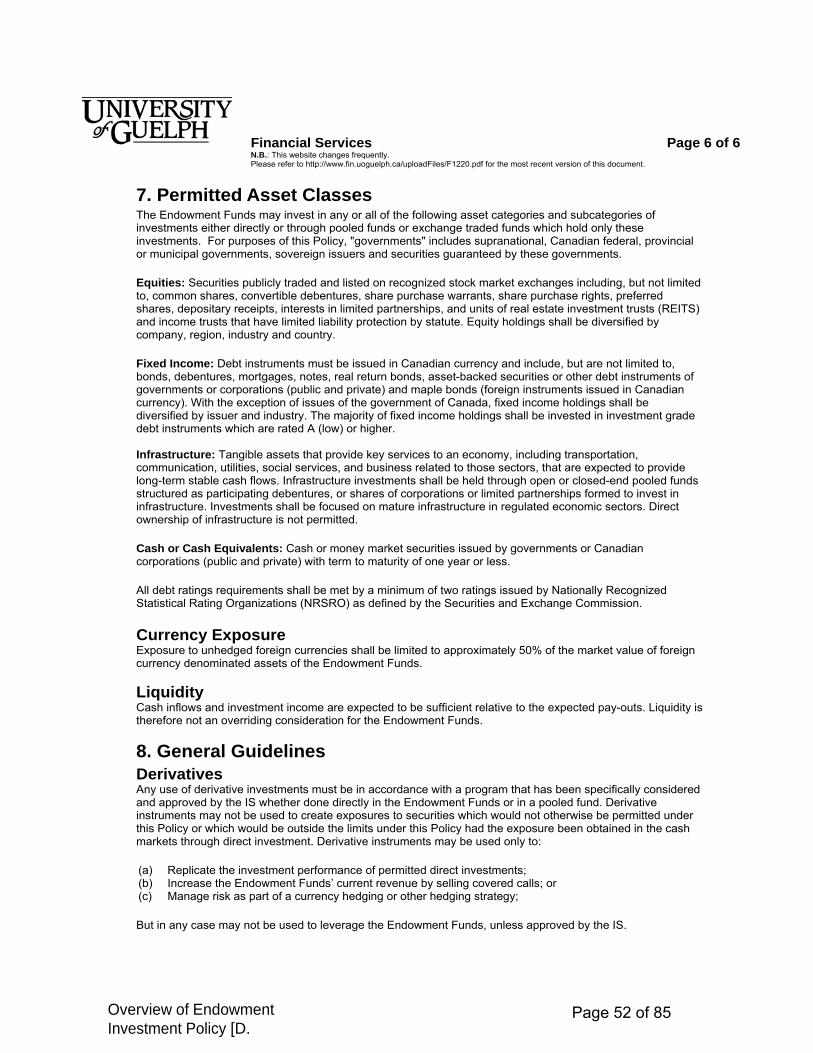
Financial Services Page 6 of 6 N.B.: This website changes frequently. Please refer to http://www.fin.uoguelph.ca/uploadFiles/F1220.pdf for the most recent version of this document.
7. Permitted Asset Classes The Endowment Funds may invest in any or all of the following asset categories and subcategories of investments either directly or through pooled funds or exchange traded funds which hold only these investments. For purposes of this Policy, "governments" includes supranational, Canadian federal, provincial or municipal governments, sovereign issuers and securities guaranteed by these governments.
Equities: Securities publicly traded and listed on recognized stock market exchanges including, but not limited to, common shares, convertible debentures, share purchase warrants, share purchase rights, preferred shares, depositary receipts, interests in limited partnerships, and units of real estate investment trusts (REITS) and income trusts that have limited liability protection by statute. Equity holdings shall be diversified by company, region, industry and country.
Fixed Income: Debt instruments must be issued in Canadian currency and include, but are not limited to, bonds, debentures, mortgages, notes, real return bonds, asset-backed securities or other debt instruments of governments or corporations (public and private) and maple bonds (foreign instruments issued in Canadian currency). With the exception of issues of the government of Canada, fixed income holdings shall be diversified by issuer and industry. The majority of fixed income holdings shall be invested in investment grade debt instruments which are rated A (low) or higher. Infrastructure: Tangible assets that provide key services to an economy, including transportation, communication, utilities, social services, and business related to those sectors, that are expected to provide long-term stable cash flows. Infrastructure investments shall be held through open or closed-end pooled funds structured as participating debentures, or shares of corporations or limited partnerships formed to invest in infrastructure. Investments shall be focused on mature infrastructure in regulated economic sectors. Direct ownership of infrastructure is not permitted.
Cash or Cash Equivalents: Cash or money market securities issued by governments or Canadian corporations (public and private) with term to maturity of one year or less.
All debt ratings requirements shall be met by a minimum of two ratings issued by Nationally Recognized Statistical Rating Organizations (NRSRO) as defined by the Securities and Exchange Commission.
Currency Exposure Exposure to unhedged foreign currencies shall be limited to approximately 50% of the market value of foreign currency denominated assets of the Endowment Funds.
Liquidity Cash inflows and investment income are expected to be sufficient relative to the expected pay-outs. Liquidity is therefore not an overriding consideration for the Endowment Funds.
8. General Guidelines Derivatives Any use of derivative investments must be in accordance with a program that has been specifically considered and approved by the IS whether done directly in the Endowment Funds or in a pooled fund. Derivative instruments may not be used to create exposures to securities which would not otherwise be permitted under this Policy or which would be outside the limits under this Policy had the exposure been obtained in the cash markets through direct investment. Derivative instruments may be used only to:
(a) Replicate the investment performance of permitted direct investments; (b) Increase the Endowment Funds’ current revenue by selling covered calls; or (c) Manage risk as part of a currency hedging or other hedging strategy;
But in any case may not be used to leverage the Endowment Funds, unless approved by the IS.
Overview of Endowment Investment Policy [D.
Page 52 of 85

Financial Services Page 7 of 7 N.B.: This website changes frequently. Please refer to http://www.fin.uoguelph.ca/uploadFiles/F1220.pdf for the most recent version of this document.
Securities Lending
a) Permitted Circumstances: The IS may lend securities of the Fund as a means of generating incremental income or cash for investment or otherwise supporting an investment strategy. Such loans shall be in writing. When the IS lends securities of the Fund, the document shall provide for the IS’s right to recall the loaned securities.
b) Use of Agents : Management may delegate, through the University’s custodial trustee, to a lending
agent the authority to select borrowers, negotiate terms and rates and invest cash or securities collateral under written procedures which specify securities available for loan, pre-approved borrowers, loan terms, and instruments for the investment of collateral as well as administrative, risk management and reporting arrangements.
c) Collateral and Margin Requirements: When the IS lends securities of the Fund as a means of generating incremental income or cash for investment, the following rules shall apply. The IS or its lending agent shall receive from the borrower collateral equal to no less than 105% of the market value of the securities loaned at the time of the transaction. The amount of collateral margin taken shall reflect best practices in local markets. Both loaned and collateral securities must be marked to market daily to account for increases in the market value of the securities loaned or decreases in the market value of the collateral. Shortfalls in the amount of collateral must be rectified by the following business day unless otherwise agreed to in writing. The collateral obtained to secure a loan of securities or any securities purchased with such collateral must be either cash or high quality, readily marketable securities acceptable as a direct investment under the IS’s investment policies. Title to all collateral must be clear.
Voting Rights The responsibility of exercising and directing voting rights acquired through the Endowment Fund’s investments shall normally be delegated to the Manager, who shall at all times act prudently and in the best interests of the Endowment Funds. The Manager shall provide the IS with its proxy voting guidelines and notify the IS of any changes to these guidelines. The Manager shall maintain a record of how the Endowment Funds’ voting rights have been exercised and provide the IS with quarterly proxy voting results. In case of doubt as to the best interests, the Manager shall request instructions from the IS regarding the best interests of the Endowment Funds and shall act in accordance with such instructions. The IS reserves the right to direct, or override, the voting decisions of a Manager, if in its view such action is in the best interests of the Endowment Funds, except for investments held in a pooled fund. It is recognized, however, that the above constraints and policy on voting rights may not be enforceable to the extent that part of the Endowment Funds are invested in pooled funds. Valuation of Investments Investment in publicly traded securities shall be valued by the Custodian for the Endowment Funds no less frequently than monthly at their market value. Investment in pooled funds comprising publicly traded securities shall be valued according to the unit values calculated at least monthly by the Custodian of the pooled funds. The Custodian shall be responsible for requesting and recording the unit values on a monthly basis. Where a security or asset is publicly traded but not frequently, the Custodian will determine the appropriate market value of the particular security or asset and, in the event of a conflict, the value that the Custodian has determined will be deemed as correct.
Overview of Endowment Investment Policy [D.
Page 53 of 85
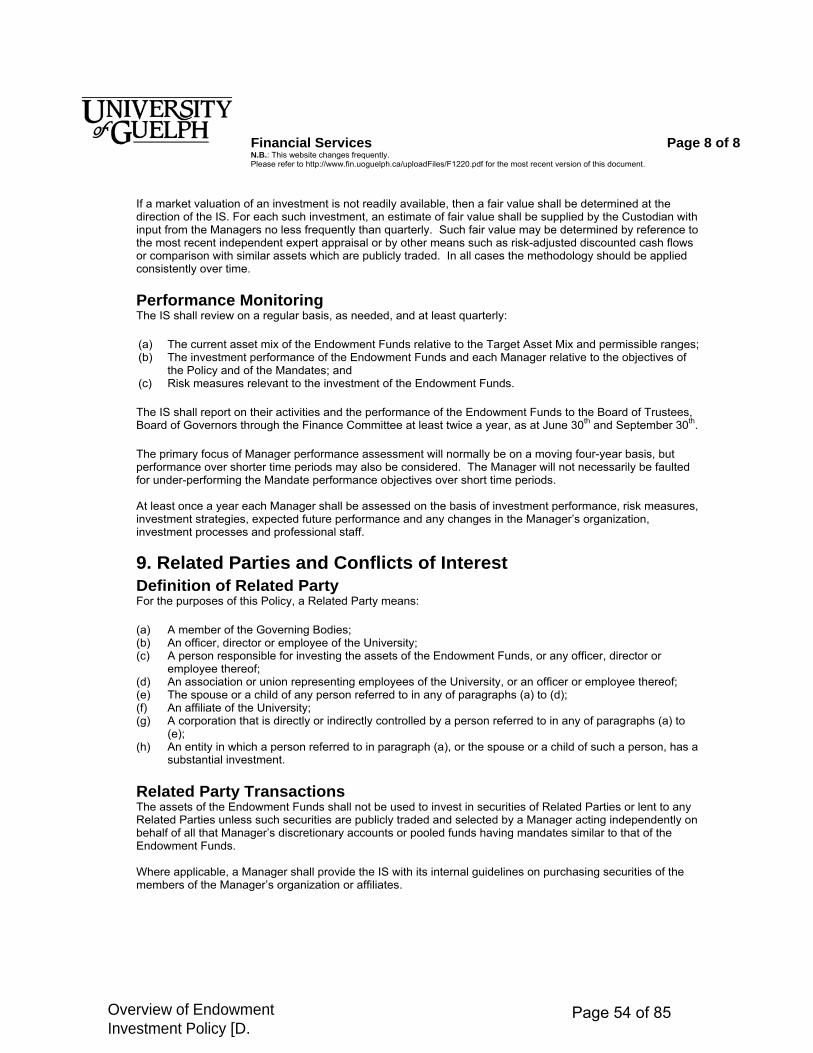
Financial Services Page 8 of 8 N.B.: This website changes frequently. Please refer to http://www.fin.uoguelph.ca/uploadFiles/F1220.pdf for the most recent version of this document.
If a market valuation of an investment is not readily available, then a fair value shall be determined at the direction of the IS. For each such investment, an estimate of fair value shall be supplied by the Custodian with input from the Managers no less frequently than quarterly. Such fair value may be determined by reference to the most recent independent expert appraisal or by other means such as risk-adjusted discounted cash flows or comparison with similar assets which are publicly traded. In all cases the methodology should be applied consistently over time. Performance Monitoring The IS shall review on a regular basis, as needed, and at least quarterly:
(a) The current asset mix of the Endowment Funds relative to the Target Asset Mix and permissible ranges; (b) The investment performance of the Endowment Funds and each Manager relative to the objectives of
the Policy and of the Mandates; and (c) Risk measures relevant to the investment of the Endowment Funds.
The IS shall report on their activities and the performance of the Endowment Funds to the Board of Trustees, Board of Governors through the Finance Committee at least twice a year, as at June 30th and September 30th.
The primary focus of Manager performance assessment will normally be on a moving four-year basis, but performance over shorter time periods may also be considered. The Manager will not necessarily be faulted for under-performing the Mandate performance objectives over short time periods. At least once a year each Manager shall be assessed on the basis of investment performance, risk measures, investment strategies, expected future performance and any changes in the Manager’s organization, investment processes and professional staff.
9. Related Parties and Conflicts of Interest Definition of Related Party For the purposes of this Policy, a Related Party means:
(a) A member of the Governing Bodies; (b) An officer, director or employee of the University; (c) A person responsible for investing the assets of the Endowment Funds, or any officer, director or
employee thereof; (d) An association or union representing employees of the University, or an officer or employee thereof; (e) The spouse or a child of any person referred to in any of paragraphs (a) to (d); (f) An affiliate of the University; (g) A corporation that is directly or indirectly controlled by a person referred to in any of paragraphs (a) to
(e); (h) An entity in which a person referred to in paragraph (a), or the spouse or a child of such a person, has a
substantial investment.
Related Party Transactions The assets of the Endowment Funds shall not be used to invest in securities of Related Parties or lent to any Related Parties unless such securities are publicly traded and selected by a Manager acting independently on behalf of all that Manager’s discretionary accounts or pooled funds having mandates similar to that of the Endowment Funds. Where applicable, a Manager shall provide the IS with its internal guidelines on purchasing securities of the members of the Manager’s organization or affiliates.
Overview of Endowment Investment Policy [D.
Page 54 of 85
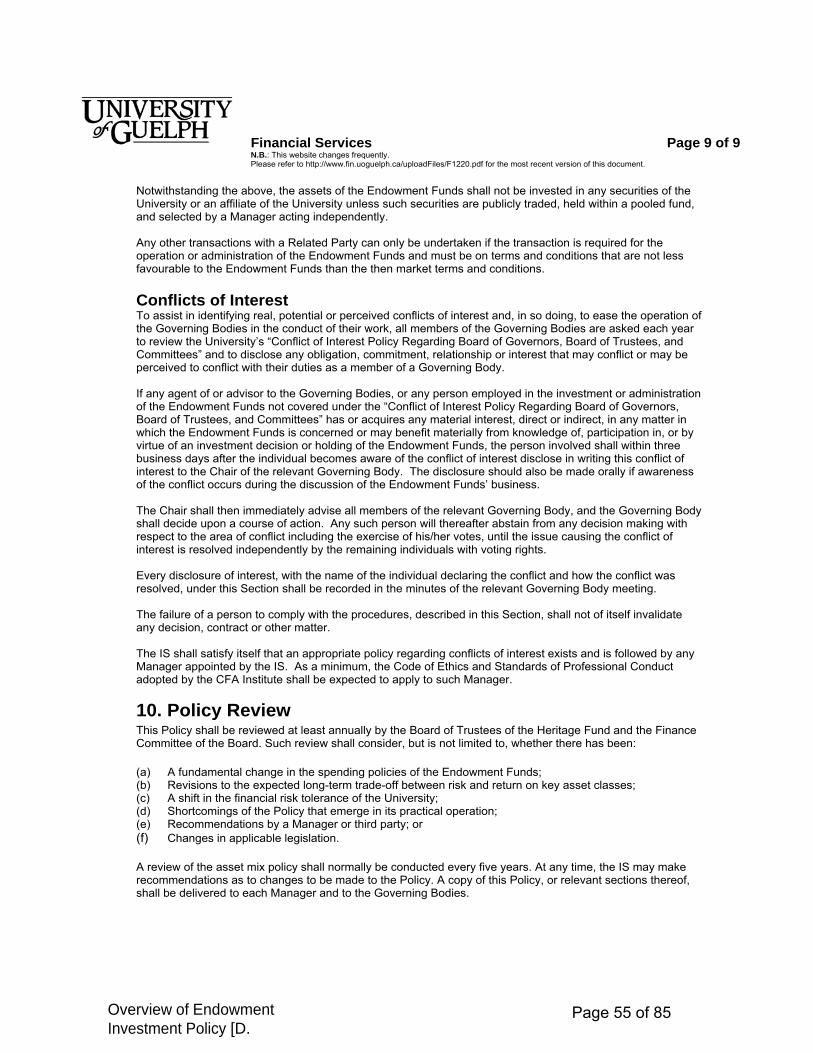
Financial Services Page 9 of 9 N.B.: This website changes frequently. Please refer to http://www.fin.uoguelph.ca/uploadFiles/F1220.pdf for the most recent version of this document.
Notwithstanding the above, the assets of the Endowment Funds shall not be invested in any securities of the University or an affiliate of the University unless such securities are publicly traded, held within a pooled fund, and selected by a Manager acting independently. Any other transactions with a Related Party can only be undertaken if the transaction is required for the operation or administration of the Endowment Funds and must be on terms and conditions that are not less favourable to the Endowment Funds than the then market terms and conditions. Conflicts of Interest To assist in identifying real, potential or perceived conflicts of interest and, in so doing, to ease the operation of the Governing Bodies in the conduct of their work, all members of the Governing Bodies are asked each year to review the University’s “Conflict of Interest Policy Regarding Board of Governors, Board of Trustees, and Committees” and to disclose any obligation, commitment, relationship or interest that may conflict or may be perceived to conflict with their duties as a member of a Governing Body. If any agent of or advisor to the Governing Bodies, or any person employed in the investment or administration of the Endowment Funds not covered under the “Conflict of Interest Policy Regarding Board of Governors, Board of Trustees, and Committees” has or acquires any material interest, direct or indirect, in any matter in which the Endowment Funds is concerned or may benefit materially from knowledge of, participation in, or by virtue of an investment decision or holding of the Endowment Funds, the person involved shall within three business days after the individual becomes aware of the conflict of interest disclose in writing this conflict of interest to the Chair of the relevant Governing Body. The disclosure should also be made orally if awareness of the conflict occurs during the discussion of the Endowment Funds’ business. The Chair shall then immediately advise all members of the relevant Governing Body, and the Governing Body shall decide upon a course of action. Any such person will thereafter abstain from any decision making with respect to the area of conflict including the exercise of his/her votes, until the issue causing the conflict of interest is resolved independently by the remaining individuals with voting rights. Every disclosure of interest, with the name of the individual declaring the conflict and how the conflict was resolved, under this Section shall be recorded in the minutes of the relevant Governing Body meeting. The failure of a person to comply with the procedures, described in this Section, shall not of itself invalidate any decision, contract or other matter. The IS shall satisfy itself that an appropriate policy regarding conflicts of interest exists and is followed by any Manager appointed by the IS. As a minimum, the Code of Ethics and Standards of Professional Conduct adopted by the CFA Institute shall be expected to apply to such Manager.
10. Policy Review This Policy shall be reviewed at least annually by the Board of Trustees of the Heritage Fund and the Finance Committee of the Board. Such review shall consider, but is not limited to, whether there has been:
(a) A fundamental change in the spending policies of the Endowment Funds; (b) Revisions to the expected long-term trade-off between risk and return on key asset classes; (c) A shift in the financial risk tolerance of the University; (d) Shortcomings of the Policy that emerge in its practical operation; (e) Recommendations by a Manager or third party; or (f) Changes in applicable legislation.
A review of the asset mix policy shall normally be conducted every five years. At any time, the IS may make recommendations as to changes to be made to the Policy. A copy of this Policy, or relevant sections thereof, shall be delivered to each Manager and to the Governing Bodies.
Overview of Endowment Investment Policy [D.
Page 55 of 85

Page 56 of 85

UNIVERSITYSECRETARIAT To: Members, Working Group on Responsible Investing From: Vicki Hodgkinson, University Secretary Subject: 5. Examples of Responsible Investing Policies at other Canadian
Universities
Meeting: Tuesday, January 27, 2015 Enclosed for review and reference by the Working Group is “Endowment Evolution: Benchmarking Responsible Investment at Canadian University Endowment Funds” a report of the Coalition of Universities for Responsible Investing. (See above link for background on the Coalition.) This report overviews responsible investing in the Canadian university sector as of 2013. Among the policies highlighted in the report is that of Queen’s University. The Queen’s policy on responsible investing is also enclosed for reference. N:\BOG\BOG Standing Commitees & Sub-Committees\Finance Committee\Ad Hoc Working Group on Responsible Investing\Meeting Packages\January 27 2015\Cover Memo\item 5_Policies.docx
Examples of Responsible Investing Policies at other
Page 57 of 85

Page 58 of 85

Endowment Evolution: Benchmarking Responsible Investment at Canadian University Endowment Funds
Coalition of Universities for Responsible Investing
Examples of Responsible Investing Policies at other
Page 59 of 85

Page 1 of 22
Endowment Evolution: Benchmarking Responsible Investment at Canadian University Endowment Funds About CURI CURI is a connective platform for students, faculty, administrators and industry professionals interested in advancing responsible investment at Canadian universities. CURI’s guiding vision is a future where the investment decisions taken by universities contribute to the long-‐term sustainability of communities, the environment and the economy. We work collaboratively to increase the awareness and integration of social, environmental and governance issues as part of a responsible approach to investing by universities in Canada. Towards this mission, we coordinate research projects, web-‐based forums, conferences and networking opportunities. Read our strategic plan, meet our team and learn more about our projects at curi.ca Acknowledgements The following people generously contributed their expertise to the project, though any omissions or errors are our own:
• Amr Addas, Professor – John Molson School of Business at Concordia University • Ben Richardson, Professor – Canada Research Chair in Environmental Law & Sustainability, Faculty of Law
at Allard Hall at the University of British Columbia (UBC) • Dan Apfel, Executive Director – Responsible Endowments Coalition (REC) • Hilary Martin, Research and Outreach Coordinator – Canadian Business Ethics Research Network (CBERN) • Ian Bragg, Associate Director – Research, Policy & Institutional Services, Social Investment Organisation
(SIO) • Matt Hammer, Graduate student – University of Victoria • Omar Dominguez, CURI Advisory Board Chair and ESG Analyst – NEI Investments • Peter Chapman, Executive Director – Shareholder Association for Research and Education (SHARE) • Tessa Hebb, Director – Carleton Centre for Community Innovation at Carleton University (3Ci)
Financial support for two research assistants assigned to the project was gratefully received from the Canadian Business Ethics Research Network (CBERN) and a Social Sciences and Humanities Research Council (SSHRC) grant awarded to Ben Richardson, Canada Research Chair in Environmental Law & Sustainability at UBC. Project team Lead researchers:
• Priya Bala-‐Miller, PhD student – University of British Columbia & Director (International Program) – Shareholder Association for Research and Education
• Heather Hachigian, PhD student – University of Oxford, School of Geography and the Environment Research assistants:
• Jason Tockman, PhD candidate – University of British Columbia • Malvika Pendharkar, MBA student – York University
Editing and communications outreach:
• Stefanie Freel, MA Student – University of Toronto • Mavis Chan, Undergraduate student – University of Waterloo
© Coalition of Universities for Responsible Investment, June 2013
Examples of Responsible Investing Policies at other
Page 60 of 85

Page 2 of 22
Endowment Evolution: Benchmarking Responsible Investment at Canadian University Endowment Funds
Contents
1.0 Introduction 3
1.1 Project overview
1.2 An overview of responsible investment
1.3 The global context for responsible investment
1.4 Drivers for responsible investment at universities
2.0 Headline Findings 11
2.1 Sustainability snapshot
2.2 Fund overview
2.3 Responsible investment policies and practices
3.0 Challenges, Opportunities and Action Points 18
3.1 Fear of the unknown
3.2 Beware the sustainability smokescreen
3.3 Universities are a ‘different’ kind of investor
3.4 High management fees
3.5 Polarizing dynamics
Appendix Methodology 21
Examples of Responsible Investing Policies at other
Page 61 of 85
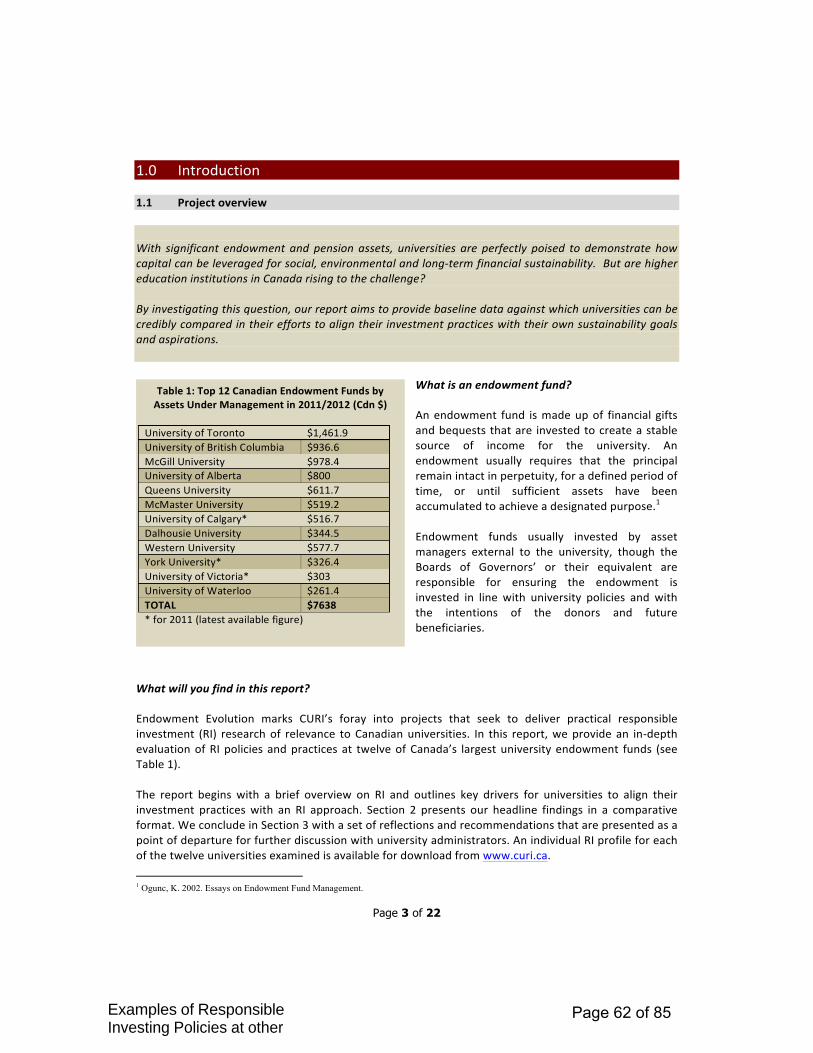
Page 3 of 22
1.0 Introduction 1.1 Project overview With significant endowment and pension assets, universities are perfectly poised to demonstrate how capital can be leveraged for social, environmental and long-‐term financial sustainability. But are higher education institutions in Canada rising to the challenge? By investigating this question, our report aims to provide baseline data against which universities can be credibly compared in their efforts to align their investment practices with their own sustainability goals and aspirations.
What is an endowment fund? An endowment fund is made up of financial gifts and bequests that are invested to create a stable source of income for the university. An endowment usually requires that the principal remain intact in perpetuity, for a defined period of time, or until sufficient assets have been accumulated to achieve a designated purpose.1 Endowment funds usually invested by asset managers external to the university, though the Boards of Governors’ or their equivalent are responsible for ensuring the endowment is invested in line with university policies and with the intentions of the donors and future beneficiaries.
What will you find in this report? Endowment Evolution marks CURI’s foray into projects that seek to deliver practical responsible investment (RI) research of relevance to Canadian universities. In this report, we provide an in-‐depth evaluation of RI policies and practices at twelve of Canada’s largest university endowment funds (see Table 1). The report begins with a brief overview on RI and outlines key drivers for universities to align their investment practices with an RI approach. Section 2 presents our headline findings in a comparative format. We conclude in Section 3 with a set of reflections and recommendations that are presented as a point of departure for further discussion with university administrators. An individual RI profile for each of the twelve universities examined is available for download from www.curi.ca.
1 Ogunc, K. 2002. Essays on Endowment Fund Management.
Table 1: Top 12 Canadian Endowment Funds by Assets Under Management in 2011/2012 (Cdn $)
University of Toronto $1,461.9 University of British Columbia $936.6 McGill University $978.4 University of Alberta $800 Queens University $611.7 McMaster University $519.2 University of Calgary* $516.7 Dalhousie University $344.5 Western University $577.7 York University* $326.4 University of Victoria* $303 University of Waterloo $261.4 TOTAL $7638 * for 2011 (latest available figure)
Examples of Responsible Investing Policies at other
Page 62 of 85

Page 4 of 22
Why is this report needed? Canadian universities have made great strides to integrate sustainability in their operations, management systems, research programs and curriculum in recent years. Yet research conducted by the Sustainable Endowments Institute (SEI) in its annual review of sustainability at universities suggests there is also scope for improvement.2 To continue to make progress on implementing their commitments to sustainability, universities need detailed information on the progress of their peers and in-‐depth analysis that contributes to the development of best practices. However, as of 2011, SEI suspended its survey and evaluation to focus its resources on facilitating university large-‐scale investment in energy efficiency. This means the Canadian universities are no longer being asked to benchmark their progress against a consistent set of sustainability indicators. The SEI has worked with the AASHE to consolidate its survey questionnaire into a self-‐reporting system that seeks to evaluate universities across a much broader range of indicators. In 2013, 32 Canadian colleges and universities were listed as participants and/or members of the Sustainability Tracking and Ratings System (STARS). That said, only 12 Canadian universities have been rated by STARS.3 While this new ratings system is commendable for its comprehensive coverage and streamlined approach to data collection, the broader scope has diluted the evaluation of university investment practices in particular. STARS evaluates the integration of sustainability into investment under its planning and engagement category (one of four categories). The total points allocated to investment in this category are 16.75 out of 100. As such, the endowment investment component reflects only 3 of 71 Tier 1 indicators in the aggregated ranking system (STARS 1.1).4 A few limitations can be observed in this regard:
• Universities can achieve the highest (Platinum) rating, while receiving a very low score in the investment section.
• Details related to fund governance, investment beliefs, impetus for integrating sustainability into investments and RI policies (or lack thereof) are not included in the data collector.
• Since the rating system relies on self-‐reporting as its primary means of data collection, there is inconsistency across the level of detail provided by the universities and the terminology used.
• The majority of universities rated by STARS are located in the United States. While there are many similarities between Canadian and American institutions, differences in the size of their endowments and institutional form may warrant different levels of sustainability integration.
For the above reasons, CURI has undertaken to provide a comprehensive survey that focuses on investment practices of Canadian university endowment funds and their efforts to integrate sustainability. The study provides a resource for benchmarking universities against their Canadian peers and in the future, against themselves. Acknowledging a debt to the ground-‐breaking efforts of the SEI and STARS surveys, the CURI benchmarking study seeks to broaden and deepen the evaluative scope of
2 Average rating of STARS universities: 57%. Average score of Canadian institutions on GRC:B/B+ 3 Rated STARS institutions between 2011 and 2013 (institutions are not annually rated): University of Ottawa, Western University, Concordia, Dalhousie, UBC, McGill, SFU, University of Alberta, University of Calgary, UNBC, University of Saskatchewan, Wilfred Laurier Members, but Non-rated: University of Manitoba, University of Laval, University of Victoria and University of Windsor. 4 This is not intended as a critique of the weightings assigned by AASHE to investment or any other categories, but to highlight that investments is only one of several component of the overall sustainability agenda but nonetheless, one which we wish to draw attention to in our report.
Examples of Responsible Investing Policies at other
Page 63 of 85

Page 5 of 22
the RI at Canadian universities. How did we develop the report? This pilot project was developed with the input of university faculty, administrators, students and RI professionals. CURI expects that the benchmarking evaluation developed through this project could be replicated at regular intervals and that future iterations will provide an opportunity to refine the methodology and evaluative criteria used. A detailed note on the methodology employed for the study is included in Appendix 1, whereas a summary is provided in Figure 1 below:
Figure 1: Project Methodology
Project scope and limitations In order to keep this pilot project within a manageable scope, CURI chose to focus on endowment funds only. In addition, the inclusion of these funds in existing studies enabled us to quickly identify gaps in knowledge and practice. We focused on the 12 largest endowment funds because we expected this is where we would find the most innovation in investment practices. Larger funds tend to be subject to greater public scrutiny. They also have more resources to innovate and implement an RI approach. The selected funds have assets under management that range from $1.6 billion to $216 million, and represent a geographically diverse sample (provinces of BC, Alberta, Ontario, Quebec and Nova Scotia are included).
Survey Tool
• With the input of key experts, a survey queskonnaire covering three aspects was developed – fund overview, sustainability snapshot and RI review.
Data colleckon
• The queskonnaire was completed for each university by CURI’s project team. Through desk research, data was collected from publicly available informakon in annual financial statements, annual endowment reports, governance documents available on university websites and external websites to verify membership and rakngs reported on the university website and media sources.
Data compilakon
• The surveys were used to generate a sustainability and RI profile for each university.
Data verificakon
• Once the profiles were completed, they were sent to university administrators to verify their accuracy. Administrators also had the opportunity to provide updated informakon that may not be available on their websites and/or correct any misinformakon. Administrators were asked to provide evidence to support any changes to their profiles. • Six of the twelve universikes in this report provided wrimen feedback about their profile. A further two universikes have commimed to doing so, while the remaining four have not responded. Universikes were given over two weeks to respond to the profiles. Non-‐responding universikes should not be sanckoned given the short review period. Any errors or omissions in the report remain the responsibility of CURI.
Examples of Responsible Investing Policies at other
Page 64 of 85

Page 6 of 22
We acknowledge there are a number of limitations in how this study is framed. For example, we have not covered other types of university investments or RI curriculum development, training and study programs offered by universities. We chose to focus our attention primarily at the level of RI policy and practice by investment decision-‐makers. However, in the future, CURI’s research program could draw on the lessons learned from this pilot project and expand to include pension plans, student managed funds and capital assets to provide a more comprehensive picture of university as an investor and capture the full range of sustainable investment initiatives. Who can use this report? The primary audience for this report are university administrators and trustees, who may find this study useful for evaluating how their fund stacks up against Canadian peers in terms of integrating environmental, social and corporate governance (ESG) factors within investment decision making. In the future, the study can be used to identify best practices among university and college endowment funds. For students, the report serves as an important resource for understanding the investment practices of their own universities and the constraints and opportunities for change beyond single-‐issue campaigns. The report provides them with information to engage in constructive dialogue with universities about their overall approach to sustainability or specific concerns about where funds are invested.
Alumni and other donors also have a stake in this information, as they may want to have a better understanding of the financial, social and environmental impacts of their donations. In addition, these stakeholders may want to use their influence to encourage universities to offer the option of investing in sustainability initiatives. 1.2 Overview of RI Defining RI In practice, RI is varied across type and size of investor, geography and asset class, leaving scope for significant conceptual and technical debates over its definition. For the purpose of this study, we refer to the definition adopted by the UN-‐backed Principles for Responsible Investment (UN-‐PRI) which explains5: Responsible investment is an approach to investment that explicitly acknowledges the relevance to the investor of environmental, social and governance (ESG) factors, and the long-‐term health and stability of the market as a whole. It recognises that the generation of long-‐term sustainable returns is dependent on stable, well-‐functioning and well governed social, environmental and economic systems….Responsible investment requires investors and companies to take a wider view, acknowledging the full spectrum of risks and opportunities facing them, in order to allocate capital in a manner that is aligned with the short and long-‐term interests of their clients and beneficiaries. Relatedly, there are diverse approaches to implementing RI with a variety of rationales that can vary from avoiding complicity in harm, the desire to promote positive social change and improving financial returns.
5 http://www.unpri.org/introducing-responsible-investment/
Examples of Responsible Investing Policies at other
Page 65 of 85

Page 7 of 22
Implementing RI RI can take the form of one or more of three investment strategies: active ownership; negative screening and divestment; and impact investing.
• Active ownership refers to an approach that is increasingly being adopted by mainstream investors seeking to participate in the market for corporate control, though it is also being extended to other asset classes and public policy. Active ownership can take the form of exercising the share owner’s formal rights such as proxy voting and filing resolutions, as well as using informal channels, such as engaging in private dialogue, letter writing and leveraging stakeholders and media campaigns to bring pressure to bear on corporations to better align their interests with long-‐term owners and society.
• Negative screening and divestment seek to remove from the investor’s universe assets that fail
to meet minimum criteria for investment. Some investors exclude assets that explicitly violate international laws, such as the ban on production of land mines and cluster munitions. The majority of institutional investors do not practice negative screening or divestment on a systematic basis, due to the assumed diversification loss, technical challenges associated with pooled funds and the presence of so called ‘vice funds’ that prevent a screened or divested firm’s increase in cost of capital.
• Impact investing is a nascent approach to RI. It is distinguished from other approaches by its
explicit intention to generate positive social environmental and governance benefits in addition to financial returns. Impact investing is also referred to as community investment, economically targeted investment, program related investments and mission investing.
1.3 The Global Context for RI We do not discount the continuing debates over the definition and application of RI, as they provide scope for investors to adopt the investment approach for different reasons. Nonetheless it is important to recognize that there is a growing consensus and mainstreaming of RI in recent years. A watershed moment at the global level in this regard was the establishment of the UN-‐backed Principles for Responsible Investment (PRI) in 2006. The PRI has set a contested, but globally recognized standard for RI, reflected by the rapid growth of its signatory base to represent over $30 trillion in assets6 under management since its inception in 2006. There are three main categories of PRI signatories as indicated in Table 2 below.
Table 2: Breakdown of PRI Signatories by Category
Asset owners 269 Investment managers 743 Professional service partners 187 Total 1199
6 As at May 2013.
Examples of Responsible Investing Policies at other
Page 66 of 85

Page 8 of 22
Although they manage considerable pension and endowments, just five universities are signatories to the PRI (as of May 2013):
• University of Ottawa (Canada) • Régime de Retraite de l'Université de Montréal (Canada) • University of Dayton Davis Centre for Portfolio Management's Flyer Investments (US) • University of Edinburgh (Scotland) • St Andrew’s University (Scotland)
1.4 Drivers for RI at Universities
Are universities institutionally distinct from other investors? How might their unique mandates spark or stifle RI approaches? Which types of stakeholders might champion RI at universities? Do university administrators and trustees have a legal obligation to consider RI in investment decision-‐making? These are just a handful of the many engaging questions that arise in the context of this study.
To borrow the old adage – to know where we are going, we must first know where we come from – CURI believes it is important what university stakeholders themselves see as the motivations for taking an RI approach. To derive this understanding, we convened three workshops with university trustees, administrators, faculty and students between 2011 and 2012.7 The discussions from these workshops serve as a heuristic guide to identifying key drivers for RI at universities, as elaborated next: The institutionalization of sustainability Universities are seen as vanguards of innovation on sustainability, providing guidance and solutions to complex issues ranging from climate change to poverty alleviation. In recent years, universities have not only publicly committed to “walking the talk” on sustainability; they actively compete on their ability to do so in an effort to attract students and faculty, as well as positioning themselves as providing an education of relevance to current global challenges. The Talloires Declaration (1990) was the first official statement made by university administrators of a commitment to environmental sustainability in higher education. It is a ten-‐point action plan for incorporating sustainability and environmental literacy in teaching, research, operations and outreach. Signed by over 350 university presidents and chancellors in over 40 countries, the declaration provided a framework and an impetus for many universities to raise the profile of sustainability issues. With the proliferation of sustainability offices, research dollars and related initiatives in campuses across the globe, the general level of awareness around sustainability issues among university stakeholders has grown considerably over the last fifteen years. Along with this awareness, students and faculty are
7 CURI Symposium held at the SIO Conference in Victoria, Canada in June 2011, CURI Workshop held at the UN-PRI Academic Network Conference in Sigtuna, Sweden in October 2011 and CURI Workshop held at the UN-PRI Academic Network Conference in Toronto, Canada in October 2012.
3 key drivers for RI at universities
Ø The institutionalization of sustainability
Ø Fiduciary and trust law responsibilities
Ø The 2008 global financial crisis
Examples of Responsible Investing Policies at other
Page 67 of 85

Page 9 of 22
asking informed and provocative questions about the extent to which such sustainability commitments factor into how their respective university endowments and pensions are invested. The most recent and visible evidence of this type of questioning is the GoFossilFree Campaign that has swept across North America in 2012-‐2013. Students at over three hundred colleges and universities are calling divestment from the fossil-‐fuel industry. In the words of campaigners: “Institutions of higher education are charged with preparing their students for lifetimes of work and service. But if those institutions are invested in fossil fuel companies, then students’ educations are being subsidized by investments that guarantee they won’t have much of a planet on which to make use of their degrees. Colleges and universities rush to launch greening initiatives, sustainability offices, and environmental curricula, but it makes no sense to green the campus and not the portfolio. Fossil fuel divestment is a reasonable next step — and it’s the right thing to do.”8 This type of campaigning is not new – issues from apartheid in South Africa and human rights abuses in Darfur, the Congo and Burma, to tar sands exploration in Canada have all prompted similar calls for action by university administrators. However, the frequency, scale and momentum being generated by student divestment campaigners and their supporters offer noteworthy signals about stakeholder demand for aligning investment practices with long-‐term sustainability. For example, two Harvard University professors have called on the ten largest university endowment funds in the US to become signatories to the UN PRI, arguing that the credibility of the university is at risk, as students, faculty and alumni are becoming aware of the fact that university investment policies are incongruent with the values that universities themselves claim to represent.9 Similarly, a 2012 petition campaign to Mary Dwyer, Senior University Rankings Editor at Maclean's Magazine requesting the inclusion of “responsible investment” as an indicator in the magazine’s annual university rankings report was supported by over 10,000 signatories.10 While MacLean’s ultimately declined to yield to this request to revise its rankings11, university administrators may not be able to ignore such signals, as campaigners employ increasingly creative approaches to draw attention to university investment practices. Fiduciary and trust law responsibilities At the decision-‐making level, some endowment trustees are concerned that the incorporation of RI approaches may not be in line with their understanding of fiduciary duty, which entails the following obligations: to follow the plan or trust deed for the investment fund, invest loyally in the interests of the fund’s beneficiaries, treat all beneficiaries evenly, and invest prudently with care and skill.12 These concerns arise when the concept of fiduciary duty is narrowly interpreted to mean that the interests of beneficiaries are best served when investment returns are maximised, such that the consideration of social and environmental issues may be in violation with the above obligations.
8 http://gofossilfree.org/about/ 9 http://www.bloomberg.com/news/2013-01-08/richest-universities-are-too-quiet-on-sustainable-investing.html 10 http://www.change.org/en-CA/petitions/maclean-s-magazine-add-an-ethical-investment-ranking-in-your-next-annual-universities-report 11 http://www.cbc.ca/hamilton/news/story/2012/12/20/hamilton-ethical-investment.html 12 CURI Symposium Meeting Report (2010).
Examples of Responsible Investing Policies at other
Page 68 of 85

Page 10 of 22
However, if one adopts a broader and contemporary view of fiduciary duty, there are four instances where an RI approach does not necessarily contradict fiduciary duty13:
1. In cases ESG issues are relevant with respect to the risk/return profile of the fund trustees could be seen as acting in manner that is consistent with their duty of care and legally prudent.
2. Ethical concerns can act as a tie-‐breaker if the financial performance in a less socially or environmentally damaging investment is comparable.
3. The Trust/Plan implicitly provides a mandate to adopt an RI approach 4. Beneficiaries express demand for RI. It is important to keep in mind that endowment funds do
not have direct beneficiaries, in the manner that pension funds do. For this reason, meeting the obligation of even handedness may be difficult in the context of endowment funds.
The 2008 global financial crisis In 2008, Canadian universities had an estimated $11 billion in endowment funds. On average, Canadian schools had invested over half of their endowment and pension funds in world markets, which had dropped more than 30 per cent that year.14 Queen’s University reported a loss of more than $100 million, while McGill had lost approximately 20% of its $928 million fund. The University of Toronto reported a loss of 31% ($545 million) of its previous year-‐end value in 2009, a decline that was attributed to over investment in hedge funds.15 While there are many thorny issues at play, one of the lessons learned for trustees from the financial crisis is that active oversight in the investment decision-‐making process is needed. Some fund administrators and service providers noted that the period of serious reflection on investment practice prompted by the financial crisis may create the opportunity for greater attention and openness by investment decision makers to consider the benefits offered by RI approaches, particularly in regards to risk management. Nonetheless, universities are increasingly called on to manage their investments and institutional practices in ways that reflect the values of their communities and their long-‐term commitments to future generations of students. In response, a growing number of universities are implementing RI policies and establishing multi-‐stakeholder groups to advise their trustees on ways of integrating ESG factors and long-‐term horizons into the management of universities’ endowments and pension funds. In this regard, there has been a renewed interest in the Universal Owner (UO) hypothesis, which states that a portfolio investor benefiting from a company externalising certain costs might experience a reduction in overall returns due to these externalities adversely affecting other investments in the portfolio, and hence overall market return. Universal Owners (UOs) therefore have an incentive to reduce negative externalities (e.g. pollution and corruption) and increase positive externalities (e.g. from sound corporate governance and good human capital practices) across their investment portfolios. However analysts suggest that most potential universal owners refrain from engaging corporations more actively. Better guidance, practical cost-‐benefit analytics and a stronger business-‐case that addresses long-‐term and macro-‐economic consequences are all needed for institutions, managers and the increasing number of intermediaries to understand and identify a fund’s exposure to externalities and opportunities for action.16 13 Ben Richardson’s presentation at the CURI Symposium (2010) 14 http://oncampus.macleans.ca/education/2008/11/24/global-economic-crisis-takes-heavy-toll-on-canadian-universities/ 15 Burrows, Malcom D. (2010). "The End of Endowments?". The Philanthropist 23 (1): 52–61. 16 Saint Mary’s College of California, Centre for the Study of Fiduciary Capitalism and Mercer Investment Consulting. 2006. Universal Ownership: Exploring opportunities and challenges.
Examples of Responsible Investing Policies at other
Page 69 of 85

Page 11 of 22
2.0 Headline findings This section offers a general description of key trends and findings observable across all twelve university profiles. Mirroring the survey’s key sections, the findings are grouped as follows: Sustainability Snapshot; Fund Overview and RI Review. Each section concludes with a key take-‐away message. An individual RI profile for each of the twelve universities examined is also available for download from www.curi.ca. 2.1 Sustainability Snapshot
• 10 out of twelve university presidents have made prominent sustainability claims in the last 3 years. • All universities in our sample have general sustainability policies and a sustainability office. • ¾ of the universities have sector-‐specific sustainability policies, but the University of Alberta, UVIC,
University of Waterloo and Western University do not disclose sector-‐specific policies. • Only half have concrete multi-‐sector action plans to implement sustainability commitments (UBC, Dal,
Toronto, UVIC, Western and York). McMaster, Queens and Calgary have action plans for climate change only.
• Only half disclose regular general reports against sustainability performance, 4 do not report at all (Alberta, Dalhousie, Toronto and Western). Queens and McGill claim/or are committed produce sustainability reports, but these are not disclosed. UBC is the only school to provide detailed and separate reports on a variety of sector specific sustainability commitments.
• 7 of the twelve universities are rated by STARS. UBC has a gold rating, while Alberta, Calgary, Dal, McGill and Western have a sliver rating. Ratings are valid for a three-‐year period, and due for re-‐evaluation in 2013.
• All 12 participated in the Green Report Card survey conducted by the SEI. The relevant results are summarised below:
Table 3: 2012 Green Report Card Grades Overview
Endowment Transparency Investment Priorities Shareholder EngagementUniversity of Alberta B C A FUniversity of British Columbia A-‐ A A DUniversity of Calgary A-‐ C A N/ADalhousie University B C A FMcGill University B+ A A DMcMaster University B C C DQueens University B A B DUniversity of Toronto A-‐ A B AUniversity of Victoria B+ A B FUniversity of Waterloo C+ C C DUniversity of Western Ontario B-‐ A B DYork University B+ A B F
2012 Green Report CardGrades for RI-‐relevant indicators only
Overall gradeUniversity
Examples of Responsible Investing Policies at other
Page 70 of 85

Page 12 of 22
• In terms of key institutional affiliations, all 12 are affiliated with CAUBO, half are affiliated with CUSP, while only McMaster and Waterloo are not affiliated with AASHE.
• With regard to sustainability declarations, only Alberta, Queens and Waterloo have not signed the Talloires Declaration. Alberta, Toronto, UVIC and Waterloo have not signed the Halifax Declaration. UBC, Queens, McGill and York have signed the Universitas 21 Declaration. Half have signed the Presidents Statement on Climate Change and most are involved with local or regional sustainability initiatives.
• In relation to investment, none have signed the PRI, though York University and the University of Toronto Asset Management Corporation participate in the Canadian Coalition for Good Governance. York’s pension fund participates in the Carbon Disclosure Project.
In summary Senior university administrators and leaders are keen to publicly state high sustainability aspirations. Sustainability is generally well-‐institutionalised in terms of dedicated coordination mechanisms, policies, project funding and inclusive of university administrators, staff, faculty, students and the local community. However, leaders and laggards appear when it comes to having concrete action plans and reporting against sustainability commitments. Crucially, the inclusion of responsible investment approaches as part of a university’s sustainability framework and commitments is virtually non-‐existent. 2.2 Fund Overview Asset Mix
• The endowment funds surveyed in this report to varying degrees reflect the Yale model, or what has come to be known as a typical endowment fund asset allocation. That is, while the majority of each university's portfolio is invested in listed equity (50-‐60%), all endowments include some allocation to alternative assets, such as real estate, infrastructure, hedge funds and private equity. Most of these alternative assets offer a long-‐term return, which suggests that integrating a concern for environmental, social and governance risks is critical for university endowments.
Fund Management
• All universities use external fund managers. • We did not evaluate whether a list of managers is disclosed for all universities, but this should be an
important aspect of endowment transparency. Fund Governance
• There is high degree of institutional isomorphism in endowment fund governance. Across all twelve universities, the Board of Governors has ultimate responsibility and oversight for the endowment fund. Strategic oversight is delegated to an Investment Committee, with day-‐to-‐day support often offered by an administrative unit supervised by the Vice-‐President Finance and Administration or their equivalent. Only two universities – Toronto and UBC – have established their own subsidiary investment management corporations.
• The terms of reference for the investment committees tend to be publicly disclosed. They often stipulate the composition of the committees based on stakeholder groups, though almost none articulate the specific level of investment expertise required.
• The investment committees have an average size of 10 members. The University of Toronto’s President’s Investment Committee is the smallest with 5 members, while the University of Alberta’s is the largest, with 15 members. Most investment committee members are appointed by the Board of Governors.
Examples of Responsible Investing Policies at other
Page 71 of 85

Page 13 of 22
In summary University endowment funds tend to be externally managed. There is high degree of institutional isomorphism in endowment fund governance in Canada. Despite being vested with ultimate authority over university investments, Boards may exercise remarkably little oversight. In practice, management proposals and recommendations seem to be rarely questioned or debated, though more comprehensive research is needed on the actual extent, expertise required and time devoted to oversight of the investment decision-‐making process at Canadian universities. 2.3 RI Policies and Practices Investment beliefs
• All universities have a statement of investment beliefs, either as a stand-‐alone document or incorporated in an official statement of investment policy and objectives. These statements typically address permitted asset class allocations, positions with regard to diversification, investment horizons, risk premiums, active versus passive investment strategies, currency hedging etc. They may also include commitments to certain principles such as long-‐termism, good corporate governance and prudence. While we found references to such a statement at McGill University, this document is not easily accessible on-‐line.
• Only York University explicitly references a commitment to environmental, social and governance issues, as part of its investment philosophy. The inclusion of a similar commitment in the University of Toronto’s investment beliefs is currently under discussion.
• It was not possible to verify McGill University’s claims that ESG issues are included in its’ statement of investment beliefs and such information is not disclosed for the University of Calgary.
RI Policy
• McMaster University and Queens University have specific stand-‐alone RI policies, while UBC, Calgary, Dalhousie and Western do not.
• York University establish objectives and a framework for responsible investing. Specifically, these activities were “expected to include the drawing of proposed guiding principles for the Responsible Investment Action Plan and a review of the practices of the broad community of Canadian universities, to assist in shaping the direction forward”.
• The University of Alberta’s Sustainability Policy claims that corporations with questionable sustainability practices are not suitable long term investments. The Investment Committee’s Terms of Reference also state that it may establish investment policy with respect to matters of social responsibility, though it is not clear if a stand-‐alone policy exists.
• RI policies are referred to at McGill and UVIC, but as they are not disclosed on-‐line, they could not be verified within the scope of this study.
• The University of Toronto’s policy entitled “Social and Political Issues with respect to University Investment” was first approved in 1978. However the policy was revised in 2008, and re-‐named as the “Social and Political Issues with respect to University Divestment.”(emphasis added). The change in focus on the consideration of social and political issues in the context of divestment only somewhat restricts the university from committing to a broader RI approach.
• The University of Waterloo does not have a policy on RI. However, the three religious colleges affiliated with the University (Conrad Grebel; St Jerome’s University and St Paul’s United College) have their own SRI policies and/or use socially responsible mutual funds.
Table 4: Comparative Overview of Investment Beliefs and RI Policies
Examples of Responsible Investing Policies at other
Page 72 of 85
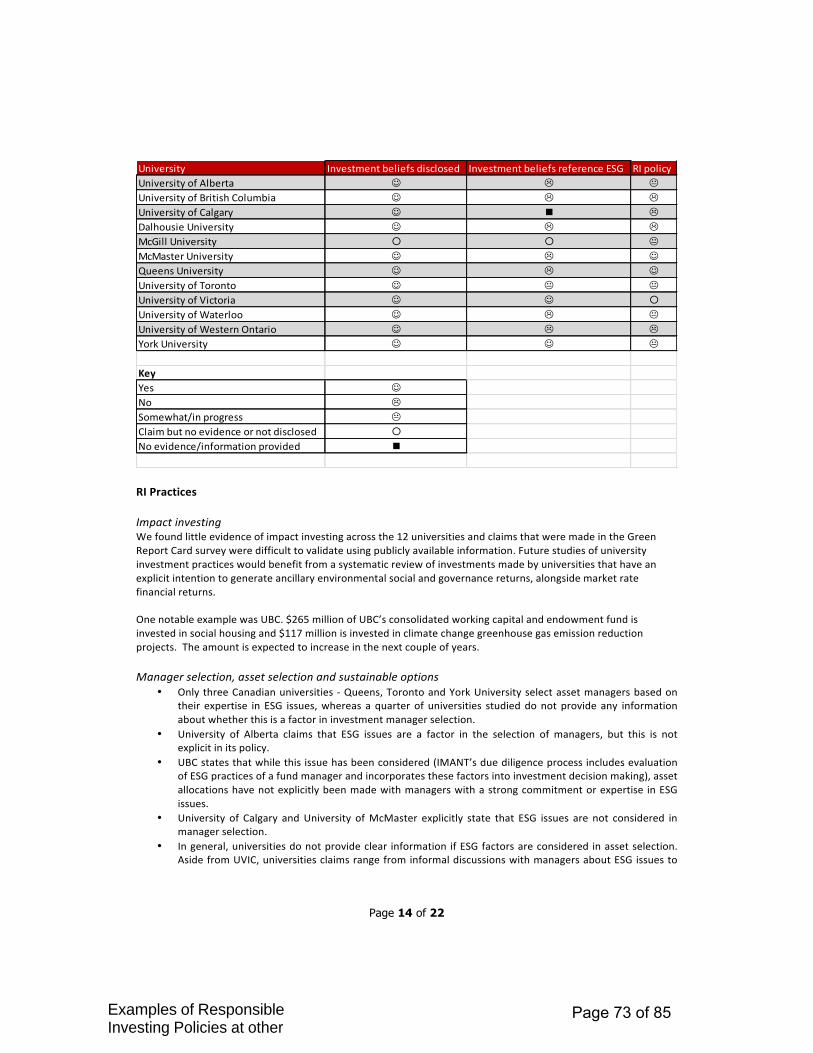
Page 14 of 22
RI Practices Impact investing We found little evidence of impact investing across the 12 universities and claims that were made in the Green Report Card survey were difficult to validate using publicly available information. Future studies of university investment practices would benefit from a systematic review of investments made by universities that have an explicit intention to generate ancillary environmental social and governance returns, alongside market rate financial returns. One notable example was UBC. $265 million of UBC’s consolidated working capital and endowment fund is invested in social housing and $117 million is invested in climate change greenhouse gas emission reduction projects. The amount is expected to increase in the next couple of years. Manager selection, asset selection and sustainable options
• Only three Canadian universities -‐ Queens, Toronto and York University select asset managers based on their expertise in ESG issues, whereas a quarter of universities studied do not provide any information about whether this is a factor in investment manager selection.
• University of Alberta claims that ESG issues are a factor in the selection of managers, but this is not explicit in its policy.
• UBC states that while this issue has been considered (IMANT’s due diligence process includes evaluation of ESG practices of a fund manager and incorporates these factors into investment decision making), asset allocations have not explicitly been made with managers with a strong commitment or expertise in ESG issues.
• University of Calgary and University of McMaster explicitly state that ESG issues are not considered in manager selection.
• In general, universities do not provide clear information if ESG factors are considered in asset selection. Aside from UVIC, universities claims range from informal discussions with managers about ESG issues to
University Investment beliefs disclosed Investment beliefs reference ESG RI policyUniversity of Alberta J L KUniversity of British Columbia J L LUniversity of Calgary J n LDalhousie University J L LMcGill University ¡ ¡ KMcMaster University J L JQueens University J L JUniversity of Toronto J K KUniversity of Victoria J J ¡University of Waterloo J L KUniversity of Western Ontario J L LYork University J J K
KeyYes JNo LSomewhat/in progress KClaim but no evidence or not disclosed ¡No evidence/information provided n
Examples of Responsible Investing Policies at other
Page 73 of 85

Page 15 of 22
general aspirational statements about ESG integration, but no specific strategies tend to be disclosed about how assets are selected in line with sustainability concerns.
• Only the University of Calgary offers donors (over $1 million) to request investments be managed differently than the current policy, which requires the approval of the investment committee. None of the twelve universities offer prospective endowment donors the option of investing in sustainable funds.
Table 5 A: Comparative Overview of Selected RI Practices
Proxy Voting
• None of the twelve universities disclose what proxy voting guidelines are issued to their investment managers, to whom proxy voting is delegated. Due to the lack of transparency on such guidance it is not possible to verify whether ESG factors are included.
• Dalhousie University is the only respondent for which it can be clearly stated that ESG factors are not included in proxy voting guidelines (since the guidance issued is minimal).
• Most of the universities studied state that their fund’s proxy voting record is accessible to the broader university community on request. Calgary and Waterloo state that this information is not provided, whereas information on this topic is not disclosed for Queens’.
Corporate Engagement and Divestment
• There is no evidence to suggest that most universities take an active role in corporate engagement as a RI strategy. UVIC and York University appear to be the exceptions in this case.
• Queens University has divested in response to adverse human rights conditions (in relation to Darfur). The University of Toronto divested from tobacco in 2007. Student-‐led divestment campaigns are currently active at all universities except the University of Calgary.
University Actively select ESG managers ESG factors in asset selection Sustainable options for donorsUniversity of Alberta ¡ ¡ LUniversity of British Columbia K n KUniversity of Calgary L n LDalhousie University n n LMcGill University n ¡ LMcMaster University K K LQueens University J ¡ LUniversity of Toronto J K KUniversity of Victoria ¡ J LUniversity of Waterloo n n LUniversity of Western Ontario K n LYork University J ¡ L
KeyYes JNo LSomewhat/in progress KClaim but no evidence or not disclosed ¡No evidence/information provided n
Examples of Responsible Investing Policies at other
Page 74 of 85

Page 16 of 22
Table 5B: Comparative Overview of Selected RI Practices
Stakeholder Involvement
• Most universities do not invite multi-‐stakeholder input on RI issues on a regular basis. • Only McGill University has a standing RI committee to provide advice and input on ESG issues.
Toronto’s committee also has ad-‐hoc status, and seems to have been highly active since 2009, with a record of regular meetings and policy deliberations.
• Queens’ University’s RI process provides for the convocation of an ad-‐hoc advisory committee, whenever a concern is expressed over ‘social injury’ in relation to university investments. However there is no evidence to suggest such a committee is currently active.
• Efforts to convene such an RI committee are actively underway at York University and UVIC.
Table 5C: Comparative Overview of RI Committees
University Evidence of Corporate Engagement Divestment used in last 10 years Active Divestment CampaignUniversity of Alberta L n JUniversity of British Columbia L n JUniversity of Calgary L n LDalhousie University L L JMcGill University ¡ n JMcMaster University ¡ n JQueens University ¡ J nUniversity of Toronto L n JUniversity of Victoria J n JUniversity of Waterloo n n LUniversity of Western Ontario n K JYork University J n JKeyYes JNo LSomewhat/in progress KClaim but no evidence or not disclosed ¡No evidence/information provided n
University Multi-‐stakeholder RI CommitteeUniversity of Alberta LUniversity of British Columbia LUniversity of Calgary LDalhousie University LMcGill University JMcMaster University LQueens University ¡University of Toronto KUniversity of Victoria KUniversity of Waterloo LUniversity of Western Ontario LYork University K
KeyYes JNo LSomewhat/in progress KClaim but no evidence or not disclosed ¡No evidence/information provided n
Examples of Responsible Investing Policies at other
Page 75 of 85
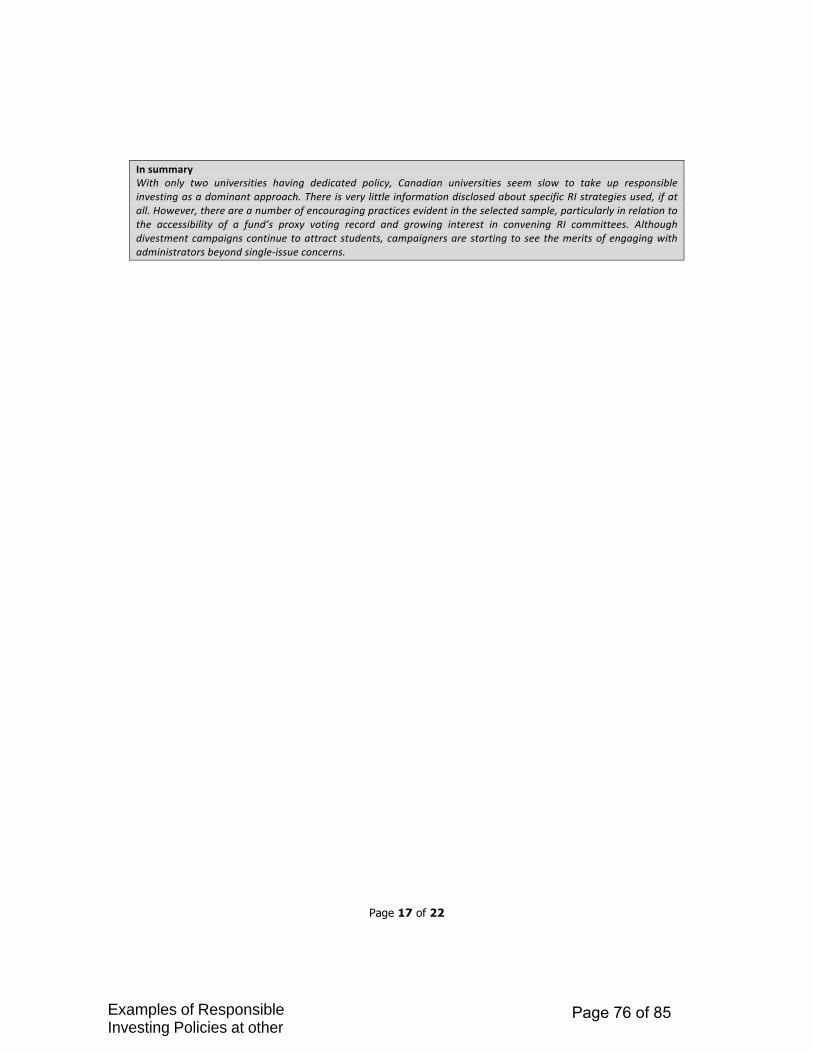
Page 17 of 22
In summary With only two universities having dedicated policy, Canadian universities seem slow to take up responsible investing as a dominant approach. There is very little information disclosed about specific RI strategies used, if at all. However, there are a number of encouraging practices evident in the selected sample, particularly in relation to the accessibility of a fund’s proxy voting record and growing interest in convening RI committees. Although divestment campaigns continue to attract students, campaigners are starting to see the merits of engaging with administrators beyond single-‐issue concerns.
Examples of Responsible Investing Policies at other
Page 76 of 85

Page 18 of 22
3.0 Challenges, Opportunities and Reccomendations Based on our findings, we close the report by identifying 5 key challenges to the wider uptake of RI approaches by university endowment funds. Drawing on expert advice as well as information provided by university administrators, we also propose potential opportunities and action points that could address the identified challenges. We hope that these could offer a basis for further discussion and input from relevant stakeholders, in a shared effort to set high standards of achievement when it comes to aligning long term social, financial and environmental sustainability in the endowment fund investment process. 3.1 Fear of the Unknown
• Challenge: Bucking broader trends among institutional investors, responsible investing is not yet a “mainstream” approach for university endowments. The challenge could be that RI approaches are not well-‐understood or narrowly associated with negative screening.
• Opportunity: Given significant homogeneity in the investment management structures of the university endowment funds considered in this report, the experiences and actions taken by universities that have embraced RI approaches could provide useful best-‐practice guidance for other institutions that want to implement similar innovations in their investment practices.
• Action: Since most universities are affiliated with CAUBO17 and AASHE, a joint initiative by these
two organisations could be successful in bringing decision-‐makers to the table in identifying persistent barriers and opportunities for change in terms of aligning endowment investment practices with an RI approach. The input of established RI groups such as the SIO in Canada and UN-‐PRI at the global level could contribute practical legitimacy to such an engagement process. Peer-‐to-‐peer exchanges on tools and best practices may also send a positive signal about the potential for this alignment to occur.
3.2 Beware the Sustainability Smokescreen
• Challenge: While only 2 universities in this study have adopted an RI policy and only one has a formal RI committee, campus sustainability initiatives are common among all universities in this study. High sustainability survey rankings and tremendous strides forward in the implementation of sustainability initiatives in research, operations and curriculum development should not act as a smokescreen to draw attention away from the fact that very few universities explicitly address their investment decision-‐making role in aspirational sustainability frameworks that apply to the university.
• Opportunity: The study finds a positive correlation between universities that have adopted RI
policies and those that have advisory committees that report directly to the university administration, such as York’s President’s Sustainability Council. That is, while student initiatives and centrally coordinated sustainability offices are important for rallying support and bringing
17 The Canadian Universities' Investment Survey is published by the CAUBO Treasury & Investment Committee, and aspires to provide universities with the information necessary to assist them in better managing their investment portfolios. The survey includes both endowment and pension investment results. However, the survey is only accessible to CAUBO members and we were not able to evaluate the extent to which RI is considered therein.
Examples of Responsible Investing Policies at other
Page 77 of 85

Page 19 of 22
attention to sustainability issues, a direct pipeline to the university administration and more specifically, the investment committee, is critical for promoting RI within a university setting.
• Action: Universities can build on their successes in creating vibrant mechanisms for multi-‐stakeholder input and action on sustainability issues, scaling up to cover responsible investing approaches. Taking the University Presidents’ Statement on Climate Change as a useful model, senior university administrators could come together to discuss the potential of co-‐creating and endorsing a high-‐level commitment to sustainable and RI that could be applied across the institutions’ funds. More importantly, this type of commitment could ensure appropriate communication pathways are put in place to facilitate the process.
3.3 Universities are a ‘different’ kind of investor
• Challenge: While universities face a unique set of challenges that set them apart from other asset owners (e.g. diverse group of beneficiaries, hybrid public-‐private institutional nature), they also share many conventional challenges that face all institutional investors, including lack of clarity over interpretations of fiduciary duty, opaque policy environments, resource constraints and lack of information on corporate ESG risks.
• Opportunity: University administrators have much to gain from participating in collaborative
initiatives with other investors as a means to manage start-‐up these challenges, as well as overcoming collective action problems that may be involved in implementing RI.
• Action: Universities may want to explore membership to organisations dedicated to RI such as
the SIO or UN PRI to take advantage of the opportunities for collaboration and resources and available to its members.
3.4 High Management Fees
• Challenge: Introducing an RI strategy arguably increases the governance costs of the universities’ investment management, as it requires additional due diligence efforts to incorporate ESG issues into investment and often hiring investment consultants to design guidelines and strategies. While the long-‐term benefits of adopting an RI strategy are gaining traction within the investment community, in the short-‐term the costs can be prohibitive for smaller funds to move beyond applying ESG criteria to selection of external managers and proxy voting guidelines. For example, active engagement on ESG issues increases management fees and impact investing requires significant cost associated with searching for opportunities and monitoring performance of investment managers.
• Opportunity: Proposals such as the ‘Facilitating Pooled Asset Management for Ontario’s Public
Sector Institutions Report’, commissioned by the Government of Ontario can contribute to reducing investment management costs due to economies of scale, provide greater access to alternative sustainable themed asset classes, enhance risk management and improve long-‐term risk/return opportunities.
Examples of Responsible Investing Policies at other
Page 78 of 85

Page 20 of 22
• Action: Universities could participate in existing and future policy discussion for pooling public sector funds and in particular, advocate for the inclusion of RI in the mandate of these new investment management institutions.
3.5 Polarizing Dynamics
• Challenge: The dominant push factor for university-‐level discussions on RI tends to be student-‐led divestment campaigns. Regrettably, sometimes these campaigns can lock administrators and students into an “us versus them” mindset, thereby precluding constructive dialogue. In addition, student divestment campaigns tend to be issue-‐specific and have a short time horizon, often placing demands on the university that its investment committees cannot meet within specified investment policies. Some universities are also able to adopt a “wait it out” strategy in response to student pressure, as divestment campaigns tend to be led by senior-‐level student who tend to graduate within one-‐to-‐two years.
• Opportunity: By establishing appropriate infrastructure, such as an RI committee, universities
can use this as a platform for diffusing the harmful and negative reputational effects of existing divestment campaigns and mitigate risk of future divestment campaigns. Most importantly, it offers an established mechanism for inviting alternative viewpoints through a systematic process. Administrations could also use this forum to regularly communicate and engage with its stakeholders on what the university is doing with respect to RI. Our analysis shows that while many universities are implementing RI, these initiatives are not communicated effectively, often buried in annual reports or investment statements.
• Action: Universities could develop a communication plan around its investment practices for its
stakeholders, including broader community and consider establishing advisory multi-‐stakeholder investment committees, as has been done at the University of Toronto, to engage students, faculty and alumni in productive discussions around the university’s investment practices
Examples of Responsible Investing Policies at other
Page 79 of 85

Page 21 of 22
APPENDIX A Methodology
Research approach The survey instrument was developed by drawing together relevant indicators from the UN Principles for Responsible Investment reporting framework and the Endowment section of the College Sustainability Report Card. Additional indicators that were relevant to the investment practices of universities were also included in the survey. Members of CURI’s advisory board were consulted on the development of the survey instrument. The survey covers general information on each fund, including fund size, asset mix, portfolio performance; governance structures (decision-‐making processes, delegation of responsibilities and powers, transparency, and specific policy questions related to proxy voting, selection and evaluation of external management, investment process); evidence of integrating sustainability into investments; and broader sustainability policies of the university. The survey includes both open and closed questions to ensure comparisons can be drawn across the funds, while allowing the flexibility for explaining the unique circumstances of each university. Selection of universities Twelve Canadian universities are selected based on their size of their endowment funds with combined assets of $8 billion CND (total university endowments in Canada-‐ $11 billion). The rationale for selecting the largest funds is based on the expectation that this is where we would find the most innovation in investment practices, given the visibility of the institutions and resources required to implement such innovation. Despite the focus on the largest endowment funds, the funds range widely in size: the largest is $1.6 billion and the smallest is $216 million. The largest universities provide a geographically diverse sample, representing five provinces. (Geographic regions not represented in the study: PEI, the territories, New Brunswick, Newfoundland, Manitoba and Saskatchewan). Ontario, BC, Alberta, Nova Scotia, Quebec Collection and verification of data Data were collected over the period of October 2012-‐December 2012 by three research assistants (a combination of paid and unpaid positions). Each researcher was assigned a specific set of universities. The research assistants were provided with the same set of instructions and guidelines to ensure consistency in data collection. Data were collected from publicly available information in annual financial statements, annual endowment reports, governance documents available on university websites and external websites to verify membership and ratings reported on the university website and media sources. The research coordinators confirmed the information collected by the research assistants. Where data was missing, the research coordinators did their own search to confirm that the information was not available publicly.
Examples of Responsible Investing Policies at other
Page 80 of 85

Page 22 of 22
It should be noted that during the verification process, one university administrator raised concerns about including student media sources such as opinion pieces from student newspapers within the benchmarking process. The authors have chosen to retain information sourced from student media. However, we agree that in the absence of other studies, interviews or focus groups to this effect, student media sources may be a less than ideal proxy indicator for student perceptions about the level of engagement from their universities on investment issues. The research assistants were instructed to provide sources for each survey question. Preference was given for primary sources (annual financial statements, official university reports), but if there was no evidence, research assistants were asked to search for secondary data (such as the Green Report Card). Once the profiles were completed, they were sent to university administrators to verify their accuracy. The administrators also had the opportunity to provide updated information that may not be available on their websites and/or correct any misinformation. Administrators were asked to provide evidence to support any changes to their profiles. The administrators were given four weeks to respond. The rationale for collecting data publicly is threefold: Avoiding “survey fatigue” from included universities; Enables the research team to establish the appropriate threshold for level of detail; Allows for consistent use of language to enhance comparability across profiles. Data analysis The research coordinators began the analysis by considering data gaps in the completed surveys. Since the survey questionnaire was designed with the intention to be completed using only public information, the surveys were largely complete (gaps included lack of detailed asset allocation and investment beliefs not available for all funds). The research coordinators decided the gaps were not significant for the pilot study and no formal interviews with university representatives were required at this stage. The sample size is too small for statistical inference and thus conclusions about causal relationships are not drawn. That said, the results provide the opportunity to consider the characteristics of universities that have integrated sustainability into their investment practices and to identify what drivers have led to adoption and whether similar drivers are present at other universities in the study. The research coordinators collated the information from each survey and identified trends across the 12 universities. The researchers considered the extent to which fund size, asset allocation, geography, governance systems and the degree to which sustainability had been integrated into other areas of university operations and administration could be used to predict the integration of sustainability into the university investment practices. Future directions of benchmarking study The research coordinators agreed it is too early to assign firm rankings to the 12 universities included in the study or to draw any conclusions regarding best practices. However, the study provides a comprehensive narrative of what the largest universities in Canada are doing with respect to integrating sustainability into their investment practices. Future versions of the survey will be developed through a review process that will include consultation with the practitioner community, university representatives and based on feedback from the research assistants involved in this pilot study.
Examples of Responsible Investing Policies at other
Page 81 of 85

Page 82 of 85

QUEEN'S UNIVERSITY STATEMENT ON RESPONSIBLE INVESTING (approved by the Board of Trustees, March 6, 2009)
In recent years, there has been considerable discussion/activity on the topic of responsible investing. Responsible investment approaches are based on the belief that environmental, social and governance ("ESG") factors can be material to shareholder value across industries and through time.
The purpose of this statement is to set down the principles which govern investments at Queen's and to provide details on the process under which non-financial factors will be considered in investment decisions.
I. GENERAL STATEMENT ON FIDUCIARY DUTIES
The Board of Trustees has the overall responsibility for the management of the investment funds of Queen's University. To help ensure that its investment responsibilities are met, the Board has appointed a Pension Connnittee and an Investment Connnittee - the latter having responsibility for the Pooled Endowment Fund and the Pooled Investment Fund.
Each committee has developed a Statement of Investment Policies and Procedures ("SIP&P") with the objective of ensuring continued prudent and effective management of the fund(s) under its mandate.
The Board of Trustees, the Pension Committee and the Investment Committee all have fiduciary duties with regard to the various funds. In an investment context, fiduciary duties include the duties of prudence and loyalty. The duty of prudence requires that investment decisions take into account appropriate planspecific factors, the specific nature of the investment under consideration and the investment portfolio at large. The duty of loyalty requires that fiduciaries act honestly, in good faith, in the best interests of the beneficiaries, and that all beneficiaries are treated with an even hand.
As a consequence of the above, the University has always considered that its fiduciary duties require the objective of obtaining the highest return for the Pension Fund, the Pooled Endowment Fund and the Pooled Investment Fund subject to acceptable levels of risk.
In 2005, the United Nations sponsored a study by a law firm in London, England - Freshfields Bruckhaus Derenger. The Freshfields report concluded that, in each of the jurisdictions examined, investment decision-makers retain some degree of discretion as to how they invest the funds under their control. Thus, it may be permissible and lawful for fiduciaries to take into account ESG considerations in specific circumstances.
There are two general approaches to ESG matters. If the plan sponsor wants to effect a change in the behaviour of companies on ESG matters, it will take a corporate engagement approach. Activities under this approach could include the voting of proxies and letters to management. If the plan sponsor does not want to profit from companies whose activities are considered socially unacceptable, this could lead to negative screens or divestiture. In most circumstances, Queen's favours the first approach.
Examples of Responsible Investing Policies at other
Page 83 of 85

II. RESPONSE FROM QUEEN'S
Queen's has also sought legal advice with regard to the consideration of non-financial factors in making investment decisions. The legal opinion which we received suggests that responsible investing policies are not per se inconsistent with the University's fiduciary duties of loyalty and prudence to the Pension Fund, the Pooled Endowment Fund and the Pooled Investment Fund.
The University acknowledges that consideration of non-financial factors could differ between the Queen's Pension Plan and the Endowment and Investment Funds. Therefore, the course of action taken by the Pension Committee on a particular issue could differ from that taken by the Investment Committee.
Currently, the two SIP&Ps do not provide direction on these matters.
For the last year or so, the University has been considering how best to respond to issues that may arise around responsible investing. The process which has been developed for Queen's is described in the following sections of this statement.
ill. SPECIAL ACTION
In exceptional circumstances, Queen's may take Special Action with respect to a specific investment or a series of investments. Special Action may include divestiture of existing holdings and/or applying investment screens.
The criterion for taking Special Action would be based on the concept of "social injury". This has been defined by Yale University as follows:
"the injurious impact which the activities of a company are found to have on consumers, employees, or other persons, particularly including activities which violate, or frustrate, the enforcement of, rules of domestic or international law intended to protect individuals against deprivation of health, safety, or basic freedoms; for the purposes of these Guidelines, social injury shall not consist of doing business with other companies which are themselves engaged in socially injurious activities."
IV. PROCESS FOR REPRESENTATION
In order to provide the University community with an opportunity to make representations on social responsibility with respect to the University's investments, the following process has been established.
Examples of Responsible Investing Policies at other
Page 84 of 85

Expressions of Concern These must be initiated by members of the Queen's community. For the purposes of this statement, we have identified five separate constituencies - faculty, administrative and support staff, students, retirees, and alumni. Requirements would be a documented submission identifying the social injury that should influence investment decisions.
The submission must be accompanied by a petition of at least 200 individual signatures, with a minimum of 20 signatures from each of three constituencies.
The submission along with the requisite signatures should be sent to the attention of the Principal of the University.
Investment Holdings Members of the Queen's community can obtain a list of the investment holdings of the Pension Fund, the Pooled Endowment Fund, or the Pooled Investment Fund by contacting the Department of Investment Services at [email protected].
V. ADVISORY COMMITTEE ON RESPONSIBLE INVESTING
Upon receipt of the requisite submission and signatures, the Principal will establish an Advisory Committee on Responsible Investing and will appoint a Chair. Membership on the committee may include representatives from the University's administration, the Pension Committee, the Investment Committee, and others drawn from the various University constituencies.
The Advisory Committee will review the brief and make a recommendation to the Principal on what further action, if any, should be taken. Actions may include (but are not limited to):
• No action • Shareholder engagement activities which may include some of the following actions:
J>o letters to management J>o supporting shareholder resolutions J>o voting of proxies J>o joining coalitions
• Special Action which must be consistent with our fiduciary duty, and may include: J>o divestiture of existing holdings J>o applying investment screens
VI. REVIEW BY BOARD COMMITTEES
The Principal will then refer the recommendation to the appropriate Board committee(s) - Pension and/or Investment Committee for a final decision. The decision will be made within the policy framework which is being established for each committee. We note that the Pension Committee and the Investment Committee are in the process of revising their respective SIP&P's to include a Responsible Investment Policy.
Examples of Responsible Investing Policies at other
Page 85 of 85