university of groningen the burden of myocardial ... filetion for stemi, in 230 patients after 4...
TRANSCRIPT
University of Groningen
The burden of myocardial infarctionHartman, Hermina Theresia
IMPORTANT NOTE: You are advised to consult the publisher's version (publisher's PDF) if you wish to cite fromit. Please check the document version below.
Document VersionPublisher's PDF, also known as Version of record
Publication date:2017
Link to publication in University of Groningen/UMCG research database
Citation for published version (APA):Hartman, H. T. (2017). The burden of myocardial infarction. [Groningen]: Rijksuniversiteit Groningen.
CopyrightOther than for strictly personal use, it is not permitted to download or to forward/distribute the text or part of it without the consent of theauthor(s) and/or copyright holder(s), unless the work is under an open content license (like Creative Commons).
Take-down policyIf you believe that this document breaches copyright please contact us providing details, and we will remove access to the work immediatelyand investigate your claim.
Downloaded from the University of Groningen/UMCG research database (Pure): http://www.rug.nl/research/portal. For technical reasons thenumber of authors shown on this cover page is limited to 10 maximum.
Download date: 13-04-2019
Chapter 5The value of global longitudinal systolic strain after STEMI
Submitted
Minke H.T. HartmanYoran M. Hummel Erik Lipsic Ad F.M. van den Heuvel Dirk J. van Veldhuisen Joost P. van Melle Iwan C.C. van der Horst Pim van der Harst

72 Chapter 5
aBsTraCT
Background
Strain echocardiography is a rapidly evolving technique to assess left ventricular func-tion. The aim of this study is to investigate the course as well as clinical, angiographic and biochemical correlates of global longitudinal systolic strain (GLSS) after ST-elevation myocardial infarction (STEMI).
Methods
GLSS was measured by 2D-echocardiography in total 291 STEMI patients treated with percutaneous coronary intervention; under which in 199 patients during hospitaliza-tion for STEMI, in 230 patients after 4 months and in 138 patients at both timepoints. GLSS was compared with cardiac magnetic resonance imaging measures performed at 4 months in 218 patients.
results
Average age was 61 year and 77% was male. GLSS improved over time (P≤0.0005). High levels of peak creatine kinase-MB were the strongest predictors of impaired GLSS during STEMI hospitalization and at 4 months. Other independent predictors of impaired GLSS during hospitalization were higher levels of high sensitive C-reactive protein (HsCRP), Hemoglobin, higher heart rate, and infarction of the left anterior descending artery (LAD) (R2=0.46, P≤0.003). High HsCRP and baseline heart rate also predicted impaired GLSS at 4 months whereas Thrombolysis In Myocardial Infarction (TIMI) flow 3 post-PCI was associated with improved GLSS (R2=0.31, P≤0.02). Over time, GLSS improved most when infarct related artery was LAD and improvement of GLSS was most pronounced in the endocardial layer.
Conclusions
To summarize, GLSS improved in the first 4 months after STEMI and was mainly deter-mined by infarct related artery. Biomarkers, infarct related artery and coronary artery reperfusion were the strongest predictors of GLSS after STEMI.
The value of GLSS in patients with STEMI 73
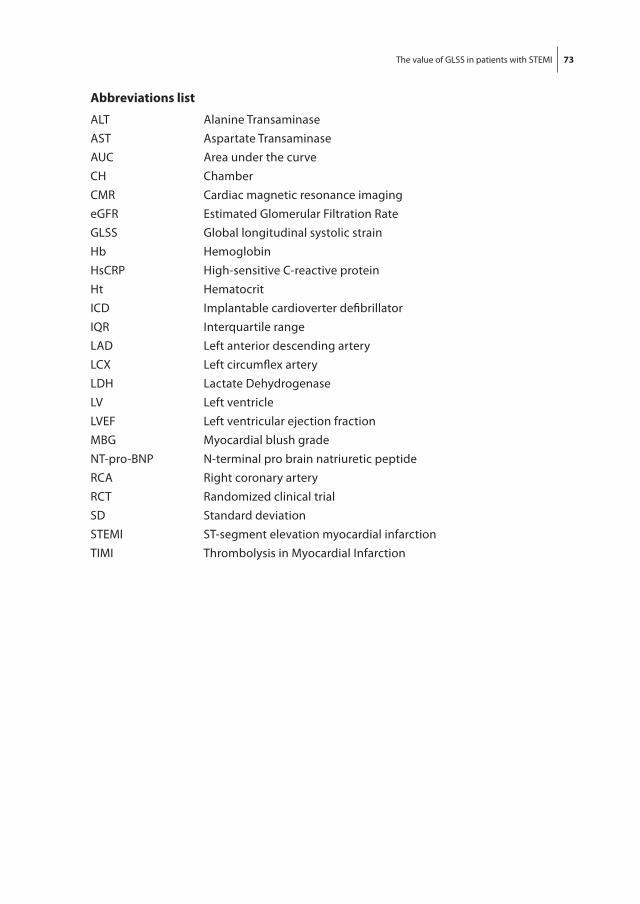
abbreviations list
ALT Alanine Transaminase AST Aspartate Transaminase AUC Area under the curveCH ChamberCMR Cardiac magnetic resonance imaging eGFR Estimated Glomerular Filtration Rate GLSS Global longitudinal systolic strain Hb Hemoglobin HsCRP High-sensitive C-reactive protein Ht Hematocrit ICD Implantable cardioverter defibrillator IQR Interquartile range LAD Left anterior descending arteryLCX Left circumflex artery LDH Lactate Dehydrogenase LV Left ventricle LVEF Left ventricular ejection fraction MBG Myocardial blush grade NT-pro-BNP N-terminal pro brain natriuretic peptide RCA Right coronary arteryRCT Randomized clinical trial SD Standard deviationSTEMI ST-segment elevation myocardial infarction TIMI Thrombolysis in Myocardial Infarction

74 Chapter 5
InTroduCTIon
Left ventricular ejection fraction (LVEF), generally measured by echocardiography dur-ing hospitalization for ST-segment elevation myocardial infarction (STEMI), is the current guidance for implementing intensified medical treatment or device therapy1. In addition to an abnormal LVEF, the value of other markers of cardiac dysfunction, including global longitudinal systolic strain (GLSS), is currently being explored in STEMI patients.
In twenty STEMI patients it was shown that GLSS correlated well with LVEF and trans-mural extent of infarction as assessed by cardiac magnetic resonance imaging (CMR)2. Several other studies highlighted the ability of GLSS to predict infarct size as determined by CMR. In these studies GLSS was a superior predictor of infarct size compared to echocardiographic estimated LVEF3-5. In addition, GLSS during STEMI hospitalization has been reported as an important predictor of LVEF improvement after 6 months6. Impaired GLSS was also associated with left ventricular remodeling and adverse cardiac events7-10. GLSS predicted in-hospital heart failure development during STEMI index hospitalization, better than known risk factors such as renal function, N-terminal pro brain natriuretic peptide (NT-pro-BNP) and Troponin T11.
Although GLSS is emerging as a novel imaging marker of adverse outcome in STEMI patients, sparse data is available on its clinical, angiographic and biochemical correlates. The aim of this study is to validate previous reported associations with LVEF and infarct size and to investigate the course as well as clinical, angiographic and biochemical cor-relates of GLSS in STEMI patients treated with PCI. In addition, we studied change in GLSS over time in the three layers of the heart.
MeTHods
study population
The design and principal results of the GIPS-III trial have been described in detail12. In brief, the GIPS-III randomized clinical trial (RCT) compared the efficacy of 4 months met-formin in comparison to placebo treatment on the preservation of LVEF. The GIPS-III was a single center study including STEMI patients admitted to the University Medical Center Groningen between January 1, 2011 and May 26, 2013. Inclusion criteria were; aged >18 years, STEMI treated with primary PCI resulting in Thrombolysis in Myocardial Infarction (TIMI) flow 2-3 post-PCI. All included patients provided written informed consent and the trial was registered at clinicaltrials.gov (NCT01217307). According to the protocol PCI-procedure related characteristics were registered by the operator during the pro-cedure and reviewed by an independent observer13. These characteristics included ischemia time, multi-vessel disease, infarct-related artery, TIMI flow pre- and post-PCI

The value of GLSS in patients with STEMI 75
and myocardial blush grade (MBG). Blood samples for analysis of myocardial injury were drawn according to a standardized protocol during the PCI procedure, including enzyme release of creatine kinase (CK), creatine kinase MB (CK-MB) and Troponin T13. Areas under the curve (AUC) and peak values were calculated over the first 36 hours post-PCI using the trapezoid method14. No curve was calculated for patients having <2 measurements or only measurements with a time span of <10 hours. Other laboratory measures collected at the time point directly after PCI included Hemoglobin (Hb), He-matocrit (Ht), high-sensitive C-reactive protein (HsCRP), Aspartate Transaminase (AST), Alanine Transaminase (ALT), Lactate Dehydrogenase (LDH), NT-pro-BNP, and estimated Glomerular Filtration Rate (eGFR) as determined by the Chronic Kidney Disease Epide-miology Collaboration formula15.
echocardiography
During index hospitalization and at 4 months, 2-dimensional (2D) echocardiography was performed on a Vivid S6 and Vivid 7 with a 2.5-3.5 MHz transducer (GE, Horten, Norway) per pre-specified imaging protocol. Images were stored digitally in raw DICOM format for further offline analysis. Offline analysis was performed on an EchoPac workstation (BT12; GE, Horten, Norway). The left ventricular deformation parameter global longitudinal sys-tolic strain (GLSS) was measured using 2D-speckle-tracking software. Region of interest is manually positioned and automatically approved by software. When disapproved by software this was followed by manually repositioning of the region of interest with a maximum of three times. No measurements and further analyses was performed when more than 2 segments were missing. As described previously, the apical-long-axis view, the 4-chamber view and the 2-chamber view are consecutively employed for averaging GLSS measurements of each segment (17 in total) and muscular layer (endocardium, myocardium and epicardium) of the left ventricle (LV)16. Vendor-dependent lower limits of normal range have been suggested -18% for EchoPAC BT12 Software16. Frame rate in all views was >40Hz. Patients with tachycardia (≥100bpm) during echocardiography were excluded (n=22). Echocardiography analyses were performed in a blinded fashion (M.H.T.H.); the observer was blinded for treatment and for all patient characteristics, such as infarct location. Strain analyses were repeated for 50 individual measurements to calculate intra-observer variability. The consistency of agreement intraclass correla-tion coefficient for intra-observer variability was 0.98 (95% confidence interval (CI): 0.96-0.99, P<0.001). The two measurements were significantly correlated (Pearson’s correla-tion 0.98, P<0.0001). Fisher-Pitman’s permutation test for equality of variances (falsely rejecting null hypothesis of paired samples being equal) was significant (P=0.002). Strain analyses repeated by a second observer (Y.M.H.) for 16 individual measurements to calculate inter-observer variability. The consistency of agreement intraclass correlation coefficient for inter-observer variability was 0.95 (95% CI: 0.86-0.98, P<0.001) and highly
76 Chapter 5
correlated (Pearson’s correlation 0.95, P<0.0001). Fisher-Pitman’s permutation test for equality of variances for paired samples was significant (P=0.0006).
Cardiac magnetic resonance imaging
Infarct size and LVEF were measured independently with CMR 4 months after STEMI by the Image Analysis Center at the VU University Medical Center in Amsterdam, the Netherlands, as described previously13. CMR imaging was performed with a phased array cardiac receiver coil on a 3.0 Tesla whole-body Magnetic Resonance imaging scan-ner (Achieva; Philips, Best, The Netherlands). LV mass and areas of infarct were analyzed on delayed enhancement images. Infarct size was defined as percentage of total left ventricular mass. LVEF was categorized according to current guidelines16.
statistical analysis
Dichotomous variables were presented as percentages, and continuous dependent variables were presented as mean±standard deviation (SD) or with interquartile ranges (IQRs) when appropriate. The paired T-test was performed to test differences between GLSS over time. Uni- and multivariable linear regression analyses were performed to assess correlates of (Δ)GLSS. The proportion of explained variance in the uni- and multivariable linear regression model was presented with R-squared (R2), P-value and standardized beta (std.β). Variables with P-value ≤ 0.10 were included in the multivari-able analyses. Multivariable linear regression analyses by means of a forward stepwise algorithm (cutoff for entry set at a significance level of P ≤ 0.10) were performed to iden-tify independent predictors of GLSS. The Dunn’s test was performed for nonparametric pair wise multiple comparisons of categories of LVEF. The sensitivity and specificity of GLSS cutpoints for LVEF categories was visualized with receiver operating characteristic curves and areas under the curves. Logistic regression was performed to evaluate the association of (Δ)GLSS and incidence of cardiovascular events during follow-up, defined as reinfarction, cardiovascular death, target lesion revascularization, target vessel revas-cularization, heart failure hospitalization, and implantation of implantable cardioverter defibrillator (ICD). All reported P-values are 2-sided. A P<0.05 was considered to indicate a significant difference. Analyses were performed with STATA/IC version 13.0 (StataCorp LP, College Station, Texas, USA).
resulTs
Baseline characteristics
In 291 patients GLSS was measured at least once (Figure 1). Baseline echocardiography (performed median 1 day after admission, IQR 1-2 days) was eligible for strain analyses

The value of GLSS in patients with STEMI 77
in 199 patients (68%). Echocardiography performed at 4 months (median 123 days after admission, IQR 117-128 days) after STEMI was eligible for strain analyses in 230 (79%) patients. At 4 months CMR data was available in 218 (75%) patients. Baseline character-istics of the 291 patients are presented in Table 1. The majority of the patients were male, had a normal MBG and TIMI flow post-PCI.
laboratory values
The median peak CK-MB level was 159.5 (68.5-323.5) U/L. Serial measurements of NT-pro-BNP were collected. NT-pro-BNP levels at 1-2 weeks, 6-8 weeks and 4 months were respectively 529 (214-1201), 261 (117-632), and 163 (70-351) ng/L. Heart rate during baseline echocardiography was 65 (60-73) beats per minute and during echocardiogra-phy performed at 4 months the heart rate was 57 (52-63) beats per minute.
figure 1. Flowchart eligibility echocardiography strain analyses and CMR in GIPS-III.

78 Chapter 5
Table 1. Baseline characteristics
Characteristic n=291IQr (25-75) or n (%)
Age 60.5 (51.6-67.3)
Sex, Male 224 (77)
Body Mass Index (kg/m²) 26.3 (24.2-29.0)
Ethnicity
Caucasian 280 (96)
Asian 8 (3)
Black 3 (1)
Hypertension 78 (27)
Hypercholesterolemia 178 (61)
Current smoker 156 (54)
Stroke 3 (1)
Previous PCI 3 (1)
Systolic blood pressure (mmHg) 133 (120-148)
Diastolic blood pressure (mmHg) 83 (74-95)
Heart rate (bpm) 74 (65-84)
Ischemia time (min) 159.5 (109-235.5)
Angiographic characteristics
Single vessel disease 198 (68)
Infarct-related artery
LAD 111 (38)
LCX 53 (18)
RCA 127 (44)
TIMI flow pre-PCI
0 159 (55)
1 24 (8)
2 49 (17)
3 59 (20)
TIMI flow post-PCI
2 29 (10)
3 262 (90)
Myocardial blush grade
0 7 (2)
1 26 (9)
2 59 (20)
3 196 (68)

The value of GLSS in patients with STEMI 79
global longitudinal systolic strain
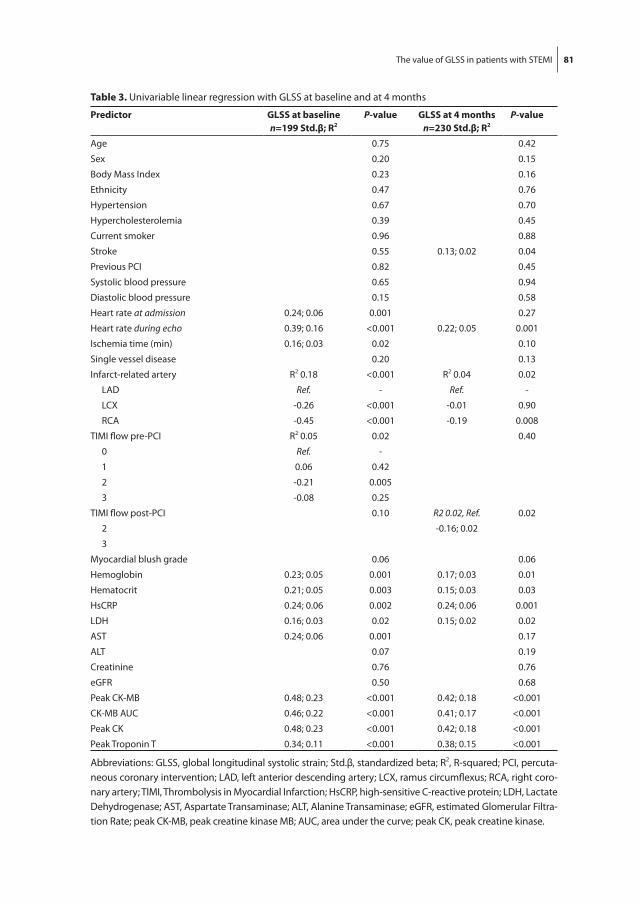
Myocardial GLSS was abnormal in 84% of patients at baseline and 73% at 4 months follow-up as shown in Table 2. Myocardial GLSS improved significantly over time (mean improvement -1.6±3.4%; paired T-test P<0.0001). In univariable linear regression, peak CK-MB and peak CK were the strongest predictors for myocardial GLSS at baseline and at 4 months (R2=0.23 at baseline, R2=0.18 at 4 months; Table 3). In multivariable analysis, independent predictors of myocardial GLSS at baseline were peak CK-MB (std.β 0.39), HsCRP (std.β 0.19), Hb (std.β 0.19), infarct related artery being left circumflex artery (LCX) (std.β -0.25), infarct related artery being right coronary artery (RCA) (std.β -0.34) explain-ing 42% of the variance (P≤0.003). When adjusting for heart rate during echocardiog-raphy, the explained variance increased to 46%. Independent predictors for myocardial GLSS at 4 months were peak CK-MB (std.β 0.38), HsCRP (std.β 0.17), and TIMI flow 3 post-PCI (std.β -0.16), explaining 24% of the variance (P≤0.02). Again, when adjusting for heart rate during echocardiography, the explained variance increased to 31%.
Table 1. Baseline characteristics (continued)
Characteristic n=291IQr (25-75) or n (%)
Blood biomarkers
Hemoglobin (mmol/L) 8.9 (8.5-9.4)
Hematocrit (%) 0.42 (0.40-0.44)
HsCRP (mg/L) 1.9 (0.9-3.7)
LDH (U/L) 177 (154-206)
AST (U/L) 28 (22-40)
ALT (U/L) 24 (18-33)
Creatinine (µmol/L) 72 (62-81)
eGFR (mL/min) 96 (86-103)
NT-pro-BNP (ng/L) 79 (37-183)
Peak CK-MB (U/L) 159.5 (68.5-323.5)
CK-MB AUC (U/L sec*107) 1.0 (0.4-1.9)
Peak CK (U/L) 1285.5 (617.5-2965.5)
Peak Troponin T (µg/L) 2.81 (1.22-6.22)
Data is presented as IQR (25-75) or n (%). Abbreviations: PCI, percutaneous coronary intervention; LAD, left anterior descending artery; LCX, ramus circumflexus; RCA, right coronary artery; TIMI, Thrombolysis in Myocardial Infarction; HsCRP, high-sensitive C-reactive protein; LDH, Lactate Dehydrogenase; AST, As-partate Transaminase; ALT, Alanine Transaminase; eGFR, estimated Glomerular Filtration Rate; NT-pro-BNP, N-terminal-pro-brain natriuretic peptide; peak CK-MB, peak creatine kinase MB; AUC, area under the curve; peak CK, peak creatine kinase; LV, left ventricle.

80 Chapter 5
Change in global longitudinal systolic strain
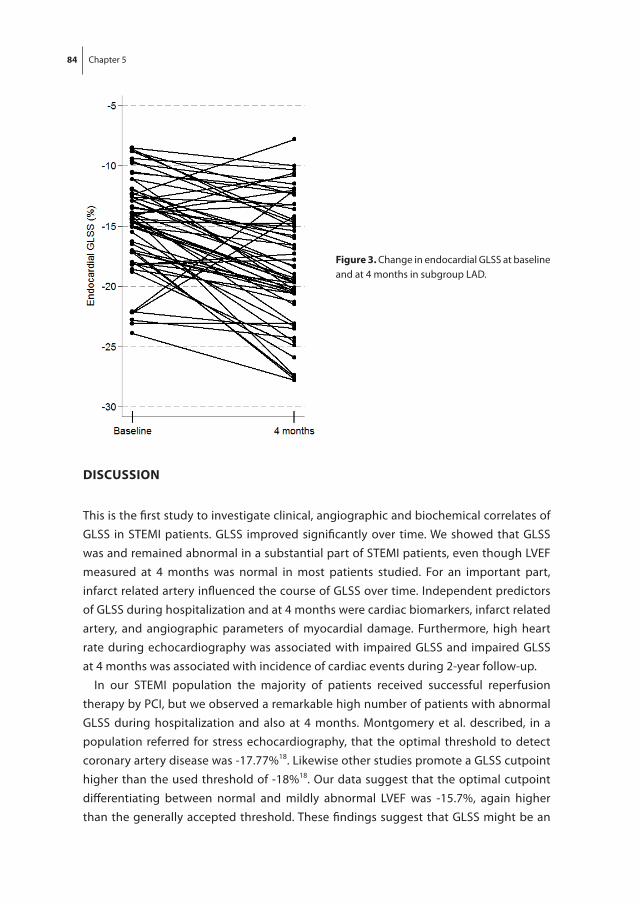
Change in GLSS in the three layers of the heart (epicardial, myocardial and endocardial) was determined for the 138 patients in whom GLSS measurements could be obtained at both time points. The number of diseased vessels and the infarct-related artery were associated with change in myocardial GLSS (single vessel disease: std.β -0.19, R2=0.04, P=0.03; infarct-related artery LCX: std.β 0.26, RCA: std.β 0.31, R2=0.10, P=0.0008; Supple-mentary Table 1). The average change in GLSS was visualized in the 17-segment model with percentage change for every segment between baseline and at 4 months in Figure 2. The left anterior descending artery (LAD) supplies the most parts of the left ventricle of blood, as shown in Supplementary Figure 1; presenting the segmentation of coronary arterial distribution according to CMR HE locations as adjusted from Ortiz-Pérez et al., 200817 and adapted with segmentation layout of the used EchoPAC BT 12 Software. As expected and presented in Figure 2, change in GLSS was in accordance with infarct loca-tion and most pronounced when infarct-related artery was LAD. Change in GLSS was evaluated for each infarct related artery group (n=58 for left anterior descending artery (LAD); n=28 for LCX; n=52 for RCA) and for each myocardial layer. Epicardial change in GLSS was significantly different between infarct-related arteries for 11 out of 17 seg-ments (P≤0.05). For the myocardial and endocardial layer 10 out of 17 segments were different (P≤0.04). Mean improvement of GLSS was -1.7±4.0% for the endocardial layer, -1.6±3.4% for myocardial and -1.4±2.9% for epicardial layer (paired T-test P<0.001). For the endocardial layer, the improvement was most pronounced when infarct related artery was LAD (Figure 3).
Table 2. Distribution of GLSS at baseline and at 4 months
strain parameter Baseline n=199
mean±sd or n (%)
at 4 months n=230
mean±sd or n (%)
Δ n=138
mean±sd
P-value
Peak GLSS endocardial (%) -16.6±4.0 -18.5±4.0 -1.7±4.0 <0.001
Abnormal 122 (61) 100 (43)
Peak GLSS myocardial (%) -14.3±3.4 -16.0±3.5 -1.6±3.4 <0.001
Abnormal 167 (84) 168 (73)
Peak GLSS epicardial (%) -12.4±3.0 -14.0±3.1 -1.4±2.9 <0.001
Abnormal 195 (98) 205 (89)
Endocardial GLSS for each infarct related artery
LAD (%) -14.7±3.9 (n=81) -17.8±4.5 (n=88) -2.8±3.5 <0.001
LCX (%) -17.4±3.8 (n=37) -18.0±3.4 (n=44) -0.7±2.9 0.40
RCA (%) -18.3±3.4 (n=81) -19.4±3.6 (n=98) -0.7±3.1 0.12
Data is presented as mean±standard deviation or n (%). Abbreviations: GLSS, global longitudinal systolic strain; LAD, left anterior descending artery; LCX, ramus circumflexus; RCA, right coronary artery.
The value of GLSS in patients with STEMI 81
Table 3. Univariable linear regression with GLSS at baseline and at 4 months
Predictor glss at baselinen=199 std.β; r2
P-value glss at 4 monthsn=230 std.β; r2
P-value
Age 0.75 0.42
Sex 0.20 0.15
Body Mass Index 0.23 0.16
Ethnicity 0.47 0.76
Hypertension 0.67 0.70
Hypercholesterolemia 0.39 0.45
Current smoker 0.96 0.88
Stroke 0.55 0.13; 0.02 0.04
Previous PCI 0.82 0.45
Systolic blood pressure 0.65 0.94
Diastolic blood pressure 0.15 0.58
Heart rate at admission 0.24; 0.06 0.001 0.27
Heart rate during echo 0.39; 0.16 <0.001 0.22; 0.05 0.001
Ischemia time (min) 0.16; 0.03 0.02 0.10
Single vessel disease 0.20 0.13
Infarct-related artery R2 0.18 <0.001 R2 0.04 0.02
LAD Ref. - Ref. -
LCX -0.26 <0.001 -0.01 0.90
RCA -0.45 <0.001 -0.19 0.008
TIMI flow pre-PCI R2 0.05 0.02 0.40
0 Ref. -
1 0.06 0.42
2 -0.21 0.005
3 -0.08 0.25
TIMI flow post-PCI 0.10 R2 0.02, Ref. 0.02
2 -0.16; 0.02
3
Myocardial blush grade 0.06 0.06
Hemoglobin 0.23; 0.05 0.001 0.17; 0.03 0.01
Hematocrit 0.21; 0.05 0.003 0.15; 0.03 0.03
HsCRP 0.24; 0.06 0.002 0.24; 0.06 0.001
LDH 0.16; 0.03 0.02 0.15; 0.02 0.02
AST 0.24; 0.06 0.001 0.17
ALT 0.07 0.19
Creatinine 0.76 0.76
eGFR 0.50 0.68
Peak CK-MB 0.48; 0.23 <0.001 0.42; 0.18 <0.001
CK-MB AUC 0.46; 0.22 <0.001 0.41; 0.17 <0.001
Peak CK 0.48; 0.23 <0.001 0.42; 0.18 <0.001
Peak Troponin T 0.34; 0.11 <0.001 0.38; 0.15 <0.001
Abbreviations: GLSS, global longitudinal systolic strain; Std.β, standardized beta; R2, R-squared; PCI, percuta-neous coronary intervention; LAD, left anterior descending artery; LCX, ramus circumflexus; RCA, right coro-nary artery; TIMI, Thrombolysis in Myocardial Infarction; HsCRP, high-sensitive C-reactive protein; LDH, Lactate Dehydrogenase; AST, Aspartate Transaminase; ALT, Alanine Transaminase; eGFR, estimated Glomerular Filtra-tion Rate; peak CK-MB, peak creatine kinase MB; AUC, area under the curve; peak CK, peak creatine kinase.

82 Chapter 5
Legend
Epicardial layer Myocardial layer Endocardial layer
Legend
Epicardial layer Myocardial layer Endocardial layer
Epicardial layer Myocardial layer Endocardial layer
Epicardial layer Myocardial layer Endocardial layer
a
B
C
figure 2. Mean change in GLSS from baseline to 4 months per infarct related artery.A. Mean change GLSS if infarct related artery was LAD (n=58).B. Mean change GLSS if infarct related artery was LCX (n=28).C. Mean change GLSS if infarct related artery was RCA (n=52).

The value of GLSS in patients with STEMI 83
relation with infarct size, lVef and nT-pro-BnP during follow-up
The correlations of CMR parameters and serial measurements of NT-pro-BNP up to 4 months follow-up with myocardial GLSS at baseline and at 4 months are presented in Table 4. Infarct size at 4 months was 9.2±8.0% and LVEF was 53.9±8.5 %. Myocardial GLSS correlated positively with NT-pro-BNP at all timepoints, infarct size, left ventricular end-systolic and end-diastolic volumes. A negative correlation was found between myocardial GLSS and LVEF. In Supplementary Figure 3 myocardial GLSS at 4 months and categories of LVEF are presented. GLSS gradually decreased over LVEF categories normal (n=120), mildly (n=50), moderately (n=11), and severely abnormal (n=3; P for trend <0.001). Surprisingly, of the 120 patients categorized with normal LVEF, 76 (63%) had abnormal GLSS at 4 months (mean myocardial GLSS in these patients: -15.2±2.1%). The optimal cutpoint to differentiate between normal versus mildly abnormal LVEF with myocardial GLSS at 4 months was -15.7% (sensitivity: 0.68, specificity: 0.71, area under the curve 0.72; Supplementary Figure 2A). The optimal cutpoint to differentiate between mildly abnormal versus moderately to severely abnormal LVEF was -12% (sensitivity: 0.79, specificity: 0.92, area under the curve 0.92; Supplementary Figure 2B).
long-term outcome
Cardiac events during 2-year follow-up occurred in 36 patients (12%). Myocardial GLSS at 4 months was associated with the incidence of cardiac events (OR 1.19, CI 1.05-1.35; P=0.005) and remained significant after adjustment for age, sex and heart rate during echocardiogra-phy (OR 1.17, CI 1.03-1.32; P=0.016). However, the association did not remain significant after adjustment for LVEF, infarct size or NT-pro-BNP (P=0.13). LVEF, infarct size and NT-pro-BNP measured during follow-up were also significantly associated with the incidence of cardiac events (P≤0.01). GLSS at baseline or change in GLSS did not predict long-term outcomes.
Table 4. NT-pro-BNP and CMR parameters correlate with GLSS
Characteristic Baseline glssr
P-value 4 months glssr
P-value
NT-pro-BNP at admission 0.16 0.02 - -
NT-pro-BNP at 1-2 weeks 0.41 <0.001 - -
NT-pro-BNP at 6-8 weeks 0.37 <0.001 - -
NT-pro-BNP at 4 months 0.34 <0.001
Infarct size at 4 months 0.45 <0.001 0.45 <0.001
LVEF at 4 months -0.41 <0.001 -0.56 <0.001
LVEDV 0.24 0.003 0.29 <0.001
LVESV 0.36 <0.001 0.48 <0.001
Abbreviations: GLSS, global longitudinal systolic strain; NT pro-BNP, N-terminal-pro-brain natriuretic pep-tide; LVEF, left ventricular ejection fraction; LVEDV, left ventricular end diastolic volume; LVESV; left ventricu-lar end systolic volume.
84 Chapter 5
dIsCussIon
This is the first study to investigate clinical, angiographic and biochemical correlates of GLSS in STEMI patients. GLSS improved significantly over time. We showed that GLSS was and remained abnormal in a substantial part of STEMI patients, even though LVEF measured at 4 months was normal in most patients studied. For an important part, infarct related artery influenced the course of GLSS over time. Independent predictors of GLSS during hospitalization and at 4 months were cardiac biomarkers, infarct related artery, and angiographic parameters of myocardial damage. Furthermore, high heart rate during echocardiography was associated with impaired GLSS and impaired GLSS at 4 months was associated with incidence of cardiac events during 2-year follow-up.
In our STEMI population the majority of patients received successful reperfusion therapy by PCI, but we observed a remarkable high number of patients with abnormal GLSS during hospitalization and also at 4 months. Montgomery et al. described, in a population referred for stress echocardiography, that the optimal threshold to detect coronary artery disease was -17.77%18. Likewise other studies promote a GLSS cutpoint higher than the used threshold of -18%18. Our data suggest that the optimal cutpoint differentiating between normal and mildly abnormal LVEF was -15.7%, again higher than the generally accepted threshold. These findings suggest that GLSS might be an
figure 3. Change in endocardial GLSS at baseline and at 4 months in subgroup LAD.

The value of GLSS in patients with STEMI 85
early marker of myocardial damage in STEMI patients and only when LV deformation is moderately affected, LVEF will decrease. Currently, guidelines do not support normal ranges of these echocardiographic parameters and are awaiting the consensus docu-ment by the task force for standardization of quantitative function imaging16.
We confirmed the significant correlation of GLSS with infarct size and LVEF. We also found similar biomarkers correlating with GLSS that previously have been shown to highly correlate with infarct size and LVEF19. This reflects that GLSS is valuable in the assessment of left ventricular function after STEMI. Enzymatic infarct size measured by peak CK-MB was the strongest predictor of GLSS at both timepoints. Peak CK-MB levels are a sensitive biomarker of myocardial tissue loss and correlate well with scar size on CMR19. In relation with GLSS, peak CK-MB likely represent the myocardial damage caused by infarction. Cardiac biomarkers and biochemical infarct size did not relate with change in GLSS. This suggests infarct size itself does not affect the recovery of cardiac function after STEMI. HsCRP also was associated with variance in GLSS and has been shown previously to correlate with infarct size and LVEF20 and is a predictor of outcome after STEMI21. The association between Hemoglobin and GLSS at baseline is less clear. Although anemia in STEMI patients has been related with worse long-term outcome22,23, and in heart failure anemia is known as an important prognostic marker22 the associa-tion with GLSS is speculative. Optimal reperfusion as indicated by a TIMI flow 3 post-PCI predicted improved GLSS after 4 months. This is in line with previous reported associa-tions of TIMI flow with LVEF and infarct size24.
We present the first data on change in GLSS after STEMI for each segment and for different myocardial layers. We observed that the distribution of change in GLSS over segments is consistent with the segmentation distribution of the coronary artery blood supply supporting the relevance of GLSS to identify areas of myocardial damage17. We observed the greatest improvement in GLSS in patients with infarct related artery LAD. To our surprise, GLSS in the basal anterior and mid anterior segments improved much less over time when infarct related artery was LAD compared to LCX. As mentioned by Malm et al., the volume quantification of the left ventricle with the 2-chamber view instead of apical-long-axis view brings along certain limitations25, this may have influenced the results. Furthermore, the endocardial layer showed an overall greater improvement in GLSS than myocardial and epicardial layers. This might be explained by the morphological patterns of myocardial infarction. In the early phase cell death starts in the subendocardial region later evolving in transmural infarction26. In successful reperfusion, transmural damage is limited. Recovery as measured by ΔGLSS is therefore probably more apparent in the endocardial vs. mid- and epicardial layers.
Only single vessel disease and infarct related artery predicted change in GLSS. Infarct related artery was also an independent predictor of GLSS at baseline. When infarct related artery was LAD, GLSS was more affected than LCX or RCA. In a smaller similar

86 Chapter 5
study, percentage of LAD infarction did vary across groups of unchanged, improved and worsened GLSS, with the highest percentage in the group with worsened GLSS27. However, this study measured GLSS before and 3 days after PCI whereas we measured GLSS post-PCI and at 4 months, a period in which infarct healing and LV remodeling is most dynamic28. In another study in 42 patients location of STEMI did not vary in groups with and without improvement of GLSS measured 2 days and 5 months post-PCI, pos-sibly due to small study size29.
The prognostic value of GLSS has been studied before8-10. GIPS-III has not been powered to study outcome in terms of cardiac events. Interestingly, we observed that GLSS at 4 months was associated with incidence of cardiac events. Baseline or change of GLSS was not predictive. These preliminary observations could be chance findings and require confirmation in larger studies.
Despite exclusion of tachycardia during echocardiography, heart rate at the time of GLSS measurement was a remarkable and independent predictor of GLSS at both timepoints. We hypothesize that heart rate might be an important variable affecting GLSS measurements and should be studied further as potential factor to account for when interpreting the value of GLSS in clinical practice.
lIMITaTIons
Although GLSS measurements were obtained without knowledge of clinical data, this study is a retrospective analysis of echocardiography data obtained in the GIPS-III trial. The GLSS measurements have been performed offline and could not be performed in all patients for the most part due to missing views and missing echocardiography’s and for a smaller part due to image quality. The number of individuals studied is substantial, in comparison with previous studies, but our study is underpowered to convincingly study the association with clinical outcomes. We determined the relation of GLSS with LVEF and infarct size, as assessed by MRI, the golden standard. Comparison with strain measured by MRI would be of additive value, but the required software is currently not yet available in our center.
ConClusIon
Strain echocardiography is a rapidly evolving and easily applicable technique to assess LV function. We demonstrated that the assessment of GLSS after STEMI could be of ad-ditional clinical value alongside conventional measurements such as LVEF and appears more sensitive in the detection of LV dysfunction. GLSS was abnormal in a substantial
The value of GLSS in patients with STEMI 87
part of STEMI patients, even when LVEF was normal. GLSS improved significantly in the 4 months after STEMI. Furthermore, we illustrated that this dynamic process was mainly determined by infarct related artery. Independent predictors of GLSS during hospitalization and at 4 months after STEMI were cardiac biomarkers, infarct related ar-tery, and angiographic parameters of myocardial damage. Increasing heart rate during echocardiography had a negative effect on GLSS. When interpreting the value of GLSS in clinical practice, GLSS should be indexed for heart rate. In addition, we demonstrated the association of GLSS at 4 months with the incidence of cardiac events during 2-year follow-up.
aCknowledgeMenTs
The GIPS-III trial was supported by grant number 95103007, ZonMw, the Netherlands Organization for Health Research and Development, The Hague, the Netherlands. We would like to acknowledge the GIPS-III investigators for making the data available for the current analyses.
fundIng
The GIPS-III trial was supported by grant number 95103007, ZonMw, the Netherlands Organization for Health Research and Development, The Hague, the Netherlands.
dIsClosures
Authors have nothing to disclose.
88 Chapter 5
referenCes
1. Task Force on the management of ST-segment elevation acute myocardial infarction of the European Society of Cardiology (ESC), Steg PG, James SK, et al. ESC guidelines for the manage-ment of acute myocardial infarction in patients presenting with ST-segment elevation. Eur Heart J. 2012;33(20):2569-2619.
2. Cimino S, Canali E, Petronilli V, et al. Global and regional longitudinal strain assessed by two-dimensional speckle tracking echocardiography identifies early myocardial dysfunction and transmural extent of myocardial scar in patients with acute ST elevation myocardial infarction and relatively preserved LV function. Eur Heart J Cardiovasc Imaging. 2013;14(8):805-811.
3. Grabka M, Wita K, Tabor Z, et al. Prediction of infarct size by speckle tracking echocardiography in patients with anterior myocardial infarction. Coron Artery Dis. 2013;24(2):127-134.
4. Grenne B, Eek C, Sjoli B, et al. Mean strain throughout the heart cycle by longitudinal two-dimensional speckle-tracking echocardiography enables early prediction of infarct size. J Am Soc Echocardiogr. 2011;24(10):1118-1125.
5. Sjoli B, Orn S, Grenne B, et al. Comparison of left ventricular ejection fraction and left ventricular global strain as determinants of infarct size in patients with acute myocardial infarction. J Am Soc Echocardiogr. 2009;22(11):1232-1238.
6. Abate E, Hoogslag GE, Antoni ML, et al. Value of three-dimensional speckle-tracking longitudinal strain for predicting improvement of left ventricular function after acute myocardial infarction. Am J Cardiol. 2012;110(7):961-967.
7. Mollema SA, Liem SS, Suffoletto MS, et al. Left ventricular dyssynchrony acutely after myocardial infarction predicts left ventricular remodeling. J Am Coll Cardiol. 2007;50(16):1532-1540.
8. Munk K, Andersen NH, Terkelsen CJ, et al. Global left ventricular longitudinal systolic strain for early risk assessment in patients with acute myocardial infarction treated with primary percuta-neous intervention. J Am Soc Echocardiogr. 2012;25(6):644-651.
9. Park YH, Kang SJ, Song JK, et al. Prognostic value of longitudinal strain after primary reperfu-sion therapy in patients with anterior-wall acute myocardial infarction. J Am Soc Echocardiogr. 2008;21(3):262-267.
10. Zaliaduonyte-Peksiene D, Vaskelyte JJ, Mizariene V, Jurkevicius R, Zaliunas R. Does longitudi-nal strain predict left ventricular remodeling after myocardial infarction? Echocardiography. 2012;29(4):419-427.
11. Ersboll M, Valeur N, Mogensen UM, et al. Relationship between left ventricular longitudinal deformation and clinical heart failure during admission for acute myocardial infarction: A two-dimensional speckle-tracking study. J Am Soc Echocardiogr. 2012;25(12):1280-1289.
12. Lexis CP, van der Horst IC, Lipsic E, et al. Metformin in non-diabetic patients presenting with ST elevation myocardial infarction: Rationale and design of the glycometabolic intervention as adjunct to primary percutaneous intervention in ST elevation myocardial infarction (GIPS)-III trial. Cardiovasc Drugs Ther. 2012;26(5):417-426.
13. Lexis CP, van der Horst IC, Lipsic E, et al. Effect of metformin on left ventricular function after acute myocardial infarction in patients without diabetes: The GIPS-III randomized clinical trial. JAMA. 2014;311(15):1526-1535.
14. Jawien W. Searching for an optimal AUC estimation method: A never-ending task? J Pharmacoki-net Pharmacodyn. 2014;41(6):655-673.
15. Levey AS, Stevens LA, Schmid CH, et al. A new equation to estimate glomerular filtration rate. Ann Intern Med. 2009;150(9):604-612.
The value of GLSS in patients with STEMI 89
16. Lang RM, Badano LP, Mor-Avi V, et al. Recommendations for cardiac chamber quantification by echocardiography in adults: An update from the american society of echocardiography and the european association of cardiovascular imaging. J Am Soc Echocardiogr. 2015;28(1):1-39.e14.
17. Ortiz-Perez JT, Rodriguez J, Meyers SN, Lee DC, Davidson C, Wu E. Correspondence between the 17-segment model and coronary arterial anatomy using contrast-enhanced cardiac magnetic resonance imaging. JACC Cardiovasc Imaging. 2008;1(3):282-293.
18. Montgomery DE, Puthumana JJ, Fox JM, Ogunyankin KO. Global longitudinal strain aids the detection of non-obstructive coronary artery disease in the resting echocardiogram. Eur Heart J Cardiovasc Imaging. 2012;13(7):579-587.
19. Chia S, Senatore F, Raffel OC, Lee H, Wackers FJ, Jang IK. Utility of cardiac biomarkers in pre-dicting infarct size, left ventricular function, and clinical outcome after primary percutaneous coronary intervention for ST-segment elevation myocardial infarction. JACC Cardiovasc Interv. 2008;1(4):415-423.
20. Reinstadler SJ, Feistritzer HJ, Klug G, et al. High-sensitivity troponin T for prediction of left ventricular function and infarct size one year following ST-elevation myocardial infarction. Int J Cardiol. 2016;202:188-193.
21. Smit JJ, Ottervanger JP, Slingerland RJ, et al. Comparison of usefulness of C-reactive protein ver-sus white blood cell count to predict outcome after primary percutaneous coronary intervention for ST elevation myocardial infarction. Am J Cardiol. 2008;101(4):446-451.
22. O’Meara E, Rouleau JL, White M, et al. Heart failure with anemia: Novel findings on the roles of renal disease, interleukins, and specific left ventricular remodeling processes. Circ Heart Fail. 2014;7(5):773-781.
23. Vrsalovic M, Pintaric H, Babic Z, et al. Impact of admission anemia, C-reactive protein and mean platelet volume on short term mortality in patients with acute ST-elevation myocardial infarction treated with primary angioplasty. Clin Biochem. 2012;45(16-17):1506-1509.
24. Bethke A, Halvorsen S, Bohmer E, Abdelnoor M, Arnesen H, Hoffmann P. Myocardial perfusion grade predicts final infarct size and left ventricular function in patients with ST-elevation myocar-dial infarction treated with a pharmaco-invasive strategy (thrombolysis and early angioplasty). EuroIntervention. 2015;11(5):518-524.
25. Malm S, Sagberg E, Larsson H, Skjaerpe T. Choosing apical long-axis instead of two-chamber view gives more accurate biplane echocardiographic measurements of left ventricular ejection frac-tion: A comparison with magnetic resonance imaging. J Am Soc Echocardiogr. 2005;18(10):1044-1050.
26. Reimer KA, Jennings RB, Tatum AH. Pathobiology of acute myocardial ischemia: Metabolic, func-tional and ultrastructural studies. Am J Cardiol. 1983;52(2):72A-81A.
27. Woo JS, Kim WS, Yu TK, et al. Prognostic value of serial global longitudinal strain measured by two-dimensional speckle tracking echocardiography in patients with ST-segment elevation myocardial infarction. Am J Cardiol. 2011;108(3):340-347.
28. Pokorney SD, Rodriguez JF, Ortiz JT, Lee DC, Bonow RO, Wu E. Infarct healing is a dynamic process following acute myocardial infarction. J Cardiovasc Magn Reson. 2012;14:62-429X-14-62.
29. Caracciolo G, Eleid MF, Abe H, et al. Non-uniform recovery of left ventricular transmural mechan-ics in ST-segment elevation myocardial infarction. Cardiovasc Ultrasound. 2010;8:31-7120-8-31.
