university of groningen microfluidic tools for …...cover design: margaryta a. ianovska layout...
TRANSCRIPT

University of Groningen
Microfluidic tools for multidimensional liquid chromatographyIanovska, Margaryta
IMPORTANT NOTE: You are advised to consult the publisher's version (publisher's PDF) if you wish to cite fromit. Please check the document version below.
Document VersionPublisher's PDF, also known as Version of record
Publication date:2018
Link to publication in University of Groningen/UMCG research database
Citation for published version (APA):Ianovska, M. (2018). Microfluidic tools for multidimensional liquid chromatography. University of Groningen.
CopyrightOther than for strictly personal use, it is not permitted to download or to forward/distribute the text or part of it without the consent of theauthor(s) and/or copyright holder(s), unless the work is under an open content license (like Creative Commons).
Take-down policyIf you believe that this document breaches copyright please contact us providing details, and we will remove access to the work immediatelyand investigate your claim.
Downloaded from the University of Groningen/UMCG research database (Pure): http://www.rug.nl/research/portal. For technical reasons thenumber of authors shown on this cover page is limited to 10 maximum.
Download date: 13-01-2021

Microfluidic Tools
for
Multidimensional Liquid Chromatography
Margaryta A. Ianovska
Paranimphs:
Viktoria Starokozko
Nashwa Soliman
Cover design: Margaryta A. Ianovska
Layout design: Margaryta A. Ianovska
Printed by: Ipskamp Printing
The research presented in this thesis was financially supported by The Netherlands Organization for
Scientific Research (NWO) in the framework of the Technology Area-COAST program, project no.
(053.21.102) (HYPERformance LC) and the University of Groningen. Printing of this thesis was
supported by the University of Groningen, Faculty of Science and Engineering and the University
Library.
© Margaryta A. Ianovska, 2018
ISBN (printed version): 978-94-034-1221-4
ISBN (digital version): 978-94-034-1220-7
No parts of this thesis may be reproduced or transmitted in any form or by any means, electronic or
mechanical, including photocopying, recording or any information storage and retrieval system,
without permission of the author.

Microfluidic Tools for
Multidimensional Liquid
Chromatography
PhD thesis
to obtain the degree of PhD at the
University of Groningen
on the authority of the
Rector Magnificus Prof. E. Sterken
and in accordance with
the decision by the College of Deans.
This thesis will be defended in public on
Friday 7 December 2018 at 16:15 hours
by
Margaryta Ianovska
born on 21 June 1990 in Kiev, Ukraine

Supervisors Prof. E.M.J. Verpoorte Prof. P.J. Schoenmakers
Assessment committee Prof. S. Eeltink Prof. R.A.H. Peters Prof. R.C. Chiechi

Can one ever predict the influence of his work on the world?
It might glow in the future as stars in the sky.
(The cover to this thesis was inspired by the most recognized painting in the
history of Western culture - The Starry Night by Vincent van Gogh, who
referred to the painting as a "failure").
At the same time, the cover represents the mixing process that was observed by
the author in the channel with herringbone grooves.


Table of Contents
Introduction ........................................................................... 11
Introduction ........................................................................................................... 13
Scope of the thesis ................................................................................................. 30
References ..............................................................................................................32
Novel micromixers based on chaotic advection and their application —a review ........................................................... 37
Abstract ................................................................................................................. 38
1. Introduction ...................................................................................................... 39
2. Theory ............................................................................................................... 42
3. Passive micromixers based on chaotic advection............................................. 46
Table 1. Micromixers based on chaotic advection. ................................................... 59
4. Application of the passive micromixers based on chaotic advection ............... 62
5. Discussion .......................................................................................................... 76
6. Conclusions ....................................................................................................... 80
References .............................................................................................................. 81
Development of small-volume, microfluidic chaotic mixers for future application in two-dimensional liquid chromatography .................................................................... 85
Abstract ................................................................................................................. 86
Introduction ........................................................................................................... 87
Material and Methods ........................................................................................... 89
Results and Discussion ......................................................................................... 96
Supplementary information ................................................................................ 106
Conclusions ........................................................................................................... 111
Acknowledgements ............................................................................................... 111
References ............................................................................................................ 112
Fabrication of a pressure-resistant microfluidic mixer in fused silica using Selective Laser-Induced Etching ........................ 115
Abstract ................................................................................................................ 116
Introduction .......................................................................................................... 117
Material and Methods .......................................................................................... 121
Results and Discussion ........................................................................................ 126
Evaluation of mixing performance ......................................................................... 134
Conclusions .......................................................................................................... 139

Acknowledgements .............................................................................................. 140
References ............................................................................................................ 141
Microfluidic micromixer as a tool to overcome solvent incompatibilities in two-dimensional liquid chromatography ................................................................... 143
Introduction ......................................................................................................... 145
Material and Methods .......................................................................................... 150
Results and Discussion ........................................................................................ 157
Supplementary Information ................................................................................ 168
Conclusions .......................................................................................................... 172
Acknowledgements .............................................................................................. 173
References ............................................................................................................ 174
General discussion, conclusions and future perspectives .... 177
General discussion, conclusions and future perspectives ................................... 179
References ............................................................................................................ 185
Samenvatting ....................................................................... 187
Acknowledgements .............................................................. 193
Curriculum Vitae .................................................................199
List of publications: ............................................................. 200

Chapter I
Introduction


Introduction
13
Introduction
Over the last centuries the world has undergone breathtaking changes that are
unprecedented in human history. Humanity has never been so far advanced in knowledge, in
so many different areas, and over such a wide spectrum. We have progressed through the age
of technology to the information and digital age. Driven by insatiable curiosity, we are gaining
a lot of insight into biological processes in living systems, including the functions of the human
body at different levels, which holds great promise for the improvement of public health.
Moreover, with limited resources on a limited planet, we have become aware of the influence
we have on our planet, and the environmental problems that arise as a consequence of our
actions.
Further progress in improving the quality of human life on the one hand and controlling
environmental change on the other is not possible without reliable and high-resolution
instrumental methods. Today in many fields, such as environmental and food analysis, and the
analysis of biological material in proteomics and metabolomics, scientists have to deal with
samples that may contain literally thousands of constituents. This has generated a need for
improving existing, or even creating new, methods for analysis of larger numbers of
compounds in more complex samples in the most comprehensive way.
Nowadays, one of the most powerful separation techniques is liquid chromatography
(LC), in which a dissolved sample flows through a column packed with a solid adsorbent. Each
constituent of the mixture interacts differently with the column material, which leads
eventually to different elution times from the column and, therefore, the separation of
components. Liquid chromatography has assumed a very important position among the modern
analytical separation techniques, mainly for the analyses of samples with low complexity
(active pharmaceutical ingredients, food industry, etc.). However, LC often does not provide
sufficient resolving power (the ability to distinguish different compounds from each other) for
the separation of complex samples. For example, biological samples of interest in proteomics
and metabolomics can contain thousands of components; in a more extreme example, samples
that are analyzed in experiments investigating expression of the human proteome in different
tissues may contain up to 200,000 components after digestion with trypsin.1,2 However, there
are few examples to be found in the literature where calculated theoretical peak capacities (the
maximum number of peaks that can be separated per single run) reach even a few thousand
Intr
od
uct
ion

Microfluidic Tools for Multidimensional Liquid Chromatography
14
peaks.3–5 Under typical circumstances in an LC separation, theoretical peak capacities tend to
be on the order of 200, whereas the actual separation will yield a more modest number of peaks.
Approximately 50 - 75 peaks are usually recorded, which means that observed peaks are likely
to contain a number of overlapping single-componentpeaks.2,6
A good alternative for improving the separation power of LC is to develop a multi-
dimensional system that combines two or more separation mechanisms in series to significantly
improve resolving power and achieve peak capacities that are greater than in one-dimensional
LC.
Basic principles of two-dimensional liquid chromatography
In 1978, Erni and Frei7 introduced a two-dimensional liquid-chromatography system,
constructed by coupling two LC columns, for the separation of complex plant extracts. Their
intention was to first separate samples on a gel permeation stationary phase, followed by the
complete transfer of all the eluate coming from the first column or “first dimension” (1D) to a
second column (second dimension, 2D) containing a reverse-phase stationary phase. The 1D
eluate was collected in fractions and re-injected to the 2D for a second separation. Though both
the separation and the set-up were imperfect, this early work is regarded as “pioneering” in the
area of comprehensive LC, as the idea was to subject all of the 1D eluate to a second
separation.8 A certain level of automation was incorporated into this first 2D-LC system in the
form of an 8-port switching valve equipped with two sampling loops of identical volume for
sampling and storing eluate for transfer between dimensions. In 1990, Jorgenson and co-
workers9 utilized comprehensive 2D-LC for protein separations. However, two-dimensional
gas chromatography (2D-GC)10 had reached a higher degree of maturity by the late 1990s6 than
2D-LC, due to inherent advantages such as faster separation as a result of faster diffusion and
mass transfer, easier coupling between dimensions and no need for thermal re-equilibration
between successive second-dimension runs.
Two-dimensional LC has found its practical applications now, two decades later, as the
required instrumentation nowadays is much more advanced. State-of-the-art 2D-LC exists in
three forms: off-line, on-line “heart-cutting” (LC-LC) and comprehensive (LC×LC).11 In the
off-line techniques, the fractions that elute from the first column first are collected off-line,
with subsequent re-injection into the second dimension,8 This approach does not require
additional equipment, as the effluent portions are simply collected, but it does take a lot of

Introduction
15
work and time. In the on-line version of 2D-LC, two dimensions are coupled via an interface
(also called “modulator”). In many cases, it consists of a switching valve with a varying number
of ports and two identical sampling loops, connected to the valve. By switching back and forth
between loops, these loops first collect, store and later re-inject the effluent from the first
column (1D) into the second dimension (2D), where the second separation takes place. The
process of sampling, storing and re-injection of small 1D effluent fractions into the second
dimension is called modulation. The separation of fractions injected onto the 2D should be fast
and in most cases complete before the next transfer occurs. In the “heart-cutting” mode, only
one or a few chosen 1D fractions are collected and immediately re-injected into the second
column for separation, while the remaining effluent is directed to waste.
Figure 1. (A) The principle of peak separation in comprehensive two-dimensional liquid chromatography: (a) the
separation of 1D-overlapping peaks in the second dimension and (b) their position in the resulting 2D
chromatogram (modified from6). (B) (a) Sampling of consecutive fractions from the 1D effluent, which are then
subjected to re-injection and separation in the second dimension; (b) a series of chromatograms resulting from the
2D separation of individual fractions from the 1D. Each chromatogram is separated from its neighbours by dashed
lines (modified from12).
In a comprehensive mode, the entire 1D effluent is transferred in fractions for analysis on
the second column. Due to the different separation mechanisms applied in each dimension,
poorly resolved peaks from one column may be completely separated on another column
Intr
od
uct
ion

Microfluidic Tools for Multidimensional Liquid Chromatography
16
(Fig.1A.).13,14 The entire 1D effluent is collected on-line in small-volume fractions, which are
transferred one by one to the 2D column in multiple repeated cycles.15 Every second-dimension
run is recorded by a detector as a separate chromatogram (for each individual 1D fraction). A
fraction may contain just one component, or several components, as the case may be (Figure
1Ba). Thus, one sample component may be observed in several successive chromatograms,
spanning over the width of one first-dimension peak (Figure 1B)15. All two-dimensional data,
recorded by the detector, can be presented in the form of a colour plot (similar to Figure 2).
Theoretical aspects
In a two-dimensional separation process three steps can be distinguished: the first-dimension
separation; sampling, storing and re-injection of small 1D effluent fractions into the second
column (“modulation”); and the second-dimension separation. Each of these steps makes a
contribution to the overall resolution of a two-dimensional liquid chromatography experiment.6
The separation in the individual dimensions of the 2D-LC system is dictated by the same
parameters as those in separations performed in one-dimensional systems. However, specific
for the 2D systems is the need for selection of suitable “orthogonal”-phase-system
combinations in both dimensions,16 and for selecting conditions for the fraction transfer
between dimensions15 that result in as little loss of resolution as possible.
Sampling rate (modulation time)
The modulation interface determines whether the resolution obtained in the first separation can
be maintained in the 2nd dimension and is hence the heart of any LC×LC system. The frequency
at which the interface performs operations with each 1D fraction indicates how often the
fractions are transferred into the second dimension (the so-called sampling rate or modulation
time, tR, Figure 1B).15 In practice, re-mixing or re-dispersion of the collected fraction before
its transfer to the second dimension is the main reason for the resolution loss in overall LC×LC
separation. The volume of the 1D fraction contributes to the total band broadening in the second
dimension, which decreases at shorter modulation times (higher sampling rate).15 Hence, the
sampling rate strongly affects the quality of the 2D separation, and a fast and reliable transfer
of the 1D effluent is needed.8 Moreover, the internal volumes of all the components making up
the interface determine the extra-column band broadening; as such, the volume of these
components should also be minimized.

Introduction
17
Choosing the appropriate sampling rate (number of samples per 1D peak, ns) is a major
decision that must be made when designing a comprehensive 2D-LC separation method.6 A
fundamental rule (Murphy-Schure-Foley rule)17 for comprehensive 2D separation is to sample
each 1D peak 3 or 4 times. The effect of different sampling rates on the resolution of peaks in
close proximity to each other in 2D-LC is shown in Figure 2. Where the sampling rate (ns)
decreases from 4 (in this case the sampling time tR is 30 s) to 1 (tR=120 s), three peaks that
were observed at ns = 4 combine into a single peak. Furthermore, Murphy, Schure and Foley17
showed that even if the initial 1D peak is narrow, the effective width of the peak as it enters the
second column will depend on the sampling rate.6 Recent research indicates that it is possible
to simplify the technique and still obtain adequate resolution with only 2.5 - 3 cuts per 1D
peak.18,19
In practice, it is difficult to achieve both good resolution and high throughput. For that
reason, the first-dimensional column is very often operated at a very low flow rate in order to
sample a sufficient number of fractions across the 1D peak, which often leads to some
broadening.8 Moreover, a high sampling rate requires that the second-dimension separations
should not be longer than the duration of a modulation period to ensure an adequate number of
samplings. Thus, the 2D column should be very short, which leads to a relatively low number
of theoretical plates.15
Intr
od
uct
ion

Microfluidic Tools for Multidimensional Liquid Chromatography
18
Figure 2. Simulated demonstration of the effect of the first dimension sampling time (tR) and sampling rate (ns)
on the peak resolution when: (A) ns=4, (B) ns=2, (C) ns=1.5 and (D) ns =1 (modified from6).
Over the last decades, many different interface configurations have been reported. In
most cases, they consist of a two-position/10-port20–22, several 6-port23,24 or a two-position/12-
port valve25,26 having two sampling loops (with the same volume).25,27,28 One example of a 2D-
LC set-up with an 8-port switching valve is presented in the Figure 3. While Loop 1 collects
the 1D effluent, Loop 2 is simultaneously being emptied, transferring its content to the second
dimension.15 The sampling loop can be replaced with a trap-column.26,27,29–31 In this case,
focusing (pre-concentration) of the solutes occurs on a trap column prior to their analysis in
the second dimension.8 The same principle is used for other reported configurations, but using
two or more columns operating in parallel in the second dimension.28,31–33 Of course, such an
approach would increase the amount of sample to be analysed. However, the interfaces with
trap- and parallel-columns are difficult to implement in practice, due to the need for additional
instrumentation, which increases the complexity of the system.8 For these reasons, the
interfaces that contain a valve with loops are the most common in 2D-LC.34

Introduction
19
Figure 3. Scheme of a 2D-LC system with two positions of an 8-port valve: (A) Loop 1 acts as a storage loop
and is filled with 1D effluent. (B) When the valve switches, the analytes are transferred from Loop 1 to the 2D,
while Loop 2 takes on the role of storage loop, to be filled with 1D effluent.
Orthogonality
In 2D chromatography, the orthogonality of the two dimensions (i.e. of the two separation
mechanisms) is of prime importance. Orthogonality refers to the differences between the
properties of the coupled dimensions.15 If the two separation mechanisms exhibit minimum
correlation in separation selectivity, a 2D separation is considered to be orthogonal.1,8
Orthogonality not only depends on the chemical properties of the stationary and mobile phases
(i.e. the structure, polarity, charge, etc. of the stationary surface and the eluent), but also on the
properties of the solutes being separated (hydrophobicity, charge, etc.). Since solute properties
will of course vary from one solute to the next, the universal orthogonal 2D-LC combination
does not exist. Nowadays, a large variety of stationary phases is available. They differ in pore
size, surface chemistry, support material used, etc. At the same time, properties of the mobile
phase can be changed by modifying pH, adding ion-pair agents or adjusting the temperature.8,16
(In)compatibility of the mobile phases
It is important to make an appropriate choice of both stationary and mobile phases, especially
from the perspective of mobile-phase compatibility between dimensions, as even slight
incompatibility may adversely affect the overall separation. Incompatibility can mean that
either two liquid phases are simply immiscible, or a so-called solvent-strength mismatch is
observed. The latter occurs when a ‘strong’ eluent having high elution strength in one mode is
a ‘weak’ eluent having a low elution strength in the other mode. In both cases, not only
Intr
od
uct
ion

Microfluidic Tools for Multidimensional Liquid Chromatography
20
retention selectivity may be significantly affected, but also band broadening and/or peak shape
in the second dimension.
In order to maximize the reduction of the fraction volume to improve resolution as
discussed above, the sample should be retained more strongly on the 2D column than on the 1D
column. For this reason, the 1D mobile phase should preferably act as a weak solvent (having
low elution strength) in the second column. In this situation, a transferred fraction is retained
(focused) at the beginning of the second column in a more or less compressed narrow zone
before its elution with 2D mobile phase.15 This effect, called “on-column fraction focusing”,35,36
improves resolution, peak capacity and detection sensitivity, due to suppression of the band
broadening that occurs when the fraction is transferred to the 2D. However, in practice, it is
rather difficult to achieve. For instance, the aqueous-organic mobile phases that are used in 2D
reversed-phase (RP) - hydrophilic interaction liquid chromatography (HILIC) systems are
miscible. However, the RP×HILIC combination still presents significant solvent-strength
mismatch problems. In this case, an organic-solvent-rich 1D mobile phase would act as a strong
solvent in a RP 2D, whereas a water-rich mobile phase used as a weak eluent in a RP 1D would
act as a strong eluent in a HILIC 2D. This would cause reduced retention, increased band
broadening and asymmetrical or even split peaks.20,37
Moreover, if the solvents used as mobile phases are not completely miscible, serious
difficulties could arise, resulting in some separation modes being almost impossible to
combine.8 For instance, coupling normal-phase (NP) and reversed-phase (RP) liquid
chromatography – a combination that in terms of orthogonality is very useful – is generally not
easy to achieve due to mobile-phase immiscibility. In this case, if RP were to constitute the 1D,
the high concentrations of water in the RP mobile phase would almost certainly deactivate the
polar adsorbent of the 2D NP column, since NP utilizes non-aqueous mobile phase (e.g. n-
hexane).15
The design of the interface is of primary importance for systems in which the separation
modes are difficult to combine. Over the last decade, a number of interfaces have been
suggested, including interfaces incorporating trapping columns,26,27,29–31,38,39 or collection of
low-volume fractions from a 1D capillary monolithic column.37 More sophisticated approaches
utilize a vacuum-evaporation interface for on-line evaporation of the 1D solvents from the
loop,40 or thermally-assisted modulation exploiting the influence of temperature on analyte
retention.41,42 While each of these approaches has unique advantages for solving the problem

Introduction
21
of mobile-phase incompatibility, these technologies are still not developed to the extent where
they could be used universally in routine LC×LC analyses.
An approach that is more generally applied is the use of an additional solvent flow (so-
called make-up flow) to allow modification of the solvent composition between dimensions by
diluting the collected 1D fraction with a weaker 2D mobile phase. However, this requires a good
mixing device at the interface between the two columns. Referring to the above discussion, in
order to be able to cope with solvent incompatibility and efficiently perform all required
manipulations with the 1D effluent at the interface between two dimensions, the mixing device
must satisfy three strict conditions. First, it should provide fast mixing in-line at different ratios
over a wide range of flow rates compatible with typical flow rates used in 2D-LC; thus, the
efficiency of the mixing mechanism should not depend on the flow rate, under which the
mixing is happening. Second, a mixer for modulation should have a small volume so as not to
contribute to the extra column-band broadening. Finally, the mixer must be able to withstand
brief pressure pulses of up to a few hundred bar, due to its connection to switching valves used
to shuttle sample from the 1D to the 2D. This is why we chose to use small-volume microfluidic
devices as mixers that are placed in the interface between two dimensions.
Intr
od
uct
ion

Microfluidic Tools for Multidimensional Liquid Chromatography
22
Microfluidics
Microfluidic technology is an area of scientific research which involves the manipulation of
small (µL and nL) amounts of fluids in micrometer-size channels. It has received growing
interest over the last twenty years, due to its promising implementation in both industrial and
academic fields, especially in applications related to analytical chemistry, and cell or medical
biology. Microfluidic systems are often called “miniaturized total analysis systems” (μTAS) or
“lab-on-a-chip” devices. The main advantages of these systems include a significant reduction
in the amount of samples, reagents and waste products, faster analysis, limited costs, good
sensitivity, small size (portability), and minimal dead volume.43,44
Nowadays, microchip technology has entered the arena of scientific research as an
attractive tool to improve or even replace conventional ‘macro’ analytical techniques. The
development of chip-based microfluidic devices for integration in LC or LC-MS systems has
increased especially in the last decade45–50 as a result of the miniaturization trend in separation
science. In addition to the many benefits of device miniaturization mentioned above,
increased separation efficiency is an expected consequence of the incorporation of
microfluidic components into multi-dimensional LC separation systems. Performance in
many other applications can be enhanced by the increased surface-to-volume ratios of
microchannels, which facilitate high-speed reactions or interactions due to the increased
surface available. Processes can be run at length scales that are more relevant for normal
biological conditions (e.g. microfluidic channels can mimic blood capillaries). Throughput
(defined as samples per unit time) can also be improved if large numbers of samples can
be processed in parallel.51
Nowadays, there are a great variety of materials, fabrication methods, and techniques
available for the development of microfluidic devices. The most important of these will be
described in more detail below.
Materials for microfluidic-device fabrication
Because microfabrication techniques for the first microfluidic devices were adapted from the
microelectronics industry, they were fabricated in glass and silicon using a combination of
planar fabrication techniques (photolithography, thin-film metallization, and chemical
etching).52,53 Both Si and glass possess important characteristics, such as chemical inertness
and excellent thermal stability, and can be used if the application of high temperatures or
organic solvents are required.54,55 Glass is an important material for the fabrication of

Introduction
23
microfluidic devices due to its optical transparency, and the fact that it is available in various
compositions (e.g. fused silica, Pyrex, soda lime glass). Moreover, it is widely used as a
substrate for microchannels, as well as for device covers, often in combination with other
materials, as it allows microchannels and their contents to be directly observed under a
microscope.
The surface characteristics of oxidized silicon and glass can be beneficial for many
applications, due not only to the chemical inertness of these materials, but also because of the
possibility of chemically modifying surfaces using a host of different silane chemistries. The
high electrical resistance of glass also allows the application of high electric fields for induction
of electro-osmotic flow, an easily implemeneted mechanism for fluid propulsion in
microchannels, However, devices fabricated in these materials are not always easily
implemented for applications with living mammalian cells.55 The fact that glass and silicon are
not gas-permeable, for instance, means that perfusion media must be pre-equilibrated with
oxygen and other gases before introduction into a micro cell-culture device. Moreover,
conventional optical detection methods cannot be used for devices fabricated in silicon,
because silicon is opaque to visible and ultraviolet light.56 Besides, the fabrication of devices
from these materials is a time-consuming process that requires a cleanroom environment.53
Nowadays silicon and glass have largely been displaced by polymers (elastomers, such
as PDMS1) and thermoplastics (e.g. PMMA, COC, PC2) that have advantages such as optical
transparency, non-toxicity and lower costs. Besides, they are chemically quite inert (though
they are susceptible to surface softening and swelling in certain organic solvents), and have
good mechanical properties (they are not fragile).54,57 In general, the components required for
lab-on-a-chip devices are easier to fabricate in elastomers than in rigid, thermoplastic materials.
This is because the former materials can be easily cast in solution form onto molds to replicate
microchannels.56
Polydimethylsiloxane (PDMS), an elastomeric silicone rubber, has widened the
possibilities for utilization of microfluidic devices and has sped up their development in the
academic microfluidics community. This is due to its low cost, robustness and the
straightforward fabrication by replication of devices that it enables.52,58,59 PDMS cures at low
temperatures, is flexible (it is a soft elastomer), and is optically transparent down to 280 nm
1 PDMS - poly(dimethylsiloxane) 2 PMMA - polymethylmethacrylate; PC – polycarbonate; COC – cyclic olefin copolymer.
Intr
od
uct
ion

Microfluidic Tools for Multidimensional Liquid Chromatography
24
(which makes UV/Vis absorbance and fluorescence detection feasible).52,53 In addition, it is
non-toxic (allowing cultivation of mammalian cells in unmodified devices), commercially
available, reasonably inert from a chemical perspective, and durable. All of these qualities have
made PDMS a material of choice for many microfluidic applications, especially in the
exploratory stages of research projects involving device development.59
Of course, some properties of PDMS may be disadvantageous for certain applications.
For example, the elastomeric nature of PDMS may cause microchannels to expand or even tear
at high flow rates or under high pressures.60,61 The utilization of PDMS is also limited by its
incompatibility with many organic solvents.62,63 In addition, non-specific adsorption to the
relatively hydrophobic PDMS surface may occur when working with biological samples,
leading to fouled surfaces having undefined compositions.62
Table 1. Comparison between the most used materials for fabrication of microfluidic devices.
Material Advantages Disadvantages
Silicon chemically inert;
excellent thermal stability53
Opaque to visible and ultraviolet light;55
fabrication is a time-consuming process
that requires a cleanroom environment52
Glass
(pyrex and
fused silica)
chemically inert; optically
transparent; wide availability
in various sizes and chemical
compositions53
relatively expensive material; device
fabrication is a time-consuming process52
requiring a cleanroom environment
PDMS
optically transparent; soft
elastomer; ease in fabrication;
gas permeability;
inexpensive, biocompatible
and non-toxic51,57,58
not pressure-resistant due to elastomeric
nature;58 incompatibility with some
organic solvents;61,62 absorption of small
molecules into the matrix;58 modified
surfaces are generally unstable over time
as the modification wears off58
Thermoplastics
(PMMA, PC,
COC etc.)
low material cost; can easily
be adapted for mass
production;63,64 optically
clear; non-toxic; excellent
chemical inertness; superior
mechanical qualities53,56
surface chemistry control required; often
incompatible with organic solvents and
low-molecular-weight organic solutes;51
generally incompatible with temperatures
greater than 170°C65
Thermoplastics3 are gaining more interest, due to the broad range of material parameters
and surface chemical properties offered, allowing for optimal material selection and, thus,
tailoring of a device to the required application.64,65 Compared to silicon and glass, they are
3 A polymer material that becomes pliable or moldable above a specific temperature and solidifies upon cooling.
Introduction
25
less expensive and can be rapidly implemented in manufacturing processes for mass
production. The need to control the chemistry of the polymer surface makes these materials a
somewhat disadvantageous choice sometimes for microfluidic devices (compared to silicon or
glass). Many thermoplastics also exhibit incompatibility with organic solvents, which tend to
adsorb onto or absorb into the polymer substrate, creating some issues in real applications.
Thermoplastics also generally cannot be used at high temperatures (greater than 170 C66), as
they will tend to soften and deform.52
Table 1 summarizes the most-used materials for microfluidic devices together with their
advantages and disadvantages.
Fabrication techniques
The selection of the microfabrication method is a crucial step in the development of any
microfluidic system. This choice depends on the compatibility of the material with the (reagent)
solutions used, as well as the requirements set for the final product, e.g. the feature resolution,
thermal or pressure resistance, and the time available for device fabrication. The costs for
device fabrication is also considered as an important factor, because for some fabrication
methods the manufacturing costs for one device can be higher (e.g. due to the initial cost of
making the molds) than for the mass production of this device for commercial purposes.
Today the most common fabrication techniques for microfluidic devices are replica
molding (soft lithography),43,52 injection molding,67–69 hot embossing,70,71 and
stereolithography.72 The first three approaches can be regarded as indirect fabrication
techniques, in that the actual fabrication involves making a mold for replicating microchannels.
Once the mold is made, polymer solutions are cast onto it and allowed to cure (as is done with
elastomeric compounds) to form microchannels, or the mold is pressed into a hard polymer
layer which has been softened at elevated temperature to form microfluidic features. In
contrast, stereolithography involves the direct formation of microchannels through patterning
in the center of a mass of light-sensitive material with a focused laser. Other direct fabrication
methods also exist, such as laser micromachining (laser ablation),73,74 wet/dry etching after
photolithographic patterning75 and micromilling.76 In all of these latter examples, microchannel
formation is achieved by removing material from a substrate. An overview of these methods is
given in Table 2 and they are schematically presented in Figure 4.
Intr
od
uct
ion

Microfluidic Tools for Multidimensional Liquid Chromatography
26
Figure 4. Overview of main fabrication methods for microfluidic devices with their advantages (+) and
disadvantages (-).Modified from 59.
Certain methods are more suited than others to the rapid prototyping of devices, an
important step in many projects involving the use of microfluidics for new applications.
Injection molding and hot embossing can be considered as fast, but they are expensive methods
for polymer-device prototyping, due to the high initial cost of making the molds. Having molds
made can also result in significant waiting times of at least several weeks before a design can
be tested. On the other hand, glass/silicon micromachining processes based on wet/dry etching
create high-precision structures, but are technically demanding and time consuming.59
Although it is possible to achieve the widest range of features for making complex 3D
structures with micromilling, stereolithography (3D-printing) and laser ablation, these
techniques offer relatively low resolution (around 20-60 µm), generate surface roughness, and
yield limited numbers of produced devices, due to the inherent slowness of the sequential
fabrication process.59 Besides, 3D-printers with the highest resolution usually need supporting
materials to fill the void spaces (i.e., a channel) during the printing process, and the removal of
this materials from a very small channel (less than 60 µm in depth) is very difficult and
sometimes even impossible process for designs with complex channel structures.77
To date, however, the most common technique used for prototyping remains soft
lithography, a rapid-prototyping process which is based on replica molding. As was
mentioned above, it is this method that primarily makes use of PDMS. This is thanks to
the extremely precise replication of all the features on a mold surface with resolution in

Introduction
27
the nm range, but without the need for expensive equipment or advanced skills in
microfabrication.78
All the methods that are listed in Table 2, except stereolithography, suffer from one
inherent drawback. They enable the creation of an open 2D channel network in the substrate
surface that has to be hermetically sealed (closed or bonded to a second chip acting as a cover)
in order to obtain a microfluidic channel. Bonded interfaces between chips tend to form a weak
point for any high-pressure application, as it is typically the bond itself that fails first when
higher pressures are applied. Developed more than a decade ago, Femtosecond Laser
Irradiation followed by Chemical Etching (FLICE),79 also called Selective Laser-Induced
Etching (SLE),80,81 has appeared as a novel powerful alternative approach for direct fabrication
of complex 3D structures inside a solid transparent material, such as fused silica. Being a direct
fabrication technique inside the solid piece of material, SLE provides an appealing solution for
avoiding the chip-sealing step. The SLE technique also allows the fabrication of glass devices
with higher resolution (10-20 µm) than is possible with wet etching, allowing the unique
properties of glass (transparency, rigidity, inertness and so on) to be exploited in devices with
finer structuring.
Intr
od
uct
ion
Microfluidic Tools for Multidimensional Liquid Chromatography
28
Table 2. An overview of the most used methods for microfluidic devices fabrication.59,76
Hot-embossing Injection
molding Micromilling
3D-printing
(stereolithography)
Wet/dry
etching
Laser micromachining
(laser ablation)
Rapid prototyping
(soft-lithography)
Type Indirect Indirect Direct Direct Direct Direct Indirect
Materials polymeric materials thermoplastics metals and
plastics
Photo curable
polymeric resins,
ceramics
glass/silicon ceramics, metals, and
polymers
elastomers; epoxy
resins
General
polymer substrate is
softened at elevated
temperature and then
pressed against a mold
under pressure to
transfer the desired
features from the mold
to the polymer
melted polymer
is injected into a
microstructured
mold and
thendemolded
after cooling
microsize
features are
structured by
removing bulk
material using
special cutting
tools (end mills)
3D parts are created
in bulk photosensitive
material using a light
source (e.g. a laser)
remove the
substrate
material from a
wafer by means
of etching with
abrasive
chemical or
plasma gases
a high-powered pulsed
laser is used to remove
material from the
polymer substrate
(through a mask or by
using a laser direct-write
process)
a prepolymer solution
is cast onto a mold
and is cross-linked
with heat or
ultraviolet (UV)
light; the resulting
polymer is peeled off
the mold
Advantages
fast; high-throughput;
precise; rapid
replication of small
(low micrometer) to
medium-size features
with high aspect ratio;
mass production
Fast, high-
throughput when
the final design
has been
established;
enables complex
3D geometry;
highly automated
fast transfer of
designs into
prototypes;
cost-accessible;
enabling
complex 3D
geometry
enables complex 3D
features (accuracy of
20-60 µm) that may
be impossible with
other methods
enables small
features with
good resolution
cost-accessible;
enables complex 3D-
multilayer structures;
mass production
easy; economical;
fast; high resolution
(few nm); possibility
to create 3D features
Dis-
advantages
expensive due to the
initial cost of making
the molds; restricted to
thermoplastics,
difficult to fabricate
complex 3D structures;
relatively long cycle
times
expensive due to
the initial cost
and time of
making the
molds; limited to
thermoplastics
limited
throughput due
to the inherent
serial nature59;
low resolution
(around 100
µm); surface
roughness
expensive equipment
and material;
limited material
availability; materials
are brittle
technically
demanding;
time-consuming
limited number of
produced devices due to
the inherent feature of
the sequential process;
low resolution (~50 µm);
surface roughness; the
surface chemistry of the
final products is very
different due to laser
treatment
devices are
vulnerable under
higher applied
pressures due to
microchannel
deformation

Introduction
29
Mixing at the microscale
As described above, miniaturization provides many attractive features that separation science
can use for its own benefit. However, some phenomena that are not very relevant in the macro
world, play an important role in micrometer-sized devices. For example, on a large scale, fluids
mix convectively resulting in turbulent flow patterns (think here of milk when it is swirled into
coffee). In this example inertia is more important than viscosity, which is true for most fluids
in the macro world. However, at the microscale this situation is reversed, and viscosity
dominates in microchannels, leading to laminar flow due to the small masses of fluids involved.
This means that turbulence tends not to be exhibited in microsystems, except at flow rates
which are so extremely high that many devices would not survive the high pressures generated
as a result. When two fluids meet in the microchannel under laminar flow conditions, they flow
side-by-side, without agitation or disruptions.56 This makes mixing at the microscale a
challenging task. In such systems, the mixing can be achieved only by diffusion, which is a
passive and slow transport process where molecules of two fluid streams move across their
interface.82
To overcome the problem of mixing at the microscale, a large number of micromixers
have already been developed. All of these work on the fundamental principle of increasing
contact areas between the solutions to be mixed, so as to reduce distances that molecules need
to diffuse to achieve mixing.82–84 Micromixers can be divided into two big groups, comprising
either passive or active mixers. This classification is based on the mechanism by which the
solution interfaces are disrupted to achieve larger contact areas. In active mixers, the need for
integration of elements for transferring energy from an external source into the mixing chamber
complicates the fabrication process, limiting the implementation of such devices. In addition,
the external forces involved in these mixers can negatively influence the samples studied (e.g.
acoustic waves can generate heat, which could lead to unwanted reactions or damage of
biological samples).82 Passive micromixers, on the other hand, generally function either by
splitting solution flows into multiple thinner streams in a branched channel network, or by
placing fixed obstacles in the flow to perturb laminar flow patterns. This makes passive
micromixing, which requires no moving parts and, thus, no external energy (other than that
required to displace solutions through microchannels), a more preferable choice for many
applications. The reader is referred to Chapter 2 of this thesis for a more in-depth discussion
about mixing on the microscale in micromachined devices.
Intr
od
uct
ion
Microfluidic Tools for Multidimensional Liquid Chromatography
30
Scope of the thesis
In this thesis, we have aimed to improve the performance of two-dimensional liquid
chromatography by using microfluidic devices fabricated by different microfabrication
techniques. We developed a small-volume microfluidic mixer that was implemented in the
interface between two columns in a 2D-LC instrument. The problem of the mobile phase
incompatibilities between dimensions was addressed by fast in-line mixing of the 1D effluent
with a weaker eluent inside the micromixer before it reached the second column. Because of
the small inner volume of our device (˂ 5 µL), we did not introduce extra dispersion to the 1D
effluent fraction.
In Chapter 2 we give a broad overview of already existing micromixers based on
chaotic advection, as well as chaotic advection combined with other principles, that have been
proposed over the last decade. We have emphasized the link between channel geometry,
operating flow conditions and the mixing mechanism adopted. We also describe the most
common application areas of passive chaotic micromixers using real examples. We discuss the
connection between channel geometry and possible areas of application under different flow
conditions, as this influences mixing efficiency.
In Chapter 3 we describe the development of microfluidic chaotic mixers with a small
volume for future applications in two-dimensional liquid chromatography. The PDMS
micromixer contains staggered herringbone grooves with an optimized geometry for fast
modification of mobile phases at different flow-rate ratios (1:2, 1:5 and 1:10). The
microchannel is 5 cm long and complete mixing is achieved within the first 3 cm of the channel.
The mixing is efficient over the whole range of flow rates tested (4-1000 μL/min).
The research described in Chapter 4 was aimed at the fabrication of a pressure-resistant
microfluidic mixer inside a solid piece of fused silica using Selective Laser-Induced Etching
(SLE). We report a chip containing herringbone grooves for chaotic advective mixing in a
channel with lengths up to 33 mm fabricated using SLE. The pressure tests showed that fused
silica chips can withstand pressures up to 85 bar.
In Chapter 5, we successfully implemented a microfluidic micromixer in the interface
of a two-dimensional liquid chromatograph for analysis of real samples. For this research we
used a microfluidic mixer with herringbone grooves fabricated in COC using micromilling.
Using a custom-designed, robust, low-dead-volume interface, a chip was directly coupled to

Introduction
31
the chromatographic equipment. This design could withstand pressure pulses up to 150 bar. A
microfluidic mixer was implemented in a 2D HILIC×RP-LC system and an improved
separation of nylon polymers was obtained compared to the system without a mixer.
In Chapter 6 we summarize and discuss the findings of the research presented in this
thesis. We present future perspectives on the use of microfluidic technology for improving
conventional multidimensional chromatographic techniques.
Intr
od
uct
ion

Microfluidic Tools for Multidimensional Liquid Chromatography
32
References
1. Dugo, P., Cacciola, F., Kumm, T., Dugo, G. & Mondello, L. Comprehensive multidimensional liquid
chromatography: Theory and applications. J. Chromatogr. A 1184, 353–368 (2008).
2. Wehr, T., Resources, L. C., Group, T., Llc, R. & Creek, W. Liquid Chromatography in Proteomic Studies.
LC GC Eur. 20, 2–8 (2003).
3. Shen, Y. et al. Automated 20 kpsi RPLC-MS and MS/MS with chromatographic peak capacities of 1000-
1500 and capabilities in proteomics and metabolomics. Anal. Chem. 77, 3090–3100 (2005).
4. Shen, Y. et al. Packed capillary reversed-phase liquid chromatography with high-performance electrospray
ionization fourier transform ion cyclotron resonance mass spectrometry for proteomics. Anal. Chem. 73,
1766–1775 (2001).
5. Eeltink, S. et al. High-efficiency liquid chromatography-mass spectrometry separations with 50mm,
250mm, and 1m long polymer-based monolithic capillary columns for the characterization of complex
proteolytic digests. J. Chromatogr. A 1217, 6610–6615 (2010).
6. Stoll, D. R. et al. Fast, comprehensive two-dimensional liquid chromatography. J. Chromatogr. A 1168,
3–43; discussion 2 (2007).
7. Erni, F. & Frei, R. W. Two-dimensional column liquid chromatographic technique for resolution of
complex mixtures. J. Chromatogr. A 149, 561–569 (1978).
8. François, I., Sandra, K. & Sandra, P. Comprehensive liquid chromatography: Fundamental aspects and
practical considerations-A review. Anal. Chim. Acta 641, 14–31 (2009).
9. Bushey, M. M. & Jorgenson, J. W. Automated instrumentation for comprehensive two-dimensional high-
performance liquid chromatography of proteins. Anal. Chem. 62, 161–167 (1990).
10. Phillips, J. B. & Beens, J. Comprehensive two-dimensional gas chromatography: A hyphenated method
with strong coupling between the two dimensions. J. Chromatogr. A 856, 331–347 (1999).
11. Schoenmakers, P., Marriott, P. & Beens, J. Nomenclature and conventions in comprehensive
multidimensional chromatography. LCGC Eur. 25, 1–4 (2003).
12. Groskreutz, S. R., Swenson, M. M., Secor, L. B. & Stoll, D. R. Selective comprehensive multi-dimensional
separation for resolution enhancement in high performance liquid chromatography. Part I: Principles and
instrumentation. J. Chromatogr. A 1228, 31–40 (2012).
13. Mondello, L., Lewis, C. & Bartle, K. D. Multidimensional chromatography. Analytical and Bioanalytical
Chemistry 407, (Biddles Ltd, Guildford and King’s Lynn., 2002).
14. Stoll, D. R. et al. Fast, comprehensive two-dimensional liquid chromatography. J. Chromatogr. A 1168,
3–43 (2007).
15. Jandera, P. Comprehensive two-dimensional liquid chromatography — practical impacts of theoretical
considerations. A review. Cent. Eur. J. Chem. 10, 844–875 (2012).
16. Pirok, B. W. J., Gargano, A. F. G. & Schoenmakers, P. J. Optimizing separations in online comprehensive
two-dimensional liquid chromatography. J. Sep. Sci. 41, 68–98 (2018).
17. Murphy, R. E., Schure, M. R. & Foley, J. P. Effect of Sampling Rate on Resolution in Comprehensive
Two-Dimensional Liquid Chromatography. Anal. Chem. 70, 1585–1594 (1998).
18. Horie, K. et al. Calculating optimal modulation periods to maximize the peak capacity in two-dimensional
HPLC. Anal. Chem. 79, 3764–3770 (2007).
19. Vivo-Truyols, G., van der Wal, S. & Schoenmakers, P. J. Comprehensive Study on the Optimization of
Online Two-Dimensional Liquid Chromatographic Systems Considering Losses in Theoretical Peak
Capacity in 1st- and 2nd-Dimensions A Pareto-Optimality Approach.pdf. Anal. Chem. 82, 8525–8536
(2010).
20. Dugo, P., Favoino, O., Luppino, R., Dugo, G. & Mondello, L. Comprehensive Two-Dimensional Normal-
Phase (Adsorption)-Reversed-Phase Liquid Chromatography. Anal. Chem. 76, 2525–2530 (2004).
21. Jandera, P. et al. Two-dimensional liquid chromatography normal-phase and reversed-phase separation of
(co)oligomers. J. Chromatogr. A 1119, 3–10 (2006).
22. Van Der Horst, A. & Schoenmakers, P. J. Comprehensive two-dimensional liquid chromatography of
polymers. J. Chromatogr. A 1000, 693–709 (2003).
23. Ikegami, T. et al. Two-dimensional reversed-phase liquid chromatography using two monolithic silica C18
columns and different mobile phase modifiers in the two dimensions. J. Chromatogr. A 1106, 112–117
(2006).
24. Gray, M. J., Dennis, G. R., Slonecker, P. J. & Shalliker, R. A. Utilising retention correlation for the
separation of oligostyrenes by coupled-column liquid chromatography. J. Chromatogr. A 1073, 3–9
(2005).

Introduction
33
25. Venkatramani, C. J. & Zelechonok, Y. An automated orthogonal two-dimensional liquid chromatograph.
Anal. Chem. 75, 3484–3494 (2003).
26. Venkatramani, C. J. & Patel, A. Towards a comprehensive 2-D-LC-MS separation. J. Sep. Sci. 29, 510–
518 (2006).
27. Cacciola, F., Jandera, P., Hajdú, Z., Česla, P. & Mondello, L. Comprehensive two-dimensional liquid
chromatography with parallel gradients for separation of phenolic and flavone antioxidants. J.
Chromatogr. A 1149, 73–87 (2007).
28. François, I. et al. Tryptic digest analysis by comprehensive reversed phasextwo reversed phase liquid
chromatography (RP-LCx2RP-LC) at different pH’s. Journal of separation science 32, 1137–44 (2009).
29. Holm, A. et al. Combined solid-phase extraction and 2D LC-MS for characterization of the neuropeptides
in rat-brain tissue. Anal. Bioanal. Chem. 382, 751–759 (2005).
30. Pepaj, M., Wilson, S. R., Novotna, K., Lundanes, E. & Greibrokk, T. Two-dimensional capillary liquid
chromatography: pH Gradient ion exchange and reversed phase chromatography for rapid separation of
proteins. J. Chromatogr. A 1120, 132–141 (2006).
31. Cacciola, F., Jandera, P., Blahová, E. & Mondello, L. Development of different comprehensive two
dimensional systems for the separation of phenolic antioxidants. J. Sep. Sci. 29, 2500–2513 (2006).
32. François, I., de Villiers, A., Tienpont, B., David, F. & Sandra, P. Comprehensive two-dimensional liquid
chromatography applying two parallel columns in the second dimension. J. Chromatogr. A 1178, 33–42
(2008).
33. Wagner, K., Miliotis, T., Bischoff, R. & Unger, K. K. An Automated On-Line Multidimensional HPLC
System for Protein and Peptide Mapping with. Anal. Chem. 74, 809–820 (2002).
34. Li, D., Jakob, C. & Schmitz, O. Practical considerations in comprehensive two-dimensional liquid
chromatography systems (LCxLC) with reversed-phases in both dimensions. Anal. Bioanal. Chem. 407,
153–167 (2015).
35. Jandera, P., Hájek, T. & Česla, P. Effects of the gradient profile, sample volume and solvent on the
separation in very fast gradients, with special attention to the second-dimension gradient in comprehensive
two-dimensional liquid chromatography. J. Chromatogr. A 1218, 1995–2006 (2011).
36. Hoffman, N. E., Pan, S. L. & Rustum, A. M. Injection of eluites in solvents stronger than the mobile phase
in reversed-phase liquid chromatography. J. Chromatogr. A 465, 189–200 (1989).
37. Jandera, P., Hájek, T., Staňková, M., Vyňuchalová, K. & Česla, P. Optimization of comprehensive two-
dimensional gradient chromatography coupling in-line hydrophilic interaction and reversed phase liquid
chromatography. J. Chromatogr. A 1268, 91–101 (2012).
38. Cao, L. et al. The development of an evaluation method for capture columns used in two-dimensional
liquid chromatography. Anal. Chim. Acta 706, 184–190 (2011).
39. Gargano, A. F. G., Duffin, M., Navarro, P. & Schoenmakers, P. J. Reducing Dilution and Analysis Time
in Online Comprehensive Two-Dimensional Liquid Chromatography by Active Modulation. Anal. Chem.
88, 1785–1793 (2016).
40. Tian, H.-Z., Xu, J. & Guan, Y.-F. Vacuum-evaporation Interface of Comprehensive Two-dimensional
Liquid Chromatography and Its Application. Chinese Journal of Analytical Chemistry 36, 860–864 (2008).
41. Verstraeten, M., Pursch, M., Eckerle, P., Luong, J. & Desmet, G. Thermal modulation for
multidimensional liquid chromatography separations using low-thermal-mass liquid chromatography
(LC). Anal. Chem. 83, 7053–7060 (2011).
42. Van de Ven, H. C., Gargano, A. F. G., Van der Wal, S. J. & Schoenmakers, P. J. Switching solvent and
enhancing analyte concentrations in small effluent fractions using in-column focusing. J. Chromatogr. A
1427, 90–95 (2016).
43. Duffy, McDonald, J., Schueller, O. & Whitesides, G. Rapid prototyping of microfluidic systems in poly
(dimethylsiloxane). Anal. Chem (1998).
44. Nguyen, N.-T. & N.-T. Nguyen. Micromixers: Fundamentals, Design and Fabrication. Igarss 2014
(William Andrew Publishing, 2011). doi:10.1016/B978-1-4377-3520-8.00001-2
45. Lin, S.-L., Bai, H.-Y., Lin, T.-Y. & Fuh, M.-R. Microfluidic chip-based liquid chromatography coupled to
mass spectrometry for determination of small molecules in bioanalytical applications: An update.
Electrophoresis 35, 1275–1284 (2014).
46. Dietze, C., Hackl, C., Gerhardt, R., Seim, S. & Belder, D. Chip-based electrochromatography coupled to
ESI-MS detection. Electrophoresis 37, 1345–1352 (2016).
47. Yin, H. et al. Microfluidic chip for peptide analysis with an integrated HPLC column, sample enrichment
column, and nanoelectrospray tip. Anal. Chem. 77, 527–533 (2005).
48. Sung, W. C., Makamba, H. & Chen, S. H. Chip-based microfluidic devices coupled with electrospray
ionization-mass spectrometry. Electrophoresis 26, 1783–1791 (2005).
Intr
od
uct
ion

Microfluidic Tools for Multidimensional Liquid Chromatography
34
49. Ro, K. W., Liu, J. & Knapp, D. R. Plastic microchip liquid chromatography-matrix-assisted laser
desorption/ionization mass spectrometry using monolithic columns. J. Chromatogr. A 1111, 40–47 (2006).
50. Bai, H.-Y., Lin, S.-L., Chan, S.-A. & Fuh, M.-R. Characterization and evaluation of two-dimensional
microfluidic chip-HPLC coupled to tandem mass spectrometry for quantitative analysis of 7-
aminoflunitrazepam in human urine. Analyst 135, 2737 (2010).
51. Ehrnström, R. Miniaturization and integration: challenges and breakthroughs in microfluidics. Lab Chip
2, 26N–30N (2002).
52. McDonald, J. C. et al. Fabrication of microfluidic systems in poly(dimethylsiloxane). Electrophoresis 21,
27–40 (2000).
53. Whitesides, G. M. & Stroock, A. D. Flexible methods for microfluidics. Phys. Today 54, 42 (2001).
54. Lavrik, N. V., Taylor, L. T. & Sepaniak, M. J. Nanotechnology and chip level systems for pressure driven
liquid chromatography and emerging analytical separation techniques: A review. Anal. Chim. Acta 694,
6–20 (2011).
55. Wu, J. & Gu, M. Microfluidic sensing: state of the art fabrication and detection techniques. J. Biomed.
Opt. 16, 080901 (2011).
56. Whitesides, G. M. The origins and the future of microfluidics. Nature 442, 368–373 (2006).
57. Wu, J. & Gu, M. Microfluidic sensing: state of the art fabrication and detection techniques. J. Biomed.
Opt. 16, 080901 (2011).
58. Ng, J. M. K., Gitlin, I., Stroock, A. D. & Whitesides, G. M. Components for integrated
poly(dimethylsiloxane) microfluidic systems. Electrophoresis 23, 3461–3473 (2002).
59. Sollier, E., Murray, C., Maoddi, P. & Di Carlo, D. Rapid prototyping polymers for microfluidic devices
and high pressure injections. Lab Chip 11, 3752 (2011).
60. Schneider, F., Draheim, J., Kamberger, R. & Wallrabe, U. Process and material properties of
polydimethylsiloxane (PDMS) for Optical MEMS. Sensors Actuators, A Phys. 151, 95–99 (2009).
61. Martin, A., Teychené, S., Camy, S. & Aubin, J. Fast and inexpensive method for the fabrication of
transparent pressure-resistant microfluidic chips. Microfluid. Nanofluidics 20, 1–8 (2016).
62. Stroock, A. Components for integrated poly (dimethylsiloxane) microfluidic systems. Electrophoresis 23,
3461–3473 (2002).
63. Favre, E. Swelling of crosslinked polydimethylsiloxane networks by pure solvents: Influence of
temperature. 32, 1183–1188 (1996).
64. Jena, R. K., Yue, C. Y. & Lam, Y. C. Micro fabrication of cyclic olefin copolymer (COC) based
microfluidic devices. Microsyst. Technol. 18, 159–166 (2012).
65. Tsao, C. W. & DeVoe, D. L. Bonding of thermoplastic polymer microfluidics. Microfluid. Nanofluidics 6,
1–16 (2009).
66. Topas. TOPAS- Cyclic Olefin Copolymers. 4 (2015).
67. Heckele, M. & Schomburg, W. K. Review on micro molding of thermoplastic polymers. J.
Micromechanics Microengineering 14, (2004).
68. Giboz, J., Copponnex, T. & Mélé, P. Microinjection molding of thermoplastic polymers: a review. J.
Micromechanics Microengineering 17, R96–R109 (2007).
69. Attia, U. M., Marson, S. & Alcock, J. R. Micro-injection moulding of polymer microfluidic devices.
Microfluid. Nanofluidics 7, 1–28 (2009).
70. Peng, L., Deng, Y., Yi, P. & Lai, X. Micro hot embossing of thermoplastic polymers: A review. J.
Micromechanics Microengineering 24, (2014).
71. Becker, H. & Heim, U. Hot embossing as a method for the fabrication of polymer high aspect ratio
structures. Sensors Actuators, A Phys. 83, 130–135 (2000).
72. Melchels, F. P. W., Feijen, J. & Grijpma, D. W. A review on stereolithography and its applications in
biomedical engineering. Biomaterials 31, 6121–30 (2010).
73. Locascio, L. E., Ross, D. J., Howell, P. B. & Gaitan, M. Fabrication of polymer microfluidic systems by
hot embossing and laser ablation. Methods Mol Biol., 339, 37–46 (2006).
74. Malek, C. G. K. Laser processing for bio-microfluidics applications (part I). Anal. Bioanal. Chem. 385,
1362–1369 (2006).
75. Misra, A., Hogan, J. D. & Chorush, R. Wet and Dry Etching Materials. Handb. Chem. Gases Semicond.
Ind. 1–5 (2002). doi:10.1002/0471263850.mis056
76. Guckenberger, D. J., de Groot, T. E., Wan, A. M. D., Beebe, D. J. & Young, E. W. K. Micromilling: a
method for ultra-rapid prototyping of plastic microfluidic devices. Lab Chip 15, 2364–2378 (2015).
77. Chen, C. et al. 3D-printed Microfluidic Devices: Fabrication, Advantages and Limitations—a Mini
Review. 8, 6005–6012 (2017).

Introduction
35
78. Whitesides, G. M., Ostuni, E., Takayama, S., Jiang, X. & Ingber, D. E. Soft Lithography in Biology and
Biochemistry. Annu. Rev. Biomed. Eng. 3, 335–373 (2001).
79. Matsuo, S., Tabuchi, Y., Okada, T., Juodkazis, S. & Misawa, H. Femtosecond laser assisted etching of
quartz: Microstructuring from inside. Appl. Phys. A Mater. Sci. Process. 84, 99–102 (2006).
80. Gottmann, J., Hermans, M., Repiev, N. & Ortmann, J. Selective laser-induced etching of 3D precision
quartz glass components for microfluidic applications-up-scaling of complexity and speed. Micromachines
8, (2017).
81. Hermans, M., Gottmann, J. & Riedel, F. Selective, laser-induced etching of fused silica at high scan-speeds
using KOH. J. Laser Micro Nanoeng. 9, 126–131 (2014).
82. Capretto, L., Wei Cheng, M. H. & Zhang, X. Micromixing Within Microfluidic Devices. TripleC 304, 27–
68 (2011).
83. Nguyen, N.-T. & Wu, Z. Micromixers—a review. J. Micromechanics Microengineering 15, R1–R16
(2005).
84. Lee, C. Y., Wang, W. T., Liu, C. C. & Fu, L. M. Passive mixers in microfluidic systems: A review. Chem.
Eng. J. 288, 146–160 (2016).
Intr
od
uct
ion


Chapter II
Novel micromixers based on chaotic
advection and their application —a
review
Margaryta A. Ianovska1,2, Patty P.M.F.A. Mulder1, Elisabeth Verpoorte1
1Pharmaceutical Analysis, Groningen Research Institute of Pharmacy, University of
Groningen, The Netherlands
2 TI-COAST, Amsterdam, The Netherlands
Manuscript in preparation

Abstract
Over the last twenty years, microfluidic technology has received growing interest in a diverse
set of fields, including clinical diagnostics, genetic sequencing, chemical synthesis and
proteomics, all of which are applications in which mixing plays a central role. However, mixing
at the micrometer scale is not easily achieved, due to the dominance of laminar flow, a well-
ordered flow regime characterized by fluid streams flowing parallel to each other. Mixing of
the dissolved species in two neighbouring solution streams occurs by diffusion only. Given that
diffusion is inherently a slow process, and the contact area between laminarly flowing solutions
is limited to their contact interface, mixing in such a system is not particularly efficient. Thus,
specially designed micromixers that are used to overcome the challenges related to mixing in
laminar flows are an important part of many microfluidic platforms. All micromixers ultimately
have the same objective, namely to increase contact areas between the solutions to be mixed,
in order to shorten diffusion lengths and thus promote more efficient mixing. Chaotic advection
is one of the most efficient mechanisms to induce mixing, as it involves the generation of flow
patterns which dramatically thin solution layers. In this chapter we describe passive
micromixers that were proposed within the last decade, based on chaotic advection and its
combination with other mixing principles (e.g. split and recombination (=SAR)). We also
discuss the applications of different types of chaotic micromixers in chemical industry, biology,
and analytical chemistry. Furthermore, we draw the connection between the design and
potential application of recently reported micromixers.
Keywords: Microfluidics; Micromixing; Passive micromixers; Chaotic advection; Combined
principles; 3D convoluted channels; Application of the mixers.

Novel micromixers based on chaotic advection and their application —a review
39
1. Introduction
Microfluidic technology has received growing interest due to its promising application as an
enabling technology in both industrial and and academic science. The key advantage of
microfluidic systems is their small size, which means only small (µL or less) quantities of
chemicals are required for the (bio)chemical process or analysis in question.1 However, if we
introduce two liquids from neighbouring inlets into a single microfluidic channel, we will
observe that these two streams flow parallel to each other. Even if the microchannel has turns
integrated into it, these streams will pass through the turn without any visible mixing occurring
(that can continue for a distance of several meters at the flow rates used typically). This regime
is called laminar flow and it exists in all micrometer-size channels that operate under flow rates
of a few to hundreds of µL/min. In order to use such devices for applications in clinical
diagnostics, genetic sequencing and chemical synthesis, where mixing is central to the
application, this problem should be first overcome.
Basically, mixing can only be achieved by means of one process, molecular diffusion,
which is driven by the gradient formed between highly-concentrated and less-concentrated
regions of the molecules to be mixed. Diffusion results in mixing without requiring directed
bulk motion, and it is faster if the contact area between two regions is larger. However, in most
cases the fluids in the microchannel are introduced by means of a pump at a constant flow rate
and the molecules experience advection – molecular mass transfer by bulk motion of fluid that
occurs parallel to the direction of the main flow. Due to the laminar flow and constant movement
of fluids along the channel, the contact area between two streams is very small and the mixing
(diffusion) happens to a minimal degree only at the interface. With an increase in the flow rate
(faster movement of fluids), the residence time, or time that molecules spend in the channel,
will decrease further, leading to a further decline in both the degree and efficiency of mixing.
These effects will be discussed in more detail later (Sec.2.2.).
To overcome a problem with mixing at the microscale, a large number of micromixers
have been already developed.2–4 In general, the purpose of all micromixer designs is to increase
the contact area between fluid streams, and in this way, decrease the diffusion length, which
makes mixing by diffusion faster. Depending on the basic mixing principle being exploited,
micromixers can be divided into either the passive or active category. Active micromixers
utilize external energy to perturb flow patterns and achieve mixing. For this, an external power
Ch
ap
ter
II
Microfluidic Tools for Multidimensional Liquid Chromatography
40
source has to be integrated into the system, which complicates the fabrication process, and
possibly limits the implementation of such devices. In addition, the external forces involved in
this type of mixer can negatively influence the samples studied (e.g. acoustic waves can
degrade synthetic polymers or generate heat, which could lead to unwanted reactions or damage
if biological samples are involved).2 This makes passive micromixers, which do not require an
external source of energy beyond that needed for advective flow, a more preferable choice for
a wide range of applications.
Passive micromixers can be further classified according to one of the following mixing
mechanisms: 1) parallel lamination and 2) sequential lamination (split and recombination
(=SAR)), 3) focusing-enhanced (injection), 4) chaotic mixing and 5) droplet micromixers.2,3
Parallel and serial lamination micromixers first split the inlet flows of the solutions to be mixed
into n sub-streams and later recombine them into one flow. In the focusing-enhanced
micromixer, a single solute flow is split by injecting it into several solvent flows. In chaotic
advection, mixing is achieved through generation of chaotic flow patterns formed at an angle
to the main flow, as a result of special microchannel geometries. Passive micromixing in
droplets exploits an internal recirculating flow field induced by their transport in non-miscible
carrier phases.3
Micromixers based on chaotic advection provide for fluid stretching and folding over
the cross-section of the channel, and are especially effective in microfluidic devices.1 A
relatively new trend in mixer designs is the combination of chaotic advection with the SAR
principle, which utilizes so-called 3D convoluted channels that provide efficient mixing over a
large range of Reynold numbers (Re). In this chapter we will primarily describe and discuss
passive micromixers based on chaotic advection. The combination of chaotic advection with
other flow processing approaches to achieve fast microfluidic mixing over extended flow rate
ranges will also be briefly presented.
In our experience, designing a mixing device can be a time-consuming process, due to
the many design parameters that need to be taken into account, as well as the choice of material
and fabrication method, depending on the final application. Before endeavouring to make a new
micromixer from scratch, one should possess appropriate knowledge and a good understanding
of mixing at the microscale, as a lot of designs that work well have been already proposed.5–28
Our main goal in this chapter is to help the reader in that process by providing him or her with
a wide overview of existing micromixers based on chaotic advection and combined principles

Novel micromixers based on chaotic advection and their application —a review
41
that can be applied to a variety of fields. We present reported applications of these devices,
which include examples in chemistry, biology and analytical chemistry, to name but a few.
In Section 3 we will discuss the micromixers that have been the most used over the last
decade, presented according to geometric classification. We place an emphasis on the channel
geometry, flow conditions (described by Re) and the mechanism of mixing. In Section 4 we
will describe the most common application areas of passive chaotic micromixers with real
examples. In the Discussion section we will focus on the link between channel geometry and
possible area of application, at different flow conditions known to influence mixing efficiency.
Ch
ap
ter
II

Microfluidic Tools for Multidimensional Liquid Chromatography
42
2. Theory
2.1. Viscosity, inertia and the Reynolds number
There are two major forces that play an important role in the microchannels, namely viscous
and inertial forces. Both of them can be seen as a measure of resistance. In the case of viscosity,
this resistance appears due to frictional shear forces that arise during the motion of molecules.
When the fluid moves through a channel as the result of an applied pressure gradient, the
molecules of the fluid generally move more quickly in the region around the central axis of the
channel than near the walls. This difference in relative motion of the fluid layers results in
differing amounts of friction being manifested between layers. Informally, viscosity is said to
be related to the “thickness” of liquids and their resistance to flow. For example, water flows
more easily than honey because it has a lower viscosity than honey. Inertia, on the other hand,
is the resistance of a volume of fluid to change its state of motion or its velocity (the fluid
prefers to continue moving in a straight line at a constant velocity). The magnitude of the inertial
force in a fluid flow depends on the mass of the fluid, increasing as fluid mass increases.
The interplay of these two forces determines the flow regime at a given flow rate in any
type of channel and can be expressed as the Reynolds number (see Equation 1). The flow
regimes that govern the behaviour of fluids in channels can be broadly divided into laminar or
turbulent. The Reynolds number predicts the range of flow rates at which flow in a
microchannel changes from laminar to turbulent. It is expressed as a measure of the ratio of
inertial forces to viscous forces for a given set of flow conditions:
𝑅𝑒 =Inertial Forces
Viscous Forces=
v𝑑ℎρ
μ (1),
where dh denotes the hydraulic diameter of the channel (see Eqn. 2), v is average linear velocity
(m/s), ρ equals the density of the fluid (kg/m3) and μ represents the dynamic viscosity of the
fluid (kg/(ms)). In case of heterogeneous flow, an average density and an average viscosity
based on the proportion of each fluid in the mixture are calculated. The fully turbulent regime
starts at Re > 3000 (depending on channel diameter).
Using the Reynolds number (Re) makes it is possible to compare different designs under
the same flow conditions.
The hydraulic diameter can be calculated with the following equation:
𝑑ℎ =4𝐴
𝑃 (2),

Novel micromixers based on chaotic advection and their application —a review
43
where A is the cross-sectional area of the flow (mm2) and P is the perimeter of the cross-section
(mm).
For a channel with circular cross-section the hydraulic diameter is calculated using the radius
of the circular pipe (r, mm), yielding the following familiar relationship:
𝑑ℎ =4𝜋𝑟2
2𝜋𝑟= 2𝑟 (3),
The hydraulic diameter of a rectangular duct is:
𝑑ℎ =2𝑤ℎ
𝑤+ℎ (4),
where h is the channel height (mm) and w is the channel width (mm).
2.2. Forms of mass transport to achieve the mixing
In general, there exist four types of mass transport in miccrochannels, namely molecular
diffusion, eddy diffusion, advection, and Taylor dispersion.29 Eddy diffusion is the transport
of large solutes by turbulent flow, where turbulent flow is characterized by chaotic changes in
flow velocity. However, the dominance of viscous forces at the microscale at the flow rates
typically used makes turbulence difficult to achieve (Re ≤ 2000) and, hence, this type of mixing
is not relevant for micromixers.
Taylor dispersion refers to the dispersion of solutes at the front of an advancing solution
flow in a microfluidic channel. When a new solution is introduced into an already-filled
microchannel under pressure-driven flow conditions, the solution front quickly adopts the
parabolic velocity profile in the channel. As a result, the front of the new solution is drawn out
into the back end of the solution in front of it, creating concentration gradients of dissolved
compounds across the channel in a direction perpendicular to flow. Diffusion of species
between streamlines having different velocities (due to the parabolic profile of the flow),30
serves to further smear out the sharp concentration profile at the solution front. Because Taylor
dispersion occurs in the direction of flow, it can be seen as an interplay between advection and
diffusion. In the situation when the microchannel is already fully filled with a given solution,
and no new solutions need to be introduced, Taylor dispersion no longer is a parameter, which
needs to be taken into consideration when describing flows and concentration gradients. In fact,
concentration gradients will cease to exist once advective flow has served to fill the
microchannel entirely with one solution having a constant composition. However, it is worth
Ch
ap
ter
II

Microfluidic Tools for Multidimensional Liquid Chromatography
44
noting that at the interface between two fluid streams, Taylor dispersion is also dictated purely
by molecular diffusion.
The most important forms of mass transport at the microscale remain molecular
diffusion and advection. Molecular diffusion involves the random motion of molecules,
whereas molecular transport by advection sees molecules being carried in bulk flow. Diffusion
is a mass transfer phenomenon that causes the distribution of dissolved (bio)chemical species
to become more uniform in space as time passes. The driving force for diffusion is the thermal
motion of molecules, where molecules migrate from a region of high concentration to a region
of low concentration. Fick's first law of diffusion states that the magnitude of this molecular
flux is proportional to the concentration gradient thus formed, as expressed in the following
equation:
𝐽 = −𝐷∇𝑛 (5),
where J is the diffusion flux per unit area per unit time (mol/(m2×s)), D is the diffusion
coefficient (m2/s) and ∇n represents the relevant concentration gradient (mol/m4). The diffusion
coefficient, D, is a measure of the rate of the diffusion process. The average distance that a
molecule travels by diffusion in a given amount of time can be calculated using the Einstein-
Smoluchowski equation, given below, which was derived from Fick’s law of diffusion by the
two scientists after which it is named.
𝑑𝑑𝑖𝑓𝑓 = √2𝐷𝑡 (6),
In this equation, ddiff is the distance a dissolved species travels in a time, t (s). Usually, diffusion
is a very slow process. For instance, a molecule of glucose with a diffusion coefficient of 5 ×
10-6 cm2/s requires more than 27 h to travel a distance of 1 cm (the total path-length).
Diffusion is superimposed on advection, the mass transport that occurs in a direction
parallel to the main flow as a result of dissolved molecular species being carried by the flow.
Advection determines the flow conditions under which diffusion takes place. In fact, advection
is not very useful in microfluidics for the mixing process, given the predominance of laminar
flow at the flow rates typically used in microfluidics (L/s to L/min). However, advection that
occurs in directions that are not parallel to the net flux of the solution, secondary flows also
known as chaotic advection, can facilitate mixing dramatically.1 In chaotic advection simple
regular velocity fields produce chaotic molecular or particle trajectories.31 This results in an
exponential growth of the interfacial area and an accompanying decrease in the thickness of the
fluids layers over which diffusion must occur to complete homogenization of two or more

Novel micromixers based on chaotic advection and their application —a review
45
solutions. Thus, chaotic advection is a very promising mechanism to improve mixing at the
microscale.2
It is important to note that chaotic advection is not turbulence. For a flow system under
steady state, the velocity components in chaotic advection at each point in space remain
constant over time, while the velocity components in turbulent flow vary over time at each point
in space.1 A necessary condition for chaos is that streamlines should cross each other at different
times, causing particles to change their paths. Thus, chaotic advection can occur in a time-
periodic flow or a spatially time-independent periodic flow.1 The first type can be implemented
by setting boundaries into motion through application of external forces (e.g. electric field).
These micromixers fall into the active category, and are based on effects such as electrokinetic
instability, EKI, a phenomenon which ca be induced in a microchannel using an applied electric
field.32,33 Chaotic advection in a spatially time-independent periodic flow can be achieved by
using 2D curved channels, for example, which will be described in Section 3.1.
Many authors20,22,34–36 report that there exists a critical value of the Reynolds number
(Recr) for every micromixer based on chaotic advection. Below this critical value, mixing is
dominated by diffusion and because the Re is proportional to the linear velocity in the system
(i.e. flow rate), the mixing efficiency is reduced with increase in flow rate. Above Recr the
mixing process is advection-dominated and mixing efficiency increases with increase in flow
rate. A probable explanation for this observation is that at low flow rates, the strength of these
secondary flows is not sufficient to significantly disturb the laminar flow profile, and mixing
by diffusion occurs between two neighbouring parallel streams. When secondary flow patterns
become more pronounced at higher flow rate, mixing by diffusion is facilitated by resulting
increases in contact area and thinner solution streamlines. Each particular micromixer design
has its own critical value of Re, above which mixing is especially efficient. For the end-user
looking for an appropriate mixer for a specific application, the critical value of Reynolds
number should be an important indicator whether a chosen micromixer design will work in the
most efficient way under the required conditions of the particular application.
Ch
ap
ter
II

Microfluidic Tools for Multidimensional Liquid Chromatography
46
3. Passive micromixers based on chaotic advection
In this section we will describe designs and mixing mechanisms of the mixers that have been
proposed within the last decade. The classification of these micromixers is based on their
geometry and includes simple channels (spiral, zig-zag and serpentine), obstacles or wall
modifications, and 3D convoluted channels. The possible mechanism of mixing depends on the
channel geometry. Flow conditions (described by Re), under which the mixer is operated,
dictate the type of phenomenon that governs mixing and, thus, the efficiency of mixing. Thus,
each design can provide different mixing performances at different Re.
3.1 Simple geometries: spiral, zig-zag and serpentine channels
The easiest design for creating chaotic advection is the T-mixer, where two streams collide at a
T-junction. Due to the sharp 90° angle at the entrance, the inertial force is large enough to cause
vortices at the junction (so-called Dean vortices), which lead to chaotic advection.37 T-mixers
have been investigated extensively by many researchers.38–40 However, the efficient application
of T-mixers require Re>150, which is Re at which vortices inside the T-mixer become
asymmetric and real chaotic advection occurs.1 Thus, many research groups used the T-junction
for introducing streams of liquids in combination with other channel modifications, for instance,
the spiral6,35 zig-zag-shaped36 and serpentine22 microchannels. In these designs, similar to the
T-mixers, the chaotic advection is induced by the appearance of Dean vortices when the fluids
experience centrifugal effects when traveling along a curved path of the pipe or at turns in the
channel.6 Dean flow can be intensified by introducing larger numbers of repetitive turns (Fig.
1A), and mixing by chaotic advection will be improved when the flow rate used is increased.
Sundarsan et al.35 tested mixing in spiral channels (Fig. 1A) using five different designs
(the four-arc, six-arc, eight-arc and ten-arc spiral channels) for Reynolds numbers between 0.02
and 18.6. The mixing efficiency of all designs improves with increased flow rate (Re>10) and
with increase in length of individual spiral contours together with decrease of their curvature
radius. This effect illustrates the correlation between mixing efficiency and the flow rate (Re,
De). Li et al.5 designed a planar labyrinth micromixer (PLM) (Fig. 1Ba) consisting of ten
successive in-line “S-shaped” mixing units (Fig. 1Bb) that are compactly arranged within a
confined circular area. Using such micromixers the range of Reynolds number, at which
efficient mixing occurs, can be expanded to Re 30. A design with a short straight channel

Novel micromixers based on chaotic advection and their application —a review
47
between two consecutive semicircles arranged with a 180°-turn provides continuous rotation of
the fluid, repeatedly distorts the interface between two streams, and breaks up unmixed regions
due to a complete position switching of the two streams.
Figure 1. Passive micromixers with simple geometries: (A) The spiral channel network incorporating three mixing
sections (Modified from35); (B) (a) a scheme of the planar labyrinth micromixer (PLM) with (b) “S-shaped” mixing
unit (Modified from 5); (C) ILSC mixer and (D) Ω mixer (Modified from6). (E) Microscopy image of a zig-zag
microchannel (Taken from36; (F) C-shaped micromixer micromixer with baffles (Taken from27); (G) Mixer with
(a) staggered and (b) symmetric obstructions along the microchannel (Modified from 22; (H) A passive alcove-
based mixer (Taken from23). See Table 1 for geometric dimensions.
Recently, inspired by the mixing results in the spiral channels, Al-Halhouli et al.6
presented computational simulations and experimental results for two new mixers composed of
units shaped as interlocking-semicircle (ILSC) and omega (Ω) channels. The ILSC mixer (Fig.
1C) consists of several mixing modules, which are composed of two offset mirrored
interlocking semi-circles (ILSC) whereas the second design consists of series of Ω-shaped
modules (Fig. 1D). Both designs enable a simultaneous rapid 90°-change in the flow direction
(and the direction of Dean vortices formed) four and six times within each Ω- and ILSC mixing
module, respectively. Both micromixers can be used over the entire range of 0.01<Re<50;
however, complete mixing is achieved only at Re>10. It should be mentioned that the strength
Ch
ap
ter
II

Microfluidic Tools for Multidimensional Liquid Chromatography
48
of Dean vortices in the Ω design is expected to be less than those in the ILSC design for a given
Reynolds number, because the Ω-mixer has 1.67-times larger mean radius of curvature.
Another simple design that was exploited decades ago, is a zig-zag microchannel (Fig.
1E), where periodic turns cause chaotic advection. Mengeaud et al.36 made simulations in the
Reynolds number range of 26-267. They found that there exists a critical Reynolds number of
80, under which the mixing relies entirely on molecular diffusion. At higher Re, mixing was
improved by recirculation generated at the channel turns.
Tsai and Wu 27 introduced radial baffles to the curved microchannel and named this
design a curved-straight-curved (C-shaped, CSC) micromixer (Fig. 1F). Dean vortices due to
the curved channel appear after the baffles, and the converging-diverging flow profile between
the baffle and the channel wall enhance mixing at Re≥27.
Another approach was taken by Sahu et al.22, who investigated mixing in a microchannel
integrating short narrow channel sections. Two types of obstructions were studied, namely a
staggered (Fig. 1Ga) and symmetric (Fig. 1Gb) arrangement. It was observed that the staggered
arrangement provided slightly higher (5%) mixing performance due to the presence of a cross-
stream velocity component. It was shown that mixing efficiency increases quadratically with
the number of obstructions due to increased residence times in the obstruction region. A larger
depth and width of the obstruction leads to larger turns of the flow, introducing larger secondary
flow that leads to higher mixing efficiency. The pressure drop is observed to be significantly
higher in the case of symmetric arrangements. In this type of mixer, a relatively high critical
value of Recr ~ 100 was found.
A sophisticated design termed an “alcove-based mixer” was proposed by Egawa et al.23
(Fig. 1H). The mixer consists of a T-junction, followed by three repeats of an alcove or cavity,
adjusted to the channel and arranged in a zig-zag manner. This mixer is capable efficiently of
mixing solvents with different viscosities (1.04-1.17 cP), due to recirculation of solution within
the alcoves to promote fluid mixing.
3.2 Microchannels with wall modifications
Another simple way to induce transverse flow in the microchannel is to insert obstacles or to
modify the channel wall with grooves. Special attention will be paid to mixers with grooves
fabricated in the channel walls.

Novel micromixers based on chaotic advection and their application —a review
49
Placing obstructions within a microfluidic channel offers a simple approach to enhance
mixing by chaotic advection. Obstacles alter the direction of flow, and the resulting swirling
flows and recirculation create transverse mass transport. The barriers are placed asymmetrically
in an alternating way inside the microchannel41 to provide even more chaotic flow patterns, due
to changing flow directions that force fluids to merge.42,43
Wang et al.42 numerically investigated different layouts of cylindrical pillars in a mixing
channel. This work showed that obstacles cannot generate eddies or recirculation at low Re.
However, mixing performance can be improved at high Reynolds numbers (Re ≥ 200). One of
the important findings was that an increase in the number of obstacles in the channel led to the
enhancement of the mixing. Later, Chen et al.44 reported a microfluidic mixer containing a high-
density array of pillars (Fig. 2A) that can provide fast mixing at very low Reynolds numbers
(Re≤1). The micropillars cause multiple splitting and reunification of laminar flows in the
channel. At a low flow rate of 0.1 µL/min, almost complete mixing was obtained due to this
‘‘split-and-recombination’’ effect (discussed more in Section 3.3), that decreases the thickness
of each fluid layer and provides shorter characteristic diffusional lengths. However, this effect
is highly reduced at higher flow rates and more clusters of obstructions are needed for complete
mixing. When the flow rate was increased to 5–15 µL/min, the mixing process starts to be
dictated by chaotic advection, and mixing performance is slightly enhanced. The mixer was
tested for mixing solutions with different viscosities (phosphate-buffered solution, gold
nanocolloids and 20% glycerol with Rhodamine 6G) at various flow rates (0.1-10 µL/min). As
expected, glycerol/Rhodamine 6G, due to its higher dynamic viscosity (1.76 cP), shows a
relatively lower mixing efficiency than the other solutions, and requires a distance of 35 mm
compared to 21 mm with phosphate buffer solution to obtain completet mixing.
C
ha
pte
r II

Microfluidic Tools for Multidimensional Liquid Chromatography
50
Figure 2. Micromixers with obstacles in the mixing channel: (A) A pillar obstruction micromixer: (a) schematic
diagram and (b) SEM image of micropillars in poly(dimethylsiloxane)(Modified from25); (B) An obstruction-based
micromixer with rectangular ribs (Taken from26); (C) T-shaped (a) simple, (b) wavy and (c) converging–diverging
micro-channels with rectangular ribs and (d) magnified rectangular rib placed on the channel floor (Modified
from17); (D) Micromixer with incorporated 2D and 3D baffles (a) 2D mixer with triangle-shaped mixing elements
and (b) 3D mixer with trapezoidal mixing units (Modified from28); (E) Mixer with cylindrical alcoves (Modified
from24). See Table 1 for geometric dimensions.
Another obstruction-based micromixer with optimized rectangular ribs was reported by
Bhagat et al.26(Fig. 2B). It provides ∼90% fluid mixing within 5 mm and is capable of achieving
particle dispersion with a wide range of particle sizes (190 nm - 1.9 µm), showing a 30%
increase in particle dispersion over a modified Tesla design45 (discussed in Section 3.3).
Hsieh and Huang 17 proposed mixers that can work at very low Re (0.027≤Re≤0.081)
(Fig.2C). Several T-shaped designs with rectangular ribs with simple (Tr) (Fig.2C-a), wavy
(Twr) (Fig.2C-b) and converging–diverging microchannels (Tcdr) (Fig.2C-c) were proposed.
Although all micromixers perform better at low Re, there was an established performance
superiority as follows: Twr>Tcdr>Tr. The periodically positioned ribs improve mixing
performance by altering the flow direction. However, the fact that better mixing is achieved at
lower Re indicates that the mixing is governed mainly by diffusion, which requires longer
residence time to occur. Probably, as in many other cases, there exists an Recr, above which the
mixing will become more efficient by increasing the flow rates.
Conlisk and Connor28 designed 2D- and 3D micromixers with triangle- (Fig. 2Da) and
trapezoidal-shaped (Fig. 2Db) baffles. The characterization within Re range 0.1–20 showed
(Recr = 1.0) that 90% of the mixing was achieved in 32 and 7 mm for the 2D and 3D mixer

Novel micromixers based on chaotic advection and their application —a review
51
respectively. The mixing is enhanced due to the focus-and-diverging effect. The 3D mixer
showed a significant increase in mixing efficiency (82% mixing homogeneity compered to a
simple T-mixer) by introducing transverse flow recirculation due to the shape of 3D baffles.
Figure 3. Micromixers with structures on channel walls: (A) Schematic diagram of slanted groove micromixer
(SGM) and (B) (a) Staggered herringbone mixer (SHM) and (b) chaotic mixing patterns in the channel (Modified
from 52); (C) Micromixer with both slanted and herringbone grooves (Taken from53); (D) Connected-groove
micromixer (CGM): (a) CGM-1; (b) CGM-2 (Modified from34); (E) Mixer with alternating slanted ridges on the
top and bottom of the channel: (a) Slanted Ridge Mixer Mirrored (SRM-M) and (b) Slanted Ridge Mixer Opposite
(SRM-O) and (c) 3D view (Taken from7); (F) Three-dimensional staggered herringbone mixer (3D SHM) (Taken
from8). See Table 1 for geometrical dimensions.
Recently, Wang et al.24 proposed designs with cylindrical alcoves extending from
microchannel walls (Fig. 2E) that varied in radius. In general, the design with smaller
cylindrical alcoves gave a 15% and 37%-increase in mixing performance compared to the
straight channel for Re 0.1 and 100, respectively. On the other hand, with the increase in Re the
efficiency of mixing decreased in all the mixers.
Modifying the channel wall is a powerful tool for creating chaotic advection, especially
at low Re numbers. This approach benefits from the low pressure drop and relatively easy
fabrication techniques due to the planar structure.46 Probably the most well-known examples of
patterned a wall of the channel are those micromixers incorporating slanted (SG) (Fig. 3A) and
staggered herringbone (SHG) grooves placed on the bottom wall (Fig. 3B, 3C). They have been
studied extensively.47–51
Grooves can generate transversal secondary flow similar to Dean vortices.52 In a slanted-
groove-micromixer (SGM, Fig. 3A) flow over the groove array assumes a chaotic helical or
Ch
ap
ter
II

Microfluidic Tools for Multidimensional Liquid Chromatography
52
corkscrew pattern, in which two solution streams twist around each other close to the bottom
of the channel. Fluid elements are stretched in a transverse direction due to the oblique position
of the groove with respect to the channel walls. This increases the contact area between two
adjacent solutions dramatically and facilitates mixing by diffusion. A detailed description of
the mechanism is given elsewhere.51 However, helical flow in a channel alone does not give
rise to chaotic mixing. In order to induce chaotic advection, it is necessary to superimpose
different recirculation patterns.54 This can be achieved with array of staggered herringbone
grooves (SHG) (Fig.3B), as described by Stroock et al.52 These structures generate a pair of
counter-rotating vortices that stretch and fold the mixing liquids, reducing the striation
thickness significantly.50 Repetition of these patterns leads to chaotic advection. A detailed
description of the mechanism can be found elsewhere.47,50,51
A variety of designs have been derived from this basic concept. For instance, Howell et
al.53 proposed a micromixer with both slanted and herringbone ridges, whereas some designs
employ grooves on both top and bottom walls (Fig. 3C) 53,55 or on the side and top walls (Fig.
3D-3E).8,34 The design proposed by Howell et al.53 (Fig. 3C) with both slanted and symmetric
herringbone ridges (chevrons) aims to improve the mixing using the combined mechanism: the
chevrons generate two equally-sized vortices that drive fluid upward in the center of the channel
and downward toward the sidewalls. On the other hand, the SG creates two vortices, one above
the other. Such a design allows the formation of a pair of counter rotating vortices in vertical
and horizontal planes, which creates far more rapid mixing than previous designs. Later, Floyd-
Smith et al.55 showed that grooves on the top and bottom of channel improve mixing by 10%
over micromixers with grooves placed only on one channel wall.
In designs where connected grooves are composed of bottom grooves and sidewall
grooves conjoined across the adjacent walls, the sidewall grooves assisted in inducing an
intensive helical motion. This situation was observed in connected-groove micromixer with
slanted grooves on the bottom and sidewall grooves (CGM, Figure 3D).34 From the bottom
grooves the fluid is guided along the sidewall grooves, then to the top and back to the main
stream. Such design can increase the helical intensity by 20%. Recently, Van Schijndel et al.7
proposed a mixer with alternating slanted ridges on the top and bottom of the channel (Fig. 3E).
Adding mixing elements to both walls promoted lateral mass transport and assisted in the
formation of advection patterns, which increased mixing efficiency. Lin et al.8 theoretically
and experimentally showed a micromixer with staggered herringbone grooves patterned on both

Novel micromixers based on chaotic advection and their application —a review
53
bottom and side walls (3D Staggered herringbone mixer, SHM, Figure 3F) that reduced the
mixing length by almost half as compared with the originally reported SHM mixer.52
The simulations confirmed that the flow pattern in the mixers with staggered
herringbone grooves is almost independent of Reynolds number.1 SHG improve mixing for a
wide range of Re from 1 to 100.34,52 However, a dependence of efficiency of mixing on flow
rate (different Re) is observed, implying the existence of an Recr (that was mentioned before)
can be observed for grooved mixers as well. It was shown that in the connected-groove
micromixer,34 the distance required for complete mixing for Re>10 decreased with increasing
flow rate because the inertial forces start to dominate over viscosity.
3.3 3D convoluted channels (combined principles)
As shown previously in this Section, simple channels can generate chaotic advection at higher
Re. However, the mixing at low Re (<1) remains a problem in these designs. To overcome this,
a large number of novel three-dimensional serpentine (3D convoluted, 3D twisted) designs
based on planar micromixers (Section 3.1 and 3.2) have been proposed over the last decade.
The mixing in such micromixers is enhanced by the superposition of several mechanisms,
mostly the combination of chaotic advection and the splitting-and-recombination principle
(SAR). The complex 3D geometry of such mixers causes continuous splitting, recombination
and collision of flows at the same time. In general, chaotic advection in this type of micromixer
can be induced at high flow rates, Re˃70, while the SAR mechanism works well at lower Re,
decreasing the operational range of such mixers to 5<Re<30. Due to the combination of mixing
principles, the distance required for complete mixing in these mixers is much shorter than in
mixers based only on chaotic advection.
A good example of such a micromixer is the serpentine laminating micromixer (SLM)
developed by Kim et al.56 The mixer consists of ‘‘F’’- shaped units arranged in two layers (Fig.
4A) that cause continuous splitting and recombination, keeping the same flow path length for
the two split streams. This SAR principle governs mixing at lower Re. As Re increases, the
serpentine channel design starts to induce chaotic advection. Thus, efficient mixing in the SLM
can be achieved for a wide range of Re (0.44<Re<12.3). Compared to a T-micromixer, the SLM
design requires a 20-times shorter distance to achieve complete mixing. Later, an improved
serpentine laminating micromixer (ISLM) was developed within the same group by Park et
al.57. It was shown that the reduced cross-sectional area in the recombination region enhanced
Ch
ap
ter
II

Microfluidic Tools for Multidimensional Liquid Chromatography
54
the advection effect, which helped achieve better vertical lamination. This change results in
improved mixing performance: at Re 0.2 and 20 at least a 1.2-fold shorter distance was required
to achieve complete mixing for the ISLM compared to the SLM.
Xia et al.58 designed and investigated several configurations of two-layer crossing
channels in the micromixers (TLCCM, Fig. 4B). All three mixers have a two-layer structure. It
is thought that the complex 3D geometry of the microchannels would impose perturbations on
the flow. However, Model 1 fails to generate chaotic advection at Re<1, which can be attributed
to a lack of fluid inertial effects. Model 2 was found to be only a partial chaotic mixer, exhibiting
incomplete mixing at Re=0.01. On the other hand, rapid mixing can be achieved at Re<1 for
Model 3. When Re increased to 10, the mixing became even better due to promotion of chaotic
advection. Further improvement was observed at Re=60. Recently, several similar designs,
namely a tangentially crossing channel mixer (Fig. 4C)9 and a micromixer with XH-shaped and
XO-shaped elements (Fig. 4D),10 both utilizing the combination of SAR and chaotic advection,
were proposed. Both of these designs give a good performance for mixing fluids are a wide
range of Reynolds numbers, 0.1<Re<10 and 0.3<Re<60, respectively.
Another micromixer with 3D square-wave structures and cubic grooves (Fig. 4E), that
expands Re to a wider range (30<Re<220), was proposed by Lin et al.11 The main flow path of
the micromixer has a square-wave shape in order to facilitate laminar flow recirculation by
vortex generation, followed by stretching of these vortices in the cubic groove. The mixer shows
good performances in the range of 0.675 - 4 mL/min flow rates. In addition, the proposed
micromixer featured a stainless steel body, making it resistant to high temperature, high
pressure, and strong corrosion, which can be beneficial in many analytical applications.

Novel micromixers based on chaotic advection and their application —a review
55
Figure 4. 3D convoluted channels: (A) Serpentine laminating micromixer (SLM) (Taken from56); (B)
Configurations of two-layer crossing channels in the micromixer design: (a) Model 1, (b) Model 2 and (c) Model
3 (Modified from58); (C) Tangentially crossing channel (TCC) mixer (Modified from9); (D) SAR micromixer with
(a) XH and (b) XO elements (Modified from10); (E) The micromixer with 3D square-wave structures and cubic
grooves (Modified from11); (F) SAR µ-reactor (a) side view and (b) mixing unit (Modified from59); (G) Horizontal
and vertical weaving micromixer (HVW mixer)(Modified from12). See Table 1 for geometric dimensions.
Fang and Yang59 designed a SAR µ-reactor (Fig. 4F) suitable for mixing fluids with
viscosities over a wide range (0.9–186 cP) for 0.01<Re<100. The 3D structures inside the mixer
cause stream cutting, separation and recombination utilizing the SAR principle. On the other
hand, the mass transfer of fluids between upper and lower halves of the channel induces a 3D-
counter-clockwise flow. The repetitive overlapping of flows forces them to collapse and stretch,
which is a characteristic of chaotic advection. Results showed that at high flow rates, such as at
Re>50, mixing becomes dominated by inertial forces and the complete mixing of fluids can be
achieved within the first 6 mm of the length of the mixer. Furthermore, authors assessed the
mixing behavior of fluorescent proteins (C-phycocyanin and R-phycoerythrin) in 88% glycerol
with a confocal microscope. Results revealed that the SAR µ-reactor exhibit only a small
difference (10–15%) in mixing efficiency when mixing highly viscous fluids (186 cP) as
compared to slightly viscous fluids (0.9 cP). This difference for the micromixer with slanted
grooves was 40–45%,59 which indicates that the mixing of viscous fluids can be achieved more
efficiently using a SAR µ-reactor.
Ch
ap
ter
II
Microfluidic Tools for Multidimensional Liquid Chromatography
56
Recently, a horizontal and vertical weaving micromixer (HVW mixer, Fig. 4G) with
crossed barriers inside a microchannel was proposed.12 Barriers cause two fluids to be divided
into upper and lower layers followed by the generation of clockwise and counter clockwise
motion both vertically and horizontally. The unique feature of this mixer is that only a very
short distance of 450 µm is required, to obtain 89.9% mixing efficiency at a Reynolds number
of 5. The overall channel width is 300 µm, channel depth is 200 µm and barrier dimensions
were 50×100 µm (width by depth).
Another mixer for mixing fluids with widely different viscosities (in ratios of up to 104)
has been reported by Xia et al.15 The mixer with interconnected multi-channel network (Fig.
5A) also employs two mechanisms to improve the mixing. First, through splitting and
recombination, the bulk fluid volumes are broken into thinner streams and chaotically
recombined together. Afterwards, the multiple fluid streams enter a circular expansion chamber,
where viscous flow instabilities lead to turbulent fluid motion. At flow rates higher than 0.20
mL/min, the initial occurrence of flow instability is observed. However, at lower flow rates, no
flow instability occurs, which reduces the quality of mixing. The mixer was tested for mixing
glycerol (680 cP) and other viscous samples (5440 cP, 17300 cP and 54600 cP) with aqueous
solutions (~1 cP). As expected, the mixer becomes less efficient at increased viscosity ratios.
However, complete mixing is still obtained by the end of the mixer (after 8 mixer units) for all
tested mixtures.
Li et al.13 developed an overbridge-shaped micromixer (OBM, Figure 5B) that was used
for mixing two fluids under both isocratic and gradient conditions with Re values of 0.01-200
(Recr=10), corresponding to 0.0045 - 900 µL/min flow rates. The mixer was compared to the
previously discussed SLM micromixer with F-shaped units [Fig. 4A],56 which revealed that
mixing performance of the OBM was always higher (>90%) comparing to F-shaped mixer
(<60%) at the same Reynolds number. Numerical simulation showed that a mixing efficiency
of more than 90% can be achieved for mixing fluids with different flow rate ratios ranging from
1:9 to 9:1, which can be useful in analytical and biological applications. The success of the
OBM mixer can be explained by the combination of different designs used. The mixer consists
of overbridge-shaped (OB) and square-wave (SW) channels. The OB channel has a branched
structure, which split a single fluid stream into two sub-streams. One sub-stream flow together
with the second fluid stream through the main SW channel, where the interface between streams
is stretched at sharp turns. The other sub-stream is transported to the other side of the channel

Novel micromixers based on chaotic advection and their application —a review
57
and collided with the main stream at a 90° angle, which will increase the contact area between
fluids.
Liu et al.18 proposed a novel cross-linked dual helical micromixer (CLDH, Fig. 5C) that
consists of double helical channels rotating in opposite directions to create repeated crossing
regions. This mixer employs flow collision to stretch, split and fold streams that recombine in
the crossing regions. Chaotic advection is enhanced with the sharply twisting streams on the
basis of helical flow and flow collision where Re>1. The simulation and experimental results
show that 99% mixing can be achieved in four cycles (320 µm) over a wide range of Re (0.003–
30).
Figure 5. 3D convoluted micromixers. (A) (a) Plain view and (b) a profile of the mixer (Taken from15); (B) (a) 3-
D overbridge-shaped micromixer (OBM) with (b) its mixing unit (Modified from13); (C) 3D cross-linked dual
helical micromixer (CLDH) (Taken from18); (D) 3D Tesla micromixer (Modified from19); (E) Micromixer with
shifted trapezoidal blades (STB) (Modified from60); (F) H-C passive micromixer (Modified from20); (G) “Twisted”
3D microfluidic mixer (Modified from21). See Table 1 for geometric dimensions.
Another possible approach for the creation of chaotic advection is the combination of
Taylor dispersion with Dean vortices. Hong et al.61 proposed to use an in-plane micromixer
with modified Tesla structures. This mixer exploits the Coanda effect, which enhances
convective mixing of the fluids by producing transverse Taylor dispersion. Recently, Yang et
al.19 designed a micromixer with three-dimensional Tesla structures (Fig. 5D). A repetitive
distortion and squeezing of flow occurs at the turning joints of the Tesla structures that generate
transverse dispersion. Moreover, an added layer of Tesla structures provides more flow
disturbances, which improves mixing. The efficiency of mixing reached 94% in the flow rate
Ch
ap
ter
II

Microfluidic Tools for Multidimensional Liquid Chromatography
58
range of 0.9 - 900 µL/min (0.1<Re<100). The application of this mixer will be discussed in
Section 4.2.2. Recently, another two micromixers were proposed for mixing in the similar range
of Re (1<Re<100): a micromixer with shifted trapezoidal blades (STB, Figure 5E)60 and an H-
C micromixer (Fig. 5G)20. The mixing efficiency was 80% and 90%, respectively.
Sivashankar et al.21 proposed a new “twisted” 3D microfluidic mixer with a two-layered
quadrant of circles (Fig. 5F). Mixing is enhanced due to chaotic advection through generation
of vortices at the edge of the arc-shaped channels, with additional splitting and recombination
of flows. These micromixers can operate at low (1.0 µL/min) and high (1.0 mL/min) flow rates
without reduction in the mixing performance. Moreover, the proposed mixer showed a good
mixing efficiency at high flow rates for mixing 98% glycerol (919 cP) with water (1 cP), making
this mixer ideal for a variety of applications where highly viscous solutions have to be mixed
at high flow rates (~ 1.0 mL/min).
Table 1 summarizes different types of micromixers based on chaotic advection with their
dimensions and material/fabrication methods. We highlighted the mixers from the current
Section applications, which will be shown in Section 4. The lines in red colour marks the mixers
that found a real application that was proposed in the original paper. The lines in blue highlights
the application in which the original or modified mixer designs from the original study were
used.

Novel micromixers based on chaotic advection and their application —a review
59
Table 1. Micromixers based on chaotic advection.
Name of the mixer Re* Dimensions Material/fabrication method
Ref Application area
CHAOTIC MICROMIXERS WITH SIMPLE GEOMETRIES
Spiral S-shaped channel 0.02< Re < 18.6 w=150 µm; h = 29 µm SEBS/ printed circuit technology; single planar soft lithography
35 A size-based particle filtration device;86 a microreactor
Planar labyrinth micromixer (PLM) with S-shaped geometry
Re = 2.5; 30 h = 267 µm; w = 220 µm; the spacing - 240 µm
PDMS/single-step soft-lithography
5
Spiral-shaped, interlocking-semicircle and Ω channel designs
0.01< Re < 50 Recr = 10
h = 230 µm; w = 200 µm; L = 22 mm
PDMS bonded to a glass/soft-lithography
6 for systems working under continuous flow conditions
Zig-zag channel 80< Re < 267 Recr = 80
h = 48 µm; w = 100 µm; L = 2 mm; s = 100-800 µm (s - periodic step)
Polyethyleneterephthalate (PET)/an excimer laser
36 A microreactor: polymerizations of styrene in cyclohexane; ultrasensitive trace analysis62
Curved-straight-curved (CSC) micromixer
Re = 1; 9; 81 w = 130 µm; h = 130 µm; L=1.95 mm; baffle thickness 40 µm; w(radial baffles) = 97.5 µm
PDMS bound to glass/soft lithography
27 As microreactor
Microchannels with lateral obstructions Recr = 100 w = 50 µm; h = 50 µm (total); L = 66 mm;
SU-8 - PMMA/photolithography and micro-milling
22 In DNA hybridization analysis
Alcove-based mixer with a triangular obstruction
Re ˂ 400 h = 82 µm; w = 20 µm; alcove: w = 30 µm; l = 40 µm
Silicon/standard photolithographic techniques
23 For handling complex biochemical and chemical reactions in parallel; mixing fluids with different viscosities
CHAOTIC MICROMIXERS WITH OBSTACLES IN THE MIXING CHANNEL
Pillar obstruction channels
Re: 0.289-0.354 (0.1–15 µL/min) Recr ≥ 5 µL/min
h = 45 µm; w = 200 µm; L= 35 mml; pillars: h = 45 µm; w = 15 µm;
PDMS bound to glass/soft lithography
44 to mix solutions with different viscosities; 44 capturing bioparticles on the immobilized surfaces85
The obstruction micromixer with rectangular ribs
Re = 0.05 h = 50 µm; w = 100 µm PDMS/soft lithography 26 Particle dispersion with a wide range of particle sizes26
Simple T-shaped-, T-shaped wavy- and T-shaped micro-channel with rectangular ribs
0.027 ˂ Re ˂ 0.081
w = 200 µm; h = 200 µm (total); L = 10.1 mm; obstacle sizes: w = 50 µm; l = 100 µm; h = 80 µm
PDMS – PDMS/two-step soft lithography
17 Capturing bioparticles on the immobilized surfaces
Mixers incorporating 2D and 3D baffles 0.1 < Re < 20 Recr = 1
w = 100 µm; h = 50 µm; L = 5.23 mm
PMMA- PMMA/an excimer laser beam
28 As microreactors; in DNA hybridization analysis
Microfluidic mixer with cylindrical alcoves or grooves (CG)
1 < Re < 10 w = 200 µm; h = 100 µm; rCG = 100; 200; 300 µm; L = 20 mm
PDMS bound to glass/soft lithography
24 For biochemical and medical diagnosis
GROOVES IN THE CHANNEL
Slanted groove micromixer (SGM) 0 < Re < 100 w = 200 µm; h = 70 µm; grooves: d = 14 µm
PDMS bound to glass/2-step soft lithography
52 A microreactor: synthesis of a statistical-copolymer-brush composition

Microfluidic Tools for Multidimensional Liquid Chromatography
60
gradient;63 continuous glucose monitoring;72 on-line chemical modification of peptides and direct ESI-MS analysis94
Staggered herringbone mixer (SHM) w = 200 µm; h = 77 µm; grooves: d = 17.7 µm
For parallel screening in situ click chemistry;65 as microreactor: production of siRNA-LNPs67–69 and continuous glucose monitoring;71 trapping of particles and DNA hybridization;758283,84 trace analysis: sarin in blood89 and cobalt (II) ions and hydrogen peroxide;93
changing mobile phase composition between dimensions in LC×LC;99 enzymatic digestion, one of the key functions of the gastrointestinal tract100.
Grooves placed on the top and bottom of the channel
0.06 < Re < 10 w = 3.175 mm; h = 0.76; 1.02; 1.27 mm; d = 0.94 mm
PMMA – Plexiglas/milling 53
Binding reactions (for DNA extraction); trapping of particles; enrichment and focusing of beads and cells; in immunoassays (trapping cancer cells on the antibody-coated surface); in environmental analysis
Re ≤ 30 w = 200 µm; h = 60 µm PDMS/soft lithography 55
Connected-groove micromixer (CGM) 0.28 < Re < 112 w = 200 µm; h = 70 µm; L = 1.7 mm; grooves: w = 50 µm; d = 30 µm
PDMS bound to glass/two standard photolithography
34
Slanted ridge mixer (SRM) Re ~ 1 (10 µL/min)
w = 185 µm (bottom); w = 120 µm (top); h = 90 µm; L = 43 mm; ridges: w = 70 µm; h = 20 µm
a glass plate bound to glass/two-step SU-8 process
7
Three-dimensional staggered herringbone mixer (3D SHM)
Re ~ 0.7 w = 200 µm; h = 80 µm; grooves: h = 20 µm (bottom); h = 40 µm (side); w = 60 µm
fused silica bound to PDMS/femtosecond-laser-assisted chemical wet etching
8
3D CONVOLUTED CHANNELS Serpentine laminating micromixer (SLM) with ‘‘F’’- shape units
0.44 < Re < 12.3 w = 250 µm; h = 60 µm; L = 10 mm
COC/hot embossing; injection molding
56 In diagnostic devices (for blood typing);88 in analytical chemistry and separation science (e.g., for gradients formation); as microreactor
Improved serpentine laminating micromixer (ISLM) with ‘‘F’’- shape units
Re =0.2; 2; 20 w = 500 µm; h = 300 µm PDMS bound to glass/soft lithography
57
Two-layer crossing channels: TLCCM, model A and model B
0.01< Re < 0.2 w = 300 µm; h = 1500 µm PMMA/the laser ablation method
58
As microreactors Tangentially crossing channel (TCC) mixer
0.1 < Re < 10 w = 100 µm; h = 50 µm PDMS-PDMS/soft lithography
9
Micromixer with self-rotated contact surface (XH and XO models)
0.3 < Re < 60 w = 450 µm; h = 150 µm; L =10.25 mm
PDMS-PDMS/multilayer soft lithography
10
SAR µ-reactor 0.01 < Re < 100 w = 300 µm; h = 100 µm; L =6.15 mm
PDMS/standard photolithography
59 Mixing of fluids with different viscosities59

Novel micromixers based on chaotic advection and their application —a review
61
Micromixer with 3D periodic perturbation
30 < Re < 220 h = 300 µm; L = 50 mm stainless steel/conventional machining
11,101 In analytical chemistry (liquid chromatography); operations under pressure and temperatures
3D structures resembling teeth (alligator teeth-shaped micromixer)
0.08 < Re < 16
w = 300 µm; h = 100-300 µm, L = 20 mm; the triangular structures: w = 300 µm, h = 300 µm; d = 50, 100, 150 µm
PDMS-PDMS/soft lithography
64
as microreactors for continuous glucose monitoring,64 DNA hybridization assays;73,74,76,77 for an ultrasensitive trace analysis of cyanide90
3-D overbridge-shaped micromixer (OBM)
0.01 < Re < 200 Recr=10
w = 100 µm; h = 50 µm; L = 2 mm
Three layers of PDMS.single-step soft lithography
13 Formation of gradients (at different flow rate ratios)13
Horizontal and vertical weaving micromixer (HVW mixer)
Re = 5 w = 300 µm; h = 200 µm; L = 1.2 mm; barriers: w = 50 µm; d = 100 µm
PDMS – PDMS/soft lithography
12 Binding reactions (for DNA extraction); trapping of particles
A micromixer with interconnected multi-channel network
Re ~ 2.8 (400 µl/min)
w1 = 600 µm, w2 = 450 µm, w3= 750 µm; h = 400 µm; dchamber = 3.45 mm.
PMMA – PMMA/CNC micro-milling
15 In analytical chemistry and separation science (e.g., for gradients formation)15
Micromixer with shifted trapezoidal blades (STB)
0.5 < Re < 100 Recr = 5
w = 210 µm; h = 200 µm PDMS-glass/soft lithography 60 In clinical and environmental analyses or diagnostic systems
3D cross-linked dual helical micromixer (CLDH)
0.003 < Re < 30 D(helical)=60 µm; P(helical)=80 µm, separation distance: 21 µm
fused silica/femtosecond laser wet etching (FLWE) technology
18 -
Micromixer with modified Tesla structures
0.1 < Re < 100 w = 200 µm; h = 100 µm; L = 11.2 mm
PDMS/soft lithography 19
In immunofluorescence experiments (for binding reaction of antibodies for detecting antigens of lung cancer cells);19 a microreactor: for fabrication of homogenous lipid-polymeric and lipid-quantum dot nanoparticles;66 formation of gradients in liquid chromatography95
H-C passive micromixer 1, 30, 50, 100 Recr = 30
wmax= 600 µm, wmin= 400 µm; hmax= 1300 µm, hmin= 400 µm
PC/micromilling 20 -
“Twisted” 3D microfluidic mixer 0.02 < Re < 20 (1, 5, 10, 100, 1000 µL/min)
w = 200 µm; h = 200 µm; L = 30 mm
PMMA – PMMA/CO2 laser system, thermal bonding
21
The mixing of various viscous fluids For diagnostic devices (cell analysis);21 integrated systems for study of reaction kinetics, sample dilution, and improved reaction selectivity.
* Experimental values unless stated different.
The lines in red colour marks the mixers that found a real application that was proposed in the original paper. The lines in blue highlights the application in which the original or modified mixer designs
from the original study were used. Other applications indicated in black are possible applications for each particular design.
PDMS - Poly(dimethylsiloxane); PC – Polycarbonate; COC – Cyclic olefin copolymer; PMMA – Poly(methyl methacrylate)
PETG - Polyethylene terephthalate glycol; SEBS - Polystyrene-Polyethylene-Polybutylene-Polystyrene

Microfluidic Tools for Multidimensional Liquid Chromatography
62
4. Application of the passive micromixers based on chaotic
advection
Microfluidic systems are widely used in biology, biotechnology and chemistry. Most of these
applications involve complicated (bio)chemical reactions that require mixing.19 Micromixers
based on chaotic advection have found their application as microreactors;62–72 and in biological
applications in the analysis of DNA,73–81 sorting of particles and cells,19,25,82–86 improvement
of diverse cell culture platforms87 and in full integrated lab-on-the-chip devices for blood
typing88 or for detecting a trace amount of sarin in whole blood.89 In analytical chemistry
chaotic micromixers have been used for analysis of hazardous compounds (e.g. cyanide,
pesticides, malachite green);89–93 on-line chemical modification of peptides in an LC-MS
interface;94 mixing liquids with different viscosities15,21,44,59 and for gradient formation.13,95
4.1. Microreactors for chemical reactions
Micromixers as microreactors possess some unique features that are advantageous for using
them for performing various chemical reactions. First, the microscale mixing time is usually
equal to or even less than the reaction time. Of course, micromixers can not produce a large
amount of product comparing to the macroscale production, however, the relative reaction
yield can be higher and the synthesis can be performed in a more controllable way. Besides, in
the micromixers the small thermal inertia and the uniform temperature provide improved
control over mass and heat transfer.1,65 This allows the synthesis of more homogeneous highly
reproducible reaction products. The small volume of the microreactors also provides an
opportunity for green syntheses by reducing the use of hazardous reagents, which makes the
production more cost effective, and safe.96 At the same time, the larger surface-to-volume ratio
provides more surface for catalyst incorporation.
There are a few examples of utilizing chaotic mixers for polymerization reactions: a
synthesis of a statistical-copolymer-brush composition gradient using a mixer with slanted
grooves63 and polymerizations of styrene in cyclohexane in zig-zag microchannels.62 The flow
rate in these applications was relatively high: ~0.15 - 0.3 mL/min. Both studies showed that
the passive mixing induces by flow only allows more controllable processes in the
microchannels, either for obtaining polymers with narrow molecular mass distribution62 or for
the fabrication of surface materials with well-defined composition gradients.63

Novel micromixers based on chaotic advection and their application —a review
63
Figure 6. (A) Schematic representation of a chemical reaction circuit used for the parallel screening of
an in situ click chemistry library (Adapted from65); (B) Schematic illustration of nanoprecipitation of
lipid polymeric NPs (a) in microchannel with Tesla structures (discussed in Section 3.3) and (b)
micrograph of mixing process between fluorescent dye and water at total flow rate 55 µL/min (Modified
from66); (C) Schematic illustration of lipid nanoparticle (LNP) small interfering RNA (siRNA)
formulation inside staggered herringbone micromixer (SHM) (Modified from67,68); (D) Schematic
illustration of LNP formation in channel with groove structures for rapid mixing (Modified from69); (E)
The ceramic microreactor design for the synthesis of core-shell nanocrystals with a three-dimensional
serpentine micromixer for the formation of the core quantum dots and a longitudinal channel for the
shell formation (Taken from70).
In 2006 Wang et al.65 described a new type of microfluidics-based chemical reaction
circuits for the parallel screening of 32 in situ click chemistry reactions. This approach allows
to synthesize a library of high-affinity protein ligands from the complementary building block
reagents via irreversible connection chemistry. In this work click reactions between acetylene
and azide was chosen as a model system. Figure 6A shows how this performed in practice.
First, a nanoliter-level rotary mixer (nL-Level mixer with a volume of 250 nL) selectively
sample nL-quantities of reagents - acetylene and azides with/without inhibitors - for each
screening reaction. Then, reagents enter the microliter-level chaotic mixer (µL-Level mixer)
and mixed with mL-quantities of bovine carbonic anhydrase II (bCAII) solution by means of
chaotic advection inside the 37.8-mm long microchannel. Afterwards, the homogeneous
reaction mixtures are guided by microfluidic multiplexer into one of the 32 individually
addressable microvessels for storing. As a result of these manipulations, 10 different binary
azide/acetylene combinations are obtained: 1) ten in situ click chemistry reactions between
Ch
ap
ter
II
Microfluidic Tools for Multidimensional Liquid Chromatography
64
acetylene and azides in the presence of bCAII; 2) ten control reactions performed th same as
in (1), but in the presence of inhibitor; 3) ten thermal click chemistry reactions performed as
in (1), but in the absence of bCAII. The total volume of the system is only 4 µL, which allows
to reduce the consumption of reagents in 2.5-11 times compared to the conventional method
using 96-well plates.
A very good example of utilizing the micromixers as microreactors is their application
for synthesis of lipid nanoparticles (LNP)66 and their complexation with small interfering RNA
(siRNA).67–69 In order to obtain monodisperse LNP siRNA systems with minimum sizes that
exhibit better gene silencing potency, faster mixing rates (higher flow rates) are required.68 The
conventional techniques for encapsulation of nucleic acids require milliliters of expensive
nucleic acid solution and do not provide good homogeneity and reproducibility.69 To overcome
this, Valencia et al.66 have developed a PDMS-based microfluidic mixer consisting of Tesla
structures for fabrication of monodisperse homogenous lipid-polymeric and lipid-quantum dot
nanoparticles (Fig. 6B). Other studies67–69 have utilized a staggered herringbone mixer for
production of siRNA-LNPs (Fig. 6C-D). Later, Rungta et al.97 showed the efficient silence
neuronal gene expression in cell culture and in vivo in the brain using LNPs produced this way.
Pedro et al.70 have reported an automatic microreactor for the easy and controlled
synthesis of water soluble quantum dots (CdS and CdS/ZnS) for in situ optical characterization.
Homogeneous, stable and highly reproducible nanocrystals have been obtained due to a
hydrodynamic focusing of reagents and the introduction of three-dimensional micromixers for
efficient mixing (Fig. 6E).
Several studies used micromixers with staggered herringbone grooves,71 slanted grooves72
and three-dimensional structures resembling teeth64 as microreactors for continuous glucose
monitoring. For these experiments relatively low flow rates in the range of 0.37-75.0 μL/min
were used. However, when the sample flow rate increases from 10 to 70 μL/min in a SHG
mixer71, a decrease in the detected signal was observed, apparently due to insufficient reaction
times. On the other hand, in micromixers with three-dimensional structures64 a mixing
efficiency between 81% to 92% was determined for the full range of the tested flow rates (0.37-
74.6 μL/min).
4.2. Biological applications
Biological processes, such as cell activation, enzyme reactions and protein folding, often
involve reactions that require mixing of reactants for their initiation.78

Novel micromixers based on chaotic advection and their application —a review
65
4.2.1. DNA analysis
Nucleic acid (NA) probe assays have an enormous scope of applications in biotechnology and
medicine in order to identify genes and mutants, to map their correlations, and to analyze their
expression.75,78 DNA microarrays involve multi-component biochemical reactions that use
thousands of oligonucleotides, complementary DNA (cDNA) clones or polymerase-chain-
reaction (PCR) products.75 Therefore, the sample and reagents should be completely mixed in
order to achieve good results. However, the fact that reagents are immobilized means that
hybridization in the conventional way may take 8–24 hours due to the diffusion-limited
kinetics.73,75
Recently, microfluidic devices started to attract attention for DNA probe assays due to
their low costs, good performances, and ability to be used for different assays by just changing
the nature of the reagents.78 However, the fundamental problem faced by DNA-microarray in
microfluidic devices remains: slow transport of DNA molecules to the probes at low Reynolds
numbers.75 To overcome this, many researchers have used microfluidic mixers based on
chaotic advection. Several different designs of micromixers have been used for this application,
including a three-dimensional serpentine mixer,78,79 mixer with overlapping channels,80 an
alligator teeth-shaped micromixer73,74,76,77 and mixer with herringbone grooves.75
Very often, modern diagnostic techniques require the isolation and purification of
nucleic acids directly from patient samples. Several studies78,79 reported utilization of three-
dimensional serpentine micromixers for DNA extraction based on binding reaction to the glass
surfaces. Lee et al. reported a DNA purification from a biological sample using a microfluidic
mixer for a stepwise change in salt concentration.79 Under high-salt buffer DNA, which is
negatively charged, is strongly adsorbed on the glass surface. Afterwards, under a low-salt
buffer conditions, adsorbed DNA was eluted from the glass. Due to the fact that other
components of the sample (e.g. proteins or sugars) are weakly charged, DNA absorption occurs
in a selective manner and allows its purification.
The group of S. Lee73,74,76,77 had been working on the development of DNA
hybridization assays using an alligator teeth-shaped PDMS microfluidic mixer (Figure 7A).
The channel of this micromixers contains an array of upper and lower teeth that are responsible
for the fluid dispersion of confluent streams in both transversal and vertical direction.64 First,
Park et al.77 investigated the rapid and highly sensitive detection of duplex dye-labelled DNA
sequences. A mixer was used for efficient mixing between DNA oligomers and aggregated
Ch
ap
ter
II

Microfluidic Tools for Multidimensional Liquid Chromatography
66
silver colloids and was operated under low flow rate of 0.37 - 74.6 µL/min. It should be noted
that the mixing under the flow rate of 74.6 µL/min was not complete.
Later, Yea et al.73 used an alligator teeth-shaped PDMS microfluidic channel for the
lab-on-a-chip-based DNA hybridization analysis (Fig. 7B). The micromixer was used to obtain
efficient mixing between the probe and target DNA oligomers at a flow rate of 1 µL/min. Kim
et al.76 and Jung et al.81 then used a molecular beacon, a stem–loop DNA oligonucleotide
labelled with two fluorescent dyes as a probe DNA to analyze a target DNA with 20 base pairs.
Finally, Chen et al.74 reported a fast and sensitive online detection technique for label-free
target DNA based on changes in the FRET (Fluorescence Resonance Energy Transfer) signal
resulting from the sequence-specific hybridization between two fluorescently labelled nucleic
acid probes and target DNA in a PDMS microfluidic channel (Fig. 7C).
Figure 7. (A) Scheme of alligator teeth-shaped micromixer;77 (B) Microfluidic channel for DNA hybridization
with marked boxes for the FRET measurement areas (Adjusted from73); (C) (a) An alligator teeth-shaped mixer
with (b) schematic drawing of an alligator-teeth-shaped channel,91 that was used for DNA hybridization: two
fluorescently labelled nucleic acid probes were mixed first, and then a target DNA oligonucleotide was added;
(Modified from74); (D) (a) Optical micrographs of the PDMS device with two identical chambers, loaded half
with red and half with blue solution, and (b) the situation when the pump start to circulate solution clockwise
between chambers and the bridge channels with herringbone grooves (HG) provide mixing of red and blue
solutions(Modified from75).
Another system for DNA hybridization (Fig. 7D) was constructed by Liu et al.75 A
microfluidic chip consisted of two identical hybridization chambers (6 × 6.5 × 65 mm, 5 mL)
for solution circulation, which were connected to each other through the bridge channels with
herringbone structure. When chambers are loaded with a sample and a peristaltic pump starts
to circulate solution between chambers, the fluids passing through the bridge channels with

Novel micromixers based on chaotic advection and their application —a review
67
herringbone grooves experience chaotic advection which leads to their mixing. It takes about
16 min to complete the circulation between two chambers. In this device DNA hybridization
was performed under dynamic and static (control) conditions using two identical PDMS
devices. The cDNA samples were loaded into the PDMS devices and by actuating the
peristaltic pumps in one of the devices a dynamic hybridization was performed, while static
hybridization was performed in the other device as a control. After hybridization at 52°C for 2
h, PDMS devices were peeled away and scanned to recieve fluorescence images. It was
observed that the hybridization in the dynamic conditions when microfluidic chaotic mixer was
used, produced stronger signals and better sensitivity than under static conditions. Besides, it
was demonstrated that a mixer with herringbone grooves enhances DNA hybridization signals
3-8-fold and improves sensitivity by nearly one order of magnitude relative to the conventional
methods over the same length of time. The device is disposable and compatible with high-
density microarray slides with a potential to hybridize about 135 000 array features in a single
experiment.
4.2.2. Sorting/separation of particles and cells
Trapping, manipulation and separation of bioparticles (such as viruses, DNA molecules,
bacteria, and cells) are important goals for biotechnology in order to develop a good therapeutic
understanding of many diseases.86 One way to achieve this is by using microconcentrators
based on dielectrophoresis (DEP) for collecting these particles on electrodes. However, this
approach is only effective, when the sample particles are brought close to electrode surfaces.
Microfluidic mixers that generate a complex helical flow can recirculate particles and bring
them closer to electrode surfaces (usually on the bottom of the channel) increasing the
percentage of particles that get trapped. Lee and Voldman82 designed a microconcentrator with
patterned grooves to enhance the trapping of particles at high flow rate (100-500 µL/min),
which also means that particle interaction with the electrode surface was strong (Fig. 8A).
Different types of grooves – the slanted groove, staggered herringbone, and symmetrical
herringbone mixers – were investigated. The amount of trapped particles (1-µm-size magnetic
microspheres) in the staggered herringbone mixer increased by a factor of ~1.5x compared to
a smooth channel. Here, the generation of vertical flow is even more important than achieving
the mixing itself. Later, for enrichment and focusing of microbeads (6, 10, and 20 μm in
diameter) and mouse dendritic cells, Chen et al.25 used single slanted and V-shaped grooves
under very low flow rate of 0.27 µL/min. Such a difference in the flow rate used is probably
due to the lower efficiency of the symmetrical V-shaped grooves to generate vertical fluid
Ch
ap
ter
II

Microfluidic Tools for Multidimensional Liquid Chromatography
68
motion (and, thus, a longer residence time is required for trapping particles) comparing to the
staggered herringbone mixer).
Figure 8. (A) (a) Illustration of the assembled device with a channel and gold interdigitated electrodes (IDEs) on
the Pyrex substrate; (b) particle trapping in chaotic flow (Modified from82); (B) The HB-Chip with a microfluidic
array of channels illustrating (a) the uniform blood flow through the device and (b) a micrograph of the grooved
surface with a side view (Modified from84). (C) An integrated device for capturing circulating tumor cells (CTCs):
(a) a patterned silicon nanopillar (SiNP) substrate with anti-EpCAM-coating, and (b) an overlaid microfluidic
chaotic mixing chip (Modified from85); (D)(a)Schematic illustration of an integrated lab-on-a-disc system: two
inlets, mixing unit and the connected inertial flow-focusing channel; (b) an upstream section of the mixing unit
processing blood-spiked and microbead solutions (Taken from86).
Interestingly enough, a number of micromixers were used for the circulation of tumor
cells by modifying the mixer surface. Idea of trapping particles come back in different
applications. The group of Mehmet Toner83,84 has reported a microvortex manipulator (MVM)
with patterned chevrons (symmetrical V-shaped grooves) and herringbone grooves
(asymmetric chevrons) on the upper wall. First, it was used for passive parallel focusing and
guiding beads and cells83 and then, for a platform of circulating tumor cells (CTC) isolation
(“HB-Chip”, Fig. 8B).84 The HB-Chip design applies passive mixing of blood cells through
the generation of microvortices in order to increase the number of interactions between target
CTCs and the antibody-coated chip surface. The most unexpected finding of this study was the

Novel micromixers based on chaotic advection and their application —a review
69
isolation of CTCs clusters from the blood of patients with metastatic cancer, which may
provide insight into the process of metastasis in human cancer.
Another CTC-capture platform was designed by Wang et al.85 (Fig. 8C). It consists of
a patterned silicon nanopillar (SiNP) substrate coated with cancer-cell capture agents
(epithelial cell adhesion molecule antibody, anti-EpCAM) for recognizing/capturing EpCAM-
expressing cells, and a PDMS chip with a serpentine mixer that contains chevron-shaped
grooves. The last one induces a vertical flow in the microchannel that increases cell–substrate
contact frequency resulting in enhanced CTC capture on SiNP substrate. The device was tested
for blood samples from a prostate cancer patient and it showed significantly higher CTC
numbers compared to the commercial CellSearch® assay.
Recently, Aguirre et al.86 have demonstrated for the first time an integrated device for
changing the properties of cells (by mans of complex creation) in order to separate them
according to this property (size). The proposed device contains a micromixer for the creation
of a cancer cell–microbead complex, and a flow-focusing region for separation (Fig. 8D). In
addition to the mixing, provided by Dean flow, a chaotic advection is induced by turning the
microchannel contents 180º at each turn (termed “flipping” by the authors). Depending on a
size of a cancer cell–microbead complex, its trajectory will vary. Thus, the proposed system
works as a size-based particle filtration device.
4.2.3. Fully-Integrated lab-on-the-chip devices
Mixers based on chaotic advection also found their application in microfluidic perfusion
systems for cell culture studies.87 The design of such generic systems with multiple
functionalities that allows tuned and controllable (medium compositions, flow rates, gradients
etc.) analysis of cell behaviour87 is an attractive but challenging idea. In order to address the
need for perfusion of large numbers of cells with the ability to change cell culture conditions,
Cooksey et al.87 developed a sophisticated system shown in Figure 9. It consists of closed-at-
rest microvalves with a multiplexer (for combining of fluids), an on/off chaotic micromixer
circuit, a bypass channel (to divert the flow to the waste output), a central chamber (containing
three exits) and a novel microfluidic resistor (to control fluid flow rates). To achieve mixing,
the device has a separate channel with deflectable herringbone-shaped PDMS membranes.
Under negative pressure, membranes are deflected downward and become grooves that induce
chaotic mixing (‘‘on/off chaotic mixer’’). If the chaotic mixer is bypassed, very little diffusive
mixing occurs between the two coloured fluids. If the chaotic mixer is off (the grooves are not
Ch
ap
ter
II
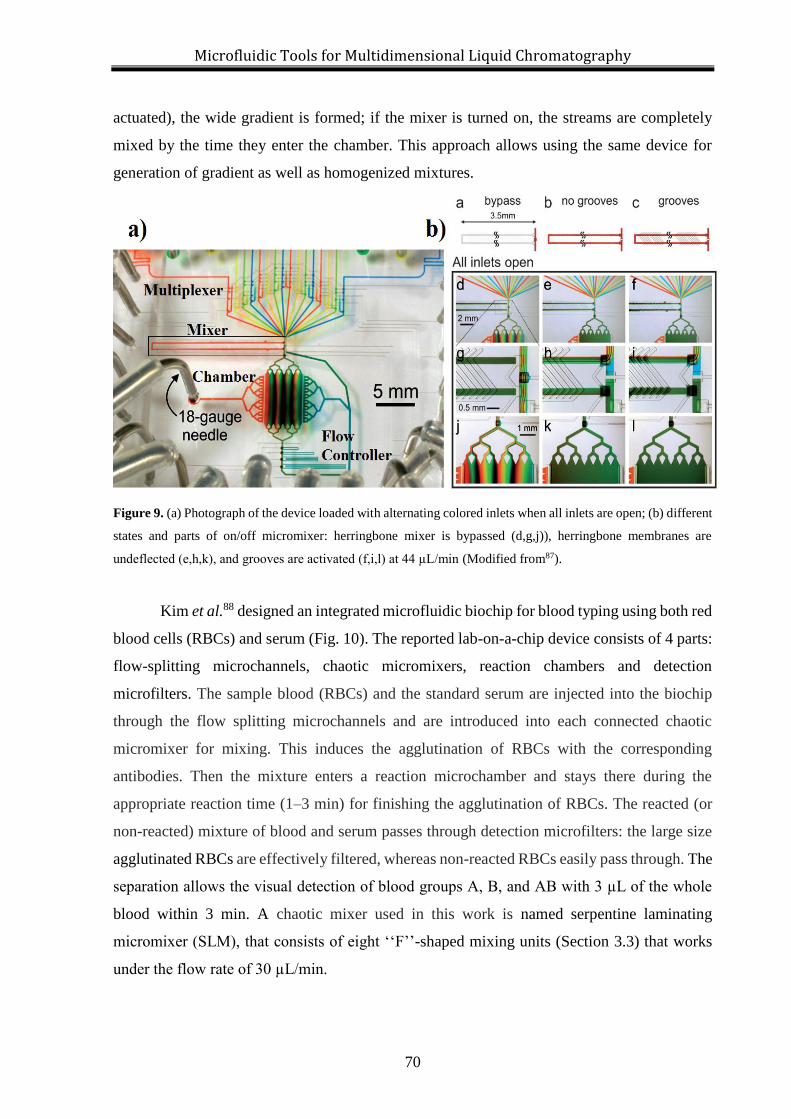
Microfluidic Tools for Multidimensional Liquid Chromatography
70
actuated), the wide gradient is formed; if the mixer is turned on, the streams are completely
mixed by the time they enter the chamber. This approach allows using the same device for
generation of gradient as well as homogenized mixtures.
Figure 9. (a) Photograph of the device loaded with alternating colored inlets when all inlets are open; (b) different
states and parts of on/off micromixer: herringbone mixer is bypassed (d,g,j)), herringbone membranes are
undeflected (e,h,k), and grooves are activated (f,i,l) at 44 µL/min (Modified from87).
Kim et al.88 designed an integrated microfluidic biochip for blood typing using both red
blood cells (RBCs) and serum (Fig. 10). The reported lab-on-a-chip device consists of 4 parts:
flow-splitting microchannels, chaotic micromixers, reaction chambers and detection
microfilters. The sample blood (RBCs) and the standard serum are injected into the biochip
through the flow splitting microchannels and are introduced into each connected chaotic
micromixer for mixing. This induces the agglutination of RBCs with the corresponding
antibodies. Then the mixture enters a reaction microchamber and stays there during the
appropriate reaction time (1–3 min) for finishing the agglutination of RBCs. The reacted (or
non-reacted) mixture of blood and serum passes through detection microfilters: the large size
agglutinated RBCs are effectively filtered, whereas non-reacted RBCs easily pass through. The
separation allows the visual detection of blood groups A, B, and AB with 3 µL of the whole
blood within 3 min. A chaotic mixer used in this work is named serpentine laminating
micromixer (SLM), that consists of eight ‘‘F’’-shaped mixing units (Section 3.3) that works
under the flow rate of 30 µL/min.

Novel micromixers based on chaotic advection and their application —a review
71
Figure 10. (a) Image of a blood typing microfluidic biochip and (b) schematic with flow splitting microchannels,
chaotic micromixers, reaction microchambers and detection microfilters are fully integrated (Modified from88).
Tan et al.89 fabricated a fully integrated lab-on-a-chip device for detecting a trace
amount of sarin in a small volume of whole blood (Fig. 11). The chip consists of regeneration
reactor for nerve agent regeneration from whole blood (realised as a micromixer); a channel
with rectangular pillars for both reaction and filtration of precipitated blood proteins; a filter
chamber with microbeads for removal of fluoride ions; an inhibition reactor (with the
herringbone structures) for the enzyme-based hydrolysis reaction. The last section contains
herringbone grooves to improve the transport of reagents to the immobilized surface coated
with cholinesterase chromophore (enzyme) for the induced optical detection. For a longer
shelf-life, the enzyme is protected by a coating layer. In this case, the coating layer is removed
with an extra washing step before the measurement. If nerve agent exists in the blood sample,
the enzyme is inhibited, hence hydrolysis of substrate is prevented and chromophore remained
unconverted. The colour was determined by an absorbance measurement. The optimal flow
rate was 20 µL/min, because enzymatic reaction requires longer time. When the flow rate was
increased to 48 µL/min, only 5% of the enzymes were inhibited due to either inefficient mixing
in the first two stages or insufficient residence time for the regeneration reaction. The rapid
decrease in the efficiency is related to a relatively small volume of reaction chamber (63 µL
comparing to the total volume of ~ 800 µL).
Ch
ap
ter
II

Microfluidic Tools for Multidimensional Liquid Chromatography
72
Figure 11. (a) Design of a lab-on-a-chip device for detection of nerve agent in blood consisting of (1) nerve agent
regeneration reactor, (2) reaction and filtration channel; (3) a filter chamber with microbeads, (4) inhibition reactor
with the herringbone structures and (5) optical detection region; and (b) the fabricated PMMA device. (Taken
from89).
4.3. Analysis of hazardous compounds (environmental analysis)
Several groups had developed sensitive analytical systems for the detection of cyanide90 and
methyl parathion pesticides91 in water, cyanide in the living cells92 and cobalt (II) ions and
hydrogen peroxide93 using micromixers based on chaotic advection.
An already-mentioned micromixer – zig-zag-shaped microfluidic mixer with alligator
teeth-shaped structures (Sec. 4.2.1)– was applied for development of an ultrasensitive trace
analysis of cyanide90 and methyl parathion pesticides91 in water. In both studies, hazardous
molecules were effectively adsorbed onto silver nanoparticles while flowing along the upper
and lower parts of the channel (Fig. 12A). Both devices were fabricated in PDMS and
investigated using confocal surface-enhanced Raman spectroscopy (SERS). The determined
detection limits for methyl parathion pesticides and cyanide were 0.1 ppm and 0.5–1.0 ppb
respectively. Later, Lee et al.98 used the same system for the sensitive trace analysis for
determining malachite green with limit of detection below the 1–2 ppb.
Kwon et al.92 developed a fluorescent chemosensor, which exhibits a selective green
fluorescence upon the addition of cyanide. In order to mix compounds, the mixing channel has
herringbone-shaped obstacles on the wall that caused chaotic advection (Fig. 12B).
Developing a sensitive analytical system with a shorter analysis time, Lok et al.93
presented a microchip containing a chaotic micromixer for luminol-peroxide
chemiluminescence (CL) detection of cobalt (II) ions and hydrogen peroxide (as an artificial
model system). The micromixer design was adopted from Tan et al.’s work89 and consists of

Novel micromixers based on chaotic advection and their application —a review
73
forward and reversed staggered herringbone grooves (Figure 1CA), which allowed better
catalytic interaction between the reactants. With a total volume of 145 µL, the corresponding
residence time of the system ranges from 1.45 hours to 8.72 minutes at the flow rates from 1.67
to 16.7 µL/min respectively. The chip was also tested at 100 µL/min and 163 µL/min, which
reduced the analysis times to 1.5 min and 1 min respectively. It was shown that a higher flow
rate increases the CL intensity. However, it also leads to the excessive usage of reagents and
leakages due to the increased pressure. As a compromise, the authors decided to use an optimal
flow rate of 16.8 µL/min (analytical time of 8.65 min).93
Figure 12. (A) An alligator teeth-shaped microfluidic mixer for mixing silver colloids and cyanide solution
(Taken from90); (B) (a) Optical images of a fluorescent chemosensor (b) that exhibits a selective green
fluorescence upon the addition of cyanide at a flow rate of 10 µL/min (Taken from92). (C) Schematic layout of
the microchip with of forward and reversed staggered herringbone grooves (SHG) (Taken from 93).
4.4. Analytical techniques
Recently, several interesting applications in the area of analytical chemistry were reported.
Abonnenc et al.94 explored the application of a new electrospray emitter microchip for on-line
chemical modification of peptides and direct ESI-MS analysis (Fig. 13A). This microchip
comprises a passive mixer with integrated photoablated slanted grooves to carry out on-chip
chemical derivatization. In order to apply the voltage to the solution and consequently induce
the ESI process, a carbon microelectrode is also integrated in the microchip. To illustrate the
feasibility of the on-line tagging reaction directly on the electrospray microchip and to assess
Ch
ap
ter
II

Microfluidic Tools for Multidimensional Liquid Chromatography
74
the performance of such micromixer, on-chip chemical tagging of three cysteines with 1,4-
benzoquinone was performed. As an ultimate application, the electrospray micromixer was
implemented in an LC-MS workflow. It was shown that online derivatization of albumin
tryptic peptides after a reversed-phase separation enhances the protein identification. Finally,
on-line RPHPLC-tagging-ESI-MS of tryptic cysteinyl peptides of bovine serum albumin was
achieved with the electrospray micromixer chip. In the present study, total flow rates from 4
to 6 µL/min were applied, at which good spray stability was demonstrated.
Figure 13. (A) Electrospray microchip with a mixing unit (Taken from94); (B) A gradient elution system for
pressure-driven liquid chromatography on a chip and a photograph of the fabricated microchip with the cross-
Tesla mixer (Modified from95).
In practice, biological and chemical samples vary over a wide range of their properties
and some fluids that have to be mixed differ in viscosity. The viscosity differences can limit
many processes in the microchannels (e.g. continuous chemical synthesis in microreactors,
polymer formulation), and, thus, the utilization of a micromixer is essential. Several
examples15,21,44,59 of chaotic micromixers that were tested for mixing viscous fluids were
presented in the Section 3.2 and 3.3. The utilization of these micromixers can be also useful in
applications, where the differences in viscosity influence mixing dramatically (e.g. the high-
viscous fluids can cause a dramatic increase of pressure in HPLC).
Another way to use micromixers for improving analytical techniques is in the formation
of gradients.13,95 One promising example - an overbridge-shaped micromixer13 - was already
presented in Section 3.3. Another mixer with integrated Tesla structure for formation of a
gradient, a channel of pillar array columns for separation and a sample injection channel
(Figure 13B) was proposed by Song et al.95. It was used for gradient elution of four aliphatic
amines in pressure-driven reversed-phase liquid chromatography separation, that were
successfully separated within 110 s at a total flow rate of 1.0 μL/min.. Due to the gradient
elution conditions, the separation was shorter with sharper peaks than under isocratic elution

Novel micromixers based on chaotic advection and their application —a review
75
conditions. These micromixers have great potential in the improvement of conventional
techniques combined with microfluidic technology, especially in the analysis of complex
biological samples.
In our group, we developed a pressure-resistant microfluidic mixer with herringbone
grooves for changing the mobile phase composition between two columns in on-line
comprehensive two-dimensional liquid chromatography (LC×LC).99 The device is meant to
mix in-line rapidly in the wide range of flow rates (0.1-1 mL/min). This chip was micromilled
in rigid cyclic-olefin copolymer (COC) and can withstand pressures of 200 bar due to a
specially designed low-dead-volume interface. Using standardized HPLC connectors, the chip
is directly connected to LC×LC system. It was successfully implemented for improved
separation and identification of various oligomeric series in polyamide samples and showed
similar performance to the commercially available mixing units.
Ch
ap
ter
II

Microfluidic Tools for Multidimensional Liquid Chromatography
76
5. Discussion
In the Section 3 the reader was already introduced to the Table 1, which summarizes different
types of micromixers based on chaotic advection with their dimensions and material/fabrication
methods. This table can serve as a good guideline for helping scientists to make a right choice
of appropriate mixer. However, in this chapter we are also providing the reader with the detailed
process of choosing the micromixer taking into account many aspects of the requirements set
by the particular application (Figure 14).
There are a lot of different micromixers proposed in the literature that were developed
for a specific application, however there is no a straightforward approach for choosing an
appropriate micromixer for a particular application. Besides, the same micromixer can be
successfully used for a variety of applications (Table 1, last column). However, it is possible to
draw some general criteria that should be taken into account while choosing an appropriate
mixer design among a big number of existing micromixers. The first thing that should be done
is to define clear requirements for the particular application. It is important to know what kind
of samples (chemical, biological etc.), ranges of flow rates (or residence times) and detection
methods will be used (Fig. 14). The application will also dictate choice of substrate material or
fabrication of the mixer. For example, some hydrophobic molecules can be absorbed in PDMS.
In combination with three-dimensional convoluted micromixers, the produced insoluble
materials in chemical synthesis102 or biological material in bio-applications can easily clog the
PDMS chip.
Another important criterion is the required flow rate range. It also dictates the material
of the mixer (and, thus, a fabrication method) and the type of connection with the macro world.
Most microfluidic systems are operated under low flow rates (0.2-75 µL/min). Therefore, those
micromixers can be fabricated in PDMS/PDMS or PDMS/glass by soft lithography (Table 1).
However, in cases where higher flow rates (0.9 - 4 mL/min) and/or the connection to
conventional equipment (e.g. LC, MS) are necessary, microfluidic systems have to be fabricated
from more rigid materials (e.g. PMMA, silicon, stainless steel) and appropriate pressure-
resistant connectors are needed, to resist higher pressures. The choice of the material influences
the type of fabrication method that should have a sufficient resolution for fabrication of a
particular design.

Novel micromixers based on chaotic advection and their application —a review
77
The detection method that is planned to be used, also determines the material (e.g.
devices should be transparent in case of optical detection), the required flow rate and the type
of connection with other equipment (if applicable). For example, the signal intensity in
chemiluminescent detection relies on the speed of mixing that determines the sensitivity of the
method. The higher flow rate in this case provides not only the faster analysis, but what is more
important a control over degree of dispersion of reactive species to localize the reaction region.
This increases the intensity of the chemiluminescent signal and, therefore, the method
sensitivity. This requires the utilization of micromixers that can mix at relatively high flow rates
(>100 µL/min).
When the flow rate range is set and the material is chosen, it is possible to decide which
type of micromixer (simple geometry, obstacles/wall modifications or 3D convoluted channels)
will be the most efficient under the defined flow conditions. As mentioned in the beginning of
this chapter, flow conditions (described by Re), under which the mixer operates, dictate the type
of phenomena that govern mixing (dominance of diffusion or advection). This means that each
type of mixer has its own range of flow rates under which it shows the best performance. There
are similar patterns in mixing performances in all mixers: below some critical value of Re, the
mixing efficiency decreases with the increase of flow rate (dominance of diffusion); and above
this value the mixing efficiency increases with the increase of flow rate (dominance of chaotic
advection).
Besides those patterns some micromixers have inherent features that are especially
beneficial for particular applications. For example, micromixers with patterned grooves can be
used in applications, where reactants have to be trapped on the immobilized surfaces (e.g., on
electrodes82). In this case grooves on both top and bottom channel walls facilitate the binding
reactions85,86 not only because of the ability to mix reactants, but also due to the creation of the
vertical flow (in the z-direction) that provides better transport of reactants to the immobilized
surfaces. This approach can be used for analysis of bioparticles with lower diffusivity (e.g.
proteins, DNA),75 which have to be transported faster to the probes than just by diffusion. Other
examples are micromixers with simple geometries (e.g. spiral, zig-zag, serpentine). They can
work under a wide range of Reynolds numbers (1˂<Re<800) due to the appearance of vortices,
which resulted in mixing by chaotic advection at high Re and molecular diffusion at low Re.
This type of mixers contains long channel paths and, thus, provides long residence time for
efficient mixing of reactants to form the final product. These features make them suitable to be
used as microreactors or for DNA hybridization.
Ch
ap
ter
II

Microfluidic Tools for Multidimensional Liquid Chromatography
78
Figure 14. The approach for choosing the chaotic micromixer for a particular application.
Although mixers with obstructions in the channel are used in a smaller range of Re
(0.01<Re< 80), they can also be used for the same purposes as mixers with simple geometries
due to the increase of the reactants residence time in the obstruction region.22 Besides, the ability
to modify the obstructions (e.g. micropillars) inside the mixer with reacting agents opens a wide
range of possibilities for separation and extraction processes, for example when the analytes of
interest are trapped on micropillars (e.g. DNA capturing or detection of affinity binding in
immunoassays).
However, the same design features that are beneficial to some applications can impose
negative effects at the same time. For instance, very deep grooves can create a large dead
volume or force reactant to stay too long in the groove, which distorts peak shape in the
chromatographic separation. Furthermore, the perpendicular bends of 3D convoluted designs
can create dead volume zones (the fluid at the corner of these bends is stagnant, the only mass
transport is diffusion).

Novel micromixers based on chaotic advection and their application —a review
79
After choosing the type of chaotic micromixer, it is important to draw an appropriate
design taking into account all nuances related to the channel parameter and the design of the
structures (obstructions, grooves etc). The geometry of the structures placed in the mixing
channel is described by their depth, width, the angle position, symmetrical or asymmetrical
arrangment etc. A larger depth and width of obstructions leads to a higher chance for inducing
chaotic advection by creating larger vortices in the flow streamlines, which increases larger
contact area between two flows. For instance, studies50,85 showed that the mixing in
micromixers with staggered herringbone grooves improves with deeper grooves. This can be
explained by the increased fluid entrainment in the grooves leading to an increase of the vertical
motions of the fluid at the side edges of the groove.47
The number of obstructions placed in the channel also influences the mixing
performance.9 For instance, Wang et al.42 investigating cylindrical pillars in a mixing channel
found that the mixing improves with the increase of the number of obstacles in the channel
(within same area). Sahu et al.22 also observed that mixing efficiency increases quadratically
with the number of obstructions. The authors explained this observation by fluids staying in the
obstruction region for a longer time (with larger number of obstruction), which provides more
time to finish mixing by diffusion.
Hence, in order to make a choice of an appropriate micromixer that performs the best
way possible for a particular application, many criteria should be considered. This choice
should be done in consideration with all nuances related to the type of the sample, the flow rate
range and the unique features of the application. However, the amount and the variety of already
available designs ease this task. There is no need to develop completely new micromixers, it is
enough to choose a right design and alter it towards the needs of a specific application.
C
ha
pte
r II

Microfluidic Tools for Multidimensional Liquid Chromatography
80
6. Conclusions
In this chapter, we showed novel designs of passive micromixers based on chaotic advection
that were proposed within the last decade. We classified them according to their geometry:
simple geometries, mixers with obstacles in the channel or wall modification, and 3D
convoluted channels. The chaotic micromixers with simple planar geometries provide better
mixing at Re>10, because the Dean flow that governs mixing is intensified with the increase of
the flow rate. The introduction of obstructions to the channel and pattering the channel wall
with grooves provide the efficient mixing at lower Re (0.01<Re<80 and 1<Re<100,
respectively). The mixing in a wider range of Reynolds numbers (0.1˂Re<260) is achieved,
when the mixers with 3D convoluted channels are used due to the combination of two mixing
mechanisms: SAR and chaotic advection.
We showed successful applications of passive chaotic mixers in chemical industry,
biology and analytical chemistry. Most of applications described in this chapter use the range
of flow rates from 0.01 µL/min to 4 mL/min. Micromixers based on chaotic advection have
found their application as microreactors, in analysis of DNA, in sorting of particles and cells,
to improve diverse cell culture platforms and in the full integrated lab-on-the-chip devices. In
analytical chemistry chaotic micromixers were used for analysis of hazardous compounds (e.g.
cyanide, pesticides, malachite green), for an on-line chemical modification of peptides in a LC-
MS interface, for mixing liquids with different viscosities, for gradient formation or improving
the performance of conventional analytical techniques such as LC×LC.
As it was shown in this chapter, very often, a mixer having a particular design finds
diverse applications in a number of different areas. As an example we can name a mixer with
herringbone grooves52 (we report here 13 different applications)65,67–69,71,75,82–84,89,93,99,100 or an
alligator teeth-shaped micromixer64 (with 6 applications).64,73,74,76,77,90 These micromixers can
be used in a such big variety of ways due to the fact that they work efficiently in a wide range
of flow rates.
We hope that this chapter will prove to be useful for the scientists in their endeavours
with respect to choosing and implementation of appropriate micromixers to the real-world
applications.
Novel micromixers based on chaotic advection and their application —a review
81
References
1. Nguyen, N.-T. & N.-T. Nguyen. Micromixers: Fundamentals, Design and Fabrication. Igarss 2014
(William Andrew Publishing, 2011). doi:10.1016/B978-1-4377-3520-8.00001-2
2. Capretto, L., Wei Cheng, M. H. & Zhang, X. Micromixing Within Microfluidic Devices. TripleC 304, 27–
68 (2011).
3. Nguyen, N.-T. & Wu, Z. Micromixers—a review. J. Micromechanics Microengineering 15, R1–R16
(2005).
4. Lee, C. Y., Wang, W. T., Liu, C. C. & Fu, L. M. Passive mixers in microfluidic systems: A review. Chem.
Eng. J. 288, 146–160 (2016).
5. Li, P., Cogswell, J. & Faghri, M. Design and test of a passive planar labyrinth micromixer for rapid fluid
mixing. Sensors Actuators, B Chem. 174, 126–132 (2012).
6. Al-Halhouli, A. et al. Passive micromixers with interlocking semi-circle and omega-shaped modules:
Experiments and simulations. Micromachines 6, 953–968 (2015).
7. Van Schijndel, T. et al. Toward gradient formation in microfluidic devices by using slanted ridges.
Macromol. Mater. Eng. 296, 373–379 (2011).
8. Lin, D. et al. Three-dimensional staggered herringbone mixer fabricated by femtosecond laser direct
writing. J. Opt. 15, 025601 (2013).
9. Lee, D. & Lo, P. H. On the enhancement of mixing in tangentially crossing micro-channels. Chem. Eng.
J. 181–182, 524–529 (2012).
10. Feng, X., Ren, Y. & Jiang, H. An effective splitting-and-recombination micromixer with self-rotated
contact surface for wide Reynolds number range applications. Biomicrofluidics 7, 1–10 (2013).
11. Lin, Y., Yu, X., Wang, Z., Tu, S. T. & Wang, Z. Design and evaluation of an easily fabricated micromixer
with three-dimensional periodic perturbation. Chem. Eng. J. 171, 291–300 (2011).
12. Yoo, W.-S., Go, J. S., Park, S. S.-H. & Park, S. S.-H. A novel effective micromixer having horizontal and
vertical weaving flow motion. J. Micromechanics Microengineering 22, 5007 (2012).
13. Li, X., Chang, H., Liu, X., Ye, F. & Yuan, W. A 3-D Overbridge-Shaped Micromixer for Fast Mixing
Over a Wide Range of Reynolds Numbers. J. Microelectromechanical Syst. 24, 1391–1399 (2015).
14. Chen, Z. et al. Performance analysis of a folding flow micromixer. Microfluid. Nanofluidics 6, 763–774
(2009).
15. Xia, H. M., Wang, Z. P., Koh, Y. X. & May, K. T. A microfluidic mixer with self-excited ‘turbulent’ fluid
motion for wide viscosity ratio applications. Lab Chip 10, 1712–1716 (2010).
16. The, H. Le et al. Geometric effects on mixing performance in a novel passive micromixer with trapezoidal-
zigzag channels. J. Micromechanics Microengineering 25, 094004 (2015).
17. Hsieh, S.-S. & Huang, Y.-C. Passive mixing in micro-channels with geometric variations through µPIV
and µLIF measurements. J. Micromechanics Microengineering 18, 065017 (2008).
18. Liu, K. et al. Design and analysis of the cross-linked dual helical micromixer for rapid mixing at low
Reynolds numbers. Microfluid. Nanofluidics 19, 169–180 (2015).
19. Yang, A. S. et al. A high-performance micromixer using three-dimensional Tesla structures for bio-
applications. Chem. Eng. J. 263, 444–451 (2015).
20. Viktorov, V., Mahmud, M. R. & Visconte, C. Design and characterization of a new H-C passive
micromixer up to Reynolds number 100. Chem. Eng. Res. Des. 108, 152–163 (2016).
21. Sivashankar, S. et al. A ‘twisted’ microfluidic mixer suitable for a wide range of flow rate applications.
Biomicrofluidics 10, 034120 (2016).
22. Sahu, P. K., Golia, A. & Sen, A. K. Investigations into mixing of fluids in microchannels with lateral
obstructions. Microsyst. Technol. 19, 493–501 (2013).
23. Egawa, T., Durand, J. L., Hayden, E. Y., Rousseau, D. L. & Yeh, S. R. Design and evaluation of a passive
alcove-based microfluidic mixer. Anal. Chem. 81, 1622–1627 (2009).
24. Wang, L., Liu, D., Wang, X. & Han, X. Mixing enhancement of novel passive microfluidic mixers with
cylindrical grooves. Chem. Eng. Sci. 81, 157–163 (2012).
25. Chen, H.-H., Sun, B., Tran, K. K., Shen, H. & Gao, D. A microfluidic manipulator for enrichment and
alignment of moving cells and particles. J. Biomech. Eng. 131, 074505 (2009).
26. Bhagat, A. A. S. & Papautsky, I. Enhancing particle dispersion in a passive planar micromixer using
rectangular obstacles. J. Micromechanics Microengineering 18, 085005 (2008).
27. Tsai, R. T. & Wu, C. Y. An efficient micromixer based on multidirectional vortices due to baffles and
channel curvature. Biomicrofluidics 5, 1–13 (2011).
28. Conlisk, K. & Connor, G. M. O. Analysis of passive microfluidic mixers incorporating 2D and 3D baffle
geometries fabricated using an excimer laser. Microfluid. Nanofluidics 12, 941–951 (2012).
29. Malvern Instruments Worldwide, Understanding Taylor Dispersion Analysis (2015).
Ch
ap
ter
II

Microfluidic Tools for Multidimensional Liquid Chromatography
82
30. Pidugu, S. B. & Bayraktar, T. FLOW PHYSICS IN MICROCHANNELS. in Proceedings of IMECE2005
2005 ASME International Mechanical Engineering Congress and Exposition 1–6 (2005).
31. Aref, H. Stirring by chaotic advection. J. Fluid Mech. 143, 1–21 (1984).
32. Tai, C. H. et al. Micromixer utilizing electrokinetic instability-induced shedding effect. Electrophoresis
27, 4982–4990 (2006).
33. Yan, D., Yang, C., Miao, J., Lam, Y. & Huang, X. Enhancement of electrokinetically driven microfluidic
T-mixer using frequency modulated electric field and channel geometry effects. Electrophoresis 30, 3144–
3152 (2009).
34. Yang, J. T., Fang, W. F. & Tung, K. Y. Fluids mixing in devices with connected-groove channels. Chem.
Eng. Sci. 63, 1871–1881 (2008).
35. Sudarsan, A. P. & Ugaz, V. M. Fluid mixing in planar spiral microchannels. Lab Chip 6, 74–82 (2006).
36. Mengeaud, V., Josserand, J. & Girault, H. H. Mixing processes in a zigzag microchannel: Finite element
simulations and optical study. Anal. Chem. 74, 4279–4286 (2002).
37. Nguyen, N. T. & Wereley, S. Fundamentals and applications of microfluidics. Artech House 111 (2006).
doi:http://doi.wiley.com/10.1002/1521-
3773%252820010316%252940%253A6%253C9823%253A%253AAID-
ANIE9823%253E3.3.CO%253B2-C
38. Bothe, D., Stemich, C. & Warnecke, H. J. Fluid mixing in a T-shaped micro-mixer. Chem. Eng. Sci. 61,
2950–2958 (2006).
39. Hoffmann, M., Schlüter, M. & Räbiger, N. Experimental investigation of liquid-liquid mixing in T-shaped
micro-mixers using μ-LIF and μ-PIV. Chem. Eng. Sci. 61, 2968–2976 (2006).
40. Ait Mouheb, N., Malsch, D., Montillet, A., Solliec, C. & Henkel, T. Numerical and experimental
investigations of mixing in T-shaped and cross-shaped micromixers. Chem. Eng. Sci. 68, 278–289 (2012).
41. Park, J. M., Seo, K. D. & Kwon, T. H. A chaotic micromixer using obstruction-pairs. J. Micromechanics
Microengineering 20, 015023 (2010).
42. Wang, H., Iovenitti, P., Harvey, E. & Masood, S. Optimizing layout of obstacles for enhanced mixing in
microchannels. Smart Mater. Struct. 11, 662 (2002).
43. Kang, T. G., Singh, M. K., Kwon, T. H. & Anderson, P. D. Chaotic mixing using periodic and aperiodic
sequences of mixing protocols in a micromixer. Microfluid. Nanofluidics 4, 589–599 (2008).
44. Chen, L. et al. Evaluation of passive mixing behaviors in a pillar obstruction poly(dimethylsiloxane)
microfluidic mixer using fluorescence microscopy. Microfluid. Nanofluidics 7, 267–273 (2009).
45. Hossain, S., Ansari, M. A., Husain, A. & Kim, K. Y. Analysis and optimization of a micromixer with a
modified Tesla structure. Chem. Eng. J. 158, 305–314 (2010).
46. Hessel, V., Löwe, H. & Schönfeld, F. Micromixers—a review on passive and active mixing principles.
Chem. Eng. Sci. 60, 2479–2501 (2005).
47. Lynn, N. S. & Dandy, D. S. Geometrical optimization of helical flow in grooved micromixers. Lab Chip
7, 580–587 (2007).
48. Tóth, E., Holczer, E., Iván, K. & Fürjes, P. Optimized Simulation and Validation of Particle Advection in
Asymmetric Staggered Herringbone Type Micromixers. Micromachines 6, 136–150 (2015).
49. Chen, F. et al. Process for the fabrication of complex three-dimensional microcoils in fused silica. Opt.
Lett. 38, 2911–4 (2013).
50. Yang, J.-T., Huang, K.-J. & Lin, Y.-C. Geometric effects on fluid mixing in passive grooved micromixers.
Lab Chip 5, 1140–1147 (2005).
51. Yun, S., Lim, G., Kang, K. H. & Suh, Y. K. Geometric effects on lateral transport induced by slanted
grooves in a microchannel at a low Reynolds number. Chem. Eng. Sci. 104, 82–92 (2013).
52. Stroock, A. D. et al. Chaotic mixer for microchannels. Science 295, 647–651 (2002).
53. Howell Jr., P. B. et al. A microfluidic mixer with grooves placed on the top and bottom of the channel.
Lab Chip 5, 524–530 (2005).
54. Hardt, S., Drese, K. S., Hessel, V. & Schönfeld, F. Passive micromixers for applications in the microreactor
and ??TAS fields. Microfluid. Nanofluidics 1, 108–118 (2005).
55. Floyd-Smith, T. M., Golden, J. P., Howell, P. B. & Ligler, F. S. Characterization of passive microfluidic
mixers fabricated using soft lithography. Microfluid. Nanofluidics 2, 180–183 (2006).
56. Kim, D. S., Lee, S. H., Kwon, T. H. & Ahn, C. H. A serpentine laminating micromixer combining
splitting/recombination and advection. Lab Chip 5, 739–747 (2005).
57. Park, J. M., Kim, D. S., Kang, T. G. & Kwon, T. H. Improved serpentine laminating micromixer with
enhanced local advection. Microfluid. Nanofluidics 4, 513–523 (2008).
58. Xia, H. M., Shu, C., Wan, S. Y. M. & Chew, Y. T. Influence of the Reynolds number on chaotic mixing
in a spatially periodic micromixer and its characterization using dynamical system techniques. J.
Micromechanics Microengineering 16, 53–61 (2006).

Novel micromixers based on chaotic advection and their application —a review
83
59. Fang, W. F. & Yang, J. T. A novel microreactor with 3D rotating flow to boost fluid reaction and mixing
of viscous fluids. Sensors Actuators, B Chem. 140, 629–642 (2009).
60. Le The, H. et al. An effective passive micromixer with shifted trapezoidal blades using wide Reynolds
number range. Chem. Eng. Res. Des. 93, 1–11 (2015). 61. Hong, C.-C., Choi, J.-W. & Ahn, C. H. A novel in-plane passive microfluidic mixer with modified Tesla
structures. Lab Chip 4, 109–113 (2004).
62. Iida, K. et al. Living anionic polymerization using a microfluidic reactor. Lab Chip 9, 339–345 (2009).
63. Xu, C. et al. Solution and surface composition gradients via microfluidic confinement: Fabrication of a
statistical-copolymer-brush composition gradient. Adv. Mater. 18, 1427–1430 (2006).
64. Kim, D. J., Oh, H. J., Park, T. H., Choo, J. B. & Lee, S. H. An easily integrative and efficient micromixer
and its application to the spectroscopic detection of glucose-catalyst reactions. Analyst 130, 293–298
(2005).
65. Wang, J. et al. Integrated microfluidics for parallel screening of an in situ click chemistry library. Angew.
Chemie - Int. Ed. 45, 5276–5281 (2006).
66. Valencia, P. M. et al. Single-step assembly of homogenous lipid-polymeric and lipid-quantum dot
nanoparticles enabled by microfluidic rapid mixing. ACS Nano 4, 1671–1679 (2010).
67. Leung, A. K. K. et al. Lipid nanoparticles containing siRNA synthesized by microfluidic mixing exhibit
an electron-dense nanostructured core. J. Phys. Chem. C 116, 18440–18450 (2012).
68. Belliveau, N. M. et al. Microfluidic Synthesis of Highly Potent Limit-size Lipid Nanoparticles for In Vivo
Delivery of siRNA. Mol. Ther. Nucleic Acids 1, e37 (2012).
69. Chen, D. et al. Rapid discovery of potent siRNA-containing lipid nanoparticles enabled by controlled
microfluidic formulation. J. Am. Chem. Soc. 134, 6948–6951 (2012).
70. Pedro, S. G. et al. A ceramic microreactor for the synthesis of water soluble CdS and CdS/ZnS nanocrystals
with on-line optical characterization. Nanoscale 4, 1328 (2012).
71. Xu, Z. R. & Fang, Z. L. Composite poly(dimethylsiloxane)/glass microfluidic system with an immobilized
enzymatic particle-bed reactor and sequential sample injection for chemiluminescence determinations.
Anal. Chim. Acta 507, 129–135 (2004).
72. Moon, B. U., De Vries, M. G., Cordeiro, C. A., Westerink, B. H. C. & Verpoorte, E. Microdialysis-coupled
enzymatic microreactor for in vivo glucose monitoring in rats. Anal. Chem. 85, 10949–10955 (2013).
73. Yea, K., Lee, S., Choo, J., Oh, C.-H. & Lee, S. Fast and sensitive analysis of DNA hybridization in a
PDMS micro-fluidic channel using fluorescence resonance energy transfer. Chem. Commun. (Camb).
1509–1511 (2006). doi:10.1039/b516253j
74. Chen, L. et al. DNA hybridization detection in a microfluidic channel using two fluorescently labelled
nucleic acid probes. Biosens. Bioelectron. 23, 1878–1882 (2008).
75. Liu, J., Williams, B. A., Gwirtz, R. M., Wold, B. J. & Quake, S. Enhanced signals and fast nucleic acid
hybridization by microfluidic chaotic mixing. Angew. Chemie - Int. Ed. 45, 3618–3623 (2006).
76. Kim, S. et al. Rapid DNA hybridization analysis using a PDMS microfluidic sensor and a molecular
beacon. Anal. Sci. 23, 401–405 (2007).
77. Park, T. et al. Highly sensitive signal detection of duplex dye-labelled DNA oligonucleotides in a PDMS
microfluidic chip: confocal surface-enhanced Raman spectroscopic study. Lab Chip 5, 437–442 (2005).
78. Yun, K.-S. & Yoon, E. Microfluidic Components and Bio-reactors for Miniaturized Bio-chip Applications.
iotechnology Bioprocess Eng. 2004 9, 86–92 (2004).
79. Lee, N. Y., Yamada, M. & Seki, M. Development of a passive micromixer based on repeated fluid twisting
and flattening, and its application to DNA purification. Anal. Bioanal. Chem. 383, 776–782 (2005).
80. Fang, W. F., Hsu, M. H., Chen, Y. T. & Yang, J. T. Characterization of microfluidic mixing and reaction
in microchannels via analysis of cross-sectional patterns. Biomicrofluidics 5, 1–12 (2011).
81. Jung, J. et al. Fast and sensitive DNA analysis using changes in the FRET signals of molecular beacons in
a PDMS microfluidic channel. Anal. Bioanal. Chem. 387, 2609–2615 (2007).
82. Lee, H. Y. & Voldman, J. Optimizing micromixer design for enhancing dielectrophoretic
microconcentrator performance. Anal. Chem. 79, 1833–1839 (2007).
83. Hsu, C.-H., Di Carlo, D., Chen, C., Irimia, D. & Toner, M. Microvortex for focusing, guiding and sorting
of particles. Lab Chip 8, 2128–2134 (2008).
84. Stott, S. L. et al. Isolation of circulating tumor cells using a microvortex-generating herringbone-chip.
Proc. Natl. Acad. Sci. 107, 18392–18397 (2010).
85. Wang, S. et al. Highly Efficient Capture of Circulating Tumor Cells by Using Nanostructured Silicon
Substrates with Integrated Chaotic Micromixers. Angew. Chemie Int. Ed. 50, 3084–3088 (2011).
86. Aguirre, G. R., Efremov, V., Kitsara, M. & Ducrée, J. Integrated micromixer for incubation and separation
of cancer cells on a centrifugal platform using inertial and dean forces. Microfluid. Nanofluidics 18, 513–
526 (2015).
Ch
ap
ter
II

Microfluidic Tools for Multidimensional Liquid Chromatography
84
87. Cooksey, G. A., Sip, C. G. & Folch, A. A multi-purpose microfluidic perfusion system with combinatorial
choice of inputs, mixtures, gradient patterns, and flow rates. Lab Chip 9, 417–26 (2009).
88. Kim, D. S., Lee, S. H., Ahn, C. H., Lee, J. Y. & Kwon, T. H. Disposable integrated microfluidic biochip
for blood typing by plastic microinjection moulding. Lab Chip 6, 794–802 (2006).
89. Tan, H. Y., Loke, W. K., Tan, Y. T. & Nguyen, N.-T. A lab-on-a-chip for detection of nerve agent sarin
in blood. Lab Chip 8, 885–891 (2008).
90. Yea, K. et al. Ultra-sensitive trace analysis of cyanide water pollutant in a PDMS microfluidic channel
using surface-enhanced Raman spectroscopy. Analyst 130, 1009–1011 (2005).
91. Lee, D. et al. Quantitative analysis of methyl parathion pesticides in a polydimethylsiloxane microfluidic
channel using confocal surface-enhanced Raman spectroscopy. Appl. Spectrosc. 60, 373–377 (2006).
92. Kwon, S. K. et al. Sensing cyanide ion via fluorescent change and its application to the microfluidic
system. Tetrahedron Lett. 49, 4102–4105 (2008).
93. Lok, K. S., Kwok, Y. C. & Nguyen, N.-T. Passive micromixer for luminol-peroxide chemiluminescence
detection. Analyst 136, 2586–91 (2011).
94. Abonnenc, M., Dayon, L., Perruche, B., Lion, N. & Girault, H. H. Electrospray micromixer chip for on-
line derivatization and kinetic studies. Anal. Chem. 80, 3372–3378 (2008).
95. Song, Y. et al. Integration of pillar array columns into a gradient elution system for pressure-driven liquid
chromatography. Anal. Chem. 84, 4739–4745 (2012).
96. Krishna, K. S., Li, Y., Li, S. & Kumar, C. S. S. R. Lab-on-a-chip synthesis of inorganic nanomaterials and
quantum dots for biomedical applications. Adv. Drug Deliv. Rev. 65, 1470–1495 (2013).
97. Rungta, R. L. et al. Lipid Nanoparticle Delivery of siRNA to Silence Neuronal Gene Expression in the
Brain. Mol. Ther. Nucleic Acids 2, e136 (2013).
98. Lee, S. et al. Fast and sensitive trace analysis of malachite green using a surface-enhanced Raman
microfluidic sensor. Anal. Chim. Acta 590, 139–144 (2007).
99. Ianovska, M. A. et al. Microfluidic micromixer as a tool to overcome solvent incompatibilities in two-
dimensional liquid chromatography.
100. Haan, P. de et al. "Digestion-on-a-Chip: A Continuous-Flow Modular Microsystem for Enzymatic
Digestion for Gut-on-a-Chip Applications. (2018).
101. Lin, Y. Numerical characterization of simple three-dimensional chaotic micromixers. Chem. Eng. J. 277,
303–311 (2015).
102. Bally, F., Serra, C. A., Hessel, V. & Hadziioannou, G. Micromixer-assisted polymerization processes.
Chem. Eng. Sci. 66, 1449–1462 (2011).

Chapter III
Development of small-volume,
microfluidic chaotic mixers for future
application in two-dimensional liquid
chromatography
Margaryta A. Ianovska1,2, Patty P.M.F.A. Mulder1, Elisabeth Verpoorte1
1Pharmaceutical Analysis, Groningen Research Institute of Pharmacy, University of
Groningen, The Netherlands
2 TI-COAST, Amsterdam, The Netherlands
RSC Adv. 2017, 7, 9090-9099

Abstract
We report a microfluidic chaotic micromixer with staggered herringbone grooves having a
geometry optimized for fast mobile-phase modification at the interface of a two-dimensional
liquid chromatography system. The volume of the 300 µm-mixers is 1.6 microliters and they
provide mixing within 26 sec at flow rate of 4 μL/min and 0.09 sec at flow rate of 1000 μL/min.
Complete mixing is achieved within a distance of 3 cm along the 5 cm-long microchannel over
the whole range of flow rates. The mixers can be used to mix aqueous phosphate-buffered saline
solutions with methanol or acetonitrile at different ratios (1:2, 1:5 and 1:10). We also describe
in detail a fabrication protocol for these mixers using a two-step soft photolithographic
procedure. Mixers are made by replication in poly(dimethylsiloxane).
Keywords: microfluidics, micromixers, chaotic advection, herringbone grooves, SHG

Development of small-volume, microfluidic chaotic mixers for future application in two-dimensional liquid chromatography
87
Introduction
The increasing demand for analysis of more complex samples is stimulating the development
of high-resolution multidimensional separation techniques, such as two-dimensional (2D)
liquid chromatography (LC).1,2 Coupling different separation mechanisms in 2D LC has two
important consequences. First, as the separation mechanism in LC is determined by the nature
of stationary and mobile phases, coupling two columns (two dimensions) with different
stationary phases necessarily means that each dimension requires a different mobile phase. This
leads to a major issue in 2D LC, namely how to deal with solvent incompatibility between
dimensions. This often means that a solvent in the first dimension (1D) becomes a strong eluent
in the second dimension (2D), rapidly eluting analytes. This results in so-called breakthrough
on the second column, and poor separation of analytes as a result. Additionally, viscosity
differences and immiscibility of solvents can cause flow instability (viscous fingering effect) in
situations where mobile phases of mixed composition are required (e.g. gradient elution). This
can lead to distortion of the peak shape in the second dimension.3
The second consequence of coupling two columns is the requirement of a specially
designed interface to maintain the resolution of the separation in the first dimension for the
second dimension separation. It should provide for the efficient fast transfer of 1D effluent to
the 2D and allow modification of the solvent composition between dimensions. The interface
usually consists of a 10-port valve with either two loops for cutting 1D effluent into small
fractions4 or trap-columns for pre-concentration of analytes before re-injection onto the second
column,5 or both 6.
A dilution of the 1D effluent with 2D mobile phase improves the sample focusing in the
2D which is crucial for an overall good performance of 2D LC. For the purpose of solvent
modification between dimensions, an additional pump and a mixer unit are required. As such a
dilution can lead to peak broadening, the mixer should have a small internal volume (low µL-
range) to obtain the desired dilution ratios in minimal volumes. Additionally, the small volume
of the mixer should enable fast modification (20-30 sec) and maintain small sampled portions
of 1D effluent. The most used mixing unit in the area of LC nowadays is the T-piece, in which
the two streams are simply collided with each other, with optimal mixing obtained at higher
flow rates. Another commercially available mixer for LC applications is the so-called static
Ch
ap
ter
III

Microfluidic Tools for Multidimensional Liquid Chromatography
88
mixer (S-mixer, e.g. HyperShear™ HPLC).7 S-mixers are usually composed of two periodically
repeated elements in the axial direction. Each element consists of two pairs of four crossed bars
perpendicular to the orientation of the fluid stream.8 Thus, the fluid interface experiences
stretching and folding eight times while moving through each element. The mixing efficiency
of the S-mixer improves with higher flow rates and bigger volumes,7 making it inherently
unsuitable for 2D LC purposes. In order to obtain mixing in small volumes and over a wide
range of flow rates, we propose to use chip-based microfluidic technologies,9 which focus on
the development of tools for manipulation of small volumes of fluids. Perhaps the best example
of attempts to implement microfluidic technologies in an LC system is the commercially
available Jet Weaver mixer.10 This device employs a network of multi-layer microfluidic
channels (120 μm x 120 μm), and uses the split-and-recombine principle to ensure an efficient
solvent gradient formation. It is incorporated into the HPLC pumping system (1290 Infinity
Binary pump) and is available in volumes of 35 µL, 100 µL and 380 µL. Our mixer differs
substantially from this device, as it has a much smaller internal volume and is based on chaotic
mixing, which ensures fast mixing in small volumes over a wide range of flow rates.
Mixing at the micrometer scale is a challenge because of the existence of well-defined
laminar flow under typical flow conditions in microchannels. A number of approaches to
overcome this limitation have been proposed, including passive and active micromixers that
can rapidly mix small amounts of fluids.11,12,13 Passive micromixers are generally preferred
since they are easier to fabricate and do not require the application of an external force to
achieve mixing, which makes them more robust and stable. The approach chosen for this work
was first described by Stroock et al.14 and is based on passive chaotic mixing. Mixing is
achieved through the incorporation of microgrooves into a microchannel wall. Grooves can be
positioned in arrays at an oblique angle to the wall (slanted grooves, SG), or take the shape of
asymmetric chevrons or herringbones in staggered arrays (herringbone grooves, HG). These
grooves work as obstacles placed in the path of the flow and alter the laminar flow profile. This
leads to a dramatic increase of the contact area between the two streams, and facilitates mixing
by diffusion. Herringbone grooves generate two counter-rotating vortices (perpendicular to the
direction of the flow) whereas slanted grooves create a helical or corkscrew pattern flow.14
Chaotic mixers with embedded microgrooves have been found to work well for systems
with Reynolds numbers from 1 to 100.14 Several studies report the utilization of mixers to
improve a surface electrochemical reaction,15,16 perform on-line chemical modification of

Development of small-volume, microfluidic chaotic mixers for future application in two-dimensional liquid chromatography
89
peptides,17 and provide mixing for direct and sandwich immunoassays.18 There are other
alternative applications in the area of surface interactions, such as binding of DNA on magnetic
beads;19 focusing, guiding, sorting particles;20 and the binding of proteins21 and circulating
tumor cells to functionalized surfaces.22,23 Most of these applications utilize the same
dimensions of the mixer reported in the original study,14 not altering them to better satisfy the
demands of the current application or optimizing them based on numerical computational
studies available in the literature. This often leads to the implementation of non-optimal
micromixer designs and suboptimal performance.
The aim of this work was to develop a chaotic mixer for fast mixing performance in a
given small volume for future application in 2D LC for solvent modification between columns.
For this we used an approach taken from the literature to design optimized grooved microfluidic
mixers with internal volumes on the order of just 1 or 2 microliters. We also characterized the
mixer in order to ensure its applicability to the 2D LC system. We demonstrated the possibility
of using small-volume micromixers for flow rates compatible with 2D LC (300-1000 μL/min).
Also, devices were tested for mixing solutions with different compositions and viscosities, such
as phosphate buffered saline/acetonitrile and phosphate buffered saline/methanol mixtures,
which are the most common solvents used in liquid chromatography. In addition, the fabrication
process of mixers is described in detail. We believe that our approach represents one further
step in the implementation of microfluidic technologies for mixing in conventional LC.
Material and Methods
All chemicals were analytical reagent-grade. Fluorescein was purchased from Sigma-Aldrich
(NL) and used to prepare separate 5.0 μM fluorescein solutions in 10.0 mM phosphate-buffered
saline with pH 7.4 (PBS; Gibco, UK). Acetonitrile (HPLC-S) and methanol were both obtained
from Biosolve, The Netherlands. The pH was measured using pH-indicator strips (Neutralit,
MERCK). All solutions were prepared with 18 M-ohm ultrapure water (Arium 611, Sartorius
Stedim Biotech, Germany). Both acetonitrile and methanol were degassed for 15 min prior to
experiments. There was no deformation or swelling observed for PDMS when acetonitrile or
methanol were used.
Ch
ap
ter
III

Microfluidic Tools for Multidimensional Liquid Chromatography
90
Mixer parameters and optimization
The mixer has a Y-shaped channel with two inlets and one outlet (Figure 1A). The
mixing channels are 50 mm long (from the Y-junction) and 300 or 400 µm wide. A ruler
is located along the channel to show the distance from the Y-junction. The total volume
of the mixing channel is about 1.6 μL and 2.2 μL for widths of 300 and 400 µm,
respectively.
The geometry of the grooves is determined by their depth (d), width (a) and
groove spacing (b) (Fig. 1B). These parameters are the same for the HG and SG tested.
Additional parameters for the HG are the asymmetry index, p, between long and short
groove arms (p is the fraction of channel width occupied by the long arm of a HG i.e. p
= wl / w) and groove intersection angle (θ). The groove depth-to-channel depth ratio (d/h)
(hereafter known as “groove-depth ratio”) for both slanted and herringbone grooves and
p were found to have the greatest influence on mixing efficiency.23
All geometric ratios – groove-depth ratio (d/h), groove spacing-to-channel width
ratio (b/w) and channel-aspect ratio (h/w) - were found to be interdependent, and there
exists an optimal groove width-to-channel width ratio (a/w) that maximizes mixing
efficiency.25 Table 1 compares optimal channel and groove parameter values taken from
the literature that maximize mixing efficiency25 with measured values of these
parameters for fabricated devices (actual parameters).
Table 1. Optimal channel and groove parameter values taken from the literature that maximize mixing efficiency25
compared with measured values of these parameters for fabricated devices (actual parameters).
Channel parameters Optimal (based on 25)
Channel 1 Channel 2
w - channel width (chosen), µm 300/400 300 400 h/w - channel aspect ratio 0.2/0.15 0.2 0.15
h - channel height, µm 60 60 60 d/h - groove depth to channel height
ratio ≥ 1.6 0.8 0.8
d - groove depth, µm 96 50 50 p - asymmetry index 0.58-0.67 0.62 0.62
θ - groove intersection angle, ° 90 90 90 a - groove width, µm 120/160 105±5 120±2
b - groove spacing, µm 45/60 50±2 65±2 n – number of grooves per half cycle 5-6 6 6

Development of small-volume, microfluidic chaotic mixers for future application in two-dimensional liquid chromatography
91
One of the most important parameters for mixer design is the groove depth ratio (d/h).
Previous studies24,25 showed that mixing performance of both slanted and herringbone grooves
improves with an increase in the value of d/h, achieved using deeper grooves with respect to
channel height. This can be explained by the increased fluid entrainment in the grooves leading
to an increase of the vertical motions of the fluid at the side edges of the groove.25 The influence
of d/h on mixing was investigated experimentally; channel heights were varied from 60 to 90
µm while groove depths were varied from 50 to 20 µm deep, respectively, to achieved d/h of
0.83 down to 0.22. Results will be discussed in the section 3.1. Note that the optimal d/h is 1.6
for the given h/w, according to Lynn and Dandy. This would lead to a groove depth of 96 µm,
which could pose problems from a fabrication perspective as well as introduce excessive dead
volume, adversively affecting chromatographic performance.
Another important parameter is the groove asymmetry (p). The effect of p on the
mixing performance was investigated by Li and Chen using the Lattice-Boltzmann
method for computational simulation and optimization of chaotic micromixers based on
particle mesoscopic kinetic equations.26 The long groove arm is believed to transport
fluid to the other side of the channel. The stirring effect generated in this way is increased
through the interchange of the positions of short and long groove arms every half cycle
(Fig. 1C). Such alteration of the flow motion causes a change in the position of
asymmetric vortices that appear in each half cycle.27 The optimal value of p was found
to be 0.6.26 The same result was shown by Lynn and Dandy,25 and Stroock.14
Several groups have studied the effect of the number of grooves per half cycle (n)
on the mixing performance. Li and Chen found that the mixing depends on n as long as
n≥4.26 The optimal number of grooves per half cycle was found to be 5-6 grooves.26
Another study showed that more mixing cycles lead to better mixing efficiency than
more grooves per cycle.28 Also, previous experiments reported by Stroock14,30 showed
that grooves with an oblique angle of 45° (SG) and an intersection angle of 90° (HG)
can generate maximum transverse flows.
Lynn and Dandy showed for SG that wider grooves (larger a) with smaller groove
spacing (smaller b) increase of the magnitude of secondary flow by up to 50% compared
to the case where 𝑎 = 𝑏.25 However, increasing the width of the groove will result in
more pronounced helical motion only to some extent. According to Du et al.30, the
Ch
ap
ter
III

Microfluidic Tools for Multidimensional Liquid Chromatography
92
mixing length (the distance along the channel at which two solutions are well mixed)
decreases sharply as a/w is increased from 0.2 to 0.25., However, the mixing
performance is hardly improved when the a/w is further increased to 0.4. Decreasing the
groove spacing also allows an increase in the number of cycles within the same channel
length.
Chip Fabrication and Assembly
The microchannels were constructed by standard microfabrication and replicated in the
silicone rubber, poly(dimethylsiloxane) (PDMS) (Sylgard 184, Dow Corning, U.S.). The
PDMS channels were sealed by bonding to glass. The chip layout and design were drawn
using the software Clewin (Wieweb software, Hengelo, The Netherlands). SU-8 masters
were fabricated in a similar way to that used by Stroock,14 through two steps of standard
photolithography. To the best of our knowledge, no detailed description of the

Development of small-volume, microfluidic chaotic mixers for future application in two-dimensional liquid chromatography
93
fabrication has been presented in the literature, though a number of papers refer generally
to the fact that two-step photolithography is used. We therefore present a more detailed
description of the process used to fabricate the masters in the ESI.
Grooved microchannels were fabricated by casting a solution of PDMS
prepolymer onto the master. PDMS resin and curing agent were mixed at a weight ratio
of 10:1 and manually stirred to mix thoroughly. The stirred solution was exposed to mild
vacuum for 30 min to remove air bubbles. After curing on a hot plate for an hour at 70°C,
the PDMS layer was cut into individual devices and peeled off the master (there were
two microchannels on one wafer).
Holes were punched (1.5 mm (od)) into the PDMS device at the locations of the
inlets and outlet, and the glass slides were cleaned with acetone and 96% ethanol. In
order to bond the PDMS channel to the glass slide, PDMS chips and glass slides were
exposed to oxygen plasma for 20 sec. Afterwards, the treated surfaces were immediately
brought into contact with each other. The assembled chips were placed on a hot plate for
30 min at 70°C to enhance the formation of a chemical bond, after which chips were
taken from the hotplate to cool down to room temperature. Teflon tubing (0.8 mm (id),
1.6 mm (od), Polyfluor Plastics, The Netherlands) was inserted directly into the punched
holes in the PDMS layer (Fig. 1A).
Experimental Setup
In order to characterize the degree of mixing, fluorescence detection was used.
Fluorescein (5 μM) in phosphate buffer and phosphate buffer were introduced from
separate inlets into the Y-junction of the channel at different flow rates using syringe
pumps with 5-mL syringes (Prosense, The Netherlands).
The Péclet number (Pe) was used to calculate the flow rates required in channels
with different widths to perform experiments under the same conditions of molecular
mass transport. The Péclet number is a dimensionless parameter that characterizes
molecular mass transport in flow conduits as a ratio of advective transport (flow) rate to
diffusive transport rate:
Pe = v𝑑ℎ
D (1)
Ch
ap
ter
III

Microfluidic Tools for Multidimensional Liquid Chromatography
94
Here v is average linear velocity (mm/s) and D represents diffusion coefficient
(mm2/s); dh denotes hydraulic diameter for rectangular duct (e.g. equivalent diameter of
a channel, mm):
𝑑ℎ =2𝑤(ℎ+𝑑)
𝑤+ℎ+𝑑 (2),
where h is channel height (mm), d, groove depth (mm), and w, channel width.
Mixing was then tested under constant Péclet-number conditions rather than constant
flow rates to ensure the same mass transport conditions in devices with different dimensions
(Table 2).
The Reynolds number (Re) was also calculated in order to confirm that laminar flow
conditions were used for experiments. Re is a dimensionless number that gives a measure of
the ratio of inertial forces to viscous forces for given flow conditions:
Re = v𝑑ℎρ
μ (3),
where dh denotes relevant length (see Equation 2), v is average linear velocity (m/s), ρ
equals the density of the fluid (kg/m3) and μ represents the dynamic viscosity of the fluid
(kg/(m*s)). All experiments were performed under laminar flow conditions (Re ≪
2000).
Table 2. Tested flow rates based on Péclet-number calculation for channels with different
widths; d+h = 110 µm; dh = 0,161 mm (w = 300 µm), dh = 0,173 mm (w = 400 µm), ρ = 103
kg/m3, µ = 10-3 kg/(m*s), D = 2.6×10⁻¹⁰ m2/s (for fluorescein).32
Channel width, µm
Pe, 103 300 400
Re Total flow rate, µL/min
1.0 3.7 4.6 0.3
10.0 37 46 3.0
30.0 111.0 138.0 9.0
50 185.0 230.0 15.0
100 370.0 460.0 30.1
150 556.0 691.6 45.2
200 740.0 920.5 60.1
300 1112.5 1383.2 90.4

Development of small-volume, microfluidic chaotic mixers for future application in two-dimensional liquid chromatography
95
The chip was placed under the fluorescent microscope (model “DMIL”, Leica
Microsystems, The Netherlands), equipped with a 4×objective, an external light source
for fluorescence (EL6000, Leica Microsystems, The Netherlands), and a CCD camera.
For visualization of fluorescence, a fluorescein filter set (488 nm excitation, 518 nm
emission) was used. Images were captured at different positions along the channel with
a CCD camera connected to a computer using a 4x objective magnification with a field
of view of 1.8 mm, a 1-sec exposure time, a gamma setting of 1.75, and a gain of 3.5.
To investigate the mixing mechanism and monitor the mixing behavior over the
cross-sections of the mixing channel, we utilized a confocal microscope (LEICA TCS
SP8, Leica Microsystems B.V.). Devices were mounted on the moving microscope stage
and syringes from syringe pumps were connected to the inlets of the devices. More
information about these experiments may be found in the ESI, Section 3.
All experiments were performed in triplicate using different chips from different
masters which were fabricated using the same procedure.
Data analysis
The degree of mixing was quantified by determining the standard deviation (SD) in
fluorescence intensity across the width of the channel at different locations along its
length. The SD was calculated using the following equation (4)32:
SD = √1
𝑁∑ (𝑥𝑖
𝑁𝑖=1 −)2 (4)
Here, xi is the gray-scale intensity value of pixel i, and is the mean intensity
value of pixels across the entire channel. In order to be able to compare different parts
of the channel, normalized fluorescent intensity was used:
𝑆𝐷𝑛𝑜𝑟𝑚 = 𝑆𝐷
∑ 𝑥𝑖𝑁𝑖=1
(5)
For this, SD (equation (4)) was normalized by the total intensity value of pixels
across the channel (xi). In order to compare different chips, the value of SDnorm for the
position 0 mm was set as 0.5, and the SD values for the other positions were recalculated
respectively. A normalized SD of 0 represents completely mixed solutions (when the
intensity is uniform across the channel) where a value of 0.5 indicates unmixed solutions.
Ch
ap
ter
III

Microfluidic Tools for Multidimensional Liquid Chromatography
96
To calculate SD, images were analyzed using LispixLx85P free software (Allegro
Common LISP v. 8.0, (c) 2004 Franz Inc.) by determining SD of the intensity distribu-
tion across the width of the channel. It should be mentioned that a SD value of 0.01,
which corresponds to 98% mixing, can be considered as corresponding to a completely
mixed situation, as introduction of premixed solutions in the channel yields the value of
SD 0.01. Thus, SD cannot reach a value of 0. This relates to the uniformity of pixel
intensity values on the image itself captured by the CCD camera. We define mixing
efficiency as the ability to accomplish mixing with a minimum time and length. Mixing
within 20-25 mm of the channel is efficient. We consider 98% (SD 0.01) as
corresponding to complete mixing.
Results and Discussion
Optimization of mixing channel design
For application in the 2D LC interfaces, it is important that the passive chaotic
micromixers under consideration possess small internal volumes (on the order of just a
few μL). At the same time, these components should not contribute significantly to
overall pressure drops in the system at the flow rates typically used in 1D (100’s of μL
per minute). Hence, we chose for devices having internal volumes of 1.6 μL and 2.2 μL
(1.5 to 2 times larger than those reported by Stroock et al. 14) with total channel length
of 50 mm in order to maintain pressure drops below 1 bar.14 However, the dimensions
used by Stroock et al.14 cannot simply be multiplied by a constant to achieve mixers with
bigger volumes exhibiting the same performance (mixing efficiency). Particularly
important is the selection of groove depth, width and spacing in relation to altered
channel widths and depths. Optimized channel and groove parameters used in this study
for SG and HG mixers (Table 1) were thus selected or calculated based on a previously
described numerical study by Lynn and Dandy.25
In order to increase the inner volume of the mixer with respect to the original
report by Stroock et al.14, microchannels having widths, w, of 300 and 400 μm and a
height, h, of 60 μm were used for this study. After choosing the values of w and h to
establish channel aspect ratios, h/w, of 0.20 (w = 300 μm) or 0.15 (w = 400 μm), other

Development of small-volume, microfluidic chaotic mixers for future application in two-dimensional liquid chromatography
97
groove parameters (groove depth, d; groove width, a; and groove spacing, b) were
selected or calculated based on h/w (Table 1).25 θ, n and p were kept constant in this
study; d/h, h/w, a/w and b/w were varied.
To test the influence of d/h on mixing, microchannels with HG having different
h and d were fabricated. Three different HG mixers were realized, with d/h = 0.22 (d =
20 μm, h = 90 μm), d/h = 0.37 (d = 30 μm, h = 80 μm), and d/h = 0.83 (d = 50 μm, h =
60 μm). The results obtained are shown in Figure 2, where a definite increase in mixing
efficiency is observed as d/h is increased. SD decreased the further down the channel
mixing efficiency was determined.
For d/h= 0.83 in Fig. 2, complete mixing has been essentially achieved at a
Figure 2. Influence of the groove depth-to-channel height ratio, d/h, on mixing performance in an HG
mixer (n = 3 chips). The total flow rate is 20 µL/min; 300-μm-wide channel; fluorescein (5 μM) in
PBS was mixed with PBS in a 1:1 flow rate ratio; total channel length is 50 mm. The variations in
standard deviation are due in part to the fact that these experiments were carried out over a period of
several months, during which time the lab environment varied somewhat and final adjustments to the
fabrication protocol were being made.
Ch
ap
ter
III

Microfluidic Tools for Multidimensional Liquid Chromatography
98
channel length of 20 mm from the Y-junction. In contrast, mixing has only been partially
achieved at 20 mm for d/h. = 0.22 and 0.37. This is consistent with observations made
in other studies.14,25,26 A probable explanation is related to the two counter-rotating
vortices vortices generated in HG mixers. The size of the larger vortex, formed above
the longer arms of the herringbone grooves, grows as d/h increases28,34. (Supplementary
Figure 2 of the Supplementary Information shows confocal microscopic images of the
cross-sectional flow profile recorded along the length of a HG mixer with w = 300 μm.)
Thus, deeper grooves provide an enhancement in mixing. However, Du et al.31 showed
that increasing the d/h-value is only effective for enhancing mixing within a limited
range of d/h. Optimum values of d/h may be found in a range of 0.28 to 0.7 if h is
decreased or for values between 0.25 and 0.4 if d is increased. A further increase in d
in this latter case does not lead to faster mixing. This can be explained by considering
the location of the transverse fluid transport caused by grooves. In the microchannel,
mixing occurs above the grooves where the vortices are to be found, and chaotic mixing
proceeds rapidly as a result. Mixing also occurs within the grooves; however, mixing in
this region is much less rapid, as it is dictated by laminar flows and slow diffusion. When
d is increased, a large quantity of fluid (more than 60%) enters the grooves, and the slow
diffusional mixing inside the groove becomes significant with respect to the overall
mixing inside the channel.31 A deeper groove could result in a bigger dead volume, in
which molecules could be retained for inordinately long periods of time in real
applications, making mixing inefficient.27
The optimal d/h value for the chosen h/w ratios was 1.6 or larger, according to
Lynn and Dandy.25 However, for h = 60 µm, this implies grooves that are at least 96 µm
deep. This would introduce a large dead volume to the mixer which could adversely
influence chromatographic results through increased band broadening in future
applications. For this reason, d/h=0.8 was chosen (d = 50 µm h=60 µm). This value still
provides enhanced mixing, but does not contribute a large dead volume as discussed
below.

Development of small-volume, microfluidic chaotic mixers for future application in two-dimensional liquid chromatography
99
Mixing performance in the different types of microchannels with different groove arrays
In order to determine which mixer exhibits the most suitable performance for the
application at hand, three types of microchannels were investigated: 1) channels with
slanted grooves (SG) and 2) herringbone grooves (HG), and 3) channels with no grooves
(NG). In addition, channels having w = 300 μm or 400 μm were studied. The efficiency
with which PBS and PBS-fluorescein solutions are mixed in these types of channels is
compared in Figure 3. The standard deviation of fluorescence intensity across the
channel is plotted versus distance along the channel for a wide range of flow rates.
Experiments were carried out in channels with w = 300 µm (Fig. 3A) and w = 400 µm
(Fig. 3B) in the range of Pe values from 103 to 3×10⁵ (Table 2). Data is shown only for
low (Pe = 103, solid line) and high (Pe = 105, dashed line) flow rates in Fig. 3.
Incomplete mixing is observed in the NG channel at low flow rate (Pe = 103) at
a channel length of 50 mm for both channels widths studied. The mixing in these
channels relies entirely on diffusion of molecules between side-by-side flows, which is
a slow process. (Molecules would require more than 10 seconds to diffuse from the
interface between solution streams at the middle of the channel to the sides. This is a
long time when compared to the residence time of molecules in the channel at even low
flow rates, see Table 2 and Fig. 3D.) In fact, mixing at the lower flow rate in the 300-µm-
wide ungrooved (NG) channel (Fig. 3A), though incomplete at the end of the 50-mm
channel, is more complete than in the 400-µm-wide ungrooved (NG) channel (Fig. 3B).
This is in keeping with the longer radial distance that solutes need to travel by diffusion
for mixing to occur in the wider channel.
Increasing the flow rate by a factor of 100 (Pe = 105) would lead to decreased
residence times of solutes in the microchannel and thus to negligible mixing or no mixing
at all. Introducing a mixer with slanted or herringbone grooves results in more efficient
mixing, as presented in Stroock’s original study.14
For the grooved channels, we observe a similar decrease in mixing efficiency, especially
at low flow rate, for the 400-µm-wide channel compared to the 300-µm-wide channel, which
means that, perhaps, similar diffusional effects as discussed above could still be playing a role.
We tried to compensate for the increase in w/h by maintaining the a/w ratio, widening the
grooves from 105 µm (as in the 300-µm-wide channel in Fig. 3A) to 120 µm for the 400-µm
Ch
ap
ter
III

Microfluidic Tools for Multidimensional Liquid Chromatography
100
wide channel in Fig. 3B. Based on experimental data which is not shown, we assume that even
wider and deeper grooves would improve the mixing efficiency further in the 400-µm-wide
channel. Considering the better performance of the 300-μm-wide channel (Fig. 3A and B) and
its smaller volume (1.6 µL compared to 2.2 µL of the 400-μm-wide channel), we selected the
300-μm-wide channel for further studies.
If we look at channels which are 300 µm wide, it can be seen that in the HG mixer (red
dots on Fig. 3A), 98% of mixing is completed by a distance of 10 mm and 15 mm for Pe of 103
and 105, respectively. These findings are in good agreement with values obtained by Stroock14
for the same Péclet number but for a channel with smaller cross-sectional area. For the SG
mixer(blue dots, Fig. 3A), the required distances for complete mixing are 20 and 35 mm for Pe
of 103 and 105, respectively. From these data, we can conclude that herringbone grooves
provide better mixing performance than slanted grooves for all the flow rates tested. This is
consistent with observations from other studies.25,35 The HG mixer is 30 and 55 times more
efficient than the NG channel, and 2.0 and 3.8 times more efficient than the SG mixer, at 3.7
µL/min and 370 µL/min, the HG mixer lies in the difference between the processes involved in
mixing. In general, grooves enhance mixing because of the additional motion of fluids
(stretching and folding), which leads to an increased contact area between the solutions to be
mixed, thereby decreasing diffusion lengths. Stretching and folding of solution volumes inside
the mixers proceeds exponentially as a function of the distance travelled along the channel.14,36
In the SG mixer, mixing happens through generation of a single helical flow along the axis of
flow (a more detailed mechanism for SG is reported elsewhere).29 This requires a longer
distance to complete mixing. In contrast, mixing in the HG mixer occurs as a result of the
formation of two oppositely rotating vortices across the channel. This makes the HG mixer
more efficient.

Development of small-volume, microfluidic chaotic mixers for future application in two-dimensional liquid chromatography
101
In order to investigate the influence of Péclet number on mixing efficiency, we
tested the 300-µm-wide HG mixer over a wide range of the Péclet numbers, namely 103
to 3×10⁵ which corresponds to a flow rate range of 3.7 to 1114 µL/min (Table 2). As
Figure 3. Comparison of microfluidic mixers having no grooves (NG), slanted grooves (SG) and
herringbone grooves (HG) as a function of distance from the Y-junction for channel widths of 300 µm
(A) and 400 µm (B) at different flow rates: Pe=103 (solid line) and Pe=105 (dashed line). The flow rate
in each case is the total flow rate in the mixing channel, with a 1:1 flow rate ratio of PBS (fluorescein)
- PBS; n = 3 chips. For grooved channels: d = 50 µm and h = 60 µm; for ungrooved channels, h = 110
µm; a=105 µm for the 300-µm-wide channel, a=120 µm for the 400-µm-wide channel. (C) Standard
deviation versus position along the channel for the 300-µm-wide HG mixer for Pe in the range of 103
to 3×10⁵, which corresponds to the flow-rate range of 3.7 to 1114 µL/min (Table 2). Microphotographs
are presented to show mixing at (a) 0 mm; (b) 5 mm; (c) 15 mm; (d) 35 mm. (D) Residence times at
different flow rates (Pe = 103-105) for HG mixer; flow rate ratio of PBS ( (fluorescein)-PBS was 1:1;
total channel length is 50 mm for all channels. The observed range of standard deviation is 0.05-0.15 at
5 mm.
Ch
ap
ter
III
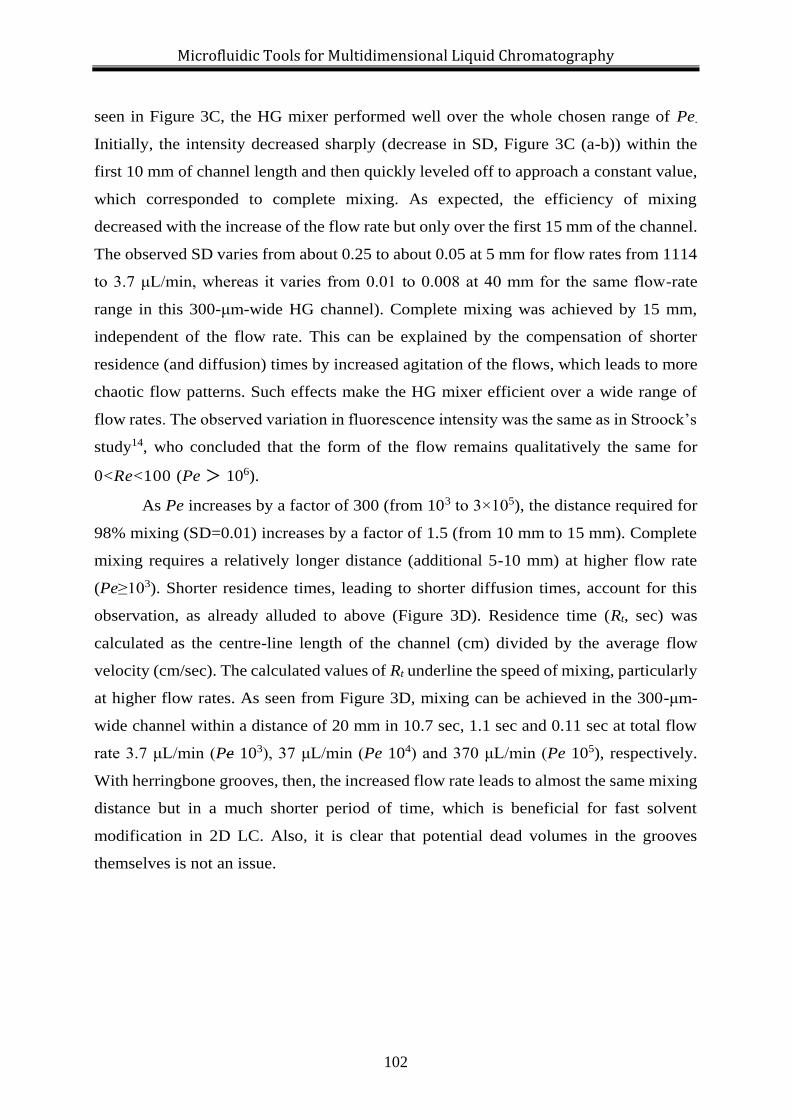
Microfluidic Tools for Multidimensional Liquid Chromatography
102
seen in Figure 3C, the HG mixer performed well over the whole chosen range of Pe.
Initially, the intensity decreased sharply (decrease in SD, Figure 3C (a-b)) within the
first 10 mm of channel length and then quickly leveled off to approach a constant value,
which corresponded to complete mixing. As expected, the efficiency of mixing
decreased with the increase of the flow rate but only over the first 15 mm of the channel.
The observed SD varies from about 0.25 to about 0.05 at 5 mm for flow rates from 1114
to 3.7 μL/min, whereas it varies from 0.01 to 0.008 at 40 mm for the same flow-rate
range in this 300-μm-wide HG channel). Complete mixing was achieved by 15 mm,
independent of the flow rate. This can be explained by the compensation of shorter
residence (and diffusion) times by increased agitation of the flows, which leads to more
chaotic flow patterns. Such effects make the HG mixer efficient over a wide range of
flow rates. The observed variation in fluorescence intensity was the same as in Stroock’s
study14, who concluded that the form of the flow remains qualitatively the same for
0<Re<100 (Pe > 106).
As Pe increases by a factor of 300 (from 103 to 3×10⁵), the distance required for
98% mixing (SD=0.01) increases by a factor of 1.5 (from 10 mm to 15 mm). Complete
mixing requires a relatively longer distance (additional 5-10 mm) at higher flow rate
(Pe≥103). Shorter residence times, leading to shorter diffusion times, account for this
observation, as already alluded to above (Figure 3D). Residence time (Rt, sec) was
calculated as the centre-line length of the channel (cm) divided by the average flow
velocity (cm/sec). The calculated values of Rt underline the speed of mixing, particularly
at higher flow rates. As seen from Figure 3D, mixing can be achieved in the 300-μm-
wide channel within a distance of 20 mm in 10.7 sec, 1.1 sec and 0.11 sec at total flow
rate 3.7 μL/min (Pe 103), 37 μL/min (Pe 104) and 370 μL/min (Pe 105), respectively.
With herringbone grooves, then, the increased flow rate leads to almost the same mixing
distance but in a much shorter period of time, which is beneficial for fast solvent
modification in 2D LC. Also, it is clear that potential dead volumes in the grooves
themselves is not an issue.

Development of small-volume, microfluidic chaotic mixers for future application in two-dimensional liquid chromatography
103
Mixing of different solvents
Micromixers designed in this study will be implemented for the modification of mobile
phase eluting from the first dimension before entering the second dimension in 2D LC.
This application requires mixing of different solvents to tune the ability of a mobile
phase to elute analytes from a stationary phase. In order to investigate the efficiency of
the HG mixer, two of the most commonly used solvents in liquid chromatography,
acetonitrile (ACN) and methanol (MeOH), were chosen for further experiments. First,
these solvents were mixed with phosphate-buffered saline (PBS) at equal (1:1) flow rate
ratios. Figure 4 shows images obtained with a fluorescent microscope which have been
stitched together to show the first 20 mm of the 300-μm-wide, 60-μm-deep channel with
herringbone grooves (d = 50 µm). The solution of fluorescein in PBS (green color) from
the left inlet (upper inlet in images) and solution of PBS (Fig. 4A), ACN (Fig. 4B) or
MeOH (Fig. 4C) from the right inlet (lower inlet in images) were introduced at equal
flow rates. As the mixing proceeds along the channel, the observed fluorescence
gradually expands to cover the whole channel width, and an almost equal distribution of
fluorescence can be observed at the 20-mm mark in the channel, indicating almost
complete mixing. Here, as in all previous experiments, the absolute intensity of the
fluorescence decreases, which is related to the dilution effect. The same chaotic flow
patterns, observed with confocal microscopy in the channel cross-section (ESI, Fig. S2),
appear as striations when viewed from above in Figure 4.
Ch
ap
ter
III
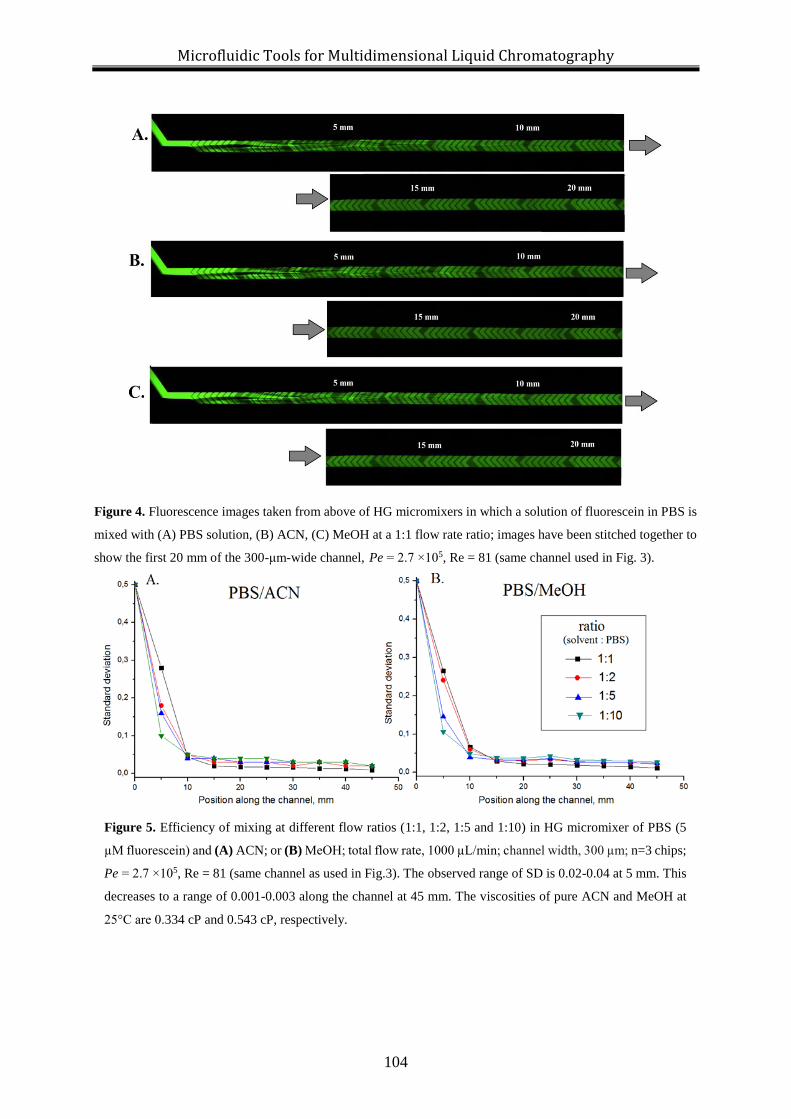
Microfluidic Tools for Multidimensional Liquid Chromatography
104
Figure 4. Fluorescence images taken from above of HG micromixers in which a solution of fluorescein in PBS is
mixed with (A) PBS solution, (B) ACN, (C) MeOH at a 1:1 flow rate ratio; images have been stitched together to
show the first 20 mm of the 300-μm-wide channel, Pe = 2.7 ×10⁵, Re = 81 (same channel used in Fig. 3).
Figure 5. Efficiency of mixing at different flow ratios (1:1, 1:2, 1:5 and 1:10) in HG micromixer of PBS (5
µM fluorescein) and (A) ACN; or (B) MeOH; total flow rate, 1000 µL/min; channel width, 300 µm; n=3 chips;
Pe = 2.7 ×10⁵, Re = 81 (same channel as used in Fig.3). The observed range of SD is 0.02-0.04 at 5 mm. This
decreases to a range of 0.001-0.003 along the channel at 45 mm. The viscosities of pure ACN and MeOH at
25°C are 0.334 cP and 0.543 cP, respectively.

Development of small-volume, microfluidic chaotic mixers for future application in two-dimensional liquid chromatography
105
In order to enable the solvent modification between dimensions in 2D LC, a
relevant solvent (e.g. water) should be mixed with the 1D eluent. In most cases, the 1D
effluent will contain a high percentage of organic solvent which should be diluted five
or ten times. Thus, ACN or MeOH were introduced together with PBS solution at
different flow rate ratios: 1:1, 1:2, 1:5 and 1:10 (Fig. 5). A solution of 5 μM fluorescein
in PBS was used to visualize the mixing. All experiments were designed to maintain a
total flow rate of 1 mL/min (Pe = 2.7×10⁵). In general, for both ACN/PBS and
MeOH/PBS systems no significant difference in mixing efficiency was observed and the
mixing was complete at a distance of 45 mm. The fact that mixing efficiency was
unaffected by buffer-solvent flow rate ratios is noteworthy. Both ACN/PBS and
MeOH/PBS mixtures can exhibit viscosities which are different from the pure solvents
(the viscosities of pure ACN and MeOH at 25°C are 0.334 cP and 0.543 cP,
respectively), as a function of mixing ratios. In fact, a 45:55 MeOH/H2O mixture has a
viscosity of 1.83 cP, which is almost twice that of water alone. For the ACN/PBS system
the maximum viscosity is 1.15 cP (20°C) at 10-30% of ACN.37 However, such changes
in viscosity had no visible effect on the mixing of MeOH and water solution in the HG
micromixer.
It should be mentioned that the appearance of bubbles was observed when mixing
methanol with PBS solution at low flow rate at channel distances greater than 15 mm,
despite the fact that we degassed the methanol prior to experiments. This can be related
to the fact that mixing of methanol and water is an exothermic process38 resulting in a
decrease of gas solubility which leads to the production of air bubbles.
C
ha
pte
r II
I

Microfluidic Tools for Multidimensional Liquid Chromatography
106
Supplementary information
Chip fabrication and assembly
The microchannels were constructed by standard microfabrication and replicated in the silicone
rubber, poly(dimethylsiloxane)(PDMS)(Sylgard 184, Dow Corning, U.S.). The chip layout and
design were drawn using the software Clewin (Wieweb software, Hengelo, The Netherlands).
Masters were fabricated using two steps of standard photolithography in the negative
photoresists SU-8 50 and SU-8 10 (MicroChem). These resists were optimized for different
layer thicknesses (SU-8 50 was used to pattern microchannels, and SU-8 10 to pattern the
grooves) (Supplementary Figure 1A). The conditions were chosen based on the recommended
parameters described by MicroChem, the manufacturer of SU-8 photoresists.39,40
A 4-inch borofloat wafer (700 µm thickness, Borofloat 33, Handelsagentur Helmut
Teller, Jena, Germany) was employed as a substrate. The wafer was cleaned sequentially with
acetone, isopropyl alcohol, and ultrapure water, dried with N2 gas and baked for 5 min at 150oC
to remove residual water. A first layer of negative photoresist (PR), SU-8 50 (MicroChem,
Newton, MA), was coated on the wafer using 500 rpm for 13 sec followed by different speeds,
depending on the required layer thickness (Table S-1). The wafers were then soft-baked (from
20oC to 65oC in 45 min, 8 min at 65oC, from 65oC to 95oC in 30 min, 25 min at 95oC and cooled
down to room temperature on the hotplate). The coated wafer was illuminated with ultraviolet
(UV) light (365 nm, 10 mW/cm2) from a collimated light source to pattern the microchannels,
using a photomask printed on a transparency (resolution 3,810 dpi; Pro-Art BV, Groningen,
The Netherlands). The illumination was followed by a post-bake step (from 20oC to 65oC in 45
min, 1 min at 65oC, from 65oC to 95oC in 30 min, 8 min at 95oC and cooled down to room
temperature).
Wafers were then exposed to oxygen plasma (Harrick plasma, USA) to ensure adhesion
of the second photoresist layer for 20 sec. The second layer of SU-8 10 photoresist was spin-
coated with SU-8 10 (MicroChem, Newton, MA) at different speeds, depending on the required
layer thickness (Supplementary Table 1), soft-baked at the conditions mentioned above and
illuminated by UV light. The second photomask, which contains the pattern for grooves only,
was aligned manually with the microchannels in the first layer under the microscope using
alignment marks. After the post-bake step, wafers were immersed in SU-8 developer for 15

Development of small-volume, microfluidic chaotic mixers for future application in two-dimensional liquid chromatography
107
min, rinsed with isopropanol and dried using N2 gas. They were then placed under vacuum in
the presence of hexamethyldisilazane (HMDS) (Sigma-Aldrich, Germany) for at least 30 min
to make the wafer surface more hydrophobic and thus facilitate the peeling of the cured
PDMSfrom the masters. The heights of the channels and grooves on the masters were
determined using a profilometer (Veeco Instrument BV, located in the Zernike NanoLab
Groningen, The Netherlands).
Supplementary figure 1. (A) A schematic diagram of the two-step photolithography fabrication
process. (B) Schematic drawing (top view) of the three types of channels investigated in this study:
channel without grooves (1); channel with slanted grooves (2); channel with herringbone grooves (3).
Supplementary table 1. Spin coating conditions for different photoresist layer thickness.
1st layer (SU-8 50) 2nd layer (SU-8 10)
Speed, rpm Layer thickness, μm Speed, rpm Layer thickness, μm
1600 (40 sec) 60 750 (30 sec) 50
1300 (40 sec) 80 1300 (35 sec) 30
1300 (35 sec) 90 1500 (45 sec) 20
Ch
ap
ter
III

Microfluidic Tools for Multidimensional Liquid Chromatography
108
Investigation the mixing mechanism
Evaluation of the degree of mixing by conventional microscopy in the manner that we have
done may yield misleading data with respect to mixing in microchannels. Image analysis for
our reported experiments was done using top-view images of the channel. However, during
mixing, fluids change their orientations inside the channel, and fluid zones containing different
dye concentrations can be situated perpendicular or parallel to the camera of the microscope.
This means that an observed equal distribution of fluorescence for the channel top-view may
not necessarily correspond to complete mixing. In order to confirm the reliability of of our
image analysis, and at the same time investigate the mixing mechanism at the cross-sections of
the mixing channel, we utilized confocal microscopy.
Supplementary Figure 2 shows the cross sections of the HG mixer at positions from 0
to 9.5 mm along the channel obtained by confocal microscopy. The first image (position 0 mm)
shows two fluids, PBS and PBS-fluorescein, flowing in the channel before entering the region
with grooves. The second image represents the situation where the solution from the left inlet
hits the sharp edge of the groove and a portion of the solution moves along the long groove
arm. At this point the flow from the left inlet splits into two parts, as was reported previously
by Yang et al.24 One part of the flow moves further to the right side, enters the groove and hits
the next rigid curve backwards, which results in formation of the counterclockwise-rotating
vortex. Another part of the flow rolls out of the groove on the left side and returns to the
mainstream. This process results in clockwise rotation. On the images obtained with confocal
microscopy (Suppl. Fig. 2) the generation of two counter-rotating asymmetrical vortices can be
clearly observed. These vortices change in asymmetry from one half-cycle to another. For this
micromixer with a groove width, a, of 80 µm and channel width, w, of 300 µm, grooves start
at 0.78 mm and one full cycle occupies 2.0 mm (each half-cycle is 0.98 mm plus interval
between half-cycles). Therefore, there are 21 full cycles within the 50 mm channel length.
Moving from a position of 2.3 mm (Supplementary Fig. S-2.B), which indicates the first half-
cycle, to a position of 3.2 mm, which indicates the second half-cycle, we clearly see two
counter-rotating vortices with changed asymmetry in between half-cycles. These results are in
good agreement with both the numerical simulations 24,29,35 and experimental results by Stroock
et al. 14,30

Development of small-volume, microfluidic chaotic mixers for future application in two-dimensional liquid chromatography
109
Yang et al.24 identified two dominant mechanisms of mixing in the HG mixer: (1) the
stretching and folding of the interface due to the vertical motions of flow at the side edge of the
groove and (2) the increase in contact area between the two fluids due to fluid transportation
inside the groove. Stretching and folding are chaotic processes that lead to the production of
chaotic advection.13 The flow velocity components are constant over space and time in chaotic
advection, in contrast to the turbulent flow where these are considered to be random.29
Supplementary figure 2. Images of the cross sections of the HG mixer obtained using confocal microscopy at
total flow rate (A) 20 μL/min (Pe ~ 5×10³, Re 1.6) and (B) 200 μL/min (Pe ~ 50×103, Re 16.3); distance from the
Y-junction: 0 - 11.5 mm of the channel length; w = 300 μm; a = 80 μm; PBS (fluorescein)-PBS 1:1. Mixing is
facilitated by the generation of two counter-rotating asymmetrical vortices. Equal distribution of fluorescein on
the images indicates the complete mixing.
Experiments were carried out using two flow rates: 20 μL/min (Suppl. Fig. 2A) and 200
μL/min (Suppl. Fig. 2B). It is reasonable to expect that mixing should be achieved faster at the
lower flow rate. The influence of the flow rate on the behavior of mixing can be clearly
observed. Compared with the smooth vortices (due to longer residence time) at lower flow rate
(Suppl. Fig. 2A), the high flow rate introduces agitation to the flows creating more chaotic flow
patterns and increasing the contact area between them. Such effects are what make the HG
mixer efficient over the wide range of flow rates tested. As the flow rate increases by a factor
of 10 (from 20 to 200 μL/min), the distance required for complete mixing increases only by a
factor of 1.35 (from 7.0 to 9.5 mm). These results are in good accordance with our previous
Ch
ap
ter
III

Microfluidic Tools for Multidimensional Liquid Chromatography
110
data (Figure 3) obtained by fluorescence microscopy, where we showed that 10 mm was enough
to complete mixing at Pe < 105.

Development of small-volume, microfluidic chaotic mixers for future application in two-dimensional liquid chromatography
111
Conclusions
We have successfully demonstrated chaotic micromixers, which are larger than those
originally reported by Stroock et al.,14 with optimized channel and groove geometries,
designed using previously reported numerical studies. The resulting micromixers can be
used at flow rates ranging from 150 to 1000 µL/min without significant differences in
the mixing efficiency. We confirm that the HG mixer works significantly better than the
SG mixer or the NG channel. The HG mixer is 55 times more efficient than the NG
channel and 3.8 times more efficient than the channel with SG at 370 µL/min. Mixing
can be achieved within 45 ms in the 300-μm-wide channel at a flow rate of 1.1 mL/min
at a distance of less than 25 mm.
In this work, we have also demonstrated mixing of different solvents in HG
micromixers. Mixers can rapidly mix aqueous buffers with ACN and MeOH solutions
at different flow rate ratios at flow rates in the range of 5-1000 µl/min, which makes it
possible to use micromixers for applications in 2D LC. Future work will be directed
towards implementation of mixers into 2D LC systems.
Acknowledgements
This work was financially supported by The Netherlands Organization for Scientific Research
(NWO) in the framework of the Technology Area-COAST program, project no. (053.21.102)
(HYPERformance LC). C
ha
pte
r II
I

Microfluidic Tools for Multidimensional Liquid Chromatography
112
References
1. François, I., Sandra, K. & Sandra, P. Comprehensive liquid chromatography: Fundamental aspects and
practical considerations-A review. Anal. Chim. Acta 641, 14–31 (2009).
2. Dugo, P., Cacciola, F., Kumm, T., Dugo, G. & Mondello, L. Comprehensive multidimensional liquid
chromatography: Theory and applications. J. Chromatogr. A 1184, 353–368 (2008).
3. Mayfield, K. J. et al. Viscous fingering induced flow instability in multidimensional liquid chromatography.
J. Chromatogr. A 1080, 124–131 (2005).
4. Van Der Horst, A. & Schoenmakers, P. J. Comprehensive two-dimensional liquid chromatography of
polymers. J. Chromatogr. A 1000, 693–709 (2003).
5. Gargano, A. F. G., Duffin, M., Navarro, P. & Schoenmakers, P. J. Reducing Dilution and Analysis Time
in Online Comprehensive Two-Dimensional Liquid Chromatography by Active Modulation. Anal. Chem.
88, 1785–1793 (2016).
6. Wang, D. et al. On-line two-dimensional countercurrent chromatography × high performance liquid
chromatography system with a novel fragmentary dilution and turbulent mixing interface for preparation
of coumarins from Cnidium monnieri. J. Chromatogr. A 1406, 215–223 (2015).
7. Brochure provided by Analytical Scientific Instruments US, http://www.hplc-asi.com/static-mixers/. (2014).
8. Singh, M. K., Anderson, P. D. & Meijer, H. E. H. Understanding and optimizing the SMX static mixer.
Macromol. Rapid Commun. 30, 362–376 (2009).
9. Whitesides, G. M. The origins and the future of microfluidics. Nature 442, 368–373 (2006).
10. Agilent 1290 Infinity LC System, Manual and Quick Reference, Agilent Technologies. (2012).
11. Nguyen, N.-T. & Wu, Z. Micromixers—a review. J. Micromechanics Microengineering 15, R1–R16
(2005).
12. Lee, C.-Y., Chang, C.-L., Wang, Y.-N. & Fu, L.-M. Microfluidic Mixing: A Review. Int. J. Mol. Sci. 12,
3263–3287 (2011).
13. Nguyen, N.-T. & N.-T. Nguyen. Micromixers: Fundamentals, Design and Fabrication. Igarss 2014
(William Andrew Publishing, 2011). doi:10.1016/B978-1-4377-3520-8.00001-2
14. Stroock, A. D. et al. Chaotic mixer for microchannels. Science 295, 647–651 (2002).
15. Moon, B.-U. et al. An enzymatic microreactor based on chaotic micromixing for enhanced amperometric
detection in a continuous glucose monitoring application. Anal. Chem. 82, 6756–6763 (2010).
16. Yoon, S. K., Fichtl, G. W. & Kenis, P. J. A. Active control of the depletion boundary layers in microfluidic
electrochemical reactors. Lab Chip 6, 1516–1524 (2006).
17. Abonnenc, M., Dayon, L., Perruche, B., Lion, N. & Girault, H. H. Electrospray micromixer chip for on-
line derivatization and kinetic studies. Anal. Chem. 80, 3372–3378 (2008).
18. Golden, J. P., Floyd-Smith, T. M., Mott, D. R. & Ligler, F. S. Target delivery in a microfluidic
immunosensor. Biosens. Bioelectron. 22, 2763–7 (2007).
19. Lund-Olesen, T., Dufva, M. & Hansen, M. F. Capture of DNA in microfluidic channel using magnetic
beads: Increasing capture efficiency with integrated microfluidic mixer. J. Magn. Magn. Mater. 311, 396–
400 (2007).
20. Hsu, C.-H., Di Carlo, D., Chen, C., Irimia, D. & Toner, M. Microvortex for focusing, guiding and sorting
of particles. Lab Chip 8, 2128–2134 (2008).
21. Foley, J. O., Mashadi-Hossein, A., Fu, E., Finlayson, B. A. & Yager, P. Experimental and model
investigation of the time-dependent 2-dimensional distribution of binding in a herringbone microchannel.
Lab Chip 8, 557 (2008).
22. Stott, S. L. et al. Isolation of circulating tumor cells using a microvortex-generating herringbone-chip. Proc.
Natl. Acad. Sci. 107, 18392–18397 (2010).
23. Wang, S. et al. Highly Efficient Capture of Circulating Tumor Cells by Using Nanostructured Silicon
Substrates with Integrated Chaotic Micromixers. Angew. Chemie Int. Ed. 50, 3084–3088 (2011).
24. Yang, J.-T., Huang, K.-J. & Lin, Y.-C. Geometric effects on fluid mixing in passive grooved micromixers.
Lab Chip 5, 1140–1147 (2005).
25. Lynn, N. S. & Dandy, D. S. Geometrical optimization of helical flow in grooved micromixers. Lab Chip 7,
580–587 (2007).
26. Aubin, J., Fletcher, D. F. & Xuereb, C. Design of micromixers using CFD modelling. Chem. Eng. Sci. 60,
2503–2516 (2005).
27. Li, C. & Chen, T. Simulation and optimization of chaotic micromixer using lattice Boltzmann method.
Sensors Actuators B Chem. 106, 871–877 (2005).

Development of small-volume, microfluidic chaotic mixers for future application in two-dimensional liquid chromatography
113
28. Schönfeld, F. & Hardt, S. Simulation of Helical Flows in Microchannels. AIChE J. 50, 771–778 (2004).
29. Tóth, E., Holczer, E., Iván, K. & Fürjes, P. Optimized Simulation and Validation of Particle Advection in
Asymmetric Staggered Herringbone Type Micromixers. Micromachines 6, 136–150 (2015).
30. Stroock, A. D. & Whitesides, G. M. Controlling flows in microchannels with patterned surface charge and
topography. Acc. Chem. Res. 36, 597–604 (2003).
31. Du, Y., Zhang, Z., Yim, C., Lin, M. & Cao, X. A simplified design of the staggered herringbone micromixer
for practical applications. Biomicrofluidics 4, 1–13 (2010).
32. Periasamy, N. & Verkman, A. S. Analysis of fluorophore diffusion by continuous distributions of diffusion
coefficients: application to photobleaching measurements of multicomponent and anomalous diffusion.
Biophys. J. 75, 557–567 (1998).
33. Xia, H. M., Wan, S. Y. M., Shu, C. & Chew, Y. T. Chaotic micromixers using two-layer crossing channels
to exhibit fast mixing at low Reynolds numbers. Lab Chip 5, 748–755 (2005).
34. Ansari, M. A. & Kim, K. Y. Shape optimization of a micromixer with staggered herringbone groove. Chem.
Eng. Sci. 62, 6687–6695 (2007).
35. Aubin, J., Fletcher, D. F., Bertrand, J. & Xuereb, C. Characterization of the mixing quality in micromixers.
Chem. Eng. Technol. 26, 1262–1270 (2003).
36. Kee, S. P. & Gavriilidis, A. Design and characterisation of the staggered herringbone mixer. Chem. Eng. J.
142, 109–121 (2008).
37. Snyder L. R., Kirkland J. J., D. J. W. Introduction to modern liquid chromatography. (A John Wiley &
Sons, Inc., Publication, 2010).
38. Aburjai, T., Muhammed, A. & Al-Hiari, Y. M. Temperature and Pressure Behaviours of Methanol,
Acetonitrile/Water Mixtures on Chromatographic Systems. Am. J. Anal. Chem. 02, 934–937 (2011).
39. Brochure provided by NANOTM SU-8 Negative Tone Photoresist Formulations 50-100.
40. Brochure provided by NANOTM SU-8 Negative Tone Photoresist Formulations 2-25.
Ch
ap
ter
III


Chapter IV
Fabrication of a pressure-resistant
microfluidic mixer in fused silica
using Selective Laser-Induced
Etching
Margaryta A. Ianovska1,2, Jean-Paul S.H. Mulder1, Martin Hermans3, Elisabeth
Verpoorte1
1Pharmaceutical Analysis, Groningen Research Institute of Pharmacy, University of
Groningen, The Netherlands
2 TI-COAST, Amsterdam, The Netherlands
3 LightFab GmbH, Aachen, Germany

Abstract
We report a microfluidic mixer fabricated in a solid block of fused silica using Selective Laser-
Induced Etching (SLE). The micromixer contains herringbone grooves (HG) that induce mixing
based on chaotic advection, as investigated in our previous work. The chip was designed for
utilization in the interface between two columns in a multidimensional liquid chromatography
system, which implies the utilization of pressure-resistant devices. Our first chips were hybrid
devices made from poly(dimethylsiloxane) (PDMS) and glass. These devices could not
withstand pressures higher than 10 bar, due both to the elastic properties of PDMS and a lack
of a robust bond between PDMS and glass. We therefore opted for utilization of a relatively
new technique, namely Selective Laser-Induced Etching (SLE), as a route to making monolithic
devices in a single block of a rigid material. Our material of choice was a block of fused silica.
This eliminates the need to bond a structured chip to a chip acting as the lid for a microfluidic
device. Moreover, fused silica is four orders of magnitude more rigid than PDMS and can thus
withstand higher pressures. We aimed to fabricate in silica, for the first time, microfluidic
mixers with channels up to 33 mm long containing arrays of microgrooves. Fabrication proved
challenging, as removing laser-modified silica from the patterned channels by the introduction
of etchant from the channel ends meant longer exposure to etchant at the beginning and end of
the mixing channel. This resulted in overetching of the channel and grooves in the end regions
with an accompanying loss of groove resolution. In order to solve these fabrication issues and
to account for differences in etch progression in different device regions, we have made use of
an adjusted design that provided improved mixing performance. The pressure tests showed that
the fused-silica chips can withstand pressures of up to 85 bar and can be used in the interface
between two columns of a multidimensional liquid chromatography system to facilitate the fast
adjustment of mobile phase composition.
Keywords: micromixers; pressure-resistant chips; fused silica chips; Selective Laser-Induced
Etching (SLE); Femtosecond Laser Irradiation followed by Chemical Etching (FLICE).

Fabrication of a pressure-resistant microfluidic mixer in fused silica using selective laser-induced etching
117
Introduction
The growing interest in microfluidics over the last few decades has led to the development of
many different techniques and methods for fabrication of microfluidic devices in scientific
settings in both academia and industry. Miniaturization imparts such advantages as reduced
consumption of reagents, shortened analysis times, and the possibility to have good control over
flow conditions, as well as mass and heat transfer.1 This makes microfluidics an attractive field
for flow chemistry, materials sciences and also as a means to realize components to improve
state-of-the-art analytical separation techniques such as high performance liquid
chromatography (HPLC). Very often such applications require utilization of high pressures.
Therefore, development of different types of pressure-resistant microfluidic systems recently
became a new trend in the microfluidics field.1
There is a big variety of materials available for chip fabrication, such as silicon, glass
and elastomeric polymers. Polydimethylsiloxane (PDMS) has gained wide acceptance in the
academic microfluidics community due to its low cost, robustness, route to simple device
fabrication, optical transparency and non-toxicity.2 In previous work,3 we developed a 1.6-μL
microfluidic mixer that provides good mixing within seconds at flow rates compatible with
LC×LC (0.1-1 mL/min). This chip was designed to be placed in the interface between two
columns of a multidimensional liquid chromatography system and so had to withstand high
pressure pulses (up to 200 bar), which arise from valve switching and additional back pressure
from the second column. In order to provide mixing, the device contained an array of
herringbone-shaped grooves (herringbone grooves, HG) with a depth of 50 µm and a width of
110 µm. The presence of these grooves led to the generation of two counter-rotating vortices
by chaotic advection.4 This mixer was fabricated in PDMS bonded to a glass plate. However,
the elastomeric nature of PDMS and its low Young's modulus become a significant problem for
the development of a chip that could withstand high pressures. In our experience, device failure
occurred above pressures of 10 bar either in the PDMS itself (mostly) or at the interface between
the PDMS and glass. Even at low flow rates, significant channel deformation can occur, which
leads to alterations of the flow profile and subsequently to changes in device performance.2
Because of problems mentioned above, other materials are used in order to fabricate
high-pressure resistant chips, such as polymers (e.g. cyclic olefin copolymer, COC),5–7 or glass
Ch
ap
ter
IV

Microfluidic Tools for Multidimensional Liquid Chromatography
118
and silicon.8–11 Liu et al.5 developed a COC chip containing in situ photopolymerized
polymethacrylate monolithic stationary phases for HPLC separations of fluorescein-labelled
intact proteins. This chip was fabricated by hot embossing and can withstand 200 bar. Another
chip suitable for liquid chromatography was demonstrated by Chen et al.6 with a maximum
burst pressure (the pressure that a device can withstand before failing) of 400 bar. It was also
fabricated using COC but by direct microscale mechanical milling. Several examples of
silicon/pyrex10 and glass/glass11 microreactors that can be used at pressures up to 300 bar have
been presented. Silicon/pyrex chips have been fabricated using deep-reactive-ion etching
(DRIE) followed by anodic bonding of the twp layers,10 whereas for fabrication of glass/glass
microreactors11 wet etching and direct fusion bonding were used. Recently, an alternative
method for inexpensive rapid prototyping based on off-stoichiometry thiolenes (OSTEs) was
demonstrated by Martin et al.1 The chip, fabricated using UV-curable OSTE and bonded to
glass, could withstand 200 bar, and was used to perform multiphase flow visualization studies
in microchannels. However, the chip fabricated in this study had a square cross-sectional
channel of 200 µm without any features inside.
Multiple methods for fabrication of microfluidic devices exist, each with unique
advantages and drawbacks. Injection molding and hot embossing can be considered as fast but
expensive methods for polymer prototyping due to the high initial cost of making the molds.
On the other hand, glass/silicon micromachining processes by wet/dry etching create good-
precision structures but are technically demanding and time consuming to fabricate.2 Direct
fabrication methods such as micromilling and laser ablation, though cost-accessible and
enabling complex 3D-multilayer structures, have low resolution (around 50 µm). They also
generate surface roughness, and fabrication has limited throughput due to the inherent serial
nature of the fabrication process.2 All these methods suffer from one inherent drawback: they
create a 2D-open channel network on one substrate surface that has to be sealed (closed or
bonded) to a second chip in order to obtain a microfluidic channel. This creates a weak point
which manifests itself as bond breakage in any high pressure application, as mentioned above.
Developed more than a decade ago, Femtosecond Laser Irradiation followed by
Chemical Etching (FLICE),12 also called Selective Laser-Induced Etching (SLE),13,14 has
emerged as a novel powerful approach for direct fabrication of complex 3D structures inside a
solid transparent material such as fused silica. The SLE technique consists of two steps: 1) the
exposure of glass to scanning focused ultra-short (fs or ps) pulsed laser radiation, which locally

Fabrication of a pressure-resistant microfluidic mixer in fused silica using selective laser-induced etching
119
changes glass properties in the focal volume to create self-aligned nanocracks perpendicular to
the laser polarisation direction;15 2) etching of the laser-modified zone by HF or an alkaline
solution such as KOH in water.13,15 During the etching process, the nanocracks created by the
pulsed laser act as channels through which the etching agent diffuses deeper into the fused
silica. Etching takes place where the etching agent comes into contact with modified fused silica
along the diffusion path.15 Being a direct fabrication technique inside a solid piece of material,
SLE provides an appealing solution to avoid microchannel-sealing or chip-bonding steps during
device fabrication. It also doesn’t require complex cleanroom facilities and allows for the
fabrication of complex 3D structures.15 The degree of feature resolution and the aspect ratios
possible in glass and silica are higher with SLE than with wet etching. SLE thus allows the
exploitation of the unique properties of glass (transparency, rigidity, inertness etc) in devices
having smaller and better defined features than previously was possible in glass.
However, the SLE approach has some limitations regarding channel length, shape and
aspect ratio. As the channel is etched after patterning by starting from one end, it is necessary
to continuously remove the reaction products and provide fresh etching agent to diffuse along
the channel. However, as the channel length increases, the amount of fresh acid able to reach
the end of the channel reduces and the etch rate gradually decreases,16 i.e. the etching process
saturates at longer etching periods.17 This saturation leads to microchannels with lower aspect
ratios and/or channels with conical shapes (tapered channels), geometries which become more
pronounced the longer channels get. The longest dead-end channels reported were about 1.8
mm long, and had an aspect ratio (length-to-hydraulic diameter ratio4) of ~ 20.18 This effect can
be reduced by etching the microchannel simultaneously from opposite ends. Vishnubhatla et
al.19 managed to obtain a 4-mm-long microchannel with an aspect ratio of 4 by etching from
both ends of the channel in an ultrasonic bath containing a 20% solution of HF in water for 4.5
hours.
Studies have shown that the depletion of the HF acid toward the center of the etched
microchannel and the difficulty of replenishing it in this region often leads to self-termination
of the etching process.15 Moreover, HF is an isotropic etching agent removing material laterally
at a similar rate to the speed of downward etching, and the selectivity of the HF for the laser-
4An aspect ratio in this work is calculated not as the ratio of the width to the channel height but as the channel
length to hydraulic diameter. This type of ratio was used here in order to compare mixers with channels fabricated
by other authors. The higher this ratio is, the more difficult it is to fabricate a channel (because of its length).
Ch
ap
ter
IV

Microfluidic Tools for Multidimensional Liquid Chromatography
120
modified region with respect to unmodified material is not sufficient.16 This results in limited
channel lengths (about 1.5 - 2 mm)20 and limited length/diameter aspect ratios. In addition,
water, which is formed during the HF action on silica, dilutes the HF acid, and further impeding
the etching process.21 On the other hand, these effects were not observed when aqueous KOH
was used as the etching agent.16 Having a higher selectivity for modified fused silica due to the
formation of a Si-rich structure16 and being an anisotropic etching agent, aqueous KOH
provides slow etching with almost constant selectivity regardless of the etching period.15,16 It
was reported that the selective etch rate with KOH is even higher (14 times higher) than for
etching with ~2% HF.14 Thus, using prolonged 60-hour etching in KOH, Kiyama et al.16
fabricated 10-mm microchannels with less than 60 μm diameter (an aspect ratio of almost 200).
In this work, we aimed to fabricate a 30-mm-long microfluidic mixing channel having
an aspect ration of more than 100 in fused silica by the Selective Laser-Induced Etching method.
Besides the problems that arise when such a long channel is to be fabricated (as described
above), the need to have herringbone grooves on the channel wall in order to generate mixing
complicate the fabrication process. The fabrication of such chips has never been explored before
using the SLE technique. In the current study, we describe several generations of chips
fabricated in fused silica with different dimensions. In order to solve some fabrication issues
and account for differences in etch times in different device regions, we exploit a modified
micromixer design incorporating compensatin structures to counteract overetching in regions
where the silica is exposed to HF etchant for longer periods. We refer to this design as a
compensation design. Compensation structures incorporated into regions subjected to longer
etchant exposure were designed so that longer HF treatment was required to yield the final
features having the desired dimensions. The fabricated micromixer with this design showed
improved mixing performance compared to previous chip generations where overetching had
(partially) eroded the grooves and made channels undesirably wider. Also, pressure tests
showed that fused silica chips can withstand pressures of up to 85 bar.

Fabrication of a pressure-resistant microfluidic mixer in fused silica using selective laser-induced etching
121
Material and Methods
Chip designs
All chip designs were drawn in SolidWorks© (Waltham, Massachusetts, USA) and saved as a
STEP file for further fabrication. The SolidWorks design of the first fabricated chip with
different relevant dimensions is given in Figure 1A. We refer to it as the 1st generation chip as
it forms the basis upon which other devices were subsequently designed. All dimensions of this
chip are summarized in Table 1. A schematic representation of herringbone grooves (HG) in
the channel with names of different parameters is shown in Figure 1C. The 1st generation chip
had the same herringbone groove dimensions as were used in our previous work.3 However,
the channel dimensions are different. Moreover, the inlets and an outlet were designed as
standard 10-32 female HPLC connectors. The midpoint of the chip channel cross-section is
aligned dead centre with the midpoint of the 1/16” ID peek tubing fixed in the inlets and outlet.
Figure 1. The SolidWorks© design of the (A) 1st and (B) 2nd generation microfluidic mixer with herringbone
grooves; all dimensions are in mm. (C) Schematic drawing of herringbone grooves in the channel.
Ch
ap
ter
IV

Microfluidic Tools for Multidimensional Liquid Chromatography
122
Table 1. The channel parameters of the 1st and 2nd generation chips.
Parameter 1st generation 2nd generation
Channel length, mm 31 33.6
Length of the inlet, mm 9.3 2.09
Hydraulic diameter, mm5 0.161 0.316
Inlet width, µm 150 215
Channel height, µm 60 150
Groove depth, µm 50 100
Channel width, µm 300 430
Groove width, µm 110 260
Ridge width, µm 50 70
Volume, µL 1.6 3.6
The first fabricated chip revealed that the chosen fabrication method is not suitable for
the fabrication of well-resolved grooves having dimensions smaller than 100 µm. Based on
these results, all dimensions of the second chip (2nd generation chip) were increased (Table 1).
We decided to increase the channel height and channel width to 150 µm and 430 µm,
respectively, in order to provide better access for etching agent to penetrate into the channel.
Based on these values, the other parameters were recalculated following the protocol for
achieving optimized geometry22 (Table 1), which is described in our previous work.3 Moreover,
the Y-junction was replaced by the T-junction (Fig. 1B) and the length of the inlet channel was
shortened significantly, for reasons which will be discussed later.
Chip fabrication
All chips were fabricated in quartz glass (fused silica) by Selective Laser-Induced Etching
(SLE) using the LightFab 3D Printer at LightFab (Aachen, Germany).13,14 The thickness of the
fused silica was 7 mm with optically polished surfaces. The FCPA laser (Satsuma, Amplitude
Systemes, Pessac, France) provided ultrashort laser pulses having a wavelength of 1030 nm,
with a pulse duration of 1000 fs, a pulse energy of about 500 nJ and a writing velocity of 200
mm/s at a repetition rate of 750 kHz. Laser radiation is focused by a 20x microscope objective
with a numerical aperture of 0.45 (LCPLAN N 20x/0.45 IR, Olympus Europa GmbH;
Hamburg, Germany) equipped with a collar for correction of spherical aberrations.
5 The formula for hydraulic diameter will be presented in Section 2.4 (Eq. 2).

Fabrication of a pressure-resistant microfluidic mixer in fused silica using selective laser-induced etching
123
The chip designs that were saved as STEP files were opened in the CAM software
LightFabScan. The laser parameters, the three linear axes and the three dynamic axes in the 3D
Microscanner were controlled using the same software. Vectors were generated automatically
by SliceLas (available from LightFab) in the CAD software Rhinoceros 3D (from Rhino3D)
and transferred to the CAM software LightFab Scan.
For development of the structures by wet-chemical etching, the laser-heated silica
device was immersed in an aqueous solution of 8 mol/L KOH for 10 days at 85 C with
ultrasonic excitation. The heavy-duty ultrasonic bath was equipped with a 99 h timer, automatic
heating and cooling with temperature control, and automatic water refill to compensate for
evaporation.
Characterization of channels and grooves
Photos of the fabricated grooved channels were obtained using a microscope (model “DMIL”,
Leica Microsystems, The Netherlands) equipped with a 40x magnification and a CCD camera.
Channel and HG dimensions were measured using ImageJ to analyse the photos (U. S. National
Institutes of Health, Bethesda, Maryland, USA). These values were then compared with the
dimensions of the original Solidworks design. The data so obtained was plotted in OriginPro
9.1.0 (OriginLab Corporation, Massachusetts, USA).
Mixing test
In order to visualize mixing, the commercially available solutions of two food dyes, Brilliant
Blue (BB, E133, KoepoE, Indonesia) and Tartrazine (Tz, E102, KoepoE, Indonesia), were
introduced from separate inlets into the channel junction with a 5-mL syringe (B.braun, The
Netherlands) through a 1.59-mm (od), 0.8-mm (id), polyetheretherketone (PEEK) tubing
(Kinesis Ltd, Cambridgeshire, UK) using a syringe pump. Photos were taken at different
positions along the channel with a camera (Canon EOS 700D) that was mounted on the
microscope (Leica S8 APO, Leica Microsystems, Germany).
To ensure that micromixers having different internal dimensions and volumes could be
tested and compared under the same flow conditions, the dimensionless Péclet number (Pe) was
used to calculate appropriate flow rates for mixing experiments. Pe characterizes molecular
Ch
ap
ter
IV

Microfluidic Tools for Multidimensional Liquid Chromatography
124
mass transport in flow conduits as a ratio of advective transport (flow) rate to diffusive transport
rate, can be calculated according to the formula:
𝑃𝑒 = 𝑣𝑑ℎ
𝐷 (1),
where v is average linear velocity (mm/s), D represents diffusion coefficient (mm2/s)
and dh denotes the hydraulic diameter for a rectangular duct (e.g. equivalent diameter of a
channel, mm). This latter parameter can be calculated according to Equation 2,
𝑑ℎ =2𝑤ℎ
𝑤+ℎ (2),
where w (mm) is channel width, h is channel height (mm).
Because the hydraulic diameter of the 2nd generation chip is 0.316 mm, which is almost
twice as large as in the 1st generation, mixing was tested under constant Péclet-number
conditions rather than constant flow rates to ensure the same mass transport conditions (Table
2).
Table 2. Tested flow rates based on Pe calculation for chips with different dimensions; (d+h)1
= 110 µm; (d+h)2 = 250 µm, where d is groove depth; dh1 = 0.161 mm (w = 300 µm), dh2 =
0.316 mm (w = 430 µm), where dh is hydraulic diameter; ρ = 103 kg/m3, µ = 10-3 kg/(m*s), DBB
= 2.8×10⁻⁹ m2 /s (for BB),23 DTz ~10-9 m2 /s (for Tz).24
Chip generation Flow rate, mL/min Pe, 103
1st 0.12 3.5
2nd and 3rd 0.2
1st 0.6 17.5
2nd and 3rd 1.0
All experiments were performed after conditioning the channel with 0.6 mol/L NaOH
(Sigma-Aldrich, Sweden, Missouri, USA) and 18 M-ohm ultrapure water (Arium 611, Sartorius
Stedim Biotech, Germany).
Pressure test
To evaluate the burst pressure, the inlets of the 2nd generation chip were connected to HPLC
pumps (Waters 515, Waters Corporation, Massachusetts, USA) and the outlet was connected
to an HPLC column (HYPERSIL SAX 5U 4.6×150 mm, Alltech) using standard HPLC fitting
(Fingertight Fitting One-Piece PEEK, Upchurch Scientific, IDEX Health & Science, CA,

Fabrication of a pressure-resistant microfluidic mixer in fused silica using selective laser-induced etching
125
USA), as shown in Figure 2. In the first set of experiments, the column was open and the tested
flow rate range was set to 0.2-2.0 mL/min. Afterwards, the column was closed with threaded
stopper to build up the pressure. The water was pumped at a total flow rate of 0.5 mL/min.
Figure 2. Set-up for the pressure test: A 2nd generation micromixer was connected to HPLC pumps and a sealed
column.
Ch
ap
ter
IV

Microfluidic Tools for Multidimensional Liquid Chromatography
126
Results and Discussion
Fabricated fused-silica chips
The fabrication of long channels with uniform cross-sections using the SLE technique has to
date been limited as was mentioned in the Introduction. However, the appealing idea to directly
fabricate buried channels in a solid block of fused silica, thereby circumventing the need to seal
channels in a bonding step, motivated us to explore this technique in more detail. In our previous
work,3 we developed and investigated a microfluidic mixer with herringbone grooves, that was
destined to be used in multidimensional chromatography. Our experiments showed that when
fabricated in PDMS/glass, such chips cannot withstand pressures more than 10 bar, due to the
low Young's modulus of PDMS (a measure of the ability of a material to withstand changes in
length (elasticity) when under lengthwise tension (pressure)). The value of the Young's modulus
lies in the range between 0.57-3.7 MPa for PDMS and 73 GPa for fused silica. Therefore, we
aimed to fabricate the micromixer in fused silica, which is three to four orders of magnitude
less elastic. The first generation chip had the same dimensions as the PDMS/glass chip reported
previously by our group.3 Because of the possible difficulty of fabricating the 50-mm-long
channel from the original design, the channel length was decreased to 30 mm. Thus, the channel
aspect ratio (length to hydraulic diameter ratio) of the 1st generation chip turned out to be 186.
Figure 3. Photos of the 1st and 2nd generation chips with herringbone grooves fabricated in fused silica: (A),(B)
whole chips and (C),(D) their channels imaged using a microscope. Images have been stitched together to show
the full channel; a 40×magnification objective lens was used for (C) and (D). The scale of the images in (C) and
(D) is the same.

Fabrication of a pressure-resistant microfluidic mixer in fused silica using selective laser-induced etching
127
Figures 3A and 3C show the whole 1st generation chip and its magnified channel,
respectively. A clear difference is observed between the laser-modified (white region) and
overetched channel (black region) material observed (Fig. 3C). Unfortunately, the channel
quality is not particularly good and the resolution of grooves is poor. The channel diameter
varies along the channel, with a larger cross-section observed at the entrance as compared to
the middle part of the channel (width 300 µm and depth 60 µm). As was discussed above, it is
an inherent feature of the etching process itself. Only in the middle part of the channel (Fig. 3C,
marked in red) did we observe channel parameters that correspond to the original design, with
well-resolved grooves. Such results were predictable due to the typical problems associated
with etching. The longer the channel is, the more etching time is needed to reach laser-modified
material in the middle of the channel. This means that both ends of the channel where laser-
modified material had already been removed remain in contact longer with etching solution
than section towards the middle of the channel. Even though we used KOH as an etching
solution, the etching selectivity of which remained almost constant regardless of the etching
time, some excessive etching took place. For comparison, Kiyama et al.16 fabricated 9.2-mm
microchannels with less than 60 μm diameter and with aspect ratio of 153, which is very similar
to the one we were aiming for (186). The etching time was 60 hours when 10 mol/L (35.8%)
aqueous KOH was used. This is 4 times shorter than the time that we used, which is not
surprising given that the microchannel length and hydraulic diameter were ~4 times shorter and
5 times smaller respectively than in our case.
Nevertheless, we decided to increase the cross-section of the 1st generation chip in order
to simplify the introduction of the etching solution into the mixing channel by using wider inlets
(Table 1). New dimensions for the 2nd generation chip were calculated based on the protocol
for optimized geometry.22 Figures 3B and 3D show the 2nd generation chip and a top-view of
its channel under the microscope. This chip has almost twice as large a channel diameter, with
a channel aspect ratio of 104, compared to the 1st generation chip. In general, the channel quality
is better and grooves are visible along the full channel length. It is also clearly visible that the
section with HG having good resolution is significantly longer for the 2nd generation chip (Fig.
3D, outlined by a red rectangular) than for the 1st generation (Fig. 3C).
Ch
ap
ter
IV

Microfluidic Tools for Multidimensional Liquid Chromatography
128
Figure 4. Micrographs of the (A-C) 1st and (D-F) 2nd generation channels: (A, D) inlet; (B, E) junction and (C, F)
middle part which correspond to the original design with clearly resolved HG. Red lines (B, E) indicate the border
of the channel according to the original design. All photos are made with the same magnification.
In addition to increased channel dimensions, the 2nd generation chip was designed with
T-junction (Fig. 3B, 4D, 4E) instead of Y-junction (Fig. 3A, 4A, 4B). Because the etching
solution enters the chip through inlets, the etching time proportionally increases with their
lengths. The T-junction provided a 4-fold shorter inlet length, providing easier access for KOH
to enter the channel. The clear improvement in etching of the middle part of the 2nd generation
chips can be also seen in Figure 4F compared to the 1st generation chip (Fig. 4C) (photos are
made with the same magnification.).
It is important to mention that besides the difficulties associated with fabrication of
channels longer than few mm using the SLE technique, the chip fabrication in our case is
complicated by the inclusion of herringbone groove arrays on the bottom of the channel, which
are essential for generation of mixing based on chaotic advection. It should be noted that the
fabrication of herringbone grooves having a rectangular cross-section is impossible with
conventional photolithographic patterning and HF etching in glass. This is due to the isotropic
nature of the HF etching process which precludes high-aspect-ratio channels. SLE provides the
possibility to fabricate channels with a high-aspect ratio that have well-defined grooves in the
glass surface. However, to the best of our knowledge, no other groups have fabricated anything
other than long straight or bent channels having no internal features. The only attempt to
fabricate a similar fused-silica herringbone mixer by femtosecond-laser direct writing
combined with wet etching using HF was proposed by Lin et al.25 Several 2D and 3D designs
were fabricated, one of which contained walls that were also patterned with slanted grooves.

Fabrication of a pressure-resistant microfluidic mixer in fused silica using selective laser-induced etching
129
However, in that study, the surface of the fused silica substrate was irradiated to form the
grooved channel, which was then sealed to PDMS. Lin et al.25 thus demonstrated the use of
SLE to produce arbitrary patterns on the vertical side walls, but didn’t exploit the most attractive
feature of SLE technique, namely, the elimination of the sealing/bonding process by fabricating
the full channel inside a block of fused silica.
Figure 5. Side-view of the 2nd generation chip with regions where ridges are clearly visible (middle part) and
where they disappear (at the beginning and the end of the channel). These are photographs taken of a tilted
channel/device.
Grooves in the micromixer are defined by ridges that separate grooves from each other.
If ridges are “eaten away” by etching solution during fabrication, there will no longer be any
grooves left over by the end of device fabrication to induce any mixing. Figure 5 presents the
side view of the 2nd generation chip to illustrate this situation. Ridges have disappeared at the
beginning and end of the channel, as a result of excessive etching over several days. This means
that mixing based on chaotic advection will occur only in the middle part where the grooves
still have good resolution, i.e. only within 3 mm out the total 33 mm of the channel length (see
Section 3.3).
Compensation design and the 3rd generation chip
In order to obtain channels with constant cross-section, we decided to make a design that
compensates for the excessive etching in the beginning and at the end of the channel. Mixing
channels were designed to have varying widths and depths, with narrower and shallower regions
at the ends to allow for more etching in these regions. Both channel width and depth increased
gradually toward the middle part of the channel. We measured the width in top-view
Ch
ap
ter
IV

Microfluidic Tools for Multidimensional Liquid Chromatography
130
micrographs of the 2nd generation chip channel (Fig. 6). We made two measurements every 0.4
- 0.45 mm along the channel, as shown in Figure 6. One value was obtained for laser-modified
(white) regions, w1, while the other was made to include etched (dark) regions, w2,
respectively. The measured data was plotted as presented in Figure 7.
Figure 6. Measurements of the channel width at different positions along the channel of the 2nd generation chip
(a) at modified (w1) and (b) etched (w2) areas at (1) junction; (2) 4.5 mm; (3) 10 mm (4) 13 mm; (5) 16 mm (6)
21 mm and (7) 27 mm along the channel. Red line across the channel shows the location of the measurement.
Figure 7 reveals five distinct regions for etching behaviour: (I) a large difference
between w1 and w2 is observed here; (II) exhibits a monotonic decrease in the difference
between w1 and w2 as channel distance increases, (III) w1 ≈ w2; (IV) shows a linear increase
in the difference between w1 and w2 and (V) exhibits almost constant w2. Also noteworthy is
the fact that w1, the width measured across the laser-modified region of the final channel,
remains constant along the entire length of the channel. Only in region (III), where modified
and etched areas overlap, do both channel width and groove parameters equal those in the
original design. This area comprises less than 3 mm (12 %) of the total 30-mm length of the
channel. Based on these data, we created a compensation design (Fig. 8A) with a channel that
has five regions with different channel parameters.
The final channel design has five regions (Fig. 8A) where different changes to the
original design were made, including channel width and channel depth. Table 3 summarizes
dimensions in each region of the compensation design. The maximum difference between w1
and w2 was calculated to be 190 µm. Thus, the channel widths in Regions I and V have been
assigned values of 240 m rather than 430 m as in the original device. This resulted in the
channel with narrower region in the beginning and at the end comparing to the middle region.
In Region II, the channel width increased linearly from 240 m to 430 m, whereas it was

Fabrication of a pressure-resistant microfluidic mixer in fused silica using selective laser-induced etching
131
reduced linearly from 430 m to 240 m in Region 4. In general, a channel has a narrower
width of 240 µm in the beginning and at the end compared to the 430 µm in middle section,
where the original design was kept unchanged. The channel was deepest in the middle section
of the channel (Region IV) (150 m; Fig.8D) and was designed to become shallower towards
the ends of the channel.
Figure 7. Difference between channel width of modified (red curve, w1) and etched (black curve, w2) regions
based on the channel of the 2nd generation chip: (I) increase in difference between w1 and w2; (II) linear decrease
of difference between w1 and w2, (III) w1 ≈ w2; (IV) linear increase of difference between w1 and w2 and (V)
constant w2.
An important consideration in the compensation design was to adjust groove dimensions
(e.g. groove width, ridge width and groove depth) to counteract effectscaused by excessive
etching in the channel. This is especially true in regions (II) and (IV), where channel width
linearly decreases towards the middle of the channel and increases again afterwards. Channel
depth increases as the middle section of the channel is approached, and decreases again once
the midpoint of the channel has been passed. As with the channel, the HG design resemble the
originally designed HG only in the middle section (Fig. 8B). All grooves touched the walls of
the new channel. In addition, groove depth was also adjusted according to the changing channel
Ch
ap
ter
IV

Microfluidic Tools for Multidimensional Liquid Chromatography
132
depth. All HG dimensions for each region are summarized in Table 3. Figures 8C and 8D show
the groove depth in the beginning and in the middle section of the channel. The etching process
also influences groove width as can be seen on Figure 6. Therefore, we measured the difference
in groove width the same way as was described above for the channel width (Fig. 6). In the
original design the groove and ridge widths are 260 µm and 70 µm respectively. In order to
keep a groove width of 260 µm after etching, grooves in the compensation design were
narrowed to different extents in all regions except the middle section of the channel (Table 3).
The same approach was taken for ridges that decrease during etching. Therefore, in order to
maintain the same ratios between grooves and ridges, we kept the distance taken up by each set
of groove + ridge along the channel the same, at 330 µm.
Figure 8. SolidWorks© design of the compensation chip design with herringbone grooves representing different
regions of the channel with different: (A) channel width; (B) groove and ridge width (dark regions); groove depth
at the (C) beginning (70 µm) and (D) middle part (100 µm) of the channel.
Table 3. Five regions of the compensation design with different parameters.
Region in
the channel,
mm
Groove
width, mm
Ridge
width, mm
Channel width, µm Groove depth, µm
0 – 6.5 0.2 0.13 240 70
6.5 – 12.7 0.22-0.24 0.11-0.1 240-430 (linear
increase)
70-100 (linear
increase)
12.7 – 15.2* 0.26* 0.07* 430* 100*
15.2 – 25.2 0.23-0.21 0.10-0.12 430-240 (linear
decrease)
100-70 (linear
decrease)
25.2 – 42.3 0.2 0.13 240 70
*The dimensions are the same as in the 2nd generation device.

Fabrication of a pressure-resistant microfluidic mixer in fused silica using selective laser-induced etching
133
Based on these adjustments, we designed the chip with compensation structures (the 3rd
generation chip) which is presented in Figure 9A. We noticed improvement in terms of
uniformity of the channel width compared to the previous designs. The measurements of
channel widths in the laser-modified and etched parts of the 3rd generation chip (Figure 10)
clearly show that the middle section having the desired width (430 µm) is ~ 6 mm long, which
is larger than for the 2nd generation chip (2.5 mm). Squeezing the two sides of the channel even
more could help obtain channels with an even more uniform cross-section. On the other hand,
narrowing the beginning of the channel too much is undesirable due to the associated reduction
of the etching solution access and, thus, an increase in the etching time. However, etching didn’t
quite proceed as we had assumed or hoped. In regions (I) and (V), the maximal difference
between the modified and etched parts still remains more than 300 µm. These regions better
resemble the compensated design than the desired original design with a narrower channel in
the beginning and at the end of the chip.
Figure 9. Photos of the 3rd generation chip with compensation design: (A) top-view of the whole channel, 40x
magnification objective lens and (B) side-view showing the difference in channel depth.
As with channel width, groove shapes have also been altered to take compensation for
longer etching times into account. compensated design (wider in the beginning and at the end
of the channel). Besides, Figure 9B reveals clear variations in channel depth. Probably, the
difference of 30 µm in depth between the beginning/end and the middle part of the channel was
not sufficient to compensate long etching times and to obtain uniform channel depth. However,
the side-view of the 3rd generation chip shows that the resolution of the HG is better compared
to 2nd generation chip. Ridges are present along the whole channel length, which probably
accounts for the better mixing performance observed (see Section 3.3).
Ch
ap
ter
IV

Microfluidic Tools for Multidimensional Liquid Chromatography
134
Our approach for compensation of the Solidwrks designdesign for the conical channel
shape is somewhat similar to the method proposed by Vishnubhatla et al.19 That approach
consisted of an irradiation of a reverse conical-shaped channel with respect to the one normally
obtained with the SLE technique. However in our approach we decided to make changes to the
actual device design and not to the SLE procedure. It is also worth mentioning that the method
proposed by Vishnubhatla et al. would be difficult to realize in our chip due to the presence of
herringbone grooves on the bottom.
Another possible solution to decrease the influence of excessive etching could be to
cycle the etching process,17 i.e. by frequently interrupting it. Acid or base would then be
replenished in the narrow modified regions during each cycle to decrease the effect of excessive
etching.
Figure 10. Difference between channel width of laser-modified (red curve, w1) and etched (black curve, w2)
regions of the 3rd generation chip channel. The marked regions represent the five regions of the original design
(Table 3).
Evaluation of mixing performance
All chip generations were tested for their mixing performance. As the mixing is enhanced by
the herringbone grooves on the bottom of the channel, the mixing quality relies on how good
the resolution/quality of the obtained grooves is. In other words, how well the original design
of HG was transferred into the fused-silica chip is of critical importance. We used a qualitative

Fabrication of a pressure-resistant microfluidic mixer in fused silica using selective laser-induced etching
135
approach with food dyes to visualize the mixing. Because of different channel dimensions, the
mixing performance was tested at different flow rates according to the same Peclet number
representing the same mass transfer conditions (Section 2.4).
Figure 11 and Figure 12 show results for mixing experiments with all three chip
generations at Pe values of 3.5×10³ and 17.5×10³, respectively. For both Pe, the best mixing is
observed in the 3rd generation mixer, as indicated by the appearance of green colour across the
entire channel much earlier. Such performance can be attributed to several factors. Though the
green colour starts to appear within first few mm of the channel, this is probably caused not
only by the existence of grooves. As was discussed above, the depth of the 3rd generation chip
decreases towards the middle section of the channel, which linearly increases the groove depth-
to-channel height ratio (Fig. 9). Previous studies26,27 showed that mixing performance of
herringbone grooves improves with an increase in the value of this ratio, which is explained in
detail elsewhere.22 Thus, the mixing at the beginning of the channel can probably be attributed
in the first place to the decreased width and depth of the channel at the junction where fluid
streams are physically brought into the contact (Fig.11C). On the other hand, mixing based on
chaotic advection occurs only in the middle section of the channel where grooves correspond
to or closely resemble their original design. This can be clearly seen in Figure 12D. Similar
mixer performance was observed in all studies involving similar herringbone-groove
designs.3,4,28 The 2nd generation chip also has a region where chaotic advection takes place,
however, the overall mixing performance is poor. The 1st generation chip (Fig. 11A, Fig. 12A)
has a very small region with well-resolved grooves, which results in even poorer mixing
performance.
Figure 11. Mixing performance of the (A) 1st, (B) 2nd and (C) 3rd generation fused-silica micromixers; Pe = 3.5×10³
(actual flow rates: 0.12 mL/min for (A) and 0.2 mL/min for (B) and (C)); two food dyes; combined photos.
Ch
ap
ter
IV

Microfluidic Tools for Multidimensional Liquid Chromatography
136
However, the mixing is not complete by the end of the channel for any of chips, which
is obvious from the streaks of unmixed dyes at the channel outlet (Fig.11 and 12). This relates
to the insufficiently long channel region exhibiting the generation of chaotic advection.
Furthermore, at higher flow rates the mixing efficiency decreases as well, as evidenced by the
green-coloured area that appears further down the channel and is less pronounced at lower flow
rates. This effect can be explained by the decrease in the residence time and, thus, decrease in
the mixing that is governed by diffusion.
Clearly then, the fabrication process needs to be optimized to realize all the grooves
initially patterned by the pulsed laser, as only then will these chips function as efficient mixers.
Figure 12. Mixing performance of the (A) 1st, (B) 2nd and (C) 3rd generation fused-silica micromixers; (D) the
middle part of the 3rd generation chip where mixing by chaotic advection is evident; Pe =17.5×10³; combined
photos.
Pressure tests
Because of the original intention to place the chip in the interface of a two-dimensional liquid
chromatograph, and the future plan to integrate a monolithic column into the same chip, the
fabricated chips had to be tested for pressure resistance. For this test only the 2nd generation
chip was chosen, as the 1st generation chip was received with a small crack in the inlet.
In the test, the column connected to the chip outlet was left open. The pressure was
increased from 0 to 22 bar for flow rates of 0.2 - 2.0 mL/min. However, no changes in the chip
or connected tubing were observed. Next, the column was closed off. The results of this second

Fabrication of a pressure-resistant microfluidic mixer in fused silica using selective laser-induced etching
137
experiment are summarized in Table 4. In the first two attempts, the tubing detached from
different inlets as the pressure increased. In the last experiment, when the pressure reached 85
bar, a big part of the outlet region split from the rest of the chip and the chip was destroyed
(Fig.13). Device fracture in the outlet region could be expected, as the used silica was not very
thick and fell subject to high total back pressures. Thus, the pressure test showed that the fused-
silica chip could withstand a pressure of 85 bar. This value is sufficient for utilization of this
device in the interface of two-dimensional liquid chromatography as a separate mixing device.
However it may not be sufficient for applications involving an integrated monolithic stationary
phase on the same chip, as the channel filled with stationary phase would increase the flow
resistance and, thus, the internal pressure drop in the device itself.
Table 4. Pressure test with the 2nd generation chip when the column was sealed at the total flow
rate 0.5 mL/min.
Total max pressure Observation
63,5 bar Different inlets leakage
77.6 bar
85.15 bar The chip split into two part in the outlet region
Figure 13. (A) Top-view and (B) side-view of the two parts of the 2nd generation chip after the pressure test.
In the literature, there is limited information regarding glass-based microfluidic devices
for high-pressure chemistry. In most cases, the main limitation associated with the development
of such devices is their micro-to-macro interface (i.e. quality of the connections). Working
pressures of 50-150 bar were achieved when glass chips were placed in different types of clamp-
holders or similar support units.29,30 Szekely and Freitag29 clamped a glass chip into a Teflon
holder/interface with integrated high pressure connectors and O-rings that withstood back
pressures of 150 bar. The disadvantage of this approach is reduced flexibility of patterning, as
Ch
ap
ter
IV

Microfluidic Tools for Multidimensional Liquid Chromatography
138
only straight lines and crosses can be fabricated. Tiggelaar et al.11 reached working pressures
of 300 bar using an in-plane, fiber-based interface with glass capillaries connected to a glass
microreactor. However, in this approach epoxy resin fibers were glued to the chip, which
decreased the flexibility for connection of the chip to different equipment. In our work, we also
used in-plane connectors for improved robustness. In contrast to other studies, no extra holders
or gluing is needed in our approach. Having female connectors with standard 10-32 thread
(suitable for standard HPLC connectors) allows easy connection of the chip to conventional
equipment and makes the interface user-friendly. Even though our chip didn’t reach pressures
beyond 85 bar, the obtained result is compatible with other high-pressure resistant chip-based
devices. Besides, it should be noted that the chip was not placed in any clamp-holder or support;
doing so would most likely allow for much higher operating pressures.
Fabrication of a pressure-resistant microfluidic mixer in fused silica using selective laser-induced etching
139
Conclusions
In this work, we explored the fabrication of microfluidic mixers with integrated arrays of
herringbone grooves in fused silica using the Selective Laser-Induced Etching (SLE) technique.
This approach allowed us to obtain devices with complex features inside solid pieces of fused
silica, eliminating the need for a bonding step. We aimed to fabricate microfluidic mixers with
channels up to 33 mm long and with aspect ratios more than 100, the first time that SLE has
been applied for this type of application. We managed to fabricate several generations of chips
with different dimensions. Our results showed that increasing the channel diameter allows
higher-resolution channels with grooves, due to faster access of etching solution. However, we
didn’t succeed in the fabrication of channels with uniform cross-section. The channel still had
a tapered, conical shape toward the middle of the channel, due to the etching process. To
overcome this effect, we proposed a compensation design that resulted in slightly better
resolutions of grooves in the channel.
All micromixers were tested for mixing performance. Tests revealed that mixing based
on chaotic advection is observed only in the middle part of the channel where herringbone
grooves correspond to or resemble most the original design. The best mixing performance was
observed for the chip with compensation design, due to changes in channel depth/width and
better resolution of herringbone grooves. However, the mixing was still not completed by the
end of the channel at either of the tested flow rates (0.2 mL/min and 1.0 mL/min).
In terms of pressure, the obtained chip can withstand pressures up to 85 bar. This is
within the pressure range reported for the glass chips placed in different types of clamp-holders
or similar support units.29,30 However, in our tests the chip wasn’t placed in any housing, which
means that the pressure resistance could be improved with both utilization of the extra support
and using a thicker block of fused silica. Compared to other studies, no extra holders or gluing
is needed in our approach. The device can be easily connected to any conventional equipment
using standard 10-32 thread (standard HPLC connectors).
We believe that it is worthwhile to further explore the fabrication of microfluidic
devices using SLE. To achieve desired structures, an optimized fabrication procedure using a
compensation design to account for variation in exposure times to etching solution should be
developed.
Ch
ap
ter
IV

Microfluidic Tools for Multidimensional Liquid Chromatography
140
Acknowledgements
This work was financially supported by The Netherlands Organization for Scientific Research
(NWO) in the framework of the Technology Area-COAST program, project no. (053.21.102)
(HYPERformance LC).

Fabrication of a pressure-resistant microfluidic mixer in fused silica using selective laser-induced etching
141
References
1. Martin, A., Teychené, S., Camy, S. & Aubin, J. Fast and inexpensive method for the fabrication of
transparent pressure-resistant microfluidic chips. Microfluid. Nanofluidics 20, 1–8 (2016).
2. Sollier, E., Murray, C., Maoddi, P. & Di Carlo, D. Rapid prototyping polymers for microfluidic devices
and high pressure injections. Lab Chip 11, 3752 (2011).
3. Ianovska, M. A., Mulder, P. P. M. F. A. & Verpoorte, E. Development of small-volume, microfluidic
chaotic mixers for future application in two-dimensional liquid chromatography. RSC Adv. 7, 9090–9099
(2017).
4. Stroock, A. D. et al. Chaotic mixer for microchannels. Science 295, 647–651 (2002).
5. Liu, J. et al. Polymer Microchips Integrating Solid-Phase Extraction and High-Performance Liquid
Chromatography Using Reversed-Phase Polymethacrylate Monoliths. 81, 2545–2554 (2009).
6. Chen, C. F. et al. High-pressure needle interface for thermoplastic microfluidics. Lab Chip 9, 50–55
(2009).
7. Mair, D. A. et al. Room-temperature bonding for plastic high-pressure microfluidic chips. Anal. Chem.
79, 5097–5102 (2007).
8. Urakawa, A., Trachsel, F., von Rohr, P. R. & Baiker, A. On-chip Raman analysis of heterogeneous
catalytic reaction in supercritical CO2: phase behaviour monitoring and activity profiling. Analyst 133,
1352–1354 (2008).
9. Trachsel, F., Hutter, C. & von Rohr, P. R. Transparent silicon/glass microreactor for high-pressure and
high-temperature reactions. Chem. Eng. J. 135, 309–316 (2007).
10. Marre, S., Adamo, A., Basak, S., Aymonier, C. & Jensen, K. F. Design and packaging of microreactors
for high pressure and high temperature applications. Ind. Eng. Chem. Res. 49, 11310–11320 (2010).
11. Tiggelaar, R. M. et al. Fabrication, mechanical testing and application of high-pressure glass microreactor
chips. Chem. Eng. J. 131, 163–170 (2007).
12. Matsuo, S., Tabuchi, Y., Okada, T., Juodkazis, S. & Misawa, H. Femtosecond laser assisted etching of
quartz: Microstructuring from inside. Appl. Phys. A Mater. Sci. Process. 84, 99–102 (2006).
13. Gottmann, J., Hermans, M., Repiev, N. & Ortmann, J. Selective laser-induced etching of 3D precision
quartz glass components for microfluidic applications-up-scaling of complexity and speed.
Micromachines 8, (2017).
14. Hermans, M., Gottmann, J. & Riedel, F. Selective, laser-induced etching of fused silica at high scan-speeds
using KOH. J. Laser Micro Nanoeng. 9, 126–131 (2014).
15. Osellame, R., Hoekstra, H. J. W. M., Cerullo, G. & Pollnau, M. Femtosecond laser microstructuring: An
enabling tool for optofluidic lab-on-chips. Laser Photonics Rev. 5, 442–463 (2011).
16. Kiyama, S., Matsuo, S., Hashimoto, S. & Morihira, Y. Examination of etching agent and etching
mechanism on femotosecond laser microfabrication of channels inside vitreous silica substrates. J. Phys.
Chem. C 113, 11560–11566 (2009).
17. Hnatovsky, C. et al. Fabrication of microchannels in glass using focused femtosecond laser radiation and
selective chemical etching. Appl. Phys. A-Materials Sci. \& Process. 84, 47–61 (2006).
18. Osellame, R., Maselli, V., Martinez Vazquez, R., Laporta, P. & Cerullo, G. Integration of optical
waveguides and microfluidic channels fabricated by femtosecond laser irradiation. Conf. Lasers Electro-
Optics, 2007, CLEO 2007 231118, 88–91 (2007).
19. Vishnubhatla, K. C., Bellini, N., Ramponi, R., Cerullo, G. & Osellame, R. Shape control of microchannels
fabricated in fused silica by femtosecond laser irradiation and chemical etching. Opt. Express 17, 8685–
8695 (2009).
20. Maselli, V. et al. Fabrication of long microchannels with circular cross section using astigmatically shaped
femtosecond laser pulses and chemical etching. Appl. Phys. Lett. 88, (2006).
21. Venturini, F. et al. Maskless, fast and highly selective etching of fused silica with gaseous fluorine and
gaseous hydrogen fluoride. J. Micromechanics Microengineering 24, 025004 (2014).
22. Lynn, N. S. & Dandy, D. S. Geometrical optimization of helical flow in grooved micromixers. Lab Chip
7, 580–587 (2007).
23. Ghoreishi, S. M., Behpour, M. & Golestaneh, M. Simultaneous voltammetric determination of Brilliant
Blue and Tartrazine in real samples at the surface of a multi-walled carbon nanotube paste electrode. Anal.
Methods 3, 2842 (2011).
24. DIACU, E., UNGUREANU1, E.-M., ENE, C. P. & IVANOV, A. A. Voltammetric Studies for Detection
and Degradation Assessment of some Synthetic Food Dyestuffs. REV. CHIM. 62, 1085–1089 (2011).
Ch
ap
ter
IV

Microfluidic Tools for Multidimensional Liquid Chromatography
142
25. Lin, D. et al. Three-dimensional staggered herringbone mixer fabricated by femtosecond laser direct
writing. J. Opt. 15, 025601 (2013).
26. Wang, S. et al. Highly Efficient Capture of Circulating Tumor Cells by Using Nanostructured Silicon
Substrates with Integrated Chaotic Micromixers. Angew. Chemie Int. Ed. 50, 3084–3088 (2011).
27. Yang, J.-T., Huang, K.-J. & Lin, Y.-C. Geometric effects on fluid mixing in passive grooved micromixers.
Lab Chip 5, 1140–1147 (2005).
28. Stroock, A. D. et al. Chaotic mixer for microchannels. Science 295, 647–651 (2002).
29. Szekely, L. & Freitag, R. Fabrication of a versatile microanalytical system without need for clean room
conditions. Anal. Chim. Acta 512, 39–47 (2004).
30. Shintani, Y. et al. Polydimethylsiloxane connection for quartz microchips in a high-pressure system. Anal.
Sci. 20, 1721–1723 (2004).

Chapter V
Microfluidic micromixer as a tool to
overcome solvent incompatibilities in
two-dimensional liquid
chromatography
Margaryta A. Ianovska1,2, Arto Heiskanen3, Bert Wouters4, Erik Ritzen5, Ynze
Mengerink5, Peter Schoenmakers4, Jenny Emnéus3, Elisabeth Verpoorte1
1Pharmaceutical Analysis, Groningen Research Institute of Pharmacy, University of
Groningen, The Netherlands
2 TI-COAST, Amsterdam, The Netherlands
3Department Micro- and Nanotechnology, Technical University of Denmark, Denmark
4University of Amsterdam, Van ‘t Hoff Institute for Molecular Sciences, Amsterdam, The
Netherlands
5DSM Resolve, Geleen, The Netherlands
Manuscript in preparation

Abstract
We report a micromilled, pressure-resistant mixing chip for application in on-line
comprehensive two-dimensional liquid chromatography (LC×LC). This microfluidic mixer is
based on chaotic advection generated in grooved microchannels, and can be operated at flow
rates compatible with LC×LC (0.1-1 mL/min). The design of this chip was optimized and tested
in our previous work in the transparent and flexible silicon rubber material,
polydimethylsiloxane (PDMS). In this work, the microfluidic chip was micromilled in rigid
cyclic-olefin copolymer (COC) substrate in order to better withstand the high pressure
environment of LC×LC. Two micromilled parts were bonded using solvent-vapour-assisted
bonding under elevated temperature and pressure. A specially designed, robust, low-dead-
volume interface allows direct connection of the microfluidic chip to an LC×LC system using
standardized HPLC connectors. Thus-fabricated chips can withstand pressures of 200 bar. The
chip was successfully implemented in a comprehensive two-dimensional HILIC×RP-LC
system for improved separation and identification of various oligomeric series in nylon polymer
(polyamide) samples. Initial trials of the micromixer in a simple modulator at the interface
between the two columns yielded chromatographic performance similar to that obtained with
commercially available mixing units. However, with the grooved micromixer, it was possible
to mix rapidly within the same flow rate range in a volume, which was 30 times smaller than
the commercially available micromixers, opening a route to utilization of microfluidic mixers
in the conventional equipment.
Keywords: microfluidic chip-based technologies; cyclic-olefin copolymer (COC) devices;
micromilling; two-dimensional liquid chromatography (LC×LC).

Microfluidic micromixer as a tool to overcome solvent incompetibilities in two-dimensional
liquid chromatography
145
Introduction
With the growing complexity of real samples, there is a need to analyze these in the most
complete way possible. While liquid chromatography is a powerful separation tool, a single
column does not offer sufficient resolution for such samples, which can, for example, contain
many different proteins, peptides or inorganic polymers. This has led to the rapid development
of techniques that employ combinations of columns with different separation mechanisms and
thus different selectivity, such as two-dimensional liquid chromatography (2D-LC).1,2 In order
to maintain the resolution obtained in the first dimension (1D) in the second dimension (2D),
the two dimensions are coupled through a special interface that performs all the required
manipulations of the 1D effluent, such as sampling, storing and re-injection of small 1D effluent
fractions. In comprehensive two-dimensional (2D) liquid chromatography (LC×LC), where all
sample material passes through both columns before reaching the detector,3 it is especially
important that the switching frequency of the interface is high. The smaller the volumetric
sample fractions are and the faster they are transferred to the 2D, the better the 1D resolution is
maintained.
Each separation mechanism in LC×LC requires its own mobile phase for the best
separation of analytes. The utilization of different stationary phases and, as a consequence,
different mobile phases in LC×LC means that the fractions dissolved in the 1D mobile phase
need to be transferred to the second dimension with a mobile phase having a different
composition. Ideally, the second-dimension (2D) mobile phase should be a stronger eluting
mobile phase on the 2D column than the 1D mobile phase at the time of elution. In addition, the
2D column should have a higher retention with this latter mobile phase than the 1D column.
Also, the 1D effluent and the 2D mobile phase at the moment of injection should be fully
miscible. If these conditions are fulfilled the band broadening caused by mobile phase
incompatibility is minimized.4 However, such a combination of mobile and stationary phases
is usually difficult to achieve, especially in highly orthogonal systems, such as hydrophilic-
interaction liquid chromatography (1D) followed by reversed-phase liquid chromatography (2D)
(HILIC×RP-LC). In this case, the 1D effluent is rich in organic solvent, giving it a high elution
strength in the RP dimension. If the order of columns were to be reversed, the water-rich
effluent from the 1D RP column would act as a strong eluent in a 2D HILIC system. Hence, the
solvent in the collected 1D fraction is a stronger eluent on the 2D column than the 2D mobile
Ch
ap
ter
V

Microfluidic Tools for Multidimensional Liquid Chromatography
146
phase,5 which can cause a decrease in retention, increased band broadening, and non-
symmetrical or even split peaks.6,7
To overcome the solvent-strength mismatch problem between the dimensions in
LC×LC, a number of solutions have been previously suggested, including trapping-column
interfaces8–10 and collection of very small fraction volumes from a 1D capillary monolithic
column.7 More sophisticated approaches utilize a vacuum-evaporation interface for on-line
evaporation of 1D solvent from the loop11 or thermally assisted modulation using the influence
of temperature on the retention of analytes.12,13 While each of these approaches has unique
advantages for solving the problem of mobile-phase incompatibility, these technologies are still
not developed to the extent where they could be used universally in routine LC×LC analyses.
An approach which is more generally applied is the use of an additional solvent flow
(make-up flow) to allow modification of the solvent composition between dimensions by
diluting the collected 1D fraction with a weaker 2D mobile phase. However, this requires the
use of a good mixing device at the interface between the two columns. Moreover, the mixer
must be able to withstand brief pressure pulses up to a few hundred bar, due to its connection
to switching valves used to shuttle sample from the 1D to the 2D. Nowadays, T-pieces14 and
static mixers (S-mixers)15,16 are used for this purpose. A T-piece mixer provides mixing by
causing two streams to collide at a T-junction to create an interdiffusion region where mixing
by diffusion takes place more rapidly.17 S-mixers, on the other hand, are based on two elements
in a circular tube, each consisting of multiple X-shaped cross-bars positioned at 45 with respect
to the axis of the tube, but with the second element rotated 90° with respect to the first.18 These
two elements form a unit which is repeated a number of times. Mixing is achieved by splitting
the main flow into sub-streams and then re-joining them. Due to this split-and-recombine
mechanism, the diffusion length between the two fluids decreases due to an increase in the
contact surface area. Both T-piece and S-mixer approaches exhibit better performance at higher
flow rates and larger mixing-unit volumes.19 For the flow-rate range (100-300 µL/min) that is
used for most 2D-LC separations, the volume of the suitable mixer should be at least 150 µL
(for S-mixer). Such volumes are not in keeping with the low 1D fraction volumes that have to
be manipulated, which makes the application of these mixing units in LC×LC not efficient
enough. 2D-LC thus stands to benefit from the development of fast, small-volume micromixers.
The development of chip-based devices integrated in LC or LC-MS systems using
microfluidic technology has increased substantially in the last decade.20–25 The key advantages
of chip-based microfluidic systems are their small size, resulting in small-volume devices, and

Microfluidic micromixer as a tool to overcome solvent incompetibilities in two-dimensional
liquid chromatography
147
their applicability for controlling small amounts of liquids, which is beneficial for application
in LC. However, many chip-based devices implemented in LC and LC-MS systems are
operated in nano-LC mode at flow rates in the 100-300 nL/min range,20,22,24,25 whereas the
conventional LC×LC applications imply utilization of higher flow rates. The connection to
conventional equipment operating at high pressures implies that devices should be also
pressure-resistant. In previous work,26 we developed a 1.6-μL mixer with herringbone grooves
(also referred to grooves having an asymmetric chevron geometry) that provides good mixing
within seconds at flow rates compatible with LC×LC (0.1-1 mL/min). This mixer has a small
internal volume in order to obtain the desired dilution ratios in minimal volumes. The mixing
is achieved through the generation of two counter-rotating vortices (perpendicular to the
direction of the main flow) based on chaotic advection,27 a substantially different mechanism
than in T-piece and S-mixers. However, in that research we employed poly(dimethylsiloxane)
(PDMS), a transparent and flexible silicone rubber, the elastomeric nature and low Young's
modulus of which become a significant problem for development of high-pressure-resistant
chips. At high flow rates, significant channel deformations (resulting from high-pressure flows)
eventually lead to the fatigue and cracking of PDMS.
In order to cope with the pressures used in conventional LC systems, we fabricated our
micromixer with herringbone grooves in cyclic-olefin copolymer (COC) using micromilling.
We decided to use COC, because of its compatibility with typical solvents used in HPLC (e.g.
acetonitrile, methanol, and isopropyl alcohol) and excellent optical and mechanical
properties.28,29 Moreover, COC has substantially lower raw material costs (compared to silicon
and glass) and can be easily used in conjunction with micromilling.29 This fabrication method
was chosen due to its applicability for the rapid translation of designs into prototypes, and it
met our requirements with respect to cost and resolution as well.30
Beside the need for the chip itself to withstand pressure for the LC applications, a
connection between conventional equipment and the chip, the so-called macro-to-micro
interface, should be pressure-resistant. However, there are only a few articles that propose
pressure-resistant interfaces compatible with LC equipment.22,31–34 Wouters et al.33 developed
a macro-to-micro interface for connection of a COC chip to LC equipment using a custom-
made aluminium chip holder with integrated flat-bottom Nanoport connections to connect 360-
μm-o.d. capillary PEEK tubing to the chip. The burst pressure (the pressure that a device can
withstand before failing or coming apart) was determined to be between 15 and 20 bar using
Ch
ap
ter
V

Microfluidic Tools for Multidimensional Liquid Chromatography
148
this approach (channel cross-section was 500 µm × 500 µm). Though commercial Nanoports
have gained popularity as a straightforward approach to create interconnections between chips
and peripheral equipment, they cannot be used for applications that require pressures above ca.
70 bar.35 Mair et al.31 reported an interface with a threaded mating port for a standard coned
capillary fitting directly fabricated into an injection molded COC chip. The chip withstood 156
bar and was broken due to its delamination rather than interconnect failure. Later this approach
was improved by changing the thermal fusion bonding protocol to solvent-vapour bonding and
subsequent exposure of the bonded chip to UV light, to achieve a burst pressure of 346 bar.32
However, these authors used injection molding, which requires a new mold for each chip design
and can be costly and time consuming in terms of rapid prototyping. Agilent developed a
layered, polyimide microfluidic HPLC chip which incorporated an enrichment column, a
packed analytical column, and a nanospray emitter with a burst pressure of 200 bar.22 The input
capillaries were filled with a slurry of particles in 2-propanol. Each capillary was then coupled
to the chip and isopropanol was used to flush the slurry into the chip under a pressure of 120
bar. The chip was sealed using standard 3.2-mm diameter ring, which enables chip pressure
resistance up to 200 bar. In this system, standard HPLC connectors were used. On the other
hand, Chen et al.34 used a non-standard approach using either a stainless steel needle with or
without the self-tapping thread, that was inserted into a mating hole or screwed into an inlet
hole respectively. In both cases, the flat bottom needle part was directly in contact with the
microchannel. Both interfaces were compatible with pressures up to 400 bar. However, a
potential issue is that such an interface is not universal and thus standardized HPLC tubing
cannot be used. Furthermore, during the process of inserting the needle, a substrate can easily
be cracked.34
Here we report the successful application of a micromilled thermoplastic-polymer
micromixer at the interface of an LC×LC system for overcoming mobile-phase mismatch
between dimensions. The micromixer contains array of microfabricated grooves having so-
called “herringbone” or asymmetric chevron geometry. These grooves perturb the side-by-side
laminar flow profile of two solutions to be mixed such that two counter-rotated vortices are
established. Solution streams are thinned leading to shorter diffusion length and thus faster
mixing. The mixer developed in this study had an internal volume of 4.65 µL, which is much
smaller volume than conventional units have. Using a custom-designed, robust, low-dead-
volume interface, a mixing chip can be directly coupled to the LC×LC equipment using
standardized HPLC connectors. The operating pressure for the chip, which is clamped in a metal

Microfluidic micromixer as a tool to overcome solvent incompetibilities in two-dimensional
liquid chromatography
149
holder, is up to 200 bar. We implemented our micromilled, COC microfluidic mixer in a
HILIC×RP-LC system. When our mixer was used to incorporate make-up flow, an improved
separation was obtained compared to the system with no make-up flow, as expected. We
successfully identified various oligomeric series in nylon (Polyamide 46) samples as a
demonstration of the 2D-LC system with implemented micromixer.
Ch
ap
ter
V

Microfluidic Tools for Multidimensional Liquid Chromatography
150
Material and Methods
Chemicals and reagents
All chemicals were analytical-reagent grade. Fluorescein was purchased from Sigma-Aldrich
(NL) and used to prepare separate 5.0 μM fluorescein solutions in 10.0 mM phosphate-buffered
saline, pH 7.4 (PBS; Gibco, UK). The pH was measured using pH-indicator strips (Neutralit,
MERCK). All solutions were prepared with 18 MΩ-ohm ultrapure water (Arium 611, Sartorius
Stedim Biotech, Germany).
Formic acid (FA) and mass-spectrometry-grade acetonitrile (ACN) were purchased
from Merck (Darmstadt, Germany). Milli-Q grade water (Merck Millipore system 0.22 µm)
was used for preparation of mobile phases. Acetone (BASF, Ludwigshafen, Germany) was used
for the dispersion test.
A list of the chemicals (and suppliers) used in this study is reported in the Supplementary
Information (SI).
Fabrication of the COC chip
COC substrates (grade TOPAS 5013L-10) were purchased from Kunststoff-Zentrum
(Leipzig, Germany). This grade was chosen to minimize occurrence of burrs (raised edges or
small chips of plastic that remain attached to the workpiece)30 during the milling process. A
device consists of a top and a bottom plate which are 2 mm and 5.5 mm thick, respectively. All
polymers were used as received in plates and cut to the desired dimensions in-house (30×58
mm). Channels with grooves were designed in SolidWorks (Waltham, MA, USA), and the G-
Code was generated from these designs for the milling machine (Autodesk, San Rafael, CA,
USA). The actual groove and channel dimensions may be found in Figure 3 (Results and
Discussion section). The bottom part of the chip was micromilled using a computer-
numerically-controlled (CNC) micromilling robot (Mini-Mill/3, Minitech Machinery,
Norcross, GA, USA) equipped with a brushless electronic Astro-E500Z spindle (NSK,
Schaumburg, IL, USA) with a maximum rotational speed of 50,000 rpm. MACH3 CNC was
used as control software. The channel containing grooves was milled using 2-flute endmills of
200 µm and 100 µm, respectively. Several bottom parts were milled with only a channel, as test
pieces for establishing the optimal bonding conditions. The spindle speed was set to 15,000
rpm. It took 1 hour for the milling of the channel and 5 hours to mill grooves. In order to prevent

Microfluidic micromixer as a tool to overcome solvent incompetibilities in two-dimensional
liquid chromatography
151
melting during milling due to the heating of the substrate, a cooling liquid (water with soap)
was continuously flushed over the COC surface.
The cover plate was polished with a PICOMAX 20 machine (Fehlmann, Seon,
Switzerland) to obtain better flatness for bonding later on. Conical access holes were drilled
into this piece using a high-speed custom step drill. Prior to bonding, the cover plate and the
channel chip were thoroughly cleaned with deionized water and isopropanol, and dried under a
N2 stream. The plates were then exposed to the vapour of the cyclohexane for 8 min at room
temperature (COC activation). For this, plates were placed over a square glass reservoir (appr.
20×10×5 cm) filled with approximately 200 mL of cyclohexane inside a closed container.
Afterwards, the top and bottom plates were aligned using 1.59 mm (1/16“) polyether ether
ketone (PEEK) tubing (Kinesis, Altrincham, Cheshire, UK). Two extra holes (1.6 mm diameter)
were drilled on the opposite side of both plates for this purpose. An assembled chip was placed
between the two chucks of a hot embosser (Dr. Collin, Ebersberg, Germany). The device was
first heated from 25°C to 120°C in 20 min, then compressed with a force of 15 bar (377 N/cm2)
for 15 min at 120°C, and finally passively cooled down to 25°C.
To evaluate bonding strength, each chip was clamped in the metal holder (see following
section) and the inlets were connected to HPLC pumps (Waters 515, Waters, Milford, MA,
USA). An HPLC column (HYPERSIL SAX 5U 4.6×150 mm, Alltech Associates/Applied
Science, Carnforth, UK) was used as a restrictor at the outlet, and water was pumped through
at a total flow rate of 0.5 mL/min. After a linear increase in pressure, a sudden pressure drop
was observed, indicating the burst pressure of the device.
Micro-to-macro interface
There are a few important requirements for the macro-to-micro interfaces of microfluidic chips,
which should be met in order to be applicable in LC: they should be compatible with
standardized connectors for easy implementation, provide adequate pressure stability and not
introduce dead volume.36
In order to connect the micromixer to other instruments, a specially designed micro-to-
macro interface was developed (Fig. 1). The chip was clamped between two brass parts that
were screwed together. For the creation of a female connector, a conical hole in the shape of an
HPLC ferrule (ca. 0.5 mm) was drilled into the top COC plate and a standard 10-32 threaded
hole was fabricated in the metal top part (8 mm diameter) (Fig. 1A). The bonded COC chip and
Ch
ap
ter
V

Microfluidic Tools for Multidimensional Liquid Chromatography
152
top part of the metal holder were aligned using small pieces of 1.59 mm (1/16“) PEEK tubing,
inserted through the standard 10-32 holes in the top metal part and into the conical holes in the
device to center them around the conical holes drilled into the top of the COC device. The chip
was then sandwiched between top and bottom metal plates, and the metal plates clamped
together at the sides with 6 metal bolts (3 down each long side of the holder) (Figure 1B, 1C).
For experiments, PEEK tubing (1.59 mm o.d., 0.254 mm i.d.) was inserted through connector
holes and standard HPLC fittings were twisted into the connector holes until they were finger
tight in the metal holder.
Figure 1. Micro-to-macro interface for establishing the connection with LC×LC: (A) side view of the COC device
aligned with top and bottom brass plates of the holder; holes for the female connectors were drilled partly in the
top COC plate (conical part) and in metal (10-32 thread). (B) side view and (C) top view of the fully assembled
chip clamped in the metal holder with finger-tight HPLC fittings, fixed into the assembly.
Standardized HPLC finger-tight fittings consist of a male nut (10-32 thread) with conical
ferrule and female tapered ferrule seat.37 Because COC substrate was not commercially
available in thicker plates (more than 10 mm), the fabrication of full female tapered ferrule seats
inside COC top plates was not possible. We decided to fabricate only the conical part for ferrule-
and-pilot depth in the COC top plate. The rest of the female connector – suitable for 10-32
thread - was fabricated in the metal top part (Figure 1A). Dimensions that were used for the
fabrication of the female tapered ferrule seat are in agreement with LC industry standards.
The interface was designed in such a way that HPLC tubing was pushed directly down
onto the channel in the COC chip, and the standard HPLC fittings were introduced and turned
into the metal top part until finger-tight. This design is meant to minimize the dead volume in
the interconnects. Such a macro-to-micro interface allowed direct connection of the

Microfluidic micromixer as a tool to overcome solvent incompetibilities in two-dimensional
liquid chromatography
153
microfluidic chip to the LC×LC using standard HPLC fittings. Moreover, clamping between
metal plates adds extra pressure stability to the chip itself. The metal holder is reusable and can
be used every time with a new chip. Fittings can be inserted easily, without extra force.
In order to evaluate the pressure stability of the connections and to measure the maximum
burst pressure, each inlet was connected to a UHPLC pump (Agilent 1290 Infinity, Agilent,
Waldbronn, Germany) and the outlet was connected to a restrictor (GL Sciences, Eindhoven,
The Netherlands, Inertsil ODS-3 column; 250 mm × 3 mm i.d., 3-µm particle size). The total
flow rate was set to 0.5 mL/min and the pressure profile was recorded. In the first pressure test,
the pressure limit of each pump was set to 150 bar and PEEK tubing was used. A second
pressure test was performed using stainless UHPLC tubing. The pressure limit of each pump
was now set to 200 bar. The chip was connected as explained above.
LC×LC setup and chromatographic conditions
The 2D-LC instrument in which the micromixer was tested was an Agilent Technologies
Infinity 1290, consisting of two binary pumps (G4220A and G4220B) (one for each column),
an autosampler (G4226A) with thermostat (G1330B), a thermostatted column compartment
(G1316C) with 2-position/4-port-duo switching valve (G1170A) equipped with two 80-µL
loops (Agilent, 5067-5426), and a UV detector (G4212A). The HILIC separation were carried
out using an Agilent ZORBAX Rx-SILcolumn (150 mm × 4.6 mm i.d., 5-µm particle size,
Agilent, Wilmington, DE, USA). In both HILIC and RP dimensions, water containing 0.1% FA
and 100% ACN were used as eluent components. These solvents were pumped in different
ratios using a 1D pump and a 2D pump. We performed 1D gradient separations at 30 μL/min
using the following program: 0 min 99% ACN, 500 min 5% ACN, 510 min 5% ACN, 512 min
99% ACN, then kept at the initial solvent composition for 88 min.
The second-dimension separation column (Waters Cortecs C18, 30 mm × 4.6 mm i.d.;
2.7 µm particles) was operated at 3 mL/min at 40°C. The following gradient was used: 0 min
1% ACN, 0.3 min 30% ACN, 0.36 min 70% ACN, 0.39 min 1% ACN. The modulation time
(the time between valve switches) was 0.6 min (36 sec).
The operating principle of the interface between the dimensions was as follows (Figure
2A). The microfluidic mixer containing mixes 1D effluent (30 μL/min) with a 0.1% FA aqueous
solution (200 μL/min) using the make-up-flow pump (Gilson 305, Middleton, Wisconsin,
USA). The mixed solution was introduced to an 80-µL storage loop (Loop 1). Each loop was
Ch
ap
ter
V

Microfluidic Tools for Multidimensional Liquid Chromatography
154
filled 100%, but some part of effluent goes to the waste. The contents of Loop 1 are transferred
with the flow from the 2D Pump to the 2D column upon switching the valve (Fig.2B), while
Loop 2 is being filled. This occurs in multiple alternating cycles during the whole 1D
chromatographic run.
During the sequence, one blank sample (Formic acid solution) was injected after each
sample, and no significant carryover of sample was observed. LC×LC separations and other
tests were performed in triplicate.
Figure 2. Schematic representation of the modulation interface of the LC×LC-Q-ToF-MS system. A two-
position/4-duo switching valve is the central component at this interface. (A) In the first position Loop 1 is filled
with 1D effluent, while the 2D pump pushes the contents of the Loop 2 to the 2D column. (B) In the second valve
position, the analytes are transferred from Loop 1 to the 2D while Loop 2 is being filled. In such interface the
microfluidic mixer is placed before the switching valve. (C) Microfluidic mixer connected to the 8-port valve with
two loops at the interface. 1D effluent is mixed with an aqueous solution of 0.1% FA inside the microfluidic mixer
in order to reduce the eluent strength in the second dimension.
All oligomers were identified manually based on high-accuracy mass-to-charge (m/z)
values measured by Q-ToF MS.

Microfluidic micromixer as a tool to overcome solvent incompetibilities in two-dimensional
liquid chromatography
155
Sample Preparation
In the HILIC-UV experiments, 250 mg of Polyamide 46 (PA46) were dissolved in 25 mL of
formic acid. The volume of injected PA46 sample was 2 µL (20 µg of PA46). The polyamide
solution was injected directly into the LC×LC system without additional sample preparation.
Dispersion tests
Dispersion tests were performed using either 1) a zero-dead volume union (316 Stainless Steel,
Swagelok, Solon, OH, USA); 2) a T-piece (316 Stainless Steel, Swagelok); 3) a 10-µL S-mixer
(Ultra HPLC, binary input housing, 316 stainless steel, Analytical Scientific Instruments,
Richmond, CA, USA); 4) 150-µL S-mixer (Standard HPLC, binary input housing, 316 stainless
steel, Analytical Scientific Instruments); or 5) our microfluidic mixer with herringbone grooves.
A zero-dead-volume union was placed between an injector and a UV detector (Agilent
Technologies, G4212A) instead of the 2D column. The inlets of each mixing units were
connected to an injector and an additional pump, and the outlet was connected to the same UV
detector. For all experiments, 1 µL of a 1% solution of acetone was injected at a total flow rate
of 0.5 mL/min. A concentration profile was recorded with a photodiode array UV detector at λ
= 275 nm (the wavelength at which the acetone exhibits the maximum absorbance).38
Mass Spectrometry Parameters
The outlet of the LC×LC system was coupled online to an Agilent 6540 UHD accurate-mass
quadrupole time-of-flight mass spectrometer (Q-ToF MS) equipped with an Agilent Jet Stream
ESI source (Agilent, G1958-65138) through a T-piece (316 Stainless Steel, Swagelok, Ohio,
United States). The Jet Stream ESI source was operated in positive mode and instrument
parameters were set as follows: gas, nitrogen; sheath gas temperature, 350°C; sheath gas flow,
11 L/min; dry gas temperature, 300°C; dry gas flow, 8 L/min; and capillary entrance voltage,
3,500 V. The Fragmentor and Skimmer were operated at 125 and 65 V, respectively. The
normalized collision energy was 750 V (OCT 1RF Vpp). The scans were acquired in MS mode
in a mass range from 50 to 1700 m/z at a rate of 4 spectra/s.
Ch
ap
ter
V

Microfluidic Tools for Multidimensional Liquid Chromatography
156
Data Analysis
The LC system was operated using Agilent OpenLAB CDS ChemStation Edition, version
C.01.07 SRI. The LC×LC and MS were operated using Mass Hunter Workstation Software
LC/MS Data Acquisition, version B.05.01 (Agilent). LC-MS data were analyzed using LCLC
Software from GC Image(Lincoln, NE, USA; GC Image LC×LC-HPMS, version R2.5b3).
Quantitative evaluation of the degree of dispersion caused by the different mixing units tested
was determined using a chromatogram recorded at the maximum absorbance wavelength of
acetone using the Mass Hunter Workstation Software Qualitative Analysis software (version
B.06.00, Agilent, 2012). The same software was applied to identify oligomeric series. All
extracted ion chromatograms (EICs) were obtained with ± 20 ppm m/z expansion (the m/z value
window).

Microfluidic micromixer as a tool to overcome solvent incompetibilities in two-dimensional
liquid chromatography
157
Results and Discussion
Our previous research was devoted to fabrication of the HG microfluidic mixer in
poly(dimethylsiloxane) (PDMS), with an optimal design for application in LC×LC.26 However,
due to the elastomeric properties of PDMS, microchannels deformed when high flow rates are
used as a result of the higher pressures induced.39,40 PDMS also exhibits poor compatibility
with solvents commonly used in LC, limiting its applicability in LC. To prevent microchannel
deformation, it was decided to use a more rigid material for the chip fabrication. Cyclic-olefin
copolymer (COC) was the material of choice, because of its excellent optical and mechanical
properties, and compatibility with the typical solvents used in HPLC.28,29 Micromilling was
used as fabrication technique, as it offers a low start-up cost and a fast way to translate designs
into prototypes.30 However, even with ongoing advancements in the technology, micromilling
does have some limitations in resolution, dictated by the endmills that are used.30 In this work,
the smallest dimension for the groove design was determined to be 100 µm (groove spacing),
whereas in our earlier PDMS device this parameter was 50 µm. To retain optimized mixing
performance, it was thus necessary to recalculate the other dimensions in the micromixer to
accommodate larger groove widths. This was done using an approach described in the
references 41 for optimized geometries.26,27 The re-calculations were based on ratios between
different channel and groove parameters according to the design protocol for optimized
geometry41 that was described elsewhere.26,41 The dimensions that were used in this work are
shown in Figure 3: the channel width and depth were set to 430 µm and 150 µm, respectively;
the groove width and depth were 260 µm and 100 µm; and the ridge between grooves was 100
µm (determined by the resolution of the milling).
In order to characterize the mixing performance of micromilled COC mixers with new
geometries, mixing experiments with different flow rates and ratios, including the ratio 1:7
(PBS:PBS) that was used in this work in the LC experiments, were performed (Suppl. Fig. 1).
At this ratio with the total flow rate of 230 µL/min, the COC chip showed sufficient mixing
performance (see the Supplementary Information).
Rounding of the internal corners of features by micromilling is caused by the shape of the
endmills used. Rounded corners have a radius equivalent to that of the endmill. Experiments
with a PDMS chip that incorporated rounded features were performed in advance (see the SI,
Ch
ap
ter
V

Microfluidic Tools for Multidimensional Liquid Chromatography
158
Supplementary Figure 2), but did not reveal any substantial adverse influence on the mixing
performance of these rounded groove structures.
Figure 3. The channel of the micromixer with herringbone grooves: (A) schematic channel side view with channel
and groove dimensions; (B) photograph of the micromilled COC channel at the Y-junction and (C) schematic top
view of the full microchannel.
Optimization of the bonding procedure
To bond the top and bottom COC plates, a solvent-vapour-assisted bonding approach was used.
This method allows the direct bonding of substrates to one another without the use of additional
adhesive materials added to the interface. This type of bonding is especially suited for
applications that require high pressure resistance. Solvent bonding of thermoplastics takes
advantage of polymer solubility in the selected solvents.42 Exposure of the COC surface to a
vapour phase can avoid excessive solvent absorption and allow a more-controlled distribution
of the solvent molecules over the polymer surface.42 Cyclohexane was chosen as a solvent for
the bonding procedure, based on very similar Hildebrandt solubility parameters (which provide
a numerical estimate of the degree of interaction between materials) of COC and cyclohexane
(17.7 and 16.7 J1/2 cm−3/2, respectively).43 When the surface of the COC substrate is solvated,
polymer chains become mobile and can diffuse across the solvated layer into another similarly
solvated COC surface layer. This leads to mechanical interlocking of chains between the two
surfaces and creates an exceptionally strong bond between the two parts.42

Microfluidic micromixer as a tool to overcome solvent incompetibilities in two-dimensional
liquid chromatography
159
It is known that bonding at elevated temperature can greatly enhance polymer
entanglement, which can result in stronger bonding.42 For this reason, after exposing both top
and bottom COC substrates to cyclohexane vapour and aligning and bringing them into contact,
the chip was heated up to 120°C (a bit lower than the glass transition temperature, which is
134°C for this COC grade), pressed together and cooled down to room temperature. Different
exposure times to cyclohexane vapour and applied forces were tested in order to find the optimal
bonding conditions (Table 1). Note that only devices containing non-grooved channels were
tested in this part of the study.
Table 1. Parameters that were tested for optimizing the solvent-vapour-assisted bonding
procedure.
Exposure
time, min
Force applied,
bar
Bonding
time, min
Burst
pressure,
bar
Reason for device
failure
1 2 12 15 <5 delamination
2 4 12 15 42 delamination
3 5 12 15 48 delamination
4 7 15 15 110 delamination
5 8 15 15 160 connector failed; chip
wasn’t damaged
After each chip was clamped in the macro-to-micro interface (as discussed below), we
performed an evaluation of bonding strength. A sudden pressure drop was observed at some
point during a linear increase of pressure, indicating that the burst pressure of the device had
been reached. All chips were visually inspected and it was noticed that in the first four chips
(Table 1) top and bottom plates were delaminated from each other. Using visualization with a
food dye, we observed that the area of the delamination was inversely proportional to the
exposure time to cyclohexane vapour. When the pressure reached 160 bar during the experiment
with the last chip (number 5), the HPLC tubing failed (due to the pressure limitation of the
PEEK tubing). A visual inspection of the chip did not reveal any delaminated or damaged areas.
Thus, the following bonding conditions were used for further experiments: 8 min of exposure
to cyclohexane vapour and 15 bar of applied pressure for 15 min at 120°C. Pressure tests to
reveal the maximum burst pressure were performed later and described in the following section.
Ch
ap
ter
V

Microfluidic Tools for Multidimensional Liquid Chromatography
160
Macro-to-micro interface
Even though the chip is meant to be placed in the interface between dimensions (separation
columns) in the low pressure region (10-30 bar), the valve switching can cause unpredictable
pressure pulses. It was thus decided to test the chip for the maximum burst pressure it could
withstand. During the first pressure stability test with an actual mixing device with herringbone
grooves, the pressure reached 150 bar and the flow was stopped. No visual damage or leakage
was observed for 15 minutes. In a repetition of this test, after a linear increase of pressure up to
~180 bar, the pressure dropped, because of leakage at the PEEK tubing. This experiment was
performed with three different chips with the same outcome. No delamination of the chips was
observed. Because of this it was decided to use UHPLC tubing, which can withstand much
higher pressures. When the total pressure reached 200 bar, UHPLC pumps started to pump only
with the flow rate needed to maintain the pressure in the systems. The pressure signal on both
pumps was recorded (Suppl. Fig. 4). After 4 min a pressure drop was observed. Visual
inspection of the chip revealed a crack in the COC substrate that appeared in the region of the
inlets. Thus, two connector holes milled in close proximity (appr. 6 mm) of each other create
the weakest point in the COC substrate.
There are a few other features of the interface that should be mentioned. In order to
assemble the interface, an extra screwdriver and/or wrench for the bolts is needed. Also, precise
alignment between the COC chip and metal parts is required, otherwise the two parts of the
female connector will be misaligned. The current interface does not allow experiments in which
optical data acquisition needs to be performed. This was not required for the present application.
The mixing experiments described in Supplementary Information were performed without the
metal holder, with the tubing simply inserted through the inlets of the COC chip.
Dispersion test
In order to characterize the elution profile of the micromixer was compared with those produced
by other conventional (mixing) components, as well as a zero-dead volume unit. To understand
the effect of the integration of the micromixer into the modulation interface, the Taylor-
dispersion-Analysis was performed.44 A flow rate of 0.5 mL/min was chosen to allow rapid
testing without introducing excessive Taylor dispersion and unnecessary pressure to the system.
The pressure in the system was in the range of 36-38 bar for all mixing units.
First, to obtain the value of the dead volume of the system, either a zero-dead volume
union, a T-piece, one of two S-mixers (10 µL and 150 µL) or a microfluidic mixer (M-mixer)

Microfluidic micromixer as a tool to overcome solvent incompetibilities in two-dimensional
liquid chromatography
161
were tested (Suppl. Figure 5). Results are shown in Figure 4. Table 2 presents the quantified
data obtained from the integration of the acetone peaks in the chromatograms (n = 3).
Figure 4. Normalized concentration (UV) profiles for 1% solutions of acetone at a total flow rate of 0.5 mL/min
for the zero-dead volume union, T-piece, microfluidic mixer (M-mixer), 10-µL S-mixer and 150-µL S-mixer.
These profiles were recorded using UV detector.
As was expected, band broadening appears for all mixing units to a different extent.
Among all mixing units, the least dispersion is observed in the T-piece. This can be explained
by the simple construction of the T-piece, which represents a T-junction (with 0.28 µL dead
volume). The geometry of the M-mixer and S-mixers are more complicated, which leads to a
longer fluid path. Besides, they have larger internal volumes compared to the T-piece.
Table 2. Chromatographic data obtained from the integration of the acetone plug profile during
dispersion tests; experiments performed in triplicate; an average value is presented.
Unit Peak height,
mAU
Area under
the peak
Peak width, s Total elution
timef, s
Zero-dead volume union
(0.007 µL)45
89.3 ± 0.22 226.8 ± 2.76 5.4 ± 0.01 6.0
T-piece (0.28 µL)45 79.2 ± 0.56 226.7 ± 2.2 7.5± 0.01 9.0
M-mixer (4.65 µL) 65.6 ± 0.62 222.8 ± 5.9 9.0 ± 0.02 10.8
S-mixer (10 µL) 62.5 ± 1.18 222.7 ± 7.5 9.6 ± 0.06 12.0
S-mixer (150 µL) 11.0 ± 0.30 213.8 ± 9.5 49.8 ± 0.10 58.8
f The elution time from the beginning of acquisition till the last point of the elution of each peak profile on the
chromatogram.
Ch
ap
ter
V

Microfluidic Tools for Multidimensional Liquid Chromatography
162
M-mixer with the inner volume of 4.65 µL yields a concentration profile similar to the S-
mixer with the volume of 10 µL (the peak width of the S-mixer is slightly larger due to tailing).
The similarity of the M-mixer to the mixing unit with a larger volume can be explained by the
location of the transverse fluid transport caused by grooves in M-mixer. Mixing occurs both
above and within the grooves.46 While rapid chaotic mixing occurs above the grooves due to
vortex generation, mixing within grooves is governed by laminar flows and slow diffusion.
Thus, the molecules that enter a groove spend a longer time in the channel than molecules that
remain in the open channel, resulting in increased dispersion. Acetone elutes from the
micromixer over a time period of 10.8 s compared to 6 s with a zero-dead volume union.
However, the microfluidic mixer provides much lower dispersion than the 150-µL S-mixer
(dispersion peak width of ~ 50 s), which is recommended for the flow rate range that is used in
our work (100-250 µL/min).19 From this perspective, the developed microfluidic mixer
provides a very good alternative to the S-mixer in LC×LC under these flow rate conditions.
Online LC×LC separation of Polyamide 46
Polyamide 46 consists of linear and cyclic oligomers of adipic acid (ADP) and 1,4-
diaminobutane (DAB).
To demonstrate the use of the M-mixer in 2D-LC, we focused on the identification of the
four most important oligomeric series: ADP-(DAB-ADP)n-2-DAB-ADP, cyclic oligomers,
ADP-(DAB-ADP)n-2-DAB and DAB-(ADP-DAB)n-2-ADP-DAB. HILIC and RP were chosen
for the LC×LC separation in the first and the second dimensions, respectively. In order to
minimize eluent mismatch between these dimensions, a modulation interface (Figure 2)
consists of a two-position 8-port switching valve equipped with two loops, a mixing unit and
an additional pump were used. In this approach, a make-up flow is used to reduce the mobile-
phase strength of the 1D effluent on the 2D column using a microfluidic mixer with herringbone
grooves for this purpose.26
To develop the LC×LC separation, we optimized each dimension separately. Afterwards,
a HILIC×RP-LC separation of Polyamide 46 without make-up flow was performed. The results
are presented in Figure 5A. When the fraction of 1D effluent with a high content of acetonitrile
reaches the 2D column, a substantial portion of the sample peak is not able to interact with the
stationary phase and elutes with the solvent front around the column dead-time (2t0 7 s). This
is the so-called ‘‘solvent-plug peak’’ or ‘‘breakthrough peak’’ (Figure 5A).47
To trap oligomers eluting in an ACN-rich mobile phase, the effluent from the 1D (30
μL/min) was mixed with a make-up flow of water containing 0.1% FA (200 μL/min), diluting

Microfluidic micromixer as a tool to overcome solvent incompetibilities in two-dimensional
liquid chromatography
163
the 1D eluent almost 7 times. Since the HILIC gradient in the first dimension varies from 99%
to 5% ACN, the mobile-phase composition varies between 14.8% and 0.7% of ACN after
dilution. The results, obtained using this approach, are shown in Figure 5B. No breakthrough is
observed and good separation is obtained.
Due to the 7.67-time dilution and the fact that some of the sample went to the waste in
the experiment when a make-up flow was used, the absolute amounts of injected sample on the
second column was lower that in experiment with no make-up flow (in the last case a loop was
filled only with 1D effluent).
Figure 5. Comparison of the 2D HILIC×RP-LC separation of PA 46 (A) without and (B) with make-up flow
using a microfluidic mixer in the interface between two columns. Separation conditions are reported in the “Setup
and chromatographic conditions” (Material and Method section). (C) Chemical structures of the four identified
series in the polyamide 46 samples: (1) ADP-(ADP)n-2-ADP, (2) cyclic oligomers, (3) ADP-(DAB-ADP)n-2-DAB
and (4) DAB-(DAB)n-2-DAB.
In most cases, a dilution of the sample is seen as something to be avoided, as it can cause
additional band broadening and a decrease in sensitivity. However, when used in-between
dimensions, a weaker sample solvent obtained by dilution not only improves retention of
analytes on the 2D column, but it also tends to limit band broadening due to absorbing analytes
in a narrow zone at the top of the column, a so-called on-column sample-focusing effect.4
Ch
ap
ter
V

Microfluidic Tools for Multidimensional Liquid Chromatography
164
Figure 5B shows the two-dimensional separation of a Polyamide 46 sample in which four
identified oligomeric series are indicated. Their chemical structures are given in Figure 5C. The
elution behavior of these series obeys simple rules related to the chain length, where the
monomer elutes first and the higher oligomers elute successively in order of increasing chain
length. During the HILIC separation, oligomers elute based on their chemical composition. On
the one hand, the retention increases with increasing sample polarity and the increase in number
of polar functional groups in the molecule usually enhances sample retention.7 On the other
hand, the interactions of basic and acidic analytes with the stationary phase are expected to be
based on both hydrophilic interactions and electrostatic forces.48 The elution sequence on the
HILIC column can be explained by the ionized state of the primary end groups. It is believed
that electrostatic interactions play an important role in HILIC, due to the partially ionized
residual silanol groups on the surface of the silica stationary phase.48 This leads to a negatively
charged surface that creates an electrostatic field in the contacting mobile phase. In the case of
the ADP-(ADP)n-ADP series, the weak retention in the first dimension can be explained by
repulsion between the silica gel surface (which is negatively charged due to the adsorbed water
molecules48) and carboxylic-acid end groups that are partially negatively charged due to the
presence of water (absorbed layer on the stationary phase). However, the main fraction of
carboxylic-acid end groups remain neutral due to the formic acid that is present in the solute
plug. For the cyclic series, which has no terminal functional groups, the slightly better retention
can be explained by other polar interactions, such as hydrogen bonding and dipole–dipole
interactions. In the oligomeric series ADP-(DAB-ADP)n-DAB, which contains both a
carboxylic-acid group and a primary amine group, the retention mechanism is a superposition
of electrostatic interactions and hydrogen bonding to the stationary phase. The last identified
series was DAB-(DAB)n-DAB, which contains only amine end groups that may be partially
protonated in the presence of formic acid. These molecules have the highest retention on the
HILIC column due to the attractive electrostatic interactions. Due to good retention, these
compounds stay the longest in the first dimension, which results in a very broad peak shape,
long tailing and a large number of modulations required to transfer one-dimensional peaks to
the second dimension.
Besides these identified series, other oligomeric series are visible in Figure 5B (not
marked) (e.g. with adipic acid/pyrrolidine, adipic acid/amide and 1,4-diaminobutane/amide end
groups). However, we focused only on the identification of the main four series discussed
above.

Microfluidic micromixer as a tool to overcome solvent incompetibilities in two-dimensional
liquid chromatography
165
Figure 6. Extracted-ion chromatograms (EICs) of (A) ADP monomer (m/z value is 345.197), (B) tetramer ADP-
(ADP)2-ADP ((m/z value is 939.597).) and (C) DAB monomer (m/z value is 287.24).
Oligomers with carboxylic-acid end groups are weakly retained on HILIC and are eluted
in the beginning of the gradient at higher concentrations of acetonitrile. The utilization of the
microfluidic mixer for dilution of 1D effluent before the second dimension allows the first series
of oligomers (ADP-(ADP)n-ADP) to provide some focusing effect on the 2D column. Figure 6
shows extracted-ion chromatograms (EICs) for ADP monomer (Figure 6A) and tetramer ADP-
(ADP)2-ADP (Figure 6B). Each peak represents one second-dimension run (60 s) from one
collected fraction and the analyte is distributed over these chromatograms.1 As can be seen from
Figure 6A and 6B, each first-dimension peak was sampled 9-10 times, resulting in the 9-10
peaks shown. The obtained 2D chromatograms are sharp. However, a bit of tailing can be
observed, the cause of which is not completely understood, but may be related to a lack of the
complete focusing at the top of the column for the early eluting analytes. With each succeeding
oligomer in the series the tailing becomes less, to disappear completely for tetramers (Figure
6B).
Ch
ap
ter
V

Microfluidic Tools for Multidimensional Liquid Chromatography
166
Oligomers with primary amine end groups (DAB-(DAB)n-DAB) are strongly retained on
the HILIC column due to attractive electrostatic interactions between partially negatively
charged silica gel surface and partially protonated amino groups.48 This series exhibits the most
band broadening during the first-dimension separation and it is the most affected by the
intermediate addition of water (aqueous buffer). Figure 6C shows the EIC for the DAB
monomer. This 1D peak is very wide, has substantial tailing and takes more than 29 modulations
to be transferred to the second dimension.
Figure 7. Extracted ion chromatograms (EICs) of the ADP monomer (m/z value is 345.197) obtained with (A) T-
piece, (B) 10-µL S-mixer, (C) 150-µL S-mixer and (D) M-mixer in the interface of 2D HILIC×RP-LC system for
analysis of PA46 sample.
In order to compare the performance of the M-mixer with other mixing units, we
conducted experiments with a T-piece and two S-mixers (10 µL and 150 µL). Although the
overall performance of all mixing units was similar, several effects were observed. We noticed
a shift to longer total elution times for all mixers with respect to the T-piece. This shift was
small for the 10-µL S-mixer and larger for the M-mixer. A clear pattern for the shifted elution
times of the M-mixer starting from 2 min for ADP monomer (Fig. 7) up to 7 min for DAB
monomer (Fig. 8) was observed. The delay in elution can be caused by the change in 1D flow
rate when a mixing unit is placed directly in the fluid flow and acts as a restrictor. In the case
of S-mixers the restriction is small because the inner cartridge has a bigger diameter compared
to the long narrow channel of the M-mixer. However, a delay of 7 min causes only a 1%

Microfluidic micromixer as a tool to overcome solvent incompetibilities in two-dimensional
liquid chromatography
167
increase in the total analysis time. Furthermore, the quality of 2D separation, when the M-mixer
is used, is not influenced by this shift.
Figure 8. Extract ion chromatograms (EICs) of the DAB monomer (m/z value is 287.24) obtained with (A) T-
piece, (B) 10-µL S-mixer, (C) 150-µL S-mixer and (D) m-mixer in the interface of 2D HILIC×RP-LC system for
analysis of PA46 sample.
We also noticed that the 150-µL S-mixer, which is recommended by the manufacturer for
the flow-rate range 100-250 μL/min,19 gave rise to split peaks for the first oligomeric series
(Supplementary Figure 6C), for which the mixing is most important. This can be caused by
incomplete mixing and the distribution of sample between different regimes having different
compositions. Additionally, the number of modulations required to transfer one 1D peak was
higher than for any other mixing unit, due to broadening of the peak. Finally, the volume of this
mixer is almost twice the volume of the loop size. In this case, resolution is lost inside the mixer
itself due to its relatively large volume.
Ch
ap
ter
V

Microfluidic Tools for Multidimensional Liquid Chromatography
168
Supplementary Information
Characterization of the degree of mixing
For characterization of the degree of mixing, fluorescence detection was used. Fluorescein (5
μM) in phosphate buffer (pH 7.4) was introduced from one inlet whereas 10mM phosphate
buffer was introduced from the other inlets into the Y-junction of the channel at different flow
rates using syringe pumps with 5-mL syringes (Prosens NE1000, The Netherlands). The chip
was placed on an inverted fluorescence microscope (model “DMIL”, Leica Microsystems, The
Netherlands), equipped with a 4×objective, an external light source for fluorescence (EL6000,
Leica Microsystems, The Netherlands), and a CCD camera. For visualization of fluorescence,
a fluorescein filter set (488 nm excitation, 518 nm emission) was used. Images were captured
at different positions along the channel with a CCD camera connected to a computer using a 4x
objective magnification with a field of view of 1.8 mm, a 1-sec exposure time, a gamma setting
of 1.75, and a gain of 3.5.
The mixing performance of COC-milled micromixer
After the COC chip was micromilled and assembled, its mixing performance was tested at
different flow rates. The protocol for testing the mixing efficiency was described in our previous
work.26
The degree of mixing was quantified by determining the standard deviation (SD) in
fluorescence intensity across the width of the channel at different locations along the channel
length. The detailed data analysis procedure described elsewhere.26 For the purpose of this
study, sufficient to say that high SD in fluorescence intensity across the mixing channel
correlates with incomplete mixing. The degree of mixing is inversely proportional to SD. The
high SD is measured at the very beginning of the mixing channel (at the Y-junction), where the
two solutions (5µM fluorescein solution in PBS buffer and PBS buffer) meet and enter the
channel under laminar flow conditions (no mixing).
For the purpose of mixing in the interface between two dimensions of LC×LC to adjust
mobile-phase compositions, it was import to test different flow rate ratios as well.
Supplementary Figure 1 shows results for the mixing performance experiments with different
flow rates at 1:1 ratio and with the flow rates used for this work at 1:7 ratio. As usual, the mixing
efficiency increases (standard deviation, SD drops) toward the end of the channel. It was
observed that when the ratio of inlet flows was 1:1, mixing behaviour was similar for all tested

Microfluidic micromixer as a tool to overcome solvent incompetibilities in two-dimensional
liquid chromatography
169
flow rates. However, the mixing is not complete by the end of the 40-mm channel. The flow
rate ratio 1:7 (30 µL-min – 200 µL-min) was important to test because that was the flow rate
ratio that we wanted to use further in the application of the mixer. Slightly deteriorated situation
was observed, which can be explained by the difficulties to involve thinner fluid layer into the
general chaotic flow. Similar situation was observed in our previous research too.26
Nevertheless, the COC chip showed sufficient mixing performance for all flow rate ratios.
Supplementary figure 1. Mixing efficiency in the COC-micromilled microfluidic mixer at different flow rates
and different flow ratios (1:1 and 1:7); 5 µM fluorescein in PBS mixed with PBS; channel width 430 µm; channel
depth is 150 µm; groove depth is 100 µm; the total channel length 40 mm.
Experiments with groove rounded angles
The radius of the endmills, used for the micromilling process, do not allow for the creation of
sharp concave corners. All concave have an internal radius of curvature depending on the
endmill used. Previous experiments reported by Stroock27,49 showed that herringbone grooves
with an intersection angle θ of 90°, the angle between long and short groove arms
(Supplementary Figure 2A), results in the generation of maximum transverse flows. In order to
investigate how the geometry of the grooves with rounded concave corners affects mixing,
chips with grooves having this geometry were designed and replicated in PDMS. A detailed
fabrication procedure can be found in our previous report.26 Only one angle in the groove design
Ch
ap
ter
V

Microfluidic Tools for Multidimensional Liquid Chromatography
170
was not rounded (Supplementary Figure 2B). This angle is an outer angle and was expected to
stay sharp during the micromilling.
Supplementary figure 2. (A) Schematic drawing of grooves in a channel with herringbone grooves showing long
and short groove arms and groove intersection angle θ. (B) Microscope images taken from above the microchannel
with herringbone grooves that have rounded angles. Only one angle of the groove was not rounded (marked in
red).
Supplementary figure 3. Efficiency of mixing in the PDMS microfluidic mixer with rounded angles herringbone
grooves at different flow rates at 1:1; 5 µM fluorescein in 10mM PBS (pH 7.4) mixed with PBS; channel width
430 µm; channel depth is 150 µm; groove depth is 100 µm; n=3 chips, the total channel length 45 mm.
Supplementary Figure 3 shows that SD levels, which implies that the mixing is
complete, after 20 mm of the channel length at all flow rates. Here, an increased optimized
dimensions comparing to our previous work26 were used but obtained results were similar.
Thus, we decided to proceed with the fabrication by micromilling of a microfluidic mixer based
on this design (dimensions, for eventual use under high pressure).

Microfluidic micromixer as a tool to overcome solvent incompetibilities in two-dimensional
liquid chromatography
171
Pressure test
Supplementary Figure 4 shows the results for the second pressure test that was performed with
a COC chip containing a grooved channel (dimensions are given in Fig.3). The chip withstood
200 bar for 4 min.
Supplementary figure 4. Pressure test with microfluidic COC chip: (A) position of the chip between two UHPLC
pumps as also given Fig.2 both schematically and in a photo and (B) pressure profile for each pump (red and blue
signals). After 4 min at 200 bar, a pressure drop was observed due to the crack at the inlets.
Tests with different mixing units
In order to investigate the influence of the mixing in the interface between two dimensions,
microfluidic mixer (m-mixer), 10-µL S-mixer, 150-µL S-mixer and T-piece were tested..
Supplementary Figure 5 presents the different mixing components that were tested to obtain the
value of dispersion of the system.
Supplementary figure 5. Units that were used for dispersion test: (1) 4.65-µL microfluidic mixer (M-mixer), (2)
150-µL S-mixer, (3) 10-µL S-mixer and (4) T-piece and (5) a Zero-Dead Volume Union.
Ch
ap
ter
V

Microfluidic Tools for Multidimensional Liquid Chromatography
172
Conclusions
In this work, the possibility to use microfluidic technology to improve LC×LC separations has
been successfully demonstrated. We fabricated a microfluidic mixer with herringbone grooves
that was implemented in a HILIC×RPLC system for successful separation and identification of
various oligomeric series in Polyamide 46 samples. A microfluidic chip was fabricated in rigid
COC substrate, which has excellent properties for chip-based LC technologies. Thanks to the
solvent-vapour-assisted bonding approach, a strong bond between two COC parts was obtained.
The resuting chips, when clamped in a metal holder, are able to withstand pressures up to 200
bar.
In order to create a connection with an LC×LC system, a very robust, low-dead-volume
interface was developed. Using standard HPLC connectors, the chip can be directly coupled to
any LC equipment. This opens a perspective for the future implementation of the microfluidic
components in conventional instrumentation for improved performance, even at high pressures.
The microfluidic mixer successfully coped with the mobile-phase mismatch between two
dimensions, diluting the 1D effluent before transferring it to the second dimension. As was
shown, good mixing prevents breakthrough and gives good peak shapes in the second
dimension. Due to the small size and ease of design adjustment, the developed microfluidic
micromixer can be integrated with trap columns on one chip in order to provide an active
modulation in the LC×LC interface. This can be an attractive solution to improve LC×LC
modulation even further, applying modulators with smaller inner volumes with the capability
to adjust mobile-phase compositions much more rapidly and efficiently.

Microfluidic micromixer as a tool to overcome solvent incompetibilities in two-dimensional
liquid chromatography
173
Acknowledgements
This work was financially supported by The Netherlands Organization for Scientific Research
(NWO) in the framework of the Technology Area-COAST program, project no. (053.21.102)
(HYPERformance LC).
The authors would like to thank Gert Salentijn for helpful discussions and his careful reading
of the manuscript.
Ch
ap
ter
V

Microfluidic Tools for Multidimensional Liquid Chromatography
174
References
1. Jandera, P. Comprehensive two-dimensional liquid chromatography — practical impacts of theoretical
considerations. A review. Cent. Eur. J. Chem. 10, 844–875 (2012).
2. François, I., Sandra, K. & Sandra, P. Comprehensive liquid chromatography: Fundamental aspects and
practical considerations-A review. Anal. Chim. Acta 641, 14–31 (2009).
3. Schoenmakers, P., Marriott, P. & Beens, J. Nomenclature and conventions in comprehensive
multidimensional chromatography. LCGC Eur. 25, 1–4 (2003).
4. Jandera, P., Hájek, T. & Česla, P. Effects of the gradient profile, sample volume and solvent on the
separation in very fast gradients, with special attention to the second-dimension gradient in comprehensive
two-dimensional liquid chromatography. J. Chromatogr. A 1218, 1995–2006 (2011).
5. Jandera, P. & Hájek, T. Utilization of dual retention mechanism on columns with bonded PEG and diol
stationary phases for adjusting the separation selectivity of phenolic and flavone natural antioxidants. J.
Sep. Sci. 32, 3603–3619 (2009).
6. Dugo, P., Favoino, O., Luppino, R., Dugo, G. & Mondello, L. Comprehensive Two-Dimensional Normal-
Phase (Adsorption)-Reversed-Phase Liquid Chromatography. Anal. Chem. 76, 2525–2530 (2004).
7. Jandera, P., Hájek, T., Staňková, M., Vyňuchalová, K. & Česla, P. Optimization of comprehensive two-
dimensional gradient chromatography coupling in-line hydrophilic interaction and reversed phase liquid
chromatography. J. Chromatogr. A 1268, 91–101 (2012).
8. Dugo, P., Cacciola, F., Kumm, T., Dugo, G. & Mondello, L. Comprehensive multidimensional liquid
chromatography: Theory and applications. J. Chromatogr. A 1184, 353–368 (2008).
9. Cacciola, F., Jandera, P., Blahová, E. & Mondello, L. Development of different comprehensive two
dimensional systems for the separation of phenolic antioxidants. J. Sep. Sci. 29, 2500–2513 (2006).
10. Cao, L. et al. The development of an evaluation method for capture columns used in two-dimensional
liquid chromatography. Anal. Chim. Acta 706, 184–190 (2011).
11. Tian, H.-Z., Xu, J. & Guan, Y.-F. Vacuum-evaporation Interface of Comprehensive Two-dimensional
Liquid Chromatography and Its Application. Chinese Journal of Analytical Chemistry 36, 860–864 (2008).
12. Verstraeten, M., Pursch, M., Eckerle, P., Luong, J. & Desmet, G. Thermal modulation for
multidimensional liquid chromatography separations using low-thermal-mass liquid chromatography
(LC). Anal. Chem. 83, 7053–7060 (2011).
13. Van de Ven, H. C., Gargano, A. F. G., Van der Wal, S. J. & Schoenmakers, P. J. Switching solvent and
enhancing analyte concentrations in small effluent fractions using in-column focusing. J. Chromatogr. A
1427, 90–95 (2016).
14. Vonk, R. J. et al. Comprehensive two-dimensional liquid chromatography with stationary-phase-assisted
modulation coupled to high-resolution mass spectrometry applied to proteome analysis of saccharomyces
cerevisiae. Anal. Chem. 87, 5387–5394 (2015).
15. Murahashi, T. Comprehensive two-dimensional high-performance liquid chromatography for the
separation of polycyclic aromatic hydrocarbons. Analyst 128, 611 (2003).
16. Gargano, A. F. G., Duffin, M., Navarro, P. & Schoenmakers, P. J. Reducing Dilution and Analysis Time
in Online Comprehensive Two-Dimensional Liquid Chromatography by Active Modulation. Anal. Chem.
88, 1785–1793 (2016).
17. Capretto, L., Wei Cheng, M. H. & Zhang, X. Micromixing Within Microfluidic Devices. TripleC 304, 27–
68 (2011).
18. Singh, M. K., Anderson, P. D. & Meijer, H. E. H. Understanding and optimizing the SMX static mixer.
Macromol. Rapid Commun. 30, 362–376 (2009).
19. Brochure provided by Analytical Scientific Instruments US, http://www.hplc-asi.com/static-mixers/.
(2014).
20. Lin, S.-L., Bai, H.-Y., Lin, T.-Y. & Fuh, M.-R. Microfluidic chip-based liquid chromatography coupled
to mass spectrometry for determination of small molecules in bioanalytical applications: An update.
Electrophoresis 35, 1275–1284 (2014).
21. Dietze, C., Hackl, C., Gerhardt, R., Seim, S. & Belder, D. Chip-based electrochromatography coupled to
ESI-MS detection. Electrophoresis 37, 1345–1352 (2016).
22. Yin, H. et al. Microfluidic chip for peptide analysis with an integrated HPLC column, sample enrichment
column, and nanoelectrospray tip. Anal. Chem. 77, 527–533 (2005).
23. Sung, W. C., Makamba, H. & Chen, S. H. Chip-based microfluidic devices coupled with electrospray
ionization-mass spectrometry. Electrophoresis 26, 1783–1791 (2005).
24. Ro, K. W., Liu, J. & Knapp, D. R. Plastic microchip liquid chromatography-matrix-assisted laser
desorption/ionization mass spectrometry using monolithic columns. J. Chromatogr. A 1111, 40–47 (2006).

Microfluidic micromixer as a tool to overcome solvent incompetibilities in two-dimensional
liquid chromatography
175
25. Bai, H.-Y., Lin, S.-L., Chan, S.-A. & Fuh, M.-R. Characterization and evaluation of two-dimensional
microfluidic chip-HPLC coupled to tandem mass spectrometry for quantitative analysis of 7-
aminoflunitrazepam in human urine. Analyst 135, 2737 (2010).
26. Ianovska, M. A., Mulder, P. P. M. F. A. & Verpoorte, E. Development of small-volume, microfluidic
chaotic mixers for future application in two-dimensional liquid chromatography. RSC Adv. 7, 9090–9099
(2017).
27. Stroock, A. D. et al. Chaotic mixer for microchannels. Science 295, 647–651 (2002).
28. Jena, R. K., Yue, C. Y. & Lam, Y. C. Micro fabrication of cyclic olefin copolymer (COC) based
microfluidic devices. Microsyst. Technol. 18, 159–166 (2012).
29. TOPAS Advanced Polymers. Brochure provided by Polyplastics, Topas COC: Transparent copolymer
with excellent optical properties. (2015).
30. Guckenberger, D. J., de Groot, T. E., Wan, A. M. D., Beebe, D. J. & Young, E. W. K. Micromilling: a
method for ultra-rapid prototyping of plastic microfluidic devices. Lab Chip 15, 2364–2378 (2015).
31. Mair, D. A., Geiger, E., Pisano, A. P., Fréchet, J. M. J. & Svec, F. Injection molded microfluidic chips
featuring integrated interconnects. Lab Chip 6, 1346–1354 (2006).
32. Mair, D. A. et al. Room-temperature bonding for plastic high-pressure microfluidic chips. Anal. Chem.
79, 5097–5102 (2007).
33. Wouters, B. et al. Design of a microfluidic device for comprehensive spatial two-dimensional liquid
chromatography. J.Sep.Sci. 38, 11123–1129 (2015).
34. Chen, C. F. et al. High-pressure needle interface for thermoplastic microfluidics. Lab Chip 9, 50–55
(2009).
35. IDEX & IDEX Health and Science. Catalogue IDEX. (2014).
36. Fredrickson, C. K. & Fan, Z. H. Macro-to-micro interfaces for microfluidic devices. Lab Chip 4, 526
(2004).
37. https://www.vici.com/vfit/vfit.php. No Title. https://www.vici.com/vfit/vfit.php Available at:
https://www.vici.com/vfit/vfit.php.
38. Bayliss, N. S. & McRae, E. G. Solvent effects in the spectra of acetone, crotonaldehyde, nitromethane and
nitrobenzene. J. Phys. Chem. 58, 1006–1011 (1954).
39. Schneider, F., Draheim, J., Kamberger, R. & Wallrabe, U. Process and material properties of
polydimethylsiloxane (PDMS) for Optical MEMS. Sensors Actuators, A Phys. 151, 95–99 (2009).
40. Martin, A., Teychené, S., Camy, S. & Aubin, J. Fast and inexpensive method for the fabrication of
transparent pressure-resistant microfluidic chips. Microfluid. Nanofluidics 20, 1–8 (2016).
41. Lynn, N. S. & Dandy, D. S. Geometrical optimization of helical flow in grooved micromixers. Lab Chip
7, 580–587 (2007).
42. Tsao, C. W. & DeVoe, D. L. Bonding of thermoplastic polymer microfluidics. Microfluid. Nanofluidics
6, 1–16 (2009).
43. Barton, A. F. M. CRC Handbook of solubility parameters and other cohesion parameters. (CRC Press,
1991).
44. Understanding Taylor Dispersion Analysis. (2015).
45. Swagelok.com. Gaugeable Chromatograph and Column End Fittings. www.swagelok.com Available at:
https://www.swagelok.com/downloads/webcatalogs/EN/MS-02-173.PDF.
46. Du, Y., Zhang, Z., Yim, C., Lin, M. & Cao, X. A simplified design of the staggered herringbone
micromixer for practical applications. Biomicrofluidics 4, 1–13 (2010).
47. Jiang, X., Van Der Horst, A. & Schoenmakers, P. J. Breakthrough of polymers in interactive liquid
chromatography. J. Chromatogr. A 982, 55–68 (2002).
48. Buszewski, B. & Noga, S. Hydrophilic interaction liquid chromatography (HILIC)-a powerful separation
technique. Anal. Bioanal. Chem. 402, 231–247 (2012).
49. Stroock, A. D. & Whitesides, G. M. Controlling flows in microchannels with patterned surface charge and
topography. Acc. Chem. Res. 36, 597–604 (2003).
Ch
ap
ter
V


Chapter VI
General discussion,
conclusions and future
perspectives


General discussion, conclusions and future perspectives
179
General discussion, conclusions and future perspectives
In this thesis, we have demonstrated the development and application of the chaotic
microfluidic mixer for improving conventional analytical technique such as two-dimensional
liquid chromatography (2D-LC). Without doubts, the research described here provides
intriguing possibilities for the application of the microfluidic technology. While many
miniaturized lab-on-a-chip systems trying to replace large laboratory equipment (which in
many cases is not achievable task), this project was focusing on using advantages of the
miniaturized devices (such as small volume) to be connected on-line with conventional
equipment. The research showed in this thesis arose as a need to find more convenient
approaches to improve the performance of the 2D-LC technique and to bring it to a different
level, where analysis of tens thousand and more components in one run become possible.
The research, presented in this thesis, covers many different facets of modern technology.
This work has been done in the interface between two rapidly developing fields –
multidimensional LC and microfluidics. On one hand we talk about huge complicated
equipment, composed of 2 chromatographic systems coupled through the intricate interface. On
the other hand, we have a small 5-cm long chip, with, nevertheless, a potential to solve one of
the major problems that exist in 2D-LC separation. The problem that we are talking about here
is a solvent incompatibility between dimensions and we propose a solution to it such as the
utilization of the mixing device in the interface.
As was discussed in Chapter 1 and Chapter 3, the mixing device in the interface between
two columns in 2D-LC must satisfy three strict conditions: it should provide fast mixing in-line
at different ratios in the wide range of flow rates (compatible with typical flow rates used in
2D-LC); have a small volume (to not contribute to the extra column-band broadening); and
must be able to withstand brief pressure pulses up to a few hundred bar (due to its connection
to switching valves which operated under the pressure from pumps). Therefore, an idea to
develop and use small-volume microfluidic mixers that are able rapidly mix solutions at
different flow rates is justified.
It is important to keep in mind, that microfluidic devices, on the other hand, has a very
important and disadvantageous in our situation feature such as an existence of a laminar flow,
which does not allow two streams to be mixed under normal consequences. Therefore, our first
research goal was to develop a fast micromixer that works under the wide range of flow rates Dis
cuss
ion

Microfluidic Tools for Multidimensional Liquid Chromatography
180
and able to mix solvents with different viscosity (which is often a case in LC). Based on the
overview we presented in Chapter 2, it was clear that the mixer with herringbone grooves
meets the required conditions. In Chapter 3 we proved this concept. Besides, we believe that
the wide overview of the existing micromixers based on chaotic advection and the approach for
choosing the appropriate type for a particular application presented in Chapter 2, combined
with the fabrication protocol described in Chapter 3 provide a good base for the end-users who
are interested in using microfluidic mixers in their own research.
As Robert M. Pirsig said, “Technology presumes there is just one right way to do things
and there never is”. Seeing the presented research from this perspective, the fabricated devices
were designed with the idea to provide competition for the existing mixers – T-piece and S-
mixers1 – that are currently used for mixing in the conventional LC systems. The developed by
us micromixer possess better characteristics in terms of volume and efficiency of mixing under
lower flow rates. As we showed later in Chapter 5, the developed COC-micromixer (with the
volume of 4.65 µL, M-mixer) shows similar dispersion profile to T-piece and the S-mixer with
the volume to 10 µL. M-mixer is clearly outperforms S-mixer with 150 µL volume in both
dispersion profile and the real application. However, in the real separation T-piece and S-mixer
give similar performance while M-mixer give some time-shift and small tailing. Even if the
mixer will show better performance than commercial mixers at lower flow rate (for which it
was designed), the overall dispersion due to the relatively large volume of the system (loops
and tubing) will vanish the benefit of having a small volume of the M-mixer. We suggest that
the benefit of the developed micromixer would be seen to the full extend if other component
have also smaller volume and integrated on the same chip. In other words, if the modulator and
a second-dimension column are also integrated on the same micromachined device. This will
dramatically decreased not only the dispersion of the system (due to the absence of extra tubing
for connecting different components), but also reduce the time of the second-dimension
separation. Figure 1 represents the situation when a column packed with a stationary phase
(particles or monoliths) is used instead of loops in the modulator. In such system, the effluent
coming from the first dimension will be mixed with the modifying solvent in order to trap
analytes on the pre-concentration column, followed by elution of the analytes after switching
the solvent with higher eluting strength. In this case, this will create so-called trap column that
provide an extra pre-concentration of analytes before entering the second column and it would
provide an active modulation in the LC×LC interface. Afterwards, the analytes will proceed to

General discussion, conclusions and future perspectives
181
the second-dimension where the effluent will be mixed with the 2D mobile phase, after which
the second-dimension separation will take place in the channel packed with a stationary phase.
We believe that developing such state-of-the-art device one should be concerned about several
aspects. The uniform packing of the microfluidic channel with particles can be a challenging
task, it require utilization of special frits and high pressure for packaging. The fabrication of
frits is problematic within a microfluidic channel and formation of bubbles and band broadening
is frequently observed. In case of monoliths, during the polymerization process the gaps
between channel walls and the monolithic phase can form. Besides, the monoliths can dislodge
under applied pressure. In both cases, the utilization of the channel with stationary phase will
create additional backpressure that should be taking into account designing the whole separation
system.
Figure 1. A micromachined device with integrated modulator with a mixer and pre-concentration column and
mixer for modifying the mobile phase followed by the second-dimension separation column. Additional pump
assists in the absorption/desorption process from the pre-concentration column.
Another example of the device that our mixer could compete with is a commercially
available Jet Weaver mixer,2 developed by Agilent and incorporated into the HPLC pumping
system (1290 Infinity Binary pump). That is a perfect example of the chip-based microfluidic
device that have already successfully entered the world of “macro-equipment”. As discussed in
Chapter 3, this mixer employs the split-and-recombine mixing principle using fro this a network
of multi-layer microfluidic channels. The minimum volume of this device is 35 µL. In our
approach we use different mixing mechanism – chaotic advection, which was proved to be more
efficient mixing mechanism that allows to obtain mixing using devices with smaller volume, as
discussed in Chapter 2. Besides, our mixer can be separately connected to any LC or MS
equipment, while Jet Weaver mixer is not applicable outside LC pumping system.
Dis
cuss
ion
Microfluidic Tools for Multidimensional Liquid Chromatography
182
Another important requirement that was set for the mixing device is its pressure-
resistance. The originally reported design by Stroock et al.3 had a very small inner
volume (around 1 µL). In order to maintain pressure drops below 1 bar, we designed
micromixers with increased dimensions (obtaining the inner volumes of 1.6 μL and 2.2
μL). However, the dimensions used by Stroock et al.3 can not simply be multiplied by a
constant to achieve mixers with bigger volumes exhibiting the same mixing efficiency.
Therefore, a lot of work was put into optimization of channel and groove parameters
based on a previously described numerical study.4
As was shown in Chapter 3, our initial devices were fabricated in PDMF using soft-
lithography. While it was sufficient for the prove of concept, these devices didn’t withstand
more than 10 bar of pressure. Starting to search a new fabrication method in order to obtain
pressure-resistant chips revealed that the initial chip features around 50 µm is on the edge of the
resolution of all accessible to us fabrication techniques. Therefore, in order to fabricate a
pressure-resistant chip, we had to modify and optimize the geometrical features inside the
channel again. Using the same approach described in Chapter 3, we obtained chips with
increased dimensions and the minimum features of 100 µm. Thought it is slightly increased the
inner volume of the device from 1.6 to 3.6 µL (Chapter 4), it allowed us to consider several
fabrication methods.
In Chapter 4 and Chapter 5 we were exploring two relatively new techniques, such as
Selective Laser-Induced Etching (SLE) and micromilling. For the work descried in Chapter 4,
a solid block of fused silica was used to create a chip using the laser modification of the fused
silica with the following etching of modified material. Because the whole procedure was
performed in the solid piece of fused silica, the bounding step (bonding of two parts of the chip)
was eliminated. We aimed to fabricate a 30-mm-long microfluidic mixing channel with
herringbone structures. Unfortunately, due to such channel length, the etching time required for
removing the modified material was also too long and we didn’t manage to obtain the equal
cross-section of the channel. Besides, the herringbone grooves were observed only in the middle
part of the channel, which was not sufficient to obtain a good working mixing device. However,
in terms of pressure-resistance, the obtained fused-silica chips can withstand pressure of 85 bar,
which make them applicable in the interface of multidimensional liquid chromatography as a
separate mixing device.

General discussion, conclusions and future perspectives
183
We tried to solve these fabrication issues accounting for difference in etching rate in
different device regions (more etching from the channel side and less in the middle). This
brought us to the idea of an adjusted “gradient” design with different channel width/depth and
groove dimensions at the beginning/end and in the middle of the channel (depending on the
time that a particular region stays in contact with the aching solution). The next chip generation
with such adjusted design showed more equal cross section and much larger regions with good-
resolved herringbone grooves, which lead to a better degree of mixing. Unfortunately, a
complete mixing by the end of the channel was still not obtained. In the future, it would be
interesting to optimize design further and obtain a chip with good-resolved grooves along the
whole channel.
Nevertheless, to the best of our knowledge, the fabrication of the fused silica chips with
such length with the complex features inside using the SLE technique has never been explored
before. This makes our work a pioneering in this area of research and makes an interesting topic
for the future.
Due to the failure of the fabrication approach exploited in Chapter 4. we have to search
for another option for the fabrication of pressure-resistant chip. We chose micromilling
technique as a compromise between speed of transferring the sketch into the actual device (it is
a direct fabrication method), its accessibility and appropriate resolution (around 100 µm). The
choice of material was also an important aspect. We decided to use cyclic-olefin copolymer
(COC), due to it is rigidity and compatibility with solvents used in LC applications (acetonitrile,
methanol, etc.). The fabrication method, as described in Chapter 5, consisted of several steps,
which, due to the limited time, were strategically planned. The first part was milling in COC
substrate. It required 5 hour in total to mill one bottom part of the chip with a channel and
herringbone structures. The top part was cut from the sicker piece of COC with the drilled
conical access holes. The next step was the bonding of two parts, which was done using the
solvent-vapour-assisted bonding approach that was used in the group of Eeltink.5 Due to the
mechanical interlocking of polymer chains between two surfaces under the cyclohexane vapor,
exceptionally strong bond between two parts was achieved.6 Without doubts, this approach
proved to be very useful in our application, but can be easily applied for the fabrication of any
pressure-resistance devices. The last step of the fabrication process was development of a
specially designed holder to assist in the pressure-resistance of the device and to connect the
chip to the equipment. The holder consists of two metal parts and the chip was clamped between
Dis
cuss
ion

Microfluidic Tools for Multidimensional Liquid Chromatography
184
them. The top metal part had an access wholes that had a standard 10-32 thread for standard
HPLC connectors. The final assembly was able to withstand pressures up to 200 bar.
Due to the standard 10-32 thread in the metal top part and the conical parts in the top
COC plate, the holder also served as a low-dead-volume micro-to-macro interface to directly
coupled the chip to 2D-LC system. This approach opens an attractive perspective for the future
implementation of any microfluidic component into conventional instrumentation, even at high
pressures.
The developed COC chip was implemented in a HILIC×RPLC system for successful
separation and identification of various oligomeric series in Polyamide 46 samples. As was
shown in Chapter 5, the microfluidic mixer successfully copes with the mobile-phase
mismatch between two dimensions, mixing the effluent after the first column before
transferring it to the second dimension. The proof of good mixing can be seen as the prevention
of the break-through in the second dimension. We want to emphasize that even though the
developed mixer did not show better performance than T-piece and 10-uL S-mixer, there is no
need to underestimate the developed mixer. Having a very small volume, it proved to be fast,
efficient and robust during a very large number of modulations. Unfortunately, the time of this
project was limited and there was no opportunity to perform more detailed research and to
compare thoroughly the behavior of different mixing units. It would be also interesting to
investigate performance of the microfluidic mixer in the separation of different samples and
therefore, at different flow rates.
In conclusion, the results of this thesis show a very good potential of combining the
microfluidic technology and conventional analytical techniques. In our case, we aimed to
improve the performance of multidimensional liquid chromatography using a microfluidic
mixer. In this work, we provided a comprehensive methodology for choosing an appropriate
micromixer and design adjustments for the need of particular application, its fabrication using
several techniques, its integration into the conventional LC equipment and its successful
application even at high pressures. We believe that the research described in this thesis gives a
good basis for scientists, who has an interest in both microfluidics and multidimensional liquid
chromatography for their own research.

General discussion, conclusions and future perspectives
185
References
1. Brochure provided by Analytical Scientific Instruments US, http://www.hplc-asi.com/static-mixers.
(2014).
2. Agilent 1290 Infinity LC System, Manual and Quick Reference, Agilent Technologies. (2012).
3. Stroock, A. D. et al. Chaotic mixer for microchannels. Science 295, 647–651 (2002).
4. Lynn, N. S. & Dandy, D. S. Geometrical optimization of helical flow in grooved micromixers. Lab Chip 7,
580–587 (2007).
5. Wouters, B. et al. Design of a microfluidic device for comprehensive spatial two-dimensional liquid
chromatography. J.Sep.Sci. 38, 11123–1129 (2015).
6. Tsao, C. W. & DeVoe, D. L. Bonding of thermoplastic polymer microfluidics. Microfluid. Nanofluidics 6,
1–16 (2009).
Dis
cuss
ion


Samenvatting


Samenvatting
189
Dit proefschrift is gericht op het uitbreiden van de toepassing van microfluïdische technologie
voor het verbeteren van conventionele analytische scheidingstechnieken, zoals two-dimensional
liquid chromatography (2D-LC), die gebruikt wordt voor het analyseren van complexe
monsters. Het meest voorkomende probleem van de mobiele fase incompatibiliteit tussen
kolommen (dimensies) in 2D-LC vereist de toepassing van een mixing component in de
interface om mobiele fasesamenstellingen aan te passen. Deze mixer moet zorgen voor snelle
menging in lijn bij verschillende flowsnelheidsverhoudingen voor een breed bereik van
stroomsnelheden, het moet een klein volume hebben en in staat zijn om korte drukpulsen tot een
paar honderd bar te weerstaan, vanwege zijn verbinding met gebruikte schakelkleppen om
monster tussen kolommen over te brengen.
Het potentieel van de lab-on-a-chip apparaten voor toepassingen in zowel industriële als
wetenschappelijke gebieden heeft de ontwikkeling van microfluïdische technologie in een hoog
tempo aangestuurd. Het belangrijkste monsterbewerkingsproces in klinische diagnostiek,
genetische sequentiebepaling, chemische productie en proteomica blijft menging, daarom is de
implementatie van effectieve menging op de microschaal één van de belangrijkste aspecten van
veel microfluïdische systemen. In Hoofdstuk 2 geven we een uitgebreid overzicht van de
literatuur van het afgelopen decennium waarin reeds bestaande micromixers worden beschreven
op basis van chaotische advectie en hun combinatie met andere mengprincipes, bijvoorbeeld
splitsen en recombinatie. Bij het onderzoeken en vergelijken van deze micromixers leggen we
de nadruk op kanaalgeometrie, stromingscondities en het mechanisme van mengen. We
beschrijven ook de meest voorkomende toepassingsgebieden van passieve chaotische
micromixers aan de hand van echte voorbeelden, en bespreken de verbinding tussen
kanaalgeometrie, mengmechanisme en mogelijk toepassingsgebied onder verschillende
stroomomstandigheden.
In Hoofdstuk 3 beschrijven we de ontwikkeling van microfluïdische mixers met een
klein volume in poly(dimethylsiloxaan) (PDMS) die groeven op de boven- of onderkanaalwand
bevatten om mengen te induceren op basis van chaotische advectie. Deze benadering werd voor
het eerst beschreven door Stroock et al.1 in 2002. Om echter binnenvolumina in de orde van één
microliter te hebben, geschikt voor 2D-LC, verhoogden we eerder gerapporteerde dimensies op
basis van numerieke studies voor geoptimaliseerde kanaal- en groefgeometrieën. Groeven
werden geplaatst in matrices, hetzij in een schuine hoek ten opzichte van de wand (schuine
groeven, SG), hetzij in de vorm van asymmetrische chevrons, ook bekend als herringbones, in
verspringende reeksen (visgraatgroeven, HG). In onze studies bleken visgraatgroeven efficiënter

Samenvatting
190
te zijn voor het verbeteren van het mengen, wat consistent is met waarnemingen uit andere
onderzoeken.2,3 We hebben met succes de prestaties van HG-micromixers aangetoond voor het
mengen van vloeistoffen met verschillende viscositeiten (acetonitril, methanol en
wateroplossingen) in verschillende verhoudingen (1: 2, 1: 5 en 1:10). De ontwikkelde
micromixer maakt volledige menging mogelijk binnen een afstand van 3 cm binnen het 5 cm
lange microkanaal over een breed bereik van stroomsnelheden (4-1000 μL/min).
De succesvolle toepassing van de ontwikkelde micromixer in de interface tussen twee
dimensies in 2D-LC hangt sterk af van de drukweerstand (om bestand te zijn tegen korte
drukpulsen wanneer bijvoorbeeld multiport valves worden geschakeld). Er werden
verschillende benaderingen genomen om een chip te fabriceren die bestand is tegen drukken tot
200 bar. Het onderzoek in Hoofdstuk 4 beschrijft de fabricage van een gegroefde
microfluïdische mixer in een blok van gesmolten silica met behulp van Selective Laser-Induced
Etching (SLE).4–6 Deze techniek bestaat uit twee stappen: 1) de blootstelling van glas aan
scanning gefocuste ultrakorte (fs of ps) gepulseerde laserstraling, die plaatselijk
glaseigenschappen in het focale volume verandert om zelf-uitgerichte nanoscheurtjes loodrecht
op de laserpolarisatierichting te creëren;7 2) etsen van de met een laser gemodificeerde zone
door HF of een alkalische oplossing zoals KOH in water.5,7 Deze aanpak stelde ons in staat om
een chip te verkrijgen met complexe groefstructuren in een massief stuk materiaal, waardoor de
gebruikelijke verbindingsstap bij de fabricage van microfluïdische apparaten werd
geëlimineerd. We rapporteren een mengchip met visgraatstructuren met een kanaallengte tot 33
mm, die voor de eerste keer gefabriceerd zijn met SLE. We zijn erin geslaagd om drie generaties
chips met verschillende dimensies te fabriceren. Onze resultaten toonden aan dat het vergroten
van de kanaaldiameter het mogelijk maakte om kanalen met een betere resolutie met groeven te
verkrijgen vanwege de gemakkelijkere toegang van de etsoplossing tot het met een laser
behandelde gesmolten siliciumdioxide. Het lukte echter niet om een gegroefd kanaal met
uniforme doorsnede te maken. Het kanaal had nog steeds een conische vorm naar het midden
van het kanaal toe, wat te wijten is aan de aard van het etsproces. Gebieden aan het einde van
het mengkanaal worden langere tijd blootgesteld aan etsmiddel dan gebieden in de richting van
het midden van het kanaal, omdat het etsmiddel vanaf de uiteinden in het kanaal moet werken.
Om dit effect te ondervangen, hebben we een aangepast ontwerp voorgesteld dat een overmatige
ets aan het begin en aan het einde van het kanaal compenseert. Deze aanpak resulteerde in een
iets betere groefresolutie in het kanaal en verschafte verbeterde mengprestaties. De drukproeven
toonden aan dat deze chips met gesmolten siliciumdioxide bestand zijn tegen drukken tot 85 bar.

Samenvatting
191
Bij hogere drukken breken ofwel de slangconnectoren naar het apparaat of breekt het apparaat
zelf bij de schroefdraad waarin de schroefconnectoren zich bevinden.
In Hoofdstuk 5 beschrijven we de fabricage van de microfluïdische mixer in cyclisch
olefinecopolymeer (COC)8 met behulp van micromilling9 als de andere benadering voor het
verkrijgen van een drukbestendige chip. Een in COC gefreesde chip werd geplaatst in een
speciaal ontworpen, robuuste metalen houder met een klein dood volume die een directe
verbinding mogelijk maakte met chromatografische instrumentatie met behulp van
gestandaardiseerde HPLC-connectoren. Dit ontwerp is bestand tegen drukpulsen tot 150 bar.
Een microfluïdische mixer werd geïmplementeerd in een 2D HILIC × RP-LC-systeem voor
analyse van nylonmonsters. Het probleem van de incompatibiliteit van de mobiele fase tussen
de dimensies werd aangepakt door de snelle menging in lijn van het effluent van de eerste
dimensie met een zwakker oplosmiddel in de micromixer voordat het de tweede kolom bereikte.
Wanneer onze mixer werd gebruikt om de make-up flow op te nemen, werd een verbeterde
scheiding (zonder doorbraak en goede piekvormen in de tweede dimensie) verkregen in
vergelijking met het systeem zonder make-up flow. We hebben met succes verschillende
oligomere series in nylonmonsters (Polyamide 46) geïdentificeerd.
Slotopmerkingen
De resultaten in dit proefschrift demonstreren het potentieel van microfluïdische apparaten als
componenten om conventionele "macroscopische" apparatuurprestaties te verbeteren. Ons
onderzoek toont de mogelijkheid om kleine microfluïdische apparaten te fabriceren die bestand
zijn tegen relatief hoge drukken, wat hun toepasbaarheid vergroot. Als toekomstig perspectief
en de volgende stap in het verbeteren van de prestaties van 2D-LC, zou de ontwikkelde
microfluïdische micromixer kunnen worden geïntegreerd met trapkolommen op één chip om
extra analyt pre-concentratie te bieden voordat de tweede kolom wordt betreden. Dit zou een
aantrekkelijke oplossing zijn om de modulatie in 2D-LC nog verder te verbeteren door apparaten
toe te passen met kleinere binnenvolumes met zowel meng- als pre-concentratiefuncties.

Samenvatting
192
Referenties
1. Stroock, A. D. et al. Chaotic mixer for microchannels. Science 295, 647–651 (2002).
2. Lynn, N. S. & Dandy, D. S. Geometrical optimization of helical flow in grooved micromixers. Lab Chip 7,
580–587 (2007).
3. Aubin, J., Fletcher, D. F., Bertrand, J. & Xuereb, C. Characterization of the mixing quality in micromixers.
Chem. Eng. Technol. 26, 1262–1270 (2003).
4. Matsuo, S., Tabuchi, Y., Okada, T., Juodkazis, S. & Misawa, H. Femtosecond laser assisted etching of
quartz: Microstructuring from inside. Appl. Phys. A Mater. Sci. Process. 84, 99–102 (2006).
5. Gottmann, J., Hermans, M., Repiev, N. & Ortmann, J. Selective laser-induced etching of 3D precision
quartz glass components for microfluidic applications-up-scaling of complexity and speed. Micromachines
8, (2017).
6. Hermans, M., Gottmann, J. & Riedel, F. Selective, laser-induced etching of fused silica at high scan-speeds
using KOH. J. Laser Micro Nanoeng. 9, 126–131 (2014).
7. Osellame, R., Hoekstra, H. J. W. M., Cerullo, G. & Pollnau, M. Femtosecond laser microstructuring: An
enabling tool for optofluidic lab-on-chips. Laser Photonics Rev. 5, 442–463 (2011).
8. TOPAS Advanced Polymers. Brochure provided by Polyplastics, Topas COC: Transparent copolymer with
excellent optical properties. (2015).
9. Guckenberger, D. J., de Groot, T. E., Wan, A. M. D., Beebe, D. J. & Young, E. W. K. Micromilling: a
method for ultra-rapid prototyping of plastic microfluidic devices. Lab Chip 15, 2364–2378 (2015).

Acknowledgements


Acknowledgements
195
There are lot of people that made an impact on my life during PhD years. Firstly, I would
like to express my sincere gratitude to my Prof. Sabeth Verpoorte who accepted me for the
position of PhD student in her Pharmaceutical Analysis group. Sabeth, you believed in me even
when I was too critical to myself. You provided me with enormous freedom, which was the
main condition to personalize my research and apply my creativity. I am grateful for your
understanding and at the same time critical mindset, for your wisdom and all your
encouragement!
I am also grateful to the following university staff: Patty Mulder and J.P. for their
unfailing support and assistance during my PhD research. Patty, thank you for helping me in
learning everything in the lab. Your input in my PhD is undeniably tremendous. J.P. thank you
for trying so hard to help me with my research and many valuable lessons that you gave me for
life. The hard times, that you have put me through, helped me to grow.
____________
I would like to thank my fellow doctoral students for their feedback, cooperation and of
course friendship. Maureen, Nadiah, Sergio, Hanan and Pim, thank you for our amazing time
together. You all are, first of all, my friends and only than colleagues. Your presence in the
group made me feel that I want to come to the lunchroom and be a part of your joyful company.
I always felt your support and eagerness to help in both research and in my daily life. I hope we
can meet time to time and share cheerful updates about our lives.
Maureen, thank you for being both my colleague and my best friend here, far away
from my home country. I think we are so similar and because of this we are able to understand
each other perfectly. I hope we will support each other in the future and our friendship will
grow. Maybe one day we become partners in business, who knows :-) Hanan, I am very happy
that we became closer this year. I hope we will never loose this! And remember, you will break
any walls on your way, but nobody will break you, I am sure! Sergio, I wish you enormous
achievements in both professional and personal life (don’t forget to invite me for the wedding).
Nadiah, I am happy to met you and I hope you will have a great scientific career! Pim, I am
very happy that my research helped yours and I hope one day we will have another bbq on your
rooftop!
Thank you, Gert and Pieter, for sharing our lovely office and helping me so much,
especially in the beginning. Gert, big thanks for reading and correcting a big part of this thesis.
Maciej S., thank you for helping with flow simulations. Maciej G., thank you for showing me
around in my first evening in Groningen, De Toeter is still one of my favorite places.
____________

Acknowledgements
196
I would like to acknowledge The Netherlands Organization for Scientific Research
(NWO) for providing the funding for this work. I also would like to express my thankfulness
to Ynze Mengerink for arranging the internships at DSM Resolve and Erik Ritzen for helping
me in the lab during that time. This secondment gave me an opportunity to see better the
company life and to obtain good results that I included in this thesis.
In addition, I would like to express my gratitude to my colleagues from the
HYPERformance projec: Peter, Henrik, Anna and Andrea for your support and help.
Henrik, separate thanks for organizing an amazing trip to Iceland, and of course for your help
with some HPLC tests! With a special mention to Arto Heiskanen and Jenny Emnéus from
DTU Nanotech. It was fantastic to have an opportunity to work in your facilities. My pressure-
resistant chip would not be able to be without our collaboration on such a short notice. A very
special gratitude goes out to Bert Wouters, who helped me in the crucial step of my PhD,
namely to assemble a chip. Without your help, I would not make it so fast.
_________
My lovely artistic friend Viktoria, from the moment you entered my office I recognized
a real Ukrainian soul in you. I am so happy than we have met and now sharing so many things
together! I hope our friendship will grow throughout the years and we will have more art
exhibitions together, more stories to tell and more great valuable time.
Nashwa, my colleague and my friends, that is amazing that we finally met (not at the
faculty, not at the salsa parties but in the middle of nowhere, in Ter Apel). You was giving me
strength and positive vibe to continue balancing between work, PhD thesis and Dutch. Thank
you so much for this! And thank you becoming my paranimph, we are a very good team! I am
sure the connection we have will stay our whole lives!
____________
To my scientific family
Спасибо моей семье за то, что всегда направляли меня в нужном направлении.
Де, всегда, когда я тебя слушала, все получалось как надо и имело огромный вклад в
будущее.
Ба, ты всегда так переживаешь за меня, и я никогда не хочу тебя расстраивать,
потому всегда очень стараюсь достичь большего.
Мама, спасибо что отпустила меня к моей мечте.
____________

Acknowledgements
197
But the most important, only two people in this world have seen what was happening
“behind the scenes” of my PhD. First person is you, Andrew. I would never heard about
Groningen if not you. You always helped me with study, science and with private problems.
Too bad we were more than friends. But we learnt so much on the way, even moving in the
wrong direction. Thank you for all you did for me and thank you for being next to me when my
life was a mess.
And of course you, Remi. Thank you for appearing in my life in time, when I needed
someone to be on my side, somebody who actually wanted to be with me in good and bad times,
who «shares my dreams, I hope that someday I'll share a home”. You have seen me struggling
with writing this PhD thesis and always supported me. I am so grateful to have you in my life.
Love you.


Curriculum Vitae
199
Curriculum Vitae
Margaryta Ianovska was born on June 21st 1990 in Kiev, Ukraine. After finishing high school
in 2007 she entered the Taras Shevchenko National University of Kiev, where she obtained first
BSc and then MSc degree (both cum laude) in Analytical Chemistry. After the graduation
Margaryta had been working for several months at the pharmaceutical company Darnitsa in
Kiev. In 2013 she was accepted as a PhD student at the University of Groningen and moved
abroad. Mainly she had been working the Department of Pharmacy, having several internships
at DSM and visiting/working in other labs across the Europe. The results of her PhD project are
presented in this thesis. During her second PhD year, Margaryta gave an oral talk at the
international HPLC conference in Geneva, Switzerland. Being a creative person, she designed
a new group logo that is used on all posters and presentation of the Pharmaceutical Analysis
group. Beside of that, Margaryta is interested in art, photography, baking and dancing salsa.
Updated Linkedin page:

List of publications
200
List of publications:
Published:
Ianovska M.A., Mulder P.P.M.F.A., Verpoorte E. Development of small-volume, microfluidic
chaotic mixers for future application in two-dimensional liquid chromatography, RSC Adv., 2017,
7, 9090.
Submitted:
De Haan P., Ianovska M.A., Mathwig K., van Lieshout G., Triantis V., Bouwmeester H., Verpoorte
E. Digestion-on-a-Chip: A Continuous-Flow Modular Microsystem for Enzymatic Digestion for
Gut-on-a-Chip Applications, Lab on a Chip.
In preparation:
Ianovska M.A., Heiskanen A., Wouters B., Ritzen E., Mengerink Y., Schoenmakers P., Emnéus J.,
Verpoorte E. Microfluidic micromixer as a tool to overcome solvent incompetibilities in two-
dimensional liquid chromatography.
Ianovska M.A., Mulder P.P.M.F.A., Verpoorte E. Novel micromixers based on chaotic advection
and their application —a review.
Ianovska M.A., Mulder J.-P.S.H., Verpoorte E. Fabrication of a pressure-resistant microfluidic
mixer in fused silica using Selective Laser-Induced Etching.
For an updated list of scientific publications one can follow this QR code: