university of dundee analysis of plant root-induced
TRANSCRIPT

University of Dundee
Analysis of plant root-induced preferential flow and pore water pressure variation by adual-permeability modelShao, Wei; Ni, Junjun; Leung, Anthony Kwan; Su, Ye; Ng, Charles Wang Wei
Published in:Canadian Geotechnical Journal
DOI:10.1139/cgj-2016-0629
Publication date:2017
Document VersionPeer reviewed version
Link to publication in Discovery Research Portal
Citation for published version (APA):Shao, W., Ni, J., Leung, A. K., Su, Y., & Ng, C. W. W. (2017). Analysis of plant root-induced preferential flow andpore water pressure variation by a dual-permeability model. Canadian Geotechnical Journal, 54(11), 1537-1552.https://doi.org/10.1139/cgj-2016-0629
General rightsCopyright and moral rights for the publications made accessible in Discovery Research Portal are retained by the authors and/or othercopyright owners and it is a condition of accessing publications that users recognise and abide by the legal requirements associated withthese rights.
• Users may download and print one copy of any publication from Discovery Research Portal for the purpose of private study or research. • You may not further distribute the material or use it for any profit-making activity or commercial gain. • You may freely distribute the URL identifying the publication in the public portal.
Take down policyIf you believe that this document breaches copyright please contact us providing details, and we will remove access to the work immediatelyand investigate your claim.
Download date: 07. Apr. 2022

Analysis of plant root-induced preferential flow and pore water
pressure variation by a dual-permeability model
Wei SHAO1, 2, Junjun NI 1*, Anthony Kwan LEUNG3, Ye SU4, Charles Wang Wai NG1
1 Department of Civil and Environmental Engineering, The Hong Kong University of Science and
Technology
2 Water Resources Section, Faculty of Civil Engineering and Geosciences, Delft University of Technology,
2628CN, Delft, Netherlands
3 School of Science and Engineering, University of Dundee, UK
4 Department of Physical Geography and Geoecology, Faculty of Science, Charles University in Prague,
12843, Prague, Czech Republic
* Corresponding author (Email: [email protected])

Abstract
Vegetation can affect slope hydrology and stability via plant transpiration and its induced matric suction.
Previous work suggested that the presence of plant roots would induce preferential flow, and its effects may
be more significant when the planting density is high. However, there is a lack of numerical study on how
planting density affects soil pore water pressure and shear strength during heavy rainfall. This study aims to
investigate the impact of plant root-induced preferential flow on hydro-mechanical processes of vegetated
soils under different planting densities. Two modelling approaches, namely single- and dual-permeability
models, were integrated with an infinite slope stability approach to simulate pore water pressure dynamics
and slope stability. Laboratory tests on soils with two different planting densities for a plant species,
Schefflera heptaphylla, were conducted for numerical simulations. The single-permeability model
overestimated the pore water pressure in shallow soil and underestimated the infiltration depth. The dual-
permeability model, which is able to model the effects of preferential flow, can better capture the
observations of rapid increase of pore water pressure and deeper pressure response in the vegetated soil.
However, caution should be taken on the choice of pore water pressure when using the dual-permeability
model to assess the factor of safety. The dual-permeability model using the pore water pressure in the
preferential flow domain and that in the matrix domain would result in lower and higher factor of safety,
respectively.
Keywords: planting density; suction; preferential flow; dual-permeability model; slope stability

1. Introduction
Vegetation has been recognised as an environmentally friendly restoration technique for slope stabilization.
On one hand, due to the mechanical reinforcement of plant root system, the tensile strength provided by roots
at the potential slip surface of a slope increases soil shear strength, which may be used to stabilize the
landslide-prone areas (Cohen et al. 2009). On the other hand, plant transpiration and root water uptake can
induce soil matric suction (equal to negative pore water pressure in unsaturated soils), resulting in an increase
in soil shear strength (Ng and Menzies 2007) and a decrease in soil hydraulic conductivity (Leung et al. 2016;
Ng and Leung 2012).
Slope restoration is affected by growing and decaying of roots, which would consequently cause changes in
both soil hydraulic and mechanical properties (Lehmann and Or 2012). Due to plant life cycle and
competition among plants, growing and decaying of roots may lead to changes in tensile strength for the root
reinforcement (Cohen et al. 2009). Besides, root occupation and biodegradation has been shown to
significantly affect the soil hydraulic properties such as soil water retention curve and saturated hydraulic
conductivity (Li and Ghodrati 1994; Scholl et al. 2014; Leung et al. 2015a, b; Vergani and Graf 2015; Ng et
al. 2016a). The pattern of infiltration and associated soil moisture and pore water pressure dynamics would
therefore be affected by root physiological processes (Snyder et al. 2003).
Planting density is an important factor influencing the physiological processes of roots in terms of growing
and decaying, and therefore altering the effectiveness of slope restoration. Low planting density leads to low
root biomass production, resulting in a reduction of root reinforcement and root water uptake (Ng et al.
2016b). In contrast, high planting density induces higher transpiration during an intermittent period between
rainfall events, causing a greater increase in matric suction in root zone. In addition, high planting density
may lead to the competition for water, nutrients, and light among neighbouring plants, which could
consequently hamper root biomass production, resulting in root decaying (Azam – Ali et al. 1984; Darawsheh
et al. 2009; Benomar et al. 2012; Ng et al. 2016b).
Recent studies reported by Ng et al. (2016a, b) found that the growth of plants was accompanied with root
biomass production, affecting the root occupancy of soil pore space. As a result, for the case of low planting
density, vegetated soil may have relatively lower soil hydraulic conductivity and higher water retention
ability than bare soil (Scanlan and Hinz 2010; Scholl et al. 2014; Leung et al. 2015b; Ng et al. 2016b). In
contrast, for the case of high planting density, the presence of decayed roots would increase the saturated
hydraulic conductivity and reduce the water retention ability (Ng et al. 2016b).
Decayed root channels can compose a self-organized macropores network, in which the preferential flow
may be triggered under high-intensity rainfall or wet soil moisture condition (Sidle et al.2001; Jarivs 2007;
Ghestem et al. 2011; Nimmo 2012). The rainfall may infiltrate through the interconnected root channels,
resulting in rapid water movement and pore water pressure response in deep soil (Beven and Germann 2013).
Even in an individual macropore, which is not directly connected to surface infiltration or ponded water, the
hydraulic connection can be achieved by pressure propagation and water exchange between macropores and
matrix (Nimmo 2007; Nieber and Sidle 2010). Preferential flow can affect tracer transport in terms of
reducing travel time, increasing infiltration depth, and affecting concentrations in drainage flow (Jarvis 2007;
Beven and Germann 2013). Particularly, under heavy rainfall or snow-melting conditions, the occurrence of
preferential flow in a potentially unstable slope could cause rapid infiltration and percolation (Uchida 2004;
Shao et al. 2015). Consequently, preferential flow induces fast pore water pressure change at the potential
slip surface, and this could play an important role in triggering slope failure (Van Asch et al. 1999; Hencher
2010; Sidle and Bogaard 2016).
The commonly-used numerical models for coupling seepage and slope stability analysis are single-
permeability models, which employ the Darcy-Richards equation or its various simplifications (e.g., the
linear diffusion equation, Boussinesq equations) in an assumed single-continuum soil(Iverson 2000; Talebi et
al. 2008; Lu et al. 2012). A single-permeability model often neglects the effects of preferential flow, so it
could underestimate the amount of infiltration, percolation, and drainage in slopes during heavy rainfall
(Beven and Germann 2013). Existing numerical studies indicate that the single-permeability model is unable
to correctly simulate rapid water and tracer movement in macropore soils (Jarvis 2007; Köhne et al. 2009).
Recent studies also suggested that even though the equivalent parameter sets were used by the single-
permeability model, it is still not possible to simulate fast pressure response and the associated effects on
slope stability (Shao et al. 2015, 2016).
It is a remaining challenge on how to deterministically quantify the impact of preferential flow on slope
hydrology and stability (Uchida 2004; Hencher 2010; Bogaard and Greco 2016). Many preferential flow
models have been developed such as a pore-network model, dual- or multi-continuum conceptualization of
soil porous media (see review by Köhne et al. (2009)). Specifically, the dual-permeability model uses two

coupled Darcy-Richard equations (Gerke and Köhne 2004; Köhne et al. 2009) to quantify the dual-effect of
the matrix and preferential flow on infiltration, pressure propagation, and their effects on slope stability (Shao
et al. 2015, 2016). Application of such dual-permeability model for an ecological system may be necessary to
simulate the hydrological and mechanical responses of soils with widespread decayed roots that potentially
form a macropore network.
This study aims to quantify the impact of planting density on soil hydrology, including the response in
pressure propagation and their effects on soil mechanical responses and slope stability. Numerical modelling
and analyses were conducted to simulate and back-analyse the recent experiments reported by Ng et al.
(2016b). In the experiments, a tree species, Schefflera heptaphylla, with ornamental and ecological value for
slope rehabilitation and reforestation was tested. The species were planted in big drums with different
planting densities. Root area index was measured to quantify the effects of planting density on root growth
and decay. The measured variation of soil pore water pressure during a rainfall event was simulated using
both the single- and dual-permeability models. Subsequently, the role of planting density on slope stability
was analysed.
2. Laboratory test
2.1 Test plan, test setup and instrumentation
Two different planting densities of 36 (test D36), and 320 (test D320) seedlings/m2, corresponding to the
plant spacing of 0.18 m and 0.06 m were investigated (Ng et al. 2016b). Each planting density was tested
with three replicates. There were six drums in total for testing vegetated soils, each of which has a diameter
of 0.6 m and a height of 0.5 m. An additional drum was compacted with bare soil for measuring soil water
retention curve and saturated hydraulic conductivity. Multiple-holes were made in the bottom of each drum
for creating a free drainage boundary. The targeted plant species, Schefflera heptaphylla, is small-sized, and
semi-deciduous. Plant individuals were transplanted to the test drums with a uniform spacing at the targeted
plant densities (Figure 1). All the tree individuals, before transplantation, were grown in a nursery under
identical growth conditions. The growing media was silty sand (according to the Unified Soil Classification
System (USCS; ASTM 2010)), which has the same soil type used in the test drums. These tree individuals
have similar characteristics, including basal diameter of tree stem (6 ± 2 mm), tree height (440 ± 27mm),
maximum lateral root spread (60 ± 15 mm) and root depth (80 ± 16 mm). After transplanting to each test
drum, all tree individuals were allowed to grow for four months, with regular irrigation to maintain the soil

moisture content similar to the field capacity. The choice of growing period of four months was based on
previous studies which reported that the survival rates were above 90% for all species (Kitao et al., 2006)
after three months of transplantation. During the growing period of four months, the tree characteristics (i.e.,
LAI, RAI) all increased significantly (Ng et al. 2016b).
The tested soil was completely decomposed granite (CDG) that can be classified as silty sand according to
the Unified Soil Classification System (USCS; ASTM, 2010). The CDG was compacted at a dry density of
1780 kg/m3 for all the test drums. Two vertical arrays of miniature-tip tensiometers were installed at the
depth of 0.05, 0.10, 0.15, 0.25, and 0.35 m to measure the negative pore water pressure. An array of
tensiometers (denoted by R) was located in the middle of the drum that is beneath a tree individual. Another
array (denoted by M) was installed next to the array R with a distance of half-spacing. The volumetric water
content at depth of 0.05 m and 0.10 m was measured by two soil moisture probes (SM300, Delta-T Device
Ltd).
All test drums were placed in a plant room with well-controlled environmental condition. The air temperature
and relative humidity were maintained at 251C and 605%, respectively. The radiation energy was
provided by the cool white fluorescent lamp with irradiance of 5.0 MJ/m2/day, and the wave band was within
the range of 400-700 nm to promote the plant growth (Ng et al. 2014). Irrigations were applied frequently to
maintain the average soil moisture that was close to the field capacity, which is commonly considered to be
sufficient for root growth (Wang et al. 2007).
2.2 Test procedures
A two-stage test was conducted after a 4-month growing period. The first stage was to saturate the drums
with a constant ponding head until the soil in each drum was fully-saturated. Afterward, the ponding water
was removed and all the drums were exposed to a 4-day drying period under the same atmospheric condition.
The second stage was commenced immediately after the drying test. Artificial rainfall was applied with a
controlled intensity of 73 mm/h and duration of 2 h, corresponding to a 10-year return period in Hong Kong
(Lam and Leung 1995). All the drums were inclined at a small angle of 2 to ensure that any water ponded on
the soil surface during rainfall could turn into infiltration-excess overland flow. The distributions of pore
water pressure in all drums were recorded at a 10-min interval during the second stage infiltration tests.

After the infiltration test was completed, all plants were carefully removed from each drum. The roots were
cleaned to investigate the geometry of root system. For detailed procedures, refer to Ng et al. (2016b). The
rooting depth is defined as the deepest soil depth, beyond which no root can be found. Root area index (RAI)
is defined as the ratio of the total root surface area to the cross-section area of soil for a given depth. The
ImageJ software was used to reconstruct the root system with high-resolution images (i.e., 12 pixels per unit
mm of length). The root surface area of each cross-section was calculated by converting the pixel number
into surface area of roots in mm2.
The measured RAI distribution with soil depth and typical root systems obtained at different planting
densities are shown in Figure 2. All the root systems were in parabolic shape along depth. The root system
from the test D36 was more dispersed. The average rooting depth in test D36 was 0.16 m, which was 30%
longer than that in test D320 (i.e., 0.125 m). However, the largest RAI values of test D320 (i.e., 0.7) was 40%
larger than test D36 (i.e., 0.5). Interestingly, in all the repeated tests, the decayed roots were commonly found
in soil of test D320, while the roots in test D36 were mainly fresh and less decayed roots were observed. For
the high planting density, more decayed roots are expected because of the intense competition among
neighboring plants (Goldberg and Miller, 1990).
3. Mathematical models
The models described herein aim to capture and simulate the transient infiltration processes and pore water
pressure dynamics in a one-dimensional (1D) profile of vegetated soil. For modelling simplicity, the roots in
each tested drum are considered to be homogeneously distributed within the root zone. As it has been shown
by Ng et al. (2016b) that any plant transpiration during the short 2 h rainfall event in the drum tests was
minimal, it is reasonable to ignore the plant transpiration as well as soil evaporation in the calculation (Sidle
et al.1985; Snyder et al.2003). In this study, the effects of roots on infiltration are represented by the
parameterisation of the soil hydraulic parameters, including soil water retention curve and saturated hydraulic
conductivity (Leung et al. 2015a, b; Ng et al. 2014, 2016a, b).
3.1 Single-permeability model
The single-permeability model uses one Darcy-Richards equation to simulate the transient response of pore
water pressure to rain-pulses:

1h h
C Kt z z
(1)
where t (T) is time, C (d/dh) (L-1) is the differential water capacity, h (L) is the pressure head, K (LT-1) is the
unsaturated hydraulic conductivity, and (T-1) is the source or sink term that may be used to calculate root
water uptake (Feddes 1976; Leung et al. 2015a, b) and soil evaporation (if a longer term of soil moisture dry-
down and pressure recession was to be modelled). In this study, the term is set to be zero, considering that
the plant transpiration during the short period of rainfall (2 h) is negligible (Snyder et al. 2003).
The Mualem-van Genuchten model is used to describe the hydraulic properties of vegetated soils (Van
Genuchten 1980):
1 , 0
1 , 0
mn
r
s r
h h
h
(2)
1/ 1/1 , 0( )
, 0
mm m
s r
s
mn hC
S h
(3)
2
0.5 1/( ) 1 1m
m
sK K
(4)
where (-) is the effective saturation, (L3L-3) is the volumetric water content, subscript r and s denote
residual and saturated state, Ss (L-1) is the specific storage in saturated soil, and (L-1), n (-), and m (-) are the
fitting parameters.
The boundary condition of the single-permeability model can be specified as the flux of rainfall intensity or
pressure head for ponding condition. The switch between the two boundary conditions are achieved by
theories and formula referring to van Dam and Feddes (2000).
3.2 Dual-permeability model
The dual-permeability model uses two Darcy-Richards equations to simultaneously simulate the non-
equilibrium phenomenon that is caused by the different pore water flow velocities in preferential flow paths
and in soil matrix (Gerke and van Genuchten 1993):
1f f w
f f
f
h hC K
t z z w
(5)

1m m wm m
m
h hC K
t z z w
(6)
where the subscript f indicates the preferential flow domain, the subscript m indicates the matrix domain, w (-)
is the volume fraction of the preferential flow domain or the matrix domain, and w (T-1) is the water
exchange term (Gerke and van Genuchten 1993):
( ) ( )( )
2
m f m m
w w f m
K h K hh h
(7)
where w (L-2) is the water exchange coefficient.
The soil hydraulic characteristics of both matrix and preferential flow domain are described by the Mualem-
van Genuchten model (Van Genuchten 1980). The total effect adopts the Durner’s formula (Durner 1994).
The volumetric ratio of the preferential flow and matrix flow sums up to one:
1f mw w (8)
The total volumetric water content of the soil is the weighted average of volumetric water contents in two
domains:
f f m mw w (9)
The same holds for the total saturated hydraulic conductivity of the soil:
S f S f m SmK w K w K (10)
The boundary conditions of the Darcy-Richards equation could be specified as pressure head, flux, or mixed.
The specified infiltration flux i (LT-1) on the dual-permeability soil surface can be divided into two
constituting domains (Dusek et al. 2008):
f f m mi w i w i
(11)
where if and im are specified boundary fluxes on the surface of matrix domain and preferential flow domain.
According to a widely-used dual-permeability model developed by Jarvis (1991), preferential flow can be
triggered only when/if the rainfall intensity is larger than the infiltration capacity of the matrix flow domain.
If the rainfall intensity is smaller than the infiltration capacity of the matrix domain, infiltration mainly occurs
in the matrix flow domain. When rainfall intensity applied is much larger than the infiltration capacity of the
matrix flow domain, the boundary condition of the matrix domain would switch from flux boundary to
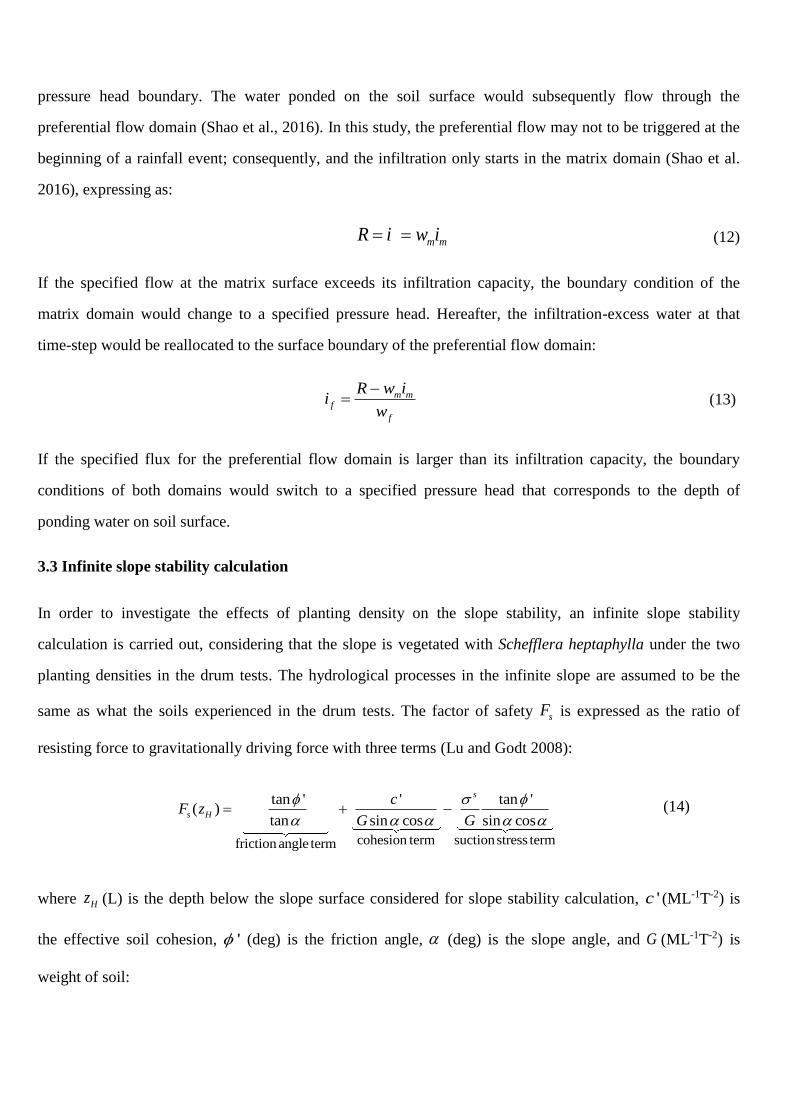
pressure head boundary. The water ponded on the soil surface would subsequently flow through the
preferential flow domain (Shao et al., 2016). In this study, the preferential flow may not to be triggered at the
beginning of a rainfall event; consequently, and the infiltration only starts in the matrix domain (Shao et al.
2016), expressing as:
m mR i w i (12)
If the specified flow at the matrix surface exceeds its infiltration capacity, the boundary condition of the
matrix domain would change to a specified pressure head. Hereafter, the infiltration-excess water at that
time-step would be reallocated to the surface boundary of the preferential flow domain:
m mf
f
R w ii
w
(13)
If the specified flux for the preferential flow domain is larger than its infiltration capacity, the boundary
conditions of both domains would switch to a specified pressure head that corresponds to the depth of
ponding water on soil surface.
3.3 Infinite slope stability calculation
In order to investigate the effects of planting density on the slope stability, an infinite slope stability
calculation is carried out, considering that the slope is vegetated with Schefflera heptaphylla under the two
planting densities in the drum tests. The hydrological processes in the infinite slope are assumed to be the
same as what the soils experienced in the drum tests. The factor of safety sF is expressed as the ratio of
resisting force to gravitationally driving force with three terms (Lu and Godt 2008):
cohesion term suctionstress termfriction angle term
tan ' ' tan '( )
tan sin cos sin cos
s
s H
cF z
G G
(14)
where Hz (L) is the depth below the slope surface considered for slope stability calculation, 'c (ML-1T-2) is
the effective soil cohesion, ' (deg) is the friction angle, (deg) is the slope angle, and G (ML-1T-2) is
weight of soil:

H
H
s wz
G dz (15)
where s and w (ML-2T-2) are the specific weight of dry soil and water.
The suction stress s (ML-1T-2) is given as:
s
w wp h (16)
where wp (ML-1T-2) is the pore water pressure, and (-) is the matrix suction coefficient, which may be
approximated by the effective saturation (Lu et al. 2010).
The hydrological results were sequentially coupled with the soil mechanical calculations in the following
ways. The unit self-weight of soil was related to the soil moisture distribution (Eq. (15)). The suction stress
and shear strength were influenced by pore water pressure and effective saturation. In the dual-permeability
model, the pore water pressure head obtained from either preferential flow domain, or matrix domain, or their
weighting may be used as an “effective pressure” (peff) for the slope stability analysis. Shao et al. (2015, 2016)
selected the pressure of the preferential flow model for stability calculation. This method considered that the
infiltration and pressure build-up in preferential flow paths reached a given depth of slope failure plane,
hence giving a relatively conservative estimation of slope stability. The simulation conducted in the present
study investigated the sensitivity of the choice of peff to the sF calculation, using (i) pressure from the
preferential flow domain (pf); (ii) pressure from the matrix domain (pm); and (iii) the arithmetic mean of the
pressure between the two domains (i.e., 0.5*(pf + pm)). It should be noted that as far as the authors are aware,
there is no theoretical model available to determine the exact weighting of pressure between the two domains
that would affect soil shear strength. The scenario (iii) aims to explore how the combined effects of the two
domains would affect the assessment of slope stability.
4. Model implementation and parameterization
4.1 Numerical models and parameterization strategies
The mathematical models were numerically solved by an author-developed script under Python 2.7
programming environment (Shao et al. 2016). The Darcy-Richards equation of single- and dual- permeability
models was solved by an implicit finite difference method (van Dam and Feddes 2000; Simunek et al. 2005).

The Picard iteration technique was used for each time step. For ensuring numerical accuracy and
computational efficiency during the computation, the tolerable errors of water content were specified with
0.0001, and the time step was adapted in a range of 0.02~5 min.
A uniform computational grid of 0.01 m was used to discretize the soil of 0.45 m depth. Both the single- and
dual- permeability models were used to simulate the infiltration tests. In both models, the initial pressure head
distribution before the infiltration tests was obtained by the interpolation of the measured pore water pressure
head right after the 4-day drying period. Rainfall pulse with the intensity of 73 mm/h was set as the upper
boundary condition, while the boundaries may switch to the pressure head boundary with a ponding depth of
0.1 mm under such high-intensity rainfall.
The soil hydraulic parameters were manually calibrated for two layers. The first layer was from the soil
surface to the rooting depth (i.e., root zone), in which the soil hydraulic properties were affected by the
presence of living and decayed roots. Below the root zone where the soil was less affected by vegetation, the
soil hydraulic parameters may be specified to be the same as the bare soil. For numerical simulations, the
following calibration strategies were sequentially used to parameterize the models: (1) the soil water retention
curves were estimated according to the measurements of soil moisture and pore water pressure; (2) the
saturated hydraulic conductivities were estimated according to the measured infiltration rate; and (3) for the
dual-permeability model, the water exchange coefficients were estimated according to the measured pore
water pressure response. The hydraulic parameters for soils in different experiment cases are listed in Table 1.
4.2 Water retention curve
The soil water retention curves (SWRCs) for single- and dual- permeability model were determined
according to water content and pore water pressure as shown in Figure 3. The data points of water content
and pressure head can be classified into two categories - drying series and wetting series, depending on
whether the data was from the first-stage drying period or the second-stage infiltration period. In the bare soil,
the difference between drying and wetting curves is indiscernible. On the contrary, more significant hydraulic
hysteresis was found in the vegetated soils (regardless of the planting density). For pore water pressure
ranged from 0 to -10 kPa, the changes of water content during the wetting process is generally smaller than
that during the drying process, probably because of the presence of macropores.

For the single-permeability model, bare soil and vegetated soils (test D320 and D36) have the same values of
r (0.1) and s (0.3). Both parameters, and n , controlling the shape of SWRC, were fitted by the
nonlinear least-squares algorithms using the sqcurvefit function in Matlab. The fitted SWRC for bare soil and
vegetated soils from single-permeability model are shown in Figures 3 a, b, d, respectively, with all the fitting
parameters shown in Table 1. Both the n and for the case of high planting density (D320) are relatively
larger, which tend to behave like a coarser soil.
The composite SWRC determined by the dual-permeability function is shown in Figures 3 c, e. The
composite SWRC has two groups of parameters to describe the different hydraulic characteristics of the
matrix and preferential flow domains. The parameters ( and w) for the volumetric ratio ( ( )s rw ) of the
matrix and preferential flow domains were predefined, according to the measured root volume. The s for the
preferential flow domain was thus set to be 0.39 considering the occupancy of decayed roots in soil pore
space (Ng et al. 2016b), while the s for the matrix domain is calculated according to Eq. 9. The volumetric
ratio of the preferential flow domain fw commonly ranges from 0.025 to 0.2. Note that different choices of
fw may result in equifinal parameter sets of SWRCs. This means that different parameter sets of the dual-
permeability model could result in the same composite SWRC of the total domain for the dual-permeability
model (Köhne et al. 2002). In this study, predefined values of fw were set to be 0.1 and 0.2 for the low and
high planting density soils, respectively. This means that the volumetric ratio of soil pores, ( )f sf rfw
belonging to the preferential flow domains for the low and high planting density soil is about 3% and 6%,
respectively. A relatively higher value of fw was specified for the high planting density soil for taking into
account the effects of decayed roots (Figure 2). The validity of the use of a higher volumetric ratio fw is
discussed in the infiltration analysis later (Section 5.1).
For the dual-permeability model, the parameters, and n, of the two domains are optimized by fitting
measured data of soil water content and pore water pressure using the nonlinear least-square curve fitting
algorithm (lsqcurvefit function in Matlab). These optimized values may thus represent the equifinal
parameters to describe the SWRC for the dual-permeability model as shown in Figs 3c and e. The parameter
n in the preferential flow domain was calibrated to be 1.5 for both D36 and D320 soils according to the

shapes of SWRC. On the other hand, is related to the air entry pressure, and the specified value for D36
and D320 is 6 and 10 m-1, respectively. For the deeper soil layer beyond the root zone, the soil hydraulic
properties may not be affected by root growth and decaying, and the parameters of and n of both the
matrix and preferential flow domains thus followed the same parameters of bare soil.
4.3 Saturated hydraulic conductivity and water exchange coefficient
The values of sK were calibrated based on the results obtained from the infiltration test. The calibrated s
K of
the bare soil is found to be 0.075 m/day when using the single-permeability model. For the vegetated soils,
the calibrated sK for the high planting density soil (D320; 0.175 m/day) is higher than that for the low
planting density soil (D36; 0.06 m/day). This is consistent with the experimental observation in Figure 2 that
the high planting density soil contained more decayed roots. The decayed roots can affect the soil hydraulic
behavior via the changes in the shape of SWRC (Figure 3) and also lead to an increase in sK (Table 1).
When using the dual-permeability model, the saturated hydraulic conductivity of the preferential flow domain
Ksf was set to be 4.5 m/day, which is 300 and 60 times larger than smK for the case of low and high planting
density, respectively. For the soil within the root zone, the values of smK (0.018 m/day in D36, and 0.075
m/day in D320 soils) are in the same magnitude as those for the bare soil (0.075 m/day). The smK for the low
planting density soil (0.018 m/day in D36) is lower than the sK (0.075 m/day) of the bare soil, and this may
be related to the occupations of the live roots (Ng et al. 2016a).
In the dual-permeability model, the hydraulic interaction between the matrix and preferential flow domains is
governed by the water exchange term w in Eq. (7). The water exchange rate between these two domains
depends on the parameterization of w . For a larger w , an equilibrium of pore water pressure between the
matrix and preferential flow domains required would reach more quickly. In this study, moderate values of
w of 25 and 15 m-2 are used for the low and high planting density soils, respectively. The use of a lower w
for the high planting density soil may be related to the coating effects in biopores (Leue et al. 2010). The
hydraulic interaction between root channel and soil matrix may be hampered by the non-wetting effects of

soil organic matters (Jarvis 2007). Detailed calibration procedures of w for a given set of infiltration data
through different parameterisation strategies are provided in Shao et al. (2015, 2016).
5 Results and Discussion
5.1 Infiltration rate and cumulative infiltration
The Infiltration rate and cumulative infiltration during the 2 h rainfall event are shown in Figure 4. The
measurement shows that infiltration rate and amount in D320 are higher than those in D36. According to the
study reported by Ng et al. (2016b), this is mainly attributed to two reasons. For the case of high planting
density (D320), the intense competition between neighboring plants results in decayed roots (see Figure 2),
hence creating preferential channels that facilitate infiltration. On the other hand, the live root biomass in the
case of low planting density (D36) might have occupied the soil pore space, reducing the available pore size
and infiltration capacity (Ng et al. 2016a).
Both the single- and dual- permeability models can simulate the same cumulative infiltration at the end of the
rainfall event in both the cases (Figure 4), which is achieved by calibrating the saturated hydraulic
conductivities. As expected, the infiltration rate decreases from a high value (close to the rainfall intensity) to
a lower value (close to the saturated hydraulic conductivity) during the 2 h rainfall period, due to the
decreased pressure gradient at the soil surface during the infiltration. Correspondingly, the cumulative
infiltration is generally approaching to a nearly constant increasing rate.
The single- and dual- permeability models could simulate infiltration rate well for the case of low planting
density (D36). On the contrary, much greater differences between two models can be found when simulating
infiltration rate and cumulative infiltration for the case of high planting density (D320). Infiltration rate and
cumulative infiltration in high planting density soil is much higher than that in low planting density soil, and
this can be modelled using a high value of fw to describe a higher soil moisture storage in preferential flow
domain. At 3000 s, for instance, the difference between the measured and simulated infiltration amount by
the dual-permeability model is less than 15%, but such difference is more than 50% using the single-
permeability model (Figure 4b). The dual-permeability model captures the infiltration behavior better for
both low and high planting density soils, while the occurrence of preferential water flow may more
significantly affect the infiltration rate and cumulative infiltration for the case of high planting density.

5.2 Pore water pressure profile after rainfall
Figure 5 compares the measured and simulated pore water pressure before and after 1 and 2 h of rainfall,
respectively. Assuming that the tensiometers installed in the soil matrix in the drum tests were to capture pore
water responses in the matrix domain, the pore water pressure in the matrix domain m
p ( w mh ) simulated
by the dual-permeability model is used for comparison. The initial profile of pore water pressure before
rainfall is the result of the 4-day drying (i.e., end of the first stage of the drum tests). Compared with the low
planting density soil (D36), the pore water pressure in high planting density soil (D320) is significantly lower
both within and below the root zone. This is attributed to the greater transpiration and plant root water uptake
at high planting density, causing a significant reduction of soil moisture and pore water pressure.
After 1h or 2h rainfall, the increased pore water pressure in shallower depth is much more significantly than
that in deeper depth, regardless of the planting density considered. After the rainfall, the maximum depth of
pressure response in D320 can be up to the depth of 0.35 m, whereas that in D36 is shallower than 0.25 m
depth. The observed pore water pressure responses are consistent with the responses of infiltration rates
(Figure 4). Higher infiltration rate in D320 leads to a greater increase in pore water pressure, more
cumulative infiltration, higher infiltration rate, and hence deeper infiltration depth.
Simulated results from the single-permeability model show that, after 1 or 2 h rainfall, there are clear wetting
fronts within which the pore water pressure increases significantly. The pore water pressure below remains
unchanged. However, the single-permeability model overestimates the pore water pressure within the wetting
front, and underestimates the infiltration depth for both cases of D36 and D320. The considerable changes of
pore water pressure in deeper depth during the rainfall tests cannot be simulated by the single-permeability
model. On the contrary, the dual-permeability model appears to give a better match with the measurements of
the pore water pressure profiles for the entire depth after 1 and 2 h of rainfall, despite of a slight
overestimation of the pressure at 0.15 m in D320. The deeper pore water pressure response observed in the
experiments can be captured by the dual-permeability model, especially for the high planting density soil
where preferential flow may be more significant.
5.3 Hydrological processes simulated by single-permeability model
The simulated vertical profiles of soil water content and pore water pressure during the 2 h infiltration period
by the single-permeability model is shown in Figure 6. The simulation results show that by using the single-

permeability model, a clear piston-shape wetting front advancement can be identified from soil moisture and
pore water pressure profiles in both the low and high-planting density soils.
In low planting density soil (D36), the wetting fronts advance progressively downwards with time. After 25
min of rainfall infiltration, the wetting front reaches the depth of 0.05 m, and soil at the top 0.02 m becomes
fully saturated. When rainfall continues from 25 to 120 min, the wetting front advances nearly at a constant
velocity. The maximum depth of water infiltration after the rainfall is 0.11 m, and only the soil of the top 0.08
m is fully saturated. There is no build-up of positive pore water pressure head, because the wetting front does
not reach the second soil layer (below the root zone) where the hydraulic conductivity is lower.
For the high planting density soil (D320), even though the values of initial soil water content and pressure are
lower than those in the low planting density soil, the variation of wetting front with time is similar. The only
difference is the velocity of the wetting front advancement. In high planting density soil (D320), due to the
higher infiltration rate (Figure 4), the rate of wetting front advancement is relatively faster, extending the
saturated zone to a deeper depth of 0.14 m (compared to the depth of 0.09 m found in D36 soils). However,
the pressure build-up is still insignificant.
5.4 Hydrological processes simulated by dual-permeability model
Figure 7 shows the simulated water content and pressure in the matrix and preferential flow domains, and the
water exchanges between the two domains for the low planting density soil (D36). Before rainfall, there is no
water exchange between domains (Figure 7f), because the initial pressure distributions in the matrix and
preferential flow domains are the same. After 2 min rainfall, most of the rainwater infiltrates into the
preferential flow domain, as the rainfall intensity surpasses the infiltration capacity of the matrix domain.
Consequently, the wetting front in the preferential flow domain propagates with a relatively high velocity, as
revealed by the rapid increase of water content and pore water pressure in the deep soil (Figures 7a, d). This
implies that the preferential flow dominants the rainwater transport in soil. This phenomenon becomes more
significant after 5-min rainfall, indicating by the highest water exchange at the depth of 0.05 m in Figure 7f.
Pressure build-up in the preferential flow domain starts when the wetting front propagates beyond the rooting
depth (at 0.16 m depth in D36). Below the root zone, the soil is less permeable. After raining for 30 min, the
advancement of the wetting front is relatively slower, and the simulated pore water pressure in the

preferential flow domain f
p shows a steady distribution (close to a hydrostatic distribution) within the root
zone. At the end of the rainfall, the final infiltration depth of rainwater reaches 0.3 m.
Figure 8 shows the simulated distributions of soil water content and pore water pressure by using the dual-
permeability model for the high planting density soil (D320). The initial soil water content and pore water
pressure in this case are significantly lower than that in the case of low planting density (D36), because of
higher transpiration rate. At the beginning of infiltration (t = 2 min), a significant fraction of rainwater
infiltrates to the matrix domain (Figures 8 a, b), while the water exchange rates along the soil profile are
nearly zero. After 2 min of rainfall when infiltration capacity of the matrix domain has reached, rainwater
starts to infiltrate into the preferential flow domain. Afterwards, the preferential flow dominates the pressure
propagation. The difference in pore water pressure between the two domains results in the water exchange
from the preferential flow domain to the matrix domain.
The final infiltration depth after 2 h rainfall for the case of high planting density (D320) is 0.35 m, which is
deeper than that in D36 (0.3 m). This is because the cumulative infiltration is higher in the high planting
density soil (Figure 4). The infiltrated rainwater may transport through the preferential flow path and more
predominantly affect the deeper soil pressure response than the case in low planting density.
Overall, the dual-permeability model can capture the pressure response not only within, but also below the
root zone. Under the applied heavy rainfall (73 mm/h), the wetting front of the preferential flow is deeper
than that of the matrix flow, causing a fast and significant pressure build-up for almost the entire soil profile
that cannot be captured by the single-permeability model. Interestingly, the soil in the matrix domain between
the depths of 0.1 to 0.3 m remains largely unsaturated – a hydrological process often called bypass flow.
Although there are substantial increases of water content and pore water pressure in deeper soil depths, the
non-equilibrium between the matrix and the preferential flow domains are revealed to be different in low and
high planting density soils. The simulations using the dual-permeability model show that the preferential flow
could lead to more significant responses of water content, and the increase of pore water pressure in the high
planting density soil is larger than those in the low planting density soil.
5.5 Preferential flow effects on slope stability
The stability of infinite vegetated slopes with a gradient of 28 is analysed. The mechanical properties of the
CDG soils used in the drum tests were reported by Liu et al. (2015). The effective cohesion of the CDG is 0

kPa, while the effective friction angle is 37.4o. The effective cohesion contributed by mechanical root
reinforcement was set to a relatively low value of 2 kPa and is assumed to be constant and distributed
uniformly within the root zone. The values of factor of safety ( sF ) of the vegetated slopes with two planting
densities (i.e., D36 and D320) were calculated by combining the infinite slope stability modelling approach
(Eq. 14 – 16) with the single- or dual- permeability models.
The calculated profiles of sF before and after 2h rainfall are shown in Figure 9. When using the single-
permeability model, the simulated pore water pressure (Figures 6b, d) can be used as an input to Eq. 14 for
calculating its corresponding sF . For the calculation of sF using the dual-permeability model (with peff = pf),
the simulated pore water pressure in the preferential flow domain (Figures 7d, 8d) was substituted into Eq. 14
– 16. The pressure build-up and the wetting front advancement by the preferential flow were much more
significant than in the matrix flow domain. Therefore, using fp to calculate sF could provide a more
conservative assessment of the slope stability.
Before rainfall, the sF calculated by the two models are identical to each other. The sF in the high planting
density slope (D320) is much higher than that of the low planting density slope (D36) because of the
reduction of pore water pressure by evapotranspiration. After 2 h of rainfall, the sF calculated by the single-
permeability model is larger than 1.0 along the entire soil profile, regardless of the planting density
considered. This means that no slope failure exists in both cases. It can be seen that the decrease of sF
happened mainly within the wetting front, where the pore water pressure increases significantly (refer to
Figure 6). The volume of soil being affected is found to be greater in the slope with high planting density
because of the increased infiltration rate (refer to Figure 4). In contrast, sF below the wetting front remains
unchanged. As has been revealed from the comparison shown in Figure 5, the use of the single-permeability
model may underestimate the pore water pressure in deep soil compared with the measurement, due to its
inability to capture preferential flow that might have taken place in the vegetated soils. This highlights the
importance of having the preferential flow to be captured when assessing pore water pressure distributions in
vegetated soil, in order to prevent overestimation, hence less conservative, on slope stability calculation.

With the assumption of peff = pf, the calculated sF by the dual-permeability model is lower than that
calculated by the single-permeability model. The relatively high sF in very shallow depth is contributed by
the mechanical root reinforcement, despite of the low effective cohesion provided by roots of 2 kPa. Near and
slightly below the interface between rooted and bare soil, the dual-permeability model predicts sF to be
lower than 1.0, indicating a potential slope failure. This is attributed to the relatively rapid pore water
pressure build-up due to the presence of preferential flow. Such preferential flow appears to exist in both the
low and high planting density soils, but it is comparatively more significant for the latter case due to the
much higher cumulative infiltration and infiltration rate (Figure 2 and 4). The more decayed roots in the high
planting density soil would result in more infiltration and larger value of pressure build-up, which adversely
affects the slope stability. However, it should be noted that setting peff to be pf represents a worst-case
scenario that may lead to a rather conservative calculation of factor of safety.
5.6 Discussion about the choice of effective pressure for slope stability calculation
In a heterogeneous soil where preferential flow could happen, it remains unknown about the relative
contribution of pore water pressure between the matrix domain and preferential flow domains to the soil
shear strength. Most of the existing hydro-mechanical models use single-permeability model to calculate pore
water pressure in soil matrix for slope stability analysis. When coupling a dual-permeability model (which
adopts a dual-continuum approach) with a slope stability model, using the pore water pressure of pf or pm may
lead to different results in slope stability calculations. Instead of using pf as peff to calculate sF (as have been
shown in Figure 9), it may be necessary to investigate how different choices of peff would affect sF .
Comparison of sF calculated by using different peff (i.e., pf, pm, or their arithmetic mean (0.5*(pf + pm)) is
given in Figure 10. As expected, regardless of the planting density, the calculated profile of sF using pm is
much higher than that calculated one using pf, because the pore water pressure in the matrix domain is
significant higher than that in the preferential domain (see Figures 8d, e and 9d, e). This suggests that it is
less conservative for the stability calculation of vegetated soil to use pm to completely ignore the effects of
preferential flow.

In an attempt to examine the combined effects of pf and pm on peff and slope stability, the calculated sF using
the arithmetic mean (i.e., 0.5*(pf + pm)) is obtained for both the low and high planting density soils in Figure
10. As expected, the calculated sF in both cases falls between the values obtained by either pf or pm, though
the sF tends to be closer to the latter case. Note that the above calculation has made an assumption on the
equal weighting on the contribution of pf and pm to shear strength. As far as the authors are aware, the exact
weighting is not known and it is believed to be dependent on the geometry, location, and distribution of the
preferential flow channels and potential failure surface. More detailed investigation to correlate preferential
flow with soil shear strength is needed in the future.
The practical application of the dual-permeability model relies on the careful calibration of the hydraulic
properties of the two domains. These properties may be identified through in-situ testing such as tracer
experiments (Krzeminska et al., 2014). This kind of testing allows simultaneous measurements of specific
discharge, soil moisture, pore water pressure, and tracer concentration, which can be used to infer water flow
paths and residence times for calibrating the dual-permeability model.
6. Summary and concluding remarks
Effects of plant-induced preferential flow on soil hydrology and slope stability were explored through
experimental and numerical modelling approaches in this study. Rainfall infiltration tests were conducted in
compacted silty sand vegetated plots with a selected tree species, Schefflera heptaphylla, with two different
planting densities (i.e., high planting density 320 seedlings/m2 and low planting density 36 seedlings/m2). In
order to capture the effects of root decaying on preferential flow, two numerical models were implemented to
simulate the infiltration tests: one is the single-permeability model (which uses one Darcy-Richards equation
to consider matrix flow-only), and another is the dual-permeability model (which couples two modified
Darcy-Richards equations to simulate both matrix and preferential flow). The calibrated hydrological models
were further used to evaluate the effects of plant-induced preferential flow on the stability of infinite
vegetated slopes.
The root-induced changes in SWRC were able to be captured by both the single- and dual- permeability
models. The dual-permeability model, in which preferential flow could be modelled by the dual-continuum

approach, showed a closer match with the measurements than the single-permeability model. The single-
permeability model however significantly underestimated the infiltration rate at the beginning of rainfall (0-
20min) and then overestimated during the last period (80-120 min).
Considering both preferential flow and matrix flow domains when using the dual-permeability model showed
that preferential water flow was likely to take place in both low and high planting density. The preferential
flow effects appeared to be more significant in the high planting density soil because of the greater increase
in pore water pressure and deeper depth of infiltration. These hydrological processes were, however, not
possible to be captured by the single-permeability model due to its inability to simulate the preferential flow
effect using the matrix flow domain alone. Instead, the single-permeability model simulated the piston-shape
of wetting front advancement during rainfall, which resulted in significant under-prediction of infiltration
depth and overestimation of the pore water pressure within the root zone.
Because of the inability of the single-permeability model, a less conservative calculation of slope stability is
resulted. Regardless of the planting density considered, the single-permeability model estimated significantly
higher factor of safety than the dual-permeability model, especially on the deeper soil depths below the root
zone. In contrast, when the dual-permeability model was used, a lower factor of safety resulted. While the
shallow stability of the vegetated slopes (up to 0.1 m depth within the root zone) is mainly provided by the
mechanical root reinforcement, the factor of safety below the root zone is marginally closer to 1. Although
the dual-permeability model is better to capture the variations of pore water pressure in vegetated soils,
caution should be taken on the choice of effective pressure when using this model to assess the factor of
safety. Simulation using the pore water pressure in the preferential flow domain and the matrix domain in the
model would result in over- and under-conservative assessment of the stability of vegetated slopes,
respectively.
Acknowledgements
Research grants HKUST6/CRF/12R provided by the Research Grants Council of the Government of the
Hong Kong SAR is acknowledged. The first author is financially supported by the scholarship (No.
2011671055) provided by the China Scholarship Council. The third author would also like to acknowledge

the EU Marie Curie Career Integration Grant under the project ‘BioEPIC slope’ and research travel support
from the Northern Research Partnership (NRP).
References
ASTM 2010. Standard practice for classification of soils for engineering purposes (Unified Soil
Classification System). West Conshohocken, PA, USA: American Society for Testing and Materials.
Azam-Ali, S. N., Gregory, P. J., and Monteith, J. L. 1984. Effects of planting density on water use and
productivity of pearl millet (Pennisetum typhoides) grown on stored water: growth of roots and shoots.
Experimental Agricultural, 20(3): 203–214.
Benomar, L., DesRochers, A., and Larocque, G. 2012. The effects of spacing on growth, morphology and
biomass production and allocation in two hybrid poplar clones growing in the boreal region of Canada. Trees
– Structure and Function, 26(3): 939–949.
Beven, K., and Germann, P. 2013. Macropores and water flow in soils revisited. Water Resources Research,
49(6): 3071–3092.
Bogaard, T. A., and Greco, R. 2016. Landslide hydrology: from hydrology to pore pressure. Wiley
Interdisciplinary Reviews: Water 3(3): 439-459.
Cohen, D., Lehmann, P., and Or, D. 2009. Fiber bundle model for multiscale modeling of hydromechanical
triggering of shallow landslides. Water Resources Research, 45(10): W10436.
Darawsheh, M. K., Khah, E. M., Aivalakis, G., Chachalis, D., and Sallaku, F. 2009. Cotton row spacing and
plant density cropping systems I. Effects on accumulation and partitioning of dry mass and LAI. Journal of
Food Agricultural and Environment, 7(3–4): 258–261.
Durner, W. 1994. Hydraulic conductivity estimation for soils with heterogeneous pore structure. Water
Resources Research, 30(2): 211-223.
Dusek, J., Gerke, H. H., and Vogel, T. 2008. Surface Boundary Conditions in Two-Dimensional Dual-
Permeability Modeling of Tile Drain Bromide Leaching. Vadose Zone Journal, 7(4): 1287–1301.

Feddes, R. A., Kowalik, P., Kolinska-Malinka, K., and Zaradny, H. 1976. Simulation of field water uptake by
plants using a soil water dependent root extraction function. Journal of Hydrology, 31(1): 13 – 26.
Gerke, H. H., and Köhne, J. M. 2004. Dual-permeability modeling of preferential bromide leaching from a
tile-drained glacial till agricultural field. Journal of Hydrology, 289(1): 239–257.
Gerke, H. H., and van Genuchten, M. 1993. Evaluation of a first-order water transfer term for variably
saturated dual-porosity flow models. Water Resources Research, 29(4): 1225–1238.
Ghestem, M., Sidle, R. C., and Stokes, A. 2011. The influence of plant root systems on subsurface flow:
implications for slope stability. Bioscience, 61(11): 869–879.
Goldberg, D. E., and Miller, T. E. 1990. Effects of different resource additions on species diversity in an
annual plant community. Ecology, 71(1): 213–225.
Hencher, S. R. 2010. Preferential flow paths through soil and rock and their association with landslides.
Hydrological Processes, 24(12): 1610–1630.
Iverson, R. M. 2000. Landslide triggering by rain infiltration. Water Resources Research, 36(7): 1897–1910.
Jarvis, N. J. 2007. A review of non-equilibrium water flow and solute transport in soil macropores: principles,
controlling factors and consequences for water quality. European Journal of Soil Science, 58(3): 523–546.
Jarvis, N. J., Jansson, P.-E., Dik, P. E., and Messing, I. 1991. Modelling water and solute transport in
macroporous soil. I. Model description and sensitivity analysis. Journal of Soil Science, 42: 59–70.
doi:10.1111/j.1365-2389.1991.tb00091.x
Kitao, M., Yoneda, R., Tobita, H., Matsumoto, Y., Maruyama, Y., Arifin, A., Mohamad Azani, A., and
Muhamad, M. N. 2006. Susceptibility to photoinhibition in seedlings of six tropical fruit tree species native to
Malaysia following transplantation to a degraded land. Tree, 20: 601-610.
Köhne, J. M., Köhne, S., and Gerke, H. H. 2002. Estimating the hydraulic functions of dual-permeability
models from bulk soil data, Water Resources Research, 38(7): doi:10.1029/ 2001WR000492, 2002.
Köhne, J. M., Köhne, S., and Šimůnek, J. 2009. A review of model applications for structured soils: a) Water
flow and tracer transport. Journal of Contaminant Hydrology, 104(1–4): 4–35.

Krzeminska, D. 2012. The influence of fissures on landslide hydrology, TU Delft, Delft University of
Technology.
Krzeminska, D. M., Bogaard, T. A., Debieche, T.H., Cervi, F., Marc, V., and Malet, J. P. 2014. Field
investigation of preferential fissure flow paths with hydrochemical analysis of small-scale sprinkling
experiments, Earth Surface Dynamics, 2(1): 2: 181–195.
Leue, M., Ellerbrock, R. H., and Gerke, H. H. 2010. DRIFT Mapping of Organic Matter Composition at
Intact Soil Aggregate Surfaces. Vadose Zone Journal, 9(2): 317–324.
Lehmann, P., and Or, D. 2012. Hydromechanical triggering of landslides: From progressive local failures to
mass release. Water Resources Research, 48(3): W03535
Leung, A. K., Coo, J. L., Ng, C. W. W., and Chen, R. 2016. New transient method for determining soil
hydraulic conductivity function. Canadian Geotechnical Journal, 53(8): 1332 – 1345
Leung, A. K., Garg, A., and Ng, C. W. W. 2015a. Effects of plant roots on soil-water retention and induced
suction in vegetated soil. Engineering Geology, 193: 183–197.
Leung, A. K., Garg, A., Coo, J. L., Ng, C. W. W., and Hau, B. C. H. 2015b. Effects of the roots of Cynodon
dactylon and Schefflera heptaphylla on water infiltration rate and soil hydraulic conductivity. Hydrological
Processes, 29(15): 3342 – 3354.
Li, Y., and Ghodrati, M. 1994. Preferential transport of nitrate through soil columns containing root channels.
Soil Science Society of American Journal, 58: 653–659.
Liu, H. W., Feng, S., and Ng, C. W. W. 2016. Analytical analysis of hydraulic effect of vegetation on shallow
slope stability with different root architectures. Computers and Geotechnics, 80: 115–120.
Lu, N., and Godt, J. 2008. Infinite slope stability under steady unsaturated seepage conditions. Water
Resources Research, 44(11): W11404.
Lu, N., Godt, J. W., and Wu, D. T. 2010. A closed-form equation for effective stress in unsaturated soil.
Water Resources Research, 46(5): W05515.
Lu, N., Şener-Kaya, B., Wayllace, A., and Godt, J. W. 2012. Analysis of rainfall-induced slope instability
using a field of local factor of safety. Water Resources Research, 48(9): W09524.

Ng, C. W. W., and Menzies, B. 2007. Advanced unsaturated soil mechanics and engineering. London, UK:
Taylor & Francis.
Ng C. W. W., and Leung A. K. 2012. Measurements of drying and wetting permeability functions using a
new stress-controllable soil column. Journal of Geotechnical and Geoenvironmental Engineering, 138(1): 58–
68.
Ng, C. W. W., Leung, A. K., and Woon, K. X. 2014. Effects of soil density on grass-induced suction
distributions in compacted soil subjected to rainfall. Canadian Geotechnical Journal, 51(3): 311–321.
Ng, C. W. W., Ni, J. J., Leung, A. K., and Wang, Z. J. 2016a. A new and simple water retention model for
root-permeated soils. Géotechnique letters, 6(1): 106 – 111.
Ng, C. W. W., Ni, J. J., Leung, A. K., Zhou, C., and Wang, Z. J. 2016b. Effects of planting density on tree
growth and induced soil suction. Géotechnique, 66(9): 711–724.
Nieber, J. L., and Sidle, R.C. 2010. How do disconnected macropores in sloping soils facilitate preferential
flow? Hydrological Processes, 24(12):1582–1594.
Nimmo, J. R. 2007. Simple predictions of maximum transport rate in unsaturated soil and rock. Water
Resources Research, 43(5): W05426.
Nimmo, J. R. 2012. Preferential flow occurs in unsaturated conditions. Hydrological Processes, 26(5): 786-
789.
Scanlan, C. A., and Hinz, C. 2010. Insight into the processes and effects of root induced changes to soil
hydraulic properties. Proceedings of the 19th world congress of soil science, soil solutions for a changing
world, Brisbane, Australia, vol. 2, pp. 41–44.
Scholl, P., Leitner, D., Kammerer, G., Lioskandl, W., Kaul, H. P., and Bodner, G. 2014. Root induced
changes of effective 1D hydraulic properties in a soil column. Plant and Soil, 381(1–2), 193–213.
Shao, W., Bogaard, T., and Bakker, M. 2014. How to Use COMSOL Multiphysics for Coupled Dual-
permeability Hydrological and Slope Stability Modeling. Procedia Earth and Planetary Science, 9: 83-90.
Shao, W., Bogaard, T., Bakker, M., and Berti, M. 2016. The influence of preferential flow on pressure
propagation and landslide triggering of the Rocca Pitigliana landslide. Journal of Hydrology, 543B: 360-372.

Shao, W., Bogaard, T. A., Bakker, M., and Greco, R. 2015. Quantification of the influence of preferential
flow on slope stability using a numerical modelling approach. Hydrology and earth system Sciences, 19(5):
2197– 2212.
Sidle, R. C., and Bogaard, T. A. 2016. Dynamic earth system and ecological controls of rainfall-initiated
landslides. Earth-Science Reviews, 159: 275– 291.
Sidle, R. C., Noguchi, S., Tsuboyama, Y., and Laursen, K. 2001. A conceptual model of preferential flow
systems in forested hillslopes: evidence of self-organization. Hydrological Processes, 15(10): 1675– 1692.
Sidle, R. C., Ochiai, H., Sidle, R.C., and Ochiai, H. 2013. Landslides: Processes, Prediction, and Land Use,
pp. 41-119, American Geophysical Union.
Simunek, J., Van Genuchten, M. T., and Sejna, M. 2005.The HYDRUS-1D software package for simulating
the one-dimensional movement of water, heat, and multiple solutes in variably– saturated media, pp. 1– 240.
Snyder, K. A., Richards, J. H., and Donovan, L. A. 2003. Night-time conductance in C3 and C4 specises: do
plants lose water at night? Journal of Experimental Botany, 54(383): 861 – 865.
Talebi, A., Uijlenhoet, R., and Troch, P. A. 2008. A low-dimensional physically based model of hydrologic
control of shallow landsliding on complex hillslopes. Earth Surface Processes and Landforms, 33(13): 1964 –
1976.
Uchida, T. 2004. Clarifying the role of pipe flow on shallow landslide initiation. Hydrological
Processes,18(2): 375– 378.
Van Asch, T. W. J., Buma, J., and Van Beek, L. P. H. 1999. A view on some hydrological triggering systems
in landslides. Geomorphology, 30(1–2), 25– 32.
van Dam, J. C., and Feddes, R. A. 2000. Numerical simulation of infiltration, evaporation and shallow
groundwater levels with the Richards equation. Journal of Hydrology, 233(1–4): 72– 85.
Van Genuchten, M. T. 1980. A closed-form equation for predicting the hydraulic conductivity of unsaturated
soils. Soil science society of America journal, 44(5): 892– 898.
Vergani, C., and Graf, F. 2015. Soil permeability, aggregate stability and root growth : a pot experiment from
a soil bioengineering perspective. Ecohydrology, doi: 10.1002/eco.1686.

Wang, D., Kang, Y., and Wan, S. 2007. Effect of soil matric potential on tomato yield and water use under
drip irrigation condition. Agricaltural Water Management, 87(2): 180–186.

Table 1. Soil hydraulic parameters for the single-permeability model (Single), and the dual-permeability model (Dual)
for the matrix and preferential flow (PF) domains
Model Soil
Depth
(m)
Domain
w r s Ks n l aw
(-) (-) (-) (m/day) (m-1) (-) (-) (m-2)
Bare 0-0.45 Total domain - 0.1 0.3 0.075 5 1.25 0.5 -
Single D36 0-0.16 Total domain - 0.1 0.3 0.060 4 1.26 0.5 -
D320 0-0.13 Total domain - 0.1 0.3 0.175 6 1.37 0.5 -
0-0.16
Matrix domain 0.9 0.1 0.29 0.018 5 1.25 0.5
25
D36 PF domain 0.1 0.1 0.39 4.5 6 1.50 0.5
0.16-0.45
Matrix domain 0.9 0.1 0.29 0.018 5 1.25 0.5
25
Dual
PF domain 0.1 0.1 0.39 0.018 5 1.25 0.5
0-0.13
Matrix domain 0.8 0.1 0.27 0.075 5 1.30 0.5
15
D320 PF domain 0.2 0.1 0.39 4.5 10 1.50 0.5
0.13-0.45
Matrix domain 0.8 0.1 0.27 0.075 5 1.25 0.5
15
PF domain 0.2 0.1 0.39 0.115 5 1.25 0.5
Note: for the single-permeability model, the hydraulic parameters for the soil below the root zone are specified to be
the same as those for the bare soil.

Figure 1. Schematic diagrams of a test drum and instrumentation (Ng et al., 2016b)

a. Low planting density D36
b. High planting density D320
c. Measured RAI
Figure 2. (a) Images of the root system for D36, (b) images of the root system for D320, (c) the measured RAI after a 4-month
growing period (Ng et al., 2016b)
0
0.02
0.04
0.06
0.08
0.1
0.12
0.14
0.16
0.18
0.0 0.2 0.4 0.6 0.8 1.0
Dep
th (
m)
RAI
D36
D320

Figure 3. Soil water retention curve of (a) bare soil, (b) single- and (d) dual-permeability model in low planting density soil (D36),
and (d) single- and (e) dual-permeability model in high planting density soil (D320)

Figure 4. Comparison of the measurements (hexagram dots) and the simulations of cumulative infiltration and infiltration rate by
the single- and dual- permeability models (lines) in low planting density soil D36 (left column) and high planting density soil D320
(right column)
c

Figure 5. Comparison of the measured and simulated pore water pressure profiles by using the single- and dual- permeability
models: (a) D36 and (b) D320 after1 h rainfall, and (c) D36 and (d) D320 at 2 h rainfall
0
0.05
0.1
0.15
0.2
0.25
0.3
0.35
0.4
-30 -20 -10 0
Dep
th (
m)
Pore water pressure (kPa)
Measured-R-before rainfall
Measured-R-after 1h rainfall
Measured-M-before rainfall
Measured-M-after 1h rainfall
Simulated-before rainfall
Simulated-single-after 1h rainfall
Simulated-dual-after 1h rainfall
Root
zone
a0
0.05
0.1
0.15
0.2
0.25
0.3
0.35
0.4
-100 -80 -60 -40 -20 0
Dep
th (
m)
Pore water pressure (kPa)
Measured-R-before rainfall
Measured-R-after 1h rainfall
Measured-M-befor rainfall
Measured-M-after 1h rainfall
Simulated-before rainfall
Simulated-single-after 1h rainfall
Simulated-dual-after 1h rainfall
Root
zone
b
0
0.05
0.1
0.15
0.2
0.25
0.3
0.35
0.4
-30 -20 -10 0
Dep
th (
m)
Pore water pressure (kPa)
Measured-R-before rainfall
Measured-R-after 2h rainfall
Measured-M-before rainfall
Measured-M-after 2h rainfall
Simulated-before rainfall
Simulated-single-after 2h rainfall
Simulated-dual-after 2h rainfall
Root
zone
c0
0.05
0.1
0.15
0.2
0.25
0.3
0.35
0.4
-100 -80 -60 -40 -20 0
Dep
th (
m)
Pore water pressure (kPa)
Measured-R-before rainfall
Measured-R-after 2h rainfall
Measured-M-befor rainfall
Measured-M-after 2h rainfall
Simulated-before rainfall
Simulated-single-after 2h rainfall
Simulated-dual-after 2h rainfall
Root
zone
d

35
1
Figure 6. Simulated vertical profiles of soil water content () and pore water pressure (p) in D36 and D320 soils 2 by using the single-permeability model during the 2 hours of rainfall 3
4
5
6
Root zone
Root zone

36
7
Figure 7. Simulated vertical profiles in D36 soil by the dual-permeability model during the 2 hours of rainfall: 8 soil water content in (a) the matrix domain, (b) the preferential flow domain, and (c) the total domain; pore water 9 pressure in (d) the matrix domain and (e) the preferential domain; and (f) the water exchange rate (positive 10 denotes water exchange from the preferential flow domain to the matrix domain) 11
12

37
13
Figure 8. Simulated vertical profiles in D320 soil by the dual-permeability model during the 2 hours of rainfall: 14 soil water content in (a) the matrix domain, (b) the preferential flow domain, and (c) the total domain; pore water 15 pressure in (d) the matrix domain and (e) the preferential domain; and (f) the water exchange rate (positive 16 denotes the water exchange from the preferential flow domain to the matrix domain) 17
18
19
20
21
22

38
23
Figure 9. Effects of planting density on factor of safety (Fs) before and after the 2 h rainfall predicted by the 24
single- and dual-permeability models (foreff f
p p ) 25
26
27
28
29

39
30
Figure 10. Effects of the choice of flow domain in the dual-permeability model on the slope stability 31
32
33
34
35