university microfilms international · 2014-06-13 · a dissertation submitted to the graduate...
TRANSCRIPT

INFORMATION TO USERS
This material was produced from a microfilm copy of the originaldocument. Whilethe most advanced technological means to photograph and reproduce this documenthave been used, the quality is heavily dependent upon the quality of the originalsubmitted.
The following explanation of techniques is provided to help you understandmarkings or patterns which may appear on this reproduction.
1. The sign or "target" for pages apparently lacking from the documentphotographed is "Missing Page(s)". If it was possible to obtain the missingpage(s) or section, they are spliced into the film along with adjacent pages.This may have necessitated cutting thru an image and duplicating adjacentpages to insure you complete continuity.
2. When an image on the film is obliterated with a large round black mark, itis an indication that the photographer suspected that the copy· may hav~
moved during exposure and thus cause a blurred image. You will find .agood image of the page in the adjacent frame.
3. When a map, drawing or chart, etc., was part of the material beingphotographed the photographer followed a definite method in"sectioning" the material. It is customary to begin photoing at the upperleft hand corner of a large sheet and to continue photoing 'from left toright in equal sections with a small overlap. If necessary, sectioning iscontinued again - beginning below the first row and continuing on untilcomplete.
4. The majority of users indicate that the textual content is of greatest value,however, a somewhat higher quality reproduction could be made from"photographs" if essential to the understanding of the dissertation. Silverprints of "photographs" may be ordered at additional charge by writingthe Order Department, giving the catalog number, title, author andspecific pages you wish reproduced.
5. PLEASE NOTE: Some pages may have indistinct print. Filmed asreceived.
University Microfilms International300 North Zeeb RoadAnn Arbor, Michigan 4B106 USA
51. John's Road, Tyler's GreenHigh Wycombe, Bucks, England HP10 BHR

78-1047
HUANG, Jiin-Vuan, 1939-QUANTITATIVE INHERITANCE OF IMMUNOLOGICALRESPONSE IN SWINE.
University of Hawaii, Ph.D., 1977Genetics
University Microfilms International, Ann Arbor, Michigan 48106
QUANTITATIVE INHERITANCE OF IMMUNOLOGICAL
RESPONSE IN SWINE
A DISSERTATION SUBMITTED TO THE GRADUATE DIVISION OF THEUNIVERSITY OF HAWAII IN PARTIAL FULFILLMENT
OF THE REQUIREMENTS FOR THE DEGREE OF
DOCTOR OF PHILOSOPHY
IN GENETICS
AUGUST 1977
By
Jiin-Yuan Huang
Dissertation Committee:
Ming-Pi Hi, ChairmanGeoffrey C. AshtonMohamed N. Rashad
Douglas C. VannDale W. Vogt

iiiACKNOWLEDGEMENr
I would like to acknowledge Dr. Robert C. T. Lee, Chairman, Joint
Connnission on Rural Reconstruction; Director F. K. Koh, Pig Research
Institute, Taiwan; National Science Council of Republic of China; and
Taiwan Sugar Corporation for their financial support, provision of
experimental animals, and for the use of their facilities for this
study.

ivABSTRACT
Pigs were used as an animal model for studying the sources of
variation in immunological response, under selected dose levels of
immunization and at various stages during the development of immunity.
Special emphasis was focused on the genetic component of the variation.
Bovine sermn albumin was selected as an antigen to inject pigs
at the age of 28 days. Based on the preliminary trials, two dose
levels of BSA were chosen, namely 5 and 50 mg. The kinetics of innnune
response were studied to decide the time for taking blood samples
for the main study. Three blood samples were taken at 14, 21 and 42
days after the first immunization, each representing the primary
response, ~, secondary response, Rs ' and peak response, Rm, respectively.
A total of 802 pigs which were offspring of 18 purebred boars,
each mated with six females, were used in the main study. Antigen
binding capacity was used for measuring the antibody response. Data
expressed as percent antigen bound was transformed by angle. No
significant difference was found in the effect of sex, birth weight,
weaning weight or pre-weaning daily gain on immune response. Pigs
which received 5 mg of BSA gave consistently higher response than
those receiving 50 mg of dose level in all three response measurements,
i.e. Rp, Rs and Rm• The difference between the two dose levels and
among litters in all responses were highly significant, but did not
show any interaction between the dose level and litter. The intra
relationship of immune response measured at the three stages were found
positively correlated.

v
The difference among sires was found to be statistically significant
in immune response under the dose of 5 mg of BSA except for the primary
response. Variations among dams within sires were significant only
in the primary response. For pigs treated with 50 mg of BSA, no sire
difference in the peak response was detected at the 1% significant
level but the difference existed at the 5% significant level. Signi
ficant difference was found among dams within sires. The genetic
contribution to the early response could not be important. As varia
tion of immune response in 50 mg of BSA would be expected to manifest
mainly enviromnenta1 influences, this part of data was not used for
estimation of genetic parameters.
The genetic variance of the three immune responses, 29, 59 and
51 percent of the phenotypic variance, showed an important effect on
the secondary and peak response.. The litter enviromnent decreased
in importance from 25% of the phenotypic variance in primary response
to zero in the secondary and peak response. The individual environ
mental variance showed a stable variation among the three immune
responses. The genetic correlations between the two adjacent stages
of i1lUl1une response, i.e. R.p and Rs, and Rs and Rm were considerably
higher than that between Rp and Rut. Similar results were also found
in the correlation measurements of individual environment and pheno
typic measurement. The heritability obtained from sire and dam
component combined for secondary and peak response were 0.51 ± 0.04
and 0.40 ± 0.04. The estimates were considered to be more precise
than those calculated from other variance component':', In conclusion,
the mu1tigenic control of immune response was demonstrated in the
present study.
viTABLE OF CONTENTS
ACKNOWLEDGEMENTS · . . . . . . . . . . . . . . . . . . . . . . . .Page
iii
ABSTRACT ••• • • • • • • • • • • • • • • • • • • • • • • • • 0 • iv
LIST OF TABLES • • • • • • • • • • • • G • • • • • • • • • • • • • vii
LIST OF FIGURES · . . . . . . . . . . . . . . . . . . . . . . . .viii
CHAPTER 1. INTRODUCTION . . . · . . . . . . . . . . . . . . . . . 1
CHAPTER 2. LITERATURE REVIEW · . . . . . . . . . . . . . . . . . 4
1. Methods for detecting antibody response • • • •• 42. Genetic control of immune response • • • • • • •• 83. Heritability of innnune response • • • • • •• 144. Enviromnental factors in immune response • • • •• 175. Studies on immune response in pig • • • • • • •• 22
CHAPTER 3. MATERlALS AND METHODS · . . . . . . . . . . . . . . . 28
1. Experimenta1 animaIs • · · · · · · · · • · ·2. Inununization • · · · • · · • · · · · • • · · · · •3. Collection and preparation of blood sample • · · •4. Preliminary trial • · · · · • · • · · · · · · · ·5. Main experiment design • · • · · · · · • · · • · ·6. Measurement of immune response · • • · · · · · • •7. Statistical methods · · · · • · • · · · • · · · ·
28282829293040
CHAPTER 4. RESULTS . . . . . . . . . . . . . . . . . . . . . . . 47
1. Preliminary results · • · • • • • • • · · • · 472. Data description • · • · • · • · • · • • · • · · · 503. Data adjustment and transformation · • · • • · · • 514. Effects of sex, dose level and body growth on
immune response · • · · · • • • · · · · • · • • · 555. Interaction between the dose level and litter 556. Intrarelationship of immune response measured
at three stages · • · • · · • • · · · • · • • · · 597. Analysis of variance for immune response · · • · · 598. Estimates of variance component for immune
response . • • · • · • • • · • • • • · · · · • · 639. Path analysis · · • • · • • • · · • · · • • · · · 66
10. Heritability estimates · • · · • · · · · · · • 69
DISCUSSION • • •CHAPTER 5.
APPENDIX • . . .. . . . . . . . . . . . . . . . . . .
. . . . . . . . . . . . . . . . . . . . . . . . .71
82
REFERENCES CITED . . . . . . . . . . . . . . . . . . . . . . . . . 83

Table
LIST OF TABLESvii
Page
3-1 Experimental Design. • • •• · . . . . . . . . . . . . 31
4-1 Effects of BSA Dose Level and Time Lapse SinceImmunization • • • • • • • • • • • • • · . 48
4-2 Effect of Dose on Immune Response • · . · . . . . . . . 56
· . . .4-3
4-4
Effects of Dose Level, Litter and Their Interaction
Effects of Early Response on Subsequent AntibodyProduction • • • • • • • • • • • • • • • • • •
• • 58
60
4-5 Analysis of Variance and Covariance for ImmuneResponse • • • • • • • ~. • • • • • • • • • • • · . . . 62
4-6 Component of Variance and Covariance of ImmtmeResponse . . . . . · · · · • · · · · · · · · · · • 64
4-7 Genotypic and Environmenta1 Variance and Covariancefor Immune Response · . . · · · • • · · • • · · · · · · 65
4-8 The Percent of the Phenotypic Variance in ResponseAttributed to Genetic, Litter and IndividualEnvironment • . . . . • · · · · • · · · • · · · 67· •
4-9 Heritability Estimates of Immune Response • · · • · · · 70

The Kinetics of Immune Response to BSA. in Pig . ·Distribution of Immune Response to BSA. at Day 14After First Immunization . • . . . . . . . · . •
Distribution of Innnune Response to BSA. at Day 21After First Immunization . • . . . . . . • ·
Figure
3-1
4-1
4-2
4-3
LIST OF FIGURES
Schedule of Immunization and Blood Collection . .Page
32
49
52
53
viii
4-4 Distribution of Innnune Response to BSA. at day 42After First Immunization •• • • • • • • • • • • 54
4-5
4-6
Effects of Dose Level on the Immune Response inthe Three Stages of Innnunity Development •••
Path Diagram Illustrates the Intrare1ationshipof Immune Response Measured at Three Stages • •
· . .
· . .
57
61
4-7 Path Diagram of Genetic and Environmental Relationsin Immune Response • • • • • • • • • • • • • • • • • 68
1
APPENDIX
Separation of I 131_BSA and Free .1131 by ae1Filtration with a Column of Sephadex G-75 • · . . . . 82

CHAPTER I
INTRODUCTION
Resistance to infectious disease in animals is dependent on
complex responses of both a non-specific and specific nature. Non-
specific resistance differs in species or races and strains of animals
which may not provide optimal conditions to permit successful
multiplication of pathogens and which may differ in their non-specific
protective mechanisms. The differences of reticuloendothelial systems
are also important in non-specific resistance. On the other band,
specific immunity is an adaptive response to an antigenic stimulus.
It depends upon prior exposure to a foreign configuration and
subsequent recognition of and reaction to it. There are two types
of effector mechanisms which may occur in specific immune response:
hmnoral immunity, which is the synthesis and release of free antibody
into the blood and other body fluids, and cell mediated immunity,
which produce sensitized lymphocytes. B-cells are the organization
of lymphoid tissue into the bone marrow dependent compartment of cells
responsible for antibody synthesis and the T-cells are processed by
or are in some way dependent on the thymus. These two different small
lymphocytes are not functionally independent. The T-cells appear to
cooperate with B-cells in the generation of the hmnoral antibody
response to certain but not to all antigens. These immunologic
responses serve three major functions: defense, which involves
resistance to infection by microorganisms; homeostasis, which is
removal of damaged cell elements, and surveillance ti'hich involves
perception and destruction of mutant cells.

It is realized that the immune response to infectious agents
relate to resistance of disease. It has also been recognized that
individuals afflicted with a disorder of antibody production are
highly susceptible to infections. It is clear that immune response
will be a predictor for disease resistance. And there are many
evidences which indicate that the immune response is under genetic
control. The differences in host resistance to particular pathogens
often have a mu1tigenic basis.
Studies of ~une response in laboratory animals suggest that the
variation in antibody response against the antigens is subject to
genetic control and environmental influence. The genetic components
of the variation are due to hereditary diffe:t'ences between individuals
in the ability to recognize antigens and in the regulation of the
amount of antibody produced. The enviromnenta1 components may be due
to the sum effects of physiologi<'..al factors such as hormonal balance,
stress, nutrition, and age, which influence antibody production.
Although there are some evidences for monogenic control of specific
response to simple antigens, the immune response genes being closely
linked to histocompatibility genes, the response to specific antigens
among different breeds or strains of animals has been shown to be
under the control of multiple genes. It has also been demonstrated
that selection for high and low response to specific antigens is
possible. One remarkable finding is that the genetically selected
high and low iunnune response lines maintain their innnune response
when injected with unrelated antigens. This separating effect of
high and low level has also been shown in histocompatibility, in the
level of different iunnunoglobulins, and in the rate of multiplication
2

3
and differentiation of antibody producing cells.
Since the immune response can be a predicator of disease resistance
in animals, selective breeding for improvement of this particular
trait can be expected, if this trait has a considerably high heritability.
Though the heritability of immune response to certain antigens has
been estimated under various conditions for several laboratory animal
species, large animals such as pigs have never been used for such a
study of quantitative genetic control of immune response.
The aim of the present study was to investigate sources of
variation in immunological response, under selected dosage levels of
immunization and at various stages during the development of immunity.
Special emphasis was focused on the genetic component of the variation.
CHAPTER 2
LITERATURE REVIEW
2.1 Methods for detecting antibody response
Many sensitive techniques have been developed for detecting
and measuring the interaction between antigen and antibody. Precipitin
reaction is the interaction between specific antibodies and soluble
antigens and has been used both in the quantitative determination of
antibodies and for the identification and characterization of protein
and polysaccharide antigens. Heidelberger and Kendall (1934)
developed a method which was based on quantitative analyses of the
protein nitrogen content of a series of antigen-antibody precipitates
formed between a constant amount of antiserum and varying amounts of
antigen.
Gel diffusion methods are simple and very sensitive for studying
quantity or quality of antibody. The formation of an insoluble
antigen-antibody complex becomes visible as a line of precipitation
in the opalescent agar in the area where optimal concentrations for
the formation of antigen-antibody precipitates are present. Single
diffusion allows the antigen to diffuse, and the antibody is
incorporated into the agar. This system can be performed in one or
two dimensions. The single diffusion in one dimension is described
by Oudin (1951). And the single diffusion in two dimensions has
been adapted by Mancini, et ale (1965) for the quantitative determina
tion of antigen concentration and is a very useful method for
screening antigen concentrations of a large number of samples. Fahey,
et a L, (1965) have applied this method to determining the concentration

of different classes of iunnunog1obulins. When both antibody and
antigen are allowed to diffuse toward each other, the system is
called double diffusion which also can be performed in one or two
dimensions. The double diffusion system in one dimension was
originally described by Qak1y and Fu1thorpe (1953). The double
diffusion in two dimensions allows comparison of different antigens
with respect to their immunochemica1 identity, and cross reactivity.
This method is also called the Ochter10ny method (Ochter10ny, 1948).
Immunoelectrophoresis developed by Grabar and William (1957),
combines electrophoretic separation of an antigen mixture in agar
with the precipitin reaction by double diffusion in two dimensions.
This method is particularly useful for the examination of mixtures
of protein antigens or mixtures of different classes of antibody.
Antigen-binding capacity method (ABC-method) developed by Farr
(1958) is a method to measure quantitatively the amount of albmnin
antigen which binds specifically to an antisertml. The antigen
antibody complex is precipitated at 50 percent saturated ammonimn
sulfate, and this is the basis for measuring the .antLgen bound to
the antibody or the antigen-binding capacity of the antLserum, The
method is so sensitive that even a level as low as 0.005 IIg antibody
protein nitrogen can be detected.
Agglutinin reactions are used to detect antibodies directed
against cellular antigens such as bacteria and erythrocytes which
result in visible agglutination. Boyden (1951) has extended the use
of this method to soluble antigens. This method called passive
hemagglutination is based on the observation that erythrocytes
5

treated with dilute tannic acid absorb protein antigens on their
surface and can be agglutinated by antibodies directed against the
absorbed antigens (Boyden, 1951; Stavitsky, 1964).
Minden, et a L, (1965) have compared some commonly used methods
for detecting antibodies to bovine serum albumin in human serum,
These methods are: the annnonium sulfate test (ABC-33), antigen
precipitating capacity (P-80), antigen-precipitating efficiency,
passive hemagglutination, gel diffusion, passive cutaneous anaphylaXis
(PCA), radio-innnunoelectrophoresis and P-K passive transfer tests.
Of the techniques used in this study, only radioimmunoe1ectrophoresis
and the ammonium sulfate method detected the primary interaction
between antigen and antibody. The other in vitro and in vivo tests
depend upon measuring secondary events which, in varying degree,
may occur sometime after the primary antigen-antibody reaction. In
the detection and measurement of humoral antibody to BSA on the
primary interaction between antigen and antibody, Minden, et a L,
(1969) also indicated the percentage of antigen bound to antibody as
determined by 50% saturated Ammonium sulfate or by heterologous
anti-r globulin was remarkably similar at various serum dilutions and
at two antigen concentrations. FarrIs method has been used for
testing the kinetics of the reaction between antibody and bovine serum
albumin (Talmage, 1960). This study indicated that ammonium sulfate
is effective as a stopping agent in the reaction between 1131 - BSA
and antibody. Weigle (1961) bas used this method in the study of the
immunochemical properties of the cross-reactions between anti-BSA
and heterologous albumins.
6
7
Green (1969) modified Farr's technique using high specific activity
3U DNP-FACA. to de~ect the low levels of anti-DNP antibody. The per-
centage of binding was calculated from the ratio: l-(counts in unknown
sera/counts in control samples) x 100. Chard (1970) described a
radioimmunoassay procedure using ammonium sulfate precipitation for
separating antibody-bound antigen from free oxytocin. A modification
of the coprecipitation-inhibition technique (Farr's technique) in
50% saturated ammonium sulfate was used for detection of <1.1 -Fetoprot~in
(AFP) in the serum of rats (Oakes, et al., 1972). It was found to be
sensitive and reproducible. A simple assay for quantifying IgE
levels has been developed based on the observation that antibody-bound
IgE is insoluble in 33% saturated (NH4)2S04' whereas unbound IgE is
not. This method has been applied to human and rat IgE. Jones, et ale
(1976) used Farr I s technique to test for the measurement of antibody
specific for Type III Pneumococcal polysaccharide (SSS-III). Linear
regression analysis of the data was performed. For each point the
x-coordinate was the dilution (loglO) of the serum and the y-coordinate
was the corresponding value for mean percentage of antigen bound.
Using Farr I s technique, a study of the genetic control of the antibody
response to simple haptens in congenic strains of mice was carried out
by Rathlum and Uildemann (1970). In this study the anti-TNP antibody
level is expressed as "percent antigen bound" at fixed value of antigen
added; this uses less serum than methods which compare the antigen
bound relative to a fixed percent antigen bound.
Green and Benacerraf (1971) also used Farr's technique to assay
the genetic control of immune responsiveness to limiting doses of
protein and hapten protein conjugates in guinea pigs.

8
Although there are many methods for detection of primary interaction
of antigen and antibody, the Farr technique has been used successfully
in many studies of immune response. It has a number of advantages:
1) its simplicity allows rapid processing of a large number of samples,
2) the materials are relatively inexpensive, and 3) there are fewer
problems related to variation between batches of reagents. Furthermore,
the solubility of ammonium sulphate does not vary widely with temperature
(Chard, et a1., 1970).
2.2 Genetic control of immune response
Genetic control of innnune response has been extensively investigated.
In early experiments studies were made on genetic control with randomly
bred animals to determine the responding or non-responding and the
high or low responding individuals. Subsequently highly inbred animals
immunized with complex antigens such as microorganisms or xenogeneic
erythrocytes were used. More recently, innnunization of highly inbred
animals with chemically-defined antigens such as synthetic polypeptide
molecules, have been studied for interpreting the genetic control of
immune response (Mozes, 1972).
2.2.1 Mu1tigenic control of innnune response
As early as 1916, Cooke and Van Der Veer found that heredity
could influence immune reaction in the development of some forms of
human sensitization, such as hay fever, bronchial asthma, and gastro
enteritis which are genetically transmitted from parent to offspring
as a dominant characteristic.
Based on tests involving the use of 5 inbred strains of mice,
there has been evidence for definite genetic variation in the response

9
of mice to either egg albumin or pneumococcus polysaccharide used in
the study by Fink (1953). This study also demonstrated different
responses to two different chemically definable antigens, via different
routes of injection, and in different ages of the animals.
Marked strain differences in the Ummune response to sheep red
cells were found in mice. The hybrid and backcross experiments
suggested that this was genetically controlled by at least three
genes. (Playfair, 1968). Using synthetic polypeptide G1u56 - Lys38_
Tyr6 in 8 strains of rabbits and in New Zealand white rabbits (Gill,
1965), it was also found that there were significant differences in
the amount of antibody produced in different strains.
James, et a1. (1969) studied the primary humoral response of a
number of inbred and random bred strains of rats. The results indicated
that various hooded strain rats exhibited widely differing responses
to bovine serum a.Ibumdn , The conclusion of the study on genetic
control of the innnune response in rats to a synthetic antigen poly
Glu52 Lys33 Tyr 15 by Simonian, et a L, (1968) was that the ability to
produce antibody was transmitted as a complex, genetically controlled
mechanism involving several genes.
Genetic studies on the ACI and F344 strains of rats, which were
respectively the high and low responders to Glu52 Lys33 Tyr15 (Gill,
1970) and their F1 and backcross offspring, showed segregation of the
response and the genetic control with two independently segregated
genes, one associated with antigenic recognition and the other controlling
the quantity of antibody produced. In addition, there is some evidence
of sex influence which may also be genetically controlled (Gill and
Kunz, 1971).

10
Aggregation of the immunogen with a variety of agents enhanced
the antibody response and delayed hypersensitivity reaction in the
poorly responding F344 strain (Sloan and Gill, 1972). Similar antigenic
complexes generated reduced antibody responses in the high responder
ACI rats without affecting their delayed skin reactions.
Levine, et a1. (1963) were the first to give evidence for the
genetic control of the ability of guinea pigs to respond immunologically
to synthetic antigens. It was found that 82% of the offspring from
Hartley parents responded to DNP-PLL, and all of the offspring of non
responding parents were unable to respond to DNP-PLL. It was also
found that strain 13 guinea pigs were non-responders and that strain
2 were responders.
McDevitt and Se1a (1965) immunized CM x C57F, F1 x CM and
F1 x C57 mice with (T, G)A-L. They found definite genetic control of
the response that appeared to be the single major genetic factor with
perhaps one or more modifying factors. They also found that the
genetic control of the immune response to (H, G) -A--L appeared to be
dominant and polygenic in the same way as was demonstrated for
(T, G)-A--L (McDevitt and Se1a, 1967).
After selective breeding of rabbits immunized with Group C
carbohydrate, complete segregation was achieved between a high-response
population and a low-response population. Eichmann, et aL, (1971)
suggested that a limited number of genes control the degree of the
immune response to the antigen.
Studies with the backcross inbred mice indicated mu1tigenic
control of the responsiveness against the GrAS and GIAlO (Maurer, et a1.,
1974). Immune response to GLO-GLT system in mice also indicated
mu1tigenic control (Merryman, et a1., 1975).

11
In mfce , the immune response to DNA. was characterized as a
dominant genetic trait and in backcross studies suggested that this
immune response is under multigenic control (Fournie, et a1., 1976).
High-responder, SJL, and low-responder, DBA/1, mouse strains were given
different doses of (T, G)-Pro-L in aqueous solution to investigate
genetic control of immune response by using hemolytic plaque-forming
cell (PFC) in the spleen as well as hemagglutination titers in the
sera. There was no difference in the response and in the number of
direct and indirect PFC in both the primary and secondary response
between the strains when given an optimal dose (1 }lg) of antigen. The
direct and indirect PFC responses were lower in the low responder than
in the high responder strain when given higher doses (10-100 11g) of
antigen. After injection of a low dose (0.02 11g) of antigen, the low
responder strain produced more direct and indirect PFC than the high
responder strain. It was suggested this Ir-gene regulated the balance
between stimulation and suppression according to the dose of antigen
given (Jorma1ainen, et al., 1975).
Using parents, F1 hybrids and backcross offspring of inbred
mice, a study was carried out to measure the amount and relative
affinity of antibody produced in response to protein antigens injected
in saline. The results of this study suggest that the antibody
affinity is under polygenic control. They also indicate that strain
related variation in the amount of antibody is independent of the
relative affinity, and that these two parameters are under independent
genetic control systems (Steward and Petty, 1976).
In certain conditions of immunization, C57131/6 mice are high
responders whereas AKR mice are low responders to bovine gamma globulin
12
(BGG). When mice were given BGG alone, a dose higher than 0.1 mg of
BGG reduced the difference between the high and low responders. When
this dose (0.1 mg) of BGG was given with adjuvant, AKR mice showed an
increase in the response, but the C57131/6 did not. When mice were
given a low dose of BGG (1 11g) with adjuvant A1(OH)3' C57l31/6 showed
high antibody titer, but AKR. mice showed very low titer. The results
suggest that the enhancing effect of adjuvants on the immune response
to BGG is dependent on the dose of antigen, and indicate a quantitative
genetic control of the immune response to BGG (Gherman and Sulica,
1976) •
2.2.2 Selection for antibody response
The selective breeding for high and low immune responder lines
of mice to mu1tideterminant strong ~unogens such as heterologus
erythrocytes has shown that multiple genes are involved in controlling
this particular trait (Biozzi, et a1., 1970). After 20 generations,
the mean aggu1tinin titers against sheep erythrocytes showed a marked
difference in the two lines (Biozzi, et a1., 1971).
The most remarkable finding in the selective breeding was that
high and low lines were shown to be separated with respect to their
antibody responses to antigens unrelated to those used in the selection
process, such as the 0 and H antigens of salmonella typhi (Biozzi,
1970; Prouvost-Danon, et a1., 1971), Limu1us polyphemus hemocyanin, and
bovine serum albumin (Biozzi, 1971). The two lines of mice also differ
in their ability to synthesize humoral antibody against histocompatibility
antigens (Biozzi, 1971). In the induced tumor cytotoxic study, Biozzi
(1971) found that the high line of mice gained high titer of cytotoxic
antibody against "low" spleen cells, while the low line gained a low

13
titer of weakly cytotoxic antibody. When injecting mice with benzopyrene,
more tumors were found in the "low" line as well as a faster rate of
tumor growth.
A marked interline difference in the serum concentration of all
classes of immunoglobulins has been demonstrated after antigen
stimulation. The levels are uniformly lower in the low responder than
in the high responder mice (Biozzi, et a1., 1970). Guercio and Zola
(1972) also found that the two lines of mice showed a great difference
in their ability to respond to primary and secondary immunization with
dinitrophenyl groups coupled to bovine r-g1obulin.
All these findings suggest that selection operated primarily
at the level of genes involved in antibody synthesis, irrespective of
immunological specificity (Biozzi, et a1., 1972).
Selective breeding for agglutinin production to heterologous
erythrocytes, sheep erythrocytes (SE) and pigeon erythrocytes (PE),
was carried out on a randomly bred population of albino mice. In order
to eliminate the maternal antibody interference, two types of selection
were performed in this study. The results of both selections indicated
polygenic regulation of the aggultinin synthesis. The heritability of
this trait was estimated to be between 0.18 and 0.36 (Feingold, et
al., 1976).
Katz and Steward (1975) selected randomly bred TO mice into high
and low lines based on the relative affinity (Ka) of antibody produced
in response to protein antigens. After four generations of selective
breeding, the ~ on the two lines showed a highly significant difference.
The results indicate that antibody affinity is genetically controlled
and is independent of the antibody level.
14
2.3 Heritability of immune response
It has been found that there is a variability in the immune
response among animals. This vaLiabi1ity suggests that hereditary
difference may contribute to the antibody response. In general a
quantitative trait shows genetic and enviromnenta1 effects. sang
and Sobey (1954) have studied the inheritance of the extent of antibody
response to tobacco mosaic virus (T.M. V.) and bovine plasma albmnin
(B.P.A~) in rabbits. Antisera were collected 10 and 1~ days after
the second injection of B.P.A. and were titrated, using the optimal
proportion method. T.M.V. was injected innnediately following the
B.P.A. injection. Anti-T.M.V. was titrated by the equivalence aone
method. Using the regression of mean immune response of unse1ected
offspring to the mean immune response of their parents, the heritabilities
of secondary response to T.M.V. and B.P.A. were 0.876 and 0.09 respective
ly. From the frequency distribution of response to B.P.A. in the two
different populations, it was concluded that the populations differed
in their ability to produce antibodies. The correlation between
responses to T.M.V. and B.P.A. is 0.27 (p < 0.01). With diphtheria
toxoid there is a definite and significant correlation between primary
and secondary responses. There is no correlation between primary
and secondary response to tetanus. In the study described above, sang
and Sobey point out certain necessary conditions for further study:
a) the antigen used must be pure, b) the injection regimen must be
standardized and simple, c) both primary and secondary response curves
must be detemined, and d) the titration method must be done with a
low inherent error.

15
Sobey (1954) used equivalence zone method to titer the anti-T.M.V.
antibody in rabbits. Measured by a midparent offspring regression,
the heritability of secondary response to T. M. V. is 0.876. The response
to T.M.V. was measured by the "equivalence zone" technique, while the
B.P. S. was measured by the "optimal proportions" method. The measure
ments were made in each case with samples of the same serum from the
same bleeding, thus, the environmental variation would be the same.
Why did heritability of response vary significantly from one experiment
to another? Sobey and Adams (1955) conducted another experiment in an
attempt to answer the question. They used sheep red cell, which is a
complex antigen, and measured the response using haemolytic titration.
One hundred twenty pairs of albino mice were used in this study. The
time response curves were determined before they chose day 3 and 6 as
the best time for bleeding. They found that there was a significant
difference in sex. The responses were corrected for constant age and
sex, and regression of offspring on midparent was calculated using
corrected figures. The heritability of antibody response to S.R.C.
was found to be 0.28 at 3 days and 0.11 at 6 days. The correlation
between these two periods was found to be r = 0.57. Their discussion
indicated that the method of measuring response might be inadequate
and, in the conclusion, suggested that the detailed knowledge of the
complexity of the antigens and the measuring method must be of concern
in such a study.
Due to a large sampling error in Sobey r s paper (1955), Claringbold
and Sobey (1957) studied the inheritance of antibody response with a
different approach in order to estimate the heritability using the
experimental design of daughter-dam pair in albino mice. In the

16
study of primary response, a 4 x 23 factorial experiment was used to
calculate independent effeet of line, dose, routine of injection,
weight, and time of testing on response. The experimental design for
secondary response is a 4 x 25 factorial experiment. The analysis
of variance showed that the responses are very strongly dependent on
dose, and that the dose response slope is a function of age. The
heritability of primary response is 0.428, while the secondary response
is -0.074. The correlation between the primary response of dams and
secondary response of daughter, or vice versa, is not significant.
The variability of primary response is about twice that of secondary
responses. Another experiment was carried out by Sobey and Adams
(1961) to determine the heritability of antibody responses using Vi and
o antigens of Rhizobium me1i1oti and MEL and LEE Strains of influenza
virus. The antihaemagglutination and neutralization methods were
used in this study. Heritabilities were obtained by doubling the
correlation of daughter with dam scores. A heritability of -0.012
for Vi and 0.78 for 0 antigens was obtained. When testing for response
of Vi with both the Vi and 0 antigen present, the heritability is low;
but when the Vi antigen is destroyed by heating, the only measurable
response is that to the 0 antigen and here the heritability of
response is high. The heritability for MEL virus was 0.60 by anti
haemagg1utinin and 0.16 by the neutralizing potency test and may
indicate that the tests did not measure a single antibody but a complex
of antibodies. It suggests that such study requires using purified
antigens which will elicit a single antibody response.
The heritability of antibody response to sheep red cells in mice,
which were selected for high and low responders for 21 generations,

17
was estimated and was found to be 0.36 (Biozzi, et a1., 1970).
2.4 Environmental factors in immune response
The variation in the immune response against the antigens is
subject to genetic control and environmental influence. This review
is concerned with dose, frequency and route of administration of the
antigen, hormonal balance, age, stress and nutrition.
2.4.1 Dose, frequency and route of administration of antigen
Immune response is dependent on the dose of antigen, but
optimum dose is required for the best response. The effect of antigen
dose and time after immunization on antibody affinity was studied in
a haptenic system by Eisen and Siskind (1964). It was found that
affinity increased progressively with time after immunization, and
that this increase was greater with lower doses of antigen. High
dose of antigen resulted in early immunization in higher concentrations
of antibody, followed later in the immune response by decreased serum
levels of antibody as compared with lower doses of antigen. This
effect of high doses of antigen can be attributed to induction of
immunological tolerance (Siskind, 1968).
Low zone tolerance can probably be obtained under favorable
circumstances with all low and medium molecular weight soluble proteins
such as serum protein antigen (Mitchison, 1968). Mature mice were
injected repeatedly with various doses of bovine serum albumin (BSA) and
then measured for antibody response. Mitchison (1968) found that mice
given repeated low doses of BSA became tolerant; mice on medium doses

of BSA became sensitized and gave a good antibody titer on challenge
while those on high BSA doses were tolerant. Thus, there is a Alow
zone" and a "high zone" for tolerance.
In addition, these high doses of antigen affect B as well as
T lymphocytes instead of only T lymphocytes as in low zone tolerance
(Mitchison, 1970).
A study of the response of guinea pigs to bacteriophage ~ x 174
(Uhr, 1962) noted that the secondary response evoked about one hundred
times as much antibody as the primary response and reached a peak
earlier. The primary response is composed mainly of 19s antibody, and
the secondary response is composed mainly of 7S antibody (Uhr, 1967).
Nossal, et ala (1965) have emphasized the similarity between the two
responses. If the dose of antigen is adjusted, primary and secondary
responses can be made to resemble each other quantitatively. It has
also been shown that 19S antibody is produced first, followed by 7S
antibody (Wei and Stavitsky, 1967).
Antibody produced in the secondary response tends to have a
higher affinity than that produced in the primary (Steiner and Eisen,
1967) •
Many routes of immunization have been used to produce antibody.
Some routes favor induction of delayed hypersensitivity, sane favor
preferential synthesis of various immunoglobulin classes, and some
favor induction of inmuno10gica1 tolerance. The site at which the
immunogen is administered should influence the antibody production.
Normally, subcutaneous, intra~uscular injections are used (Hurnand
Landon, 1970) 0
18
19
2.4.2 Sex hormone and age in immune response
The hormone balance influences the maturation of the immune
system as well as general itmnuno1ogica1 reactivity during periods of
stress. Somatotrophin, thyrotrophin, corticotrophin and gonadotropin
and the endocrine secretions have been reported to control the
immunological development and have been reviewed elsewhere (Batchelor,
1971; White and Goldstein, 1972; Hudson, 1974). Estrogen increases
the phagocytic activity of the reticuloendothelial system, but
androgens and progesterone do not (Nicol and Bi1bey, 1960). The
estrogens also increase the effect on lymphoid tissue structure and
functions, but the androgens do not. The estrogens have been observed
to enhance antibody production and levels of sermn immunoglobulin
in females in comparison with levels in control groups of males
(Butterworth, 1967; Terres, 1968). It was shown that changes in sex
hormone levels exerted a marked influence on immune responsiveness
and stem cell differentiation (Eindinger, 1972).
The effects of age on the immune response were studied in mice.
A decline in the antibody forming activity was seen after 20 weeks
of age (Makinodan, 1972). The itmnuno10gic inadequacies of the aged
reflect both intrinsic deficiencies in the immunocompetent cell
population and extrinsic deficiencies in the environment of cells.
Studies on humoral immunity in aging showed that 90% of the
decline in the humoral response is intrinsic to the innnunocompetent
cells. Although the stem cells as well as the accessory cells do not
show deficiency with age, the functional capacity of both T and B
lymphocytes is markedly depressed (Nordin and Makinodan, 1974). It

20
was found that BALB/C and C3H mice could mount high level plaque
forming cell (PFC) response to SIll at various age through 110 weeks,
~~hereas, the level of the SJI.,/ J PFC responses began to decline by the
age of 42 weeks through the age of 80 weeks. Also the suppression
T cell activity was apparently greater in young BALB/C mice than in
older BALB/C mice (Smith, 1976).
The effects of age on the immune response were studied in
highly responding and poorly responding strains of inbred rats. Changes
in the itmnune response associated with age were found only in the
highly responding strain. The antibody response fluctuated up to
10-12 weeks of age, showed no significant change up to 60 weeks of
age, and decreased thereafter. The factors influencing antibody
formation at different ages appear to modulate the genetically set
capability of the immune system (Kunz, 1974).
2.4.3 Stress and nutrition in immune response
Stress appears to have an important influence on disease
resistance. Much work on stress and susceptibility to disease has
been conducted in man and in laboratory animals. Detectable changes
in itmnuno1ogica1 mechanisms include impaired antibody responses
(Solomon, 1969b). Little is known about the mechanism of this associa
tion.
Protein-calorie malnutrition has been a widely known cause of
impaired immunoglobulin synthesis. Experimental animals deprived of
proteins showed an impaired ability to respond to primary immunization
(Kenney, et a1., 1970) 0 A study showed that protein supplementation
of diets led to a rapid recovery of antibody-producing capacity

21
(Mathews, 1972). The reticuloendothelial system with phagocytic
function is an important accessory to antibody formation. This system
is often impaired in protein-calorie malnutrition (Arbeter, 1971),
The clinical and experimental evidence has suggested that increased
incidence of disease in protein deficient subjects is not always
explained by a reduction in antibody synthesis. Many factors may
contribute to impairment of the resistance. The cell-mediated immune
response is probably most important (Smythe, 1971; McFarlane, 1971).
Vitamin A deficiency in pigs lead to a reduced response to salmonella
Pu110rum antigen (Harmon, 1963). Vitamin A also enhanced the response
of mice to sheep erythrocytes and led to a more rapid rejection of
skin grafts (Jurin, and Tannick, 1972). Deficiencies of vitamins of
the B group have been associated with a reduction in antibody produc
tion to antigenic stimuli (Axelrod, 1971). Vitamin C has little
effect on antibody production (Kumar and Axelrod, 1969).
Physical enviromnent such as climate and weather appear to have
most profound influences on iumuno1ogica1 status and disease resistance.
Many infectious or immunological disorders of man and domestic animals
show seasonal cycles presumably associated with the thermal environ
ment (Top, 1964). The faster catabolism of antigen and earlier
appearance and higher levels of circulating antibodies were found in
the cold-exposed group (Rose and sabiston, 1971). The suppressive
effects of many pathogenic organisms on the general immune response of
the host have been demonstrated. Parasitic infectious have shown
immunosuppression (Hudson, 1973b). The role of immune suppression
induced in tumors by viruses has been reviewed by Dent (1972). In
22
addition to viruses, mycoplasma (Roberts, 1972) exhibits innnunosuppressive
characteristics.
2.4.4 Antigenic competition in immune response
The depression of ~ne response to one antigen may occur as
a result of the injection of a second antigen. In mice injected
intravenously with antigen in incomplete Freund I s adjuvant, there was
competition between BGG and ferritin (Adler, 1964). It was shown
that large doses of BGG depressed antibody production in response to
ferritin, although smaller doses actually increased the level of
ferritin antibodies. Competition could still be demonstrated if the
BGG was given before the ferritin. The bovine sermn a1bmnin and
haemocyanin in a comparable type of experiment also gave the same
conclusions (Cremer, 1963). There was no diminution in the antibody
production to sheep red blood cells (SRBC) when horse red blood cells
(HRBC) were given simultaneously. Prior injection of HRBC decreased
the response to SRBC (Radovich and Talmage, 1967). The mechanism of
antigenic competition is still not conclusive.
2.5 Studies on immune response in pig
2.5.1 Transmission of passive immunity from mother to offspring
Due to the structure of the placenta of the pig, there is no
maternal r-g10bulin present in the blood of newborn pigs before they
suckle colostrmn (Kim, 1964; Myers and Segre, 1963). Colostrmn and
milk are the only sources of maternal immunity for newborn pigs. The
pigs utilize the immunoglobulin from the colostrmn during the first
24-36 hours after birth. After this period, the intestinal absorption
23
will cease (Miller, 1962; Speer, 1959). The pig colostrum contains
all three innnunoglobulin classes; IgG, IgM and IgA.. Although the
antibody in colostrum is mainly IgG and is three Umes as concentrated
as in the serum, it decreases rapidly during the first week of lactation.
IgA is four times as concentrated in the serum and declines during the
first 24 hours of lactation, but not as markedly as IgG or IgM. It
becomes the predominant immunoglobulin in milk (Bourne, 1976; Porter
and Noakes, 1969).
This passive immunity is gradually replaced by active immunity
in the young pigs. By using sodium sulphate precipitation and free
boundary electrophoresis, Jakobser and Moustgaard (1950) and Rook
(1951) observed the euglobulin content in pig serum from birth to
maturity. They found that the euglobulin content rose to a maximum
after suckling and then fell to a minimum between 20 to 30 days of age,
thereafter, rising gradually until adulthood was reached, indicating
that the r-globulin level falls to a minimum at 3 weeks of age.
Nordbring, et ale (1957) found that r-globulin in the serum decreased
to a minimum at about 4 weeks of age and thereafter increased gradually.
From these results, it is indicated that the time of minimum concentra
tion of r-g1obu1in in pig serum is between 3 and 4 weeks of age.
2.502 Active antibody production
Brown (1961) pointed out that the serum antibody of baby pigs
which absorbed the Serratia marcesceus from high titer colostrum can
be detected through 6 weeks of age. This differ from the findings of
Miller (1962) who discovered that absorbed antibodies are retained in
measurable concentration for about seven days.

24
Curtis and Bourne (1973) studied the time of onset of
immunoglobulin in pigs. They concluded that there was no IgG pro
duced during the first 14 days and no IgA until the first week of
age. Immunoglobulin-containing cells in the intestinal tract have
been found on the tenth day of age (Allen and Porter, 1973), and all
classes of immunoglobulin also have been found in the duodeum during
the first week of life (Brown and Bourne, 1976). Miller (1962)
found that the capability to produce the serum antibodies to salmonella
Pullorum and serum immunoglobulins increase until pigs were 3 't~eeks
of age as well as a 20 fold increase in serum antibody titer in pigs
which were 6 weeks old. Hoer1ein (1957) used killed Brucella abortus,
or sheep red cells, or bovine serum or egg albumin to innocu1ate the
young pigs at the age of 3 to 8 weeks and administered a booster dose
at 3 weeks after the first injection. The pigs were either allowed to
suckle, deprived colnstrrum, or received innnune coIoatrrum, Pigs under
8 weeks of age, which were deprived of colostrum, did not produce
antibody in measurable quantity, except to sheep red cells, whereas
those that had received colostrum (non-immune) did produce antibody
at 3 weeks old and this increased markedly up to 6 weeks. Antibody
production of pig at ages 3 and 6 weeks interfered with immune-co10strtnn.
Three weeks-old colostrum-deprived pigs failed to produce
antibody to diphtheria toxoid and responded only slightly to tetanus
toxoid. Those fed with colostrum responded strongly and within a week
to both antigens. The colostrum deprived pigs showed the intermediate
response when injected with combined toxoids with a minimtnn amount of
pig serum from pigs hyper-innnune to both antigens. Removal of the
25
antitoxins from the hyper-immune serum resulted in loss of its
stimulating effect. It was also found that the serum from 15 weeks
old pigs provides a greater stimulus for active antibody production in
a colostrum deprived pig than the serum from 9 weeks old pigs. Segre
and Kaeberle (1962a, 1962b) found colostrum-fed pigs produced diphtheria
antibodies after intraperitoneal innoculation of the toxoid at birth,
but the production of antibody to tetanus toxoid was depressed.
Colostrum deprived pigs produced tetanus but not diphtheria antibodies.
These results indicated that a degree of transplacental transfer of
maternal antibody of tetanus, but not of diphtheria, are present in
the sow's blood. Kaeberle (1968) found that colostrum fed pigs did
not produce antibody in response to tetanus, but responded better to
antigens than colostrum-deprived pigs, and the response was enhanced
by the presence of a small amount of specific antibody. It was
concluded that passive immunity from colostrum may inhibit the
development of active immunity for the first 3 weeks of life, but its
presence at a low level, thereafter, enhances the production of
antibody.
Kim, et al. (1966) found that no immunoglobulin could be
detected in sera of germfree colostrum-deprived miniature piglets at
birth. A single antigen showed a greater primary immune response
than a multiple antigen. This indicated antigenic competition. The
antibody response to a single injection of the phage in 1 month old
piglets was identical to that of the adult sow. The first antibody
produced in response to the specific antigenic stimulus was 198 (rl)
immunoglobulin which developed later in the piglets, and the 198
immunoglobulin was distinct from r M-macrog1obu1in (Kim, et a1., 1966).

26
Although pigs can produce antibody during the first week to
antigenic stimulus at birth, a more normal time for active immunization
is at 3 weeks old, and the capacity of increasing the innnune response
is not until at least 6 weeks old (Brambe11, 1970).
It was concluded that colostrum and traces of specific
antibody in passive transmission may play an important role in active
innnunity, but an amount of passive innnunity to a specific antigen
greater than a trace amount would interfere with active immunization
as long as it persists.
2.5.3 Sources of variation in immune response in pigs
Perry and Watson (1967a) studied sources of variation in the
uptake of a marker antibody by piglets from 26 litters sired by 10
boars. Analysis of variance in efficiency of antibody absorption
showed that 25% of total variance was due to time of dosage, 13% to
dosage concentration and 6% to sire. Half of the total variance was
within subclass. Further analysis showed that three-fourths of this
variance within subclass was due to between litters and only one fourth
was due to within litter. This indicated that the maternal effect
was a very important source of variation. Sixteen sows at parturation
showed marked differences in serum antibody to salmonella pufLorum
antigen which was used to innnunize the sow in late pregnancy. The
piglet serum antibody titers measured at twelve hours after birth
showed a positive relation to the serum titers of their mother. No
relationship was found between colostral titers and the titers in sow
or piglet sera. The titers of the colostral samples showed marked
variation both between different teats and different sows. The piglet

27
and litter weight gain from birth to seven days of age were negatively
related to sow and piglet serum titers. Those piglets with high
serum antibody titers at 12 hours after birth showed faster growth
rate and lower mortality than those with low serum titers (Perry and
Watson, 1967b).
The breed differences of pig in the inunune response to sheep
red blood cell were studied by Buschmann, et a L, (1974). The innnune
response to SRBC as determined by the number of plaque forming cells
(PFC) in the spleen of pigs revealed a significant difference among
breeds. A significant seasonal influence on the number of PFC was
observed in immunized animals. The breed differences in immune response
to SRBC were supposed to be due to different genetic background.
Using the phage neutralization technique to detect the anti-
hapten antibodies in the pig serum from 8 different breeds after
inununization with DNP-BSA, it was found that 49.0% of pigs' serum
showed no antibody activity, 38.0% showed weak antibody titer and
13.9% showed high antibody titer. The frequency distribution of
response showed breed-specific differences (Buschmann, et a1., 1975).
C~PTER 3
MATERIALS AND METHODS
3.1 Experimental animals
Pigs were used for experimentation in the present study. All
animals, raised in complete confinment, were randomly selected from
a herd of some 3,000 breeding females maintained at the Animal Industry
Research Institute, Taiwan Sugar Corporation (TSC). At birth, the
pigs were allowed to suckle colostrum from their mothers and were
given creep feed from the first week until weaning at 28 days of age.
After weaning, all the litters were moved to another facility.
Management and feeding were uniform through all the experiments. In
thi,; herd, hog cholera vaccine was administered routinely to immunize
the pigs at the age of 49 days.
3.2 Immunization
Bovine serum albumin (BSA.) was selected as an antigen, since it is
a soluble, pure protein and is well known as a good immunogen when used
with Freund adjuvant. This protein antigen, obtained as a commercial
product of the Sigma. Company, was emulsified in an equal volume of
complete Freund I s adjuvant (CFA) (Difico Laboratories) for the first
injection and the booster dose was made with BSA. in incomplete
Freund I S adjuvant (ICFA). IIIIllunization was made by deep intramuscular
injection on the inside of the pig's thighs near the lymoph node.
3.3 Collection and preparation of blood sample
A schedule of drawing blood was established in each experimental
design. Ten ml of blood were obtained from the anterior vena cava and

29
allowed to clot overnight at a temperature of 4°C in the refrigerator.
The blood was subsequently centrifuged at 1,500 rpm, 15 minutes in
4°C. The sera obtained from the supernatant were inactivated at 56oC,
for 30 minutes and transferred into two vials stored at -ao?c for
antibody assay.
3.4 Preliminary trial
3.4. 1 Trial l: Dose leve1 of antigen
Three dose levels were used, namely, 0.5, 5.0 and 50 mg/ml of
BSA. A total of fifteen 28-day old pigs at weaning from three litters
were randomly assigned to the respective levels. A booster dose was
given two weeks later. Blood samples were collected from each animal
every week after first iunnunization for a period of five weeks. Each
sample was examined for antibody response to BSA by using gel diffusion
and passive hemagglutination.
3.4.2 Trial 2: Kinetics of anti-BSA res~onse in pigs
Five 28-day old pigs were used. Fifty mg/ml of BSA. was given in
the first injection with a booster dose two weeks later. Blood was
drawn fran each pig every three days for two months and the antisera
were analyzed for innnune response by using the antigen binding capacity
method, details of which were given in 3-6. Non-linear regression
analysis of percent antigen bound on the days that response was measured
was used to plot the response curve.
3.5 Main experiment design
In the main experiment three treatment combinations were used.

30
Each litter se'lectied for study was divided into two groups of
approximately equal number with similar sex composition, and was
randomly assigned to one of the three treatments. For the first
treatment half of the litter received no antigen and the other half
5 mg/ml of BSA.. The second combination speci.:::ied no antigen and 50
mg/ml of BSA for the two groups of each litter assigned. Two dose
levels of BSA., namely, 5 and 50 mg/ml characterized the last combina
tion. A total of 802 pigs which were offspring of 18 purebred boars
each mated with six crossbred females were used. Table 3-1 gives the
mating scheme in which litters were assigned to various treatment
combinations of BSA. dosage. The use of no antigen was specifically
designed to study the effects of subsequent BSA iDmunological response
to the hog cholera vaccine which was scheduled for every animal at
seven weeks of age. Figure 3-1 illustrates the plan of immunization
and blood collection. The first dose of BSA. was injected at the age
of 28 days and a booster dose was given two weeks later. The blood
samples were collected at 14, 21 and 42 days in order to study the
innnune response in different stages of innnunity development.
3.6 Measurement of immune response
3.6.1 Gel diffusion
This method was employed in Trial 1. One percent agarose was
poured on glass plates and allowed to solidify at room temperature.
Opposite wells were cut into the agarose by suction. The central
well was filled with solutions containing anti-BSA serum and the
peripheral wells with BSA solution. During the next day, a precipitin
line was expected to be visible between the wells if there was

Table 3-1. Experimental Design
Sire S1 82 --------- 818--Dam D1 D2 D3 D4 DS D6 D7 D8 D9 D10 Dll D12 D13 D14 ----- D108
B8A Dose 0 x x - x x - x x - x x - x x ----------
(mg/m1) 5 x - x x - x x - x x - x x - --------x
50 - x x - x x - x x - x x - x --------x
8 = sire
D = dam
x = inject
- - not inject
Wf-I

Age (days) 28 35 42 49 56 63 70
Days since firstB~ dose injection 0 7 14 21 28 35 42
IIunnunization 1st dose 2nd dose Hog cholera
of BSA of BSA vaccination
II
Blood collection 1st blood 2nd blood 3rd bloodsamples samples samples
Figure 3-1. Schedule of Immunization and Blood Collection
WN

33
anti-BSA antibody in the test antiserum.
3.6.2 Passive hemagglutination
The method of passive hemagglutination (Boydin, 1951) was also
used in Trial 1, based on the observation that the tannic acid treated
erythrocytes which would absorb protein antigen on their surface and
the antibody could agglutinate with this sensitized cell directed
against the absorbed ant Lgen,
Sensitized cells were prepared according to Boydin (1951) and
Campbell (1963). Sheep red blood cells (SRBC) were first washed
three times with phosphate buffered saline (PBS) pH 7.2. Ten ml of
freshly prepared solution of 1:20,000 dilution of tannic acid in PBS,
pH 7.2 and added with equal volume of SRBC in PBS pH 7.2. After
incubation for 15 minutes at 37oC, the SRBC were washed with PBS
and suspended in· equal volume in a solution containing 1 mg BSA per
ml PBS, pH 6.4. Following incubation with antigen at 370C for 15
minutes, the SRBC were centrifuged and washed with PBS, pH 6.4, to
remove nonabsorbed antigen and finally suspended in 1% normal rabbit
serum.
The absorption of nonspecific antibody was made by taking 0.4 m~
antiserum mixed well with 0.02 ml washed pack SRBC in a small tube.
After incubation at 40C overnight, the cells were centrifuged and
the supernatant was transferred into another tube kept in 40C for
the test.
Twofold serial dilutions of each antiserum USing microtiter were
prepared in the plate wells using 1% NRS as dilutent. An equal volume
of tanned sensitized SRBC was added to each well. The plates were

34
read after incubated at 370C for 1 hour and kept at 4°C for reading
the following morning. The titers were expressed as the highest
dilution which gave a positive agglutination.
3.6.3 Antigen binding capacity (ABC)
The Farr method (Farr, 1958) was selected for the measurement
of antibody level in the blood. This method was originally developed
to measure quantitatively the amount of a1btmlin antigen which bound
specifically to the globulin fraction of an antiserum. It determined
indirectly both precipitating and nonprecipitating antibody activity,
based on the differential solubility of a lbunrln and globulin in 50%
saturated ammonfum sulfate (SAS). It was observed that soluble
antigen-antibody complexes were precipitated at a 50% SAS concentration,
whereas, albumin antigen which is not complex to antibodies remained in
the supernatant. When a constant amount of a labeled antigen I 131_BSA
was added to serial dilutions of anti-BSA, until the I 131_BSA excess
was achieved, spontaneous precipitation of I 131_BSA and antibody
aggregate could not occur. All antibody was bounded to I 131_BSA and
the equilibritml in solution is reached
131This I -BSA bound to antibody was found by the radioactivity
determinations on the separated precipitation and supernatant formed
in 50% SAS. This test gave antigen-binding capacity of the antibody
rather than the amount of antigen or antipody spontaneously precipitated.
A. Iodination of BSA
The BSA was labelled with 1131 by the method described by

35
Greenwood (1963). The iodination was through an oxidation process with
Chloramine T, and sodium metabisulfite was used to stop the oxidation
process.
The iodine reacted was ~OI+ to iodinate the tyrosine
residues of the protein was0-I/~
\\ I.... ~ "'II:""~--IC~-protein
0 06
I/~-1:
" I,?
,b~-protein
++ H + ~O
. (Kabat, 1968)
The column (size about 1 x 30 em) was prepared by us Ing
1.25 gm Sephadex G-75 which suspended in about 300 m1 of borate buffer,
pH 8.2, kept overnight at 4oC. To minimize the loss of 1131_BSA.
which sometimes tended to bind with sephadex, 20 mg BGG/m1 of borate
buffer was allowed to e1utriate through the column first.
All the reagents were ~reshly prepared in phosphate buffer
pH 7.6 and the reaction was carried out at room temperature. Five
hundred mg of BSA. in 0.1 m1 was added to 1131 (0.5-1 Me.) in a small
vial. Then, 4 mg chloramine T in 0.1 ml was added and mixed gently.
After one minute, 10 mg sodium metabisulfite was added to stop the
reaction. 0.2 m1 KI (10 mg/m1) was used for washing the walls of the
vial.
The preparation of 1131_BSA. from the reaction mixture was
carried out by gel filtration with a column of sephadex G-75. The
mixture was then transferred to the column. The vial was rinsed with
another 0.1 ml K1, and the rinse was also put on the column. After
the mixture penetrated into the column, borate buffer was added to the

36
column from the top. Two ml (about 20 drops) of fraction was collected
in each of 16 tubes. All 16 fractions were read for their radioactive
counts by using a gamma scintillation counter (ORTEC). The first
radioactive peak was that of BSA bound 1131 while the second one was
free 1131 (Appendix 1). The highest peak fraction was then kep for
further use.
B. Standardization of antigen
Since so many samples required measurement and the half
131life of I was only 8 days, several batches have to be taken and
the difference between batches must be minimized. The standardization
of the I 131_BSA concentration became very important in the measurement
of immune response by determining the antigen binding capacity through
131all batches. The concentration of the stock I -BSA obtained from
the iodinate fraction was determined by means of the Fo1in-Ciocalteu
reagent. The method used was essentially described by Lowry (1957).
A amount of 0.2 m1 of 1 131 stock solution was mixed with
2.0 m1 of a reagent which was a mixture of 50 m1 of 2% Na2C03 in O.lN
NaOH and 1 ml 0.5% CUS04 5H20
in 1% sodium citrate. The solution was
allowed to stand for 10 minutes at room temperature. Two-tenths m1
of Fo1in-Cioca1teu reagent (1 N in acid) was pipetted rapidly into
the mixture with thorough mixing and the extinction at 750 mUD It was
ready for reading after standing for 30 minutes.
The concentrations of I 131_BSA from 0.125 ug/ml to 12.5 ug/ml
were suggested for this method by Farr (1958). It was decided to chose
0.2 ug/m1 of I 131_BSA for the present study. The known amount of 1131_
BSA in stock solution in which the protein concentration was determined

37
by the Folin-Ciocalteu reagent method, was diluted with 1% normal pig
serum into 0.2 ug/ml with about 30,000 to 60,000 CEM which was used
as a standard for the present study.
C. Reagents for Farr technique
1. Borate Buffer (pH 8.3 ionic strength 0.1) needed in
these experiments was made of 6.184 gm boric acid
9.536 gm sodium tetraborate (borax)
4.384 gm sodium chloride
make up to 1 litter, pH 8.3-8.4
2. Saturated annnonium sulfate (SAS)
SAS was prepared and stored at 4°C with crystals
remaining in the stock SAS to prevent the solution from becoming
supersaturated. The solution was filtered and the pH neutralized
before being used, since the fractional precipitation is markedly
affected by pH.
3. 50% saturated annnonium sulfate (50% SAS)
It was made of one part of SAS to one of borate buffer.
4. Normal pig serum (NPS)
oPooled normal pig serum was heated at 56 C for 45
minutes in a water bath. After centrifuged, it was stored at _20oC
for further use. Antigen was diluted with 1:100 NPS in borate buffer.
131In order to prevent denaturation of the I -BSA by the effects of
dilution, 1:10 NPS in borate buffer was prepared for antiserum dilution.
S. Trace labelled I 13l_BSA
The stock I 13l_BSA was diluted with 1:100 NPS to the
exact concentration desired for the test antigen. Two tenths ug

38
1131.BSA per m1 was used in all the experiments.
6. Trichloroacetic acid (TeA)
Twenty percent aqueous solution.
D. Experimental procedures
1. Antiserum dilution
The preliminary antiserum was 1: 10 with borate buffer
and subsequent twofold dilution with 1:10 ~~S-borate. Each dilution
was prepared in two duplicate sets. There were three doubling
dilutions of antiserum and each tube contained 0.5 m1 a1iquots.
2. Controls for each experiment
Normal serum (NPS) control: Three tubes contained
0.5 m1 a1iquots of normal pig serum (1:10). These tubes received both
1131.BSA and SAS.
TeA. control (protein-bound 1131-contro1s): Three tubes
added 0.5 m1 aliquots of normal pig serum (1:10). These tubes received
TeA., but not SAS.
Antigen-added controls: Three tubes contained 0.5 m1
aliquots of 1131_BSA
dilution only.
Batch control: One sample from the preliminary experi
ment which had shown high anti-BSA. titer, was used for the determination
of antigen binding capacity, there were two duplicate vials of the
same sample in each batch as a control for measuring the differences
among batches.
3. Experimental procedure of Farr method
Using a volumetric pipette, 0.5 ml of the I 13l_BSA.
dilution was pipetted into all experimental and control tubes. The
tubes were thoroughly mixed immediately after antigen was added.

39
All tubes were incubated overnight at 4°C.
Following overnight incubation, 1.0 m1 SAS was added
to all experimental tubes and normal serum control tubes only. Mixed
well with mixer innnediately after added SA.S. After the addition of
SAS, the tubes were incubated at 4°C for 30 minutes, then centrifuged
for 30 minutes at 4°C in a refrigerated centrifuge at 2,000 rpm. The
supernatants were decanted and discarded. The tubes were blotted on
absorbant tissues to take up the remaining drops on the edge of the
tubes. After the precipitates were washed with 3 m1 of cold 50%
SAS and mixed to resuspend the precipitates, the tubes were innnediately
centrifuged at 4°C for 30 minutes at 2,000 rpm. The supernatants were
decanted and blotted as previously.
Antigen-added controls were used as a counting standard.
TCA controls were added 1.0 m1 of 20% TCA and centrifuged for 30
minutes at 2,000 rpm in a refrigerated centrifuge. Supernatants were
decanted and discarded.
4. Counting and calculating procedure
All control and experimental tubes were counted by a
gamma scintillation COmlter (ORTEC). Radioactivity was determined as
counts per minute (CPM).
The percent antigen bound in each experimental and
batch control tubes were obtained by the following calculations:
(Farr, 1970).
A. Determine the percent protein-bound antigen:
% antigen-bound antigen = cpm in TCA ppt Xcpm in Ag-add contro1 100

B. Calculation of correction factor (supernatant)
40
C.F. = cpm in ppt (precipitated)cpm in TeA ppt -cpm in NPS contro1
C. Corrected supernatant cpm
= (TeA- average ppt cpm) x C.F.
% antigen in supernatant = corrected supernatantTC'A
(% antigen not bound)
E. % antigen bound (precipitated) = 100% - % antigen
not bound
3.6.4 Characteristic of observation
The percentage of antigen bound by antibody was estimated
by the radioactivity as described earlier. There were six counts
which came from two duplicate sets, each with three dilutions. A
regression line of percent antigen bound was computed on the logarithmic
dilution factor based on which the percent antigen bound of each
sample was estimated at the 1:10 dilution (Rathbun, 1970). The
conventional approach by plotting the percent antigen bound against
the reciprocal of the dilution of the sample on a semilog paper would
produce the same results. In regression analysis the percent antigen
bound was on the linear scale and the reciprocal of dilution used on
the logarithm (Jones, 1976). The estimate represented the measure of
~ne response level in a pig. In addition to the immune response
level expressed as percent antigen bound, information on sex, birth
weight, and weaning weight of each pig was also recorded.
3.7 Statistical methods
The statistical methods used in the present study consisted of

41
analysis of variance and co-variance, regression analysis and path
analysis. All analyses were carried out on the IBM 370/158 computer
using the generalized LS program available at the Department of
Genetics (Mi, Onizuka and Wong, 1977).
3.7.1 Adjustment, transformation and distribution of data
The data obtained from the batch used as a control were analyzed
by the one-way analysis method. The differences of the overall mean
and each batch mean were used to adjust for batch differences.
The angular transformation which was developed for binomial
proportion was used to transformed the data before further analyses.
The computation procedures were illustrated by Snedecor (1967). The
histogram of the distribution of samples was given by two different
scales, namely percentage and angle. Tests of normality, skewness
and kurtosis for the distribution in two different scales were carried
out according to Snedecor (1967). Since the most of statistical
techniques were based on the assumption of normal distribution of
sample, the data which had the best fit in a normality test would be
chosen for analyses.
307.2 Mathematical models used in data analyses
In any analysis it is important that the mathematical model
underlying the analysis and the assumptions made in using the model
be well known. several general models which were discussed py Harvey
(1960) were used in the present study.
1. One-way classification model
Yi j = ~ + Lai + ei j

42
where Yi j
= jth observation in the i th A class (the A classes may
represent sex, or birth weight or weaning weight or daily gain, or
immune response at a specific stage, etc.)
II = the overall mean
a1 = the effect of the i th A class expressed as a deviation
from the overall mean
ei j = random error which are assumed to be independent
2. One way classification with regression model
Y.. = 11 + L ai
+ b (x.. - x) + e ..~J ~J ~J
where Yi j = the jth observation in the ith A class
II = overall mean
a. = the effect of the i th A class~
b = simple or partial regression of the dependent variable
(y) on the independent continuous variable (x) holding
the discrete variable (the a i) constant
Xij = the continuous independent variate for the corresponding
Y.. observation~J
x = the arithmetic mean of the Xij
eij = the random errors
An alterable model without L ai class could be used only for
linear regression.
3. Two-way classification with interaction model
Y = 11 + a + b + (ab) + eijk i j ij ijk
where:
Yi j k = the kt h observation in the jth B class and i th
A class

1.1 = the overall mean
a = effect of the i t h A classi
bj = effect of the jth B class
(ab) ij = effect of the ijth AB subclass after the average
effect of A and B have been removed. These are the
individual interaction effects expressed as a
deviation from the mean 1.1 •
ei jk = random errors
4. Nested classification model
where
Yi jk = the kt h observation in the jth B class within i t h
A class
ex. = the overall mean when equal frequencies exist in
all subclasses
ai = effect of the i t h class
bi j = effect of the jth B class within i t h A class
eijk = random errors
3.7.3 Estimation of the variance component
The variance components due to between sires, between dams
within sire and within dam were analyzed by 2-stage nested analysis
of variance and estimated with the expected mean square as showed
below:
43
Source
Between sires
Between dams/sires
Within dam
Expected mean sguare
2 + 'K....rr 2 + ILrr 2(J w -7' d -"3- s(J 2+ K (J 2wId
(J 2w

44
where o 2 is variance attributable to differences among progeny ofw
the same female, crd2 is variance attributable to differences among the
progeny of females mated to the same male, and as 2 is variance
attributable to differences among progeny of different males. K 'si
are the coefficient of variance component which were calculated
according to the method given by Gates and Shine (1962). The same is
true for covariance. The coefficients Kl, K2, and K3 were determined
by the formulas below:
K1 = (n•• - d.f. (dams)
2LLni "i" J
- J ) / d.f. (sires)n ••
2Ln ••K ( _iJ.)/ (3 = n , , d s f , sires)
n ••
According to Hazel, Baker and Reinmiller (1943), the variance
of innnune response (P) ,was· attributed to a genetic variance (G), a
litter environment or between dam environment (L) and a residual
environmental factor or within litter environment (E). These sources
of variance were additive and statistically independent. Thus the
relationship could be shown as follows:
V(P) = V(G) + V(L) + V(E)
and
COV(P) = COV(G) + COV(L) + COV(E)
These variances, V(G), V(L) and V(E) could be estimated by using the
corresponding component of variance according to the methods which
were given by Falconer (1964):

45
V(G) = 402
s
V(L) .. 0 2 _ 0 2d s
V(E) = o 2 _ 2 0 2w s
and
COV(G) =4 COV(s)
COV(L) = COV(d) - COV(s)
COV(E) = COV(w) - 2 COV(s)
The relative importance of genetic and environmental components of
phenotypic variance then could be easily estimated and were expressed
as a ratio of each variance component to the total of variance.
3.7.4 Using path analysis techniques for estimation of the variance
components
The quantitative importance of each source in causing variation
of immune response was estimated using Wright's (1934) method of path
coefficients. The relationship between each source at different stages
of immunity development was indicated by correlation coefficients.
The calculation for path coefficient and for correlation coefficient
of genetic, enviromnental and phenotypic components were carried out
according to the method illustrated by Hazel, Baker and Reimniller
(1943).
3.7.5 Esttmation of heritability
Because of the nature of the data available in the presented
study, the component of variance from sib analysis was used for
estimation of heritability which was discussed fully by Falconer
(1964).

h 2 = ~::--_-:::-_~s+d
The precision of the estimate of heritability would be determined by
the standard error of heritability which was estimated according to
the method of Dickerson (1959):
S.E. of h 2 = 42 Var a 2 I (a 2 + a 2 + a 2) 2s s s d w
S.E. of hd2 = 42 Var ad
2 I (a 2 + a 2 + a 2) 2s d w
S.E. of hs+d2 = 22 [Var 0'/ + Var ad2 + 2 Cov (a 2 a 2) ] I
s d
(~2 + ad2 + aw
2) 2
where(MS) 2 (MS)/0'2= 2Var ( s
sK
2 + )N Ndss s
2 (MS) 22 2 (MS)sVar a = ----- ( + w )
d 2K dd Nd N
w
46

CHAPTER 4
RESULTS
4.1 Preliminary results
4.1.1 Trial 1: Level of antigen
Antibody was not detectable in blood samples collected at 7 and
14 days after immunization in any of the 15 pigs by either gel
diffusion or the passive hemagglutination method. Results for three
subsequent samples are given in Table 4-1 showing variation among
litters and among doses of BSA. The antibody was scarcely detectable
in pigs from the third litter. Most pigs which received 0.5 mg did
not have antibody even at 35 days after the first injection. Response
to higher doses at 5 mg and 50 mg were good.
4.1.2 Trial 2: Kinetics of immune response
The kinetics of immune response to BSA for each individual pig
is displayed in Figure 4-1. The relationship between antibody level
as measured in percent antigen bound and days after immunization was
well represented by a fourth degree polynomial regression curve for
each animal. Variations among individuals were apparent. When data
were pooled, the mean response curve showed that antibody was not
detectable until 6 days. One of the five pigs responded at approximate
2 weeks. Antibody level increased up to 14 days at which time a
booster was given. The response curve continued to rise at a decreasing
rate. A plateau was reached approximately at 35 days.
4.1.3 Planning for the main experiment
Based on the above results, two dose levels of BSA were chosen,

Table 4-1. Effects of BSA Dose Level and Time Lapse Since Immunization
0.5 mg 5 mg 50 mgLitter Pig 21 28 35 21 28 35 21 2$ 35number number G P G P G P G P G P G P G P G P G P
1 1 0 0 0 0 0 0
2 0 0 0 x x x
3 0 x x x x x
4 x x x x x x
5 x x x x x x
2 6 x x x x x
7 x x x x x
8 x x x x x
9 x x x x x
3 10 0 0 0 0 0 0
11 0 0 0 0 0 0
12 0 0 0 0 x x
13 0 0 0 0 0 x
14 0 0 0 0 x x15 0 0 0 0 0 x
21, 28 and 35 are days after immunizationG=ge1 diffusion, P=passive hemagglutination ~
00
O=no response, x=response

49
oCD
\I)\I)
E)
tlO0 .,-l
\I) P-I
~o.-l
~\I)
~
~ 0.I-J
Q)lD~00 Po<
~ lD
~.-IasU
\I) o.-l
'" tlO0
.-I"N,"~\I) 0
en §,",,",ClJ,",,", ~................. a: JQ.Q.Q.Q.Q. 00E)4+X+ '" q.j
0
lDU
\I) o.-lN .I-J
Q)~
~Q)0 ~N
..-I
I..-t
\I)Q)...~::s00
o.-ll"z.I0..
09 011 OZ
ONngg 9H lN3~Y3d YH1n9NH
-------+--------------------100o09
50
namely 5 and 50 mg. Since the early weaning at 28 days of age and
subsequent separation by litter were established practices in the herd,
it was necessary to select the weaning time for immunization. It was
shown that a good response would be expected 2 weeks later. Therefore
the earliest possible time for antibody determination was at 42 days
of age. Because of a scheduled hog cholera vaccination at 7 weeks of
age for all pigs, it was decided to take blood samples at 14, 21 and
42 days after immunization which corresponded to 42, 49 and 70 days
after birth. The first sample would measure the primary response, Rp,
since a booster injection was given immediately after drawing blood.
The second sample was taken seven days later but prior to hog choloera
vaccination, in order to minimize possible interactions between
antigens. The determination of antibody level in the second sample
was assumed to reflect the secondary response, Rs , The third sample
would represent the peak level of antibody production, Rm.
4.2. Data description
Two hundred eighty-one and 266 pigs were immunized with 5 mg and
50 mg of ESt\., respectively. Complete information for sufficient data
for analysis was 241, 254 and 235 pigs for the dose of 5 mg of B~
at the three stages of immune response, respectively. The corresponding
number of pigs in 50 mg of BSA was 204, 204 and 200. The causes of
loss of sample are given as follows:

51
Causes of loss 5 mg 50 mgRp Rs BIn Rp Rs Rm
Death of pig 10 11 13 13 13 15
Insufficient quantity ofblood fo~ analysis 4 4 6 6 7 7
Lost during blood processingor centrifuge 6 3 5 6 5 6
Vial broken during thawing 5 4 6 7 5 7
Contamination 9 3 8 12 11 13
Limitation in the method ofdetection 3 1 3 15 15 14
Other accidental causes 3 1 5 3 6 4
Total 40 27 46 62 62 66
4.3 Data adjustment and transformation
Analysis of all control samples, two for each batch, indicated
that there were highly significant differences (p < 0.01) among the
18 batches. These differences did not display any time trend and
were assumed to reflect random errors.
There were a total of 458 pigs, 254 of which received a dose of
5 mg of BSA and 204 of which received 50 mg of BSA. The mean antibody
level under the dose of 5 mg as measured by percent antigen bound was
44.3, 68.9 and 79.1 for Rp, Rs and Rm, respectively. The corresponding
means were 16.2, 18.8 and 30.1 under the dose level of 50 mg of BSA.
The distribution of individual response within dose level was not
normal. The departure from normality was found to be statistically

100908030 qO SO 80 70PERCENT AG B"UNO
201010090
- - - - - N"RI1AL OISTRIBUTUIN
0='
50 HG
r0
en en...a::s:-z "a::
~... 0I) N \
\IlC \\oJ10 \s::I n,z 0...
80
1:rIffi:II~_30 qO SO 80 70
PERCENT AG B"UNO2010
5 I1G
H H.J.A.•H11h----- rl.ft.:f1J-lJ'1 ~ ~ ~ •
o='
00
oen en...a::s:-za::... 0I) N
IlC\oJ10s::IZ 0...
Figure 4-2. Distribution of Immunological Response to BSA at Day of 14 After First Immunization
,..50 I1G
.-
II,
\I \
\\
j,t:
~\~
~,~I
~ ..Jr
o='
oenen...
a::s:-za::
o... NI)
IlC\oJ10s::IZ 0...
0 0
5 tlG
10 20 30 qO SO 60 70qNGULAR PERCENT AG B"UNO
80 90 100
o='
0enen...
a:s:-za:
0... NI)
IlC\oJ10s::IZ 0...
00 10 20 30 qO SO 60 70
ANGULAR PERCENT AG BaUND80 90 100'
\J1N

----- tU'A"AL OISTAIBUTIaN
gT gS "I: I SO "I:
100808030 ijO SO 60 70
PERCENT AG BaUNO
...... ... .... .... .... ....' ...
2010Co
Cen v.a-'II:E-ZII:... CII:J N
a:IaICD
!z C..
100808030 ~O SO 60 70PERCENT AG BaUND
2010Co
Cen v.a-'II:EZII:... CI:J N
a:l;fE::»Z CI...
C~
5 "Gg
SO "G
Cen ."-'II:EZII:... CI:J N
~1IC::»Z C...
Co 10 20
Figure
Cen ."-'a:s:-za:... CI:J N
ffi~::»z C..
30 ~O SO 60 70 80 90 100
ANGULAR PERCENT AG BaUND4~2. Distribution of Immunological Response to
,\
10 20 SO ~O SO 60 70 80 80qNGULAR PERCENT AG BaUNO
BSA at Day of 21 After First Immunization
100
\JIW

NGAHAL DJSTftJ8UTIGN
~5 HG
Cl~
50 He
,.".,,--",'"
",'"
1008080SO qO SO 60 70
PERCENT AG BGUND2010
Cl
en '"-'a:EZa:
Cl&0. N~
a:..,CDE=Z Q...
1008080so qO SO SO 70
PERCENT AG aGUND2010
QO
Cl
en '"a!EZa:&0. Cl~ N
a:~E=Z Q..
~5 HG
Cl~
SO HG
U1~
100808030 qO SO SO 70ANGULAR PERCENT AG OGUND
2010
Q
en '"-'a:E-Za:II. Cl~ N
a:..,CDE=Z Q..
1008080
'l i,to,
\ ,"-....
...-
,-/,,,,,,
SO qO SO SO 70
ANGULAR PERCENT AG aGUND2010
QO
Cl
en '"-'a:E-Za:&0. Q~ N
a:..,s=Z Q..
Figure 4-2. D±stribution of Immunological Response to BSA at Day of 42 After First Immunization

55
significant (p < 0.01). The approximation of normality by angular
transformation of the data is clearly demonstrated in Figure 4-2 to
4-4. The transformed values expressed in degree were used for analysis.
4.4 Effects of sex, dose level and body growth on immune response
Because there were highly significant differences among litters,
data were analyzed on a within litter basis using model 2 in which
effects of sex, dose level, birth weight, weaning weight or preweaning
daily gain on response were tested. None of the factors were found to
be important except the dose level of BSA (p < 0.01). Therefore,
data would not be adjusted by sex, birth weight and weaning weight.
Pigs which received 5 mg of BSA demonstrated a consistently higher
response than those receiving 50 mg of dose level in all three
response measurements, i.e. Rp, Rs and Rm (Table 4-2).
The mean response curves for the two dose levels are shown in
Figure 4-5. For pigs which received 5 mg of BSA., there was a marked
increase in antibody level between the primary and secondary response.
The increase presumably continued at a reduced rate until a plateau
was reached. A dose of 50 mg of BSA produced significantly lower
primary response. Antibody level seemed to increase slightly after a
booster injection as shown by the peak response measured at 42 days
after the first immunization.
4.5 Interaction between the dose level and litter
The interaction between the dose level and litter was tested
using model 3. The results are given in Table 4-3. There was no
evidence of interaction in any of the three responses. Highly
significant differences were found between two dose levels and among
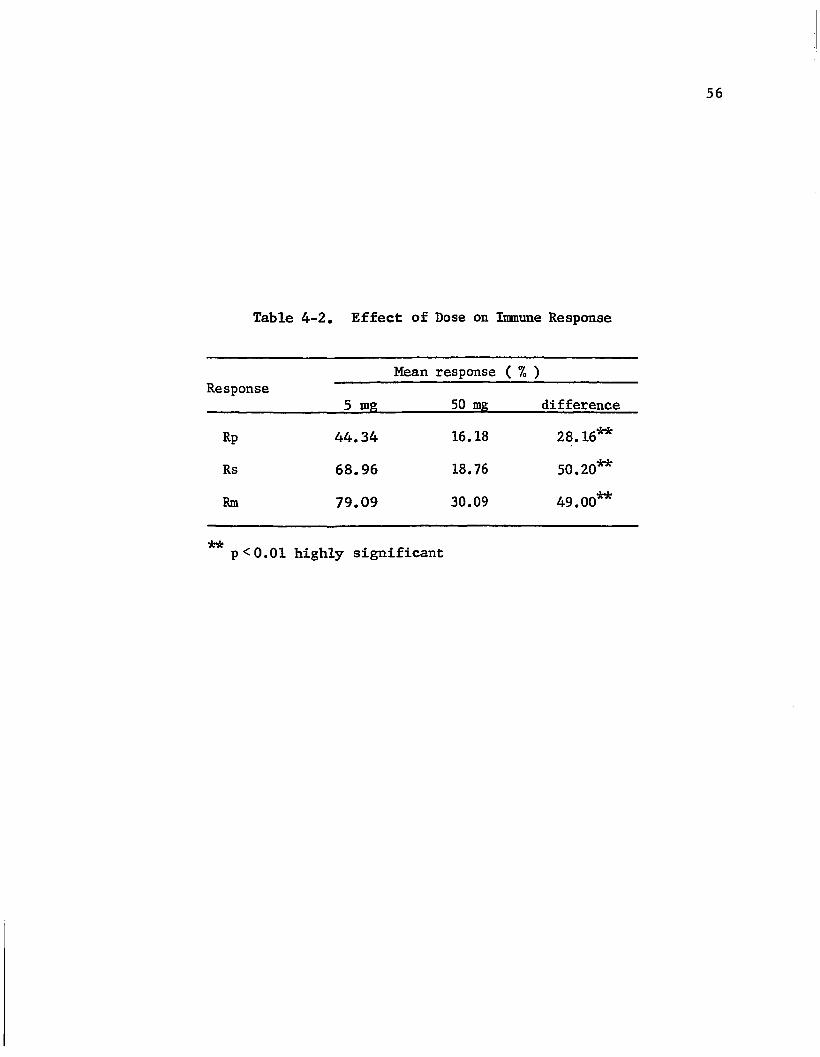
Table 4-2. Effect of Dose on Inmune Response
Mean response ( %)Response
5 mg 50 mg difference
Rp 44.34 16.18 28.16**
Rs 68.96 18.76 50.20**
Rm 79.09 30.09 49.00**
** p < 0.01 highly significant
56

80 5mg
----5Omg
"t:l ,1st inject§ 60o
,.0
§~,j..I
~ 40,j..I
~
~PI
20
boosterdose
--------_.:..---------
,---- ---------_ ... -_... -----
..---- -------r---- .--- --,
days 7 14 21 28 35 42
Figure 4-5. Effects of dose level on the immune response in thethree stages of immunity development.
VI......
_..__.__.~----_. ,---.~- " ._-_ -.. -- -. -'--"--"'---'-'~_.'

Table 4-3. Effects of Dose Level, Litter and Their Interaction
Mean squareSources DF
Rp Rs Rm
7758.77'** 33722.10** **Dose level 1 29867.70
Litter 23 338.75** 693.13** 872.34**
Interaction 23 79.62 156.55 215.50
Residual 111 77.30 153.96 136.76
** p <0.01 highly significant
58

59
litters in all responses. The results indicated that the effects of
dose level and litter were additive, high responders remaining high in
both levels.
4.6 Intrare1ationship of ~une response measured at three stages
The effect of early antibody production on subsequent response
was analyzed by the regression method (model 2) on a within litter
basis. Estimates were derived for each dose level separately. As
shown in Table 4-4, all responses were found positively correlated.
The primary response accounted respectively for 48 and 26 percent of
the variation in the secondary and peak response in simple regression
for pigs receiving 5 mg of BSA. The secondary response contributed
45 percent of the variation in the peak response. Similar relation
ships among responses were observed in pigs treated with 50 mg of B~.
When the primary and secondary response were considered simultaneously,
the influence of the former on the peak response became ni1. The
path diagram (Figure 4-6) shows that effect of the primary response
on the peak response, if any, would operate through the secondary
response.
4.7 Analysis of variance for immune response
Based on model 4, the total variation of each immune response
was partitioned into three sources; namely, between sires, between
dams within sires, and within dams within sires (Table 4-5). The
difference among sires was found to be statistically significant in
innnune response under the dose of 5 mg of BSA. except in the primary
response. Variations among dams within sires were significant only in
the primary response.

60
Table 4-4. Effects of Early Response on Subsequent Antibody Production
5 mg 50 mg
b bs R2 b bs R2
Simple regression:
Rs on Rp 0.798** 0.067 0.48 1.108** 0.122 0.44
Rm on Rp 0.424** 0.058 0.26 0.923** 0.178 0.20
Rm on Rs 0.486** 0.044 0.45 0.738** 0.095 0.36
Multiple regression:
Rm on
Rp 0.069 0.069 0.45 0.186 0.212 0.37
Rs 0.445** 0.060 0.665** 00127
1b = regression coefficient
2b = standard error of bs
3R2 = coefficient of determination
** p <0.01 highly significant

0.51»: >.
61
5mg
50 mg
Figure 4-6. Path Diagram Illustrates the Intrarelationship ofof Immune Response Measured at Three Stages

Table 4-5. Analysis of Variance and Covariance for Immune Response
5 mgSources DF Mean square Mean cross products
Rp Rs Rm RpRs RpRm RsRm
Between sire 17 550.73 655.08** 288.80** 338.80** 182.37* 290.03**
Between dam/sire 45 352.20** 23·'.42 110.23 147.21 81.38 93.63
Within dam 153 124.26 164.87 86.58 99.25 52.73 80.21
50 mg
Between sire 17 99.33 277.24 440.29* 102.63** 99.23** 233.17
Between dam/sire 36 70.92** 228.44** 222.44** 35.74 16.33 151.62**
Within dam 107 23.27 65.36 97.98 25.79 21.47 48.25
* p <0.05 significant
** p < 0.01 highly significant
0\N

63
For pigs treated with 50 mg of B~, no sire difference was
detected with the possible exception of the peak response, Rm, However
significant differences were found among dams within sires in all
three immune responses studied. The lack of significant differences
among sires in the primary response might be interpreted to mean that
the genetic contribution to the early response as measured at 14
days after innnunization was not important. As its variation would be
expected to manifest mainly enviromnental influences, this part of
data was not used for the estimation of genetic parameters.
4.8 Estimates of variance canponent for immune response
In Table 4-6, the three variance components were derived fran
the mean squares in the analysis of the variance table given above.
These were attributed to (1) differences among sires, as2 ; (2) differences
among dams, an2; and (3) differences among litter mates, aw
2• The
subscript "L" was used to identify the three immune responses. Since
all three response measurements were used, the components of covariance,
a SiSi' anini' and aWi Wi; were calculated by the same procedure. The
genetic variance, aG2; litter environmental variance, a L
2; the individual
. 1· 2 d h h . . a 2envuonmenta varaance , a E ; an t e p enotyac varaance , p; were
obtained based on the procedure outlined under materials and methods.
These estimates are given in Table 4-7. The genetic variance was a
measure of the average effects of all genes on the immune response.
The litter environmental variance represented the effects of environ-
mental factors which influenced the litter, and the individual environ-
mental variance was the residual environmental factors composing the
effects of dominance, espistasis and environmental factors peculiar

64
Table 4-6. Component of Variance and Covariance of Innnune Response
Response a2s 2 a 2w Combination as.S. aD.D. awiwia D~ ~ ~ ~
Rp 15.24 67.92 124.26 RpRs 15.76 14.29 99.25
Rs 34.24 21.62 164.87 RpRm 8.29 8.54 52.73
Rm 14.83 7.05 86.58 RsRm 16.37 4.00 80.21
a2S= between-sire component
iD = between-dam, within-sire component2
a W= within-progeny component
asis i = covariance of sire component between two stages
aD.D. = covariance of dam component between two stages~ ~
cfitl.W. = covariance of progeny component between stages~ ~

Table 4-7. Genotypic and Environmental Variance andCovariance for Immune Response
Sources Variance (0-2) Covariance (0-)
Genotypic G1 60.95 G1GZ 63.04
G 138.20 G1G3
33.162
G3
59.28 GZG3
65.48
Litterenvironment L
152.24 L1LZ -1.47
L2
0 L1LZ
0.25
L3 0 LZ~ -12.37
Individualenvironment El 93.78 E1EZ 67.73
E2
95.77 E1E336.15
E 56.94 E E 47.473 Z 3
Phenotypic PI 206.97 P1P2 129.30
P2
233.97 PlP3
69.56
P3 116.22 PZP3 100.58
Subscripts 1, Z and 3 are designed for Rp, Rs and Rm, respective1y •
65

66
to individual pigs. The relative importance of these variances as
each expressed in percent of the total phenotypic variance is
illustrated by Table 4-8. The genetic variance of the three tmmune
response were 29, 59 and 51 percent of the phenotypic variance showed
an important in secondary and peak response. The litter environment
decreased in importance from 25 percent of the phenotypic variance in
primary response to zero in the secondary and peak response. The
individual environmental variance in the three innnune response showed
a stable variation (45%, 40% and 49% for the Rp, Rs and Rm) among the
three immune response.
4.9 Path analysis
Genetic and environmental correlation between the three immune
responses were analyzed by the method of path analysis. In Figure 4-7,
the path coeffic.ients were shown in straight line and the correlation
coefficients were given in curve line. The heredity played a signifi
cant role in determining variations in immune response particularly
in the secondary and peak response. The individual environment showed
fairly constant effects on the variation in immune response, while the
litter environment showed some influence in the pr~ry response but
none in subsequent measurements. The genetic correlations between
the two adjacent measurements, i.e. Rp and Rs, and Rs and Em were
considerably higher than that between Rp and Bm, However, the genetic
correlation between the secondary response, Rs; and peak response, Rm;
was the highest being O. n. The observation that correlations between
the two adjacent measurements were generally higher was also found in
individual environment and phenotypic measurement. Since the variance

Table 4-8. The Percent of the Phenotypic Variance in ResponseAttributed to Genetic, Litter and Individual Environment
67
Sources
Genetic
Litterenvironment
Individualenvironment
Percent
29.45
59.07
51.01
25.24
o
o
45.31
40.93
48.99
Subscripts 1, 2 and 3 are designed for Rp, Rs and Rm,respectively.

;: G10.54
~~~l69 0.590.55 '»GZ 0.77 X~ 0.45
\372 ~:;J~G3 0.71
Figure 4-7 0 Path Diagram of Genetic and EnviromnentalRelations in Immune Response
68

69
components of litter enviromnent for the secondary and peak response
were estimated to be zero, correlations between two response measure
ments were assumed to be negligible. The heritability estimate
derived from the path coefficient squared was 0.29 for primary response,
0.59 for secondary response, and 0.51 for peak response. There were
71, 41 and 49 percent of the observed phenotypic variation remained
and attributed to environmental sources.
4.10 Heritability estimates
The heritability of immune response could be estimated from sire
component, dam component or the two components combined. These
estimates are shown in Table 4-9 with their standard errors. Herit
ability obtained from the sire component for secondary response and
peak response are 0.51 ± 0.07 and 0.40 ± 0.07. These estimates are
considered to be more precise than those calculated fram other variance
components. Due to highly significant differences between dams, the
heritability of primary response calculated from the dam component is
an overestimate.

Table 4-9. Heritability Estimates of Immune Response
Method of Rp Rs Rmestimation
h2 h2+ h2 ++ s.e. s.e. s.e.
S 0.29 ± 0.06 0.63 ± 0.07 0.57 ± 0.07
D 1.13 ± 0.09 0.39 ± 0.06 0.26 ± 0.06
S+D 0.80 ± 0.04 0.51 ± 0.04 0.40 ± 0.04
2h = heritability
s.e. = standard error of h2
S = sire component
D = dam component
S+D= sire and dam component combined
70

CHAPTER 5
DISCUSSION
The present study was designed to evaluate the effects of genetic
and environmental factors on immune response to BSA in pigs. This
was the first attempt to use a large mammalian species for the genetic
study of immune response. Large extant pig herds can be used to
facilitate large-scale experimentation. A mating plan which employs
randomly selected breeding animals from the population, one boar to
several sows, provides fu1l- and half-sib data for genetic analysis.
The phenotypic variation can be partitioned into three sources:
(1) heredity, (2) coumon maternal enviromnent, and (3) individual
enviromnent. The large herd selected for the present study is an
intensive production operation in which all animals are kept in complete
confinement. Feeding and management are maintained constantly and
uniformly in the herd.
The use of bovine sermn a1bmnin is considered a suitable antigen
for study. It is a pure soluble protein with a large molecular weight,
96,000, and is a potent immumogen when used with Freund's adjuvant
(Hildemann, 1970). The anti-BSA antibody can be measured by the method
of antigen binding capacity (Farr, 1958). The measurement is recorded
in percentage and demonstrates a continuous distribution. It is
considered more precise than the method of titration which records
the dilution factor at the end point of reaction. The antigen binding
capacity method used for the measurement of immune response in the
present study has been compared with several canmon1y used methods
and was found to be a good method for detecting the primary interaction
between antigen and antibody (Minden, 1965, 1969). This method is
sensitive and reproducible (Oakes, 1972) and is considered to be
simple for large-scale processing (Chard, 1970). It has also been
shown that materials used in the method are relatively inexpensive,
and there are fewer problems concerning variation between different
batches of reagents. The data in the present study are expressed in
percent antigen bound as used previously by Minder (1969), Green
(1969), Rathlum (1970) and Jones (1976).
The response of most pigs receiving a dose of 0.5 mg B~ could
not be detected up to 35 days after inununization, while animals
treated with 5 mg and 50 mg showed measurable response at 21 days or
earlier. This low dose of antigen, 0.5 mg, is considered sub-optimal.
The result is consistent with the findings of Siskind (1968) in
rabbits.
As pointed out by sang and Sobey (1954), the selection of optimal
time ie': measuring response is critical. It is also important to the
72
definition of phenotype for a genetic study. The kinetics of response
to BSA in pigs as studied provides essential information for such
a purpose. However, there are many other factors which must be
taken into consideration when a large-scale experiment is being
conducted in a production herd. For example, it might be better to..
postpone both primary and secondary measurements to a later stage in
the present study. However, the routine vaccination program against
hog cholera could have interfered with the response to B~. This
possibility has been demonstrated by the fact that the depression of
inunune response to one antigen may occur as a result of the injection
of a second antigen (Cremer, 1963; Adler, 1964; Radovich and Talmage,
1967) •

73
It has been shown that the concentration of r-globulin in pig
serum decreases to a minimmn at around 28 days of age and thereafter
increases gradually when pigs are kept with their mothers after birth
(Jakobsen and Moustgaard, 1950; Rook, 1951; Foster, 1951; and
Nordbring, 1957). On the other hand, pigs which are separated from
their dams without getting colostrum have shown the capability of
immunoglobulin production at an age as early as approximately 2
weeks (Curtis and Bourne, 1973; All and Porter, 1973) but a normal time
for active immunization is between 3 to 6 weeks of age (Hoerlein,
1957; Miller, 1962; and Brambell, 1970).
Sex difference in immune response has been reported in mature
mice (Sobey and Adams, 1955). Other investigators have shown that
sex hormone could influence immune response (Dougherty, 1952;
Butterworth, 1967; Eidinger, 1972; Hudson, 1974). In the present study
the measurement of three responses is made in pigs at an early age
and the last measurement is made at 70 days of age. In pigs sexual
maturity is reached at about 5 months. If there is any degree of
sexual development at two months of age its influence on immune
response would be too small to measure in the present study.
The notion that the rate of body growth of an individual may be
related to the development of antibody-producing capability is an
interesting one. In the present study birth weight, weaning wei~l:lt
and daily gain in weight fran birth to weaning are three measures of
early growth and development of an individual. The weight at birth
measures prenatal growth and the second measurement represents postnatal
growth up to weaning at 28 days of age. The average growth increment

74
is measured by the total weight gain from birth to weaning divided
by the length of the nursing period. However~ there is no evidence
of an association between early growth of an individual and its
ability to develop immune response. No other published data are
available for comparison.
There were highly significant differences found between the immune
response of both antigen doses in three stages of immune response.
It was shown that pigs given 5 mg of BSA had a higher immune response
than that of pigs given 50 mg of BSA. These results are in agreement
with the findings reported by Eisen and Siskind (1964) and Siskind
(1968) in that the high dose of antigen results in a lower serum
level of antibody as compared with the lower dose. This effect of
the higher dose of antigen can be attributed to induction of immuno
logical tolerance. Soluble serum prot.edns , such as serum albumdn,
have shown low dose or high dose tolerance in laboratory animals
(Mitchison~ 1968). Thus, 5 mg of BSA may be an optimal dosage,
while 50 mg of BSA can induce high dose tolerance in 28-day old pigs.
This immune suppressive effect of 50 mg of BSA may play a role in the
genetic expressivity of the immune response and result in a wide
variation among sire groups in the present study.
The immune response increased progressively with time after
immunization, and this increase was greater with lower doses of
antigen, while the high dose showed a much lower and slower increase
in the immune response. With 5 mg of BSA~ the secondary response
increased rapidly after the booster dose~ but the secondary response
of 50 mg of BSA showed only a slight increase. These findings are

75
consistent with the reports of Uhr (1962) and Siskind (1968). The
intra-relationships of the three stages of immune response show highly
significant correlations in the present study. This is supported by
the report of Sobey (1955) who has indicated that there is a high
correlation between the two periods studied in the course of the
development of iunnune response. The influence of primary response on
secondary response or secondary response on peak response was more
important than that of primary response on peak response. These
effects were also illustrated by the path diagram in Figure 4-6.
Similar results of the intra-relationships of immune response measured
at three stages were seen in both doses.
Interaction between dose and litter was not apparent in this
present study. This indicates that the litter mates show a consistent
capability of immune response in different environments, i.e. a high
responder to the treatment of 5 mg of BSA. is also found to be high
responder to 50 mg of BSA.. This result suggests that the effects of
interactions between dose and litter can be neglected from the genetic
analysis of iunnune response.
Since the lack of significant differences among sires in immune
response to 50 mg of BSA. indicated that the genetic contribution to
response was not important, this part of the data was not used for the
estimation of genetic parameters.
In the analysis of variance for the iunnune response in the three
stages of immunity development for both doses, highly significant
differences among sire groups were found in secondary and peak responses
but not in primary response after a dose of 5 mg BSA.. This suggests

76
that maternal effects may be involved in the primary response. Thus,
the sources of variation in inmune response due to the maternal
effects could be attributed to variation in the absorption of maternal
immunity from the colostrum. Per.ry (l967a, 1967b) indicated that the
maternal effect is a very important source of variation in the
efficiency of antibody absorption in pigs. The speed of the elimination
of passive immunity from the se'rum of the pig is different among
individuals (Miller, 1962). The influence of passive immunity on the
active antibody produced has been demonstrated in the comparison of
colostrum-deprived and colostrtnn-fed pigs in response to some of the
antigens (Hoerlein, 1957; Segre, 1962a, 1962b; Kaeherle, 1968; and
Kim, 1966). The colostrum-fed pig responded highly and rapidly to
the antigen. The pigs showed a higher response to a combine antigen
with serum from an older pig than that from a younger pig. This gave
evidence that a certain level of immunoglobulin may enhance the produc-
tion of the antibody (Segre, 1962a, 1962b). The immune-colostrum,
interfering with active antibody production in pigs, has been reported
by Hoerlein (1957) and Segre (l962a, 1962b). Their evidence suggested
a complicated maternal effect on the inmune response. The effect
was gradually reduced with age; the relative importance went from 25
percent of the total phenotypic variance on the 14th day after
injection, to zero on the 21st and 42nd day. Factors which operate to
reduce the importance of heredity in early stage of immunity development
are apparent.
Path coefficients for individual environment were notably constant
in variation among the three stages of immune response. This suggests

77
that environmental factors, other than those between litters, playa
similar role in the three stages of innnune'response.
Genetic control of the immune response has been demonstrated by
using chemically defined antigens with inbred animals, and immune
response genes have been proposed in the control of this particular
trait (Mores, 1972; Hildemann, 1973; Marx, 1976). Much evidence also
supports the mu1tigenic control of innnune response (Playfair , 1968;
Simonian, 1968; McDevitt, 1965; Gill, 1971; Eichmann, 1971; Merryman,
1975; Fournie, 1976; Steward, 1976 and Gherman, 1976). Selective
breeding for high and low innnune responder lines in mice to hetero1ogus
erythrocytes has shown that multiple genes are involved in controlling
this response (Biozzi, 1970; Feingold, 1976). Genetic control of the
innnune response to an optimal dose of BSA. at specific stages was
also shown in this present study. In the present study, the heritability
of immune response was found to be different between the two dose
levels of BSA.. No available studies can be used for comparison. The
variation of heritability between the three stages of immune response
was also showed in the study. C1aringbo1d and Sobey (1957) have
reported a large variation of heritability of immune response to sheep
red cells between the primary and secondary response. They have suggested
that the factors governing response to a primary dose are considerably
different from those governing response to a secondary dose. This view
supports the results of the present study. Another study on inheritance
of immune response to sheep red cells was conducted by Sobey and
Adams (1955) who found a variation of heritability between two stages
of primary response. Heritability estimates vary with different antigens

78
used (sang and Sobey, 1954: Sobey and Adams, 1961) and also with
different measurement methods employed (Sobey and Adams, 1961).
Unfortunately the series of studies of Sobey, et al , on inheritance of
immune response all used microorganisms or xenogenic erythrocytes
as antigen source. Battisto (1972) indicated that complex antigens
such as microorganisms or xenogenic erythrocytes tended to obscure
results and this was especially true when the test for antibody did
not differentiate sufficiently between multiple antigens on cell
surface. It should be emphasized that the phenotype of immune response
must be well-defined and the heritability must be estimated only for
that particular phenotype. In general, under an optimal dose and
suitable conditions, the innnune response to an antigen would be a
medium heritable trait according to results of this present study and
a realized heritability estimated by Biozzi (1970). The heritability
of immune response to 5 mg of BSA. was estimated by variance component
of sire, dam or sire and dam combined. The best estimate of heritability
was decided by the least standard error of each heritability. In the
primary response, the heritability estimated from dam component of
variance showed a overestimation, i.e. the value greater than 1.
There should be no dominant variance in the dam component because if it
exists then this dominant variance should also be present at the
secondary and peak response stages. Therefore, the overestimation
could be explained as being due to the large common maternal environment
variance involved. The estimation from sire variance component could
be the most precise estimation for primary response.
Because of maternal effects on the immune response, only the
secondary and peak responses showed significant differences in genetic

79
variance among sire groups. The heritability estimates determined
from these two stages may give a more reliable estimation than that
derived from the primary response. High genetic correlations were
found in these two stages of innnune response. This indicates that
genetic selection for secondary response will affect the peak
response. Since the variance components of litter environment for
these two stages were estimated to be zero, the litter environment
correlations could not be estimated. This result is expected since
the importance of litter environment during the immune development
decreases with age, especially after weaning.
As previously described, the large maternal effects were involved
in the variance between dams. If the immunoglobulin in each experi
mental pig serum could be detected before injecting the BSA, the
influence of passive immunity would be eliminated. But it was impossible
to do so with such a study involving a large number of animals.
Due to the complexity of influences on innnune response by various
environmental factors, one must attempt to minimize the variation of
environment by experiment design. However, for further similar studies
certain experimental steps have to be considered: (a) The experimental
animals should be of about the same age and have active antibody
production potency. It is also important to know that no passive
immunity interference exists in the animals. (b) The antigens used
should be pure and produce only one specific antibody. (c) The pheno
type would be defined as one in which immune response is under a
predetermined dose of an antigen at a specified time after immuniza
tion. Since immune response is strongly dependent on dose as shown in

i \ r I •••
80
the present study, it is important to find an optimum dose for the
best response for full genetic expressivity. (d) The suitable time
for testing may be chosen at a clearly specified phase of response.
It can be obtained by a preliminary trial on the kinetics of immune
response. (e) Immunization schedule should be standardized by using
the same injection routine. (f) The ant.igen-antibody reaction
should be measured by a method which is simple, reproducible and
accurate. (g) The results should be transformed by statistical
method to a valid scale.
The results of this study will not only enhance the understanding
of genetic and environmental effects on imnune respone, but can also
be used to assist the animal immunization program for animal health.
The genetic action model of this quantitative trait can be used as
a basis for selecting disease resistant animals (Biozzi, 1971).
Further breeding and selection of high imnune response animals will
decrease the mortality and/or morbidity rate among animals and result
in an increase in growth rate and a corresponding improvement in
animal production efficiency. Since it is dangerous and costly to
expose animals to pathogens for the purpose of selecting the disease
resistance in such large animals, the results of this study will
provide a means of detecting the propensity for disease resistance by
measuring immune response to harmless antigen.

81
In conclusion, the mu1tigenic control of immune response was
demonstrated in the present study.
The genetic and environmental component of var.iation among three
stages of immune response has been fully studied and partitioned into
three sources, i.e. genetic variance, litter or common maternal
environmental variance, and individual environmental variance. Genetic
control of immune response varied among doses and among stages of
immune response. Genetic importance was found in secondary and peak
responses, while the importance of common maternal environment was
only seen in primary response. A constant variation, of individual
environment was found among the three stages of immune response.
The heritability estimations for secondary and peak responses of
5 mg dose of BSA were found to be 0.51 and 0.40, respectively. Accord-
ing to this heritability, a genetic improvement of immune response would
be expected by selective breeding. Genetic correlations for primary
and secondary, primary and peak, and secondary and peak responses were
0.69, 0.55 and 0.72. Corresponding values for phenotypic correlations
were 0.59, 0.45 and 0.61; for individual environmental corre1ations~
corresponding values were 0.71, 0.49 and 0.64.
No interaction between dose and litter was found in the three
stages of immune response, although highly significant difference was
seen between doses and among litters.
High dose of BSA, 50 mg, has induced suppression in pigs. The 5 mg
dose of BSA would be an optimal dose for immunization in pigs.

82
160
150
14Q
130:
120
10
70
60
Free r131
20
40
50
30
80
160
Q,\ 110.j.J
~attCJf
.j.J
go
x10,OOO
° 1 2 3 4 5 6 7 8 9 10 11 12 13 14 15 16
~pendix 1. Sepal:'ation of r:131...BSA and free r13J..lif.;,~
!i1tl:'ation with a column of Sephadex G-75

REFERENCES CITED
Adler, F. L. 1964. Competition of antigen. Prog. Allergy 8:41-73.
Allansmith, M., B. McClellan and M. Butterworth. 1969. The influenceof heredity and environment on human immunoglobumin level. J.Immunol. 102:1504.
Allen, W. D. and P. Porter. 1973. The relative distribution of IgM andIgA cells in intestinal mucosa and lymphoid tissues of the youngunweaned pig and their significance in ontogenesis of secretoryimmunity. Immunol. 24:493-501.
Arbeter, A., et ale 1971. Nutrition and infection. Fedn. Proc. 30:1421-1428.
Axelrod, H. E. 1971. Immune response in vitamin deficiency states.Am. J. C1in. Nutr. 24:1-35.
Baggs, B. B. ~d S. A. Miller. 1973. Nutritional iron deficiency asa determinant of host resistance in the rat. J. Nutr. 103:1554-1560.
Batchelor, J. R. 1971. Hormonal control of antibody formation, inCinader, B. (ed) , Regulation of the antibody response. Thomas, Ill.276 pp.
Battisto, J. R. and F. Lilly. 1972. Heriditary aspects of the capacityto respond immunologically, in Borek, F. (ed). Immunogenicity,Holden-Day. . 302-333.
Beck, W. A. 1967. Manual of procedures in quantitative genetics.Washington State Univ. 3rd ed. 19 pp.
Biozzi, G., C. Stiffed and D. Mouton. 1969. Genetic selection forantibody product.Lon in mice, in Peeters, H. (ed) . Protides of theBiological Fluide. Pergamon Press, Oxford. 161 pp.
_____, and 1970. Serum concentrations andal10types of immunoglobumins in two line mice genetically selectedfor "high" and "low" antibody synthesis. J. Exp. Med. 132:752-764.
_____, and 1~7l. Genetic regulation of thefunction of antibody producing cell. in Amos, B. (ed) , Progress inImmunology. Academic Press, New York. 529 pp.
__~~_, and 1971. Incidence of Benzopyrene-Induced tumors in lines of mice genetically selected for "high" and"low" antibody production. Transplantation Proceeding. 3 :1333-1334.
____~ and 1972. Cytodynamics of the immuneresponse in two lines of mice genetically selected for "high" and"low" antibody synthesis. J. Exp. Med. 135:1071-1094.

84
Bourne, F. J. 1976. Humoral iunnunity in pig. Vet. Rec. 98:499-501.
Boyden, S. V. 1951. The adsorption of proteins an erythrocytes treatedwith tannic acid and subsequent hemagglutination by antiproteinsera. J. Exp. Med. 93:107-120.
Brambell, F. W. R. 1970. The transmiss of passive immunity from motherto young. North-Holland, Amsterdam, London. 166 pp.
Brown, H. V., C. Speer, et al. 1961. Studies on colostrum acquiredimmunity and active antibody production in baby pigs. J. Anim. Sci.20:323-330.
_____ and F. J. Bourne. 1976. Distributions of immunoglobulincontaining cells in alimentary tract, spleen and mesentic lymph nodeof the pig demonstrated by peroxidase - conjugated antiserums toporcine immunoglobulins G, A and M. Am. J. Vet. Res. 37:9-13.
Buckley, C. E. III, E. G. Buckley and F. Dorsey. 1974. Longitudinalchanges in serum immunoglobulin levels in older humans. Fed.Proc. 33:2036-2039.
Buschmann, H., et a l., 1972. Variation of the iDDIlune response to sheeperythrocytes in several strains of mice and their crosses. Med.Microbio1 Immunol. 158:71-82.
______, __• 1974. A study of the immune response to sheeperythrocytes in several breeds of swine. Med. Microbiol. Immunol.159:179-190.
_______~, 1975. Studies on the immune response to DNPhapten in different breeds of pigs. Genetics Abstr. 7:70. No. 7G9679.
Buterworth, M., B. McClellan and M. Allansmith. 1967. Influence of sexon iDDIlunoglobu1in levels. Nature, Lond. 214:1224-1225.
Chard, T., et al. 1970. The development of a radioimmunoassay foroxytocin: Radfododdnatdon , antibody production and separationtechniques. J. Endocr. 46:269-278.
____, M. Martin and J. Landon. 1970. The separation of antibodybound from free peptides using ammonium sulfite and ethanol. InKirkham, K. E. and W. M. Hunter~ (eds). Radioiunnunoassay methods.257 pp.
Claringbold, P. J., W. R. Sobey and K. M. Adams. 1957. Inheritance ofantibody response III. Heritability of response to sheep red cells.Aust. J. BioI. Sci. 10:367-373.
Cook, R. A. and A. Vander Veer. 1916. Human sensitization. J. Immunol.1:201-305.
Cremer, N. E. 1963. Competition of soluble antigens by tissue cultureassay. J. Immunol. 90:685-696.

85
Curtis, J. and F. J. Bourne. 1973. Half-lives of immunoglobulins IgG,IgA. and IgM in the serum of newborn pigs. Inmuno1. 24:147-155.
Dent, P. B.Viro1.
1972. Immunodepression by oncogenic viruses.14:1-35.
Prog. Med.
Dickerson, G. C. 1959. Techniques for research in quantitative animalgenetics. In Techniques and Procedures in Animal ProductionResearch, pp 57-105. Amer. Soc. Anim. Sci., New York.
Dougherty, T. F.Physio. Rev.
1952. Effect of hormones on lymphatic tissue.32:379-401.
Eiclnnann, K., D. G. Braun and R. M. Krause. 1971. Influence of geneticfactors on the magnitude and the heterogeneity of the innnuneresponse in the rabbit. J. Exp. Mad. 134:48-65.
Eidinger, O. and T. J. Garrett. 1972. Studies of the regulatory effectsof the sex hormones on antibody formation and stem cell differentiation. J. Exp. Med. 136:1098-1116.
Eisen, H. N. and G. W. Siskind. 1964. Variations in affinities ofantibodies during the immune response. Biochemistry. 3:996-1008.
Fahey, J. L. and E. M. Mckelvey. 1965. Quantitative determination ofserum i-munog1obulins in antibody agar plates. J. I1JIIlunol. 94:84-90.
Farr, R. S. 1958. A quantitative innnunochemical measure of the primaryinteraction between I131_BSA and antibody. J. Infect. Dis. 103:239-262.
Fournie, G. J., D. H. Lambert and P. A. Miescher. 1976. Features ofthe immune response to DNA in mice. I. Genetic control. Clin.Exp. Innnunol. 26:46-51.
Gates, C. E. and C. J. Shiue. 1962.stage hierarchal classification.
The analysis of variance of the SBiometrics. 18:529-536.
Gherman, M. and A. Su1ica. 1976. Genetic control of humoral innnuneresponse to bovine gamma globulin. Genetic Abstracts. 8:73.
Gill, T. J. 1965. Studies on synthetic polypeptide antigens, XII.Variations in antibody production among rabbits of different inbredstrains. J. Innnunol. 95 :542-545.
__-==-_~.. 1970. Genetic and cellular factors in the immune response.I. Genetic control of the antibody response to poly G1n52 Lys::S::STyr15 in the inbred rat strains ACI and F 344, J. Inmuno1. 105:14-28.
__~__ and H. W. Kunz. 1971. Genetic and cellular factors in theimmune response. II. Evidences for the polygenic control of theantibody response from further breeding studies and from pedigreeanalysis. J. I1JIIluno1. 16 :980-992.

86
Graber, P. 1957. Agar- gel diffusion and iunnuno-e1ectrophoreticanalysis. Ann. N. Y. Acad. Sci. 69:591.
Green, I. and B. Benacerraf. 1969. The effect of the amount of mycobmycobacterial adjuvants on the innnune response of strain 2, strain13 and Hartley strain guinea pigs to DNP-pLL and DNP-G1. ;I.Immuno1. 103:403-412.
____ and 19710 Genetic control of innnune responsive-ness to limiting doses of proteins and hapten protein conjugatesin guinea pids. J. Immuno1. 107:374-381.
Greenwood, F o C., W. M., W. M. Hunter and J. S. Glover. 1963.preparation of I13.L-labelled human growth hormone of highspecific radioactivity. Biochem. J. 89:114-123.
The
Guercio, P. O. and H. Zola. 1972. A comparison on the immune responseto DNP in mice genetically selected for high or low antibodysynthesis. Immunochemistry. 9:769-778.
Harmon, B. G., et a l , 1963. Relationship of specific nutritientdeficiences to antibody production in swine. I. Vitamin A.J. Nutr. 79:263-268.
Harvey, W. R.numers.
1960. Least-squares analysis of data with unequal subclassARS 20-8, USDA..
Heidelberger, M. and F. E. Kendall, et al , 1934. Quantitative studieson the precitin reaction. J. Exp. Med. 59:519-526.
Hi1demann, W. H. 1966. A11oantibody production measured by plaqueassay in relation to strong and weak histoincompatibi1ity.· J.Exp. Med. 124:885-899.
1970. Immunogenetics, Holden-Day, p. 39.
1973. Genetics of immune responsiveness. Ann. Rev.of Genet. 7:19-36.
Hoer1ein, A. B. 1957. The influence of colostrum on antibody responsein baby pigs. J. Immuno1. 78:112-117.
Hudson, R. J. 1973b. Reduced immunological responsiveness in parasiticinfectious. Adv. Vet. Sci. 17:87-117.
___~_, H. S. Saben and D. Emslie. 1974. Physiological andenvironmental influences on immunity. Vet. Bull. 44:119-127.
Hurn, P. A. L. and J. Landon. 1970. Antisera for radioimmunoassay. InKirkham, K. E. and W. M. Hunter. (eds). Radioimmunoassay methods,Edinburgh and London, Eand S Livingstone. 63 pp.
87
Jakobser, P. E. and J. Moustgaard. 1950. Investigations of the serumproteins in pigs from birth to maturity. Nord. Vet. Med. 2:812-824.
James, K., D. M. Pullar and V. S. James. 1969. Strain variations inthe primary humoral response of rats and its susceptibility toinhibition by antilymphocytic antibody. Nature 222:886-888.
Jones, J. M., et al. 1976. Kinetics of the antibody response to typeIII Pneumococcal polysaccharide (SSS-III). J. Immunol. 116:41-51.
Jormalainen, S., E. Mozes and M. Sela. 1975. Genetic control ofimmune response. The dose of antigen given in aqueous solutionis critical in determining which mouse strain is high responderto poly(LTr, LGln)-poly(LPro)-poly(LLys). J. Exp. Med. 14:10571072.
Jurin, M. and J. F. Tannock.immunological response.
1972. Influence of vitamin A onImmunol. 23:283-287.
J.<abat, E. V. 1968. Structural concepts in immunology and immunochemistry. 20 pp. Holt, Rinehart and Winston, Inc.
J.<aeberle, M. L. 1968. Colostrum and innnunologic canpetence. ~.
Bull. 38:695. Abstr.
J.<atz, F. E. and M. W. Steward. 1975. The genetic control of antibodyaffinity in mice. Immunol. 29:543-548.
Kenney, M. A., J. L. Mayee and F. Piedad-pascual. 1970. Dietaryamino acid and innnune response in rats. J. Nutr. 100:1063-1072.
Kim, Y. B., S. G. Bradley and D. W. Watson. 1964. Development ofimmunoglobulin in germfree and conventional colostrum-deprivedpiglets. Fed. Proc. 23:346. Abstr.
__~_, and 1966a. Ontogeny of theimmune response. I. Development of immunoglobulins in germfreeand conventional colostrum-deprived pilets. J. Immuno1. 97:52-63.
_____, and ~-~
immune response. II. Characterizationimmunoglobulins in the true primary andpiglets. d. Immuno1. 97:189-196.
1966b. Ontogeny of theof 19S rG and 7S rGsecondary response in
Kumar, M. and A. E. Axelrod.scorbutic guinea pigs.
1969. Circulating antibody formation inJ. Nutr. 98:41-44.
Kunz, H. W., T. J. III. Gill and J. M. Corson. 1974. Effects of ageand genetic background on the antibody response in inbred rats.Gerontologic 20:88-101.
88
Levine, B. B., A. Ojeda and B. Benacerraf. 1963. Studies on artificialantigens III. The genetic control of the immune response tohapten-poly-lysine conjugates in guinea pigs. J. Exp. Med.118:953-957.
Makinodan, T., E. H. Perkins and M. G. Chen. 1972. ItID1lunologicactivity of the aged. Adv. in Gerontological Research.3:171-179.
Mancini, G. and A. D. Carbonara. 1965. ItIDIlUnochemical quantitativeof antigens by single radial itlD1lunodiffusion. Immunochem.2:235-254.
Marra, J. R. 1963. Sensitivity and specificity of methods ofdetecting antibodies. Brit. Med. Bull. 19:178-182.
Mathews, J. D., S. Whittingham and et a1. 1972. Protein supplementation and enhanced antibody-producing capacity in new guineanschool-children. Lancet. 11:675-677.
Maures, P. H., C. F. Merryman and J. Jones. 1974. Multigenic cc:mtrolof immune respggse of inbred mice ag~inst the terpolymerspoly(Glu57 Lys Ala5) and poly(Qlu54 Lys36 Ala l O) and linkagewith H-2 haplotype. Immunogenetic 1:398-406.
McDevitt, H. O. and M. Sela. 1967. Genetic control of the antibodyresponse II. Further analysis of the specificity of determinespecific control and genetic analysis of the response to (H,G)A-L in CBA and C57 mice. J. Exp. Med. 126:969-978.
McFarlane, H., et al. 1971.malnutrition. Lancet.
Cell-mediated immunity in protein-caloric11:1146-1147.
Merryman, C. F., P. H. Maurer and J. H. Stimpfling. 1975. Unigenicand multigenic. 1. Region control of the immune responsesof mice to the GATlO and GLO-GLT. Terpolymer, Immunogenetics.2:441-448.
Mi, M. P., S. M. Onizuka and J. C. Wong. 1977. Computer programs forstatistical analysis of biomedical data. Technical Report No.5.Data and Computation Unit, Cancer Center of Hawaii.
Miller, E. R., et al. 1962. Antibody aborption, retention and production by the baby pig. J. Ani. Sci. 21:309-314.
Minden, P. and R. S. Farr. 1965. A comparison of some commonly usedmethods for detecting antibodies to bovine albumin in humanserum. J. Immunol. 96:180-187.
__~__ and 1969. A comparison of seven procedures todetect the primary binding of antigen by antibosy. J. Immunol.102:832-841.
89
Mitchison, N. A. 1968. The dosage requirements for immunologicalparalysis by soluble proteins. Immunol. 15 :309-530.
__-:-_-::--__, et a L, 1975. The relative ability of T and Blymphocytes to protein antigen. In Proceedings of the ThirdSigrid Juselius Symposium, Helsinki, New York, Academic Press.249-260.
of antigen.87-111.
Marx, J. L. 1976.191:277-191.
1972. Dose, frequency and route of administrationIn Borek, F. (ed). Inmunogenicity, North-Holland
Immunology: Role of immune response genes, Science.
Mozes, E. and G. M. Shearer. 1972. Genetic control of immuneresponses. Current Topic in Microbiology and Inmunology.59:167-200.
Myers, W. L. and D. Segre. 1963. The immunologic behavior of babypigs. III. Transplacental transfer of antibody globulin inswine. J. Immunol. 91:697-700.
Nalder, B. N. 1972. Sensitivity of the immunological response to thenutritional status of rats. J. Nutr. 102:535-541.
Nicol, T. and D. L. J. Bilbey. 1960. The effects of various steriodson the phagocytic activity of the retivuloendothelial system.In Heller, J. H. (ed) 301-320. Rticuloendothelial Structureand Function. 301-320.
Nordbring, F. and B. Olsson. 1957. Electrophoretic and immunologicalstudies on sera of young pigs. I. Influence of ingestion ofcolostrum on protein pattern and antibody titer in sera fromsuckling pigs and the changes throughout laction. Acta. Soc.Med. Upselien. 62:193-198.
Nordin, A. A. and T. Makinodan. 1974. Humoral immunity in aging.Fed. Proc. 33:2033-2035.
Nossal, G. J. V., et a L, 1965. Antigens in immunity VII. Analysisof Immunological memory, Immuno1. 9:333-345.
Oakes, D. D., J. Shuster and P. Gold. 1972. Radioimmunoassay foral-Fetoprotein in the serum of rats, Cancer Research 32:2753-2760.
Oakly, C. L. and A. J. Fulthorps. 1953. Antigenic analysis by diffusion.J. Path. Bact. 65:49-60.
Ochterlony, O. 1948. In vitro method for testing the toxin producingcapacity of diphtheria bacteria. Acta Path. Microbial. Scand ,25:186-1990

90
OchterIony , O. 1964. Ge1-diffusion techniques, in Ackroyed, J. F.(ed). Immunological Methods, Philadelphia, F. A. Davis, 55 pp.
Oudin, J. 1951. In Coh, M. (ed).Yearbook, Chicago, Illinois.
Methods in Medical Research.5:355-366.
Perry, G. C. and J. H. Watson. 1967a. Sources of variation in theuptake of a marker antibody by piglets. Ani. Prod. 9:337-384.
___---,_ and 1967b. Variation in the absorption ofa co10stra11y secreted marker antibody in piglets. Ani. Prod.9:385-391.
P1ayfair, J. H. L. 1968. Strain differences in the immune responseof mice 1. The neonatal response to sheep red cells, Immuno!.15:35-50.
Porter, P. 1969. Transfer of immunoglobulins IgG, IgA and IgM to1acta1 secretion in the partarient sow and their absorption bythe neonatal piglet. Biochem. Biopbys. Acta. 181:381-392.
Prouvost-Danon, A., C. Stiffe1, D. Danton and G. Biozzi. 1971.Anaphylactic antibodies in mice genetically selected for antibodyproduction. Immuno1. 20:25-27.
Radovick, J. and D. W. Talmage. 1967. Antigen competition: cellularor humoral. Science, N. Y. 158t512.
Ram, J. S. 1967. Aging and immunological phenomena. A review.J. Geront. 22:92-107.
Rathbun, W. E. and W. H. Hi1demann. 1970. Genetic control of theantibody response to simple haptens in congenic strains of mice.J. Inmuno1. 105:98-107.
Roberts, D. H. 1972. Inhibition of 1ymphcyte transformation inducedby phytohaemaggutinin with procine mycoplasma. Br. Vet. J.128:585-590.
Rook, J. A. F., J. Moustgaard and P. E. Jakobsen. 1951. Anelectrophoretic study of the changes in the serum proteins ofthe pig from birth to maturity. Roy. Vet. and Agr. Coll.Copenhagen, Denmark. Yearbook.
Rose, J. E. M. and B. H. Sabiston. 1971. Effect of cold exposureon the immunologic response of rabbits to human serum albumin.J. Immuno1. 107:339-343.
Sang, J. H. and W. R. Sobey. 1954.antigenic stimuli. J. Immuno1.
Genetic control of response to72:52-56.
Scheibel, I. F. 1943. Hereditary differences in the capacity ofguinea pigs for produetion of diphtheria antitoxin. Acta Path.Microbio1. Seand, 20 :464-484.

91
Segre, D. and M. L. Kaeberle. 1962a. The immunologic behavior ofbaby pigs.1. Production of antibodies in three week old pigs.J. Immunol. 89:782-789.
__...,..-~ and _~~---=~-:-_ 1962a. The immunologic behavior ofbaby pigs. II. Production of antibodies in newborn pigs.J. Immunol. 89:790-793.
1966. Swine in immunologic research, in Bustad, L. K.(ed), Swine in Biomedical Research. Battelle Mem. Inst. PacificNorthwest Lab., Richland, Washington. P. 263-272.
Simonian, S. J., Gill and S. N. Gershoff. 1968. Studies on syntheticpolypeptide antigens. XX. Genetic control of the antibodyresponse in the rat to structurally different synthetic polypeptideantigens. J. Immuno1. 101:730-742.
Siskind, G. W., P. Dann and J.G. Walker. 1968. Studies on thecontrol of antibody synthesis. II. Effect of antigen affinityof antibody synthesized. J. Exp. Med. 127 :55-66.
Sloan, B. and T. J. Bill. 1972. Genetic and cellar factors in theresponse. IV. The effect of aggregation on antibody formationand on delay hypersensitivity in the inbred ACI and F444 strainsof the rats. J. Immunol. 108:26-33.
Smith, A. M. 1976. The effects of age on the immune response toTyeIII Pneumococcal polysaccharide (SIll) and bacteriallipopolysaccharide (LPS) in BALB/C, SJL/J, and C3H mice.J. Immunol. 116:469-474.
Smythe, P. M., et a L, 1971. Thymolympbatic deficiency and depressionof cell-mediated immunity in protein-caloric malnutrition.Lancet. 11:939-944.
Snedecor, G. W. -1967. Statistical methods. Sixth ed , Iowa State.
Sobey, W. R. 1954. The inheritance of antibody response to TobaccoMosaic virus in rabbits. Aust. J. BioI. Sci. 7:111-117.
_____ and K. M. Adams. 1955. Inheritance of antibody response.I. Sheep red cells. Aust. J. BioI. Sci. 3:603-614.
_ ..........._- and 1961. Inheritance of antibody response.IV. Heritability of response to the antigen of RhizobiumMe1i1oti and two strains of influenza virus! Aust. J. BioI. Sci.14:588-593.
Solomon, G. F. 1969b. Stress and antibody response in rats. Int.Archs. Allergy App1. Immunol. 35 :97-104.
Speer, V. C., et a1.the young pig.
1959. The cessation of antibody absorption inJ. lnununo1. 83:632-634.

92
Stavitsky, A. B. 1964. Haemagg1utination and haemagg1utinationinhibition reactions with tannic acid and bisdiazatized benzidineprotein conjugated erythrocytes. In Ackroyed, F. A. (ed) ,Immunological Methods. Philadelphia, F. A. Davis. 363 pp.
Steiner, L. A. 1967. The relative affinity of antibodies SYnthesizedin the secondary response o J. Exp. Med. 126:1185-1205.
Steward, M. W. and R. Eo Pettyo 1976. Evidence for the geneticcontrol of antibody affinity from breeding studies with inbredmouse strain producing high and low affinity antibody.Immuno1. 30:789-798.
Talmage, D. W. 1960. The kinetics of the reaction between antibodyand bovine serum albumin. J. Infect. Dis. 107:115-132.
Terres, G., S. L. Morrison and G. S. Habicht. 1968. A quantitativedifference in the immune response between made and female mice.Froc. Soc. Exp. Bio1. Med. 127:664-667.
Top, F. H. 1964. Environment in relation to infectious disease.Arch. Envir. H1th. 9:699-723.
Uhr, J. W. and M. S. Finkelstein. 1967. The kinetics of antibodyformation. Prog. Allergy. 10 :37-83.
Weigle, W. O. 1961. Imnunochemica1 properties of the cross-reactionsbetween anti-BSA. and htero1ogus a'lbumfna, J. Inmuno1. 87 :599-607.
Wei, M. M. and A. B. Stavitsky. 1967. Molecular formus of rabbitantibody synthesized during the primary response to human albumin.Immuno1. 12:431-444.
White, A. and A. Goldstein. 1972.immunity. In Borek, F. (ed).334 pp.
Hormonal regulation of hostInmunogenicity, North-Holland.
Wright, S. 1934. The method of path coefficient. Ann. Meth. Statist.3:161-215.