universiti putra malaysia integration and pricing ... filekajian ini menehti prestasi pasaran beras...
TRANSCRIPT
UNIVERSITI PUTRA MALAYSIA
INTEGRATION AND PRICING EFFICIENCY OF RICE MARKET
BISHWA BANDHU RAJ SINGH
FEP 1999 5
INTEGRATION AND PRICING EFFICIENCY OF RICE MARKET IN NEPAL
By
BISHWA BAND"l) RAJ SINGH
Dissertation Submitted in Fulfilment of Requirements for the Degree of Doctor of Philosophy in the Faculty of Economics and Management
llniversiti Putra Malaysia
Decem ber 1999

DEDICATION
To my parents,
Shree Indra Raj Singh &
Shreemati Ram Devi
11

Abstract of thesIs presented to the Senate of Umversltl Putra MalaysIa 10 fulfilment of reqUIrements for the deh'Tee of Doctor of PhIlosophy
INTEGRATION AND PRICING EFFICIENCY OF RICE MARKET IN NEPAL
By
BISHW A BANDHU RAJ SINGH
Decem ber 1999
Chairperson: Professor Fatimah Mohd. Arshad, Ph.D.
Faculty: Economics and Management
ThIS study InvestIgated perfonnance of nce market m Nepal by analysmg
mterdependence of pnces (market IntegratlOn) and efficIency of arbItrage (pncIng
efficIency) among the reglOnal wholesale markets
An Integrated approach to the analYSIS of performance of the market system was
adopted The cO lntegratlOn-based Johansen's Vector Error CorrectIOn Model
(VECM) was used for analYSIS of nature of mterdependence of pnces In the regional
markets to lOfer on IntehTfatlOn of the market system The frontter-functlOn-based
SWltchmg RegImes Model (SRM) was used to evaluate efficIency of arbitrage
between market regIOns related 10 dIrect trade to Infer on pncmg effiCiency of the
market system The analYSIS results for market IntegratIOn and pncIng effiCiency
were mterpreted In relatIOn to the structural and behaVIOural charactenstlcs of the
market system bemg Investigated through the rapid appraisal market survey
III

The evaluatlOn of results from estlmatlon of the VECM lend support to the
hypothesIs that reglOnal markets for nce m Nepal are mtegrated to fonn a smgle
market area WIth Kathmandu as the central market Pnce shocks m the central
market gets qUIckly transmitted to the regional markets However, the results from
estlmatlon of the SRM for the five market paIrs provIded statIstical eVldence of
vlOlatlOn of effiCIent arbItrage condltlOns ThIs supports the hypothesIs that the
mtegrated nce market m the country IS not efficient m arbItrage sense ConslderatlOn
of behavIOural charactenstIcs of the market mdicated ineffiCIent IntegratlOn of the
market regIOns could be due to lack of adequate instItutIonal Infrastructure m the
market that provIded the large mIllers and traders to enJoy some degree of market
power
The study indIcates that phYSical faclhtJes In the market are necessary for mteb'TatIOn
of the market, but these alone are not sufficient for a market system to be effiCient
With expansIOn of the market through economic integratIOn, need for proVISIOn of
appropnate institutional Infrastructure In the form of public and private order
instItutIOns anses The government needs to play a crUCIal role m provldmg
institutIOnal mfrastructures to make the market more competItive, effiCIent and
eqUItable
IV

Abstrak tesis yang dikemukakan kepada Senat Universiti Putra Malaysia sebagai mernenuhi keperluan untuk ijazah Doktor Falsafah
INTEGRASI DAN KECEKAPAN MELETAK HARGA PASARAN BERAS DI NEPAL
Oleh
BISHW A BANDHlJ RAJ SINGH
Disember 1999
Pengerusi: Profesor Fatimab Mobd. Arsbad, Pb.D.
Fakulti: Ekonomi dan Pengurusan
Kajian ini menehti prestasi pasaran beras di Nepal daripada segi saling
pergantungan antara harga (integrasi pasaran) dan kecekapan arbitraj (kecekapan
letak harga) di dalam pasaran borong tempatan.
Pendekatan integrasi telah digunakan ke atas anal isis prestasi slstem pemasaran.
Model Pernbetulan Ralat Vector Johansen yang berlandaskan kointegrasi (atau
Vee/or [�'rror CorrectIOn Model (VECM) ) telah diterirna pakai untuk menganalisis
pola saling pergantungan harga di pasaran tcmpatan untuk mencapal rurnusan
tentang integrasi sistem pemasaran. Model Regim Alihan (atau SWltchmg RegImes
Model (SRM) ) yang berlandaskan kepada fungsi sempadan telah digunakan untuk
mcnilai kecekapan arbitraj antara pasaran tempatan yang terlibat dalam perdagangan
untuk merumus kecekapan harga sistem pcmasaran. Penemuan daripada anailsls
intcl,rrasi pasaran dan kccekapan harga tclah ditakrifkan mengambil kira ciri struktur
dan gelagat sistem pasaran yang ditchti mclalui kajiscJidik penilaian pasaran pintas.
v

Penelitian penemuan anggaran daripada model VECM menyokong hipotesis bahawa
pasaran beras tempatan adalah berintegrasi sehingga terbentuk satu kawasan pasaran
di mana Kathmandu sebagai pasaran pusat. Kejutan harga dalam pasaran pusat akan
disalurkan dengan pantas ke pasaran tempatan. Bagaimanapun, penemuan anggaran
SRM bagi kelima-lima pasangan pasaran memberi bukti statistik bahawa syarat
kecekapan arbitraj tidak diakuri. Penemuan ini menyokong hipotesis bahawa
pasaran beras adalah tidak cekap dari segi arbitraj. Mengambilkira ciri-ciri gelagat
pasaran (yang dikumpul melalui kajiselidik penilaian pintas), didapati bahawa
ketidakcekapan integrasi pasaran tempatan adalah disebabkan oleh kekurangan
institusi infrastruktur yang disediakan oleh pengilang dan peniaga besar yang
memiliki kuasa pasaran.
Kajian ini menyarankan bahawa kemudahan fizikal dalam pasaran adalah penting ke
arah pasaran yang berintegrasi. Namun situasi ini masih tidak mencukupi untuk
mewujudkan pasaran yang cekap. Pasaran yang berkembang melalui integrasi
ekonomi memerlukan infrastruktur institusi seperti institusi awam dan swasta.
Kerajaan perlu memainkan peranan yang penting da}am menyediakan infrastruktur
institusi untuk mcwujudkan pasaran yang bersaing, cekap dan saksama.
VI

ACKNOWLEDGEMENTS
I express smcere appreclatlOn and deep sense of gratitude to my Malor Supervisor
Professor Dr Fatlmah Mohd Arshad for her mvaluable gmdance, support and
encouragement throughout the course of the thesIs research Grateful apprecmtlOn IS
extended to the adVISOry commIttee members Assoc Prof Dr Ahmed Zubaldl
Baharumshah, Assoc Prof Dr Mad NasH Shamsudm and Dr Tan HUl Boon for
thelf Invaluable support, suggestIons and cntJCIsms at vanous stages of thIS study
I am grateful to the Wmrock InternatlOnal for sponsonng my doctoral studIes at
UmversIty Putra MalaYSIa SIncere apprecIatIon IS extended to Ms Rose BautIsta and
Ms Vlctona SebastIan for theIr effiCIent management of my scholarshIp programme
Smcere gratitude IS extended to the Agncultural Projects ServIces Centre,
Kathmandu for grantmg me study leave
Thanks are extended to Mr Sapta Man BaJracharya and Mr Nagendra Amatya from
Nepal Rastra Bank, Mr Sanu Ratna Sthaplt from Nepal Food CorporatlOn, and Mr
Pralhad Paudel, Mr Han Babu Tlwan and Mr Sukra Raj Mathema from
AgrIcultural MarketIng DIVISIOn, for provldmg me valuable data
SpeCIal thanks are extended to the mIllers, traders and offiCIals WIth whom 1
conducted mtervlew dISCUSSIon, for provldmg me valuable mformatlOn on workmg�
VII

of the rice marketing system. I am thankful to the Morang Merchants' Association
for allowing me to use their price records
Sincere thanks are due to Ms Jean Saludadez for going through the draft and
suggesting some grammatical corrections.
Finally, I am very much grateful to my parents for their blessings, to my brothers
and sisters for their moral support, to my wife Pramila for her sacrifices,
understanding and encouragement, and to my son Bivek and daughter Pallavi for
being constant source of inspiration during my stay in Malaysia.
VIII

I certIfy that an ExammatlOn CommIttee met on 22 December, 1999 to conduct the final exammatlon of BIshwa Bandhu Raj Smgh on hIs Doctor of PhIlosophy theSIS entItled "IntegratIOn and Pncmg EffiCIency of RIce Market In Nepal" In accordance wIth Umversltl Pertaman MalaYSIa (HIgher Degree) Act 1980 and Umversltl Pertaman MalaYSIa (HIgher Degree) RegulatIOns 1981 The CommIttee recommends that the candIdate be awarded the relevant degree Members of the ExammatIOn are as follows
FA TIMAH MOHD. ARSHAD, Ph.D. Professor Faculty of EconomIcs and Management Umversltl Putra MalaYSIa ( ChaIrperson)
MAD NASIR SHAMSUDIN, Ph.D. ASSOcIate ProfessorlHead Department of Agrtbusmess and Infonnatlon System Faculty of AgrIculture UmversItI Putra MalaYSIa (Member)
AHMAD ZUBAIDI BAHARUMSHAH, Ph.D. AssocIate Professor Faculty of EconomIcs and Management Umversltl Putra MalaYSIa (Member)
TAN HlJl BOON, Ph.D. Faculty of EconomIcs and Management UmversltJ Putra MalaYSIa (Member)
JAMAL OTHMAN, Ph.D. Associate Professor Department of AgrIcultural and Resource EconomJc� Umversltl Kebangsaan MalaYSIa (External Exammer)
--------��----------------------------
MOHD. HAZALJ MOHA YIDIN, Ph.D. Professor/Deputy Dean of Graduate School Umversltl Putra MalaYSia
Date 3 1 DEC 1999 IX

This thesis was submitted to the Senate of Universiti Putra Malaysia and was accepted as fulfilment of the requirements for the degree of Doctor of Philosophy.
--��---KAMIS AWANG, Ph.D. Associate ProfessorlDean of Graduate School Universiti Putra Malaysia
Date: � 4 JAN 2CC�
x

DECLARA TION
I hereby declare that the thesis is based on my original work except for quotations
and citations that have been duly acknowledged. I also declare that it has not been
previously or concurrently submitted for any other degree at UPM or other
institutions.
Bishwa Bandhu Raj Singh
Date: so., 1. . 9 9
XI

TABLE OF CONTENTS
DEDICATION ABSTRACT ABSTRAK ACKNOWLEDGEMENTS APPROV AL SHEETS DECLARATION FORM LIST OF TABLES LIST OF FIGURES LIST OF ABBREVIATIONS
CHAPTER
INTRODUCTION Countr y Background
RIce ProductIOn and Supply SItuatIon Open Border and the Large IndIan Market RIce Market10g System 10 Early 1980s Government InterventIOn m the RIce Market
Statement of the Problem ObjectIves of the Study SIf:,TJ1lficance of the Study OrgamsatIOn of the DIssertatIOn
11 MARKET INTEGRATION AND PRICING EfFICIENCY THE THEORETICAL FRAMEWORK IntroductIOn Theory of SpatIal Pnce RelatIonshIp Market IntegratIOn and Pncmg EffiCIency
Market Inte!:,'fatlOn Pnc10g EffiCIency
The SCP Approach TradItional SCP Approach CntJclsms of TradItIOnal SCP Approach General SCP Approach
Determmants of Market Competitiveness Degree of Market ConcentratIOn Threat of Entry and SubstitutIOn Extent of Vertlcal lnte!:,'fatIOn Adequacy of InstJtutlOnallnfrastructure
XII
Page
11
111
V Vll IX
XI xv
XVI
XVll
1 3 9
11 13 17 22 22 24
26 28 31 32 34 36 38 39 43 45 46 48 50 51

Summary 53
111 REVIEW OF METHODS OF MEASUREMENT OF MARKET INTEGRATION AND PRICING EFFICIENCY IntroductIon 55
ConventIOnal Methods of Market IntegratIOn Analysts 56
CorrelatIOn CoeffiCIents 56
CausalIty Tests 57
Ravalhon Model 59
ComtegratlOn based Methods of Market Integratton AnalYSIS 62
IntroductIOn 62 Engle-Granger's Error CorrectIOn Model 65
Johansen's Vector Error CorrectIOn Model 67 SWltchmg Regtmes Model for AnalysIs of Pncmg EfficIency 72
IntroductIon 72 Stochasttc Frontter Function 74 SpIller-Huang Model 75
Sexton-Klmg-Carman Model 77
Baulch's Panty Bounds Model 79
EvaluatIOn of Alternate SpeCIficatIOns m SRM 80
Summary 83
IV METHODOLOGY IntroductIOn 85
Market Centre and Study Penod 85
Hypotheses 88
Data and Data CollectIOn 89 CollectIOn of Pnce Data 90 RapId AppraIsal Market Survey 92
Data AnalYSIS Procedure 94 Structure and Conduct of the Market 95 Market Integration 96
Pncmg EfficIency 98 Summary 102
V MARKETING AND PRICING PROCESS IntroductIOn 103 The RIce Marketmg System 104
Marketmg Channels 104 Government InterventIOn and Regulations 108
RIce Marketing In Taral Markets 112 RIce MIlls 112 Paddy TradIng In Taral Markets 116 RIce Supply from Ta ra! MarJ..ets 120 Tradmg and Pncmg P rocess 122
XIII

RIce Marketmg m Kathmandu Market Supply of RIce m Kathmandu Market Tradmg PractIces and Pncmg
Summary
VI ANAL YSIS OF MARKET INTEGRATION AND PRICING EFFICIENCY Introductton DescnptlOn of the Data
Graph and Summary StatIstICS CorrelatIon CoeffiCIents of the Pnce Senes StatlOnanty of the Pnce Senes
AnalysIs of IntegratIOn of the RIce Market The Model and SpecIficatIOn ComtegratlOn and the Error CorrectIOn Terms Market IntegratIon Results and DIscussIon
AnalYSIS ofPncmg EffiCIency of the RIce Market The Model and SpecIficatIOn Pncmg EffiCIency Results and DISCUSSIon
Summary
VII SUMMARY AND CONCLUSIONS
Summary ConclUSIOns and PolIcy ImphcatIons LImItatIOns and SuggestIons for Future Research
REFERENCES
APPEND ICES A Supplementary Country StatIStICS B Data Senes C IntervIew GUIde D DetaIls on EsttmatJon of the Models
BJODATA
XIV
130
130
135
139
] 4]
142
142
144
146
148
148
150
154
163
163
168
174
179
187
190
193
206
219
224
228
248

LIST OF TABLES
Page Table
1.1 Total and Per Capita Production of Paddy, 1974175 - 1995/96 ..... 5 1.2 Per Hectare Yield of Paddy in Nepal and other South-Asian
Countries, 1961-63 and 1991-93 ...... '" .... " '" ......... ... '" ... . . . . 6 1.3 Regional Distribution of Paddy Production and Population in the
Tara; of Nepal . . . . . . . . . . . . . . . . . . . . . .. . . . . . . . . . . .. . . . . . . . . . . . . . . . . . . . . . . . . . . 7 1.4 Per Capita Annual Consumption of Staple Foodgrain in Nepal,
1984/85 ... ... ... '" .,. '" ... ...... '" ... ... ... .... ,. '" '" ... '" ... ... ... ... 8 1.5 Comparative Market Size of Nepal and India, 1992 ... ... ... ... ...... 9 1.6 Monthly Average Retail Prices of Fine Rice in Nepal Tara; and
Adjoining Indian Border Markets, 1995/96 ... ...... ... ...... ... ... ... 10 4.1 Market-Wise Distribution of Millers and Traders Interviewed . . . .. 94 5.1 Retail Prices of Fine Rice Supplied by NFC and Private Traders in
Kathmandu Market, 1986/87 - 1996/97 ... ...... ... ... ................ 110 5.2 Number of Rice Mills in the Selected Tarai Markets . . . . . . . . . . . . . . . .. 115 5.3 Rice Supply from Tarai Markets to Different Consumption
Markets . . . . . . . . . . . . . . . . . . . . . . . . . . . . . . . . . . . . . . . . . . . . . . . . . . . . . . . . . . . . . . . . . . . . . 122 5.4 Prices of Rice in the Regional Markets at Different Levels, April-
May, 1997 ... ... ... ... ... ... ... ............ ... ............ ......... ... ... ... 125 5.5 Prices and Marketing Margins for Rice Supplied from Different
Tarai Markets to Kathmandu, April-May, 1997 ... ... ................ 129 5.6 Average Daily Arrival of Rice and Paddy from Different Tarai
Market Areas to Kathmandu, 1997 ... ...... ... ... ...... ...... .......... 133 5.7 Average Daily Arrival of Rice and Paddy to Kathmandu from
rarai Markets in different Months, 1996/97 ... ... ...... ...... ... ...... 134 6.1 Summary Statistics of the Price Series, April 1987 to March 1997 144 6.2 Correlation Coefficients of Monthly Wholesale Prices of Fine Rice
in the Selected Markets, April 1987 to March 1997 . . . . . . ....... ..... 145 6.3 Stationarity Test Statistics for Rice Price Series (April 1987 to
March 1997) ...... ...... ... ... '" '" '" ...... '" ... '" ... ... ... ... '" ... ... 147 6.4 Johansen's Test for Number of Co integrating Relations among the
Price Series, April 1987 to March 1997 ...... ............ ... ... ... ..... 151 6.5 Estimates of Vector Error Correction Model for Rice Prices, April
1987 to March ] 997 ... ............ ...... ...... ... ............ ...... ...... 156 6.6 Estimates of Transaction Cost and Different Arbitrage Regime
Probabilities in the Supply of Fine Rice from Tarai Markets to Kathmandu, April 1987 to March 1997 ...... ... ... ... ... ... ........... 170
xv

LIST OF FIGURES
Page Figure
lI The Country Map 2
2 1 Two-RegIOn SpatIal Pnce EqUIlIbnum Model 30 2 2 TradItIonal SCP Approach 38 2 3 General SCP Approach 44
24 Welfare Effect of an OlIgopoly With Costs Lower than In Perfect CompetItIOn 47
5 1 MarketIng Channels for Supply of PaddylRlce from Taral Markets to Kathmandu 106
6 1 Monthly Wholesale Pnces of FIne RIce m Selected Market Centres, Apnl 1987 to March 1997 143
XVI

ADB/M ADBIN ADF AIC AMC APP APROSC ARCH CBS CUSUMSQ EASD FMC J(O) 1(1 ) JMA
LM LOP AMDD MMA MOA MOF MSP NFC NPC NRB OLS PP RECs RLSC Rs
SBC SCP SEE SPE SRM VAR VECM
LIST OF ABBREVIATIONS
Asian Development Bank, Manila Agricultural Development Bank, Nepal Augmented Dickey-Ful1er Akaike Information Criteria Agricultural Marketing Corporation Agricultural Perspective Plan Agricultural Projects Services Centre Auto-Regressive Conditional Heteroskedasticity Central Bureau of Statistics Cumulative Sum of Squares Economic Analysis and Statistics Division Food Management Corporation Integrated of Order Zero Integrated of Order One John Mellor Associates Lagrange Multiplier Law of One Price Agricultural Marketing Development Division Morang Merchants' Association Ministry of A!,rriculture Ministry of Finance Minimum Support Price Nepal Food Corporation National Planning Commission Nepal Rastra Bank Ordinary Least Squares Philips-Perron Rice Exporting Companies Recursive Least Squares Coefficients Rupees (1 US$ = Rs 56.75, as of July 1997) Schwartz Bayesian Criteria Structure Conduct Performance Standard Error of Equations Spatial Price Equilibrium Switching Regimes Model Vector Autoregression Vector Error Correction Model
XVII

CHAPTER I
lNTROD\lCTION
Country Background
Nepal is a land-locked country between India and China, with a physical area of
]47,181 square kilometre and a population of 21 million. The country is broadly
classified into three ecological regions, running parallel from east to west - the
Tarai (plain area), the hills, and the mountains respectively covering 23, 42 and 35
percent of the total land area. The TarQl (75 to 300 meters from sea level) lies on the
southern part of the country bordering with Indian states of West Bengal, Bihar and
Uttar Pradesh (from east to west). The hills (300 to 3000 meters from sea level) are
in the middle and the mountains (above 3000 meters from sea level) form the
northern strip bordering with Tibet region of China. Further, the country has been
divided into five development regions, viz. eastern region, central region, western
region, mid-western region and far-western region. Each of the five development
regions is comprised of Tarat, hills and mountains. The regional headquarters are
Dhankuta (eastern region), Kathmandu (central region), Pokhara (western region),
Surkhet (mId-western region) and Dipayal (far-western region).
The country map In Figure 1 1 shows location of the Tar(JI regIOn, regional
headquarters, major Taral market centres, major road network within the country,
and bordering market centres and transportation network on the Indian side.

.. � 1 .. ..
, 'I 1 !
! .. 1 . ; 0 ;, v
f)
-\0 .
0"-i v 0\ t
i II
I 0 ....,
0 •
� u .... ::2 0
CI)
dol ....
2
::2 OJ} u....

3
The distributions of land area and population of the country by development regions
and by ecological regions are provided in Appendix A 1 and Appendix A2,
respectively. In tenns of physical size, mid·western region (28.8 percent of the total
area) is the largest of the five, followed by western region (20 percent), eastern
region (19.3 percent), central region (18.6 percent) and far·western region (13.3
percent). Population concentration is highest in the central region (33 percent),
followed by eastern region (24 percent), western region (20 percent), mid-western
region (13 percent) and far-western region (9 percent). Population distribution by
ecological region is 47 percent in Tarai, 45 percent in hills and 8 percent in
mountains.
Rice Production and Supply Situation
Agriculture is the mainstay of Nepal' s economy, generating 41 percent of the GOP
and employing 80 percent of the workforce (MOF, 1997a). Being mountainous,
cultivated land in the country is limited to 16 percent of its geographical area, of
which 55 percent lies in the Taral region (Appendix A1). Foodgrain, comprising
paddy, maize, wheat, millet and barley, cover about 80 percent of the cropped area
under all crops. Paddy is the main food crop accounting for 46 percent of the
cropped area under food crops. Area under paddy in 1995/96 was 1,497 thousand
hectares and its production for the same year was 3,579 thousand metric tons. The
annual statistics of area and production of major food crops for 1974175 - 1995196
are provided in Appendix A3 and Appendix A4, respectively.

4
The Tarat region, considered the granary of the country, accounts for about three
fourth of the country's paddy output; the hills produce 23 per cent, and the mountain
about 2 percent. In 1995/%, out of the total paddy production of 3,579 thousand
metric tons in the country, 2,682 thousand metric tons was from the Tara; region
alone. The estimates of annual production of paddy in Tarai, hill and mountain
regions for 1974175 to 1995/96 are provided in Appendix AS. During the period,
paddy production grew by 1.04 per cent annually (1.53 percent for Taral, and - 0.20
percent for hills and mountains), whereas annual population growth for the same
period was 2.39 percent, resulting in a decline in per capita average annual paddy
production by 1.25 percent (Table 1.1).
Nepal had higher per hectare yield of paddy than other South-Asian countries in the
early 1960's, but the situation got quite reversed by early 1990's (Table 1.2). While
Nepal's paddy yield was almost stagnating, the same for other countries in the
region was improving. The slow growth of rice yield in the country is attributed to
inadequate supply of quality seeds and fertilisers, slow expansion and limited
utilisation of irrigation facilities, lack of suitable improved technology for
unirrigated fann land, and neglect of development of efficient marketing and pricing
system (NPC, 1985� EASD, 1996).

5
Table 1.1: Total and Per Capita Production of Paddy, 1974175 - 1995196
Index of Paddy Production Per Capita {l974175=100} Mid-Year Paddy
Year Hill and Population Production Tara; Mountain Total ('000) (kS)
1974175 100 100 100 12668 225 1975176 107 104 106 13005 233 1976177 96 105 99 13350 2]0 1977178 92 94 93 13705 192 1978179 94 96 95 14069 192 1979/80 83 82 83 14442 163 1980/81 102 88 97 14826 187 1981182 104 92 100 15178 187 1982/83 69 78 72 15497 132 1983/84 113 89 105 15823 190 1984/85 107 83 100 16155 176 1985/86 112 79 ]02 16494 175 ]986/87 92 77 88 ]6840 ]48 1987/88 116 83 105 17194 ]74 1988/89 126 95 116 ]7556 188 1989/90 13] 95 120 17925 190 1990/91 133 101 123 18301 191 1991/92 122 95 113 18737 172 1992/93 94 83 91 19236 134 1993/94 137 92 123 19747 177 1994/95 107 91 102 20272 143 1995/96 137 101 126 20812 172
Av. Growth Rate (%) 1.53 -0.20 1.04 2.39 -1.25
Note: • The growth rates have been calculated using the semi-log linear model: In Y = a
+ bT, where Y is the dependent variable, T is time variable, b is the growth rate.
Source: a. Production index based on Appendix A4. h. Population estimates are based on the 1971, ) 98] and 199) Census, and
the official growth projection for 1991 onwards.
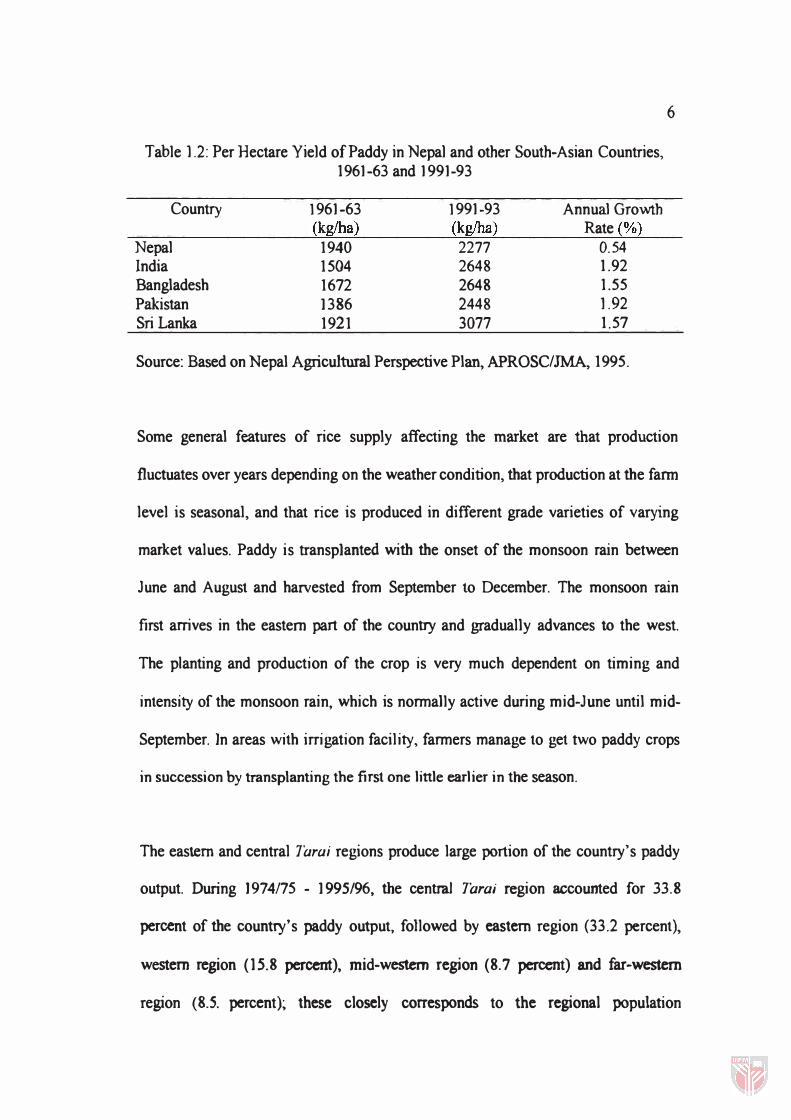
Table] .2: Per Hectare Yield of Paddy in Nepal and other South-Asian Countries, 1961-63 and 1991-93
Country
Nepal India Bangladesh Pakistan Sri Lanka
1961-63
(kg/ha) 1940 1504 1672 1386 1921
1991-93
(kg/ha) 2277 2648 2648 2448 3077
Annual Growth Rate (%)
0.54 1.92 1.55 1.92 1.57
Source: Based on Nepal Agricultural Perspective Plan, APROSC/JMA, 1995.
6
Some general features of rice supply affecting the market are that production
fluctuates over years depending on the weather condition, that production at the fann
level is seasonal, and that rice is produced in different grade varieties of varying
market values. Paddy is transplanted with the onset of the monsoon rain between
June and August and harvested from September to December. The monsoon rain
first arrives in the eastern part of the country and !,1J"adually advances to the west.
The planting and production of the crop is very much dependent on timing and
intensity of the monsoon rain, which is normany active during mid-June until mid-
September. ]n areas with irrigation facility, farmers manage to get two paddy crops
in succession by transplanting the first one little earlier in the season.
The eastern and central Tara; regions produce large portion of the country's paddy
output. During J 974175 - 1995/96, the centra) Tara; region accounted for 33.8
percent of the country's paddy output, followed by eastern region (33.2 percent),
western region (15.8 percent), mid-western region (8.7 percent) and far-western
region (8.5. percent)� these closely corresponds to the regional population
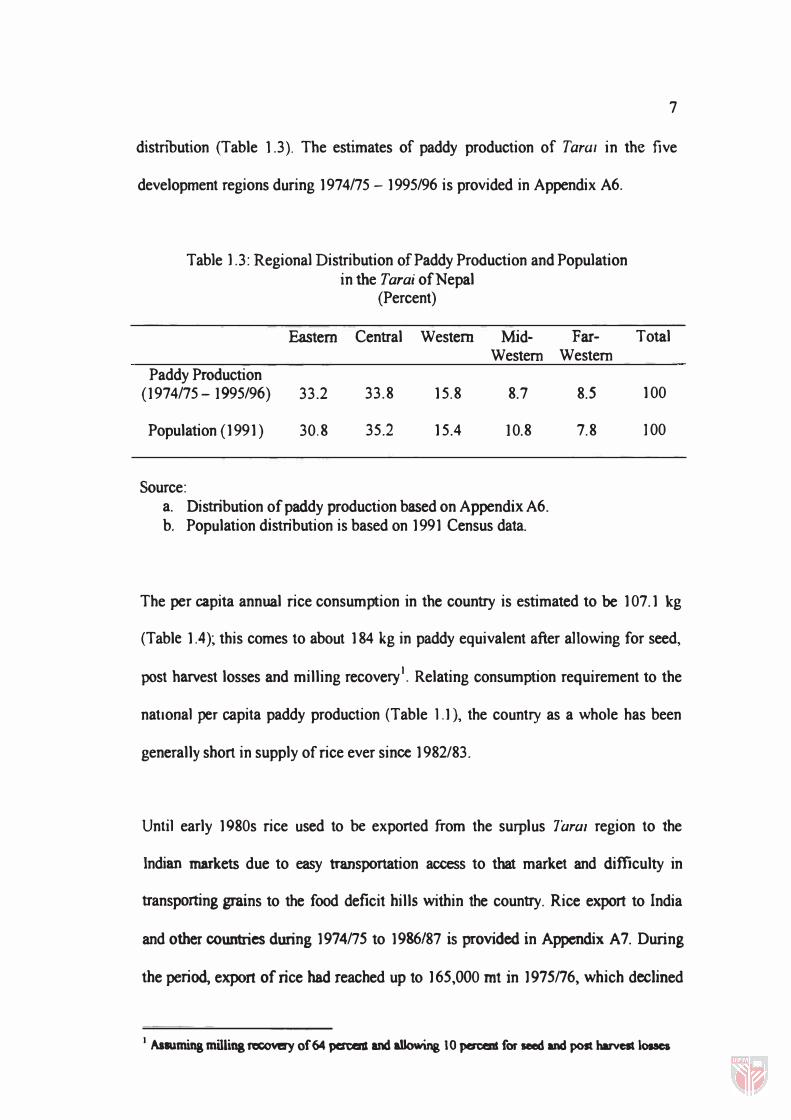
7
distribution (Table 1,3), The estimates of paddy production of Tarw in the five
development regions during 1974175 - 1995/96 is provided in Appendix A6,
Table) ,3: Regional Distribution of Paddy Production and Population in the Tara; of Nepal
(Percent)
Eastern Central Western Mid-Western
Paddy Production (1974175-1995/96) 33.2 33.8 15,8 8.7
Population (1991) 30,8 35.2 15.4 10.8
Source: a. Distribution of paddy production based on Appendix A6. b, Population distribution is based on 1991 Census data.
Far-Western
8.5
7.8
Total
100
]00
The per capita annual rice consumption in the country is estimated to be 107.1 kg
(Table 1.4)� this comes to about 184 kg in paddy equivalent after aHowing for seed,
post harvest losses and milling recovery I. Relating consumption requirement to the
national per capita paddy production (Table 1,1), the country as a whole has been
generally short in supply of rice ever since 1982/83.
Until early 1980s rice used to be exported from the surplus Taral region to the
Indian markets due to easy transportation access to that market and difficulty in
transporting grains to the food deficit hills within the country, Rice export to India
and other countries during 1974175 to 1986/87 is provided in Appendix A7. During
the period, export of rice had reached up to 165,000 mt in 1975176, which declined
I Assuming millina recovery of 64 perr.enl and allowing 10 percent for seed and post harvest 10lllCS