universita’ degli studi di siena - unisi.it phd... · universita’ degli studi di siena...
TRANSCRIPT
UNIVERSITA’ DEGLI STUDI DI SIENA
FACOLTA’ DI MEDICINA E CHIRURGIA
Scuola di Dottorato di Ricerca in Biomedicina e Scienze Immunologiche Sezione di Allergologia ed Immunologia Cliniche e Sperimentali
COMPARISON OF BALF PROTEOME FROM INTERSTITIAL LUNG DISEASES:
sarcoidosis, IPF, PLCH, fibrosis associated to SSc
Relatore: Chiar.ma Prof.ssa Paola Rottoli Tesi di Dottorato di: Dott.ssa Claudia Landi Anno Accademico 2010-2011

Abstract
The “–OMICS” sciences elaborated in the last twenty years had permitted to introduce the biotechnological era, offering opportunities in cellular and molecular research. In particular, proteomics is an unbiased approach aimed to detect a list of candidate proteins used to develop further targeted studies. Proteomic approach can be applied to the study of various biological samples, among these Broncho-Alveolar Lavage (BAL), particularly useful to study pathogenetic mechanisms and potential biomarkers in interstitial lung diseases (ILDs). Initially, we used a proteomic approach specifically to analyze BAL protein composition of patients with Pulmonary Langerhans Cells Histiocytosis (PLCH) and of healthy smoker (sc) and non-smoker controls (nsc) to obtain insights into the pathogenetic mechanisms of the disease, to study the effect of cigarette smoking on susceptibility to PLCH and to identify potential new biomarkers. BAL of 5 PLCH, 5 sc and 5 nsc were resolved by 2D-electrophoresis. The Image Master Platinum 7.0 software was used to compare the obtained electropherograms and to define characteristic differences in protein expression, identified by mass spectrometry (MALDI-ToF and ESI-ion TRAP). The proteins identified had antioxidant, pro-inflammatory and anti-protease functions. Many, such as protease inhibitors and antioxidant proteins have been already linked to PLCH pathogenesis, whereas other proteins have never been associated with the disease. Interestingly, numerous proteolytic fragments of plasma proteins were also identified suggesting an increased proteolytic activity in this inflammatory lung disease. Differences in protein expression were found between the three groups and confirmed by Principal Component Analysis (PCA).
Moreover, proteomic approach to the BAL study is considered extremely useful in order to analyze in depth the pathogenesis of interstitial lung diseases such as Idiopatic Pulmonary Fibrosis (IPF), Sarcoidosis (Sar), PLCH and pulmonary fibrosis associated to Systemic Sclerosis (Ssc) and characterize their different protein profile, to obtain new insight on the disease pathogenetic mechanisms and to identify potential biomarkers. Multivariate analysis, such as PCA, was used to confirm the association between differentially expressed proteins and the different conditions analyzed. System biology elaboration of the identified proteins by MetaCore software, highlighted new gene products involved such as transcriptional factors AP-1, NK-kB and p53 as well as signaling pathways such as immune response, blood coagulations and Slit-Robo signaling in ILDs pathogenesis.
In conclusion proteomic analysis on ILDs can help to identify proteins of interest to be analyzed as potential biomarkers to allow a faster and distinctive diagnosis of these pathologies. PCA can help

to classify unknown samples in the appropriate group and system biology suggests pathways and/or gene products not necessarily take into consideration using only proteomic analysis.

Index Introduction to proteomics 6 Proteomics as biomarker research 6 Two Dimensional electrophoresis 9 Protein identification: mass spectrometry MALDI ToF 10 Protein identification: Chromatography coupled to tandem mass spectrometry 12 Multivariate analysis by Principal Component Analysis 13 System biology and MetaCore 14
Chapter 1 Proteome analysis of bronchoalveolar lavage in Pulmonary Langerhans Cells Histiocytosis
Introduction 16 Pulmonary Langerhans cell histiocytosis and cigarettes smoke 16 Materials and methods 17 Population 17 Bronchoalveolar lavage 18 Two-Dimensional Gel Electrophoresis (2DE) 18 Statistical analysis: ANOVA and Tukey’s test 19 Mass Spectrometry: MALDI ToF 19 Multivariate analysis 20

Results 21 Population 21 Proteome analysis 21 Multivariate analysis 23 Discussion 24 Population 24 Two dimensional electrophoresis 24 PCA 27 Conclusion 28
Chapter 2
Multivariate analysis of BALF protein expression profiles can help to distinguish between interstitial lung diseases: Sar, PLCH, IPF, SSc
Introduction 29 Interstitial lung diseases 29 Sarcoidosis 29 Idiopathic Pulmonary Fibrosis 32 Pulmonary Langerhans cells histiocytosis 35 Fibrosis associated to Systemic sclerosis 37 Bronchoalveolar lavage fluid 39 Proteomic analysis of Sar, PLCH, IPF, fibrosis associated to SSc, sc and nsc 40

Materials and Methods 41 Preparation of BAL 41 Classical 2D-Electrophoresis 41 Protein identification by MALDI-ToF-MS 41 Protein identification by LC-MS/MS analysis 41 Statistical analysis by Principal Component Analysis 42 Network analysis by MetaCore 42 Results 44 Proteomic analysis 44 Principal Component analysis 45 Network analysis by MetaCore 46 Discussion 47 Two dimensional electrophoresis 47 Principal Component analysis 52 Network analysis by MetaCore 53 Conclusion 55 Table and figure Abbreviations Reference

Introduction to proteomics Proteomics as biomarker research The science of Proteomics, one of the most important areas of research in the post-genomic
era, came about from the necessity to know not only what happens at the gene level but also what happens at the protein level in a biological system. Proteomics represents the functional state of a given biological compartment and the term “Proteome” was coined in 1994 during the Siena Meeting “From Genome to Proteome” to define the “PROTEin expressed by a genOME”. More precisely, the proteome was defined as the set of proteins expressed by an organ, organism or biological fluid at a given time, subject to specific environmental, physiological, pathological conditions. Its study not only allows the characterization of protein function and the protein structure, but also the characterization of the protein-protein interactions and the post-translational modifications (1). The proteomic analysis allows for a new molecular mechanisms discovery that in turn leads to the development of new prognostic, diagnostic and therapeutic targets. The proteomic potentiality resides in its ability to correlate physiological and /or pathological protein patterns that distinguish themselves. Moreover, the integration between proteomics, genomics, transcriptomics, bioinformatics and biostatistics has allowed for the development of an important instrument for translational aspects of modern molecular medicine. Inherently, proteomics is an unbiased approach aimed to detect a list of candidate proteins used to develop further targeted studies. Instead, the introduction of bioinformatics not only permits elaborating the analysis to find which protein spots are differently expressed between the conditions considered, but also proposes a series of new procedures based on “network enrichment” to highlight proteins of interest not necessarily included in the proteomic results. These “new” proteins found, thanks to “network enrichment analysis” were not found in proteomic analysis as a result of the inherent limitations of the technique used to resolve the protein mixture. The “network enrichment analysis” takes into consideration information from protein co-localization in protein-protein complex (2), metabolic and signaling pathways, functional annotations of Gene Ontology (GO) categories. The use of enrichment analysis allows to focalize attention on pathways or functions not so obvious or significant in the original data obtained from proteomic procedures. This global approach allows to investigate the complexity of the biological system analyzed, in particular, the data organization can help to improve the understanding of many biochemical pathways (3). The study of a protein set, representing a biological system, becomes interesting when the changes in the normal protein composition are taken into account. More specifically, these changes, observable thanks to the

analytical methods developed for the proteomics study, can be observed between the different considered conditions such as, for instance healthy and diseased tissue. Intuitively, these changes may be associated with the pathogenic mechanism, specific for that pathology. Depending on these intuitions, quantitative proteomics, aim at the quantitative and qualitative alteration measurement in the protein profile of the investigated biological system. Moreover, quantitative proteomics can be applied to the study of the mechanisms involved in the disease or in biomarker discovery. In conclusion, the advantage in proteomic study, compared to “single path” methods where expressions of single proteins or single genes are studied, is the ability to visualize the globality of the biological situation in the examined conditions.
The analytical methodologies used in proteomics, subdivided into gel-based and gel-free, are based on the initial separation step followed by visualization, analysis and identification steps. The separative step aims to resolve complex protein mixtures in order to separate each protein species contained inside the sample. The separation process easily permits the subsequent quantification and identification steps. The most used methods in separation steps are the classical two dimensional electrophoresis (2DE) or Differential In Gel Electrophoresis (DIGE) and liquid chromatography. Two dimensional electrophoresis has preceded and accompanied the birth of proteomics. Established in the early ‘70s, thanks to O’Farrel, still remains the technique of choice for this kind of study although lately interest has focused on the development of gel-free techniques. The 2DE is reproducible, robust and able to best resolve a complex protein mixture according to their isoelectric point (pI) and their molecular weight (MW) (4). The polyacrilamide gel, where the protein species are resolved, represent the “core” of the proteomic analysis. Its structure consents to physically match two different samples. Thanks to this, two different protein mixtures are compared to each other in both quantitative and qualitative points of view. Another advantage of the 2DE method is represented from the study of post-translational modifications that determined an alteration of the pI and MW inducing a positional shift in the 2D gel. This kind of modification is represented by phosphorylation, glycosylation, glutathionylation or more neglected modification such as protein cleavage (4). In conclusion, the 2DE for separative step is decisive for the next selection of interesting spots for the analysis. Although widely used, 2DE presents some limitations: the reduced dynamic range, for instance, allow the visualization of the under-represented proteins limiting the global approach of the proteomic method. In addition, 2D gels also rarely display hydrophobic proteins and only highly abundant proteins are currently visualized. Low abundance proteins of physiological relevance, such as regulators or signaling proteins are difficult to detect. Moreover, basic or very basic proteins are rather difficult to focus. In addition to these technical problems, 2DE is a “time-consuming” method that makes it possible to carry out a comparison of a

low number of analytical and biological replicates. In support of the various problems encountered with classical 2DE on gel-to-gel variations and time-consuming questions, DIGE has been developed which substantially reduces variability by sample labeling with different fluorescent dyes (Cy2, Cy3, Cy5). In the same gel it is possible to resolve control and treated samples labeled independently with a fluorescent dye such as Cy3 or Cy5. Cy2 allows to label an internal standard, a mixture containing equal amounts of each experimental sample taken into consideration. Two samples and the internal standard are mixed together and resolved in the same gel. Densitometric scanning at different wavelengths, characteristic for each dye, permit to obtain three images from only one gel, two from samples and one from internal standard. This procedure allows a very accurate and fast computer analysis reducing errors due to the distortion of the experimental gels. The internal standard represents the average of the analyzed samples reporting every protein species. Its use allows an accurate statistical spot quantification as well as an increase in matching gel reliability to distinguish the experimental from biological variations in the samples. The classical or DIGE gel production needs an image analysis step by dedicated software such as Image Master 2D Platinum (GE Healthcare, Uppsala, Sweden) for classical gels and De Cyder (DeCyder Differential Analysis software, GE Healthcare) with regard to the DIGE gels. Once differently expressed spots are localized, these spots are mechanically excised from the gel and processed by trypsin digestion to address the identification step. The obtained peptide mixture is identified by MALDI ToF (Matrix Assisted Laser Desorption/Ionization Time-of-flight). Spots that give back ambiguous identification are submitted to peptide sequencing using LC MS/MS (Liquid Chromatography tandem mass spectrometry).
Among the gel-free techniques, multidimensional capillary chromatography (Mud-LC) coupled with electrospray ionization ion trap tandem mass spectrometry (ESI-MS/MS) allows the resolution of complex protein mixtures using different chromatographic separation methodologies such as ion exchange, affinity and reverse-phase that resolve the proteins based on different independent physical-chemical properties as the charge, size, hydrophobicity, isoelectric point and their affinity for other molecules. The ESI MS/MS permits to directly identify the chromatographic fractions. Summarizing, this technique, essential for shotgun proteomics, acts in separating the protein mixture by liquid multidimensional chromatography and identifies the chromatographic fractions by mass spectrometry. Being a fully automated method allows the analysis and identification of a large amount of protein without a preliminary quantitative analysis. However, Mud-LC share the same limitations with the 2DE analysis such as the range and resolution of low abundance proteins (5). In recent years more gel-free techniques have acquired significant importance and are based on differential labeling of perturbed and non-perturbed protein extract with different stable isotopes

(12C/13C,14N/15N, 1H/2H). In this way, the same peptide from two different samples will show the same chemical behavior, with a difference in mass detectable by mass technique. Peptide pick intensities can be used for relative quantification of these peptides (6). The workflow provides a differential isotopic labeling, the digestion of combined protein samples to obtain peptide mixture, chromatographic fractionation of mixed peptide samples, the analysis of the separated peptides by MS/MS and the processing of the MS results to obtain the relative protein abundance as well as protein identification by database searching. The two quantitative proteomic approaches based on mass spectrometry are SILAC (Stable Isotope Labeling by Amino Acids in Cell Culture) and ICAT (Isotope-Coded Affinity Tags).
Two Dimensional electrophoresis Two dimensional electrophoresis (2D-PAGE), as mentioned above, is a technique used for
separation of complex protein mixtures according to the protein pI and MW. The procedure takes into consideration two orthogonal methods such as isoelectric focusing (IEF) and SDS-PAGE (Sodium Dodecyl Sulphate Polyacrilamide Gel Electrophoresis). The IEF resolves the proteins according to their pI and defines the pH value where the net charge of the protein is zero (7). The SDS-PAGE resolves the proteins according to their MW using sodium dodecyl sulphate detergent (SDS) which binds the proteins in a stechiometric manner (1 SDS molecule per 2 aminoacid residues). The SDS confers a net negative charge to the proteins eliminating the intrinsic protein charge, so the peptidic mass/charge ratio becomes analogous. SDS also helps protein denaturation minimizing the conformation variability. The second electrophoretic dimension (SDS-PAGE) is performed in reducing conditions using DTE (Dithioerithritol) or β-Mercaptoethanol which break the disulphide bridges in order to linearize the protein chains. The polyacrilamide gel for the second dimension acts as a molecular sieve, slowing the protein migration according to their size (8). Two dimensional electrophoresis resolving power represents the product of individual IEF and SDS-PAGE resolving power (9). Therefore, proteins with identical MW are resolved according to their pI and proteins with identical pI are resolved thanks to their MW. The dimensions of the classical electropherograms are 18cm wide x 20cm high x 1,5mm thick. After staining by silver nitrate, the gels are digitized to the laser densitometer. The final image represents a map, a Cartesian plane, where every reported spot is univocally identified by a pI in the x-axis and a MW in the y-axis. Also the gel size affects the gel resolution. Protein species with similar chemical and physical characteristics will be better distinguished in wider gels. 18cm wide gels can resolve about 2000-4000 spots increasing the number using the 24cm IEF strip (10). The digitalized images are compared using dedicated software such as Image Master 2D Platinum, that not only permits to

clear gel images but principally makes gel matching possible, to compare the protein expression from two or more considered conditions from quantitative (amount of protein expressed) and qualitative (presence/absence of a protein) points of view (11-12). The software greatly helps the operator minimizing the discrepancies between images, due to normal experimental procedures (13-14). Significantly, the software computed the intensity, the area and the volume of each spot in the gel. For the quantitative analysis normalized volume values are used, that is, the percentage of relative volume (%V) obtained by dividing the volume of the spot by the total volume of all spots in the gel.
Protein identification: mass spectrometry MALDI ToF Interesting spots obtained from image analysis need to be identified in order to carry out the
functional analysis. For this purpose, mass spectrometry (15) consents to accurately determine molecular mass starting from the measurement of its mass/charge ratio (m/z). Molecules that can be analyzed by this technology must be ionizable and transferred in gaseous phase in order to move in a vacuum system. In MALDI ToF procedure, the protein spot of interest resolved by 2DE, is previously subjected to hydrolytic cut by trypsin. This enzyme cuts the peptidic chain at arginine and lysine levels. The obtained peptidic mixture, placed in the target plate, is mixed with a matrix, composed by small aromatic rings (saturated solution of α-cyano-4-hydroxycinnamic acid) (16-18). MALDI is a soft ionization technique allowing the analysis of biomolecules which tend to be fragile and fragment when ionized by more conventional ionization methods. In the first part of MALDI ToF analysis, aromatic groups of the matrix absorb the laser energy ionizing its acidic group. This process consents to transfer a proton to the peptide. The desorbtion of the sample is achieved thanks to the vacuum in the flight tube (19). This process consents to obtain charged and in gaseous phase peptides that fly in the flight tube only depending on electromagnetic potential difference where every peptide will be characterized by the same kinetic energy. What distinguishes the time of flight of each peptide, that is, the time that the peptide employs to reach the detector starting from the target plate, will be its m/z ratio. Every peptide assumes a single charge (z = +1) hence, the mass will characterize each aminoacidic chain and then the time of flight. According to this, the smaller peptides will reach the detector before the bigger ones. The time of flight employed will be recorded and reported on a spectrogram, a graph showing the values of the m/z ratios on the x-axis and the intensity of each peak on the y-axis (each ion with the same m/z ratio). All the m/z values determine the peptide mass fingerprinting (PMF) of the protein, useful in comparing the experimental masses obtained from MALDI ToF, with the theoretical masses in specific databases available online on Swiss Prot (http://www.expasy.org/sprot/) and NCBInr

(www.ncbi.nlm.nih.gov/protein). Mascot Search (www.matrixscience.com) is a research program, similar to Profound (http://prowl.rockefeller.edu/profound_bin/WebProFound.exe) able to perform the comparison between experimental and theoretical masses to identify the protein. The degree of identification accuracy is estimated by score value and sequence coverage. MALDI ToF technology is extremely versatile in proteomic analysis thanks to its capacity to generate mono-charged ions and to its high sensitivity. The MALDI ToF can also be applied to the protein modification such as post-translational modification (phosphorilation, glycosylation…) and protein interactions (protein-ligand or protein-metal ions). In SILAC and ICAT techniques, the signal calibration using known amounts of protein, enables us to quantify the analyzed protein (19-20). Moreover, MALDI ionization allows a higher tolerance to slightly higher salt concentration, buffer and other chemical species in the samples. Thanks to these characteristics, MALDI ToF is effective in studies of biological fluid such as bronchoalveolar lavage, serum, tissue extract and cells.

Protein identification: Chromatography coupled to tandem mass spectrometry Liquid chromatography coupled to mass spectrometry is a useful technique to identify
protein samples. This identification method takes advantage of high performance liquid chromatography (HPLC) that permits the fractionation of the sample peptides coupled to Electro Spray Ionization-Ion Trap (ESI-IT) mass spectrometry in order to sequence the pre-fractioned protein peptides. HPLC enabled to fractionate the peptide mixture depending on different chemical-physical characteristics such as the charge, size, hydrophobicity, isoelectric point, molecular affinity using different types of columns: ion exchange, affinity, reverse-phase (21). The peptide fraction obtained is directly inserted into the mass spectrometer using a gold needle heated to 200°C and subjected to high electrical potential. This step characterizes the ESI ionization, where the sample forms a dense cloud of charged micro drops. In these conditions the ion solvent quickly evaporates in order to permit the passage from liquid phase to gaseous phase in a non-destructive manner (22-24). ESI, as well as MALDI, are considered soft ionization. Peptides in gaseous phase and in atmospheric pressure are “sucked” through a pore into the ion trap (IT) in a vacuum condition (25-27). In the ion trap the ions orbit circularly in stable conditions since the Radio Frequency (RF) amplitude is constant. In order to acquire the mass spectrum, radio frequency voltage is increased to perturb the ions in a way of expelling them from the trap in a progressive manner. Ions with a lower m/z value leave the trap before the higher ones and will be detected by a detector (28). Modifying the analyzer applied voltages, it is possible to select ions with a specified m/z ratio. These ions will be subsequently and selectively fragmentized by a particular gas, such as helium. The Collision Induced Dissociation (CID) permits the oligopeptide to be fragmentized at more than one position along the amino acidic chain forming fragments (ions y and b). Grading the fragments according to their m/z ratio, allows each one to be different from every other one due to amino acid residue. It is possible to detect every amino acid to obtain the peptide sequence.
In contrast to the MALDI ionization, which leads to the mono-charged ion formation, ESI ionization leads to multi charged ion formation. The HPLC and ESI-IT conjugation allows to increase the spectrometer sensitivity because it is very dependent on sample entrance flow. Nanoliters/minute flow allows to obtain high sensitivity performance (29-31).
Multivariate analysis by Principal Component Analysis Proteomic analysis produces large amounts of data difficult to elaborate, in order to
extrapolate information useful to prognostic and/or diagnostic aims. The obtained protein list and every protein expression trend in the conditions observed can be organized and simplified by multivariate statistical analysis such as Principal Component Analysis (PCA). PCA transforms a number of related variables, for instance, the spot expression levels in each experimental sample, in a smaller number of uncorrelated variables called principal components. The data organization is performed on a matrix, where the columns represent the observation and the rows relate the variables. Through the matrix, using a linear transformation, the correlated variables become a smaller number of uncorrelated variables obtaining a reduction in initial data complexity. From the graphical point of view, a multivariate vector is generated for every variables group. The first multivariate vector includes the highest possible variance in the native variables. In this way, the new variables are written in a multidimensional space, where the linear transformation projects the original variables in a new system of Cartesian axis where a decreasing mode of variance is classified (32). The PCA permits to construct a Cartesian plane where the two reference axes are the two principal components. In the plane the distances between the data that respect the native form are fundamental. The unit radius circle in the Cartesian graph, makes it possible to evaluate the correlation coefficient between every variable included inside the circle, allowing to have an immediate graphical view in which greater variables determine the principal component (33-34).
PCA used in proteomic data, become crucial in order to clusterize the experimental groups on the basis of protein expression of the spot found differently expressed in the considered spot map. 2DE, in combination with multivariate analysis such as PCA can be a complementary approach to the classical differential analysis based on univariate statistical analysis. This procedure can help to establish the basis for the determination of an automatic classification protocol (35).
System biology and MetaCore The necessity to attribute a higher significance to the enormous amount of data obtained by
proteomic approach, has permitted the introduction of System biology. Proteomics provides a long list of up- or down-regulated proteins among the considered conditions. The protein differential expression needs to find a significance, a functionality and specific pathway involved in the performed study. In order to extrapolate new knowledge, hypothesis and emerging properties from the data, System Biology allows the analysis of the relationships between the system elements subjected to genetic or environmental perturbations. The software, for the System Biology study, is able to bind together the differential expressed proteins of the proteomic data on the basis of their co-occurrence with the elements contained in an available database, considering information such as physical interactions, genomic proximity, expression, further proteomic data, literature (PubMed), affiliation to the same pathway (KEGG, Reactome,…) and “GO terms” into the Gene Ontology vocabulary. GO vocabulary describes the genetic product properties subdivided into three domains: Biological process (BP), Cellular Component (CC) and Molecular Function (MF). BP affects operations or sets of molecular events having a defined beginning and end, pertinent to the integrated living unity functionality such as cells, organs and organisms. Instead, CC regards the cellular compartments and/or its extracellular environment. MF are elementary activity of a genetic product at the molecular level such as its possible bonds with other molecules or its catalysis process.
The network construction, using specific software, can recreate the cellular processes regulated by molecular interaction systems. These networks will simulate real protein networks essential for the regulation of the organisms development programs such as signal transduction and regulation of the metabolic pathways.
The graph obtained by the software contains a set of elements called “Nodes” and are connected by “Arches”. Nodes represent the software introducing proteins and the Arches are the interaction between them. Among the Nodes there are “Hubs”, proteins connecting more Nodes. Within the network are present “subnetworks” interconnecting smaller groups of proteins. Between the Nodes are collocated the interactions of regulation, indicating the protein behavior with respect to other proteins: controls, inhibition, feedback mechanism, interactions with other molecules. MetaCore is a System Biology software and works thanks to databases containing protein information regarding protein-protein, DNA-protein, RNA-protein interactions, translational factors, metabolic and signaling pathways and bioactive molecule effects.
• The application of the MetaCore pathways analysis on the experimental data, obtained thanks to the image analysis of the 2D gels from the bronchoalveolar lavage of the different conditions treated,

can help to visualize relevant network involving the differentially expressed proteins in every pulmonary disease considered.
In conclusion, the application of System Biology to identify proteins consents not only to display eventual prognostic/diagnostic pathological processes, but also to extrapolate new information completely unknown at the starting experiment, for instance, the behavior of the less abundant proteins and consequently not found on the gels, such as transcription factors.

CHAPTER 1
PROTEOME ANALYSIS OF BRONCHOALVEOLAR LAVAGE IN PULMONARY LANGERHANS CELL HISTIOCYTOSIS
Introduction 1.1 Pulmonary Langerhans cell histiocytosis and cigarettes smoke Pulmonary Langerhans cell histiocytosis (PLCH) is a rare granulomatous disorder
characterized by uncontrolled proliferation and infiltration of CD1+ Langerhans cells (LCs) in the lung. It has been associated with smoking and prevalently affects young adults (36-37). The pathogenesis of PLCH is unclear. The bronchiolar distribution of lesions suggests that an inhaled antigen, such as cigarette smoke, may be involved, since 90% of cases are smokers (38). The correlation between PLCH and smoking is corroborated by recent studies demonstrating that acute tobacco smoke inhalation determines immediate and selective recruitment of LCs into human airways, inducing a very early reaction of the adaptive immune system (39-41). Moreover, cigarette smoke promotes survival signals and prolongs survival of dendritic cells (42). Smoke-induced alterations at lung level can therefore induce changes in lung condition determining a typical protein profile at bronchoalveolar and plasma level.
Proteomics is a powerful approach that enables lung diseases to be studied through the characterization and identification of protein marker profiles that can highlight specific pathological states. A proteomic approach to the study of BAL is extremely useful for insights into pathogenesis and identification of biomarkers (43). There is no literature on BAL proteomic findings in PLCH. We therefore studied BAL protein composition in PLCH patients, healthy non-smoker controls and healthy smoker controls by a proteomic approach using two-dimensional electrophoresis and mass spectrometry in order to obtain insights into the pathogenesis of PLCH, to evaluate the effect of smoking on disease progression and to discover new prognostic biomarkers.

Material and Methods 2.1 Population The study population consisted of five PLCH patients of Caucasian race (3 female, mean
age 33.15 ± 36.13 years), five healthy non-smokers (3 female, mean age 59.13 ± 24.2) and five healthy smokers (2 female, mean age 43.17 ± 29.62) monitored at Siena Regional Referral Centre for Interstitial Lung Diseases for a period of at least four years. All patients were currently smokers with the exception of a single patient who was an ex-smoker. We analyzed exposure of our patients to environmental pollution retrospectively and interestingly, none of the patients lived in big cities: all came from the country or small town with no significant exposure to pollutants. No professional risk was found as 3/5 were office workers, another a teacher and the fifth a cook. Diagnosis of PLCH was conducted according to international criteria (44-46); three patients had a diagnosis based on histological examination of transbronchial biopsies showing tissue positivity for anti-CD1a and S100 protein staining; the other two had a diagnosis based on clinical-radiological findings and BAL features (including CD1a positivity). All patients underwent pulmonary function tests (PFT) and gas exchange evaluation according to ERS guidelines (47). All patients gave their written informed consent to enrolment in the study.

2.2 Bronchoalveolar lavage Bronchoscopy with BAL was performed in all patients for diagnostic reasons as previously
reported in chapter 1 (48-50). Lymphocyte phenotype was analyzed by flow cytometry (Facs-Calibur, Becton Dickinson) using anti -CD3, -CD4, -CD8 and -CD1a monoclonal antibodies.
Two-Dimensional Gel Electrophoresis BAL samples were dialyzed against water, lyophilized and dissolved in lysis buffer (8M
urea, 4% CHAPS, 40 mM Tris base, 65 mM dithioerythritol and trace amounts of bromophenol blue). Protein concentration was determined according the Bradford method (51). 2DE was carried out using the Immobiline polyacrylamide system, as previously described (52) on a preformed immobilized nonlinear pH gradient, from pH 3 to 10, 18 cm length, from GE Healthcare (Uppsala, Sweden). Sample load was 60 μg per strip in analytical runs, and 1 mg per strip in preparative gels. Analytical runs were carried out using the Ettan™ IPGphor™ system (Amersham Biosciences) at 16°C under the following electrical conditions: 0 V for 1 h, 30 V for 8 h, 200 V for 1 h, from 300 to 3500 V in 30 min, 3500 V for 3 h, from 3500 to 8000 V in 30 min, 8000 V up to a total of 80,000 Vh. Preparative strips were rehydrated with 350 μL UREA 8 M, 4% w/v CHAPS, 1% w/v DTE and 2% v/v carrier ampholyte at room temperature for 12 h. Sample load was obtained by cup loading, with the cup applied at the cathodic and anodic ends of the strip. MS-preparative runs were obtained using the Multiphor™ II electrophoresis system and the following voltage steps at 16°C: 200 V for 6 h, 600 V for 1 h, 1200 V for 1 h, 3500 V for 3 h, 5000 V for 14 h. After the first dimension run, the IPG gels were equilibrated in 6 M urea, 2% w/v SDS, 2% w/v DTE, 30% v/v glycerol and 0.05 M Tris-HCl pH 6.8 for 12 min; and for a further 5 min in 6 M urea, 2% w/v SDS, 2.5% w/v iodoacetamide, 30% v/v glycerol, 0.05 M Tris-HCl pH 6.8 and a trace of bromophenol blue. After the two equilibration steps, the second dimensional separation was performed on 9–16% SDS polyacrylamide linear gradient gels (18 x 20 cm x 1.5 mm), and carried out at 40 mA/gel constant current, at 9°C until the dye front reached the bottom of the gel (53). Analytical gels were stained with ammoniacal silver nitrate (54-55). MS-preparative gels were stained with SYPRO Ruby (Bio-rad headquarters, Hercules, California) according to the manufacturer's instructions. Bind-silane (γ methacryloxypropyltrimethoxysilane) (LKBProdukter AB, Brommo, Sweden) was used to attach polyacrylamide gels covalently to a glass surface for those undergoing SYPRO Ruby staining (56). Ammoniacal silver nitrate stained gels were then digitized by a Molecular Dynamics 300S laser densitometer (4000x5000 pixels, 12 bits/pixel; Sunnyvale, CA, USA). Preparative gel

images stained with SYPRO Ruby were digitized with a Typhoon 9400 laser densitometer (GE Healthcare). Computer-aided 2D image analysis was carried out with the Image Master Platinum 7.0 computer system (GE Healthcare). Spot detection was achieved after defining and saving a set of detection parameters, enabling filtering and smoothing of the original gel scans to clarify spots, and removal of vertical and horizontal streaks and speckles. The analysis process was performed by matching all gels of each group with a reference gel for the same condition with the best resolution and greatest number of spots, chosen by the user and named “master” by the software. The three master reference gels were then matched with each other. By this procedure, the Image Master Platinum algorithm matched the other gels to find qualitative and quantitative differences.
2.4 Statistical analysis: ANOVA and Tukey’s test Statistical analysis of the samples was performed using Statistical software packages SPSS
13.0 for Windows and Graphpad Prism 5 for Windows. Data was expressed as mean ± standard deviation (M ± SD). For the proteomic approach, statistical analysis of proteins expressed differently in the three groups was carried out using Student’s T-test, one-way ANOVA and Tukey’s test. Only unmatched spots or spots with significantly different %V (p<0.05 by ANOVA) were considered “differently expressed” in the three groups.
2.5 Mass Spectrometry: MALDI ToF Protein identification was carried out by PMF on an Ettan MALDI-TOF Pro (GE
Healthcare), as previously described (57-58). Electrophoretic spots from SYPRO Ruby stained gels were mechanically excised by an Ettan Spot Picker (GE Healthcare), destained in 2.5 mM ammonium bicarbonate and 50% acetonitrile, and dehydrated in acetonitrile. They were then rehydrated in trypsin solution and digested overnight at 37°C. 0.75µL of each protein digest was spotted onto the MALDI target and allowed to dry. Then 0.75 μL of matrix solution (saturated solution of CHCA in 50% v/v ACN and 0.5% v/v TFA) was applied to the dried sample, and dried again. After acquiring the mass of the peptide, a mass fingerprinting search was carried out in Swiss-Prot/TrEMBL and NCBInr databases using MASCOT (Matrix Science Ltd., London, UK, http://www.matrixscience.com) software available on-line. Taxonomy was limited to Mammalia, mass tolerance was 100 ppm, and the number of missed cleavage sites accepted was set at one. Alkylation of cysteine by carbamidomethylation was assumed and oxidation of methionine was

considered as a possible modification. Sequence coverage, number of matched peptides and probability score are shown in Tables 2, 3, 4, 5.
2.6 Multivariate analysis Principal Components Analysis (PCA) was performed for the three groups to reduce
proteomic data complexity and to identify meaningful groups and associations in the dataset. PCA transforms a number of correlated variables (e.g. individual protein spot abundance levels in each experimental sample) into a smaller number of uncorrelated variables, called principal components. In this study PCA was used to cluster the experimental groups on the basis of protein spot expression in BAL (spot maps). Percentage volumes of spots differently expressed in the three analysis groups (PLCH versus non-smoker controls, PLCH versus smoker controls and non-smoker versus smoker controls) were included in the PCA analysis, which was performed using STATISTICA 7.0 software (Statsoft, Inc.). In the resulting graph, the spot maps were plotted in two-dimensional space, showing the principal components PC1 and PC2 that divided the samples analyzed orthogonally according to the two principal sources of variation in the data set.

Results 3.1 Population Table 1 reports the clinical features, LFT and bronchoalveolar lavage results of the group of
PLCH patients. As expected, BAL cell profile showed eosinophilia greater than 6%, mild neutrophilia and 8.1% [± 5.3] CD1a-positive cells. Low DLCO was evident in all patients at the time of bronchoscopy and lung function tests revealed obstructive pattern in 2 patients, restrictive deficit in 1 patient and a normal functional pattern in the other 2 cases.
3.2 Proteome analysis Figure 1 shows the master gels of the three groups (PLCH patients and smoker/non-smoker
controls), chosen as reference gels because of their high resolution and large number of protein spots. An average of 1100 spots was detected in each gel across groups. When our master gels were matched by Image Master Platinum 7.0, qualitative and quantitative protein differences were observed. MALDI-ToF/MS identified these proteins, including two found for the first time in BAL samples: serpin B3 (SPB3) and plastin-2 (PLSL), which were up-regulated in smokers versus non-smokers and down-regulated in PLCH patients versus smokers. Among spots expressed differently between groups, there were modulators of immune responses (such as polymeric immunoglobulin receptor (PIGR), immunoglobulin light chain, Ig alpha-1 chain C region, PLSL, Ig gamma-1 chain C region, IgG K chain), proteins implicated in antioxidant defence (thioredoxin (THIO), albumin (ALBU), ceruloplasmin (CERU), glutathione peroxidase 3 (GPX3)), cell-cycle regulators (creatinine kinase B-Type, ADP ribosylation factor-like protein 3 and annexin A3 (ANXA3)), proteins involved in ion transport (such as serotransferrin (TRFE) and hemoglobin subunit beta) and several inflammatory proteins (including pigment epithelium derived factor (PEDF) and apolipoprotein A1 (APOA1)). Alpha-1-antitrypsin (A1AT) isoforms and SPB3 were spots with anti-protease function. Other proteins like purine nucleoside phosphorylase, pyruvate kinase isozymes, fibrinogen gamma chain, alpha 1B glycoprotein and actin cytoplasmic 1 were identified. BAL proteome analysis of PLCH patients also revealed several proteolytic fragments of plasma proteins, such as albumin (ALBU), haptoglobin (HPT) and kininogen-1 (KNG1). Five isoforms of alpha 1 anti-trypsin (A1AT) were differentially expressed in BAL of the three groups.
Considering only spots constantly present in all gels of all groups, significant qualitative variations in sensitivity to silver staining were observed for the nine spots (tab. 2). Some of these proteins
were found in healthy controls but not in patients and others were found in PLCH and smoker-control samples but not in those of non-smoker controls. Fifty nine spots showed at least ±2 times variations in percentage of relative volume (%V) (%V = Vsingle spot/Vtotal spot). These spots were significantly up- or down-regulated in BAL samples of PLCH patients with respect to BAL of smoker and non-smoker controls (p<0.05). Table 3, 4, 5 lists the proteins identified from these spots with their accession numbers, theoretical and experimental molecular weights, pIs, Mascot search results, mean and standard deviations, statistical p values and number of folds of protein expression in the three groups.
Twenty-eight spots were quantitatively more abundant in PLCH than in non-smoker and/or smoker control samples. The proteins of 24/28 spots were identified and are listed in Table 3. KNG1 fragment N-terminal (p<0.00001) and an isoform of A1AT were strongly up-regulated in PLCH patients with respect to controls (Table 3). Figure 2 shows the expression of KNG1 N-terminal fragment (an inflammatory protein never studied in PLCH) in patients and controls. The percentage volume of two spots identified as PEDF (a protease inhibitor) were particularly elevated in patients than controls (p<0.001) (Fig. 3). Another protein involved in cell proliferation, motility, invasiveness and signaling pathways, up-regulated in PLCH with respect to controls (p<0.01) and potentially involved in pathogenesis, is ANXA3 (fig.4).
Thirteen spots were down-regulated in PLCH compared to non-smoker and/or smoker controls (Table 4). The protein spots PIGR, THIO and PLSL were down-regulated in PLCH compared to controls (fig. 5,6,7) and are of particular interest because of their specific functions and potential implication in the disease. Figures 5 and 6 show the trend of expression of PIGR, THIO percentage volumes in patients and controls.
Seventeen spots were also significantly differently expressed between healthy smoker and non-smoker controls, as well as between controls and PLCH patients; 10/17 were identified (table 5). Table 5 is divided in two parts: the first includes protein spots significantly down-regulated in non-smoker compared to smoker controls; the second includes spots up-regulated in non-smoker compared to smoker controls. Among the spots up-regulated in smokers, SPB3 is a protein with anti-protease function identified de novo in BAL; there is no literature on SPB3 and smoke-induced lung damage.

3.3 Multivariate analysis Multivariate statistical analysis by PCA was used to examine global trends in protein
expression in BAL of PLCH patients and non-smoker and smoker controls. These samples were grouped according to the variance of their protein expression (%V) and their spatial distribution is shown in Fig. 9. The first principal component (PC1) explained 49.94% of the variance and the second (PC2) explained a further 20.06%. PCA showed that PLCH and control samples clustered in distinct groups along the PC2 axis. In the control cluster, there were two other distinct groups very close to each other: those of non-smoker and smoker controls.

Discussion BAL protein expression analyzed by 2DE in a population of PLCH patients was compared
with that of control samples. Bioinformatics analysis identified a wide range of spots differently expressed in BAL of PLCH patients with respect to BAL of healthy controls. The effect of cigarette smoking on the expression of some proteins was also evaluated, comparing BAL protein patterns of smoker and non-smoker controls.
4.1 Population The clinical, immunological and functional features of our PLCH patients indicated
prevalently obstructive lung function deficit, increased BAL CD1a+ cells together with neutrophilia and eosinophilia, in line with the literature (36-37).
4.2 Two dimensional electrophoresis Proteomic analysis of BAL revealed 59 spots expressed with quantitative differences and 9
spots expressed with qualitative differences in BAL of PLCH patients with respect to controls. The proteins identified from these spots are involved in specific biological mechanisms (inflammation, immunity, oxidative stress, protease-antiprotease balance, cell proliferation, fibrosis) potentially implicated in the pathogenesis of PLCH. Some of these proteins need to be studied in detail, as they could be useful diagnostic or prognostic biomarkers.
Two proteins never described in BAL were identified de novo: serpin B3 and plastin 2. The first, up-regulated in smokers and higher (with borderline significance p=0.05) in PLCH than controls, is a member of the family of protease inhibitors involved in cell survival and associated with lung cancer (59). The second protein, plastin 2, member of a large family of actin filament cross-linkers, was down-regulated in PLCH patients with respect to smoker controls. Plastin 2 triggers immune response, cell migration, proliferation and cell-adhesion (60) and its role in actin cytoskeleton rearrangement and T-cell activation is crucial. Another function of plastin 2 is protection against TNF-cytotoxicity (61). As cigarette smoke may induce production of tumor necrosis factor-alpha (TNF-α) by alveolar macrophages (62), up-regulation of PLSL2 in BAL of smokers may have a protective role against this pro-inflammatory cytokine. Interestingly in our PLCH patients this mechanism was down-regulated.
The results of our proteome analysis of PLCH BAL suggested the involvement of some immunoinflammatory pathways in its pathogenesis, which is not yet known. For example, the

profibrotic effect of certain proteins could play a key role in development of PLCH. Pigment epithelium derived factor (PEDF) is a protein known to be involved in fibrogenesis. In our study PEDF was significantly higher in BAL samples of PLCH patients than smoker and no-smoker controls. This protein is an endogenous anti-angiogenic factor (63) implicated in a variety of diseases in which angiogenesis is critical, such as non-small cell lung cancer and IPF (62-66). Immunohistochemical studies on IPF located PEDF in fibroblastic foci and areas of active matrix synthesis, where vascular density is low (66). Recent research indicates that PEDF can be regarded as a TGF β1-mediated profibrotic agent (67). These findings suggest that PEDF may be implicated in the regulation of vascular and fibrotic damage occurring in PLCH.
The role of angiogenesis in the pathophysiology of PLCH is controversial. Little data is available about neovascularization in PLCH (68). Senechal et al. recently reported that PLCH lesions were sites of neoangiogenesis and tissue remodelling (69), whereas an immunohistochemical analysis by Zielonka et al. indicated that PLCH granulomas are connected with areas of extensive neoangiogenesis in which interleukin 1 alpha (IL-1α) and TNF-α are over-expressed (70). In contrast to these lung tissue results, it has also been found that serum from PLCH patients inhibited angiogenesis (70). Our study demonstrated that several proteins implicated in vascular remodelling were up-regulated in BAL of PLCH patients versus controls. Annexin A3, for example, is a calcium- and phospholipid-binding protein involved in angiogenesis as well as in cell proliferation, motility, invasiveness and signaling pathways (71, 72). This protein, up-regulated in PLCH patients with respect to controls, is reported in the literature to be over-expressed in lung adenocarcinoma associated with metastases (73). Its multiple functions in PLCH pathogenesis warrants further investigation.
Our study suggests an imbalance between protease and anti-protease with consequent proteolytic-mediated lung damage potentially involved in the pathogenesis of PLCH, confirming previous observations (74). In fact, we found a great abundance of proteolytic fragments of plasma proteins in BAL of PLCH patients, suggesting increased proteolytic activity. In particular kininogen 1 and haptoglobin proteolytic fragments were more highly expressed in BAL of PLCH patients than BAL of controls. An increased anti-proteolytic activity was found expressed by the significant increase of five isoforms of alpha 1-antitrypsin in BAL of PLCH patients with respect to smoker and/or non-smoker controls (74).
Several studies have analyzed smoke-induced oxidative stress in normal subjects but little data is available on the potential role of oxidation in PLCH (75). Glutathione peroxidase 3 is an antioxidant protein with a protective role against cigarette smoke-induced lung inflammation (76). It protects cells and enzymes against oxidative damage by catalyzing the reduction of hydrogen peroxide, lipid

peroxides and organic hydroperoxide by glutathione (76). Interestingly, in our research this protein was significantly higher in smoker than non-smoker controls but almost absent in BAL of PLCH patients (who were all smokers). It should be investigated if there is a defective production or/and an increased consumption in PLCH, as it has been demonstrated that oxidative stress is generally higher in PLCH patients than smoker controls (75). Thioredoxin was another antioxidant protein down-regulated in BAL of PLCH patients with respect to smoker controls. It plays a protective role against cigarette smoke-induced lung oxidative damage (77, 78) and reacts against reactive oxygen species (ROS) and other free radicals which are considered causative factors of smoke-related diseases in humans (79). Thioredoxin counteracts Th2-driven airway inflammation by suppressing local production of macrophage migration inhibitory factor (MIF), irrespective of systemic Th1/Th2 immune modulation (80). Interestingly, THIO is not only down-regulated in PLCH but also in idiopathic pulmonary fibrosis (IPF) (81).
Polymeric immunoglobulin receptor is a transmembrane protein involved in mucosal immunity (mediating transcytosis of polymeric IgA and IgM) (82, 83). This protein was significantly down-regulated in BAL of PLCH patients with respect to controls. Stress, smoking and inflammation can modulate PIGR production through TNF-α and interleukin-1 β (IL1 β), allowing translation of systemic inflammatory signals into mucosal immune responses (84), this mechanism seems to be compromised in PLCH. Recruitment of Langerhans cells in the lungs during exposure to smoke may induce T-helper 1 and T-helper 17 responses in CD4 T cells. Th17 cells produce interleukin 17 (IL17) that enhances secretion of CCL20, a chemoattractant for dendritic cells and matrix metalloproteinase 12 from lung macrophages (85, 86). Th17 and Th1 also promote PIGR activity by production of IL-17 and IL-1 (82); this mechanism creates feedback that induces inflammatory cell recruitment and lung destruction (82). The large quantity of Th17 in smoke-exposed lungs may therefore explain the high levels of PIGR required to amplify the mucosal immune response in BAL of smokers. This protein showed a different pattern in PLCH than in healthy smokers being decreased in PLCH, although PLCH patients were all smokers, suggesting a possible pathogenetic (not smoking related) role. PIGR, Th1 and Th17 immune responses should be deeply investigated in PLCH.
Another interesting protein potentially involved in PLCH pathogenesis could be annexin A1, a cell mediator of the anti-inflammatory action of glucocorticoid (87) that inhibits neutrophil extravasation (88). The inflammatory environment induced by smoking is associated with increased epithelial permeability to neutrophils, macrophages and myeloid dendritic cells (39, 77, 89). Complete loss of ANXA1 found in BAL of PLCH patients may lead to reduced response to
steroids, over-recruitment of neutrophils in the lungs and loss of negative feedback for extravasation.
4.3 PCA In this study, PCA and analysis of the patterns of proteins differently expressed enabled us
to distinguish our BAL samples into three groups (PLCH patients and smoker and non-smoker controls), which was one of our aims. Very high reproducibility was observed between BAL samples and distinct expression patterns in the three groups. Conducting multivariate analysis by PCA, we distinguished three groups in relation to the PC2 y-axis, and observed that non-smoker and smoker controls were both in the upper part of the graph, close together. This suggested that their patterns of protein expression were more similar to each other than to the PLCH group, despite the fact that they, too, were clearly separated, not only suggesting similar characteristics but also that exposure to cigarette smoke induced a modest change in the pattern of protein expression in BAL (smokers versus non-smokers). The position of the PLCH group on the opposite side of PC2 with respect to controls confirmed that the disease group had a protein profile different from that found in a condition of health (fig 9).

Conclusion In conclusion, proteomic analysis of BAL from patients with PLCH and smoker and non-
smoker controls distinguished proteins up- and down-regulated in the disease differently expressed from smoker controls and then disease-related. Among these proteins there were PIGR and thioredoxin. The observation that certain proteins, over-expressed in PLCH patients, are also elevated in IPF suggests common pathways for the development of lung fibrosis (90). Our proteomic study also indicates that oxidative stress, proteolysis and angiogenetic factors may be involved in the pathogenesis of PLCH, although further studies are needed also to assess the impact of other agents including pollution. Our future aim will be to further investigate the functions of the proteins of interest, their potential modifications induced by local damage (i.e. oxidation and proteolysis) and to validate the present results on a larger patients population.

CHAPTER 2
Multivariate analysis of BALF protein expression profiles can help to distinguish between different interstitial lung diseases: Sarcoidosis,
PLCH, IPF, SSc
Introduction 1.1 Interstitial lung diseases 1.1.1 Sarcoidosis Sarcoidosis is a multisystemic granulomatous disease with a pulmonary and
extrapulmonary manifestations. This multisystem disorder has an unpredictable clinical course: acute and chronic progressive variants are distinguished; 15-25% of cases are chronic progressive and may lead to lung fibrosis. The disease may involve young adults; it has an incidence of 3/100000 people/year. It is prevalent in woman and in scandinavian and afro-american populations. The ethiology of this disease is still unknown but an unidentified antigen seems to induce an immune response mediated by alveolar macrophages and lymphocytes. Presumptively, involved antigens are phagocytized from the APC cells as dendritic and macrophage cells inducing a cell-mediate response. This immune reaction determines the lymphocytes T polarization and maturation in T-helper 1 phenotype. Sarcoidosis is more diffused in no-smoker subjects and recently it has been observed, through radiological exams, that in the affected patients, smoke is less associated with broncho-vascular thickening in sarcoidosis patients (91). From the histopathological point of view, sarcoidosis is characterized from no caseating epithelioid granulomas constituted by epithelioid cells as macrophages with abundant eosinophilic cytoplasm and vescicularized nucleus. The granulomas are distributed in lymphatic vessels, in connective tissue around the bronchi, around pulmonary veins, in alveolar spaces and inside the pleura (92). Sarcoidosis is characterized by a T-helper-1 response with accumulation of CD4-positive lymphocytes and activated macrophages in the lungs and affected organs, resulting in granuloma formation. Macrophages and lymphocytes, activated by
inflammatory stimuli, release mediators such as cytokines, chemokines, oxygen radicals and enzymes which may be involved in the pathogenesis. The principal cytokines secreted by alveolar macrophages are IL-2, INF-γ, INF-α and Tumor Necrosis Factor α with a relevant role in the induction and maintaining of inflammation and in granuloma formation. Tumor Necrosis Factor α acts on the cellular recruitment, proliferation and differentiation. Probably, the persistence of granulomatous inflammation may be consequent to a deficiency in the immune response regulatory mechanisms (92, 93).
Among sarcoidosis biomarkers, serum angiotensin converting enzyme (ACE) is a widely used clinical indicator, but its concentrations in serum and BAL, seem to have poor predictive value. Its specificity and sensitivity are very low (ACE may be elevated in various lung diseases and it is associated to genetic polymorphism that modifies its expression in different populations). Other biochemical markers of inflammation in sarcoidosis include lysozyme, cytokines, chemokines and enzymes produced by activated macrophages or lymphocytes. These mediators, that could have roles in the pathogenesis of the disease, have been analyzed in different human body fluids and tissues. The majority of these studies are referred to serum and bronchoalveolar lavage although some referred also to the analysis of expired breath condensate (a recent noninvasive methodology to collect samples directly from the respiratory system) or to different biological fluids. Sarcoidosis is the most widely studied disease through BAL since the beginning of the applications of this procedure. The use of BAL in the study of sarcoidosis had contributed to the definition of its pathogenesis and it has also been useful to identify markers with prognostic/diagnostic value.
This pathology is a challenging research field due to the immunoinflammatory events that characterized its pathogenesis. The study of cytokine pattern in BAL by Th1/Th2 model has allowed to define the immune response characteristic of the disease and to identify some reliable markers with potential clinical applications (94).
The unpredictable clinical course of sarcoidosis has prompted research into biomarkers that could help predict outcome. The need for diagnostic and prognostic markers is a very topical subject for all chest physicians involved with sarcoidosis patients.
The application of proteomic analysis to the study of BAL and serum from sarcoidosis patients allowed the identification of several proteins, some of them represent possible markers of the disease. Some recent studies have documented differently expressed proteins in serum and BAL from sarcoidosis and idiopathic pulmonary fibrosis patients (95). For instance two-dimensional electrophoretic studies on BAL demonstrated that plasmatic proteins were the most abundant in sarcoidosis while low molecular weight proteins were predominant in idiopathic pulmonary fibrosis (96). Different proteins have been proposed thanks to proteomic analysis as inflammatory markers

in sarcoidosis, such as thioredoxin and thioredoxin reductase, serum amyloid A, C-reactive protein and alpha-defensin. C-reactive protein and amyloid A are acute phase proteins released from liver under IL1 and IL6 stimulation.

1.1.2 Idiopathic Pulmonary Fibrosis Idiopathic pulmonary fibrosis (IPF) is a progressive fibro-proliferative disorder
characterized by fibroblast and miofibroblast accumulation in the alveolar walls. IPF affects only lungs and from the histological and radiological point of view is associated with Usual Interstitial Pneumonia (UIP) (97, 98). The incidence of diagnosis is 4.6/100000 people/year in UK and 6.8/100000 people/year in US. 66% of the affected patients are aged around 60 years old. This pathology seems to be more frequent in males respect to females with a prevalence in the smokers. Usually the survival after diagnosis does not exceed 3-5 years (97). IPF has a progressive and variable trend. Three different pathology phenotypes have been proposed: quickly progressive phase, acute exacerbation phase and slow progression phase. In the acute exacerbation phase acute respiratory deficiency occurs dramatically and generally with unknown causes. This phase is associated to disease worsening and high death risk. UIP pattern is not exclusive of IPF but it is also associated with other pulmonary diseases such as systemic sclerosis and other connective tissue lung disorders (LES, rheumatoid arthritis etc..).
The IPF etiopathogenesis is not completely understood but some hypothesis have bee performed. It has been demonstrated a possible association with some genetic polymorphisms. Some genetic alterations of genes codifying for TNF-α, receptor IL-1 antagonist, complement receptor 1, transforming growth factor β1 (TGF-β1) and surfactant proteins A, B and C have been associated with IPF/UIP. The presence of IPF familiar disease suggests further investigations on possible genetic mutations as bases of disease. A probable telomere dysfunction has been associated to the familiar forms and to recent cases of sporadic disease.
IPF is a pathology characterized by a continuous deposition of extracellular matrix reducing the parenchymal lung functionality and the effective gas exchange. Through phenotypic transition, lung epithelial cells dedifferentiate in motile mesenchymal cells such as fibroblasts and myofibroblasts suggesting a tumor ‘metastatic’ mechanisms (99). This transition process begins after the exposure to the TGF-β (100) alone or in combinations with other growth factors such as epidermal growth factor (EGF), determining a matrix metallo-proteases growing expression and consequently a basal membrane degradation with cellular detachment. Cells undergo a cytoskeleton rearrangement and a surface molecules expression alteration, allowing the transition to the mesenchymal phenotype. In the active fibrotic process site, the fibroblasts are particularly induced by TGF- β. Th2 lymphocytes are also able to express a variety of markers such as CD45, CD34, collagen I, fibronectin and a variety of chemokines receptors such as CCR3, CCR5, CCR7, CXCR4 (99). Moreover in IPF, macrophages M2 play a profibrotic role through fibronectin, insulin growth factor (IGF), platelet-derived growth factor (PDGF) release and other mediators, inducing cellular proliferation, collagen

formation and tissue repair. Numerous studies carried out on BAL, serum and tissue shown CCL18 chemokine to be a helpful marker for the disease progression. CCL18 in fact has been recognized as positive feedback mediator between alveolar macrophages and fibroblasts, promoting collagen deposition (101). So the pathology is a consequence of an anomalous fibrotic response due to successive insults to the alveolar epithelium where inflammatory response has a secondary role. Therefore, in IPF the normal reparative response results altered. Also the coagulation system seems to be atypical with a proven increasing in pro-coagulant activity. As before mentioned, in IPF the epithelial cells express numerous cytokines and growth factors, promoting fibroblast migration, proliferation and extracellular matrix accumulation. Numerous studies demonstrate that the synthesis sites of TGF-β1 are iperplastic pneumocytes type II and that the platelet derivation growth factor is synthesized by alveolar epithelial cells. Close to the epithelial cells, fibroblasts play a central role in the disease pathogenesis. It has been hypothesized that the fibroblastic pool expands itself through three ways: local proliferation, epithelial-mesenchymal cell transition with possibility to change into fibroblasts and precursor production to the bone marrow level. Instead, is possible to detect fibrocytes in the peripheral blood and the amount of these cells seems to correlated to the disease progression. Another altered way in IPF is the apoptotic process: fibroblasts and miofibroblasts induce the epithelial cells death, in particular in adjacent fibroblastic foci areas. The basal membrane destruction could play a crucial role in IPF pathogenesis, although the mechanisms are not perfectly understood. Moreover, matrix metallo-proteinases produced by alveolar epithelial cells and involved in tissue damage, are object of study. The typical pathologic pattern of IPF is “Usual Interstitial Pneumonia” (UIP), characterized by the destruction of pulmonary architecture with fibrosis and scattered fibroblastic and miofibroblastic foci, honeycombing distribution in the acinar and lobar zones. The peripheral subpleural parenchyma is generally destroied. The tissue inflammatory reaction is always of light entity. The fibrotic zones appear in different progressive steps and are constituted from dense areas without cells, with collagen and scattered fibroblastic foci. The typical honeycombing areas are constitute from air spaces obtained from fibrotic cystis often full of mucin, covered from bronchiolar epithelium. In the fibrotic zones, in particular in the honeycombing areas, is possible find smooth muscle cells homogeneous iperplasia. Macroscopically the end-stage lung, seems completely unstructured, with cystic formations and thick fibrotic walls that substitute the normal pulmonary parenchyma.
Cigarette smoke is considered a leading cause of IPF and generally all patients affected by IPF are smokers or ex-smokers (99). Still now the pathogenetic role of cigarette smoke is subject of discussion because pulmonary fibrosis associated to cigarette smoke not presents the typical

characteristics of UIP such as honeycombing and fibroblastic foci, while emphysema is present in both the conditions (102).
The medical history of the IPF patients showed that 90% of patients suffering of gastro-oesophageal reflux that with the presence of H. pilori seems to be a further risk factor for IPF onset. Tests on BAL samples have displayed presence of pepsin associated to pulmonary inflammation. Therefore epithelial alveolar damage and fibrosis may be consequent to gastric enzymes, pepsin and bile salts mediated damage (99, 103).
According to the new ATS/ERS guidelines, surgical lung biopsy is necessary only to confirm IPF when the high resolutione computed tomography (HRCT) of the chest is not denitive for IPF/UIP pattern (98). Histological biopsies reveal tissue with normal pulmonary areas interchanged with interstitial areas, honeycombing and fibrotic zones prevalently constituted by dense collagen and diffuse fibroblastic foci in active proliferation. BAL analysis allows to study the alveolar microenvironment and BAL cell analysis in IPF patients shows increased percentage of neutrophils and eosinophils. BAL cytological analysis shows a wide presence of type II alveolar epithelial cells with a characteristic iperplasticity. Reduced lymphocyte CD4/CD8 ratio is commonly observed in BAL. The cytokine profile is prevalently a Th2 phenotype. In BAL fluid, some soluble markers derived from epithelial cells such as cytokeratin 19 (CK19) and the carbohydrate antigen (CA19-9) with chemotactic activity on neutrophils have been observed in vitro (104). A recent biomarker with possible clinical application is the chemokine CCL18.

1.1.3 Pulmonary Langerhans cells histiocytosis Pulmonary Langerhans cells histiocytosis (PLCH) is a rare proliferative disorder
characterized by unchecked proliferation and infiltration at the pulmonary level of immature dendritic cells (DC) also called Langerhans cells (LC). PLCH is a rare cystic lung disease with unknown etiology and different pathogenesis that occurs predominantly in young adults patients (20-40 yrs of age) with a history of current or prior cigarettes smoking. PLCH affects 1/560000 people (105, 106) with unknown ethiology.
PLCH diagnosis is based on HRCT highlighting cysts and nodular lesions. Bronchoalveolar lavage helps the diagnosis as it allows to observe a major amount of CD1+ cells (>5%), macrophages Perls+ and a moderate presence of eosinophiles (<10%). In some cases an hystologic diagnosis may be required. The disease is associated with persistent cough ( 60% of the cases) and dyspnoea (in the 15% of patients). In the 25% of cases PLCH is asymptomatic or associated with general symptoms such as weight loss, temperature, night perspiration and anorexia.
Langerhans cells deriving from dendritic cells, express HLA-DR, S-100 and CD1a. These cells are characterized from an abundant vacuolated cytoplasm with Birbek granules. Proliferating dendritic cells express in anomalously CCR6 and CCR7 receptors that bind respectively CCL20, CCL19 and CCL21. These chemokines are released from lymphonodes, lung, bones, liver and skin (that are the pathological locations of PLCH) (107). Histopathologically, early PLCH lesions are characterized by interstitial cell infiltration in the bronchoalveolar zone. In that infiltration it is possible to find LC, but also lymphocytes, macrophages, eosinophiles, and plasma cells (36). The enlargement of infiltrates determines nodules formation. The internal of the nodules shows cavitations due to enlargement of inflammatory infiltrates. The disease progression is associated with the replacement of granulomatous nodular infiltrates by fibroblasts, shapes stellate lesions showing the classic PLCH histology (108) and by the evolution of nodules in thin wall cysts. In the final stage it is possible to observe prominent fibrotic scars often surrounded from honeycombing areas and paracicatrical emphysema mainly distributed in the upper pulmonary lobes (37). Nodules spontaneously solved, often stopping smoking, while cysts are irreversible, generally multiple with different shapes and dimensions, isolated or confluent (109). PLCH involves smoker subjects (90%) (38), its bronchiolar distribution of the pathologic lesion suggests that an inhaled antigen, such as cigarette smoke, may be involved in its pathogenesis. The correlation among PLCH and smoking is in part corroborate by recent studies. It has been demonstrated that acute tobacco smoke inhalation determine an immediate and selective recruitment of LCs into human airways (39, 40, 110, 111) and affects the expression profile of function-associated surface molecules on airway myeloid DCs (40). Moreover, cigarette smoke promotes survival signals and augments survival of

dendritic cells (42). These results might suggest that the immediate and selective recruitment of LCs into human airways due to smoke exposure, might induce a very early reaction of the adaptive immune system. Therefore, vary smoke-induced mechanisms at the lung level can induce a deeper change of lung condition reflected on protein profile at epithelial, immunological and plasma level. The majority of the ethiopathogenetic studies on PLCH has been performed on epithelial lung biopsy tissue and BAL fluid.

1.1.4 Fibrosis associated with Systemic sclerosis Systemic sclerosis (SSc) is a heterogeneous disorder characterized by endothelial
dysfunction, collagen over-production due to fibroblast altered regulation and abnormality in the immune system responses. The systemic sclerosis on the visceral organs can arise also without cutaneous involvement. The survival is related to the visceral disease gravity. SSc is widely diffused in the world affecting every race. The incidence increased with the age, mainly between forty and fifty years old. Women are more affected respect to men. When SSc is associated with pulmonary involvement the patients have a worse prognosis respect to SSc without lung involvement. In the 90% of the cases Raynaud Syndrome precedes SSc. The pulmonary involvement in SSc is verified in 70% of the patients. In the majority of cases it is an interstitial fibrosis with a marked basal involvement. The interstitial fibrotic course is extremely variable. SSc pulmonary manifestations include vascular pulmonary diseases such as arterial hypertension and venal-occlusive diseases, interstitial lung diseases and increased risk of malignancy (112).
Diagnosis criteria for SSc are proposed by American Rheumatism Association. Pulmonary involvement of SSc is evaluated by respiratory function test, that highlights a restrictive pattern with reduction of vital capacity, residual volume, maximum expired volume in the first second and total lung capacity associated to a decreased diffusion capacity of carbon monoxide. In the previously phases radiography of the chest can be negative, subsequently a bilateral-reticular or reticular-nodilar aspects evolving in honeycombing is described. High resolution computed tomography reveals parenchymal and subpleural micronodules, intralobular opacities with a reticular aspect. The alteration are overall on the lower lobes with a peripheral and posterior distribution. BAL analysis shows the active alveolar inflammation characterized from a cells increment and by percentual increase of neutrophils, eosinophils and/or lymphocytes (113). SSc prognosis is due to the severity of pulmonary involvement but the survival of these patients is better than the survival of IPF/UIP patients. DLCO levels seems to be correlated to the mortality: DLCO<40% is associated to a survival probability of 5 years less of 10%.
Possible pathogenetic agents have been hypothesized, including genetic and environmental factors such as exposition to silica, vinil clorure and organ solvents, drug assumption and viral agents exposition. Pathogenetic mechanisms of lung involvement are not completely understood. Studies on BAL of fibrosis associated SSc patients show alveolar inflammation with neutrophilic or eosinohilic components in the late phase, while lymphocytosis is generally evident in the early phases (inflammatory cells accumulation at the alveolar level precedes the lung damage and represents the first step toward the fibrotic process). The fibrotic lung damage is induced by release of some mediators such as cytokines, chemokines, oxygen free radicals, proteolytic enzymes and
cytotoxic proteins. Among the involved cells on the pulmonary fibrosis associated to SSc there are alveolar activated macrophage; mast cells able to release hystamine and tryptase involved in fibroblast and eosinophil activation. Pathologic alterations in SSc patients are represented by a diffuse interstitial fibrosis, peribronchial formation of connective lung tissue and alveolar membrane thickening. The pulmonary septum breakage leads to the cystic and emphysema areas formation. The secondary vascular alterations and pulmonary hypertension could be associated to the fibrotic lesions and are represented with intima thickening, elastic tonaca fragmentation and muscular hypertrophy in the little pulmonary arteries.
SSc has a remarkable clinical variability with more common manifestations on skin, gastroenteric apparatus, lung, kidney, heart, articulations and muscles. The ontset of the pathology is particularly insidious with the first sign on the Raynaud phenomenon that constitute in a episodic vasocostriction of the small arteries of the hand and feet fingers and sometimes of the nose tip and auricle. These kind of episodes are evocated from cold exposition, vibrations and emotive stress.
Pulmonary involvement is observable almost in two-thirds of the patients. More common symptoms are effort dyspnoea and no-producing cough. In limited scleroderma cutaneous patients it is possible the development of pulmonary arterial hypertension, also without interstitial fibrosis. The ontset of this condition is characterized by worsening of dyspnoea and right heart deficiency. The presence of pulmonary hypertension determines a serious prognosis, with a survival of 2-3 years.
This pathology is classified as ILD because it can have the same radiographic, functional and pathologic characteristics. Although premature diagnosis helped to prevent pulmonary function damage, there is not a correct methodology of premature diagnosis because the first ILD stage is asymptomatic. The patients can perform anti-topoisomerase I/Scl70, anti U3RNP, Th/To and anti-istonic antibodies revealing possible lung involvement in SSc. Often, pulmonary functional tests is able to reveal abnormality (113).
1.2 Bronchoalveolar lavage fluid Lung surface is coated with a thin layer of epithelial lining fluid (ELF) and its presence
preserves the structural integrity of the airways and acts as a protective barrier against infectious and pollutant agents. What makes ELF an interesting sample for the biological studies is the composition because it contains phospholipids, neutral lipids but in particular, proteins from resident cells like pneumocytes and immune system cells such as macrophages and leukocytes. Protein content is amplified from plasmatic proteins by exudation from blood vessels to pulmonary regions. BAL, obtained with a less invasive procedure, is the epithelial lining fluid which bathes the lower respiratory tract of the bronchial, bronchiolar and alveolar surfaces and could be a potential source of biomarkers, useful for research since they contain a wide spectrum of proteins which originate from blood or are locally released by immunological and epithelial cells.
The technique used to obtain this kind of sample is the bronchoalveolar lavage, a minimally invasive procedure, used also in patients with partial respiratory function (94). The recovered physiological solution, instilled in the first tract of the lung, contains a high number of cells and proteins characterizing the pulmonary environment. Bronchoalveolar lavage is performed introducing a bronchoscope into the endotracheal duct until the bronchial tract releases a small amount of sterile saline solution, gently sucked. Bronchoalveolar lavage is a highly advantageous method compared to surgical biopsy because, not only is it less invasive but can be repeated several times. BAL for proteomic analysis is obtained after lung washing and fluid centrifugation, necessary to eliminate the cellular portion (macrophages, leukocytes, etc…) and the supernatant containing proteins is stored.
The proteomic approach to the BAL study is considered extremely useful in order to analyze in depth the pathogenesis of the disease and discover potential prognostic/diagnostic biomarkers. However, potential rewards in the diagnosis and treatment of lung disease make proteomic characterization of BAL a very worthwhile endeavor. As said before, BAL thus collected contains different cell types as well as a wide variety of proteins that either originate from the blood stream or are released locally by epithelial and inflammatory cells. Due to the diverse origin of BAL proteins, analysis of BAL may reveal important pathological mediators and enable more accurate characterization of many lung diseases at the molecular level.
1.3 Proteomic analysis of Sar, PLCH, IPF, fibrosis associated to SSc, sc and nsc Since 2003, Rottoli and co-workers, compared BAL from diffuse lung diseases such as
sarcoidosis, idiopathic pulmonary fibrosis and fibrosis associated with systemic sclerosis highlighting differential expressed spots subsequently studied as possible pathology biomarkers probably involved in the pathologic mechanisms (114). Their complexity and heterogeneity underlined the different pathologies making them object of an interesting research field.
Therefore, the difficulty in distinguishing in terms of diagnosis and prognosis the various ILDs described above, had permitted to elaborate this proteomic work and cigarette smoke involvement in the ILDs onset was also take into consideration in order to identify differentially expressed proteins among different pathologies and between pathologies and smoker and non-smoker controls. Once different protein patterns for each condition were obtained, we set out to confirm that a determined protein expression profile is specific for a unique condition using multivariate analysis. Moreover, thanks to the large amount of experimental data obtained with the proteomic analysis it was possible to perform the Pathways analysis by MetaCore in order to discover new genic products involved in the pathogenesis and specific molecular pathways leading to the disease onset.

2. Materials and methods 2.1 Preparation of BAL Bronchoalveolar lavage samples obtained from 9 patients affected from Sarcoidosis, 7 with
Pulmonary fibrosis associated to systemic sclerosis, 7 with Idiopatic pulmonary fibrosis, 9 with PLCH, 10 no-smoker controls and 8 smoker controls, were carried out with the informed consent of the patient. At the time of the bronchoscopy the patients were not on therapy. First of all, the sample preparation needs a 12h dialysis against four changes of distilled water. The resulting samples were lyophilized and dissolved in the lysis buffer (8M urea, 4% w/v CHAPS, 40mM Tris base, 65mM dithioerythritol (DTE) and trace amounts of bromophenol blue). Before adding bromophenol blue, the protein concentration was determined according to the Bradford method (51). Samples were diluted with lysis buffer to obtain 60µg of proteins in 100µl of solution for analytical run and 900µg of proteins in 200µl of solution for the preparative run.
2.2 Classical 2D-Electrophoresis See chapter 1, paragraph 2.3 2.3 Protein identification by MALDI-ToF-MS See chapter 1, paragraph 2.5 2.4 Protein identification by LC-MS/MS analysis Tryptic digests that did not produce MALDI-TOF unambiguous identifications were
subsequently subjected to peptide sequencing on a nanoscale LC–ESI/MS-MS, as described in detail by Meiring et al. All the analyses were carried out on an LC–MS system consisting of a PHOENIX 40 (ThermoQuest Ltd., Hemel Hempstead, U.K.) and an LCQ DECA IonTrap mass spectrometer ( Finnigan, SanJose, CA, USA). The peptides, after a manual injection (5µL) in a six-port valve, were trapped in a C18 trapping column (20mm x 100µm ID x 360µm OD, Nanoseparations, Nieuwkoop, NL) using a 100% solvent A (HPLC grade water + 0.1% v/v formic acid) at a flow rate of 5µL/min for 10 min. A linear gradient up to 60% solvent B (acetonitrile + 0.1% v/v formic acid) for 30 min was used for analytical separation and, using a pre-column splitter restrictor, we obtained a column flow rate of 100–125 nL/min on a C18 analytical column (30cm x 50µm ID x 360µm OD, Nanoseparations). Before the injection of the next sample, both the trapping and analytical column were equilibrated for 10 min in 100% solvent B and for 10 min in 100% solvent A. The ESI emitter, a gold-coated fused silica (5cm x 25µm ID x 360µm OD, Nanoseparations) was heated to 195°C. A

high voltage of 2kV was applied for stable spray operation. The LC pump, the mass spectrometer as well as the automatic mass spectra acquisitions were controlled using the Xcaliburtm 1.2 system software (Thermo). The MS/MS ion search was carried out in Swiss-Prot/UniprotKB databases using MASCOT. Taxonomy was limited to Homo sapiens, peptide precursor charge was set to 2+ or 3+, mass tolerance to ±1.2Da for precursor peptide and ±0.6Da for fragment peptides was allowed and the number of accepted missed cleavage sites was set to one. Alkylation of cysteine by carbamidomethylation was taken as a fixed modification, while oxidation was considered as possible modifications. We considered significant peptides with individual ion scores (-10*Log[P], where P is the probability that the observed match is a random event) that indicate identity (p<0.05).
2.5 Statistical analysis by Principal Component Analysis Principal Component Analysis (PCA) was carry out to perform multivariate analysis using
STATAsoft software 7.0. For this kind of analysis each %V of each differentially expressed spot in every gel of the six different conditions was used. The PCA finality is simplify the enormous amount of data (%V= variables) by their linear transformation that project the original variables in a new cartesian system where the variables are ordinate in decrease mode. The variable with higher variance is projected on the first axis, the second on the second axis and so on. The reduction of complexity is due to the limitation in the analysis only on the principal (due to the variance) new variables. Thanks to this simplification it is possible to observe the distribution of each sample in a bidimensional plane and easily visualize possible experimental groups on the basis of protein spot expression in BAL (spot maps).
2.6 Network analysis by MetaCore Differentially expressed protein spots, found by image analysis and consequently identified
by MALDI ToF and LC-MS/MS, were further analyzed by pathway analysis using the MetaCore 6.8 network building tool (GeneGo, St, Joneph, MI, USA). MetaCore includes a manually annotated database of protein interactions and metabolic reactions obtained from scientific literature. The gene name of each differential expressed protein found was uploaded into MetaCore network analysis software version 6.8 (http://portal.genego.com) and processed using the shortest-path algorithm. That kind of algorithm consents to link two uploaded experimental proteins, only by a unique Node. Using this process, hypothetical networks were built among the experimental proteins and the MetaCore database proteins. Protein-protein interaction networks were generated. The relevant

pathway maps were then prioritized according to their statistical significance. The networks were graphically visualized by “nodes” representing proteins connected by “Arches”.
Using MetaCore software with the same list of differentially expressed proteins, the enrichment analysis was also elaborated, able to associate biological meaning to some groups of proteins with a statistical significance (p<0.001).

3. Results 3.1 Proteomic analysis The proteomic analysis carried out by 2D electrophoresis and the consequent gel matching
by Image Master 2D Platinum 7.0 of the six conditions considered, have been performed to highlight specific protein patterns to distinguish all pathologies considered and pathologies from both healthy smoker and non-smoker controls. An average of 1800 spots were detected in each gel across groups and every gel of the various condition was matched with its own “Master” gel reported in figure 1. After that, every “Master” gel was matched to the others to compare the different conditions and quantitative protein differences were observed. A total of 15 matching groups were carried out among the conditions (PLCH-SSc, PLCH-IPF, Sar-sc, Sar-nsc, IPF-nsc, IPF-sc, PLCH-Sar, Sar-SSc, Sar-IPF, IPF-SSc, SSc-sc, SSc-nsc, PLCH-nsc, PLCH-sc, sc-nsc) revealing a total of 339 spots up- or down-regulated in relation to the ratio of percentages of relative volumes (%V = Vsingle spot/Vtotal spot) between the same protein spot of two different conditions. The valid ratio was equal to or differed more than 2-fold with a significant T-test value (p<0.05). Of these 339 spots, the identification of 118 proteins have been established by MALDI-ToF-MS and LC-MS/MS. The identified spots are shown in figure 2, reported in a unique gel “Master”. Table 1 reports the identified proteins and provides information about the identification such as protein name, accession number, theoretical and experimental isoelectric point (pI) and molecular weight (MW) and Mascot Search Results with score, number of matched peptide and sequence coverage. The peptide sequences for the LC-MS/MS identified proteins were reported. Moreover, in Table 1 the significant fold change of each protein identified in different match analysis are also reported.
Interestingly, it is possible to realize that many proteins were differentially expressed in more than three groups of analysis such as actin cytoplasmic 1 (ACTB), alpha 1 antichymotrypsin (AACT), alpha 1 antitrypsin (A1AT), antithrombin III (ANT3), pulmonary surfactant associated protein A2 (SFPA2), alpha 2 HS glycoprotein (FETUA), complement C3 (CO3), complement factor H (CFAH), Ig gamma 1 chains C regions (IGHG1), polymeric immunoglobulin receptor (PIGR), protein S100A8 (S10A8), apolipoprotein A1 (APOA1), haptoglobin (HPT), serotransferrin (TRFE), transthyretin (TTHY), zinc alpha 2 glycoprotein (ZA2G), leucin rich alpha 2 glycoprotein (A2GL), peroxinredoxin 5 (PRDX5), glutathione S transferase P (GSTP1), ceruloplasmin (CERU) and many isoforms of albumin (ALBU).
On the other hand, some other proteins were specific for one, two or three groups of analysis such as serpin B3 (SPB3) up-regulated in Sar with respect to sc, leucocyte elastase inhibitor (ILEU) up-regulated in IPF with respect to nsc and Sar, annexin A2 (ANXA2) more expressed in IPF than nsc,

annexin A3 (ANXA3) up-regulated in IPF than sc, annexin A5 (ANXA5) up-regulated in sc with respect to Sar, IPF and nsc. Ig alpha 2 chains C regions (IGHA2) resulted up-regulated in sc with respect to Sar, complement factor B (CFAB) up-regulated in Sar than SSc and complement factor I (CFAI) up-regulated in SSc with respect to IPF. Angiotensinogen (ANGT) resulted more expressed in SSc than both Sar and sc as well as vitamin D binding protein (VTDB). Afamin (AFAM) was up-regulated in PLCH with respect to Sar, fatty acid binding protein (FABP4) was up-regulated in SSc with respect to nsc. Retinol binding protein 4 (RET 4) was more expressed in Sar than sc, instead 14-3-3 protein epsilon (1433E) was up-regulated in SSc with respect to Sar. Selenium binding protein (SBP1) resulted down-regulated in IPF with respect to sc and calcyphosin (CAYP1) was down-regulated in Sar with respect to SSc, kininogen 1 N-terminal (KNG 1) was down-regulated in PLCH with respect to Sar, peptidil prolyl cis trans isomerase (PPIA) was found up-regulated in Sar with respect to both nsc and PLCH. Cystatin B (CYTB) as reported in table 1 resulted up-regulated in PLCH with respect to Sar, plastin 2 (PLSL2) down-regulated in SSc with respect to sc. Instead, immunoglobulin J chain (IGJ) was up-regulated in SSc with respect to nsc. Pulmonary surfactant associated protein D (SFTPD) was up-regulated in Sar and sc with respect to nsc and macrophage mannose receptor 1 (MRC1) resulted more expressed in SSc than in Sar and sc. Pancreatic alpha amylase (AMYP) was down-regulated in SSc with respect to nsc.
3.2 Principal Component analysis Multivariate analysis by PCA was performed by STATISTICA 7.0 software in order to get
an overview of the proteomic data and also to identify possible outliers and trends in the BAL expression data of Sar, SSc, IPF, PLCH patients and non-smoker and smoker controls. Differential analysis data (%V of each differentially expressed protein), were organized in a specific matrix where the columns represented gel maps and the rows showed differentially expressed proteins %V. Matrix was loaded into the software, able to elaborate a graphical visualization of the results.
Gel maps were grouped according to the variance of their protein expression and their spatial distribution is shown in fig.3. The first principal component (PC1) explained 21% of the variance and the second (PC2) explained a further 14.61%. PCA showed that PLCH, Sar, IPF, SSc, sc and nsc gel maps clustered in distinct groups and highlighted the consistent reproducibility among the biological replicates, as spot maps segregate into six experimental groups (encircled by different colours).

3.3 Network analysis by MetaCore Pathways analysis by MetaCore has been considered of relevant importance in order to
extrapolate further notions and hypothesis from the enormous amount of proteomic data. This kind of analysis is based on the concept that the function of a protein depends directly on the context in which the protein acts and MetaCore is able to correlate the 2DE/MS identified proteins with the hypothetical cellular pathways affected by different ILDs or smoking habits. The gene names of the differential expressed proteins were processed by the shortest-path algorithm, consequently only those proteins known to be closely related were included in the resulting path shown in fig.4. Almost all the differential expressed proteins introduced were closely clustered together in the network. Software elaboration had developed a network with Alpha 1-antitrypsin, SERPINA3, 14-3-3 epsilon, SERPINB1 as “central hubs”. A particular transcription factor such as activator protein-1 (AP-1) is a notable “functional node” situated in the center of the map. Fifteen identified proteins are directly connected with AP-1, among those alpha 1 anti-trypsin, one of the “functional nodes” in the map. A1AT directly inhibits a high amount of generic protease. Instead, 1433E interacts with a discrete number of transcription factors such as p53 as well as AP-1. Transcriptional factors are usually present in low levels in the cells and consequently are not detectable by conventional 2DE staining. Network analysis consents taking into consideration transcription factors not obtainable by the proteomic approach.
Thanks to MetaCore, Enrichment analysis was also performed, highlighting specific functional pathways where the differential expressed proteins were particularly involved. The enrichment analysis results are supported by statistical analysis (p<0.01) and are reported in fig. 5. The most important pathway was the immune response, involving the alternative complement pathway and the lectin induced complement pathway. The classical complement pathway is implicated with a minor statistical significance with respect to the others. Some proteins are also actively implicated in blood coagulation and interestingly in Slit-Robo signaling.
4. Discussion Bal samples from 50 subjects belonging respectively to 9 patients affected with Sarcoidosis,
7 with Pulmonary fibrosis associated to systemic sclerosis, 7 with Idiopatic pulmonary fibrosis, 9 with PLCH, 10 non-smoker controls and 8 smoker controls were resolved by 2D electrophoresis and gel images compared by image analysis. Every condition was matched to each other in order to highlight not only characteristic protein patterns of each pathology with respect to healthy conditions but also protein patterns able to distinguish the four different interstitial lung diseases (Sar, PLCH, IPF, SSc). The introduction of two kinds of controls, sc and nsc was indispensable to emphasize the role of cigarettes smoke in the ILDs onset.
4.1 Two dimensional electrophoresis The proteomic analysis performed by classical 2D electrophoresis and image analysis by
Image Master 2D Platinum permitted us to individuate a total of 339 differently expressed spots among the six conditions and 118 protein spots were identified by MALDI ToF and LC-MS/MS.
As suggested, it is possible to subdivide the identified proteins into two parts based on differently expressed proteins found in one, two or three groups of analysis, and the others were found in more than three groups of analysis.
Among differently expressed proteins in one, two or three groups of analysis, many could be considered characteristic for Sarcoidosis such as complement factor B, retinol binding protein 4, kininogen N-fragment, peptidil prolyl cis trans isomerase, apolipoprotein A1, glutathione S transferase P and pulmonary surfactant-associated protein D.
For instance, complement factor B, is more expressed in Sar then SSc and is part of the alternative pathway of the complement system and is cleaved by factor D into 2 fragments: Ba and Bb. Bb, a serine protease, then combines with complement factor 3b to generate the C3 or C5 convertase. It has also been implicated in proliferation and differentiation of preactivated B-lymphocytes, rapid spreading of peripheral blood monocytes, stimulation of lymphocyte blastogenesis and lysis of erythrocytes. Ba inhibits the proliferation of preactivated B-lymphocytes.
PPIA, up-regulated in Sar with respect to nsc and PLCH accelerates the folding of proteins. It catalyzes the cis/trans isomerization of pThr/Ser-Pro motifs and plays an important role in many cellular events such as proliferation, differentiation, and cell death through the effects of conformational change on its functional biological substrates, including Cdc25C, and p53. Recent studies have demonstrated that PPIA plays an important role in oncogenesis and is associated with several human malignancies, including lung and colon cancers (118).

It can also be seen that Kininogen, up-regulated in Sar with respect to PLCH, plays an important role in fibrinolysis (119). Moreover, Kinins can induce an increase in vascular permeability and the local release of kinins on the neutrophil surfaces, is able to open a corridor between endothelial cells and facilitates neutrophil migrations into the interstitial tissue space (120).
SFTPD over expressed in Sar and sc in comparison with nsc, plays a role in the clearance of pathogens and apoptotic cells and can modulate the cellular immune response and has a direct effect on microbacterial growth and plays a role in the regulation of inflammation (121).
In conclusion, these proteins are characterized from their up-regulation in sarcoidosis and particularly, their functions could be involved in the pathogenesis of this disease because they are involved in the complement alternative way and in neutrophil infiltrations as well as in the modulation of the immune response, in the regulation of inflammation and in clearance of microbacterial growth. According to their behavior they could distinguish sarcoidosis from SSc, PLCH, sc and nsc.
In the same protein group it is also possible to observe up-regulated proteins in IPF such as, annexin A2, annexin A3 and leukocyte elastase inhibitor. Moreover, to corroborate leukocyte elastase inhibitor expression data, a high level of free elastase activity was observed in IPF (122) and epithelial cell apoptosis is known to be induced by leukocyte elastase in vitro (123). This can explain the up-regulation of leukocyte elastase inhibitor in IPF compared to nsc and Sar, highlighting not only the difference from a healthy condition but also from another pathology such as sarcoidosis with different pathogenetic onsets. Also annexin A2 (ANXA2) is more expressed in IPF versus non-smoker controls. This protein was originally described as a positive modulator in the fibrinolytic cascade. Moreover, ANXA2 has been implicated in surfactant secretion in the alveolar cell type II by allowing fusion of lamellar bodies with the cell membrane through the membrane-located ANXA2 heterotetramer. ANXA2 seems to play a role in regulation of the actin cytoskeleton and has been implicated in motility and cell migration. Additionally, in an in vitro model of wound healing, it has been recently reported that migrating epithelial cells revealed increased expression of ANXA2. In line with such a notion, expression of ANXA2 was observed in “regenerative” bronchiolar basal cells overlying areas of active fibrosis, as well as in multilayered basal cell sheets of “hyperplastic bronchioles”, and seemed to be associated with bronchiolization of terminal airspaces in IPF lungs (124). Also, annexin 3 (ANXA3) was found up-regulated in IPF patients with respect to smoker controls. The role and function of this anticoagulant protein in the lung has not yet been disclosed. Suppression of ANXA3 expression by RNA interference in primary cultured rat hepatocytes, determine a significant inhibition of hepatocyte growth, indicating a crucial function for this annexin in cell proliferation. Increased expression of ANXA3 has also

been observed in approximately two-thirds of colorectal tumors, and has been more recently reported as a novel biomarker for lymph node metastasis in lung adenocarcinoma (124). Summarizing, in IPF there are over expressed proteins involved in fibrinolysis, cellular growth and there are specific anti-protease to protect against leukocyte elastase damage widely observed in this fibrotic disease underling the possibility to be potential IPF biomarkers.
Distinctive proteins for PLCH and Sar were afamin and cystatin B up-regulated in PLCH with respect to Sar. Interestingly, afamin is a member of the albumin multigene family with vitamin E-binding properties. It plays a crucial role in protecting against oxidative damage (125), probably up-regulated in PLCH because the affected subjects are frequently smokers conversely to subjects with sarcoidosis. The other up-regulated protein, cystatin B, is a cysteine protease inhibitor, whose activity was found significantly higher also in the baboon model of broncho-pulmonary Dysplasia (126). In patients with non small cell lung cancer, high levels of cystatin correlated with increased probability of survival (127) and probably also reflected on PLCH/Sar gravity.
In SSc pathology, complement factor I was found up-regulated with respect to IPF, angiotensinogen, vitamin D binding protein, 1433 protein epsilon (14-3-3 ε), calcyphosin, macrophage mannose receptor 1 with respect to Sar and fatty acid binding protein and immunoglobulin J chain with respect to nsc. Angiotensinogen is the precursor of angiotensin II, an essential mediator in the pathogenesis of pulmonary fibrosis. It has been shown that angiotensin II induces alveolar epithelial cell apoptosis, enhances fibroblast proliferation and lung collagen production, and increases TGF-β1 synthesis. Moreover, serum angiotensin II levels were significantly higher in patients with diffuse cutaneous SSc (128). Recently, it has been observed that the inhibition of angiotensinogen mRNA expression attenuates bleomycin induced lung fibrosis (129).
14-3-3 proteins are ubiquitously expressed as regulatory proteins that primarly function by binding to protein ligands and as a result, interfere with or enhance the ligand’s normal activities. Some of the proteins to which 14-3-3 proteins bind play various roles in apoptosis, mitogenic signal, transduction, DNA replication, and cell-cycle control. Interestingly, many of the ligands that 14-3-3 proteins bind to are proto-oncogene or oncogene products suggesting a potential role in carcinogenesis. In lung cancer, 14-3-3 protein isoforms have been found in all major histological types, but at different expression levels (130). Accumulating evidence indicates that the 14-3-3 proteins play an important role in the regulation of cell differentiation, proliferation and transformation. 14-3-3 isoforms have distinct tissue localizations. It was clear and universal that only two isoforms, 14-3-3 ε and ζ existed in normal lung tissues, suggesting that these two isoforms were essential for normal functions in the lung (131). Also 14-3-3 ε behavior between SSc and Sar,
could be considered indicative to the gravity of the disease. Moreover, further studies on its involvement for these two pathologies could be proposed.
Calcyphosin, up-regulated in SSc with respect to Sar is another interesting protein highly conserved, involved in cell survival, differentiation and transformation (132). Macrophage mannose receptor 1 is a membrane receptor. Characteristically, it was seen to be a specific protein belonging to the surface expression pattern of M2 macrophage phenotypes. Pechkovsky et al. showed that M2 macrophages, activated by Th2 cytokines, are drastically increased in fibrotic lung remodeling as reflected in SSc and IPF. It was also seen that M2 macrophages are increased in the fibrotic phase of Sarcoidosis (133). Interestingly, mannose receptor 1 up-regulation, found in this proteomic analysis, can reflect the fibrotic degree of the pathology considered.
In the end, annexin A5, IGHA2, selenium binding protein 1 and plastin 2 have been found more expressed in sc. Annexin A5 results up-regulated in smoker controls versus Sar, IPF and nsc. It is a phospholipid binding protein that efficiently binds to phosphatidylserine that during early events of apoptosis, becomes externalized to the outer leaflet of the plasma membrane where ANXA5 can bind to it. So ANXA5 essentially marks the cell for safe removal from the system by macrophages. Interestingly, the use of ANXA5 as a clinical tool for visualization of cell death, has been suggested to be important in monitoring pathologies such as atherosclerosis, myocardial infarction, and cancer (130). Therefore, ANXA5 behavior could suggest the increased apoptotic level particularly in smoker’s lungs. IGHA2, a mucosal immunoglobulin was up-regulated in sc with respect to Sar indicating the increased mucosal defense probably due to smoke inhalation. Selenium binding protein 1 was up-regulated in sc with respect to IPF. The reduced expression of this protein was reported in many types of human malignancies including in the lung and in all these studies, higher SBP1 expression correlated with better survival (134). SPB1 down-regulation in IPF with respect to controls and can correlate, also in this case, with the survival aspect. Plastin 2 was up-regulated in sc with respect to SSc. One of plastin 2 roles is to protect from TNF-cytotoxicity (61). Cigarette smoke induces production of tumor necrosis factor-alpha (TNF-α) by alveolar macrophages (62). Up-regulation of PLSL2 in BAL of smokers may have a protective role against this pro-inflammatory cytokine.
Observing the behavior of the proteins, differently expressed in more than three groups of analysis, it is possible to deduce their role to distinguish between a pathological and healthy state. Among these proteins there was pulmonary surfactant associated protein A2, down-regulated in Sar, IPF, SSc and PLCH with respect to smoker and non-smoker controls. SFPA2 is a large, hydrophilic molecule with host defense and immune regulatory functions. This molecule, also known as the hydrophilic surfactant protein (surfactant protein [SP]–A and SP-D) belongs to the class of

collagenous lectins (collectins). The collectins are a small family of soluble pattern recognition receptors containing collagenous regions and C-type lectin domains. SP-A together with SP-D are most abundant in the lung. Because of their structural uniqueness, specific localization, and functional versatility, lung collectins are important players in the pulmonary immune response (135). The SFPA2 reduction trend observed in ILDs, was also investigated by McCormack et al. in BAL and resulted to be non specific to IPF but also occurred in other interstitial lung diseases (136).
Moreover, alpha 1 antichymotrypsin showd an increasing trend in pathologies such as Sar, IPF, SSc, PLCH and also in sc with respect to nsc, probably due to the anti-protease activity because it was shown to be an important mediator in preventing fibrosis. Moreover, it is possible to observe AACT, such as A1AT, another anti-protease, which are mediators affected by smoking habits (137).
Alpha-2-HS-glycoprotein was absolutely up-regulated in the ILDs relatively to the nsc BAL samples. FETUA is a member of extracellular type III cystatine which acts as inhibitors of trypsin, meprin metalloproteinase and TGF-beta-mediated signaling. Although the precise biological role of FETUA remains unknown, recent studies have shown that it regulates immune response and cell adhesion (138).
S100A8 protein was particularly up-regulated in IPF and Sar as opposed to nsc and sc. S100A8 was also found up-regulated in the lung adenocarcinoma and end stage lung cancer tissue (139). This protein (also called calgranulin A) is known to regulate neutrophil, monocyte and lymphocyte migration. It is produced by macrophages, epithelial cells and neutrophils and is a potent chemoattractant of neutrophils. It therefore appears to be a good candidate biomarker in airway inflammation (140, 94).

4.2 Principal Component analysis To examine the relationship existing among the six considered conditions and to
corroborate the biological validity of differential expression patterns found by the image analysis performed by Image Master Platinum dedicated software, we performed a multivariate statistical analysis by PCA. Acquired proteomic data were processed according to the STATISTICA 7.0 software taking into consideration the %V of every differentially expressed protein in each condition. The 50 samples used were grouped according to the variance of their protein expression and their spatial distribution as shown in fig.3. The first principal component (PC1) indicates 21% of the variance and the second (PC2) indicates a further 14.61%. PCA showed that PLCH, Sar, IPF, SSc, sc and nsc samples clustered into distinct groups and their position can be due to the existing relations between the conditions. Conducing multivariate analysis by PCA, we distinguished Sar, PLCH, sc groups from SSc and nsc ones in relation to the PC2 y-axis and all these conditions from IPF on the PC1 x-axis (fig 3). PLCH, Sar and sc groups were in the lower part of the graph, close together suggesting that their protein expression patterns were similar to each other. Moreover, sc is overlapped with Sar conditions emphasizing their similar protein pattern. Interestingly, smoke habits seems to protect from sarcoidosis onset because sarcoidosis patients are often non-smokers, but the belief that smoking is protective for sarcoidosis is not substantiated (141). The position of the SSc and nsc groups is on the opposite side of Sar, PLCH and sc with respect to PC2 y-axis confirmed that SSc and nsc groups had a well distinctive different protein profile from PLCH, Sar and sc. The position of IPF shows a very different protein pattern with respect to the other conditions with a consistent reproducibility between the biological replicates, in fact, seven spot maps obtained from the seven BAL samples are clusterized exactly at the same point suggesting the IPF protein pattern peculiarity. IPF graphical position probably reflects the characteristics of the severity of the disease with respect to the others, leading to death only 3-5 years after the diagnosis.
4.3 Network analysis by MetaCore The necessity to attribute a higher significance to the enormous amount of data obtained by
proteomic approach, needed an ulterior process of network analysis performed by MetaCore software. The network analysis permitted to correlate 2DE/MS-identified proteins and the cellular pathways affected by interstitial lung diseases considered (Sar, IPF, PLCH, SSc) and the MetaCore-produced network, highlights hypothetical processes or particular gene products not necessarily taken into consideration in the proteomic analysis. The network reported in fig 4., shows the differently expressed proteins found such as PLSL2, ANXA2, ANXA3, ANXA5, CERU, SFTPA2, SFTPD, A1AT, ANGT, RBP4, GSTP1, PRDX5, CYTB, PIGR, directly connected to a transcriptional factor, the activator protein-1 (AP-1) considered an important mediator of interstitial lung disease (142). AP-1 has been implicated in a wide range of cellular process including proliferation, death, survival, and differentiation, as well as participating in different biological and pathological process, such as immune and inflammatory responses and tumorigenesis (143). These results confirmed the previous finding regarding proteins involved in fibrinolytic cascade, cell proliferation, cell death, motility and migration as ANXA2, ANXA3 and ANXA5. Moreover, AP-1 transcription factor Fra-1 (encoded by Fosl1) is an important mediator of interstitial lung diseases and it was found that Fra-1 over expression in mice, reduced pro-inflammatory cytokine production in response to injection of lipopolysaccharide (LPS), a Toll-like receptor (TLR)-ligand (142). Li et al. found Src-ERK/AP-1 signaling pathways involved in the TNF-α and TGF-β1 expression induced by silica in macrophages (144). In the network AP-1 is also connected with retinol binding protein 4 and transthyretin, two transport proteins for delivery of retinol to the tissue via circulation (145). Retinol is a nonenzymatic low-molecular-weight antioxidant found in increased levels in BAL in patients affected with IPF and Sar or hypersensivity pneumonie (146). Two spots have been identified as transthyretin and showed an increased trend in ILDs such as Sar, IPF, SSc and PLCH with respect to nsc and sc and one spot was identified as RBP4 resulting up-regulated in Sar with respect to sc. RBP4 and TTHY behaviour, may be part of an adaptive response to oxidative stress. In fact, peroxinredoxin 5 and glutathione S transferase P, proteins involved in the antioxidant defence, also are connected to AP-1. Interestingly, peroxinredoxin 5 is more expressed in IPF and SSc compared to sc and nsc suggesting its particular role in pathological defense from oxidative damage. Instead, Glutathione S transferase P resulted particularly up-regulated in sc with respect to Sar, IPF and nsc suggesting its involvement in defense against smoke effects with respect to pathologies. It is interesting to note that GSTP1 drastically decreased in presence of ILDs as well as in nsc but, while in nsc its low presence may be due to physiological

conditions, in ILDs a defect in protein expression could subsist. Also, the transcriptional factor Nuclear factor-κB (NF-kB) resulted connected with PRXD5 and positively induced GSTP1 as well as PIGR, SFPA2, SERPINA3, FETUA and complement C3. NF-κB in turn is positively induced by transthyretin. It was seen that this transcriptional factor resulted in a transcriptional regulator key of the expression of inflammatory molecules and is activated by TNF-alpha (147). Another important “network Node” resulted in 14-3-3 protein epsilon, already described as a regulatory protein with multiple functions. In fact, 14-3-3 protein epsilon has a positive effect on AP-1 as well as on another important transcriptional factor p53 that in turn positively induce PRDX5 and GTSTP. Moreover, in fig 4 it is possible to observe, according to the MetaCore analysis, alpha 1 antitrypsin, connected to AP-1 that negatively induced many proteases. Based on these results it is possible to further investigate AP-1, NF-kB, p53 pathways that include many of the proteins found in the proteomic analysis and particularly involved in interstitial lung disease pathogenesis.
Thanks to MetaCore it has been possible to elaborate also the enrichment analysis that characterizes the biological attributes in a given protein set. The GO dataset provides a central collection of such attributes already known and assigned to a group of proteins. In figure 5 it is possible to observe the enrichment analysis classification reporting the five most significant pathways where the differentially expressed proteins found were involved. First, second and third paths regard the immune response respectively including alternative, lectin induced and classical complement pathways. The principal proteins identified and involved in these pathways are complement C3, complement factor H, B and I (fig. 5,enrichment analysis report). Interestingly, the fourth discovered pathway by enrichment analysis, comprehended the blood coagulation mechanisms including antithrombin III, kininogen and alpha 1 antitrypsin (fig. 5,enrichment analysis report). It was seen that abnormalities in alveolar coagulation occur in acute and chronic lung injury and according to this, the efficacy of heparin inhaled to attenuate lung fibrosis was studied (148, 149). Also Collard et al. show that in acute exacerbation there is evidence of disordered coagulation (150). The fifth pathway found, regarded the Slit-Robo signaling, principally based on actin cytoplasmic 1, whose main function is to regulate cell migration of leukocytes, endothelial cells and cancer cells observed during lung inflammation (151). Other studies have described involvement of Slit and its receptor also in angiogenesis (152). As you can see, the network and enrichment analysis open a wide range of new hypotheses that need to be further validated.

5. Conclusion Proteomic analysis performed on BAL from patients affected with different interstitial lung
diseases such as Sarcoidosis, Idiopatic Pulmonary Fibrosis, Pulmonary Langerhans Cells Histiocytosis, fibrosis associated with Systemic Sclerosis and both smoker and non-smoker controls allowed us to identify a high number of differently expressed proteins involved in various mechanisms characteristic for ILDs pathogenesis as immune response, inflammation, coagulation, oxidative stress, anti protease activity. The differential expression observed for some proteins underlines the particular involvement in a fixed ILD such as leukocyte elastase inhibitor and annexin A2 in IPF, retinol binding protein 4, kininogen N-fragment, peptidil prolyl cis trans isomerase in Sar. Instead, other proteins differentiate the pathologic state from the healthy conditions such as surfactant protein A2, alpha 1 antichymotrypsin, alpha-2-HS-glycoprotein and protein S100A8.
In order to corroborate the biological validity of differential expression patterns found by image analysis, principal component analysis had shown the respective ILD protein patterns using a graphical representation, highlighting the reproducibility between the biological replicates, above all in IPF samples showing the peculiarity of this pathology with respect to others.
Based on the concept that the function of a protein depends directly on the biological context in which the protein acts, MetaCore network analysis was performed to extrapolate new knowledge, hypothesis and emerging properties from the proteomic data. Interestingly, transcriptional factors, such as AP-1, p53 and NF-kB, not detectable by conventional 2DE staining, have been included in the MetaCore network as well as new signaling pathways not necessarily taken into account in the initial hypothesis and proteomic data, such as coagulation and Slit-Robo signaling.
In conclusion, an interesting future aim could be to validate by western blot, the expression of transcriptional factors suggested from MetaCore analysis in the different interstitial lung diseases. Moreover, could also be interesting to validate the differentially expressed proteins found thanks to the proteomic analysis in order to confirm new ILDs biomarkers.

NUMBER OF PATIENTS 5
AGE 33,15 ± 36,13
GENDER 2 MALE
BAL MACROPHAGES (%) 77,2 ± 15,6
BAL LYMPHOCITES (%) 9,9 ± 19,3
BAL NEUTROPHILES (%) 4,7 ± 2,1
BAL EOSINOPHILS (%) 6,88 ± 3,4
CD1+ 8,1 ± 5,3
OBSTRUCTIV PATTERN 2
RESTRICTIV DEFICIT 1
DECREASED DLCO 5
Chapter 1 Table

Spot letter
Description
AC
pI/MW (KDa)
theoretical
pI/MW (KDa)
Experimental
Mascot Search Results Mean %V ± SD x 10-4
1-way ANOVA p value
Localization
Number of
matched peptide
Sequence coverage
Score
nsc
sc
PLCH
a Serum albumin,
fragment c-term
P02768 5.92 71317
6.30 47485
5 11 64 67±68* 175±56*¥ 0¥ 0,0005 Plasma
b
Serum albumin,
fragment c-term
P02768
5.92 71317
5.90 41761
10
20
128
28±39*
125±69*¥
0¥
0,002
Plasma
d Alcohol dehydrogenase
P14550 6.32 36892
6.44 37399
15 52 223 90±101* 396±159*¥ 0¥ 0,0002 Cytoplasm
e Annexin A1 P04083 6.57 38918
6.57 33339
12 42 179 22±35* 326±265*¥ 0¥ 0,009 Cytoplasm-Nucleo
g Glutathione peroxidase 3
P22352 8.26 25765
5.48 17509
9 34 121 108±40* 386±229*¥ 0¥ 0,001 Plasma
h Beta-2-glycoprotein 1
P02749 8.34 39584
5.89 56152
6 28 91 0* 997±277*¥ 319±253¥
3,27E-05 Plasma
i Serum albumin,
fragment c-term
P02768 5.92 71317
6.25 14042
8 11 78 0§ 61±97¥ 381±254¥§
0,005 Plasma
Table 2. In the table are reported the qualitative differences with their spot letter match those present in fig 1, the protein name, the accession number, theoretical and experimental pI and MW. Mascot Search Results comprehending number of matched peptide, sequence coverage and score. Are also reported %V mean and standard deviation values of the respective protein in every gel of each condition. In the table is also reported ANOVA p-value. Multiple pair-wise comparison was performed using a Tukey post hoc test (p≤0.05). Smoking controls (sc) means that significantly differ from no-smoking controls (nsc) means are visualized by *, while smoking controls means significantly differing from Langerhans cell Histiocytosis (HX) ones are visualized by ¥; and significant differences occurring between no-smoking controls and Langerhans cell Histiocytosis are shown by §

No. of spot
Protein name
AC Theoretical
pI/Mr (KDa)
Experimental
pI/Mr (KDa)
Mascot search result Mean %V ± SD x 10-4 1-way ANOVA p value
Folds in Localization No. of
matched peptide
Sequence
coverage (%)
Score nsc sc PLCH Nsc-sc Nsc-PLC
H
Sc-PLC
H
PLCH>nsc and/or sc 1 Kininogen-
1, fragment N-term
P01042 6.34 72996
4.95 61092
11 18 118 543±105§ 225±214¥ 5393±1864¥§
8.97E-06
2.41 9.93§ 23.96¥
Secreted-extracellular space
2 Ig alpha-1 chain C region
P01876 6.08 38486
5.98 60221
8 25 116 879±788§ 206±207¥ 3179±1685¥§
0,002 4.26 3.61§ 15.43¥
Secreted
3 Pigment epithelium
P36955 5.97 46484
5.61 49075
8 24 111 405±176§ 281±87¥ 1230±693¥§
0,007 1.44 3.03§ 4.37¥ Secreted
4 Pigment epithelium
P36955 5.97 46484
5.69 49222
8 21 114 326±211§ 307±182¥ 767±260¥§ 0,009 1.06 2.35§ 2.49¥ Secreted
5 Haptoglobin, fragment c-
term.
P00738 6.13 45861
5.26 40355
12 31 114 446±69§ 432±180¥ 2062±1186¥§
0,003 1.03 4.62§ 4.77¥ Plasma
6 Creatine kinase B-
type
P12277 5.34 42902
5.31 41841
7 26 108 267±146§ 161±93¥ 749±306¥§ 0,001 1.65 2.80§ 4.65¥ Cytoplasm
7 Annexin A3 P12429 5.63 36524
5.59 31681
8 32 111 158±159§ 127±54¥ 530±318¥§ 0,017 1.24 3.35§ 4.17¥ Cytoplasm
8 Alpha-1 anti tripsin
P01009 5.37 46878
4.84 53626
15 46 212 1491±1178§
299±413¥ 5425±817¥§
1,79E-06
4.98 3.63§ 18.14¥
Plasma
9 Alpha-1 anti tripsin
P01009 5.37 46878
4.80 54359
8 27 107 495±979§ 28±64¥ 2644±1473¥§
0,003 17.6 5.34§ 94.42¥
Plasma
10 Ceruloplasmin
P00450 5.44 122983
5.10 131973
11 13 134 135±118§ 154±149¥ 496±121¥§ 0,001 1.14 3.67§ 3.22¥ Plasma
11 Alpha-1-antitrypsin
P01009 5.37 46878
4.96 58032
13 41 175 288±221§ 423±204¥ 1359±551¥§
0,001 1.46 4.71§ 3.21¥ Plasma
12 Serotransferrin
P02787 6.81 79280
6.05 60048
8 11 102 415±322§ 162±219¥ 2655±1223¥§
0,0003 2.56 6.39§ 16.38¥
Plasma
13 Serotransferrin
P02787 6.81 79280
6.00 80091
11 19 112 623±170§ 672±576¥ 3255±2316¥§
0,016 1.07 5.22§ 4.84¥ Plasma
14 Pyruvate kinase
isozymes
P14618 7.96 58470
6.47 58174
11 28 105 276±236§ 642±290¥ 1391±596¥§
0,003 2.32 5.03§ 2.16¥ Cytoplasm-Nucleus
15 Apolipoprotein A-I
P02647 5.56 30759
5.03 23065
8 26 99 179±103§ 276±197¥ 924±371¥§ 0,0009 1.54 5.16§ 3.34¥ Plasma
16 Hemoglobin subunit beta
P68871 6.75 16102
6.77 11120
11 77 155 109±131§ 328±123¥
650±233¥§ 0,001 3.00 5.96§ 1.98¥ Blood
17 Ceruloplasmin
P00450 5.44 122983
5.13 130654
15 18 123 259±183§ 180±179¥ 564±99¥§ 0,005 1.43 2.17§ 3.13¥ Plasma
18 Alpha-1-antitrypsin
P01009 5.37 46878
4.70 50566
11 32 143 277±290 93±77¥ 599±288¥ 0,018 2.97 2.16 6.44¥ Plasma
19 Actin, cytoplasmic
1
P60709 5.29 42052
5.07 40664
9 28 107 867±437 320±272¥ 1071±348¥
0,016 2.70 1.23 3.34¥ Cytoskeleton
20 Ceruloplasmin
P00450 5.44 122983
5.16 130000
10 11 101 306±223 201±151¥ 537±137¥ 0,02 1.52 1.75 2.67¥ Plasma
21 Serotransferrin
P02787 6.81 79280
6.07 80.091
16 22 166 1085±228§ 1831±559 4471±2939§
0,022 1.68 4.12§ 2.44 Plasma
22 Serotransferrin
P02787 6.81 79280
6.14 79397
18 23 188 2376±300§ 3235±879 4969±1743§
0,01 1.36 2.09§ 1.53 Plasma
23 Fibrinogen gamma chain
P02679 5.37 52106
5.52 53481
10 28 133 511±354§ 766±671 2649±2055§
0,039 1.49 5.18§ 3.45 Plasma
24 Alpha-1-antitrypsin
P01009 5.37 46878
5.29 54009
8 27 121 197±222§ 641±651 1938±1200§
0,01 3.25 9.83§ 3.02¥ Plasma
Table 3. Table reporting identified proteins up-regulated in PLCH BAL respect to smoker and/or no-smoker controls with their spot number match those present in fig 1, the protein name, the accession number, theoretical and experimental pI and MW. Mascot Search Results comprehending number of matched peptide, sequence coverage and score. Are also reported %V mean and standard deviation values of the respective protein in every gel of each condition. In the table is also reported ANOVA p-value. Multiple pair-wise comparison was performed using a Tukey post hoc test (p≤0.05). Smoking controls (sc) means that significantly differ from no-smoking controls (nsc) means are visualized by *, while smoking controls means significantly differing from Langerhans cell Histiocytosis (HX) ones are visualized by ¥; and significant differences occurring between no-smoking controls and Langerhans cell Histiocytosis are shown by §

No. of spot
Protein name AC Theoretical
pI/Mr (KDa)
Experimental pI/Mr (KDa)
Mascot search result
Mean %V ± SD x 10-4 1-way ANOVA p value
Folds in Localization
No. of
matched
peptide
Sequence
coverage (%)
Score nsc sc PLCH Nsc-sc
Nsc-PLCH
Sc-PLC
H
PLCH< nsc and/or sc 25 Polymeric
immunoglobulin receptor
P01833 5.58 84429
5.14 87377
10 18 129 2901±438§
3037±1038¥
911±694¥
§ 131E-05 1.04 3.18§ 3.33¥ Cell membrane
26 Thioredoxin P10599 4.82 12015
4.67 12098
6 40 82 665±113
1492±819¥
230±235¥ 0,005 2.24 2.89 6.48¥ Cytoplasm-Secreted
27 Plastin-2 P13796 5.20 70815
5.19 61983
10 21 102 873±355
1272±320¥
453±386¥ 0,01 1.45 1.92 2.80¥ Cytoplasm-Cytoskeleton-Cell junktion
28 Serum albumin P02768 5.92 71317
6.04 57513
8 14 92 1830±647
2980±827¥
1239±1363¥
0,04 1.62 1.47 2.40¥ Plasma
29 Serum albumin, fragment N-term
P02768 5.92 71317
6.09 31059
6 9 74 278±137
405±224¥
124±83¥ 0,049 1.45 2.24 3.26¥ Plasma
30 ADP-ribosylation factor-like protein
3
P36405 6.74 20614
7.37 21404
6 52 107 305±161
621±331¥
142±49¥ 0,012 2.03 2.14 4.37¥ Membrane
31 Alpha-1B-glycoprotein
P04217 5.58 54809
5.16 75685
8 22 109 1370±414§
1163±443
663±83§ 0,022 1.17 2.06§ 1.75 Plasma
Table 4. Table reporting identified proteins down-regulated in PLCH BAL respect to no-smoker and/or smoker subjects with their spot number match those present in fig 1, the protein name, the accession number, theoretical and experimental pI and MW. Mascot Search Results comprehending number of matched peptide, sequence coverage and score. Are also reported %V mean and standard deviation values of the respective protein in every gel of each condition. In the table is also reported ANOVA p-value. Multiple pair-wise comparison was performed using a Tukey post hoc test (p≤0.05). Smoking controls (sc) means that significantly differ from no-smoking controls (nsc) means are visualized by *, while smoking controls means significantly differing from Langerhans cell Histiocytosis (HX) ones are visualized by ¥; and significant differences occurring between no-smoking controls and Langerhans cell Histiocytosis are shown by §

No. of spot
Protein name
AC Theoretical
pI/Mr (KDa)
Experimental
pI/Mr (KDa)
Mascot search result Mean %V ± SD x 10-4 1-way ANOVA p value
Folds in Localization No. of
matched
peptide
Sequence coverage
(%)
Score
nsc sc PLCH Nsc-sc Nsc-PLCH
Sc-PLC
H
Nsc<sc and/or PLCH sc>PLCH 32 Serum
albumin P02768 5.92
71317 6.01
56684 13 24 163 601±414* 1372±30
6*¥ 418±277¥ 0,001 2.28* 1.43 3.28¥ Plasma
33 Serum albumin
P02768 5.92 71317
6.09 56847
9 14 116 601±176* 1372±170*¥
418±323¥ 7,278E-05
2.28* 1.43 3.28¥ Plasma
34 Ig gamma-1 chain C
region
P01857 8.46 36596
7.16 35601
7 32 113 103±63* 343±228*¥
31±44¥ 0,01 3.33* 3.32 11.06¥
Secreted
35 IgG kappa chain
gi|4176418
6.92 23690
6.51 24549
5 39 94 712±776* 3006±931*¥
969±904¥ 0,002 4.22* 1.36 3.10¥ Secreted
36 Serum albumin,
fragment c-term
P02768 5.92 71317
5.55 40910
10 19 138 66±61* 326±254*¥
33±25¥ 0,019 4.93* 2.00 9.87¥ Plasma
37 Haptoglobin, fragment
c-term.
P00738 6.13 45861
5.47 42815
12 24 105 691±316* 1328±216*¥
349±144¥ 9,61E-05
1.92* 1.97 3.80¥ Plasma
38 Serpin B3 P29508 6.35 44594
6.34 39874
10 33 138 90±88* 233±100*
161±55 0,05 2.58* 1.78 1.44 Cytoplasm
39 Serum albumin
P02768 5.92 71317
5.55 38760
9 16 121 61±56*§ 287±134*
302±147§ 0,013 4.70* 4.95§ 1.05 Plasma
Nsc>sc and/or PLCH 40 Immunoglo
bulin light chain
gi|149673887
6.97 23665
8.69 24747
8 59 127 3126±2050*§
653±780*
848±709§ 0,022 4.78* 3.68§ 1.29 Secreted
41 Purine nucleoside phosphoryl
ase
P00491 6.45 32325
6.40 29822
8 31 128 355±141*§
36±33* 136±166§ 0,005 9.86* 2.61§ 3.77 Cytoplasm-Cytoskeleton
Table 5. Table reporting identified proteins down-regulated in nsc BAL respect to smoker and/or PLCH and protein up-regulated in sc respect to PLCH. The last three proteins are up-regulated in nsc respect to sc and/or PLCH, with their spot number match those present in fig 1, the protein name, the accession number, theoretical and experimental pI and MW. Mascot Search Results comprehending number of matched peptide, sequence coverage and score. Are also reported %V mean and standard deviation values of the respective protein in every gel of each condition. In the table is also reported ANOVA p-value. Multiple pair-wise comparison was performed using a Tukey post hoc test (p≤0.05). Smoking controls (sc) means that significantly differ from no-smoking controls (nsc) means are visualized by *, while smoking controls means significantly differing from Langerhans cell Histiocytosis (HX) ones are visualized by ¥; and significant differences occurring between no-smoking controls and Langerhans cell Histiocytosis are shown by §

Chapter 2 Table

Table 1. Table reporting identified proteins with spot numbers match those present in fig 2, protein name, accession number, theoretical pI and MW, Mascot Search Results comprending number of matched peptide, sequence coverage, score and sequence peptide when proteins are identified to LC-MS/MS. In the last part of the table is reported the fold change of each analysis with statistical significance: *= p<0.05, **= p<0.01.

Mr KDa
10
200
Non linear IPG pH 3.5 pH 10
1
14
25
50
55
32
1
38 34
33
26
59
42 27 28
48
44 45
46
51 29
35 30
57
36 37
14
24 18 49
3 4
6 19
5 47
7
15
58
13 21
22
31
12 2
8 23
39
52
16
53
a
b c
d e
f
g
h
i
11
41
PLCH
9
10 17 20
54
40
56
43
nsc
26
54
55
16 59 57
58 i
56
10 17
25
31 42 27 1
8 18
11 24 23
3 4
13 21 22
44 45 19
5 46
47 6
37 36
39
7
15
30
40 53
35
52
41
e
d 50 34
32 33
a b
c
38
28 h
48
49
29 51 f
g
9 14
2 12
Non linear IPG pH 3.5 pH 10
sc
25
50
54
55
32
1
38
34
33
26
59
42 27 28 48
44 45
46
51 29
35
30
57
36 37
40
11 14 24
18 49 3 4
6 19 5
47
7
15
58
13 21
22 31
12
8 23
39
52
16
9
53
a
b
c d e
f
g
h
i
41
10 17
20
56
43
Mr KDa
10
200
Non linear IPG pH 3.5 pH 10
43
Fig 1. Gels Master of PLCH, smoker control (sc), no-smoker control (nsc). In every gel master are reported the proteins quantitatively (number-circle) and qualitatively (letter-square) differentially expressed.
2
20
CHAPTER 1 Figure
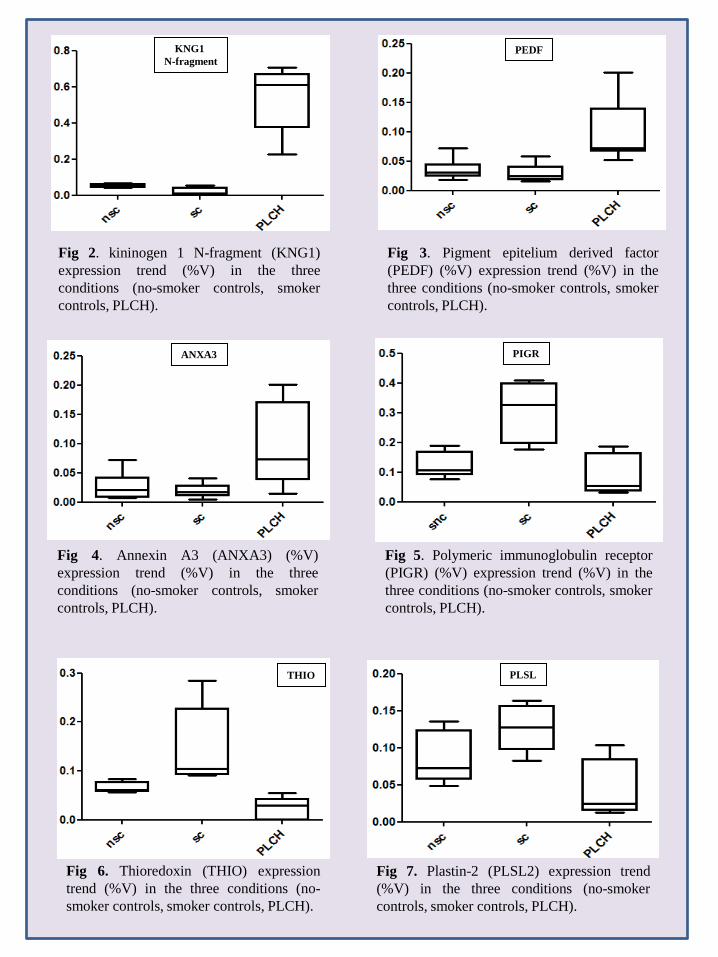
Fig 2. kininogen 1 N-fragment (KNG1) expression trend (%V) in the three conditions (no-smoker controls, smoker controls, PLCH).
Fig 3. Pigment epitelium derived factor (PEDF) (%V) expression trend (%V) in the three conditions (no-smoker controls, smoker controls, PLCH).
Fig 4. Annexin A3 (ANXA3) (%V) expression trend (%V) in the three conditions (no-smoker controls, smoker controls, PLCH).
Fig 5. Polymeric immunoglobulin receptor (PIGR) (%V) expression trend (%V) in the three conditions (no-smoker controls, smoker controls, PLCH).
Fig 6. Thioredoxin (THIO) expression trend (%V) in the three conditions (no-smoker controls, smoker controls, PLCH).
Fig 7. Plastin-2 (PLSL2) expression trend (%V) in the three conditions (no-smoker controls, smoker controls, PLCH).
KNG1 N-fragment
PEDF
ANXA3 PIGR
THIO PLSL

Fig 8. Serpina B3 (SPB3) expression trend (%V) in the three conditions (no-smoker controls, smoker controls, PLCH).
SPB3
PC2:
20,
06%
PC1: 49,94%
Fig 9. Principal component analysis (PCA) perfectly clusterize 15 spot maps obtained from 15 BAL into three groups. Each group perfectly correspond to each treated condition: nsc (green), sc (red), PLCH (blu).
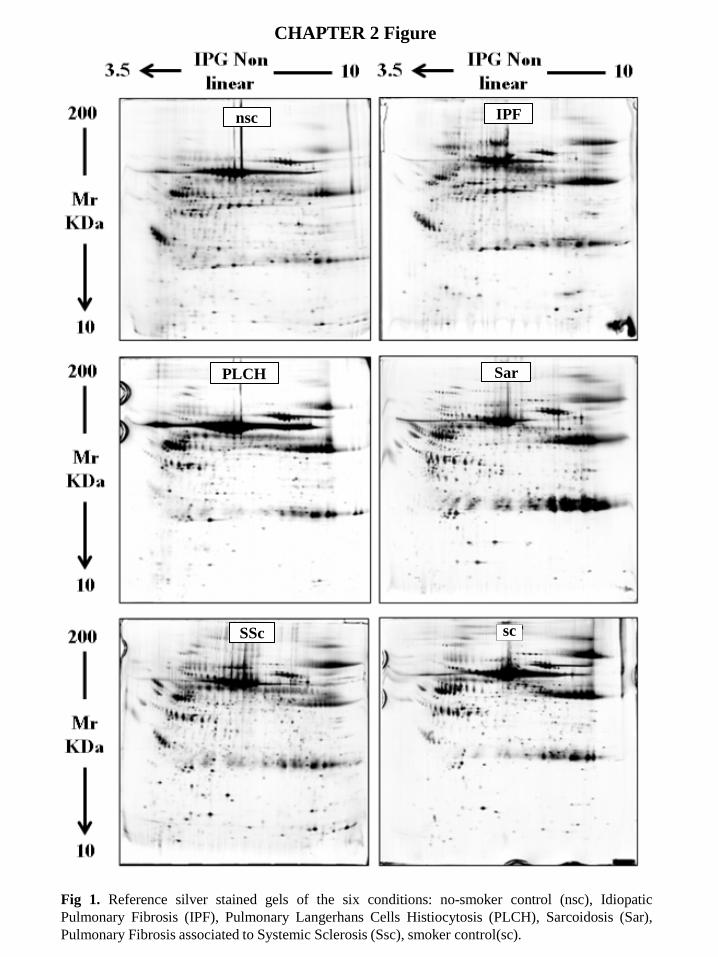
Fig 1. Reference silver stained gels of the six conditions: no-smoker control (nsc), Idiopatic Pulmonary Fibrosis (IPF), Pulmonary Langerhans Cells Histiocytosis (PLCH), Sarcoidosis (Sar), Pulmonary Fibrosis associated to Systemic Sclerosis (Ssc), smoker control(sc).
sc SSc
PLCH Sar
nsc IPF
CHAPTER 2 Figure

1
2
3 4 5
6 7
8 9
10
11
12 13 14
15 16
17
18
19
20
21 22
23 24
25 26
27 28
29
30
31
32
33
34
35
36
37
38 39 40
41
42 43 44
45 46 47
48
49 50
51
95 52
53
54
55
56
56 58
59
60
61
62
63
64
65
66
67 68
69
70
71
72
73
74
75
76
77
78
79 80
81 82
83 84
85
86
87
88
89 90 91
92 93
94
96 97
98 99
IPG non linear 3.5 10
100 101
102
103 104 105
106 107
108
109
110
111
112
113
114
115
116
117
118
Mr KDa
10
200
Fig 2. Spot map reporting identified differential expressed spots among six different conditions (Sar, PLCH, SSc, IPF, nsc, sc).

Ssc Ssc
Ssc Ssc Ssc Ssc Ssc
PLCH PLCH PLCH
PLCH PLCH PLCH PLCH PLCH
PLCH
IPF IPF IPF IPF IPF IPF IPF
Sar Sar Sar Sar
Sar
Sar Sar Sar Sar
nsc nsc nsc nsc
nsc nsc
nsc
nsc nsc
nsc
sc
sc
sc sc
sc sc sc sc
-1,0 -0,5 0,0 0,5 1,0
Factor 1 : 21,00%
-1,0
-0,5
0,0
0,5
1,0
Fact
or 2
: 14
,61%
Fig 3. Principal Component Analysis (PCA) perfectly clusterize 50 spot maps obtained from 50 BAL into six groups. Each group perfectly correspond to each treated condition: nsc (blue), sc (black), SSc (orange), Sar (green), PLCH (sky blu), IPF (red).
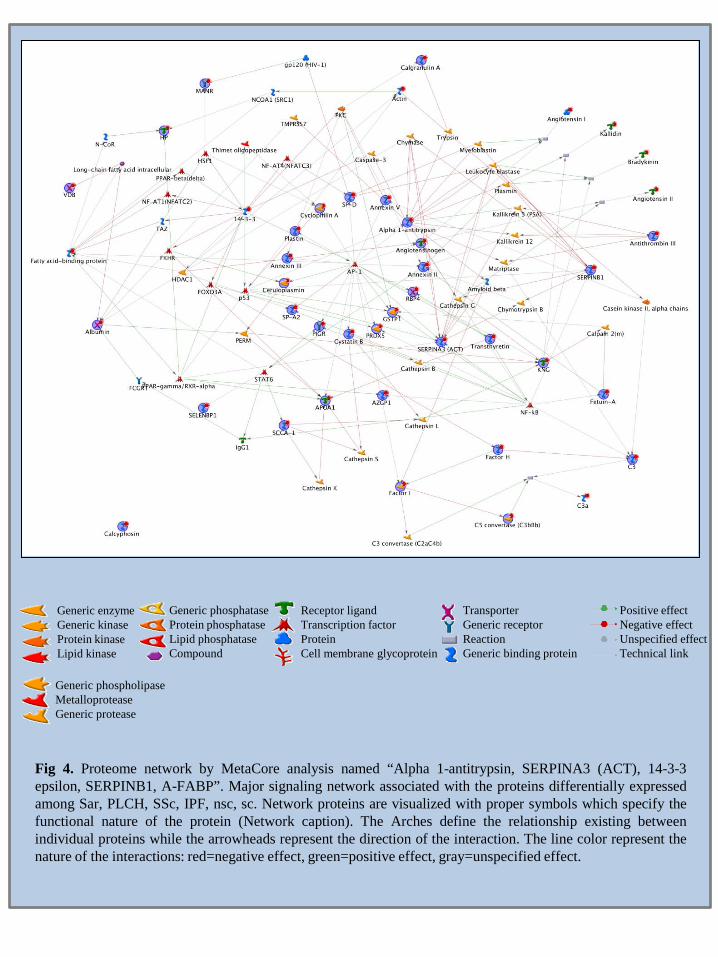
Fig 4. Proteome network by MetaCore analysis named “Alpha 1-antitrypsin, SERPINA3 (ACT), 14-3-3 epsilon, SERPINB1, A-FABP”. Major signaling network associated with the proteins differentially expressed among Sar, PLCH, SSc, IPF, nsc, sc. Network proteins are visualized with proper symbols which specify the functional nature of the protein (Network caption). The Arches define the relationship existing between individual proteins while the arrowheads represent the direction of the interaction. The line color represent the nature of the interactions: red=negative effect, green=positive effect, gray=unspecified effect.
Generic enzyme Generic kinase Protein kinase Lipid kinase
Generic phosphatase Protein phosphatase Lipid phosphatase Compound
Receptor ligand Transcription factor Protein Cell membrane glycoprotein
Transporter Generic receptor Reaction Generic binding protein
Positive effect Negative effect Unspecified effect Technical link
Generic phospholipase Metalloprotease Generic protease
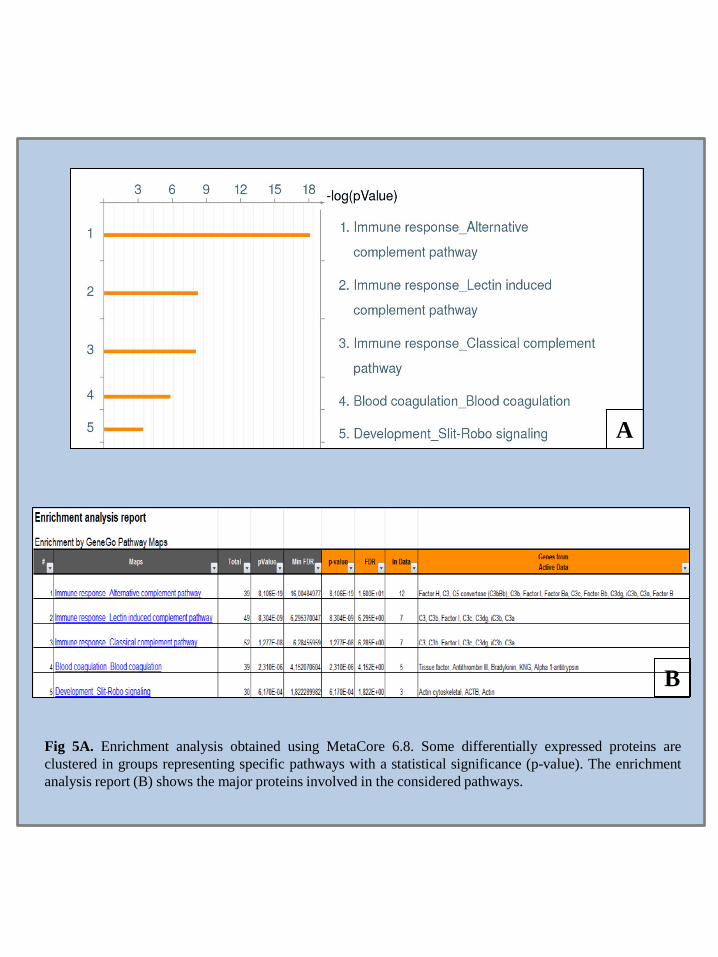
Fig 5A. Enrichment analysis obtained using MetaCore 6.8. Some differentially expressed proteins are clustered in groups representing specific pathways with a statistical significance (p-value). The enrichment analysis report (B) shows the major proteins involved in the considered pathways.
A
B

Abbreviations ILD Interstitial lung disease PLCH Pulmonary Langerhans Cell Histiocytosis Sar Sarcoidosis IPF Idiopathic Pulmonary Fibrosis SSc Systemic Sclerosis Sc smoker control Nsc no-smoker control LC Langerhans cells DC dendritic cells BAL BronchoAlveolar Lavage HRCT High Resolution Computed Tomography PFT Pulmonary Function Test MS Mass Spectrometry. GO Gene Ontology MALDI-ToF Matrix Assisted Laser Desorption/Ionization-Time of Flight LC MS/MS Liquid Chromatography tandem mass spectrometry ESI-MS/MS electrospray ionization ion trap tandem mass spectrometry 2D-PAGE Two dimensional-polyacrilammide gel electrophoresis SDS Sodium Dodecyl Sulphate PCA Principal Component Analysis UIP Usual Interstitial Pneumonia TGF-β Transforming Growth Factor β EGF epidermal growth factor IGF insulin growth factor PDGF platelet-derived growth factor ELF Epithelial Lining Fluid DTE dithioerythritol ACTB actin cytoplasmic 1 AACT alpha 1 antichymotrypsin A1AT alpha 1 antitrypsin SFPA2 pulmonary surfactant associated protein A2 FETUA alpha 2 HS glycoprotein CO3 complement C3 CFAH complement factor H
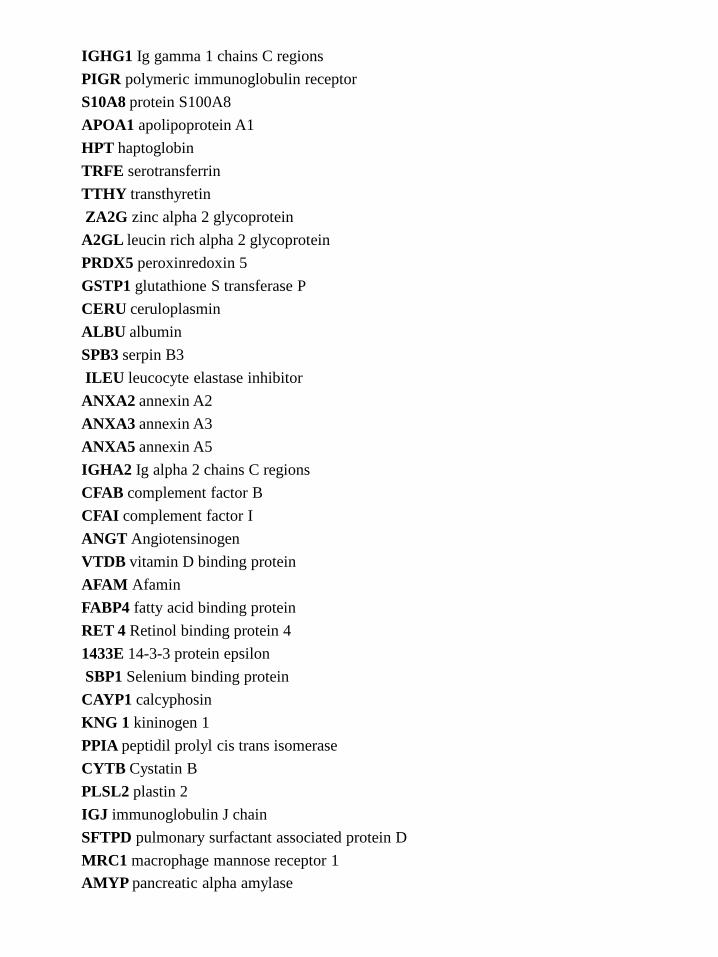
IGHG1 Ig gamma 1 chains C regions PIGR polymeric immunoglobulin receptor S10A8 protein S100A8 APOA1 apolipoprotein A1 HPT haptoglobin TRFE serotransferrin TTHY transthyretin ZA2G zinc alpha 2 glycoprotein A2GL leucin rich alpha 2 glycoprotein PRDX5 peroxinredoxin 5 GSTP1 glutathione S transferase P CERU ceruloplasmin ALBU albumin SPB3 serpin B3 ILEU leucocyte elastase inhibitor ANXA2 annexin A2 ANXA3 annexin A3 ANXA5 annexin A5 IGHA2 Ig alpha 2 chains C regions CFAB complement factor B CFAI complement factor I ANGT Angiotensinogen VTDB vitamin D binding protein AFAM Afamin FABP4 fatty acid binding protein RET 4 Retinol binding protein 4 1433E 14-3-3 protein epsilon SBP1 Selenium binding protein CAYP1 calcyphosin KNG 1 kininogen 1 PPIA peptidil prolyl cis trans isomerase CYTB Cystatin B PLSL2 plastin 2 IGJ immunoglobulin J chain SFTPD pulmonary surfactant associated protein D MRC1 macrophage mannose receptor 1 AMYP pancreatic alpha amylase

• Reference • • Lee JM, Han JJ, Altwerger G, Kohn EC. Proteomics and biomarkers in clinical trials for
drug development. J Proteomics. 2011 May 4. [Epub ahead of print] • Antonov AV, Dietmann S, Rodchenkov I, Mewes HW. PPI spider: a tool for the
interpretation of proteomics data in the context of protein-protein interaction net. Proteomics. 2009 May;9(10):2740-9.
• Alberio T, Fasano M. Proteomics in Parkinson's disease: An unbiased approach towards peripheral biomarkers and new therapies. J Biotechnol. 2011 Sep 2. [Epub ahead of print]
• Rabilloud T, Lelong C. Two-dimensional gel electrophoresis in proteomics: a tutorial. J Proteomics. 2011 Sep 6;74(10):1829-41. Epub 2011 Jun 12.
• Monteoliva L, Albar JP. Differential proteomics: an overview of gel and non-gel based approaches. Brief Funct Genomic Proteomic. 2004 Nov;3(3):220-39.
• Wilkins MR, Appel RD, Van Eyk JE, Chung MC, Görg A, Hecker M, Huber LA, Langen H, Link AJ, Paik YK, Patterson SD, Pennington SR, Rabilloud T, Simpson RJ, Weiss W, Dunn MJ. Guidelines for the next 10 years of proteomics. Proteomics. 2006 Jan;6(1):4-8.
• Bjellqvist B, Ek K, Righetti PG, Gianazza E, Gorg A, Westermeier R, Postel W. Isoelectric focusing in immobilized pH gradients: principle, methodology and some applications. J.Biochem. Biophys. Methods. 1982 Sep, 6 (4): 317-39.
• Nelson DL, Cox MM. Lehninger. Principles of Biochemistry. 2000; 89-90, 92-94, 102, 325. • Hochstrasser DF, Harrington MG, Hochstrasser AC, Miller MJ, Merril CR. Methods for
increasing the resolution of two-dimensional protein electrophoresis. Anal Biochem Sep. 1988;173(2):424–35.
• Görg A, Obermaier C, Boguth G, Weiss W. Recent developments in two-dimensional gel electrophoresis with immobilized pH gradients: wide pH gradients up to pH 12, longer separation distances and simplified procedures. Electrophoresis. 1999 Apr-May;20(4-5):712-7.
• Shevchenko A, Jensen ON, Podtelejnikov AV, Sagliocco F, Wilm M, Vorm O, Mortensen P, Shevchenko A, Boucherie H, Mann M. Linking genome and proteome by mass spectrometry: large-scale identification of yeast proteins from two dimensional gels. Proc Natl Acad Sci U S A. 1996 Dec 10;93(25):14440-5.
• Langen H, Takács B, Evers S, Berndt P, Lahm HW, Wipf B, Gray C, Fountoulakis M. Two-dimensional map of the proteome of Haemophilus influenzae. Electrophoresis. 2000 Jan;21(2):411-29.
• Berth M, Moser FM, Kolbe M, Bernhardt J. The state of the art in the analysis of two dimensional gel electrophoresis images. Appl Microbiol Biotechnol. 2007; 76: 1223-1243.
• Hunt DF. Personal commentary on proteomics. J Proteome Res. 2002;1:15-19. • Gevaert K, Vandekerckhove J. Protein identification methods in proteomics.
Electrophoresis. 2000 Apr;21(6):1145-54. • Cohen SL, Chait BT. Influence of Matrix Solution Conditions on the MALDI-MS Analysis
of Peptides and Proteins. Anal Chem. 1996;68: 31–37. • Dai Y, Whittal RM, Li L. Confocal Fluorecence Microscopic Imaging for Investigating
the Analyte Distribution in MALDI Matrices. Anal Chem. 1996;68:2494–2500. • Figueroa ID, Torres O, Russell DH. Effects of the Water Content in the Sample Preparation
for MALDI on the Mass Spectra. Anal Chem. 1998;70: 4527–4533. • Matthiesen R, Mutenda KE. Introduction to proteomics. Methods Mol Biol; 2007: 367: 1-
35. • Farmer TB, Caprioli RM. Determination of Protein-Protein Interactions by Matrix-Assisted
Laser Desorption/Ionization Mass Spectrometry. J Mass Spectrom. 1998;33:697–704. • Pelzing M, Neusu C. Separation Techniques Hyphenated to Electrospray-TandemMass
Spectrometry in Proteomics: Capillary Electrophoresis versus Nano liquid Chromatography. Electrophoresis. 2005;26: 2717–2728.
• Aleksandrov ML, Gall LN, Krasnov VN, Nikolaev VI, Pavlenko VA, Shkurov VA. Ion Extraction from Solutions at Atmospheric Pressures: A Mass Spectrometric Method of Analysis of Bioorganic Compounds. Dokl Akad Nauk SSSR. 1984;277: 379–383.
• Fenn JB, Mann M, Meng CK, Wong SF, Whitehouse CM. Electrospray Ionization for Mass Spectrometry of Large Biomolecules. Science, 1989;246: 64–71.
• Yamashita M, Fenn JB. Electrospray Ion Source: Another Variation on the Free-JetTheme. J Phys Chem. 1984;88: 4451–4459.
• Dole M, Mack LL, Hines RL, Mobley RC, Ferguson LD, Alice MB. Molecular Beamsof Macroions. J Chem Phys. 1968;49: 2240–2249.
• Iribarne JV, Thomson BA. On the Evaporation of Small Ions from Charged Droplets. J Chem Phys. 1976;64: 2287–2294.
• Mora JF, Van Berkel GJ, Enke CG, Cole RB, Martinez-Sanchez M, Fenn JB. Electrochemical Processes in Electrospray Ionization Mass Spectrometry. J Mass Spectrom. 2000;35: 939–952.
• Gorshkov MV, Zubarev RA. On the Accuracy of Polypeptide Masses Measured in a Linear Ion Trap. Rapid Commun Mass Spectrom. 2005;19: 3755–3758.

• Smith RD, Loo JA, Edmonds CG, Barinaga CJ, Udseth HR. New Developments in Biochemical Mass Spectrometry: Electrospray Ionization. Anal Chem. 1990;62: 882–899.
• Wilm M, Mann M. Analytical Properties of the Nano electrospray Ion Source. Anal Chem. 1996;68: 1–8.
• Wilm M, Shevchenko A, Houthaeve T, Breit S, Schweigerer L, Fotsis T, Mann M. Femtomole Sequencing of Proteins from Polyacrylamide Gels by Nano-Electrospray Mass spectrometry. Nature. 1996;379: 466–469.
• Jolliffe T. Principal Component Analysis. Springer, 2nd edition, New York, 2002. • Miranda AA, Le Borgne YA, Bontempi G. New Routes from Minimal Approximation Error
to Principal Components. 2007 Kluwer Academic Publishers NP Lafter Feedbackv 15; 21:54; 1-14.
• Johnson A, Wichern DW. Applied Multivariate Statistical Analysis. Prentice-Hall, Inc., Upper Saddle River, New Jersey, third edition, 1992.
• Mazzara S, Cerutti S, Iannaccone S, Conti A, Olivieri S, Alessio M, Pattini L. Application of Multivariate Data Analysis for the Classification of two Dimensional Gel Images in Neuroproteomics. J Proteomics Bioinform. 2011;4(1): 016-021.
• Torre O, Harari S. The diagnosis of cystic lung diseases: a role for bronchoalveolar lavage and transbronchial biospy? Respiratory Medicine. 2010;104:S81eS85.
• Sundar KM, Gosselin MV, Chung HL, Cahill BC. Pulmonary Langerhans Cell Histiocytosis: Emerging Concepts in Pathobiology, Radiology, and Clinical Evolution of Disease. Chest. 2003;123:1673-1683.
• Rao RN, Goodman LR, Tomashefski JF Jr. Smoking-related interstitial lung disease. Ann Diagn Pathol. 2008;12(6):445-57.
• Lommatzsch M, Bratke K, Knappe T, Bier A, Dreschler K, Kuepper M, Stoll P, Julius P, Virchow JC. Acute effects of tobacco smoke on human airway dendritic cells in vivo. Eur Respir J. 2010;35(5):1130-6.
• Bratke K, Klug M, Bier A, Julius P, Kuepper M, Virchow JC, Lommatzsch M. Function-associated surface molecules on airway dendritic cells in cigarette smokers. Am J Respir Cell Mol Biol. 2008;38(6):655-60.
• Soler P, Moreau A, Basset F, Hance AJ. Cigarette smoking-induced changes in the number and differentiated state of pulmonary dendritic cells/Langerhans cells. Am Rev Respir Dis. 1989;139(5):1112-7.

• Vassallo R, Walters PR, Lamont J, Kottom TJ, Yi ES, Limper AH. Cigarette smoke promotes dendritic cell accumulation in COPD; a lung tissue research consortium study. Respir Res. 2010; 11-45.
• Magi B, Bargagli E, Bini L, Rottoli P. Proteome analysis of BAL in lung diseases. Proteomics. 2006; 6(23):6354-69.
• Aricò M. Langerhans cell histiocytosis in adults: more questions than answers? Eur J Cancer. 2004 ;40; 1467-1473.
• Crausman RS. Pulmonary histiocytosis X: pulmonary function and exercise pathophysiology. Am J Respir Crit Care Med. 1996; 153: 426-35.
• Vassallo R. Pulmonary Langerhans cell histiocytosis. N Engl J Med. 2000; 342:1969-1978. • ATS/ERS. Standardisation of lung function testing. Eur Respir J. 2005; 26:319-38. • Bargagli E, Bigliazzi C, Leonini A. Tryptase concentrations in bronchoalveolar lavage from
patients with chronic eosinophilic pneumonia. Clin Sci. (London) 2005; 108(3):273-276. • Bargagli E, Margollicci MA, Luddi A. Chitotriosidase activity in patients with diffuse lung
diseases. Respir Med. 2007; 101(10): 2176-81. • Bargagli E, Margollicci M, Perrone A, et al. Chitotriosidase analysis in BAL of patients
with sarcoidosis. Sarcoidosis Vasc Diffuse Lung Dis. 2007; 24(1):59-64. • Bradford MM. A rapid and sensitive method for the quantitation of microgram quantities of
protein utilizing the principle of protein-dye binding. Anal Biochem. 1976;72:248–254. • Bjellqvist B, Pasquali C, Ravier F, Sanchez JC, Hochstrasser D. A nonlinear wide-range
immobilized pH gradient for two-dimensional electrophoresis and its definition in a relevant pH scale. Electrophoresis. 1993;14:1357–1365.
• Hochstrasser DF, Harrington MG, Hochstrasser AC, Miller MJ, Merril CR. Methods for increasing the resolution of two-dimensional protein electrophoresis. Anal Biochem Sep. 1988;173(2):424–35.
• Oakley BR, Kirsch DR, Morris NR. A simplified ultrasensitive silver stain for detecting proteins in polyacrylamide gels. Anal Biochem. 1980;105:361–363.
• Hochstrasser DF, Patchornik A, Merril CR. Development of polyacrylamide gels that improve the separation of proteins and their detection by silver staining. Anal Biochem. 1988;173:412–423.
• Cañas B, Piñeiro C, Calvo E, López-Ferrer D, Gallardo JM. Trends in sample preparation for classical and second generation proteomics. J Chromatogr A. 2007;1153(1–2):235–58.
• Hellman U, Wernstedt C, Gonez J, Heldin CH. Improvement of an "In-Gel" digestion procedure for the micropreparation of internal protein fragments for amino acid sequencing. Anal Biochem. 1995;224:451–455.
• Soskic V, Gorlach M, Poznanovic S, Boehmer FD, Godovac-Zimmermann J. Functional proteomics analysis of signal transduction pathways of the platelet-derived growth factor beta receptor. Biochemistry. 1999;38:1757–1764.
• Ahmed ST, Darnell JE. Serpin B3/B4, activated by STAT3, promote survival of squamous carcinoma cells. Biochem Biophys Res Commun. 2009;378:821-5.
• Janji B, Giganti A, De Corte V, Catillon M, Bruyneel E, Lentz D, Plastino J, Gettemans J, Friederich E. Phosphorylation on Ser5 increases the F-actin-binding activity of L-plastin and promotes its targeting to sites of actin assembly in cells. J Cell Sci. 2006;119(Pt 9):1947-60.
• Janji B, Vallar L, Al Tanoury Z, Bernardin F, Vetter G, Schaffner-Reckinger E, Berchem G, Friederich E, Chouaib S. The actin filament cross-linker L-plastin confers resistance to TNF-alpha in MCF-7 breast cancer cells in a phosphorylation-dependent manner. J Cell Mol Med. 2010;14(6A):1264-75.
• Petrescu F, Voican SC, Silosi I. Tumor necrosis factor-alpha serum levels in healthy smokers and nonsmokers. Int J Chron Obstruct Pulmon Dis. 2010;5:217-22.
• Chen J, Ye L, Zhang L, Jiang WG. The molecular impact of pigment epithelium-derived factor, PEDF, on lung cancer cells and the clinical significance. Int J Oncol. 2009;35(1):159-66.
• Rodríguez-Piñeiro AM, Blanco-Prieto S, Sánchez-Otero N, Rodríguez-Berrocal FJ, de la Cadena MP. On the identification of biomarkers for non-small cell lung cancer in serum and pleural effusion. J Proteomics. 2010;73(8):1511-22.
• Broadhead ML, Dass CR, Choong PF. Cancer cell apoptotic pathways mediated by PEDF: prospects for therapy. Trends Mol Med. 2009;15(10):461-7.
• Cosgrove GP, Brown KK, Schiemann WP, Serls AE, Parr JE, Geraci MW, Schwarz MI, Cool CD, Worthen GS. Pigment epithelium-derived factor in idiopathic pulmonary fibrosis: a role in aberrant angiogenesis. Am J Respir Crit Care Med. 2004;170(3):242-51.
• Szlubowski A, Soja J, Grzanka P, Tomaszewska R, Papla B, Kuzdzał J, Cmiel A, Sładek K. TGF-beta1 in bronchoalveolar lavage fluid in diffuse parenchymal lung diseases and high-resolution computed tomography score. Pol Arch Med Wewn. 2010;120(7-8):270-5.
• Zielonka TM, Demkow U, Puscinska E, Golian-Geremek A, Filewska M, Zycinska K, Białas-Chromiec B, Wardyn KA, Skopińska-Rózewska E. TNFalpha and INFgamma

• inducing capacity of sera from patients with interstitial lung disease in relation to its angiogenesis activity. J Physiol Pharmacol. 2007;58 Suppl 5(Pt 2):767-80.
• Senechal B, Elain G, Jeziorski E, Grondin V, Patey-Mariaud de Serre N, Jaubert F, Beldjord K, Lellouch A, Glorion C, Zerah M, Mary P, Barkaoui M, Emile JF, Boccon-Gibod L, Josset P, Debré M, Fischer A, Donadieu J, Geissmann F. Expansion of regulatory T cells in patients with Langerhans cell histiocytosis. PLoS Med. 2007;4(8):e253.
• Zielonka TM, Demkow U, Filewska M, Bialas-Chromiec B, Zycinska K, Radzikowska E, Korzeniewska M, Wardyn KA, Kus J, Skopinska-Rozewska E. Angiogenic activity of sera from silicosis and pulmonary Langerhans cell histiocytosis patients in relation to lung function tests. J Physiol Pharmacol. 2008;59 Suppl 6:781-9.
• Rescher U, Gerke V. Annexins--unique membrane binding proteins with diverse functions. J Cell Sci. 2004;117(Pt 13):2631-9.
• Park JE, Lee DH, Lee JA, Park SG, Kim NS, Park BC, Cho S. Annexin A3 is a potential angiogenic mediator. Biochem Biophys Res Commun. 2005;337(4):1283-7.
• Liu YF, Xiao ZQ, Li MX, Li MY, Zhang PF, Li C, Li F, Chen YH, Yi H, Yao HX, Chen ZC. Quantitative proteome analysis reveals annexin A3 as a novel biomarker in lung adenocarcinoma. J Pathol. 2009;217(1):54-64.
• Wood AM, Stockley RA. Alpha one antitrypsin deficiency: from gene to treatment. Respiration. 2007;74(5):481-92.
• Brown RE. Oxidative stress, p53expression, and cytogenetic abnormalities in Langerhans cell histiocytosis. Med Pediatr Oncol. 2002; 38(1):70-1.
• Duong C, Seow HJ, Bozinovski S, Crack PJ, Anderson GP, Vlahos R. Glutathione peroxidase-1 protects against cigarette smoke-induced lung inflammation in mice. Am J Physiol Lung Cell Mol Physiol. 2010;299(3):L425-33.
• Morrison D, Rahman I, Lannan S, MacNee W. Epithelial permeability, inflammation, and oxidant stress in the air spaces of smokers. Am J Respir Crit Care Med. 1999;159(2):473-9.
• Huang YL, Chuang CY, Sung FC, Chen CY. Thioredoxin overexpression modulates remodeling factors in stress responses to cigarette smoke. J Toxicol Environ Health A. 2008;71(22):1490-8.
• Zhang S, Xu N, Nie J, Dong L, Li J, Tong J. Proteomic alteration in lung tissue of rats exposed to cigarette smoke. Toxicol Lett. 2008;178(3):191-6.
• Torii M, Wang L, Ma N, Saito K, Hori T, Sato-Ueshima M, Koyama Y, Nishikawa H, Katayama N, Mizoguchi A, Shiku H, Yodoi J, Kuribayashi K, Kato T. Thioredoxin
• suppresses airway inflammation independently of systemic Th1/Th2 immune modulation. Eur J Immunol. 2010;40(3):787-96.
• Rottoli P, Magi B, Perari MG, Liberatori S, Nikiforakis N, Bargagli E, Cianti R, Bini L, Pallini V. Cytokine profile and proteome analysis in bronchoalveolar lavage of patients with sarcoidosis, pulmonary fibrosis associated with systemic sclerosis and idiopathic pulmonary fibrosis. Proteomics. 2005;5(5):1423-30.
• Jaffar Z, Ferrini ME, Herritt LA, Roberts K. Cutting edge: lung mucosal Th17-mediated responses induce polymeric Ig receptor expression by the airway epithelium and elevate secretory IgA levels. J Immunol. 2009;182(8):4507-11.
• Kaetzel CS. The polymeric immunoglobulin receptor: bridging innate and adaptive immune responses at mucosal surfaces. Immunol Rev. 2005;206:83-99.
• Sano Y, Hermsen JL, Kang W, Gomez FE, Lan J, Maeshima Y, Kudsk KA. Parenteral nutrition maintains pulmonary IgA antibody transport capacity, but not active transport, following injury. Am J Surg. 2009;198(1):105-9.
• Shan M, Cheng HF, Song LZ, Roberts L, Green L, Hacken-Bitar J, Huh J, Bakaeen F, Coxson HO, Storness-Bliss C, Ramchandani M, Lee SH, Corry DB, Kheradmand F. Lung myeloid dendritic cells coordinately induce TH1 and TH17 responses in human emphysema. Sci Transl Med. 2009;1(4):4ra10.
• Harrison OJ, Foley J, Bolognese BJ, Long E 3rd, Podolin PL, Walsh PT. Airway infiltration of CD4+ CCR6+ Th17 type cells associated with chronic cigarette smoke induced airspace enlargement. Immunol Lett. 2008;121(1):13-21.
• Yang YH, Morand EF, Getting SJ, Paul-Clark M, Liu DL, Yona S, Hannon R, Buckingham JC, Perretti M, Flower RJ. Modulation of inflammation and response to dexamethasone by Annexin 1 in antigen-induced arthritis. Arthritis Rheum. 2004;50(3):976-84.
• Perretti M, Gavins FN. Annexin 1: an endogenous anti-inflammatory protein. News Physiol Sci. 2003;18:60-4.
• Woodruff PG, Koth LL, Yang YH, Rodriguez MW, Favoreto S, Dolganov GM, Paquet AC, Erle DJ. A distinctive alveolar macrophage activation state induced by cigarette smoking. Am J Respir Crit Care Med. 2005;172(11):1383-92.
• Cianti R, Bargagli E, Landi C, et al. Proteomic analysis of BAL in patients with PLCH. Proceedings Congresso Siena From Genome to Proteome 2008; s163.
• Gerke AK, van Beek E, Hunninghake GW. Smoking inhibits the frequency of bronchovascular bundle thickening in sarcoidosis. Acad Radiol. 2011 Jul;18(7):885-91. Epub 2011 May 6.

• Jain V, Hasselquist S, Delaney MD. PET scanning in sarcoidosis. Ann N Y Acad Sci. 2011 Jun;1228:46-58.
• Kanellopoulou T, Filiotou A, Kranidioti H, Dourakis SP. Sarcoid-like granulomatosis in patients treated with anti-TNFα factors. A case report and review of the literature. Clin Rheumatol. 2011 Apr;30(4):581-3. Epub 2010 Oct 23.
• Bargagli E, Olivieri C, Prasse A, Bianchi N, Magi B, Cianti R, Bini L, Rottoli P. Calgranulin B (S100A9) levels in bronchoalveolar lavage fluid of patients with interstitial lung diseases. Inflammation. 2008 Oct;31(5):351-4.
• Sabounchi-Schutt F, Astrom J, Hellman U, Eklund A, Grunewald J. Changes in bronchoalveolar lavage fluid proteins in sarcoidosis: a proteomics approach. Eur Respir J. 2003;21:414–20.
• Magi B, Bini L, Perari MG, Fossi A, Sanchez JC, Hochstrasser D, Paesano S, Raggiaschi R, Santucci A, Pallini V, Rottoli P. Bronchoalveolar lavage fluid protein composition in patients with sarcoidosis and idiopathic pulmonary fibrosis: a two-dimensionalelectrophoretic study. Electrophoresis; 2002: 23:3434–44.
• O'Connell OJ, Kennedy MP, Henry MT. Idiopathic pulmonary fibrosis: Treatment update. Adv Ther. 2011 Oct 3. [Epub ahead of print].
• Raghu G. Idiopathic pulmonary fibrosis: guidelines for diagnosis and clinical management have advanced from consensus-based in 2000 to evidence-based in 2011. Eur Respir J. 2011 Apr;37(4):743-6.
• Murray LA. Commonalities between the pro-fibrotic mechanisms in COPD and IPF. Pulm Pharmacol Ther. 2011 Sep 29. [Epub ahead of print]
• Conte E, Fruciano M, Fagone E, Gili E, Caraci F, Iemmolo M, Crimi N, Vancheri C. Inhibition of PI3K Prevents the Proliferation and Differentiation of Human Lung Fibroblasts into Myofibroblasts: The Role of Class I P110 Isoforms. PLoS One. 2011;6(10):e24663. Epub 2011 Oct 3.
• Bargagli E, Prasse A, Olivieri C, Muller-Quernheim J, Rottoli P. Macrophage-derived biomarkers of idiopathic pulmonary fibrosis. Pulm Med. 2011;2011:717130. Epub 2010 Nov 29.
• Samara KD, Margaritopoulos G, Wells AU, Siafakas NM, Antoniou KM. Smoking and pulmonary fibrosis: novel insights. Pulm Med. 2011;2011:461439. Epub 2011 Jun 15.
• Fahim A, Dettmar PW, Morice AH, Hart SP. Gastroesophageal reflux and idiopathic pulmonary fibrosis: a prospective study. Medicina (Kaunas). 2011;47(4):200-5.

• Capelozzi VL, Faludi EP, Balthazar AB, Fernezlian SD, Filho JV, Parra ER. Bronchoalveolar lavage improves diagnostic accuracy in patients with diffuse lung disease. Diagn Cytopathol. 2011 Jun 14. doi: 10.1002/dc.21743. [Epub ahead of print]
• Laman JD, Leenen PJ, Annels NE, Hogendoorn PC, Egeler RM. Langerhans-cell histiocytosis ‘insignt into DC biology’. Trends Immunol. 2003; 24: 190.
• Weitzman S, Egeler RM, editors. Histiocytic disorders of children and adults basic science, clinical features and terapy. Cambridge, UK: press university 2006.
• Fleming MD, Pinkus JL, Fournier MV, Alexander SW, Tam C, Loda M, Sallan SE, Nichols KE, Carpentieri DF, Pinkus GS, Rollins BJ. Coincident expression of the chemokine receptors CCR6 and CCR7 by pathologic Langerhans cells in Langerhans cell histiocytosis. Blood 101:2473, 2003.
• Ling CH, Ji C, Raymond DP, Bourne PA, Xu HD. Uncommon features of pulmonary Langerhans' cell histiocytosis: analysis of 11 cases and a review of the literature. Chin Med J 2010;123(4):498-501.
• Tazi A. Adult pulmonary Langerhans cell histiocytosis. Eur Respir J 2006;27:1272–85.
• Soler P, Moreau A, Basset F, Hance AJ. Cigarette smoking-induced changes in the number and differentiated state of pulmonary dendritic cells/Langerhans cells. Am Rev Respir Dis 1989;139(5):1112-7.
• Casolaro MA, Bernaudin JF, Saltini C, Ferrans VJ, Crystal RG. Accumulation of Langerhans' cells on the epithelial surface of the lower respiratory tract in normal subjects in association with cigarette smoking. Am Rev Respir Dis 1988 ;137(2):406-11.
• M Hassoun P. Lung involvement in systemic sclerosis. Presse Med. 2011 Jan;40(1 Pt 2):e3-e17. Epub 2010 Dec 30.
• Le Pavec J, Launay D, Mathai SC, Hassoun PM, Humbert M. Scleroderma lung disease. Clin Rev Allergy Immunol. 2011 Apr;40(2):104-16.
• Rottoli P, Bargagli E. obsolete in the diagnosis of ILD? Curr Opin Pulm Med 2003;9:418–25.
• Bjellqvist B, Pasquali C, Ravier F, Sanchez JC, Hochstrasser D. A nonlinear wide-range immobilized pH gradient for two-dimensional electrophoresis and its definition in a relevant pH scale. Electrophoresis 1993;14:1357–1365.
• Görg A, Postel W, Günther S. The current state of two-dimensional electrophoresis with immobilized pH gradients. Electrophoresis 1988;9:531–546.

• Hochstrasser DF, Harrington MG, Hochstrasser AC, Miller MJ, Merril CR. Methods for increasing the resolution of two-dimensional protein electrophoresis. Anal Biochem Sep 1988;173(2):424–35.
• Yoon HE, Kim SA, Choi HS, Ahn MY, Yoon JH, Ahn SG. Inhibition of Plk1 and Pin1 by 5'-nitro-indirubinoxime suppresses human lung cancer cells. Cancer Lett. 2011 Oct 29. [Epub ahead of print]
• Guo YL, Colman RW. Two faces of high-molecular-weight kininogen (HK) in angiogenesis: bradykinin turns it on and cleaved HK (HKa) turns it off. J Thromb Haemost. 2005 Apr;3(4):670-6. Epub 2005 Feb 23.
• Stuardo M, Gonzalez CB, Nualart F, Boric M, Corthorn J, Bhoola KD, Figueroa CD. Stimulated human neutrophils form biologically active kinin peptides from high and low molecular weight kininogens. J Leukoc Biol. 2004 Apr;75(4):631-40. Epub 2004 Jan 23.
• Duvoix A, Mackay RM, Henderson N, McGreal E, Postle A, Reid K, Clark H. Physiological concentration of calcium inhibits elastase-induced cleavage of a functional recombinant fragment of surfactant protein D. Immunobiology. 2011 Jan-Feb;216(1-2):72-9. Epub 2010 Mar 15.
• Schaaf B, Wieghorst A, Aries SP, Dalhoff K, Braun J. Neutrophil inflammation and activation in bronchiectasis: comparison with pneumonia and idiopathic pulmonary fibrosis. Respiration. 2000;67(1):52-9.
• Song JS, Kang CM, Rhee CK, Yoon HK, Kim YK, Moon HS, Park SH. Effects of elastase inhibitor on the epithelial cell apoptosis in bleomycin-induced pulmonary fibrosis. Exp Lung Res. 2009 Dec;35(10):817-29.
• Korfei M, Schmitt S, Ruppert C, Henneke I, Markart P, Loeh B, Mahavadi P, Wygrecka M, Klepetko W, Fink L, Bonniaud P, Preissner KT, Lochnit G, Schaefer L, Seeger W,Guenther A. Comparative Proteomic Analysis of Lung Tissue from Patients with Idiopathic Pulmonary Fibrosis (IPF) and Lung Transplant Donor Lungs. J Proteome Res. 2011 May 6;10(5):2185-2205. Epub 2011 Mar 29.
• Anshu A, Price MO, Richardson MR, Segu ZM, Lai X, Yoder MC, Price FW Jr. Alterations in the aqueous humor proteome in patients with a glaucoma shunt device. Mol Vis. 2011;17:1891-900. Epub 2011 Jul 14.
• Altiok O, Yasumatsu R, Bingol-Karakoc G, Riese RJ, Stahlman MT, Dwyer W, Pierce RA, Bromme D, Weber E, Cataltepe S. Imbalance between cysteine proteases and inhibitors in a baboon model of bronchopulmonary dysplasia. Am J Respir Crit Care Med. 2006 Feb 1;173(3):318-26. Epub 2005 Sep 15.

• Rivenbark AG, Coleman WB. Epigenetic regulation of cystatins in cancer. Front Biosci. 2009 Jan 1;14:453-62. Review.
• Kawaguchi Y, Takagi K, Hara M, Fukasawa C, Sugiura T, Nishimagi E, Harigai M, Kamatani N. Angiotensin II in the lesional skin of systemic sclerosis patients contributes to tissue fibrosis via angiotensin II type 1 receptors. Arthritis Rheum. 2004 Jan;50(1):216-26.
• Molina-Molina M, Xaubet A, Li X, Abdul-Hafez A, Friderici K, Jernigan K, Fu W, Ding Q, Pereda J, Serrano-Mollar A, Casanova A, Rodríguez-Becerra E, Morell F,Ancochea J, Picado C, Uhal BD. Angiotensinogen gene G-6A polymorphism influences idiopathic pulmonary fibrosis diseaseprogression. Eur Respir J. 2008 Oct;32(4):1004-8. Epub 2008 May 28.
• Bortner JD Jr, Das A, Umstead TM, Freeman WM, Somiari R, Aliaga C, Phelps DS, El-Bayoumy KDown-regulation of 14-3-3 isoforms and annexin A5 proteins in lung adenocarcinoma induced by the tobacco-specific nitrosamine NNK in the A/J mouse revealed by proteomic analysis. J Proteome Res. 2009 Aug;8(8):4050-61.
• Qi W, Liu X, Qiao D, Martinez JD. Isoform-specific expression of 14-3-3 proteins in human lung cancer tissues. Int J Cancer. 2005 Jan 20;113(3):359-63.
• Archimandriti DT, Dalavanga YA, Cianti R, Bianchi L, Manda-Stachouli C, Armini A, Koukkou AI, Rottoli P, Constantopoulos SH, Bini L. Proteome analysis of bronchoalveolar lavage in individuals from Metsovo, nonoccupationally exposed to asbestos. J Proteome Res. 2009 Feb;8(2):860-9.
• Pechkovsky DV, Prasse A, Kollert F, Engel KM, Dentler J, Luttmann W, Friedrich K, Müller-Quernheim J, Zissel G. Alternatively activated alveolar macrophages in pulmonary fibrosis-mediator production and intracellular signal transduction. Clin Immunol. 2010 Oct;137(1):89-101. Epub 2010 Jul 31.
• Jeong JY, Wang Y, Sytkowski AJ. Human selenium binding protein-1 (hSP56) interacts with VDU1 in a selenium-dependent manner. Biochem Biophys Res Commun. 2009 Feb 6;379(2):583-8. Epub 2008 Dec 30.
• Haczku A. Protective role of the lung collectins surfactant protein A and surfactant protein D in airway inflammation. J Allergy Clin Immunol. 2008 Nov;122(5):861-79; quiz 880-1.
• McCormack FX, King TE Jr, Voelker DR, Robinson PC, Mason RJ. Idiopathic pulmonary fibrosis. Abnormalities in the bronchoalveolar lavage content of surfactant protein A. Am Rev Respir Dis. 1991 Jul;144(1):160-6.
• Kim TH, Lee YH, Kim KH, Lee SH, Cha JY, Shin EK, Jung S, Jang AS, Park SW, Uh ST, Kim YH, Park JS, Sin HG, Youm W, Koh ES, Cho SY, Paik YK, Rhim TY,Park CS.

• Role of lung apolipoprotein A-I in idiopathic pulmonary fibrosis: antiinflammatory and antifibrotic effect on experimental lung injury and fibrosis. Am J Respir Crit Care Med. 2010 Sep 1;182(5):633-42. Epub 2010 May 12.
• Yu CJ, Wang CL, Wang CI, Chen CD, Dan YM, Wu CC, Wu YC, Lee IN, Tsai YH, Chang YS, Yu JS. Comprehensive proteome analysis of malignant pleural effusion for lung cancer biomarker discovery by using multidimensional protein identification technology. J Proteome Res. 2011 Oct 7;10(10):4671-82. Epub 2011 Aug 24.
• Su YJ, Xu F, Yu JP, Yue DS, Ren XB, Wang CL.Up-regulation of the expression of S100A8 and S100A9 in lung adenocarcinoma and its correlation with inflammation and other clinical features. Chin Med J (Engl). 2010 Aug;123(16):2215-20.
• MacGregor G, Gray RD, Hilliard TN, Imrie M, Boyd AC, Alton EW, Bush A, Davies JC, Innes JA, Porteous DJ, Greening AP. Biomarkers for cystic fibrosis lung disease: application of SELDI-TOF mass spectrometry to BAL fluid. J Cyst Fibros. 2008 Sep;7(5):352-8. Epub 2008 Feb 1.
• Gupta D, Singh AD, Agarwal R, Aggarwal AN, Joshi K, Jindal SK. Is tobacco smoking protective for sarcoidosis? A case-control study from North India. Sarcoidosis Vasc Diffuse Lung Dis. 2010 Jul;27(1):19-26.
• Takada Y, Gresh L, Bozec A, Ikeda E, Kamiya K, Watanabe M, Kobayashi K, Asano K, Toyama Y, Wagner EF, Matsuo K. Interstitial lung disease induced by gefitinib and toll-like receptor ligands is mediated by Fra-1. Oncogene. 2011 Sep 8;30(36):3821-32. doi: 10.1038/onc.2011.101. Epub 2011 Apr 4.
• Meng Q, Xia Y. c-Jun, at the crossroad of the signaling network. Protein Cell. 2011 Nov;2(11):889-98. Epub 2011 Dec 17.
• Li X, Hu Y, Jin Z, Jiang H, Wen J. Silica-induced TNF-alpha and TGF-beta1 expression in RAW264.7 cells are dependent on Src-ERK/AP-1 pathways. Toxicol Mech Methods. 2009 Jan;19(1):51-8.
• Kutasy B, Gosemann JH, Doi T, Fujiwara N, Friedmacher F, Puri P. Nitrofen interferes with trophoblastic expression of retinol-binding protein and transthyretin during lung morphogenesis in the nitrofen-induced congenital diaphragmatic hernia model. Pediatr Surg Int. 2011 Oct 21. [Epub ahead of print]
• Markart P, Luboeinski T, Korfei M, Schmidt R, Wygrecka M, Mahavadi P, Mayer K, Wilhelm J, Seeger W, Guenther A, Ruppert C. Alveolar oxidative stress is associated with elevated levels of nonenzymatic low-molecular-weight antioxidants in patients with different
• forms of chronic fibrosing interstitial lung diseases. Antioxid Redox Signal. 2009 Feb;11(2):227-40.
• Binker MG, Binker-Cosen AA, Richards D, Gaisano HY, de Cosen RH, Cosen-Binker LI. Chronic stress sensitizes rats to pancreatitis induced by cerulein: role of TNF-α. World J Gastroenterol. 2010 Nov 28;16(44):5565-81.
• Markart P, Nass R, Ruppert C, Hundack L, Wygrecka M, Korfei M, Boedeker RH, Staehler G, Kroll H, Scheuch G, Seeger W, Guenther A. Safety and tolerability of inhaled heparin in idiopathic pulmonary fibrosis. J Aerosol Med Pulm Drug Deliv. 2010 Jun;23(3):161-72.
• Scotton CJ, Krupiczojc MA, Königshoff M, Mercer PF, Lee YC, Kaminski N, Morser J, Post JM, Maher TM, Nicholson AG, Moffatt JD, Laurent GJ, Derian CK,Eickelberg O, Chambers RC. Increased local expression of coagulation factor X contributes to the fibrotic response in human and murine lung injury. J Clin Invest. 2009 Sep;119(9):2550-63. doi: 10.1172/JCI33288. Epub 2009 Aug 3.
• Collard HR, Calfee CS, Wolters PJ, Song JW, Hong SB, Brady S, Ishizaka A, Jones KD, King TE Jr, Matthay MA, Kim DS. Plasma biomarker profiles in acute exacerbation of idiopathic pulmonary fibrosis. Am J Physiol Lung Cell Mol Physiol. 2010 Jul;299(1):L3-7. Epub 2010 Apr 23.
• Ye BQ, Geng ZH, Ma L, Geng JG. Slit2 regulates attractive eosinophil and repulsive neutrophil chemotaxis through differential srGAP1 expression during lung inflammation. J Immunol. 2010 Nov 15;185(10):6294-305. Epub 2010 Oct 13.
• Nasarre P, Potiron V, Drabkin H, Roche J. Guidance molecules in lung cancer. Cell Adh Migr. 2010 Jan-Mar;4(1):130-45. Epub 2010 Jan 7.

PUBBLICATIONS ON INTERNATIONAL SCIENTIFIC JOURNAL Differential response to intracellular stress in the skin from Osteogenesis Imperfecta
Brtl mice with lethal and non lethal phenotype: a proteomic approach. Bianchi L, Gagliardi A, Gioia R, Besio R, Tani C, Landi C, Cipriano M, Gimigliano A, Rossi A, Marini JC, Forlino A, Bini L. Journal of Proteomics. [Submitted]
Proteome analysis of bronchoalveolar lavage in Polmonary Langerhans Cells
Histiocytosis. Landi C, Bargali E, Magi B, Prasse A, Muller-Quernheim J, Bini L, Rottoli P. J Clin Bioinforma. 2011 Nov 10;1(1):31. [Epub ahead of print]
Analysis of serum amyloid A in sarcoidosis patients. Bargagli E, Magi B, Olivieri C,
Bianchi N, Landi C, Rottoli P. Respir Med. 2011 Jan 5. Proteomic analysis in interstitial lung diseases: a review. Rottoli P, Bargagli E, Landi
C, Magi B. Curr Opin Pulm Med. 2009 Sep;15(5):470-8. Solubilization methods and reference 2-DE map of cow milk fat globules. Bianchi L, Puglia M, Landi C, Matteoni S, Perini D, Armini A, Verani M, Trombetta C,
Soldani P, RoncadaP, Greppi G, Pallini V, Bini L. J Proteomics. 2009 Jul 21;72(5):853-64. ABSTRACTS FOR NATIONAL AND INTERNATIONAL CONGRESS MULTIVARIATE ANALYSIS OF BALF PROTEIN EXPRESSION PROFILES CAN
HELP TO DISTINGUISH BETWEEN INTERSTITIAL LUNG DISEASE. Landi C, Puglia M, Bianchi L, Gagliardi A, Cipriano M, Gimigliano A, Bargagli E, Magi B, Rottoli P, BinI. 10th HUPO World congress. 4-7 September 2011.
2D-DIGE ANALYSIS OF AN IMMORTALIZED CELL LINE DERIVED FROM A
CYSTIC FIBROSIS PATIENT. Cipriano M., Puglia M., Bianchi L., Gimigliano A., Landi C., Armini A., Gagliardi A., Pini A., Bini L. 10th HUPO World congress. 4-7 September 2011.
A PROTEOMIC STUDY ON SKIN BIOPSIES OF BRITTLE IV MOUSE: AN ANIMAL
MODEL OF OSTEOGENENSIS IMPERFECT. Bianchi L., Cipriano M., Gagliardi A., Tani C., Landi C., Gimigliano A., Puglia M., Armini A., Forlino A., Bini L. 10th HUPO World congress. 4-7 September 2011.

CHARACTERIZATION OF THE HUMAN OVARIAN FOLLICULAR FLUID PROTEOME. Gagliardi A., Bianchi L., Campanella G., Cipriano M., Gimigliano A., Armini A., Landi C., Puglia M., Focarelli R., Bini L. 10th HUPO World congress. 4-7 September 2011.
PROTEOMIC ANALYSIS OF INTERSTITIAL LUNG DISEASES. Landi C., Bargagli E.,
Perari MG., Rottoli P., Bini L. 6° Annual National Conference Italian Proteomics Association (ItPA), 2011 Torino ITALY.
A PROTEOMIC STUDY OF HEPATOCELLULAR CARCINOMA DISEASE: A
COMPARISON BETWEEN THE LIVER INFLAMMATORY CONDITION AND CANCER OUTCOME BY DIGE APPROACH. Gimigliano A., Martins MA., Bianchi L., Puglia M., Landi C., Gagliardi A., Cipriano M., Armini A., Bini L. 6° Annual National Conference Italian Proteomics Association (ItPA), 2011Torino ITALY.
PROTEIN CARBONYLATION IN PERIPHERAL BLOOD MONONUCLEAR CELLS
FROM AMYOTROPHIC LATERAL SCLEROSIS PATIENTS. Gagliardi A., Frosali S., Landi C., Bianchi L., Cipriano M., Puglia M., Gimigliano A., Armini A., Di Stefano A., Bini L. 6° Annual National Conference Italian Proteomics Association (ItPA), 2011 Torino ITALY.
APOPTOSIS AND LOSS OF MITOCONDRIAL TRANSMEMBRANE POTENTIAL
BEFORE AND AFTER OXIDATIVE STRESS IN PERIPHERAL BLOOD LYMPHOCYTES FROM SPORADIC AMYOTROPHIC LATERAL SCLEROSIS. Frosali S, Gagliardi A, Landi C, Bongioanni P, Rossi B, Bini L, Di Maio G, Federico A, Di Stefano A. 18th Annual Meeting International Alliance of ALS/MND Associations and 21th International Symposium on ALS/MND Orlando, USA 7 - 13 December 2010.
STUDIO PROTEOMICO DEL BAL NELL’ISTIOCITOSI POLMONARE A CELLULE DI
LANGERHANS. Landi C, Bargagli E, Perari M.G, Olivieri C, Magi B, Bini L, Rottoli P. 11° Congresso Nazionale di Pneumologia (UIP) 2010, Milano ITALY.
PROTEIN ANALYSIS OF BRONCHOALVEOLAR LAVAGE IN PULMONARY
LANGERHANS CELL HISTIOCYTOSIS BY A PROTEOMIC APPROACH. Rottoli P, Landi C, Bargagli E, Perari M.G, Prasse A, Mueller-Quernheim J, Bini L. 20° Annual Congress Europian Respiratory Society (ERS), 2010 Barcellona SPAIN.
PROTEIN EXPRESSION PROFILES IN BRONCHOALVEOLAR LAVAGE FLUID OF
PULMONARY LANGERHANS-CELL HISTIOCYTOSIS, NO-SMOKING AND SMOKING HEALTH SUBJECTS. Landi C, Bargagli E, Olivieri C, Magi B, Cipriano M,. Bianchi L, Prasse A, Armini A , Rottoli P , Bini L. 5° Annual National Conference Italian Proteomics Association (ItPA), 2010 Florence ITALY.

EFFECT OF SCO1 DELETION ON SACCHAROMYCES CEREVISIAE METABOLISM. Puglia M, Gamberi T, Magherini F, Landi C, Bianchi L, Gagliardi A, Soldani P, Gimigliano A, Bini L, Modesti A. 5° Annual National Conference Italian Proteomics Association (ItPA), 2010 Florence ITALY.
TOWARD THE UNDERSTANDING OF CORNELIA DE LANGE SYNDROME
THROUGH A PROTEOMIC APPROACH. Gimigliano A, Bianchi L, Mannini L, Puglia M, Landi C, Gagliardi A, Armini A, Musio A, Bini L. 5° Annual National Conference Italian Proteomics Association (ItPA), 2010 Florence ITALY.
PATTERNS OF CARBONYLATED PROTEINS IN PLASMAS FROM PATIENTS WITH
SPORADIC AMYOTROPHIC LATERAL SCLEROSIS” Bongioanni P., Landi C., Frosali S., Puglia M., Bianchi L., Rossi B., Di Stefano A., Bini L. 20th International symposium on ALS/MND, Berlin, Germany, 8-10 December 2009.
PROTEIN BIOMARKERS IN BRONCHOALVEOLAR LAVAGE FLUID OF
PULMONARY LANGERHANS CELLS HISTIOCYTOSIS (PLCH) PATIENTS. Landi C, Bianchi L, Puglia M, Armini A, Bargagli E, Magi B, Rottoli P, Bini L. 4° Annual National Conference Italian Proteomics Association (ItPA), 2009 Milan ITALY.
CHARACTERIZATION OF PROTEIN PROFILE AND TARGET PROTEINS OF
OXIDATION IN SACCHAROMYCES CEREVISIAE CELLS LACKING SCO1 BY A PROTEOMIC APPROACH. Puglia M, Gamberi T, Magherini F, Landi C, Bianchi L, Serchi T, Gimigliano A, Bini L, Modesti A. 4° Annual National Conference Italian Proteomics Association (ItPA), 2009 Milan ITALY
DIGE ANALYSIS IN FOOD QUALITY CONTROL: THE STUDY OF MILK FAT
GLOBULES FROM OVIS ARIES. Serchi T, Bianchi L, Landi C, Gimigliano A, Armini A, Puglia M, Trombetta C, Verani M, Bini L. 4° Annual National Conference Italian Proteomics Association (ItPA), 2009 Milan ITALY.
SOLUBILIZATION AND SAMPLE LOADING METHODS OF HUMAN FOLLICULAR
FLUID FOR 2DE ANALYSIS. Bianchi L, Campanella G, Gimigliano A, Puglia M, Landi C, Armini A, Serchi T, Focarelli R, Bini L. 4° Annual National Conference Italian Proteomics Association (ItPA), 2009 Milan ITALY.