universidad autÓnoma de ciudad juÁrez · countries over a 31-year period. panel vector auto...
TRANSCRIPT

REVISTA DE CIENCIAS SOCIALES Y HUMANIDADES
VOL. 25NÚMERO
49E N E R O - J U N I O
2 0 1 6
ISSN
0188
—98
34
UNIVERSIDAD AUTÓNOMA DE CIUDAD JUÁREZ
ISSN
elec
tróni
co: 2
395-
8669

Ricardo Duarte JáquezRector
David Ramírez PereaSecretario General
Juan Ignacio Camargo NassarDirector del Instituto de Ciencias
Sociales y Administración
Manuel Loera de la RosaSecretario Académico
Ramón Chavira ChaviraDirector General de Difusión Cultural
y Divulgación Científica
Isaac Leobardo Sánchez JuárezDirector General
Mayola Renova GonzálezSubdirectora de Publicaciones
Mayela Rodríguez RíosAsistente Editorial
Karla María Rascón GonzálezDiseño de interiores y portada
UNIVERSIDAD AUTÓNOMA DE CIUDAD JUÁREZNóesis. Revista de Ciencias Sociales y Humanidades del Instituto de Ciencias Sociales y Administración
Nóesis Volumen 25, número 49, enero-junio 2016, es una publicación se-mestral editada por la Universidad Autónoma de Ciudad Juárez, a través del Instituto de Ciencias Sociales y Administración de la UACJ. Redacción: Avenida Universidad y H. Colegio Militar (zona Chamizal) s/n. C.P. 32300 Ciudad Juárez, Chihuahua. Para correspondencia referente a la revista, comunicarse al teléfono: (656) 688-21-00 ext. 3759; o bien escribir a los siguientes correos electrónicos: [email protected] y/o [email protected].
Editor responsable: Isaac Leobardo Sánchez Juárez. ISSN: 0188-9834/ISSN electrónico: 2395-8669. Impresa por Imprenta Uni-versitaria, ubicada en edificio R, campus ICB, en Av. Hermanos Escobar y Av. Plutarco Elías Calles, zona Pronaf, C.P. 32310, Ciudad Juárez, Chihuahua, México. Distribuidor: Subdirección de Gestión de Proyectos y Marketing Editorial. Avenida Plutar-co Elías Calles #1210, Fovissste Chamizal, C.P. 32310. Ciudad Juárez, Chihuahua. Este número se terminó de imprimir en marzo de 2016 con un tiraje de 500 ejemplares.
Hecho en México /Printed in Mexico
© UACJ
Nóesis: Revista de Ciencias Sociales y Humanidades/Universidad Autónoma de Ciudad Juárez, Instituto de Ciencias Sociales y Administración, núm. 1, vol. 1 (noviembre, 1988). Ciudad Juárez, Chih.: UACJ, 1988.SemestralDescripción basada en: núm. 19, vol. 9 (julio/diciembre, 1997)Publicada anteriormente como: Revista de la Dirección General de Investigación y Posgrado.ISSN: 0188—98341. Ciencias Sociales-Publicaciones periódicas2. Ciencias Sociales-México-Publicaciones periódicas3. Humanidades-Publicaciones periódicas4. Humanidades-México-Publicaciones periódicas
H8.S6. N64 1997300.05. N64 1997
Permisos para otros usos: el propietario de los derechos no permite utilizar copias para distribución en general, promociones, la crea-ción de nuevos trabajos o reventa. Para estos propósitos, dirigirse a Nóesis.
Los manuscritos propuestos para publicación en esta revista deberán ser inéditos y no haber sido sometidos a consideración a otras revistas simultáneamente. Al enviar los manuscritos y ser aceptados para su publicación, los autores aceptan que todos los derechos se transfieren a Nóesis, quien se reserva los de reproducción y distribución, ya sean fotográficos, en micropelícula, electrónicos o cualquier otro medio, y no podrán ser utilizados sin permiso por escrito de Nóesis. Véase además normas para autores.
Revista indexada en Latindex, Clase, Biblat, Redalyc, Latam-studies, ResearchBib, E-Revistas, Ebsco, DOAJ, EZ3 Electronic Journals Library, UlrichsWeb, CiteFactor, Scholar Google, Dialnet
Apoyado con Recursos PIFI
Comité Editorial:
Dra. Myrna Limas HernándezDr. Héctor Padilla DelgadoDr. Luis Gutiérrez Casas
Consejo Editorial:
Dr. Nicasio Urbina GuerreroUniversidad de CincinnatiDr. Bernardo Guerrero JiménezUniversidad Arturo PratDr. José María Fernández BataneroUniversidad de SevillaDr. Miguel Mujica AreurmaUniversidad de CaraboboDr. Adrian Rodríguez MirandaUniversidad de la República UruguayDra. Araceli AlmarazEl Colegio de la Frontera NorteDr. Rafael Perez-TaylorUniversidad Nacional Autónoma de MéxicoDr. Franco Savarino RoggeroEscuela Nacional de Antropología e HistoriaDr. Gerardo EsquivelEl Colegio de México

El significado dE nóEsis
NÓESIS. Este término es griego y se vincula con otro muy empleado en la filosofía clásica: nous (razón, intelecto). La elección de este título se deriva de algunas consideraciones acerca de la teoría del conocimiento que se desprenden del conocido símil de la caverna (República, VII).
El hombre, que ha podido contemplar el mundo de los arquetipos, esto es, que ha logrado penetrar las esencias, no puede ya contentarse con la proyección deformada del conocimiento sensible. La luz que lo iluminó es la filosofía, que Platón conceptualiza todavía en el sentido pitagórico de ancla de salvación espiritual. Al ser iluminado por ésta, el hombre siente la necesidad de comunicar a ex compañeros de esclavitud la verdad que ha encontrado, aun cuando estos últimos puedan mofarse de él, como lo había hecho la mujer tracia con Tales. La misma alegoría recuerda los descensos al Hades del orfismo y del pensamiento religioso pitagórico.
En el conocimiento, así caracterizado, Platón encuentra diversos gra-dos. El primero es dado por la experiencia, que es de suyo irracional, por-que se fundamenta en una repetición mecánica de actos.
Ésta se racionaliza en el arte (techne), es decir, en la habilidad adquirida, en las reglas metodológicas, puesto que en dicha actividad se investigan los datos de la experiencia. Entre las distintas artes sobresale la filosofía, porque no examina los fenómenos aisladamente, sino que los ve en su con-junto. Platón llama a esta visión totalizadora “dialéctica”, y dice que ella se alcanza a través del ejercicio de la razón (nóesis).
Por medio de este ejercicio alcanzaremos pues el conocimiento que, para ser válido, debe ser verdadero y tan real como su objeto. Estas con-sideraciones sintetizan el propósito y el objetivo de esta revista: presentar trabajos que reflejen, manifiesten, denuncien, los diferentes aspectos de nuestra realidad y hacerlo a través del “ejercicio de la razón”, es decir, de la NÓESIS.
Dr. Federico Ferro Gay ( )
N.dE. Se respeta la ortografía original de este texto, escrito antes de las modificaciones a la gramática y ortografía dispuestas por la Real Academia Española, como señal de respeto al trabajo invaluable del Dr. Federico Ferro Gay.

4769
7
99
123161
181
13
Contenido
Abstracts
Multidisciplinario de Ciencias Sociales
Public finance and monetary policies as economic stabilizer: unique or universal across countries? Arwiphawee Srithongrung
Caracterización de las mujeres en la política hoy: un estudio en la ciudad de MéxicoAnna María Fernández Poncela
Pobreza, “cuestión social” y su enfrentamiento Carlos Eduardo Montaño Barreto
El entorno cotidiano, la estética kitsch y su relación con los diseñosJosé de Jesus Flores Figueroa/César Omar Balderrama Armendáriz/Germán Aguilera Ampudia
Multidisciplinario de HumanidadesLas subdelegaciones novogalaicas en los gobiernos de los intendentes Villaurrutia y Ugarte y Loyola. Problemas solventados. José Antonio Gutiérrez Gutiérrez
Luis G. Urbina, la definición de un género literarioErnesto Emiliano Romero
La imagen de la mujer caída en algunas obras de la literatura mexicanaMartha Elena Munguía Zatarain
Alejandro Morales y la fuga mística del caosRoberto Sánchez Benítez
Padre Carolus di Spinola, Sacerdote Jesuita (1564-1622): el primer modelo de vida del Padre Eusebio Francisco Kino (1645-1711)Peter Horwath
205
227
ABSTRACT
This study examines dynamic effects of fiscal and monetary policies on growth of two distinctive groups: industrialized with high-income and non-industrialized with medi-um-income economies. The literature is mixed in recommending fiscal and monetary policies to stabilize a national economy, especially for non-industrialized countries. Unlike high-income and industrialized countries, in the non-industrialized countries, capital markets are imperfect; and hence, setting interest rates to target inflation or mitigate recessions will be ineffective because the level of cash flows do not reflect true investment demands, leading to failed monetization. Data were derived from 36 countries over a 31-year period. Panel Vector Auto Regression (PVAR) was used to mitigate endogeneity which is an inherent problem of panel data. The results confirm the major hypothesis.
Keywords: Government Spending, OECD, GDP Growth, Panel Vector Auto Regres-sion, Medium-Income Country.
RESUMENEn este artículo se examinan los efectos dinámicos de las políticas fiscales y mo-netarias en el crecimiento de dos grupos distintos: países industrializados con altos ingresos y no industrializados con economías de ingresos medios. La revisión de la literatura indica diferentes situaciones en relación al tipo de política fiscal y monetaria que debe seguirse, especialmente en aquellos países no desarrollados. A diferencia de los países de ingresos altos e industrializados, los países no industrializados tienen mercados de capital imperfectos; y por lo tanto, el establecimiento de tasas de interés para controlar la inflación o mitigar recesiones puede resultar poco efectivo debido a que los bajos niveles de flujo de efectivo no reflejan fielmente las demandas de inversión, conduciendo a un fallo en el patrón monetario. En el ánimo de comprobar lo anterior, se utilizaron datos de 36 países para un periodo de 31 años, a los que se aplicó un Panel de Vectores Autoregresivos para contrarrestar la endogeneidad. En lo general, los resultados confirman la hipótesis propuesta.
Palabras clave: Gasto Público, OCDE, Crecimiento Económico, Panel De Vectores Autoregresivos, Países De Ingreso Medio.
REVISTA DE CIENCIAS SOCIALES Y HUMANIDADES
ISSN 0188-9834ISSN electrónico: 2395-8669
Volumen 25, número 49, enero-junio 2016.

Fecha de recepción: 13 de septiembre de 2014Fecha de aceptación: 5 de diciembre de 2014
Public finance and monetary policies as economic stabilizer:
unique or universal across countries?
Multidisciplinario de Ciencias Sociales
¿Finanzas públicas y políticas monetarias como estabilizador
económico: único o universal entre los países?
Arwiphawee Srithongrung1
1 Nacionalidad: Tailandesa. Grado: Doctorado en Administración Pública. Especiali-zación: Finanzas Públicas, Presupuesto Gubernamental y Crecimiento Económico. Adscripción: Associate Professor of Public Administration. Hugo Wall School of Pu-blic Affairs.Wichita State University. Correo electrónico: [email protected]
REVISTA DE CIENCIAS SOCIALES Y HUMANIDADES
ISSN 0188-9834ISSN electrónico: 2395-8669
Volumen 25, número 49, enero-junio 2016.

Nóe
sis
14
Publ
ic fin
ance
and
mon
etary
poli
cies a
s eco
nom
ic sta
biliz
er: u
niqu
e or u
nive
rsal a
cross
coun
tries
?
Introduction
One of a government’s responsibilities in public financial management is to stabilize national economic performance (Musgrave, 1959). Over the short or medium term, a coun-
try’s rapid growth rates create inflation while sharply declining rates create recession. In the macroeconomic literature, monetary policy implemented through targeted nominal interest rates is viewed as the most appropriate policy tool given that a country’s monetary author-ity can promptly execute interest rate changes (Taylor, 2000). Mean-while, fiscal policies including taxes and deficit spending take time to remedy the economy since they need a national governing body’s approval prior to implementation. This conventional view is tested in 18 Organization for Economic Cooperation and Development (OECD) countries during the period of 1920 to 2011 and empirical evidence support the view that setting nominal interest rates slightly below or above the targeted rates have positive impacts on asset prices which in turn smooth the growth rates of OECD economies (Bordo & Landon-Lane, 2013). However, to the authors’ best knowledge, this view has not been systematically tested in non-industrialized coun-tries.
The non-industrialized countries, namely the countries that are not members of The Organization for Economic Co-operation and Development (OECD), have economic structures that are distinctive-ly different than those of OECD members. For example, the non-OECD countries have (1) low-to medium-income levels (The World Bank, 2014), (2) relatively high public debt, relatively low levels of gov-ernment accountability, and relatively low levels of creditability (Field-ing, 2008), (3) incomplete trading systems, opaque national account payment, and relatively high levels of government deficits (Hasan & Isgut, 2009) and (4) imperfect capital markets in which foreign trans-actions and regulations are arbitrary and capital inflows are mainly for speculation rather than real investment (El-Shagi, 2012). Monetary policy may not be appropriate for a country that has such economic characteristics given that capital inflows tends to fail in boosting in-

15
Vol.
25 •
núm
ero 4
9 • e
nero
-juni
o, 20
16Ar
wip
haw
ee S
ritho
ngru
ngvestment causing hyperinflation or deep recession (Calvo, Leiderman, Rinehart 1996; Feildberg, 2008). When monetary policy is ineffective, fiscal policies may be the answer given that public spending and taxing alter net wealth in the society. In such non-industrialized countries, economic restructuring may be required to stabilize countries prior to adjusting interest rates as in industrialized countries.
Based on the above discussion, the central thesis for this study is that in non-OECD countries, fiscal policy measured through cen-tral government spending is effective in enhancing national economic growth. Economic agents cannot guess the future about economies due to arbitrary capital market conditions on their systems, and asym-metry of information in the levels of cash inflows. In such situations, monetary policy through central bank discount rate will likely fail for the same reason as information asymmetry. This hypothesis is sys-tematically tested through Panel Vector Auto Regression (PVAR) in which monetary policy, national account balance and capital for-mation are simultaneously controlled for their effects. Testing data were derived from 19 OECD countries and 17 non-OECD coun-tries within a 31 year-period ranging from 1980 to 2010. The testing was separated into two groups: non-OECD and OECD groups. In PVAR, endogeneity is controlled by system equations in which all en-dogenously determined variables in the testing models are alternately predicted based on the other variables and error terms in the models. The results support a central hypothesis: in non-OECD countries, public spending significantly enhances national productivity, while central bank discount rates do not exhibit significant impact on na-tional productivity in the short or medium- term.
This paper is organized as follows. The following section describes normative theories and positive findings for the roles of fiscal and monetary policies when high debt levels, inflation persistence, and the degree of openness are taken into consideration. The hypotheses are specified at the end of this section. The third section describes the testing model, data, and estimator. The fourth section presents results and discussion. The final section provides a conclusion.
Nóe
sis
16
Publ
ic fin
ance
and
mon
etary
poli
cies a
s eco
nom
ic sta
biliz
er: u
niqu
e or u
nive
rsal a
cross
coun
tries
?
LiteratureThis section reviews basic theory of the roles of fiscal and mone-
tary policies in stabilizing an economy.
Fiscal and Monetary Policies and Their Basic Roles in Stabilizing an Economy
According to IS/LM model (Mundell, 1963), in a short-run, mar-ket price does not abruptly adjust itself to fully reflect true shortage or surplus of economic output because economic agents in the private sector (i.e., households and firms) plan their investment and employ-ment contracts in advance. A government may use fiscal or monetary policies to alleviate high inflation and deep recession resulting from an oversupply of cash or interest rates in capital markets that are above their optimal level, respectively. A country’s monetary authority (here-after referred to as the central bank) implements monetary policy to stabilize economy by setting interest rates targeting a particular level of private consumption and investment. The country’s fiscal authority (i.e., national finance department) implements fiscal policy to stabilize the economy by setting public spending or tax rates that can alter net wealth of the economy.
Although both policies have the same goals in stabilizing the economy, they tend to do so through different approaches. Monetary policy stimulates the economy through direct investment and con-sumption. Meanwhile fiscal policy stimulates the economy through wealth alteration in the society, which in turn, reshuffles resources redistribution in economic structures. Due to different approaches, each of the policies may be effective in a country but not another de-pending on the countries’ economic structures. Therefore, the crucial questions for developing new issues into the literature and for policy practitioners across countries are, what circumstances make monetary policy effective in stabilizing an economy? and what circumstances produce that fiscal policy be a better tool to achieve the same result?
According to the IS/LM model, for an open economy with float-ing exchange rates, monetary policy tends to mitigate recessions at a

17
Vol.
25 •
núm
ero 4
9 • e
nero
-juni
o, 20
16Ar
wip
haw
ee S
ritho
ngru
nglower cost compared to fiscal policy. This is because low interest rates dampen foreign investment, weakening a country’s currency. This in turn induces higher net exports. By contrast, tax cuts or deficit finance will cause an influx of foreign investment, strengthening a currency and in turn dampening net exports. Fiscal policy will be efficient only in an open economy with fixed exchange rates because both deficit finance and tax cuts will stimulate demand for money which will push up interest rate ; and as a result, drawing more foreign investment.
When IS/LM model is relaxed by assuming that an open econo-my has high public debt accumulation, fiscal policy is more efficient than monetary policy in both fixed and floating exchange rate systems because monetary policies tend to stabilize the economy at a higher social cost than fiscal policies (Beetsma & Bovenberg, 1995; Durham, 2006; Shabert, 2004; Piergallini; 2005; Bartolomeo & Gioacchino, 2008). When monetary policy is used through interest rate setting, unemployment rates are impacted and become less than (or more than) proportionate to the targeted level of inflation (or recession) reduction (Durham, 2006). In such situations, monetary policies can generate over- (or under-) optimal social costs due to any of the fol-lowing situations: 1) private economic agents can anticipate inflation strategies used by the central bank (Beetsma & Bovenberg, 1995), 2) in a finite-horizon situation economic agents consider life-cycle cost in which debt service is transferred to the next generation and money value is depreciated through high interest rate (Shabert, 2004), and 3) because of finite horizons, the fiscal authority tends to spend more than (or less than) proportionate to inflation (recession) to offset the dampened demands (overheating demands) due to inflation reduction (recession mitigation); and as such, government liabilities affect ag-gregate demand dynamics, which in turn generates net wealth (Pier-gallini, 2005; Bartolomeo & Gioacchino, 2008).
Specifically, the literature in this vein asserts that fiscal policy must be counter-cyclical while monetary policy should be cyclical. In bad times, deficit finance or tax cuts will boost private consumption, espe-cially when lower interest rates fail to boost investment and consump-tion for several consecutive periods because private agents continue

Nóe
sis
18
Publ
ic fin
ance
and
mon
etary
poli
cies a
s eco
nom
ic sta
biliz
er: u
niqu
e or u
nive
rsal a
cross
coun
tries
?
cutting their investment and consumption for fear of persistent reces-sions (Beetsma & Bovenberg, 1995, Schabert, 2004; Durham, 2006). In good times, increasing income tax rates will deflate the economy at relatively less social cost compared to monetary policy because eco-nomic agents will not need to guess whether inflation will occur and thus there is no need to prematurely cut employment contracts, in-vestment and spending in fear of persistent inflation (Schabert, 2004; Durham, 2006). To summarize, the literature in this group assumes that economic agents adjust to economic signals by interpreting whether the recession or inflation spell will be temporary or persistent and thus monetary policy will be ineffective.
In contrast with this view, other literature asserts that under the same conditions stated above (i.e., an open economy with relatively high debt accumulation), monetary policy is more efficient than fis-cal policy in stabilizing the economy (Kirsanova, Stehn, Vines, 2005). The key is for countries to follow the Taylor rule and set the nominal interest rate to target the inflation rate and the gap between actual and potential output, and then use fiscal policy to complement the policy. So in bad times, nominal interest rates should be negative for several periods, followed by mild deficit finance at the end of a long recession to bring an economy to the new equilibrium (Romer & Romer, 1996; Kirsanova, Stehn, Vines, 2005). In good times, the interest rate should be increased for several periods, and then taxes slightly increased or spending cut mildly to reduce inflationary pressures on the economy (Clarida, Gali & Gertler, 1999; Kirsanova, Stehn, Vines, 2005).
Tax increases and budgetary surpluses in early periods of inflation dampen private investment given that economic agents expect reces-sion in the following period (Kirsanova, Stehn, Vines, 2005). Deficit finance in early period of recession adds higher interest rates especially when public debt accumulation exists. If fiscal policy is counter-cycli-cal, debt accumulation in a recession period will create higher interest rates that will eventually force permanent spending cuts in the ending periods (Stehn & Vines, 2007). As a result, a government stabilizes the economy at relatively high social cost given that permanent bud-get cuts tend to create negative impacts on some labor groups, e.g.,

19
Vol.
25 •
núm
ero 4
9 • e
nero
-juni
o, 20
16Ar
wip
haw
ee S
ritho
ngru
nglow-skill labor that would otherwise be productive if some social pro-grams are not cut (Stehn & Vines, 2007). The models finding these results employ an infinite horizon model assuming that households and firms do not pass debt burdens to the next generation, and there-fore, private agents adapt to fiscal policy changes. This creates a situa-tion where public spending crowds out private consumption.
Clearly, the theoretical literature is mixed in predicting the impacts of fiscal and monetary policies in stabilizing growth. However, one commonality is that all of them address the relative efficiency of fiscal and monetary policy within a developed country context. In OECD countries, the following characteristics are present: 1) a perfect capital market and thus capital inflows are controllable because they are not highly sensitive to changes in domestic taxes and credit rates, 2) taxa-tion at optimal levels, 3) relatively high human development index, 4) relatively high institutional quality,1 and 5) relatively low fiscal burden2 (Eicher et al, 2009). With these characteristics, monetary policy should most likely be the first tool in fighting inflation and recession, with fiscal policy used only when monetary policy is severely constrained by multiple periods of zero-bound interest rates (Mankiw, Wienzierl, Blanchard, Eggertsson, 2011; Romer & Romer, 1996). This is because deficit spending can crowd out private consumption and that the mar-ginal social cost of public deficit may be larger than the marginal so-cial benefit of economic stabilization (Mankiw, Wienzierl, Blanchard, Eggertsson, 2011; Christiano, Eichenbaum & Robelo, 2009). Existing empirical evidence supports the traditional views that monetary pol-icy can stabilize OECD economies at a lower cost than fiscal policy. For example, Alesina, Silvia, Roberto & Fabio (2002) found that in 18 OECD countries (excluding Mexico and Turkey) over a 36-year period ranging from 1960 to 1996, a one-percent increase in the ratio
1 According to Eicher, Ochel, Rohn, and Rohwer (2009), institutional quality includes political stability, bureaucratic quality, law and order, property rights and legal structure, corruption, and transparency in economic policy and legal decisions.
2 According to Eicher et al (2009), fiscal burden refers to the ratio of total tax revenue to total GDP. For OECD countries the mean fiscal burden ranges between 25% to 34% between 1965 and 2011 period (OECD Statistics Extract).

Nóe
sis
20
Publ
ic fin
ance
and
mon
etary
poli
cies a
s eco
nom
ic sta
biliz
er: u
niqu
e or u
nive
rsal a
cross
coun
tries
?
of government spending to total GDP significantly reduces private investment for 0.15 percent in the first year and an accumulated 0.75 percent over a five-year period. Tax increases also generate similar ef-fects on private investment although with a slightly smaller effect size (Alesina et al, 2002).
The Role of Fiscal and Monetary Policies on Economic Growth In a closed economy, long-term economic stabilization and stable
growth rates can be achieved if the economy applies strategic coor-dination between fiscal and monetary policies which can effective-ly influence investment and consumption levels to move production forward, and hence expand outputs. Warren Smith (1957) proposed that in a year in which full employment3 and full production capac-ity is achieved, private investment —which expands production and outputs in the following year— must be larger than the tax bur-den (measured by the current-year ratio of net government receipts to national income). If this condition occurs, the economy achieves structural balance in resource allocation between public and private activities fostering long-term economic growth; business cycles that generate temporarily random shocks due to price changes will not interrupt the long-term growth path. However, this situation may not occur because current-year investment depends on current-year prof-its, the levying of taxes on profit (i.e., tax structure) and government consumption (i.e., tax level). If one of these factors alters the level of current-year investment to the point that it is over (or under) the opti-mal level asserted in the ideal situation, inflation (or recession) occurs depending on the real domestic growth rate (Smith 1957).
Later, David Smith (1960) relaxes Warren Smith’s (1957) assump-tion that in an open economy, fiscal policy may be relatively ineffective given that in addition to domestic investment and consumption, the balance of payments (due to a country’s levels of export, import and
3 According to Smith (1957), full employment and production capacity (i.e., technolo-gical progress is fully utilized and no slack capital or human resources remain in the economy).

21
Vol.
25 •
núm
ero 4
9 • e
nero
-juni
o, 20
16Ar
wip
haw
ee S
ritho
ngru
ngdisposable income) will also determine output expansion and contrac-tion. Furthermore, the open economy is subject to foreign domestic growth and decline through the level of openness; therefore for open economies, maintaining the balance of payments is key to stabilize the economy. Smith (1960) proposes that direct policy tools including tariff taxes, import controls and periodic exchange rate devaluations can be used since they directly control the balance of payments. Smith (1960) also notes that to enhance domestic economic growth, mon-etary policy can also be used as a tool to indirectly maintain the bal-ance of payments through the level of investment, especially when the economy faces foreign growth. To expand economic output, reducing interest rates can generate investment incentives while increasing tax rates can free up domestic resources from consumption (Smith, 1960). An exception for the use of those direct policy tools to alter economic outputs is when the tax rate is fixed or when the current account bal-ance does not readily adjust to reflect capital inflows (i.e., imperfect capital markets). In cases with imperfect capital markets, fiscal pol-icy is more appropriate (Smith, 1960) compared to monetary policy. Based on the above literature, the first hypothesis of this paper follows.
Hypothesis 1: In developed countries fiscal policy is relatively ineffective in promoting economic growth comparedto monetary policy
The logic of hypothesis 1 is that in developed countries, which have more complete capital markets, monetary policy is effective by creating incentives for private investment, whereas fiscal policy is rela-tively ineffective due to crowding out effects. Therefore, in a situation of high inflation or recession, the optimal policy is to first increase (decrease) interest rates and then later if the problem persists, raise (lower) taxes or decrease (increase) public spending.

Nóe
sis
22
Publ
ic fin
ance
and
mon
etary
poli
cies a
s eco
nom
ic sta
biliz
er: u
niqu
e or u
nive
rsal a
cross
coun
tries
?
Fiscal and Monetary Policies in Imperfect Capital Markets
Direct applications of the IS/LM and Smith (1960) models to developing countries that tend to lack effective capital markets may cause more harm than good for two main reasons. First, such coun-tries have relatively low to medium per capita income and relatively low levels of direct taxation compared to those of developed countries. As a result, private sector income cannot be monetized by the central bank (Fielding, 2008). This failure induces low domestic currency de-mands and national saving rates, and as a result, the interest rate has little effect on cash flows (Fielding, 2008). Second, for these countries, due to relatively high public debt accumulation, hyperinflation, and weak government accountability as well as low creditability, central banks fail to effectively fight inflation in good times. When this sit-uation occurs, public debt fails to absorb inflation unless the interest rate is much higher than inflation, requiring tax rates high enough to reduce investment and consumption.
El-Shagi (2012) created an index of capital market controls for more than 200 countries around the world, using an innovative ap-proach in which capital inflows and outflows as well as institutional quality are incorporated. Based on the new database, El-Shagi (2012) asserts that it is not the intensity of capital market controls, but the quality and intention of capital market regulations that determine a country’s economic growth. For example, in western industrialized countries, capital market restrictions are designed to limit exposure to foreign risks instead of enhancing local currency supplies. In such countries, the level of capital inflow regulations is relatively compati-ble with those of outflow. Capital market transaction approvals are not subject to arbitrary decisions by a government agency4 (See El-Sha-gi’s (2012) statistics in p. 291). In non-industrialized countries, capi-
4 El-Shagi (2012) concludes that for developing and transitioning countries that are not in the first group, capital market regulation tends to be abused by either a) requiring special approvals for a government agency for transaction (e.g., a country in Latin America) or b) having capital outflow controls that are stronger than inflows (e.g., Middle East, Sub-Saharan and North African countries).

23
Vol.
25 •
núm
ero 4
9 • e
nero
-juni
o, 20
16Ar
wip
haw
ee S
ritho
ngru
ngtal market regulations are abused and used to enhance domestic cash supply rather than to forfeit capital supply. If this is the case, monetary policies are unlikely to be effective since central bank discount rates must be excessively high or low compared to the real interest rate to fight economic volatility. When the central bank has to set interest rates at extreme levels, society pays relatively high social costs resulting from unemployment rates which are too high or too low.
Uncontrollable capital inflows can create either negative or pos-itive effects to an economy depending on government capacity and the quality of institutions designed to handle rising inflows. Capital inflows tend to raise demand for a country’s currency and to respond to this situation, a government would intervene by increasing the money supply through policies allowing foreigners to invest in capital markets that can generate long-term economic growth. This process has been termed monetization (Calvo, Leiderman, Reinhart, 1996). In other cases, monetization results in inflation pressure followed by the appreciation rate of the domestic currency exchange, which in turn, dampens exports, creating trade deficits (Calvo, Leiderman and Re-inhart, 1996). In most countries, rising capital inflows occur in good times because of government’s budget surplus and better credit rating and rising outflows occur in bad times because of public debt pay-ments (Kaninsky, Rienhart & Vegh, 2004). In industrialized countries, monetary policy tends to be counter-cyclical; and hence, the inter-est rates are an effective tool to slow down inflation and recession (Mankiw, Wienzierl, Blanchard, Eggertsson, 2011). In non-industri-alized countries, fiscal policy tends to be cyclical. When this practice is coupled with the incomplete capital market problems in developing countries, their economies are relatively volatile compared to industri-alized ones (Kaninsky, Rienhart & Vegh, 2004). For this reason, East-erly and Schmidt-Hebbel (1993) argue that in developing countries, good public financial management through well-planned taxing and spending leads to growth. This is because private investment is highly responsive to interest rates that can be kept at relatively low levels through domestic borrowing and good fiscal management discipline, rather than creating foreign debts.

Nóe
sis
24
Publ
ic fin
ance
and
mon
etary
poli
cies a
s eco
nom
ic sta
biliz
er: u
niqu
e or u
nive
rsal a
cross
coun
tries
?
In addition to underdeveloped capital markets, developing coun-tries tend to have incomplete trade openness, opaque capital accounts, and relatively high government deficits (Hasan & Isgut, 2009). When the capital market is not fully open due to uncertain rules for foreign transactions, monetary policy will lose power because it cannot di-rectly control stocks of foreign currency circulating in the economy (Hasan & Isgut, 2009). Based on the above results, the second hy-pothesis for the study is:
Hypothesis 2: In developing countries with imperfect capital markets, fiscal policy is effective in stabilizing economies, while monetary policy is relatively ineffective.
Methodology And Data
Fischer (1993) defines a stable economy conducing growth as the economy whose inflation is low and predictable, real interest rate is at the optimal level, fiscal policy is stable and sustainable, real ex-change rate is competitive and predictable, and balance of payments is perceived as viable (p. 4.) Fischer’s conceptualization is that high inflation negatively affects capital accumulation while the balance of payments positively affects capital accumulation; both are transmitted to economic growth rates through national saving, monetary and fis-cal policies (i.e., interest rates and government spending). In Fischer’s formulation economic growth (Y) is a function of the inflation rate (π), the current account balance (b), government spending (g), interest rates (r) and capital accumulation (k):
(1) Equation (1) can be estimated through a standard Ordinary
Least Square (OLS) method, however, there will be an endogene-ity problem in which each of the independent variables (π, b, g, r, k) are endogenously determined by both the dependent variable (y) and other independent variables. The Two-Stage Least Square method

25
Vol.
25 •
núm
ero 4
9 • e
nero
-juni
o, 20
16Ar
wip
haw
ee S
ritho
ngru
ng(2SLS) which uses a set of instrumental variables to estimate the val-ues of the four endogenous variables is an appropriate method to ad-dress endogeneity. However, in practice, it is impractical to find a set of multiple instrumental variables that robustly explain the endogenous variables while at the same time are not influenced by other variables (Stock & Watson, 2001). Furthermore, in panel data, error terms of the first and second stages of analysis can be correlated (Hsiao, 1999). For this reason, the theoretical model proposed by Kirsanova, Stehn and Vines (2005) is used because the model is a system equation in which each variable is simultaneously affected by other variables and their stochastic errors.
(2)
where Yi,t is per capita real GDP at time t in country i (values are in purchasing power constant dollar), Ri,t is the central bank’s discount rate at time t in country I, Ki,t is the ratio of capital stock to GDP at time t in country I, Gi,t is the ratio of government consumption to

Nóe
sis
26
Publ
ic fin
ance
and
mon
etary
poli
cies a
s eco
nom
ic sta
biliz
er: u
niqu
e or u
nive
rsal a
cross
coun
tries
?
GDP at time t in country I, and Bi,t is the ratio of national account balance to GDP at time t in country i.
Kirsanova et al. (2005) define current year per capita GDP as a function of previous year growth rate, previous and current year dis-count rate, previous and current year account balance value, and pre-vious and current year government spending rate. Given that all of the variables in equation (2) are explained by previous and current year variables of the model, we chose to employ Panel Vector Auto Regression (PVAR), a system equation for panel data to mitigate the endogeneity problem. Standard panel data analysis is unlikely valid and reliable because the data contains fixed effects of each country’s characteristics. Because of this, the residuals from each equation in the system are likely to be correlated and may result in biased coefficients (Kennedy, 2008; Hsiao, 1999). To solve the potential problem of resid-ual correlation across equations in PVAR system, a mean differencing procedure (i.e., the Helmert procedure; see Arellano & Bover, 1995) was used to transform the data, and the PVAR system equations are finally estimated through the general method of moments (GMM). Because per capita GDP is measured in constant dollars, inflation ( as defined in equation (1) is dropped from the model to save the degree of freedom. The resulting PVAR model has five endogenous variables including real per capita GDP (), current account balance (), central bank discount rate (), government spending rate () and capital forma-tion rate ().
Table 1. Sample Countries OECD Member Countries (19) Non-OECD Member Countries (17)
Belgium, Canada, Denmark, Finland, France, Greece, Iceland, Ireland, Italy,
Japan, Netherlands, New Zealand, Norway, Portugal, Spain, Sweden, Swit-zerland, United Kingdom, United States
Algeria, Barbados, Fiji, Hong Kong, Jordan, Kuwait, Mauritius, Pakistan, Paraguay, Peru, Philippines, South Africa, Sri Lanka, Thailand, Trini-dad & Tobacco, Uruguay, Venezuela

27
Vol.
25 •
núm
ero 4
9 • e
nero
-juni
o, 20
16Ar
wip
haw
ee S
ritho
ngru
ngTable 1 presents the list of sample countries. Testing data were derived from 36 countries over a 31-year period ranging from 1980 to 2010. The 36 countries were selected based on the availability of financial and economic data. To control for capital market charac-teristics, we divided the sample into two groups, OECD (developed) and non-OECD (developing) countries. Turkey, Mexico and Hun-gary were omitted from the OECD group because the three coun-tries do not have capital market characteristics that are compatible to those of OECD group; instead their capital market characteristics are more similar to those in the non-OECD group (Table 2, see El-Shagi (2012) for methodology used in calculating the indices of capital mar-ket controls).5 This is also suggested by the findings of Eicher, Ochel, Rohn, & Rohwer ( 2009, p. 27) that Turkey and Mexico ranked the lowest at the 23rd and 24th, respectively, in term of the quality for capital market control. The results in which the three countries sam-ples were included in OECD group are available up request.
5 As presented in Table 2, capital market control index (which is ranging from 0 to 1, 0 is the least controlling system and 1 is the most controlling system) for 17 non-OECD group countries is at 0.35 on average. Turkey, Hungary and Mexico control index is about 0.34 on the average. Meanwhile the control index for 19 OECD countries is 0.06 on average. The control index in this table suggests that the three countries’ capital market are more similar to those in non-OECD countries. For bureaucratic control, data in the same table suggests that on average, bureaucratic control for capital tran-saction approvals in the 17 non-OECD countries is about 0.30 on average. The bu-reaucratic control for capital transaction approvals in the 19 OECD countries is about 0.15 on average. The bureaucratic control in Turkey, Mexico and Hungary is about 0.40 on average. The bureaucratic index in this table also suggests that the three countries’ capital market are more similar to those in non-OECD countries than those in OECD countries.

Nóe
sis
28
Publ
ic fin
ance
and
mon
etary
poli
cies a
s eco
nom
ic sta
biliz
er: u
niqu
e or u
nive
rsal a
cross
coun
tries
?
Table 2. Mean capital market controls by statute and bureaucratic approval requirements from 1998 to 2009 (0 = the least restrictive; 1= the most restrictive)
Controls Bureaucracy
OECD group (19 countries as listed in Table 1) 0.06 0.15Non-OECD group (17 countries as listed in Table 1) 0.35 0.30
Hungary, Turkey and Mexico (ex-cluded from OECD group) 0.34 0.40
Data Source: El-Shagi, M. (2012).
Table 3. Summary Statistics for OECD Member Countries
Variables Mean Standard Deviation
Min. Max.
Current Account Balance (% to GDP) (bi,t ) -0.3 5.2 -28.4 16.5Gross Fixed Capital Forma-tion rate (% to GDP) (ki,t)
21.3 3.5 12.0 34.5
Per Capital Real GDP (Constant $ value) (yi,t )
27,814 7,579 10,806 51,792
Government Spending Rate (% to GDP) (gi,t) 7.1 1.6 3.0 11.3
Central Bank Discount Rate (ri,t) 7.5 6.0 0.0 49.0Annual Change Central Bank
Discount Rate (Δri,t1-t ) -0.3 2.7 -25.0 28.0
Annual Change Per Capita Real GDP (Δyi,t1-t ) 429 846 -5609 4308
Annual Change Government Spen-ding Rate (% to GDP) (Δgi,t1-t )
0.0 0.3 -1.4 1.8
Annual Change Gross fixed capital Formation rate (% to GDP) (Δki,t1-t )
-0.2 1.4 -10.5 6.2
Annual Change Current Account Balance (% to GDP) (Δbi,t1-t )
0.1 2.2 -12.6 16.8

29
Vol.
25 •
núm
ero 4
9 • e
nero
-juni
o, 20
16Ar
wip
haw
ee S
ritho
ngru
ngTable 4. Summary Statistics for Non-OECD Member Countries
Variables Mean Standard Deviation
Min. Max.
Current Account Balance (% to GDP) (bi,t ) 0.41 14.35 -242.19 54.57Gross Fixed Capital Forma-tion rate (% to GDP) (ki,t) 21.7 5.81 9.5 43.2Per Capita Real GDP (Constant $ value) (yi,t ) 9,617 10,382 1,170 52,502Government Spending Rate (% to GDP) ( gi,t ) 7.76 3.45 2.82 29.40Central Bank Discount Rate (ri,t) 21.96 61.03 0.00 866.00Annual Change Central Bank Discount Rate (Δri,t1-t ) -0.17 47.60 -576.00 718.00Annual Change Per Capita Real GDP (Δyi,t1-t ) 158 1,172 -10,315 9,690Annual Change Government Spen-ding Rate (% to GDP) (Δgi,t1-t ) -0.01 1.20 -11.15 11.62Annual Change Gross fixed capital For-mation rate (% to GDP) ( Δki,t1-t ) -0.17 3.27 -19.40 21.30Annual Change Current Account Ba-lance (% to GDP) ( Δbi,t1-t ) 0.06 16.70 -262.53 239.92
Tables 3 and 4 present summary statistics for OECD and non-OECD groups, respectively. The total observation for the OECD group is 589 (19 countries * 31 years). The total observation for the non-OECD group is 527 (17 countries * 31 years). Current account balance and gross fixed capital formation data were derived from In-ternational Monetary Fund (IMF). Per capita real Gross Domestic Product (GDP) and government spending data were taken from Penn World Statistics 7.1. Central bank discount rate data comes from the CIA Fact Book in various years.
As presented in Tables 3 and 4, the average per capita real GDP for the OECD and non-OECD groups is $27,814 and $9,617 re-spectively. The average values of central bank discount rate for OECD and non-OECD groups is are approximately 7.5% and 22%, respec-tively. The average value for account balance for OECD and non-

Nóe
sis
30
Publ
ic fin
ance
and
mon
etary
poli
cies a
s eco
nom
ic sta
biliz
er: u
niqu
e or u
nive
rsal a
cross
coun
tries
?
OECD groups is -0.3% and +0.41%, respectively. The average value of gross fixed capital formation for OECD and non-OECD groups is 21.3% and 21.7%, respectively. The mean government spending rate for OECD and non-OECD groups is 7.1% and 7.8%, respectively.
The summary statistics for GDP levels, account balance levels and interest rate indicate that the two groups are distinctively different in terms of their real productivity levels, interest rates and nation-al account balance. The summary statistics in Tables 3 and 4 show that capital stocks and government spending for both OECD and non-OECD groups are similar, regardless of economy size and open-ness structure. Interestingly, the relatively high interest rates for non-OECD countries support El-Shagi’s (2012) notion that the interest rate in developing countries with imperfect capital markets tends be set at a relatively high level in order to increase cash supply rather than enhance economic investment.
Empirical Results And DiscussionI used the PVAR system estimator as discussed above to obtain
estimates of the coefficients. Joint significance tests of the null hy-pothesis confirmed the coefficients were not zero for all current and lagged values of one variable on another variable. Lag length tests using the Schwarz Bayesian Information Criterion (BIC) suggested that a four-period lag and a three-period lag were an appropriate lag length for OECD and non-OECD groups, respectively. The F-sta-tistic indicated that each of the variables was jointly significant for the system equations.
The coefficients of PVAR models are consistent, but the standard errors of individual coefficients tend to be inflated due to the heavy parameterization of the model. For this reason, the statistical signif-icance test through probability value (i.e., p-value) traditionally used in OLS estimation is not very useful to decide whether the effects of the independent variables in the model are statistically significant (Kennedy, 2008). Therefore, most often the analysis of PVAR models proceeds through an analysis of simulated shocks to the system using

31
Vol.
25 •
núm
ero 4
9 • e
nero
-juni
o, 20
16Ar
wip
haw
ee S
ritho
ngru
ngthe coefficient estimates and residuals of the model (i.e., impulse re-sponse functions) (Stock & Watson, 2001).
Impulse Response of Real Per Capita GDP to Fiscal and Monetary Policy in OECD Countries
Table 5 presents PVAR estimates of the response of per capita real GDP change to government spending, central bank discount rate, capital stock and national account balance for OECD countries. Fig-ures 1 through 4 present a graphic version for PVAR impulse response for real per capita GDP change to a standard deviation shock of cen-tral bank discount rate, government spending, capital stock, and bal-ance payment, respectively, for OECD country group. As seen across the second row of Table 4, real per capita GDP exhibits strong trends across a six-year period. A one standard deviation ($ 846) increase in real per capita GDP results in $707, $395, $107, $142, $108, $66, $51 increase in real per capita income for the current year, one-year, two-year, three-year, four-year, five-year, and six-year after the productivity change, respectively. All of these effects are statistically significant at .05 level given that the upper and lower-bound of each estimated val-ue does not cover zero, and hence, the point estimated of the effect is statistically significant within 95% confident interval. These results confirm autocorrelation within a country’s real GDP, and thus, PVAR is an appropriate method.

Nóe
sis
32
Publ
ic fin
ance
and
mon
etary
poli
cies a
s eco
nom
ic sta
biliz
er: u
niqu
e or u
nive
rsal a
cross
coun
tries
?
Tabl
e 5. O
ECD
Cou
ntrie
s: Im
pulse
Res
pons
e Fun
ctio
n fo
r Rea
l Per
Cap
ita G
DP
(in re
al
dolla
r val
ue) t
o a S
tand
ard
Dev
iatio
n C
hang
e in
the v
aria
ble i
ndic
ated
(var
ious
lag
perio
ds)*
Varia
ble
Per C
apita
GD
P R
espo
nse S
ize
Year t
Year
t+
1 Ye
ar
t+2
Year
t+
3Ye
ar
t+4
Year
t+
5Ye
ar
t+6
Cum
ulat
ive E
ffect
A
cros
s Tim
e
(Δy i,t
1-t )
Lo
wer B
ound
(95%
CI)
665.
432
6.4
10.5
13.4
9.6
-38.
3-3
2.4
$
1,02
5
($84
6)Po
int E
stim
ated
706.
639
4.8
106.
814
2.2
108.
465
.950
.6 $
1,4
59
U
pper
Bou
nd (9
5% C
I)74
6.6
469.
721
8.1
259.
821
5.4
175.
714
9.7
$ 1
,910
(Δ
r i,t1-
t )
Lowe
r Bou
nd (9
5% C
I)0
-160
-280
-200
-130
-49.
7-4
9.5
$ (7
70)
(2.
7%)
Poin
t Esti
mat
ed0
-82.
8-2
10-1
30-7
0.8
13.8
5.3
$(4
94)
U
pper
Bou
nd (9
5% C
I)0
-16.
2-1
30-7
0.3
-9.7
76.3
59.1
$(2
26)
(Δg i,t
1-t )
Lo
wer B
ound
(95%
CI)
0-4
7.7
-18.
817
-25.
4-2
1.9
-48.
8 $
0
(.
3%)
Poin
t Esti
mat
ed0
4.3
4184
.345
.931
.49.
3 $
0
U
pper
Bou
nd (9
5% C
I)0
54.8
102.
115
1.3
111.
291
66.3
$0
(Δk i,t
1-t )
Lo
wer B
ound
(95%
CI)
0-3
2.3
-160
-260
-220
-170
-120
$0
(1.4
%)
Poin
t Esti
mat
ed0
58.9
-64.
3-1
60-1
30-1
10-5
0.4
$0
U
pper
Bou
nd (9
5% C
I)0
163.
519
.2-4
5.4
-45.
7-3
6.8
11.6
$0
(Δb i,t
1-t )
Lowe
r Bou
nd (9
5% C
I)0
-210
-120
-58.
2-1
20-9
2.2
-83.
5 $
0
(2
.2%
)Po
int E
stim
ated
0-1
50-3
8.5
56.1
-28.
7-7
-17
$0
U
pper
Bou
nd (9
5% C
I)0
-85.
556
.514
5.4
48.1
61.3
42.1
$0
* Not
e: T
he n
umbe
r in
each
cell
indi
cate
s res
pons
es o
f rea
l per
capi
ta G
DP
to a
stand
ard
devia
tion
shoc
k in
the m
odel
varia
bles
liste
d in
the
first
colu
mn
at d
iffer
ent p
erio
ds ra
ngin
g fro
m ye
ar t
to ye
ar t+
6. St
anda
rd d
eviat
ion
valu
e for
each
varia
ble s
hock
s are
repo
rted
in p
aren
thes
is be
low
each
varia
ble’s
nam
e in
the f
irst c
olum
n. F
or si
gnifi
canc
e tes
t in
impu
lse re
spon
se st
atist
ics, if
the p
oint
estim
atio
n an
d th
e low
er an
d up
per b
ound
estim
atio
n wi
thin
95%
conf
iden
t int
erva
l doe
s not
cove
r zer
o va
lue,
the p
oint
estim
ated
is st
atist
ically
sign
ifica
nt at
.05
level.
N
et an
d cu
mul
ative
effe
cts a
re fo
und
by ad
ding
sign
ifica
nt re
spon
ses f
or ea
ch ro
w an
d ar
e rep
orte
d in
the l
ast c
olum
n. L
ag le
ngth
test
was
perfo
rmed
and
for t
he N
on-O
ECD
gro
up, 4
lags
wer
e fou
nd to
be a
ppro
priat
e lag
leng
th.

33
Vol.
25 •
núm
ero 4
9 • e
nero
-juni
o, 20
16Ar
wip
haw
ee S
ritho
ngru
ngFigure 1. Impulse Response of Real Per Capita GDP to One Standard Deviation Shock of Central Bank Discount Rate in OECD Countries
As seen across the third row of Table 5 and Figure 1 above, a stan-dard deviation increase in central bank discount rate (2.7) results in $83, $210, $130, and $71 decrease in real per capital GDP one-year, two-year, three-year and four-year after the monetary policy change, respectively. These monetary policy effects are statistically signif-icant at .05 level across four-year period given that the upper and lower-bound of each point estimated value does not cover zero; and hence, the point estimated of the effect is statistically significant at .05 level. Note that the central bank discount rate does not have a statisti-cally significant effect on real per capita GDP in the same year as the monetary policy was introduced (i.e., year t or column 3 of the Table). Furthermore, as seen in Table 5 and Figure 1, the effect of monetary policy on real per capita GDP is persistent across four years after the policy was implemented. Once again, these results empirically con-firm the first hypothesis that in OECD countries, monetary policy is effective because a lower interest rate induces incentives for invest-ment, while fiscal policy (i.e., government spending variable in the
Nóe
sis
34
Publ
ic fin
ance
and
mon
etary
poli
cies a
s eco
nom
ic sta
biliz
er: u
niqu
e or u
nive
rsal a
cross
coun
tries
?
test) is not relatively effective given that the spending does not have a significant effect on growth when monetary policy is controlled.
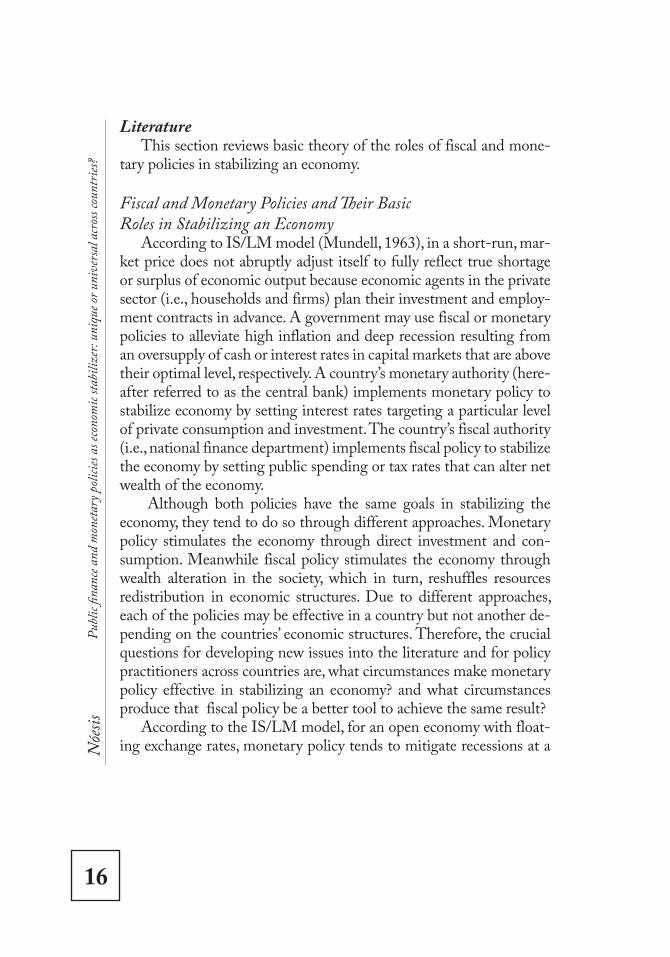
As presented in the last column of Table 5, the cumulative effect of monetary policy across the four-year period is $494—that is, for every 2.7% central bank discount rate dropped by the monetary policy authority, the economy is advanced about $494 real per capita GDP across four-year period. Furthermore, the effects of monetary policy can be seen across the four-year period starting from the first year af-ter the interest rate reduction (i.e., year t+1, t+2, t+3, and t+4 columns in the table). This result again empirically supports the first hypothesis that in OECD countries where capital markets are relatively control-lable, monetary policy is effective in enhancing economic growth. The possible reason is that interest rate works directly in increasing invest-ment incentive, while fiscal policy tends to be less effective because the private sector can speculate future economy.
Figure 2. Impulse Response of Real Per Capita GDP to One Standard Deviation Shock of Government Spending in OECD Countries
35
Vol.
25 •
núm
ero 4
9 • e
nero
-juni
o, 20
16Ar
wip
haw
ee S
ritho
ngru
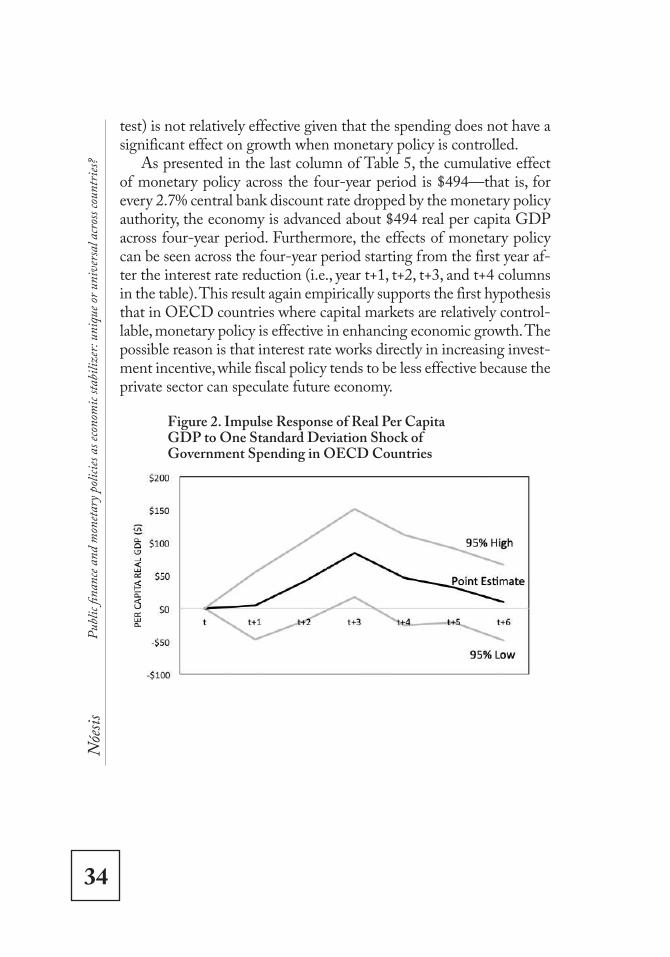
ngFigure 3. Impulse Response of Real Per Capita GDP to One Standard Deviation Shock of Capital Formation in OECD Countries
Figure 4. Impulse Response of Real Per Capita GDP to One Standard Deviation Shock of National Account Balance in OECD Countries

Nóe
sis
36
Publ
ic fin
ance
and
mon
etary
poli
cies a
s eco
nom
ic sta
biliz
er: u
niqu
e or u
nive
rsal a
cross
coun
tries
?
As presented in rows four, five and six of Table 5 and Figures 2 through 4, government spending, gross fixed capital formation, and national account balance do not significantly affect OECD economies. These results are sensible given that annual government spending rate, cumulative capital stock formation and account balance changes are at about 0, -0.2, and 0.1 per year on average as shown by summary statis-tics in Table 3. Furthermore, for relatively stable economies, like those in OECD countries, monetary policies tend to be easily predicted by private economic agents; and hence none of these variables is useful in stimulating growth in the OECD economies. Future studies should examine these tentative assumptions to understand the roles of fiscal and monetary policies in well-structured economies such as those in OECD group.
Impulse Response of Real Per Capita GDP to Fiscal and Monetary Policy in non-OECD Countries
Table 6 presents estimates of the response of per capita real GDP change to government spending, central bank discount rate, private capital stock and national account balance in non-OECD countries. Figures 5 through 8 present impulse response function of per capi-ta GDP to government spending, central bank discount rate, private capital stock and national account balance in a graphic form.
As seen across the second row of Table 6, real per capita GDP ex-hibits a relatively weak effect compared to those in OECD countries. A one standard deviation ($ 1,172 ) increase in real per capita GDP results in $962, $293, and $176 increase in real per capita income for the current year, two-year, and four-year after the productivity change occurs, respectively. These effects are statistically significant at the .05 level. Again, this confirms that PVAR is an appropriate method given that autocorrelation in GDP data occurs.

37
Vol.
25 •
núm
ero 4
9 • e
nero
-juni
o, 20
16Ar
wip
haw
ee S
ritho
ngru
ng
Tabl
e 6. I
mpu
lse R
espo
nse o
f Rea
l Per
Cap
ita G
DP
to F
iscal
and
Mon
etar
y Pol
icy V
aria
bles
in n
on-O
ECD
Cou
ntry
*
Varia
ble
Per C
apita
GD
P R
espo
nse S
ize
Year t
Year
t+
1 Ye
ar
t+2
Year
t+
3Ye
ar
t+4
Year
t+
5Ye
ar
t+6
Cum
ulat
ive E
ffect
A
cros
s Tim
e
(Δy i,t
1-t )
($1
,172
)
Lowe
r Bou
nd (9
5% C
I)90
1-3
6.9
172.
7-1
9021
.3-7
4.2
-37.
3 $
1,0
95
Po
int E
stim
ated
962.
420
9.8
292.
8-9
.917
6.5
56.8
44.8
$ 1
,432
Upp
er B
ound
(95%
CI)
1000
439.
248
1.2
168.
134
1.7
204.
620
2.1
$ 1
,823
(Δr i,t
1-t )
(4
8%)
Lowe
r Bou
nd (9
5% C
I)0
-41.
9-2
3.6
-77.
4-6
-63.
3-1
5.8
$
0
Poin
t Esti
mat
ed0
-4.5
31-2
3.1
38.4
-19
18 $
0
U
pper
Bou
nd (9
5% C
I)0
35.7
82.2
25.6
93.8
11.6
48.7
$
0
(Δg i,t
1-t )
(1.2
%)
Lowe
r Bou
nd (9
5% C
I)0
207.
787
15.3
5.5
6.4
3 $
32
5
Poin
t Esti
mat
ed0
348.
325
6.1
141.
499
.398
.682
.4 $
1,0
26
U
pper
Bou
nd (9
5% C
I)0
507.
645
3.9
367.
626
7.2
269.
924
0.7
$ 2
,107
(Δk i,t
1-t )
(3.3
%)
Lowe
r Bou
nd (9
5% C
I)0
-150
-61.
9-3
90-8
8.8
-140
-43.
3 $
(390
)
Po
int E
stim
ated
0-1
0.6
41.4
-230
-27.
6-5
0.1
8.5
$ (2
30)
Upp
er B
ound
(95%
CI)
013
4.3
145.
6-5
5.3
50.8
13.8
70.5
$ (5
5)
(Δb i,t
1-t )
(16.
7%)
Lowe
r Bou
nd (9
5% C
I)0
-200
2-9
2.3
-74.
4-6
2.4
-16.
1 $
(198
)
Po
int E
stim
ated
0-1
1012
4.3
-24
-11.
3-1
3.2
20.6
$ 1
4
Upp
er B
ound
(95%
CI)
0-2
3.8
249
45.9
42.2
37.9
72 $
225
*Not
e: T
he n
umbe
r in
each
cell
indi
cate
s res
pons
es o
f rea
l per
capi
ta G
DP
to a
stand
ard
devia
tion
shoc
k in
the m
odel
varia
bles
liste
d in
the
first
colu
mn
at d
iffer
ent p
erio
ds ra
ngin
g fro
m ye
ar t
to ye
ar t+
6. St
anda
rd d
eviat
ion
valu
e for
each
varia
ble s
hock
s are
repo
rted
in p
aren
thes
is be
low
each
varia
ble’s
nam
e in
the f
irst c
olum
n. F
or si
gnifi
canc
e tes
t in
impu
lse re
spon
se st
atist
ics, if
the p
oint
estim
atio
n an
d th
e low
er an
d up
per b
ound
estim
atio
n wi
thin
95%
conf
iden
t int
erva
l doe
s not
cove
r zer
o va
lue,
the p
oint
estim
ated
is st
atist
ically
sign
ifica
nt at
.05
level.
N
et an
d cu
mul
ative
effe
cts a
re fo
und
by ad
ding
sign
ifica
nt re
spon
ses f
or ea
ch ro
w an
d ar
e rep
orte
d in
the l
ast c
olum
n. L
ag le
ngth
test
was
perfo
rmed
and
for t
he N
on-O
ECD
gro
up, 3
lags
wer
e fou
nd to
be a
ppro
priat
e lag
leng
th.

Nóe
sis
38
Publ
ic fin
ance
and
mon
etary
poli
cies a
s eco
nom
ic sta
biliz
er: u
niqu
e or u
nive
rsal a
cross
coun
tries
?
Figure 5. Impulse Response of Real Per Capita GDP to One Standard Deviation Shock of Central Bank Discount Rate in non-OECD Countries
As seen across the third row of Table 6 and Figure 5, in non-OECD countries, the central bank discount rate does not have a sta-tistically significant effect on developing economies across the testing time period including the same year as the monetary policy was intro-duced (i.e., year t or column 3 of the Table). In non-OECD countries, the average value of the central bank discount rate is 21.7% (see Table 4), while those in OECD countries is only 7.5% (see Table 3). These statistical data implies that the cost of investment (i.e., discount rate) in the non-OECD countries are relatively large compared to OECD. The results support the El-Shagi (2012) assumption that governance and transparency is the key to decide whether monetary policy should be used in stabilizing economies.

39
Vol.
25 •
núm
ero 4
9 • e
nero
-juni
o, 20
16Ar
wip
haw
ee S
ritho
ngru
ngFigure 6. Impulse Response of Real Per Capita GDP to One Standard Deviation Shock of Government Spending in non-OECD Countries
In contrast to monetary policy, the PVAR results indicate that fis-cal policy is effective in enhancing growth in the non-OECD econ-omies. As presented in the fourth row of Table 6 and Figure 6, fiscal policy is statistically significant to growth across six-year period. A standard deviation increase in government spending (1.2% of GDP as presented in Table 3) results in $348, $256, $141, $99, $99, and $82 increase in real per capita GDP one-year, two-year, three-year, four-year, five-year and six-year after the government spending is imple-mented, respectively. As shown in Figure 6, these fiscal policy effects are statistically significant at the .05 level across six-year period. Note that the government spending does not have a statistically significant effect on real per capita GDP in the same year as the fiscal policy was introduced (i.e., year t in the Table).
Furthermore, as seen across row three of Table 6 and Figure 6, the effects of government spending on real per capita GDP are persistent across six years after the policy was implemented. The last column of Table 6 indicates that the cumulative effect of fiscal policy is $1,026—that is, for every 1.2% of government spending increase in the first year, economic growth increases by about $1,026 accumulated through the entire period. These positive effects can be seen across the six-year

Nóe
sis
40
Publ
ic fin
ance
and
mon
etary
poli
cies a
s eco
nom
ic sta
biliz
er: u
niqu
e or u
nive
rsal a
cross
coun
tries
?
period starting from the first year after the government spending was introduced (i.e., year t+1, t+2, t+3, t+4, t+5, t+6 columns in the table). Once again, these results empirically confirm the second hypothesis that in non-OECD countries, fiscal policy is better than monetary policy in stimulating economic growth. The potential reason is that in incomplete capital markets, future economies are unpredictable and economic agents interact with fiscal policy.
Figure 7. Impulse Response of Real Per Capita GDP to One Standard Deviation Shock of Capital Formation in non-OECD Countries
Figure 8. Impulse Response of Real Per Capita GDP to One Standard Deviation Shock of National Account Balance in non-OECD Countries

41
Vol.
25 •
núm
ero 4
9 • e
nero
-juni
o, 20
16Ar
wip
haw
ee S
ritho
ngru
ngAs presented in rows five and six of Table 6 and Figures 7 and 8 above, capital stock and current account balances do not signifi-cantly affect non-OECD economies. As shown in summary statistics table (See Table 4), in non-OECD group, the average value of gross fixed capital formation is 21.7% and its national account balance in these countries is 0.41%. The capital investment rate and account bal-ance rate in the non-OECD countries are similar to those of OECD (21.3% and -.03% for capital formation and national balance rates, respectively, see Table 3). These statistical data imply that export and import activities in the non-OECD countries are not helpful in en-hancing the economies in both OECD and non-OECD groups.
ConclusionThis study empirically examines the effect of fiscal and monetary
policies on economic growth measured by the change in real per cap-ita GDP. Fiscal and monetary policies stabilize an economy through different approaches. Monetary policy uses interest rates to stimulate an economy through investment and consumption levels. Meanwhile fiscal policy uses public spending or taxes or both to stimulate an economy through wealth alteration between public and private sec-tors, and hence, reshuffles the economic structure rather than simply altering production levels.
The study uses PVAR to estimate a system equation of economic growth and macro-economic policies. The results confirm the major hypotheses: public spending enhances productivity in non-OECD countries across a six-year period while central bank discount rate en-hances productivity in OECD countries across four-year period. The cumulative effect of reducing central bank discount rate by 2.7% is a $494 increase in real per capita GDP for OECD group. The cumu-lative effect of increasing government spending by 1.2 % is a $1,026 increase in real per capita GDP for non-OECD group.
The findings add to the international public policy literature that developing and developed countries need different policy tools. This additional knowledge is vitally important for developing countries in which economic growth process is vaguely understood. The study is

Nóe
sis
42
Publ
ic fin
ance
and
mon
etary
poli
cies a
s eco
nom
ic sta
biliz
er: u
niqu
e or u
nive
rsal a
cross
coun
tries
?
somewhat limited in that the variables of perfect and imperfect capital market are not directly tested by the model, but controlled by run-ning the models of separate groups of countries. A future study should address this limitation by incorporating estimates of capital market features to see how the macro-economic policies interact with capital markets and indirectly generate the effects on national productivity through private investment levels.
ReferencesAlesina, Alberto; Ardagna, Silvia; Perotti, Roberto and Schiantarelli,
Fabio. 2002. Fiscal policy, profits and investment. The American Economic Review 92 (3): 571-589.
Arellano, Manuel and Bover, Olympia. 1995. Panel data: Another look at the instrumental variable estimation of error component models. Journal of Econometrics 68: 29–51.
Bartolomeo, Giovanni and Gioacchino, Debora. 2008. Fiscal monetary policy coordination and debt management: A two-stage analysis. Empirica 35: 433-448.
Beetsma, Roel and Bovenberg, Lans. 1995. Monetary union without fiscal coordination may discipline policy makers. Central Planning Bureau Working Paper: 1-18.
Bordo, Michael and Landon-Lane, John. 2013. Does expansionary monetary policy causes asset price booms; some historical and empirical evidence. NBER Working Paper 19585: 1-73
Calvo, Guillermo, Leiderman, Leonardo and Rinehart, Carmen. 1996. Inflows of capital to developing countries in the 1990s. The journal of Economic Perspectives 10(2): 123-139.
Christiano, Lawrence, Eichenbaum, Martin and Robelo, Sergio. 2009. When is government spending multiplier large? National Bureau of Economic Research NBER Working Paper 15394: 1-68.
Clarida, Richard, Gali, Jordi and Gertler, Mark. 1999. The science of monetary policy: A new Keynesian perspective. Journal of Economic Literature 37: 1661-1707.

43
Vol.
25 •
núm
ero 4
9 • e
nero
-juni
o, 20
16Ar
wip
haw
ee S
ritho
ngru
ngDurham, Benson. 2006. An estimate of the inflation risk premium using a three factor affine term structure model. Board of Governors of the Federal Reserve Finance and Economics Discussion Series, Working paper 2006-42.
Easterly, Williams and Schmidt-Hebbel, Klaus. 1993. Fiscal deficits and macroeconomic performance in developing countries. The World Bank Research Observer 8(2): 211-237.
Eicher, Theor, Ochel, Wolfgang, Rohn, Oliver & Rohwer, Anja. 2009. Institutions and growth in OECD countries. Research Report by Institute for Economic Research at the University of Munich, 2 (07): 24-29. https://ideas.repec.org/a/ces/ifodic/v7y2009i2p24-29.html. (October 12, 2014)
El-Shagi, Makram. 2012. Initial Evidence from a New Database on Capital Market Restrictions. Panoeconomicus, 3: 283-292.
Fielding, David. 2008. Fiscal and monetary policies in developing countries. In The New Palgrave Dictionary of Economics, edited by Steven N. Durlauf and Lawrence E. Blume, pp. 400-405. New York City: Palgrave Macmillan.
Fischer, Stanley. 1993. The role of macroeconomic factors in growth. National Bureau of Economic Research Working Paper 4565:1-36.
Hasan, Aynul and Isgut, Alberto. 2009. Effective Coordination of Monetary and Fiscal policies: Conceptual Issues and Experiences of selected Asia-Pacific Countries. Paper presented at United Nations Economic and Social Commission for Asia and the Pacific (UNESCAP)’s Regional High-Level Workshop on “Strengthening the Response to the Global Financial Crisis in Asia-Pacific: The Role of Monetary, Fiscal and External Debt Policies, Dhaka, Bangladesh”.
Hsiao, Cheng. 1999. Analysis of panel data. Cambridge, MA: Cambridge University Press.
Kaninsky, Gracia, L., Rinehart, Carmen, M. and Vegh, Carlos, A. 2004. When it rains, it pours: Procyclical capital flows and macroeconomic policies. NBER Macroeconomics Annual 19: 11-53.
Kennedy, Peter. 2008. A guide to econometrics. 5th Ed. Cambridge, MA: MIT Press.

Nóe
sis
44
Publ
ic fin
ance
and
mon
etary
poli
cies a
s eco
nom
ic sta
biliz
er: u
niqu
e or u
nive
rsal a
cross
coun
tries
?
Kirsanova, Tatiana, Stehn, Sven Jari and Vines, David. 2005. The Interactions of Monetary and Fiscal Policy. Oxford Review of Economic Policy 21 (1): 532-564.
Mankiw, Gregory, Wienzierl, Mathew, Blanchard, Olivier, Eggertsson, Gauti. 2011. An Exploration of Optimal Stabilization Policy. Brookings Papers on Economic Activities. Washington, DC: Brookings Institution Press.
Mundell, R.A. 1963. Capital mobility and stabilization policy under fixed and flexible exchange rates. Canadian Journal of Economics 29: 475-485.
Musgrave, Richard. 1959. The Theory of Public Finance: A Study in Public Economy. New York: McGraw-Hill.
Piergallini, Alessandro. 2005. Equilibrium Determinacy under Monetary and Fiscal Policies in an Overlapping Generations Model. Economic Notes 34(3):313-330.
Romer, Christina and Romer, David. 1996. What ends recession? National Bureau of Economic Research, NBER Working Paper 4765:13-79.
Schabert, Andreas. 2004. Interactions of monetary and fiscal policy via open market operations. The Economic Journal 114(494): 186-206.
Smith, Warren L. 1957. Monetary-Fiscal policy and economic growth. The Quarterly Journal of Economics 17(1): 36-55.
Smith, David C. 1960. Monetary-Fiscal policy and economic growth in an open economy. The Quarterly Journal of Economics 74(4): 614-632.
Stehn, Sven Jari and Vines, David. 2007. Debt Stabilization Bias and the Taylor Principle: Optimal Policy in a New Keynesian Model with Government Debt and Inflation Persistence. International Monetary Fund- IMF Working Paper WP/07/206:1-54.
Stock, James. H., and Watson, Mark. W. 2001. Vector autoregressions. Journal of Economic Perspectives 15:101–115.
Taylor, John. 2000. Reassessing Discretionary fiscal Policy. The Journal of Economic Perspectives 14(3): 21-36.

45
Vol.
25 •
núm
ero 4
9 • e
nero
-juni
o, 20
16Ar
wip
haw
ee S
ritho
ngru
ngThe World Bank. 2014. Countries and lending groups. http://data.worldbank.org/about/country-and-lending-groups. (May 12, 2014).