univariate statistics 9/18/2012. readings chapter 2 measuring and describing variables (pollock)...
TRANSCRIPT

Univariate Statistics
9/18/2012

Readings
• Chapter 2 Measuring and Describing Variables (Pollock) (pp.32-33)
• Chapter 2 Descriptive Statistics (Pollock Workbook)
• Homework: Chapter 1 Introduction to SPSS (Pollock Workbook) – Question 1 Parts A &B – Question 2

About the Homework
• It must be turned in during class.
• It cannot be emailed
• It must appear on the workbook paper (original or a photocopy)
• You cannot:

OPPORTUNITIES TO DISCUSS COURSE CONTENT

Office Hours For the Week
• When– Weds and Fri 11-1– Thursday 8-12– And appointment

Course Learning Objectives
• Students will learn the research methods commonly used in behavioral sciences and will be able to interpret and explain empirical data.
• Students will achieve competency in conducting statistical data analysis using the SPSS software program.

Variables
Variables
• Measured Concepts
• We need to operationalize concepts to test hypotheses

Four Categories of Variables

Categorical
Nominal• Name
• And provide value
Ordinal• Name
• Provide value
• And Order

CONTINUOUS VARIABLES

What about them
• The values matter
• Your variable includes all possible values, not just the one’s that you assign.
• Name, order, and the distances between values matter.

Interval Level Variables
• The values matter at this level
• The distances matter
• The zero is arbitrary

Examples of Interval Scales
Ratio Variables
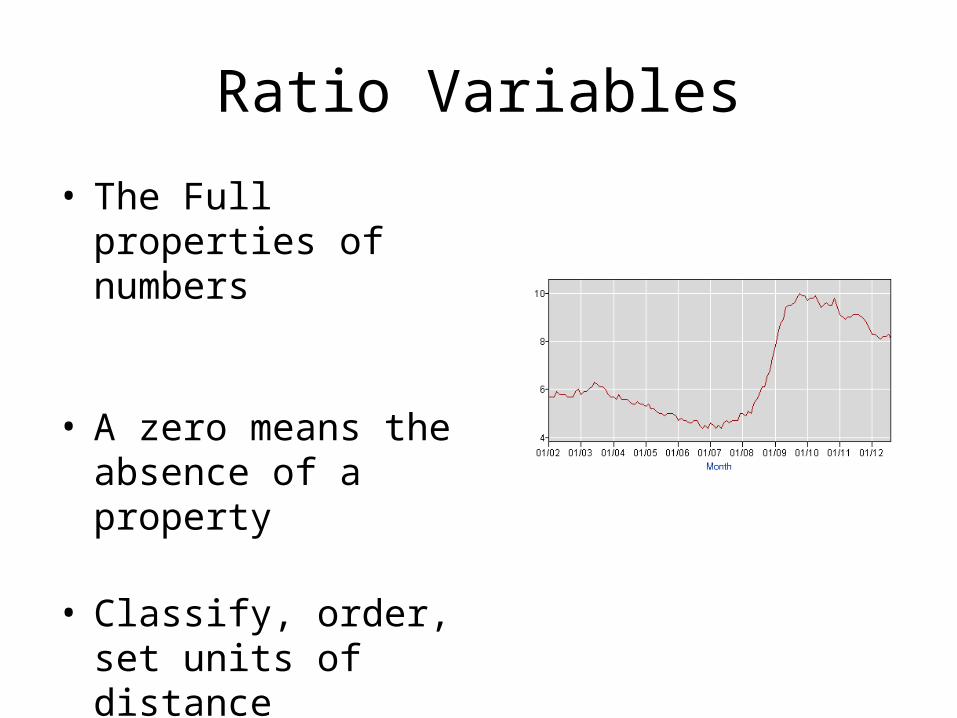
• The Full properties of numbers
• A zero means the absence of a property
• Classify, order, set units of distance


Lets Look at this one again

DESCRIPTIVE STATISTICS
Descriptive Statistics
• These simply describe the attributes of a single variable.
• You cannot test here (you need two variables)
• Why do them?

Categories of Descriptive Statistics
Measures of Central Tendency• The most common, the
middle, the average
• Mean, Median and Mode
Measures of Dispersion• How wide is our range of
data, how close to the middle are the values distributed
• Range, Variance, Standard Deviation
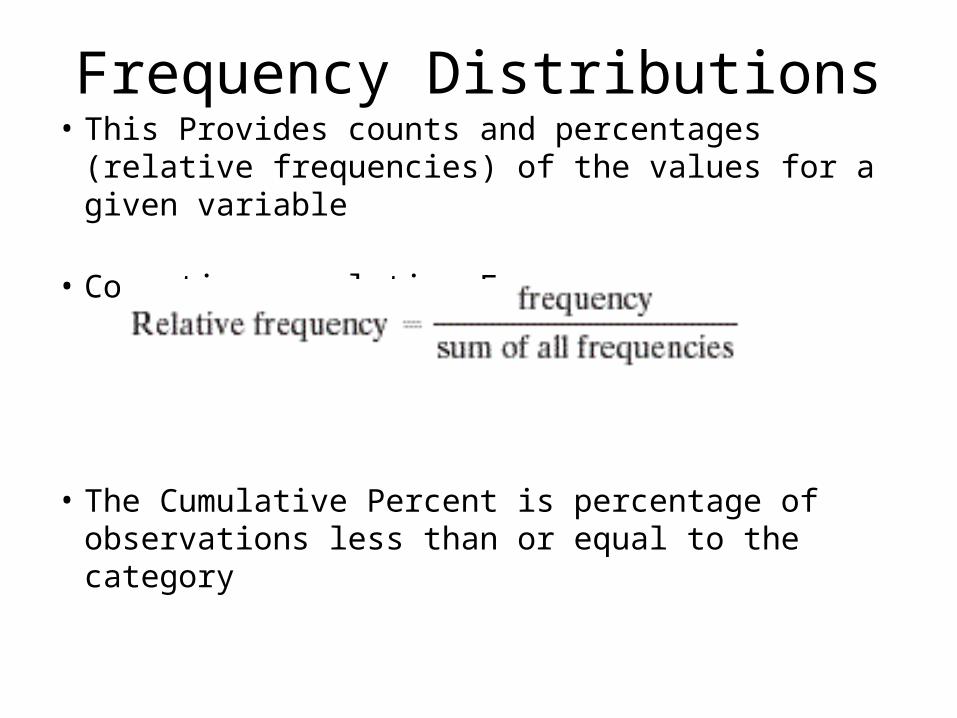
Frequency Distributions• This Provides counts and percentages (relative
frequencies) of the values for a given variable
• Computing a relative Frequency
• The Cumulative Percent is percentage of observations less than or equal to the category

Examples
• St. Edward’s Data

The Mode
• the most frequent observation of the variable in a distribution
• Which category is most common
• There can be more than 1

Examples
• What are the Modes here?
1. 110,105.100.100.100.100.99.982. 110.105.105.105.100.95.95.95.90

Advantages and Disadvantages
• Advantages of the Mode
• Disadvantages of the Mode
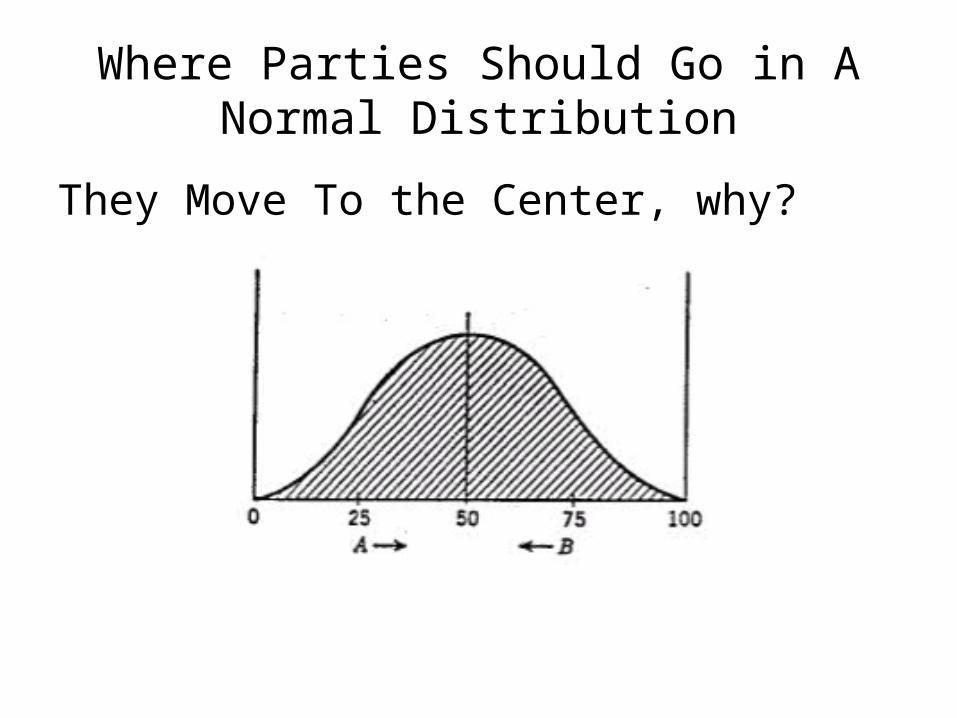
Where Parties Should Go in A Normal Distribution
They Move To the Center, why?

What About A Bimodal Distribution?

Party Polarization

A polymodal System

THE MEDIAN

The Median
• It only tells us one thing
• the value that lies in the middle of the data when arranged in ascending order.

Examples
• The University of Texas
• The 78704 Zip Code
Examples
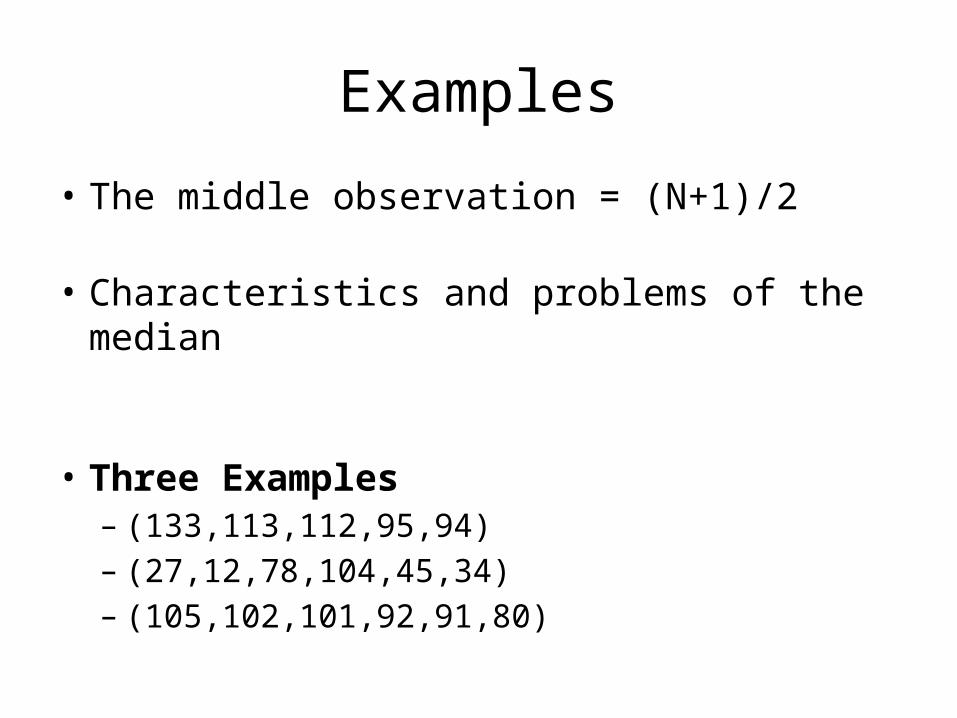
• The middle observation = (N+1)/2
• Characteristics and problems of the median
• Three Examples – (133,113,112,95,94) – (27,12,78,104,45,34) – (105,102,101,92,91,80)

Locating the Median

Finding the Median
• location of median case (1747+1)/2 = 874 • Where Does that case fall?
– Case 1 through 534 = has value of 0 – Case 535 through 1747 = has value of 1
• Case 874 is more than 535 and less than 1747 • THE MEDIAN IS 1, the category is voted
You can also look here for where 50% falls

Lets Try Again
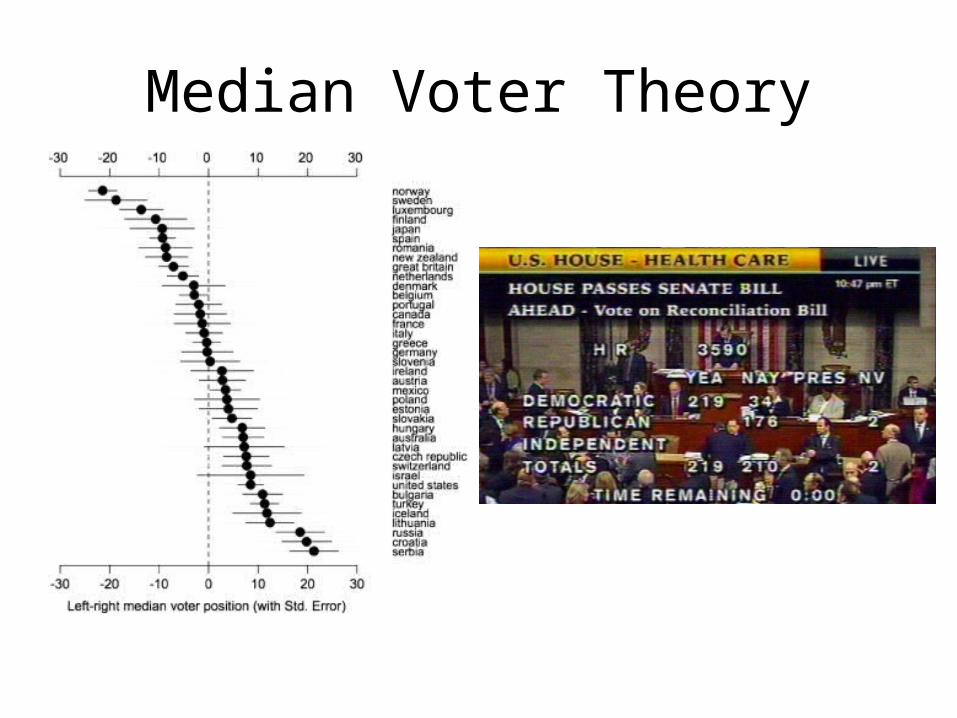
Median Voter Theory

THE MEAN

The Mean
• What is it
• How do you compute it?


About the Mean
• Characteristics of the Mean
• Problems of the Mean

An Example
Name Income
Skipper 50.00
Gilligan 150.00
Mary Ann 150.00
Professor 400.00
Mrs. Howell 500.00
Mr. Howell 1000.00
Ginger 3000.00
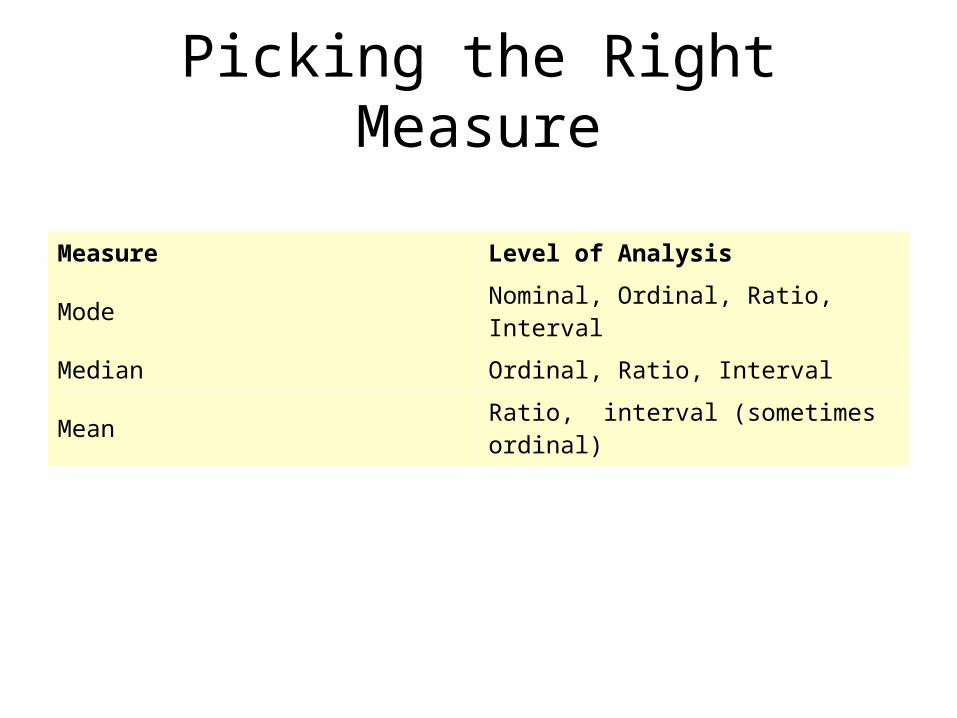
Picking the Right Measure
Measure Level of AnalysisMode Nominal, Ordinal, Ratio, IntervalMedian Ordinal, Ratio, IntervalMean Ratio, interval (sometimes ordinal)