unitrans general manager's report fiscal year 2018-19 · unitrans 2nd annual holiday food...
TRANSCRIPT

UNITRANS
GENERAL MANAGER'S REPORT FISCAL YEAR 2018-19
2
Table of Contents Fiscal Year 2018-19 Unitrans Service Executive Summary…..…….……………………..3 Full Narrative & Analysis of Fiscal Year 2018-19 Unitrans Service.…………….……….. 6 FY2018-19 Highlights and Accomplishments………………………………………...…….17 Objectives for FY2019-20 and Beyond………………………………………………………18 APPENDIX A: Unitrans Operating Characteristics by Line, FY2017-18………………....20 APPENDIX B: Unitrans Performance Indicators by Line, FY2017-18……………….... 21 APPENDIX C: Unitrans SRTP Performance Measures…………………………………... 22 APPENDIX D: Unitrans Workgroup Recommendations…………………………..………24

3
Fiscal Year 2018-19 Unitrans Service Summary Executive Summary Fiscal Year 2018-19 began with financial and staffing challenges and ended with our financial and staffing outlook stronger than ever. Student Involvement Unitrans is primarily operated by undergraduate students at UC Davis. Over 90% of all Unitrans employees, including all drivers, are UC Davis undergraduates. This model is unique to Davis and helps keep Unitrans fiscally efficient, friendly, and operationally nimble. Maintaining our student-operated model is one of our core values. We pride ourselves on mentoring our student employees and provide them with learning and leadership opportunities that build upon their education. Unitrans 2nd Annual Holiday Food Drive Unitrans student employees and UC Davis undergraduates shined this fiscal year and our campus and city communities felt their support. The following are just a few examples of our student impact.
In November 2018, the Camp Fire in Paradise, CA closed UC Davis campus for seven days as well as many businesses and schools throughout Davis. Our student employees continued to come to work and we continued to operate uninterrupted public transit service to our community.
In December 2018, Unitrans held its second annual food drive at the Davis Co-op to benefit the ASUCD Pantry. We received over $3,000 in food donations.
In January 2019, Unitrans employees continued to operate buses throughout the city on the evening Davis Police Officer Natalie Corona was fatally shot to ensure our campus and community members could safely return home.
In February 2019, the undergraduate students championed and passed a student fee measure to place Unitrans on a financially sustainable course so we can sustain public transit service to our city and campus communities.
4
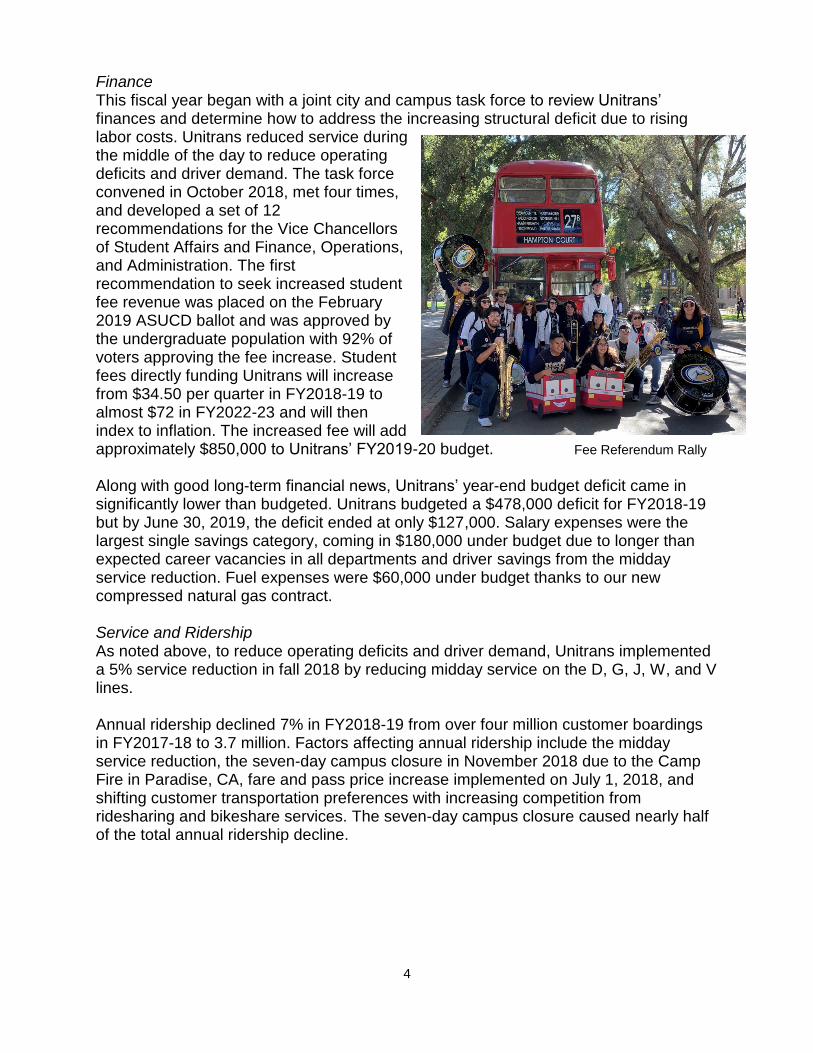
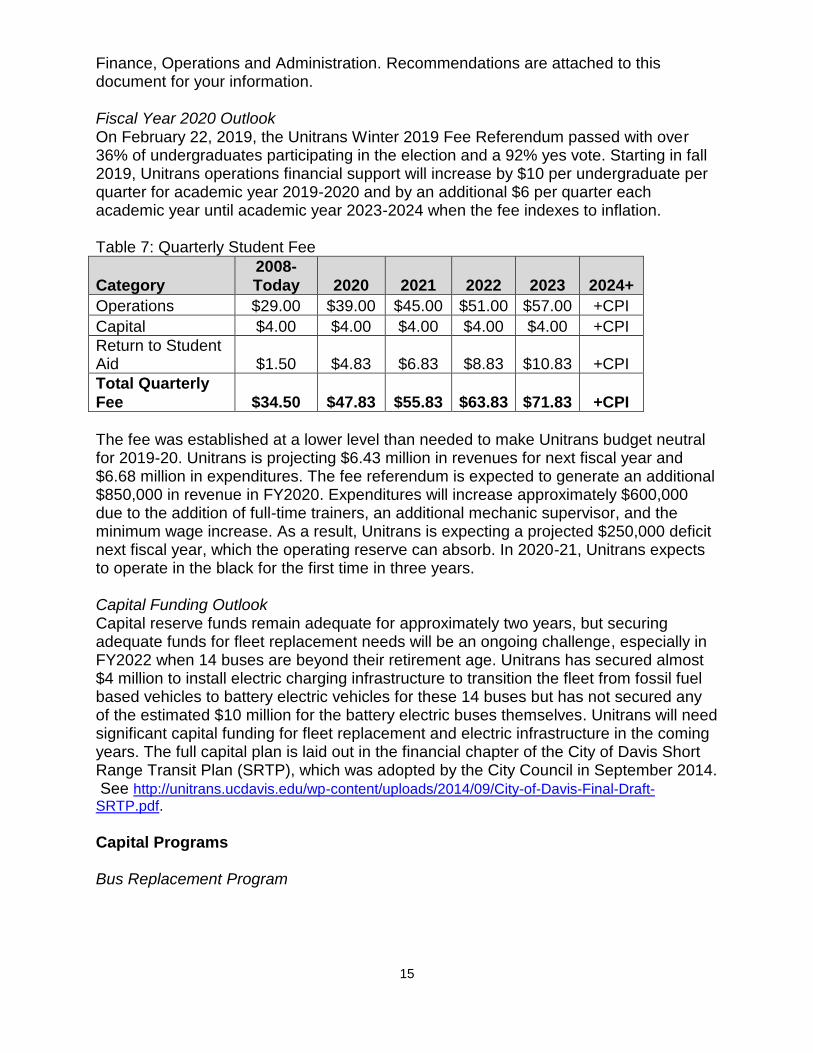
Finance This fiscal year began with a joint city and campus task force to review Unitrans’ finances and determine how to address the increasing structural deficit due to rising labor costs. Unitrans reduced service during the middle of the day to reduce operating deficits and driver demand. The task force convened in October 2018, met four times, and developed a set of 12 recommendations for the Vice Chancellors of Student Affairs and Finance, Operations, and Administration. The first recommendation to seek increased student fee revenue was placed on the February 2019 ASUCD ballot and was approved by the undergraduate population with 92% of voters approving the fee increase. Student fees directly funding Unitrans will increase from $34.50 per quarter in FY2018-19 to almost $72 in FY2022-23 and will then index to inflation. The increased fee will add approximately $850,000 to Unitrans’ FY2019-20 budget. Fee Referendum Rally
Along with good long-term financial news, Unitrans’ year-end budget deficit came in significantly lower than budgeted. Unitrans budgeted a $478,000 deficit for FY2018-19 but by June 30, 2019, the deficit ended at only $127,000. Salary expenses were the largest single savings category, coming in $180,000 under budget due to longer than expected career vacancies in all departments and driver savings from the midday service reduction. Fuel expenses were $60,000 under budget thanks to our new compressed natural gas contract. Service and Ridership As noted above, to reduce operating deficits and driver demand, Unitrans implemented a 5% service reduction in fall 2018 by reducing midday service on the D, G, J, W, and V lines. Annual ridership declined 7% in FY2018-19 from over four million customer boardings in FY2017-18 to 3.7 million. Factors affecting annual ridership include the midday service reduction, the seven-day campus closure in November 2018 due to the Camp Fire in Paradise, CA, fare and pass price increase implemented on July 1, 2018, and shifting customer transportation preferences with increasing competition from ridesharing and bikeshare services. The seven-day campus closure caused nearly half of the total annual ridership decline.

5
Capital Projects Unitrans received two new Alexander Dennis Double Decker Buses in winter 2019. Both buses entered service on April 1, 2019 and increased our modern double decker fleet from two to four buses. The combined cost was $2 million and paid solely through state grant funding. Unitrans secured approximately $3.9 million from the Sacramento Area Council of Governments for electric bus infrastructure. Unitrans seeks to purchase 12-14 new electric buses in 2022-23 to replace old buses. The awarded funding will pay for electrical infrastructure and facility improvements. The total project is expected to cost $5-6 million in infrastructure and over $10 million for buses. Staffing Fiscal Year 2018-19 began with staffing challenges due the departure of our long time IT manager and administrative assistant. A mechanic also retired mid-year and financial uncertainty led to Unitrans pausing career trainer hiring. As the year progressed though and with the fee initiative passing, we hired a new IT manager, a new administrative assistant, a new mechanic, and we expanded our career trainer workforce from one trainer to four trainers. Coming Year With the new student fee measure approved and strong driver staffing projected for fall 2019, we expect FY2019-20 to be a solid year for Unitrans. In FY2019-20, Unitrans will be focused on further improving driver staffing in order to introduce more capacity service for winter 2020, reducing minimum hour requirements for student staff, and securing funding for the electric bus program and facility improvements.

6
Full FY2018-19 Unitrans Service Narrative and Analysis Introduction Fiscal Year 2018-19 began with financial and staffing challenges and ended with our financial and staffing outlook stronger than ever. The following report summarizes key performance trends and progress during FY2018-19. Unitrans is a public transportation service serving the City of Davis and the University of California, Davis. The service was founded in 1968 by the Associated Students of UC Davis (ASUCD) and continues to be student-driven with over 90% of employees being undergraduate students. Unitrans is operated by ASUCD as part of UC Davis and is a funding partnership between the City of Davis and UC Davis. Service In spring 2018, Unitrans received approval from the Unitrans Advisory Committee (UAC) and Davis City Council after a public participation process to increase cash fares and pass prices for the first time in 14 years and also implement service changes. The following summarizes the implemented changes:
Cash fare increased from $1.00 to $1.25 on July 1, 2018
Unitrans pass prices increased 20% on July 1, 2018
The V line discontinued fare free service for all customers and implemented standard Unitrans fare policies on August 6, 2018
Midday weekday academic year service from 11am to 3pm was reduced from 15 minutes to 30 minutes on Unitrans’ most popular bus lines – the D, G, J, V, and W lines
L Line service expanded from every 60 minutes to every 30 minutes during UC Davis Finals Week
Unitrans launched a new Davis Joint Unified School District student focused pilot line called the S line serving North Davis, West Davis, Davis High School, and Holmes Junior High School
The T line serving Davis Senior High School was modified to provide direct service to the Wildhorse neighborhood via Moore Boulevard, provide closer service to Holmes Junior High School by operating on J Street, and avoid 14th Street traffic by serving Davis Senior High School via Oak Street
Summer night service was consolidated to the Memorial Union Bus Terminal instead of being split between the Silo Terminal and Memorial Union Bus Terminal
The changes resulted in a 5% decline in scheduled service hours and miles compared to the previous year. The intention of the changes were to reduce operating costs, reduce driver demand, and increase fare revenue. With the implemented service changes, actual vehicle revenue miles, revenue hours, and total annual trips declined by 5% compared to the previous fiscal year as planned. Unitrans operated approximately 799,000 revenue miles, 75,600 revenue hours, and almost 121,000 total trips for the year.
7
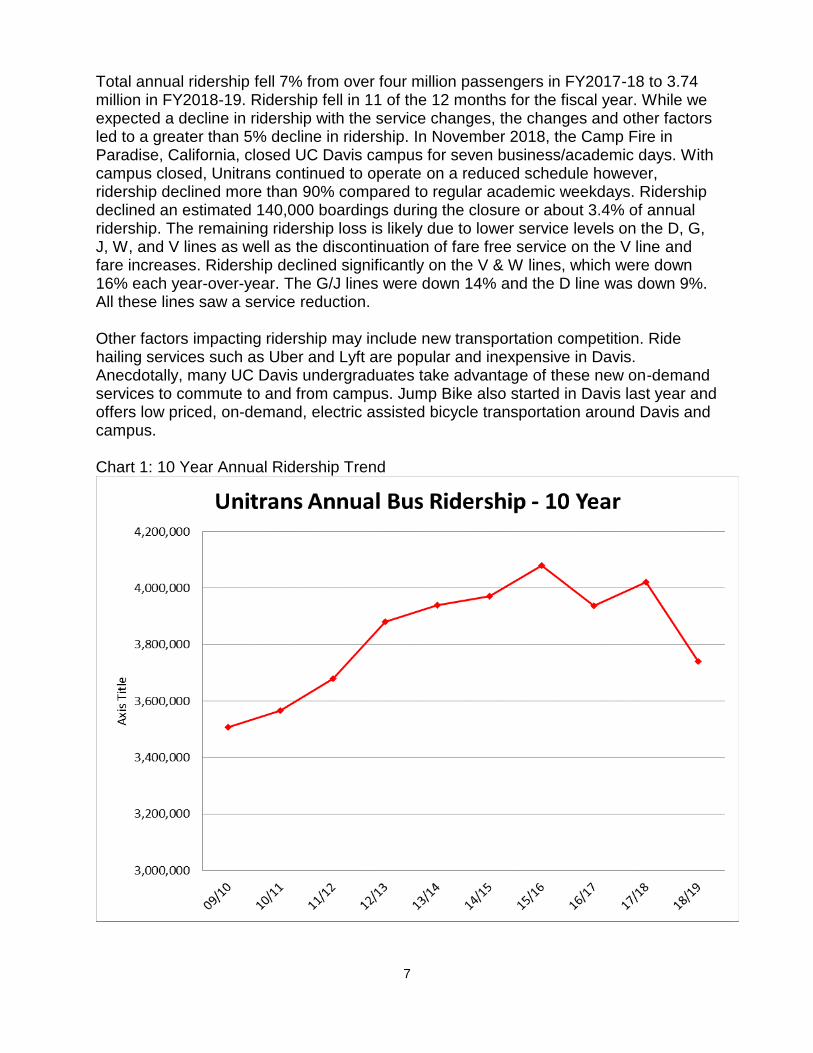
Total annual ridership fell 7% from over four million passengers in FY2017-18 to 3.74 million in FY2018-19. Ridership fell in 11 of the 12 months for the fiscal year. While we expected a decline in ridership with the service changes, the changes and other factors led to a greater than 5% decline in ridership. In November 2018, the Camp Fire in Paradise, California, closed UC Davis campus for seven business/academic days. With campus closed, Unitrans continued to operate on a reduced schedule however, ridership declined more than 90% compared to regular academic weekdays. Ridership declined an estimated 140,000 boardings during the closure or about 3.4% of annual ridership. The remaining ridership loss is likely due to lower service levels on the D, G, J, W, and V lines as well as the discontinuation of fare free service on the V line and fare increases. Ridership declined significantly on the V & W lines, which were down 16% each year-over-year. The G/J lines were down 14% and the D line was down 9%. All these lines saw a service reduction. Other factors impacting ridership may include new transportation competition. Ride hailing services such as Uber and Lyft are popular and inexpensive in Davis. Anecdotally, many UC Davis undergraduates take advantage of these new on-demand services to commute to and from campus. Jump Bike also started in Davis last year and offers low priced, on-demand, electric assisted bicycle transportation around Davis and campus. Chart 1: 10 Year Annual Ridership Trend

8
Daily Average Ridership FY2019 annual ridership corresponds to roughly 21,000 average daily boardings during the academic year, a 6.5% decline from FY2018 and the lowest since 2012. Average Friday ridership was down about 7.5% compared to the previous year. Average weekend boardings declined nearly 20% from almost 2,000 boardings in FY2018 to 1,630 boardings per weekend day on average in FY2019. This is the lowest level since 2014. While the weekend P, Q, and O lines saw increased ridership on the weekends, the weekend G, K, M, and V lines experienced declines. Table 1: Average Daily Ridership by Service Type
FY2019 FY2018 FY2017 FY2016 FY2015 FY2014
Regular Service Mon-Thur 21,006 22,490 22,137 22,448 22,077 22,239
Regular Service Friday 17,052 18,356 17,974 18,375 17,828 17,895
Summer/Break Mon-Thur 6,586 6,758 7,010 7,516 7,189 7,044
Weekend (academic year) 1,630 1,989 1,886 2,078 1,832 1,521
Ridership by Line All lines operated above the 15 passenger per hour minimum threshold standard in FY2019 except for the pilot S line. Carrying fewer than 15 passengers per hour is one criteria Unitrans uses to determine if a route should be considered for elimination or other service interventions. The pilot S line only carried an average of two passengers per hour, far below the 15 passenger per hour threshold and below the systemwide average of 50 passengers per hour. While systemwide ridership was down, the news was not all negative. Seven of 20 bus lines experienced increased ridership. The K and O lines experienced a 7% increase in ridership, the P and Q lines experienced a combined 5% increase in ridership, the L line saw a 3% increase, and the A line saw a 2% increase compared to the previous year. The X line, a short weekend only line serving the Tercero Dorms, saw ridership almost double last year however the route was discontinued in August 2019 to allow the companion O line to operate more reliably. The O line carries seven times more passengers per weekend day than the X line. As discussed earlier, lines that saw a service level reduction also saw a ridership decline. The largest declines were on the V and W lines, both down about 16% each and the C, G, and J lines, each down approximately 14% each. C line ridership may have been impacted by the demolition of Webster Hall and may be impacted more in the coming year with the closure and demolition of Emerson Hall. Table 2: Ridership by Line
Line FY19 FY18 % Change Pass/Hr
A 231,493 227,306 1.8% 41.1
B 130,488 134,367 -2.9% 57.3

9
Line FY19 FY18 % Change Pass/Hr
C 112,676 131,215 -14.1% 49.9
D 264,810 290,931 -9.0% 64.2
E 137,205 146,172 -6.1% 44.3
F 106,616 111,809 -4.6% 42.2
G 379,237 444,114 -14.6% 70.8
J 425,769 494,413 -13.9% 73.5
K 182,132 169,457 7.5% 53.2
L 161,976 157,259 3.0% 29.6
M 153,022 154,809 -1.2% 45.4
P 252,649 238,595 5.9% 30.9
Q 259,039 250,806 3.3% 32.6
S (pilot) 504 2.0
T 8,323 9,151 -9.0% 25.5
V 370,314 438,519 -15.6% 85.8
W 385,426 457,783 -15.8% 65.7
Z 105,990 106,077 -0.1% 26.2
O (Weekend) 30,541 28,574 6.9% 37.8
X (Weekend) 7,078 3,716 90.5% 18.9
The S Line pilot was unsuccessful based on ridership and community interest and as a result, was discontinued at the end of the 2018-19 school year. Typical ridership was two passengers per hour. Crowding Unitrans high ridership and productivity also translate to high levels of crowding at peak times, which typically correspond to class start and end times at UC Davis. In FY2019, the percentage of bus trips with over 60 passengers on board (or doubledecker buses with over 100 passengers on board) was 3.5%, less than FY2018 when 4% of trips were overcrowded and the same as FY2017 performance. Looking at time of day, over 20% of our most crowded trips occur during the 8:00am hour and another 14% in the 9:00am hour. The most crowded single trip time is 6:10pm where 9.5% of trips were overcrowded. In response to this, Unitrans is adding a 6:10pm departure on the Z line to help alleviate crowding on the A line and added additional trips on the D, G, J, V, and W lines to help reduce crowding. The A, G, and W lines had the highest percentage of overcrowded trips with 7-8% of trips overcrowded for the year. These three lines have assigned capacity buses (known as trippers) to help alleviate crowding but even with capacity buses added, these lines are still crowded. Crowding is something that has been a part of Unitrans for decades. However, it degrades the customer experience when a very large number of bus trips are at crush load, and that, in turn, discourages some people from riding the bus at all. Adding capacity services during the most crowded times is costly and requires more drivers and buses. Safety & Security Unitrans had three major collisions for the year, all non-preventable based on driver
10
behavior. Compared to the previous four years, performance was slightly higher than three of four years but significantly lower than two years ago when we had nine major collisions. In winter 2019, we had our first major collision for the fiscal year. On February 15, 2019 on Hutchison Drive at Dairy Road, a motorist ran a red light and collided with a Unitrans bus. There were no injuries and minor damage to the Unitrans vehicle however the incident vehicle incurred major damage. The collision was non-preventable based on the Unitrans driver’s actions. Unitrans was involved in a major collision on April 1, 2019. A van fleeing police rear-ended an L line bus on Monarch Lane at Temple Drive in East Davis. The bus had seven customers on board and the driver. There were no reported customer injuries however the driver was injured and the bus had major damage. The collision was non-preventable based on the driver’s actions and our driver acted heroically by ensuring his customers’ safety following the collision. On May 9, 2019, a Q line bus collided with a motorist making an illegal left hand turn in front of the bus traveling northbound on Arlington at Calaveras. The bus had approximately 55-60 people on board and approximately 10 fell. No injuries were initially reported however claims may be filed. Table 3: Summary of Major Collisions/Incidents
Annual Total
FY18-
19
FY17-
18
FY16-
17
FY15-
16
FY14-
15
Total 3 2 9 1 2
In support of reducing collisions at high collision locations, Unitrans staff is working with City staff on capital improvements to the H Street and Third Street intersection. Our largest number of annual collisions occur at this location. We hope to have improvements to the intersection in place by the end of FY2019-20. Staff is also reviewing driver behavior monitoring equipment for buses to better identify risky or problematic driving behaviors. Ideally, we would procure this technology in FY2020-21. Safety and incident reports are reviewed daily for trends and commonalities. All incidents are followed up with our Safety Manager or an Operations staff person. On-Time Performance Overall on-time performance (OTP) continues a steady year-to-year decline. Systemwide on-time performance for FY2018-19 declined from 89% to 88%. Four years ago, systemwide on-time performance was 93%. OTP is defined as a bus arriving at the terminal before the scheduled time or within five minutes of the scheduled time. Arriving more than five minutes late is defined as “late”. OTP declines were driven primarily by fall and winter challenges with increasing traffic and construction on Covell and Cowell Boulevards, on Third Street, and Fifth Street.

11
Ten lines declined compared to last year, three improved, and three had flat performance. For the improved routes, the C line improved which may be due to lower ridership, the V line improved due to a long term construction reroute which shortened the route in West Village, and the W line improved compared to the previous year due to the previous year having severe reliability impacts due to the construction of the Cowell/Drummond traffic circle. The largest year over year decline occurred on the Q line which declined from 81% on time to only 68% on time. Increasing congestion, namely around Mace Boulevard in the afternoons has taken a toll on the Q line. In FY2020, Unitrans may consider significant route changes on the A, P, Q, and Z lines to help reduce travel times and improve performance in East Davis. Table 4: FY2019 On-Time Performance by Line
Line FY FY FY FY
2019 2018 2017 2016
A 85% 91% 90% 92%
B 92% 95% 97% 98%
C 96% 94% 97% 98%
D 92% 93% 96% 98%
E 70% 82% 87% 88%
F 87% 91% 96% 97%
G 96% 98% 96% 97%
J 89% 89% 89% 91%
K 88% 94% 94% 95%
L 97% 99% 99% 99%
M 83% 90% 88% 83%
P 80% 87% 87% 91%
Q 68% 81% 80% 81%
V 96% 93% 97% 98%
W 90% 83% 89% 86%
Z 90% 91% 97% 98%
All Lines 88% 89% 92% 93%
Customer Service Overall customer complaints declined 9% in FY2019 compared to FY2018 and have declined for four years in a row. Performance improved in all customer complaint categories except for “Late” arrivals and “Pass Ups”. Late complaints were up 36% compared to last year from 14 complaints to 19 complaints and pass up complaints were up 42% from 31 to 44 complaints. With on-time performance declining, an increase in late is expected and pass up complaints were concentrated on lines with service reductions. Complaints regarding unsafe driving declined 12% from 73 to 64 complaints however
12
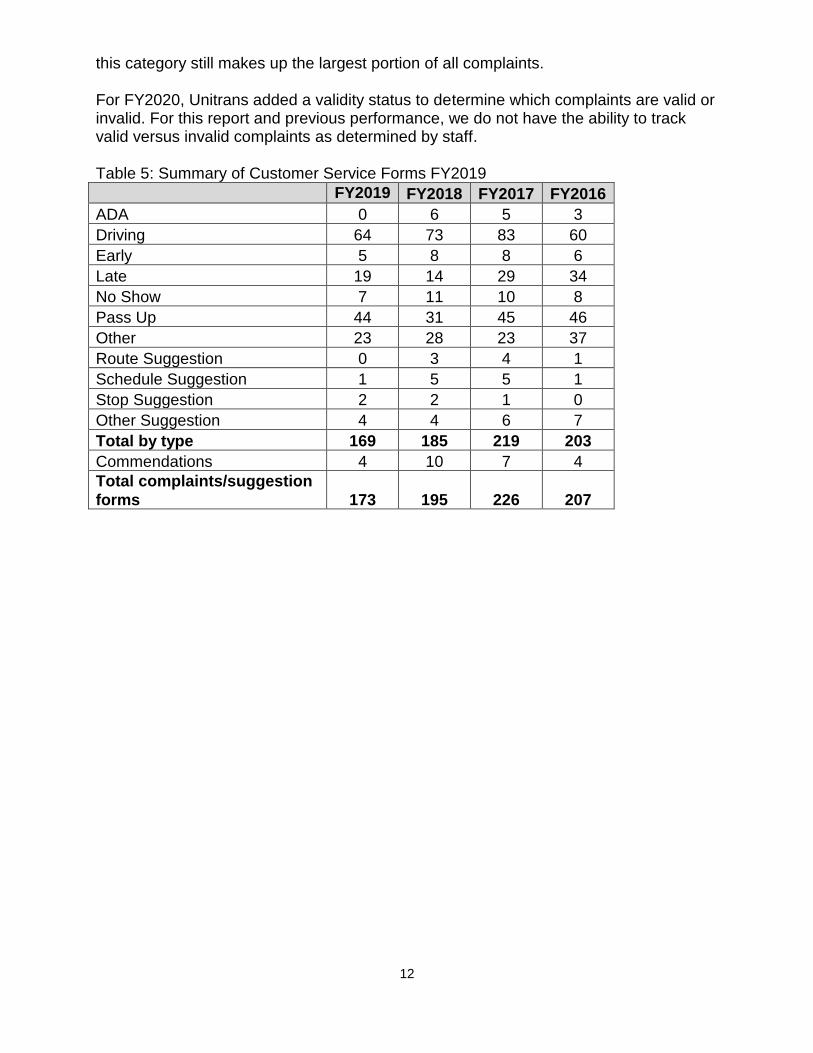
this category still makes up the largest portion of all complaints. For FY2020, Unitrans added a validity status to determine which complaints are valid or invalid. For this report and previous performance, we do not have the ability to track valid versus invalid complaints as determined by staff. Table 5: Summary of Customer Service Forms FY2019
FY2019 FY2018 FY2017 FY2016
ADA 0 6 5 3
Driving 64 73 83 60
Early 5 8 8 6
Late 19 14 29 34
No Show 7 11 10 8
Pass Up 44 31 45 46
Other 23 28 23 37
Route Suggestion 0 3 4 1
Schedule Suggestion 1 5 5 1
Stop Suggestion 2 2 1 0
Other Suggestion 4 4 6 7
Total by type 169 185 219 203
Commendations 4 10 7 4
Total complaints/suggestion
forms 173 195 226 207

13
Maintenance Unitrans has a fleet of 48 active buses including three vintage London double decker buses, four modern double decker buses, and 40 single deck buses. Most of the Unitrans bus fleet is over 10 years old and is either past its retirement age or approaching its retirement age. The average age of the fleet (less the vintage buses) is over nine years old. The Federal Transit Administration defines the useful life of a bus as 12 years. With an aging fleet comes increased maintenance and roadcalls (also known as loss of service breakdowns). In FY2019, Unitrans experienced 102 roadcalls, a 20% increase compared to the previous year. Buses that are 10 years or older accounted for 75% of the total loss of service road calls. To improve fleet performance, maintenance personnel are focusing in on component failures to identify trends and replace parts fleetwide before they fail on multiple vehicles. In addition, Unitrans secured funding to perform engine replacement on 13 buses. The project is expected to kick off in FY2020 and should greatly improve performance on the rehabilitated vehicles. Unitrans performs safety and performance preventative maintenance checks every 3,000 miles per vehicle and Unitrans exceeds its performance standard that 95% of all PMs occur within 10% of the 3,000 mile window. Of the 364 preventative maintenance checks required in FY2019, 362 or 99.4% occurred inside of Unitrans’ maintenance standard. Financial Results Unitrans’ fiscal performance in FY2019 was better than originally projected. The budgeted deficit for the year was approximately $478,000 and the final year-end deficit was $127,000. The lower than expected deficit was due to two primary reasons:
1. Unitrans budgeted for more service hours than were delivered. The FY2018-19 budget included midday 15 minute service on the D, G, J, W, and V lines however Unitrans eliminated that service due to financial uncertainty entering the 2018-19 academic year. As a result of the service cut, expenses came in lower.
2. Career staff salary and benefits expenses were lower than expected. Unitrans had longer than expected vacancies for administrative assistant and IT manager positions, had an unexpected retirement in maintenance, and was not able to fill one budgeted trainer position due to financial uncertainty. These led to lower salary expenses than budgeted.
Unitrans budgeted $5.57 million in revenues, $6.05 million in expenditures, and a deficit of approximately $478,000 to be taken from the operating reserves. The reserve had a balance of $1.9 million at the beginning of FY2018. Fiscal Year 2019 ended with a $127,000 budget deficit. Revenues came in approximately at budget or $5.58 million. By revenue category, cash and pass sales were 18% lower than expected. In FY 2018-19, we implemented a 20% increase in pass prices and a 25% increase in the cash fare. We also had a record 30+ days of Spare the Air free fare days and a seven-day campus closure. These factors affected this line item. On the upside, student fee revenue and TDA revenue came in approximately 3% higher than expected each. To mitigate fare-free days, Unitrans

14
changed its fare-free policy to only offer fare-free service on the first 15 Spare the Air days of the year. Expenditures were approximately $5.71 million, lower than the $6.05 million budget. The primary factor affecting budgeted expenses is salary and benefit savings. This year we had unexpected 4-5 month vacancies for a mechanic and an administrative assistant, a longer than expected vacancy in IT, a budgeted trainer was not permitted to be filled until the end of the fiscal year, and we operated 5% fewer annual driver hours. Maintenance expenses were approximately 10% lower than budgeted due to fuel expenses coming in lower than expected with our new fuel contract and carbon offset credits. Unitrans’ operating reserve is approximately $1.8 million as of June 30, 2019 or about three months of expenses in reserves. This is our target and is an industry standard for small transit operations. Table 6: FY2019 Financial Summary
Budget Actual % Difference
UCD Undergraduate Fee $2,720,000 $2,800,000 3%
Cash Fares and Pass Sales $280,000 $230,000 -18%
Advertising Revenue $36,000 $31,000 14%
Miscellaneous Revenue $80,000 $44,000 -45%
City of Davis TDA $760,000 $780,000 3%
FTA Operating Assistance $1,700,000 $1,700,000 0%
Total Revenues $5,576,000 $5,585,000 0.2%
Operations Labor $2,740,000 $2,664,000 -3%
Operations Expenses $207,000 $172,000 -17%
Maintenance Labor $1,271,000 $1,224,000 -4%
Maintenance Expenses $852,000 $758,000 -11%
Administration Labor $602,000 $544,000 10%
Administration Expenses $207,000 $175,000 -15%
Yolobus Access $175,000 $175,000 0%
Total Expenditures $6,054,000 $5,683,000 -6%
Net Revenues - From Reserves -$478,000 -$127,000 -73%
University Sponsored Review and Joint City/University Financial Task Force In October 2018, the University led task force to review Unitrans’ finances and provide recommendations on a path forward to resolve the deficit convened and held four meetings between October 2018 and February 2019. The task force was comprised of University, ASUCD, and City staff. At the final meeting in February, the task force reviewed draft recommendations and set a 30-day review period to finalize the recommendations. The review period concluded on March 28, 2019 and the recommendations were sent to Associate Vice Chancellors in Student Affairs for final review and transmittal to the Vice Chancellor of Student Affairs and Vice Chancellor of
15
Finance, Operations and Administration. Recommendations are attached to this document for your information. Fiscal Year 2020 Outlook On February 22, 2019, the Unitrans Winter 2019 Fee Referendum passed with over 36% of undergraduates participating in the election and a 92% yes vote. Starting in fall 2019, Unitrans operations financial support will increase by $10 per undergraduate per quarter for academic year 2019-2020 and by an additional $6 per quarter each academic year until academic year 2023-2024 when the fee indexes to inflation. Table 7: Quarterly Student Fee
Category
2008-
Today 2020 2021 2022 2023 2024+
Operations $29.00 $39.00 $45.00 $51.00 $57.00 +CPI
Capital $4.00 $4.00 $4.00 $4.00 $4.00 +CPI
Return to Student Aid $1.50 $4.83 $6.83 $8.83 $10.83 +CPI
Total Quarterly
Fee $34.50 $47.83 $55.83 $63.83 $71.83 +CPI
The fee was established at a lower level than needed to make Unitrans budget neutral for 2019-20. Unitrans is projecting $6.43 million in revenues for next fiscal year and $6.68 million in expenditures. The fee referendum is expected to generate an additional $850,000 in revenue in FY2020. Expenditures will increase approximately $600,000 due to the addition of full-time trainers, an additional mechanic supervisor, and the minimum wage increase. As a result, Unitrans is expecting a projected $250,000 deficit next fiscal year, which the operating reserve can absorb. In 2020-21, Unitrans expects to operate in the black for the first time in three years. Capital Funding Outlook Capital reserve funds remain adequate for approximately two years, but securing adequate funds for fleet replacement needs will be an ongoing challenge, especially in FY2022 when 14 buses are beyond their retirement age. Unitrans has secured almost $4 million to install electric charging infrastructure to transition the fleet from fossil fuel based vehicles to battery electric vehicles for these 14 buses but has not secured any of the estimated $10 million for the battery electric buses themselves. Unitrans will need significant capital funding for fleet replacement and electric infrastructure in the coming years. The full capital plan is laid out in the financial chapter of the City of Davis Short Range Transit Plan (SRTP), which was adopted by the City Council in September 2014. See http://unitrans.ucdavis.edu/wp-content/uploads/2014/09/City-of-Davis-Final-Draft-SRTP.pdf.
Capital Programs Bus Replacement Program

16
On April 1, 2019 two new double decker buses entered revenue service. The buses are used to increase high capacity bus service on the B and G lines and to more reliably provide double decker service on the J and V lines. The project cost was approximately $2 million and was funded through a combination of Congestion Mitigation Air Quality (CMAQ) and Public Transportation Modernization, Improvement, and Service Enhancement Account Program (PTMISEA) funds made available through the City. No student fees were used for these buses. New Cutaways/Mini-Buses: In April 2018, we started the process to purchase two new low-floor cutaways to replace our two 2003 cutaways. These vehicles were purchased using a contract with the California Transit Association, the same contract that the City of Davis uses for Davis Community Transit vehicles. The vehicles arrived on April 17, 2019. The project cost is approximately $340,000. New Single Deck Buses: Using a joint procurement with Omnitrans in San Bernardino, California, Unitrans is replacing five compressed natural gas (CNG) buses that are beyond their useful life with five new New Flyer 40’ CNG buses. New Flyer received the purchase order in June 2019 and we expect the buses to arrive winter 2020. The total cost estimate is $3.3 million. Bus Rehabilitation Unitrans was awarded $1.2 million in Federal State of Good Repair funding to rehabilitate our aging 2009 New Flyer single deck bus fleet. This funding will be used to rehabilitate up to 13 buses and help extend the useful life of these vehicles as well as increase passenger capacity through seating improvements inside the buses. A request of proposals will be released at the end of the 2019 calendar year to contract with a business to perform this important work. Electric Bus Program & Other Facility Improvements In support of University, City, and State goals to reduce our carbon footprint, Unitrans staff started working with the University’s Design Construction Management (DCM) department to engineer electric charging infrastructure with the goal of electrifying 14 buses by FY2022-23. In addition to electric charging infrastructure, Unitrans’ Operations and Maintenance Facility is in need of rehabilitation including replacing 15-year-old pavement that is severely degraded, implement stormwater run-off contamination mitigation measures, and possibly removing and replacing an underground diesel storage tank. The full electric infrastructure and facility rehabilitation project is expected to cost $5-$6 million.
17
Conceptual engineering was completed in FY2019 and engineering work began in early FY2020 with the goal of being shovel ready by early FY2021. Unitrans was awarded $3.9 million in funding for the electric infrastructure and charging stations and is aggressively pursuing funding for the battery electric buses. Staff will continue to prioritize funding this project. Compressed Natural Gas Facility The compressor replacement project started on July 16, 2018 and was substantially completed in March 2019. The project replaces two 1995 natural gas compressors which are beyond their useful life and suffering from reliability issues with new compressors. We are currently working through issues with the new compressors. Some shake out testing and issues were expected and we are working with the contractor and DCM to resolve these issues prior to providing final payment. The total project cost was $1.2 million. Bus Stop Rehabilitation In FY2018, Unitrans cataloged and prioritized replacing aging plexiglass paneled shelters through the city. In FY2019, Unitrans staff worked with the City to secure the encroachment permit to replace shelters at 20 locations across the city and procured the replacement shelters. The project is projected to cost $138,000 in parts and materials and $50,000-$75,000 in installation costs. Construction is expected to take approximately two months and will start in fall 2019. Replacement of another 20 shelters is prioritized for early FY2021.
2018-19 Highlights and Accomplishments
Financial Stability: On February 22, 2019, the Unitrans Winter 2019 Fee Referendum passed with over 36% of undergraduates participating in the election and a 92% yes vote. The measure is expected to bring in an additional $850,000 in funding in FY2020 and provide a stable financial footing for Unitrans’ future. The University and City also entered into a new State funding agreement which will increase State funding through the City by $25,000 per year during economic expansion years. FY2019 Budget Deficit Lower than Expected: The FY2019 year-end budget deficit was projected to be approximately $478,000 but came in at approximately $127,000 due to lower expenditures related to lower salary expenses and fuel costs. Fleet Replacement: Unitrans received two new modern double decker buses, increasing the number of modern double decker buses from two to four buses. Unitrans also replaced two early 2000s cutaway buses with two new low floor cutaways. Five new compressed natural gas buses are expected to arrive in winter 2020 to improve Unitrans service. Electric Buses: With support from the City and University, Unitrans secured $3.9 million in funding for electric bus charging infrastructure. Conceptual engineering was
18
completed in FY2019 and Unitrans is working on final engineering with the goal of being shovel ready to construct 14 electric charging stations in FY2021. Safety: Major safety incidents were on par with performance last fiscal year and were much lower than FY2017. Unitrans staff worked with campus partners to provide clearer pavement markings on Hutchison Drive and Howard Way to provide clearer lane positioning guidance to avoid tree/bus conflicts, installed improved lighting at our facility to improve safety and security, and is working with the City of Davis to reduce collisions at H Street and Third Street, our #1 collision location. Regulatory Successes: Unitrans had its triennial Transportation Development Act (TDA) State Funding audit. The audit had no findings. Unitrans also completed another flawless California Highway Patrol compliance audit. Staffing Improvements: In FY2019, Unitrans hired three new career trainers to prepare us for changes in federal regulations regarding driver training. Unitrans now has four full time career trainers supported by 15 student driver trainers. Together, we are ready to meet 2020 federal regulation changes and establish a stable driver-training pipeline moving forward.
Objectives for FY2020 and Beyond
Hiring Strategy: Continue to implement strategies to hire freshmen and
sophomore driver candidates in order to reduce annual turnover, reduce uncovered shifts, and implement additional winter capacity services.
Electric Bus Program: Complete engineering for 14 electric charging stations, stormwater mitigation, and paving rehabilitation and prepare to advertise the work. Aggressively pursue funding for up to 14 battery electric buses and facility rehabilitation.
Student Staff Engagement: Provide leadership learning opportunities for interested Unitrans student employees including leadership retreat, small working groups to solve issues, and field trips to transit related businesses that employ UC Davis and Unitrans alumni.
Amtrak Access Support: Support and learn from the City’s Civic Lab project to
provide subsidized rideshare service options to access the Davis Amtrak Station. Support City efforts to address perceived demand for transit service to the Amtrak Station and Downtown Davis in a budget neutral manner.
. Career Vacancies: Hire a new maintenance supervisor and assess the need for
a new dedicated career position to support hiring, payroll, and human resources. Service and Schedule Changes: Review passenger loads, on-time performance,
budget, and workforce projections to provide a stable, efficient, and effective
19
service plan for FY2020-21. This will include reviewing and addressing P and Q line performance issues and preparing for increased residential density in West Village and on Fifth Street near the Post Office.
20
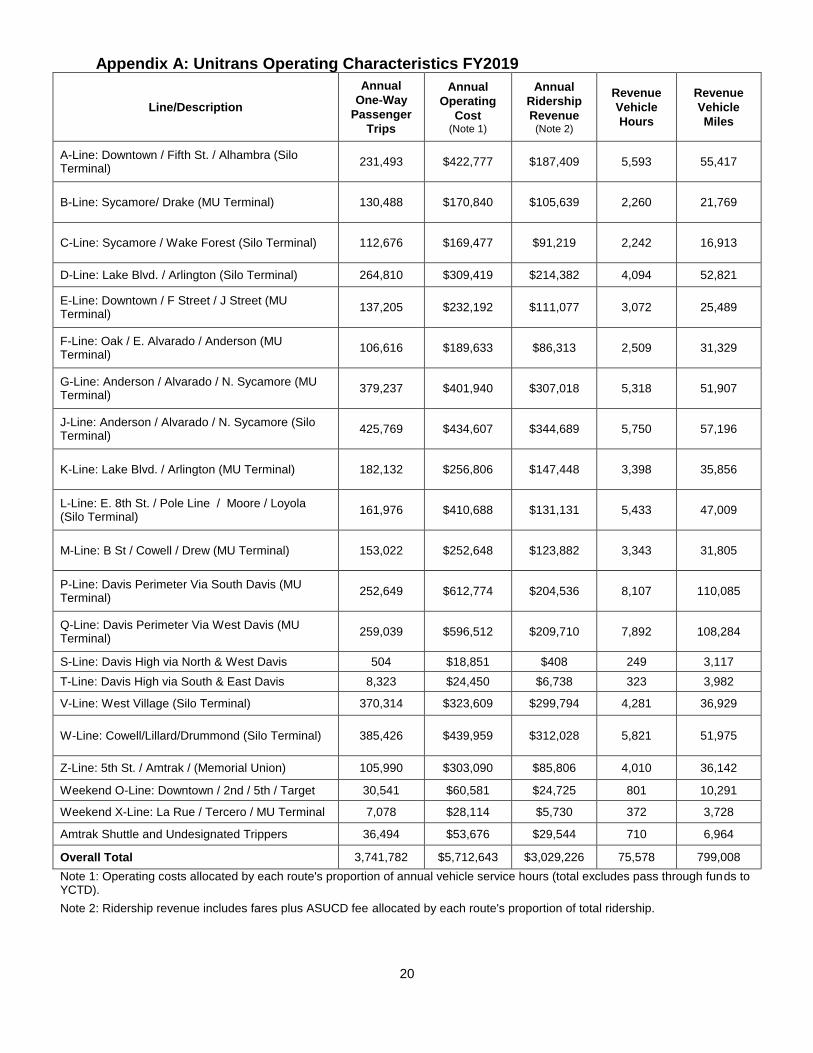
Appendix A: Unitrans Operating Characteristics FY2019
Line/Description
Annual
One-Way
Passenger
Trips
Annual
Operating
Cost (Note 1)
Annual
Ridership
Revenue (Note 2)
Revenue
Vehicle
Hours
Revenue
Vehicle
Miles
A-Line: Downtown / Fifth St. / Alhambra (Silo Terminal)
231,493 $422,777 $187,409 5,593 55,417
B-Line: Sycamore/ Drake (MU Terminal) 130,488 $170,840 $105,639 2,260 21,769
C-Line: Sycamore / Wake Forest (Silo Terminal) 112,676 $169,477 $91,219 2,242 16,913
D-Line: Lake Blvd. / Arlington (Silo Terminal) 264,810 $309,419 $214,382 4,094 52,821
E-Line: Downtown / F Street / J Street (MU Terminal)
137,205 $232,192 $111,077 3,072 25,489
F-Line: Oak / E. Alvarado / Anderson (MU Terminal)
106,616 $189,633 $86,313 2,509 31,329
G-Line: Anderson / Alvarado / N. Sycamore (MU Terminal)
379,237 $401,940 $307,018 5,318 51,907
J-Line: Anderson / Alvarado / N. Sycamore (Silo Terminal)
425,769 $434,607 $344,689 5,750 57,196
K-Line: Lake Blvd. / Arlington (MU Terminal) 182,132 $256,806 $147,448 3,398 35,856
L-Line: E. 8th St. / Pole Line / Moore / Loyola (Silo Terminal)
161,976 $410,688 $131,131 5,433 47,009
M-Line: B St / Cowell / Drew (MU Terminal) 153,022 $252,648 $123,882 3,343 31,805
P-Line: Davis Perimeter Via South Davis (MU Terminal)
252,649 $612,774 $204,536 8,107 110,085
Q-Line: Davis Perimeter Via West Davis (MU Terminal)
259,039 $596,512 $209,710 7,892 108,284
S-Line: Davis High via North & West Davis 504 $18,851 $408 249 3,117
T-Line: Davis High via South & East Davis 8,323 $24,450 $6,738 323 3,982
V-Line: West Village (Silo Terminal) 370,314 $323,609 $299,794 4,281 36,929
W-Line: Cowell/Lillard/Drummond (Silo Terminal) 385,426 $439,959 $312,028 5,821 51,975
Z-Line: 5th St. / Amtrak / (Memorial Union) 105,990 $303,090 $85,806 4,010 36,142
Weekend O-Line: Downtown / 2nd / 5th / Target 30,541 $60,581 $24,725 801 10,291
Weekend X-Line: La Rue / Tercero / MU Terminal 7,078 $28,114 $5,730 372 3,728
Amtrak Shuttle and Undesignated Trippers 36,494 $53,676 $29,544 710 6,964
Overall Total 3,741,782 $5,712,643 $3,029,226 75,578 799,008
Note 1: Operating costs allocated by each route's proportion of annual vehicle service hours (total excludes pass through funds to YCTD).
Note 2: Ridership revenue includes fares plus ASUCD fee allocated by each route's proportion of total ridership.

21
Appendix B: Unitrans Performance Indicators, FY2018
Line/Description
Subsidy Per
One-Way
Passenger-
Trip
Ridership
Recovery
Ratio
Passenger
Trips Per
Revenue
Vehicle Hour
Passenger
Trips Per
Revenue
Vehicle Mile
A-Line: Downtown / Fifth St. / Alhambra (Silo Terminal)
$1.02 44% 41 4.2
B-Line: Sycamore/ Drake (MU Terminal) $0.50 62% 58 6.0
C-Line: Sycamore / Wake Forest (Silo Terminal) $0.69 54% 50 6.7
D-Line: Lake Blvd. / Arlington (Silo Terminal) $0.36 69% 65 5.0
E-Line: Downtown / F Street / J Street (MU Terminal)
$0.88 48% 45 5.4
F-Line: Oak / E. Alvarado / Anderson (MU Terminal)
$0.97 46% 42 3.4
G-Line: Anderson / Alvarado / N. Sycamore (MU Terminal)
$0.25 76% 71 7.3
J-Line: Anderson / Alvarado / N. Sycamore (Silo Terminal)
$0.21 79% 74 7.4
K-Line: Lake Blvd. / Arlington (MU Terminal) $0.60 57% 54 5.1
L-Line: E. 8th St. / Pole Line / Moore / Loyola (Silo Terminal)
$1.73 32% 30 3.4
M-Line: B St / Cowell / Drew (MU Terminal) $0.84 49% 46 4.8
P-Line: Davis Perimeter Via South Davis (MU Terminal)
$1.62 33% 31 2.3
Q-Line: Davis Perimeter Via West Davis (MU Terminal)
$1.49 35% 33 2.4
S-Line: Davis High via North & West Davis $36.59 2% 2 0.2
T-Line: Davis High $2.13 28% 26 2.1
V-Line: West Village (Silo Terminal) $0.06 93% 86 10.0
W-Line: Cowell/Lillard/Drummond (Silo Terminal) $0.33 71% 66 7.4
Z-Line: 5th St. / Amtrak / (Memorial Union) $2.05 28% 26 2.9
Weekend O-Line: Downtown / 2nd / 5th / Target $1.17 41% 38 3.0
Weekend X-Line: La Rue / Tercero / MU Term. $3.16 20% 19 1.9
Overall Total $0.72 53% 50 4.7
Standard from City of Davis Short Range Transit Plan
N/A 53% systemwide;
consider changes
if <20%
50 systemwide;
consider changes
if <20 N/A

22
Appendix C: Unitrans Goals, Objectives, Performance Measures, and Standards
Based on the City of Davis Short-Range Transit Plan Goal Objective Performance Measure Standard FY2018-19 Performance Met?
Effectiveness Convenience % of student dwelling units within 1/4 mile of transit stop
90% Over 95% of all Davis
residents are within 1/4 mile Yes
% of major activity centers within 1/8 of transit stop
90% 94% Yes
Peak-hour service frequencies for routes >=60 pass/hour
15-minute service D, J, V, W are >60; all have
15" frequency Yes
Reliability % within 5" of scheduled time
90% 88% No
Number of missed trips <1/day N/A N/A
Vehicle miles between road calls
20,000 FY18: 9,949 FY19: 7,833
No
Safety Miles between preventable major accidents
100,000 266,336 Yes
Injuries per 100,000 boardings
<=1 < 1 Yes
Safety meetings Quarterly Yes, quarterly meetings Yes
Attractiveness Annual ridership growth >= population
growth
FY19: Ridership -7.0% Student population +2.3%
City of Davis population <1% No
Provide accurate and timely information
Schedules stocked on
vehicles and thru community
Yes Yes
Efficiency Cost Efficiency Change in Op cost / rev hour
<= CPI
FY 17-FY18: $72.83 to $75.59 = +3.8%
CPI +3.7% (most recent from Dept of Ind Relations)
Approximately Equal
Productivity Passengers per rev veh hr 40 50 Yes
Individual route productivity
Consider changes if less
than 15
S line eliminated due to low ridership. Only 2/hour
Yes
Maintenance % of PMs completed w/in 300 miles of scheduled
95% 99.4% Yes
Wash exterior and sweep interior
Ext. wash 2/week Interior: Daily
Yes, Exterior – 1/week; Interiors - Daily
Yes
Cost Recovery % of annual cost from fares
60% 53% No
Integration/ Coordination
Shared Facilities Study feasibility of timed transfer terminal
Upgrade Silo and MU Terminals
Completed Yes
Coordinate service and fares
Waiting times between buses at transfer locations
Local <=10" Regional <= 20"
Yes. Waiting times within standard; fares fully
integrated Yes
Paratransit coordination
Coordinate Unitrans service with ADA services
Ongoing coordination
Regular meetings with DCT and YCTD for coordination
Yes

23
Goal Objective Performance Measure Standard FY2018-19 Performance Met?
Inclusion of transit w/general plans
Transit service considered in plans and development review
Ongoing coordination
Close coordination with City of Davis, UCD ORMP, and
SACOG Yes
Accessibility Wheelchair lifts % vehicles with lifts or ramps
100% of single-deck buses
100% of single-deck buses; 97% of trips; 97% of miles
Yes
Special needs
% known concentrations of senior and disabled residents with transit service
100% Yes Yes
Capacity Peak loading conditions not to exceed 150% of seats
95% of bus trips. 90% of bus
riders on trips <60
96.5% of bus trips 91.5% of bus riders
Yes
Identify gaps Meet w/ interest groups and respond to comments
Respond to requests; resolve
w/in 6 months
Yes, requests also gathered at Unitrans Adv Comm and
Unmet needs hearings Yes


Evaluate trunsportotion lunding models used dt uC Los Angeles and UC lrvine fot campus shuttle se|icesto determine if UC Davis should pursue similar funding relationships with private/public partnerships such as
Greystar in West Village. At both UCLA and UCl, third party property managers provide direct funding forshuttle services that directly serve their residents.
Evoluote tronsportotion lunding opportunities with new ond/or existing off-compus opoftment housingfor undergroduote ond graduote students served directly by IJnitrons to directly fund Unitrons service.Models could include assessing larger transportation impact fees to fund public transit service or one-timecapital purchases beyond simple measures such as installing a bus stop, on-going a n nual bus pass fundingfor residents similar to new low-income housing developments in Davis, etc.
Suppott tronsportotion demond mdnogement (TDM) plonning ellorts through llc Davis' TronsportotionSeruices department to:
Review class and work schedules to reduce the impacts of peak transpodation demands on Unitransas well as the campus transportation network, Spreading peak transportation demand and peaktraffic impacts could result in significant Unitrans operating budget savings.Provide direct funding to expand Unitrans fare-free service to all UC Davis affiliates beyondundergraduates.
7. Pursue pldnnlng elforts thot moximize Unitrons touting elliciency, prioritize mosstransit dccess, dndreduce operating costs. For example, because there is not a connection between West Village and WestDavis neighborhoods via Russell Boulevard, Unitrans must operate two bus lines to serve both areas,doubling its operating costs. Connecting West Davis and West Village could allow efficient mass transitwithout a significant annual financial investment.
8. Support compus ond city projects thot prioritize trunsit service such as improved trallic signdl technoloqythot prioriti?es transit, boarding islands on mojor coffidors, etc. and low cost technology to simplily ldrccollection. Reducing bus stop dwell tames and start to finish running times for Unitrans routes will result inshorter trip times and lower operating costs.
AMAS Report Observation:
. Submit a plan of action to campus senior leadership addressing the long-term capital needs of Unitrans,
Unitrans WorkBroup Recommendations:
9. lnclude Unitrons' Tuyeot capital program in the Division oI Student Allairs copitol plonning qnd Jundingprocess. Unitrans prepares and regularly updates a 10-year capital program and aggressively pursues local,regional, state, and federal funding to support the program.
AMAS Report Observation:
o Review and determine whether Unitrans'strategies adequately address the high attrition rate and impactof new rules for graduating students.
Unitrans Workgroup Recommendations:
b.
70. Continue to implement humon resources ond training strotegies to address high attrition rate includingfocusing hiring on freshmen and sophomores, tracking student employee graduation dates quarterly toinform the hiring and training plan, and implementing stricter weekly minimum work hour requirements fordriver trainees- Unitrans has implemented a number of measures to reduce attrition in Academic Year 2018-19.
AMAS Report Observation:
. Review and determine whether Unitrans' collision mitigation measures and strategies adequately address
the rate of collisions.
Unitrans Workgroup Recommendations:
77. continue to implement the lollowing collision reduaion strotegies:a. Review collision trends and high-collision locations quarterly implementing strategies to reduce
collisions like lane reconfigu rations, driver-training improvements, re-routing buses, etc.
b. Review and evaluate driver behavior after all collisions. lmplement driver retraining or discipline as
needed.c. Work collaboratively with campus Risk Management to review claims and to identify potential areas of
improvements to reduce risk.
AMAS Report Observation:
. Provide evidence that relevant Long Range Development Plan (LRDP) documents and reports have beenincorporated into the scope of the Unitrans Workgroup.
Recommendation:
12. Completed.fhe Unitrans Workgroup have incorporated the LRDP into its meeting agendas andrecommendations relating to transportation demand management relevant to the LRDP. Matt Dulcich,Director of Environmental Planning, who oversees the campus' LRDP, was a contributing member of theUnitrans Workgroup.