united states securities and exchange...
TRANSCRIPT

UNITED STATES SECURITIES AND EXCHANGE COMMISSION
Washington, D.C. 20549
FORM 10-Q
(Mark One)
For the quarterly period ended July 1, 2017
For the transition period from _______ to _______
Commission File Number 1-7416
VISHAY INTERTECHNOLOGY, INC.
(Exact name of registrant as specified in its charter)
Indicate by check mark whether the registrant (1) has filed all reports required to be filed by Section 13 or 15(d) of the Securities Exchange Act of 1934 during the preceding 12 months (or for such shorter period that the registrant was required to file such reports), and (2) has been subject to such filing requirements for the past 90 days. ý Yes ☐ No Indicate by check mark whether the registrant has submitted electronically and posted on its corporate Web site, if any, every Interactive Data File required to be submitted and posted pursuant to Rule 405 of Regulation S-T (section 232.405 of this chapter) during the preceding 12 months (or for such shorter period that the registrant was required to submit and post such files. ýYes ☐ No Indicate by check mark whether the registrant is a large accelerated filer, an accelerated filer, a non-accelerated filer, a smaller reporting company, or an emerging growth company. See the definitions of "large accelerated filer," "accelerated filer," "smaller reporting company," and "emerging growth company" in Rule 12b-2 of the Exchange Act. (Check one):
If an emerging growth company, indicate by check mark if the registrant has elected not to use the extended transition period for complying with any new or revised financial accounting standards provided pursuant to Section 13(a) of the Exchange Act. ☐ Indicate by check mark whether the registrant is a shell company (as defined in Rule 12b-2 of the Exchange Act). ☐ Yes ý No As of July 28, 2017, the registrant had 134,124,823 shares of its common stock and 12,129,227 shares of its Class B common stock outstanding.
1
☒ QUARTERLY REPORT PURSUANT TO SECTION 13 OR 15(d) OF THE SECURITIES EXCHANGE ACT OF 1934
☐☐☐☐ TRANSITION REPORT PURSUANT TO SECTION 13 OR 15(d) OF THE SECURITIES EXCHANGE ACT OF 1934
Delaware 38-1686453 (State or Other Jurisdiction of Incorporation) (I.R.S. Employer Identification Number)
63 Lancaster Avenue
Malvern, PA 19355-2143
610-644-1300 (Address of Principal Executive Offices) (Registrant's Area Code and Telephone Number)
Large accelerated filer ý Accelerated filer ☐ Non-accelerated filer ☐ (Do not check if smaller reporting company) Smaller reporting company ☐ Emerging growth company ☐

This page intentionally left blank.
2

VISHAY INTERTECHNOLOGY, INC.
FORM 10-Q July 1, 2017 CONTENTS
3
Page Number PART I. FINANCIAL INFORMATION Item 1. Financial Statements Consolidated Condensed Balance Sheets – July 1, 2017 (Unaudited) and December 31, 2016 4 Consolidated Condensed Statements of Operations (Unaudited) – Fiscal Quarters Ended July 1, 2017
and July 2, 2016
6 Consolidated Condensed Statements of Comprehensive Income (Unaudited) – Fiscal Quarters Ended
July 1, 2017 and July 2, 2016
7 Consolidated Condensed Statements of Operations (Unaudited) – Six Fiscal Months Ended July 1, 2017
and July 2, 2016
8 Consolidated Condensed Statements of Comprehensive Income (Unaudited) – Six Fiscal Months Ended
July 1, 2017 and July 2, 2016
9 Consolidated Condensed Statements of Cash Flows (Unaudited) – Six Fiscal Months Ended July 1, 2017
and July 2, 2016
10 Consolidated Condensed Statement of Equity (Unaudited) 11 Notes to the Consolidated Condensed Financial Statements (Unaudited) 12 Item 2. Management's Discussion and Analysis of Financial Condition and Results of Operations 33 Item 3. Quantitative and Qualitative Disclosures About Market Risk 54 Item 4. Controls and Procedures 54 PART II. OTHER INFORMATION Item 1. Legal Proceedings 55 Item 1A. Risk Factors 55 Item 2. Unregistered Sales of Equity Securities and Use of Proceeds 55 Item 3. Defaults Upon Senior Securities 55 Item 4. Mine Safety Disclosures 55 Item 5. Other Information 55 Item 6. Exhibits 55 SIGNATURES 56

PART I - FINANCIAL INFORMATION
Item 1. Financial Statements
VISHAY INTERTECHNOLOGY, INC. Consolidated Condensed Balance Sheets (In thousands)
Continues on following page.
4
July 1, 2017 December 31,
2016 (Unaudited) Assets Current assets:
Cash and cash equivalents $ 561,032 $ 471,781 Short-term investments 626,172 626,627 Accounts receivable, net 327,131 274,027 Inventories:
Finished goods 126,667 109,075 Work in process 175,027 162,311 Raw materials 117,100 109,859
Total inventories 418,794 381,245
Prepaid expenses and other current assets 117,055 110,792 Total current assets 2,050,184 1,864,472 Property and equipment, at cost:
Land 91,282 89,753 Buildings and improvements 586,898 570,932 Machinery and equipment 2,376,420 2,283,222 Construction in progress 58,150 71,777 Allowance for depreciation (2,266,097) (2,166,813)
Property and equipment, net 846,653 848,871 Goodwill 142,209 141,407 Other intangible assets, net 76,945 84,463 Other assets 142,853 138,588
Total assets $ 3,258,844 $ 3,077,801

VISHAY INTERTECHNOLOGY, INC. Consolidated Condensed Balance Sheets (continued) (In thousands)
See accompanying notes.
5
July 1, 2017 December 31,
2016 (Unaudited) Liabilities and equity Current liabilities:
Notes payable to banks $ 11 $ 3 Trade accounts payable 181,906 174,107 Payroll and related expenses 129,836 114,576 Other accrued expenses 153,546 149,131 Income taxes 9,630 19,033
Total current liabilities 474,929 456,850 Long-term debt less current portion 350,329 357,023 Deferred income taxes 288,516 286,797 Other liabilities 65,366 59,725 Accrued pension and other postretirement costs 267,879 257,789 Total liabilities 1,447,019 1,418,184 Redeemable convertible debentures 88,044 88,659 Stockholders' equity: Vishay stockholders' equity
Common stock 13,413 13,385 Class B convertible common stock 1,213 1,213 Capital in excess of par value 1,955,926 1,952,988 (Accumulated deficit) retained earnings (232,418) (307,417) Accumulated other comprehensive income (loss) (19,503) (94,652) Total Vishay stockholders' equity 1,718,631 1,565,517
Noncontrolling interests 5,150 5,441 Total equity 1,723,781 1,570,958 Total liabilities, temporary equity, and equity $ 3,258,844 $ 3,077,801

VISHAY INTERTECHNOLOGY, INC. Consolidated Condensed Statements of Operations (Unaudited - In thousands, except per share amounts)
See accompanying notes.
6
Fiscal quarters ended July 1, 2017 July 2, 2016 Net revenues $ 644,892 $ 590,051 Costs of products sold 471,929 443,923 Gross profit 172,963 146,128 Selling, general, and administrative expenses 90,446 92,253 Restructuring and severance costs 481 4,467 Operating income 82,036 49,408 Other income (expense):
Interest expense (7,076) (6,270) Other 749 2,256 Gain on early extinguishment of debt - 986
Total other income (expense) (6,327) (3,028) Income before taxes 75,709 46,380 Income tax expense 19,300 13,151 Net earnings 56,409 33,229 Less: net earnings attributable to noncontrolling interests 219 143 Net earnings attributable to Vishay stockholders $ 56,190 $ 33,086
Basic earnings per share attributable to Vishay stockholders $ 0.38 $ 0.22 Diluted earnings per share attributable to Vishay stockholders $ 0.36 $ 0.22 Weighted average shares outstanding - basic 146,381 147,643 Weighted average shares outstanding - diluted 155,300 149,845 Cash dividends per share $ 0.0625 $ 0.0625
VISHAY INTERTECHNOLOGY, INC. Consolidated Condensed Statements of Comprehensive Income (Unaudited - In thousands)
See accompanying notes.
7
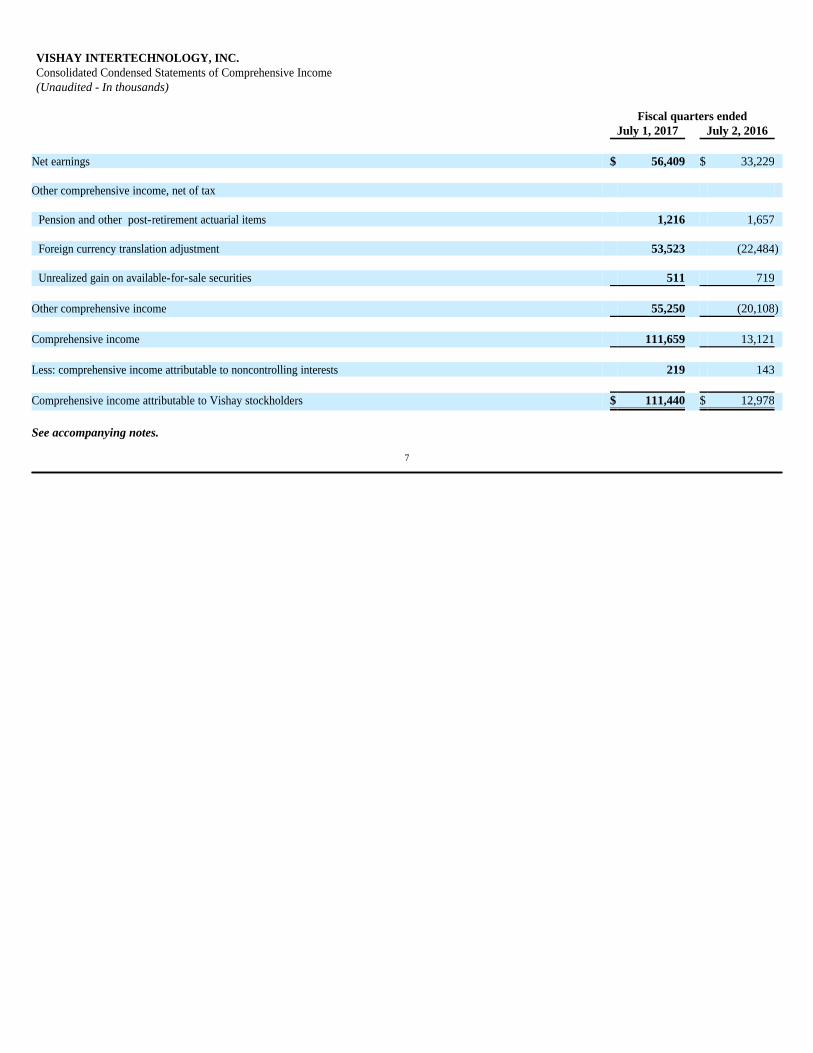
Fiscal quarters ended July 1, 2017 July 2, 2016 Net earnings $ 56,409 $ 33,229 Other comprehensive income, net of tax
Pension and other post-retirement actuarial items 1,216 1,657
Foreign currency translation adjustment 53,523 (22,484)
Unrealized gain on available-for-sale securities 511 719 Other comprehensive income 55,250 (20,108) Comprehensive income 111,659 13,121 Less: comprehensive income attributable to noncontrolling interests 219 143 Comprehensive income attributable to Vishay stockholders $ 111,440 $ 12,978

VISHAY INTERTECHNOLOGY, INC. Consolidated Condensed Statements of Operations (Unaudited - In thousands, except per share amounts)
See accompanying notes.
8
Six fiscal months ended July 1, 2017 July 2, 2016 Net revenues $ 1,251,150 $ 1,160,657 Costs of products sold 917,312 877,220 Gross profit 333,838 283,437 Selling, general, and administrative expenses 185,164 182,539 Restructuring and severance costs 1,950 10,942 Operating income 146,724 89,956 Other income (expense):
Interest expense (13,866) (12,736) Other 353 3,035 Gain on early extinguishment of debt - 4,597 Loss on disposal of equity affiliate (7,060) -
Total other income (expense) (20,573) (5,104) Income before taxes 126,151 84,852 Income taxes 32,793 23,471 Net earnings 93,358 61,381 Less: net earnings attributable to noncontrolling interests 449 281 Net earnings attributable to Vishay stockholders $ 92,909 $ 61,100
Basic earnings per share attributable to Vishay stockholders $ 0.63 $ 0.41 Diluted earnings per share attributable to Vishay stockholders $ 0.60 $ 0.41 Weighted average shares outstanding - basic 146,328 147,739 Weighted average shares outstanding - diluted 155,088 150,237 Cash dividends per share $ 0.1250 $ 0.1250

VISHAY INTERTECHNOLOGY, INC. Consolidated Condensed Statements of Comprehensive Income (Unaudited - In thousands)
See accompanying notes.
9
Six fiscal months ended July 1, 2017 July 2, 2016 Net earnings $ 93,358 $ 61,381 Other comprehensive income, net of tax
Pension and other post-retirement actuarial items 3,551 3,525
Foreign currency translation adjustment 70,816 10,048
Unrealized gain on available-for-sale securities 782 1,346 Other comprehensive income 75,149 14,919 Comprehensive income 168,507 76,300 Less: comprehensive income attributable to noncontrolling interests 449 281 Comprehensive income attributable to Vishay stockholders $ 168,058 $ 76,019

VISHAY INTERTECHNOLOGY, INC. Consolidated Condensed Statements of Cash Flows (Unaudited - In thousands)
See accompanying notes.
10
Six fiscal months ended July 1, 2017 July 2, 2016
(recast - see
Note 1) Operating activities Net earnings $ 93,358 $ 61,381 Adjustments to reconcile net earnings to net cash provided by operating activities:
Depreciation and amortization 80,380 79,117 (Gain) loss on disposal of property and equipment (51) 76 Accretion of interest on convertible debentures 2,444 2,259 Inventory write-offs for obsolescence 9,729 11,225 Loss on disposal of equity affiliate 7,060 - Deferred income taxes 6,640 (2,836) Gain on early extinguishment of debt - (4,597) Other 2,579 (9,009) Net change in operating assets and liabilities, net of effects of businesses acquired (73,873) (42,203)
Net cash provided by operating activities 128,266 95,413 Investing activities Capital expenditures (49,067) (51,073) Proceeds from sale of property and equipment 1,288 193 Purchase of short-term investments (418,114) (274,524) Maturity of short-term investments 454,918 351,326 Other investing activities (6,664) 2,975 Net cash provided by (used in) investing activities (17,639) 28,897 Financing activities Principal payments on long-term debt and capital leases - (34,044) Net proceeds (payments) on revolving credit lines (10,000) (66,000) Common stock repurchases - (6,123) Net changes in short-term borrowings 7 (725) Dividends paid to common stockholders (16,761) (16,924) Dividends paid to Class B common stockholders (1,516) (1,516) Proceeds from stock options exercised 1,260 - Distributions to noncontrolling interests (740) (707) Cash withholding taxes paid when shares withheld for vested equity awards (1,971) (442) Other financing activities (1,255) - Net cash provided by (used in) financing activities (30,976) (126,481) Effect of exchange rate changes on cash and cash equivalents 9,600 1,831 Net increase (decrease) in cash and cash equivalents 89,251 (340) Cash and cash equivalents at beginning of period 471,781 475,507 Cash and cash equivalents at end of period $ 561,032 $ 475,167

VISHAY INTERTECHNOLOGY, INC. Consolidated Condensed Statement of Equity (Unaudited - In thousands, except share and per share amounts)
See accompanying notes.
11
Common
Stock
Class B Convertible
Common Stock
Capital in Excess of Par
Value
Retained Earnings
(Accumulated Deficit)
Accumulated Other
Comprehensive Income (Loss)
Total Vishay Stockholders'
Equity Noncontrolling
Interests Total Equity Balance at December 31, 2016 $ 13,385 $ 1,213 $ 1,952,988 $ (307,417) $ (94,652) $ 1,565,517 $ 5,441 $ 1,570,958 Cumulative effect of accounting change
for adoption of ASU 2016-09 (see Note 1) - - - 386 - 386 - 386
Net earnings - - - 92,909 - 92,909 449 93,358 Other comprehensive income - - - - 75,149 75,149 - 75,149 Distributions to noncontrolling interests - - - - - - (740) (740) Temporary equity reclassification - - 615 - - 615 - 615 Issuance of stock and related tax
withholdings for vested restricted stock units (200,688 shares) 20 - (1,991) - - (1,971) - (1,971)
Dividends declared ($ 0.1250 per share) - - 19 (18,296) - (18,277) - (18,277) Stock compensation expense - - 3,043 - - 3,043 - 3,043 Stock options exercised (77,334 shares) 8 - 1,252 - - 1,260 - 1,260 Balance at July 1, 2017 $ 13,413 $ 1,213 $ 1,955,926 $ (232,418) $ (19,503) $ 1,718,631 $ 5,150 $ 1,723,781

Note 1 – Basis of Presentation The accompanying unaudited consolidated condensed financial statements of Vishay Intertechnology, Inc. ("Vishay" or the "Company") have been prepared in accordance with the instructions to Form 10-Q and therefore do not include all information and footnotes necessary for presentation of financial position, results of operations, and cash flows required by accounting principles generally accepted in the United States ("GAAP") for complete financial statements. The information furnished reflects all normal recurring adjustments which are, in the opinion of management, necessary for a fair summary of the financial position, results of operations, and cash flows for the interim periods presented. The financial statements should be read in conjunction with the consolidated financial statements filed with the Company's Annual Report on Form 10-K for the year ended December 31, 2016. The results of operations for the fiscal quarter and six fiscal months ended July 1, 2017 are not necessarily indicative of the results to be expected for the full year. The Company reports interim financial information for 13-week periods beginning on a Sunday and ending on a Saturday, except for the first fiscal quarter, which always begins on January 1, and the fourth fiscal quarter, which always ends on December 31. The four fiscal quarters in 2017 end on April 1, 2017, July 1, 2017, September 30, 2017, and December 31, 2017, respectively. The four fiscal quarters in 2016 ended on April 2, 2016, July 2, 2016, October 1, 2016, and December 31, 2016, respectively. Recently Adopted Accounting Guidance In March 2016, the Financial Accounting Standards Board ("FASB") issued Accounting Standards Update ("ASU") No. 2016-09, Compensation - Stock Compensation (Topic 718): Improvements to Employee Share-Based Payment Accounting. The ASU is the result of the FASB's simplification initiative intended to improve GAAP by reducing costs and complexity while maintaining or enhancing the usefulness of related financial statement information. The ASU simplifies several aspects of the accounting for employee share-based payment transactions, including the accounting for income taxes, forfeitures, and statutory tax withholding requirements, as well as classification in the statement of cash flows. The Company adopted the ASU on January 1, 2017. The ASU allowed prospective adoption of certain aspects, while requiring retrospective adoption of other aspects of the guidance. The Company recognized a cumulative-effect adjustment for previously unrecognized excess tax benefits in January 1, 2017 retained earnings (accumulated deficit) of $386. The Company reclassified $442 of cash withholding taxes paid when shares were withheld for vested equity awards in the accompanying consolidated condensed statement of cash flows for the six fiscal months ended July 2, 2016 to financing cash flows. The Company retrospectively reclassified excess tax benefits as operating cash flows on the consolidated condensed statement of cash flows. The Company will recognize forfeitures on its stock-based awards as they occur. Recently Issued Accounting Guidance In May 2014, the FASB issued ASU No. 2014-09, Revenue from Contracts with Customers (Topic 606). The ASU is the result of a convergence project between the FASB and the International Accounting Standards Board to clarify the principles for recognizing revenue and to develop a common revenue standard for GAAP and International Financial Reporting Standards. The ASU removes inconsistencies and weaknesses in revenue requirements; provides a more robust framework for addressing revenue issues; improves comparability of revenue recognition practices across entities, industries, jurisdictions, and capital markets; provides more useful information to users of financial statements through expanded disclosure requirements; and simplifies the preparation of financial statements by reducing the number of requirements to which an entity must refer. The ASU is effective for the Company for interim and annual periods beginning on or after January 1, 2018. The Company intends to retrospectively adopt the ASU effective January 1, 2018. Based on work performed to date, the adoption of the ASU is not expected to have a material impact on the Company's results of operations. In February 2016, the FASB issued ASU No. 2016-02, Leases (Topic 842). The ASU is the result of a project between the FASB and the International Accounting Standards Board to increase transparency and comparability among organizations by recognizing lease assets and lease liabilities on the balance sheet and disclosing key information about leasing arrangements. Upon adoption of the ASU, the Company will recognize lease assets and liabilities for its operating leases which are not currently reported on its consolidated balance sheets. The ASU is effective for the Company for interim and annual periods beginning on or after January 1, 2019, with the ability to early adopt. The Company is currently evaluating the effect of the ASU on its lease contracts. In June 2016, the FASB issued ASU No. 2016-13, Financial Instruments - Credit Losses (Topic 326): Measurement of Credit Losses on Financial Instruments. The ASU replaces the incurred loss impairment methodology in current GAAP with a methodology that reflects expected credit losses and requires consideration of a broader range of reasonable and supportable information to inform credit loss estimates. The ASU is effective for the Company for interim and annual periods beginning on or after January 1, 2020, with the ability to early adopt for interim and annual periods beginning on or after January 1, 2019. The Company is currently evaluating the effect of the ASU on its financial assets measured at amortized cost. Reclassifications In addition to the changes due to the retrospective adoption of certain aspects of new accounting guidance described above, certain prior period amounts have been reclassified to conform to the current financial statement presentation.
12
NOTES TO THE CONSOLIDATED CONDENSED FINANCIAL STATEMENTS (dollars in thousands, except per share amounts)

Note 2 – Restructuring and Related Activities The Company places a strong emphasis on controlling its costs and combats general price inflation by continuously improving its efficiency and operating performance. When the ongoing cost containment activities are not adequate, the Company takes actions to maintain its cost competitiveness. The Company incurred significant restructuring costs in its past to reduce its cost structure. Historically, the Company's primary cost reduction technique was through the transfer of production from high-labor-cost countries to lower-labor-cost countries. Since 2013, the Company's cost reduction programs have primarily focused on reducing fixed costs, including selling, general, and administrative expenses. In 2013, the Company announced various cost reduction programs. These programs were substantially implemented by the end of the first fiscal quarter of 2016, with some additional costs incurred in the remainder of 2016. Many of the severance costs were recognized ratably over the required stay periods. In November 2016, the Company announced an extension of one of these programs. In 2015, the Company announced additional global cost reduction programs. These programs include a facility closure in the Netherlands. The cash costs of these programs, primarily severance, are expected to aggregate to approximately $30,000. Complete implementation of these programs is expected to occur before the end of 2017. The following table summarizes restructuring and related expenses which were recognized and reported on a separate line in the accompanying consolidated condensed statements of operations:
MOSFETs Enhanced Competitiveness Program Over a period of approximately 2 years and in a series of discrete steps, the manufacture of wafers for a substantial share of products was transferred into a more cost-efficient fab. As a consequence, certain other manufacturing previously occurring in-house was transferred to third-party foundries. This transfer of production was substantially completed by the end of the first fiscal quarter of 2016. Employees generally were required to remain with the Company during the production transfer period. Accordingly, the Company accrued these severance costs ratably over the respective employees' remaining service periods. The Company has incurred and may continue to incur other exit costs associated with the production transfer, including certain contract termination costs. As a result of a review of the financial results and outlook for the Company's MOSFETs segment following the completion of production transfers, the Company has determined to implement further cost reductions for the MOSFETs segment. In November 2016, the Company announced an extension of the MOSFETs Enhanced Competitiveness Program. The revised program includes various cost reduction initiatives, primarily the transfer of all remaining manufacturing operations at its Santa Clara, California facility to other Vishay facilities or third-party subcontractors. The production transfers will be completed in steps by the end of 2017. The Company expects to incur cash charges of approximately $4,000 to $8,000, primarily related to severance, to implement these steps. The total cash charges for the MOSFETs Enhanced Competitiveness Program are expected to be $24,000 to $27,000. The Company expects to maintain its R&D and management presence in the Silicon Valley area, even after the cessation of manufacturing operations there.
13
NOTES TO THE CONSOLIDATED CONDENSED FINANCIAL STATEMENTS (dollars in thousands, except per share amounts)
Fiscal quarters ended Six fiscal months ended July 1, 2017 July 2, 2016 July 1, 2017 July 2, 2016 MOSFETs Enhanced Competitiveness Program $ 28 $ 1,110 $ 448 $ 5,025 Global Cost Reduction Programs 453 3,357 1,502 5,917 Total $ 481 $ 4,467 $ 1,950 $ 10,942

The following table summarizes the activity to date related to this program:
Severance benefits are generally paid in a lump sum at cessation of employment. Other exit costs of $80 are included in the expenses incurred in 2017 in the table above. The entire amount of the liability is considered current and is included in other accrued expenses in the accompanying consolidated condensed balance sheets. Voluntary Separation / Retirement Program The voluntary separation / early retirement program was offered to employees worldwide who were eligible because they met job classification, age, and years-of-service criteria as of October 31, 2013. The program benefits varied by country and job classification, but generally included a cash loyalty bonus based on years of service. All employees eligible for the program have left the Company. These employees generally were not aligned with any particular segment. The effective separation / retirement date for most employees who accepted the offer was June 30, 2014 or earlier, with a few exceptions to allow for a transition period. The Company recorded $13,373 of expenses for this program, primarily in 2013 and 2014. Substantially all amounts related to this program have been paid as of July 1, 2017.
14
NOTES TO THE CONSOLIDATED CONDENSED FINANCIAL STATEMENTS (dollars in thousands, except per share amounts)
Expense recorded in 2013 $ 2,328 Cash paid (267) Balance at December 31, 2013 $ 2,061 Expense recorded in 2014 6,025 Cash paid (856) Balance at December 31, 2014 $ 7,230 Expense recorded in 2015 5,367 Cash paid (426) Foreign currency translation 1 Balance at December 31, 2015 $ 12,172 Expense recorded in 2016 9,744 Cash paid (15,686) Foreign currency translation 2 Balance at December 31, 2016 $ 6,232 Expense recorded in 2017 448 Cash paid (3,356) Balance at July 1, 2017 $ 3,324

Global Cost Reduction Programs The global cost reduction programs announced in 2015 include a plan to reduce selling, general, and administrative costs company-wide, and targeted streamlining and consolidation of production for certain product lines within its Capacitors and Resistors & Inductors segments. The following table summarizes the activity to date related to this program:
The following table summarizes the expense recognized by segment related to this program:
Severance benefits are generally paid in a lump sum at cessation of employment. The current portion of the liability is $2,633 and is included in other accrued expenses in the accompanying consolidated condensed balance sheets. The non-current portion of the liability is included in other liabilities in the accompanying consolidated condensed balance sheets.
15
NOTES TO THE CONSOLIDATED CONDENSED FINANCIAL STATEMENTS (dollars in thousands, except per share amounts)
Expense recorded in 2015 $ 13,753 Cash paid (986) Foreign currency translation (150) Balance at December 31, 2015 $ 12,617 Expense recorded in 2016 9,918 Cash paid (16,237) Foreign currency translation (34) Balance at December 31, 2016 $ 6,264 Expense recorded in 2017 1,502 Cash paid (4,728) Foreign currency translation 237 Balance at July 1, 2017 $ 3,275
Fiscal quarters ended Six fiscal months ended July 1, 2017 July 2, 2016 July 1, 2017 July 2, 2016 Diodes $ 13 $ 130 $ 13 $ 578 Optoelectronic Components 242 775 242 953 Resistors & Inductors 84 1,504 935 2,522 Capacitors 85 89 246 423 Unallocated Selling, General, and Administrative Expenses 29 859 66 1,441 Total $ 453 $ 3,357 $ 1,502 $ 5,917
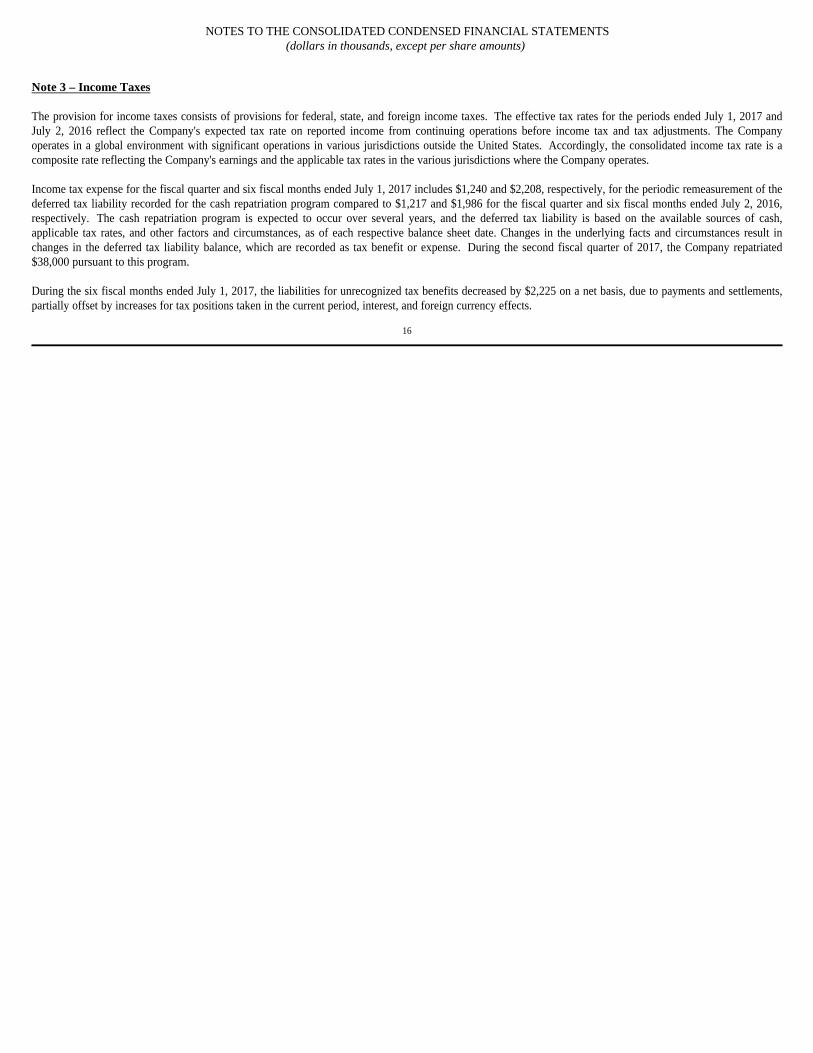
Note 3 – Income Taxes The provision for income taxes consists of provisions for federal, state, and foreign income taxes. The effective tax rates for the periods ended July 1, 2017 and July 2, 2016 reflect the Company's expected tax rate on reported income from continuing operations before income tax and tax adjustments. The Company operates in a global environment with significant operations in various jurisdictions outside the United States. Accordingly, the consolidated income tax rate is a composite rate reflecting the Company's earnings and the applicable tax rates in the various jurisdictions where the Company operates. Income tax expense for the fiscal quarter and six fiscal months ended July 1, 2017 includes $1,240 and $2,208, respectively, for the periodic remeasurement of the deferred tax liability recorded for the cash repatriation program compared to $1,217 and $1,986 for the fiscal quarter and six fiscal months ended July 2, 2016, respectively. The cash repatriation program is expected to occur over several years, and the deferred tax liability is based on the available sources of cash, applicable tax rates, and other factors and circumstances, as of each respective balance sheet date. Changes in the underlying facts and circumstances result in changes in the deferred tax liability balance, which are recorded as tax benefit or expense. During the second fiscal quarter of 2017, the Company repatriated $38,000 pursuant to this program. During the six fiscal months ended July 1, 2017, the liabilities for unrecognized tax benefits decreased by $2,225 on a net basis, due to payments and settlements, partially offset by increases for tax positions taken in the current period, interest, and foreign currency effects.
16
NOTES TO THE CONSOLIDATED CONDENSED FINANCIAL STATEMENTS (dollars in thousands, except per share amounts)

Note 4 – Long-Term Debt Long-term debt consists of the following:
Convertible Senior Debentures Vishay currently has three issuances of convertible senior debentures outstanding with generally congruent terms. The quarterly cash dividend program of the Company results in adjustments to the conversion rate and effective conversion price for each issuance of the Company's convertible senior debentures effective as of the ex-dividend date of each cash dividend. The following table summarizes some key facts and terms regarding the three series of outstanding convertible senior debentures following the adjustment made to the conversion rate of the debentures on the ex-dividend date of the June 29, 2017 dividend payment:
Prior to three months before the maturity date, the holders may only convert their debentures under the following circumstances: (1) during any fiscal quarter after the first full quarter subsequent to issuance, if the sale price of Vishay common stock reaches 130% of the conversion price for a specified period; (2) the trading price of the debentures falls below 98% of the product of the sale price of Vishay's common stock and the conversion rate for a specified period; (3) Vishay calls any or all of the debentures for redemption, at any time prior to the close of business on the third scheduled trading day immediately preceding the redemption date; or (4) upon the occurrence of specified corporate events. The convertible debentures due 2042 became convertible subsequent to the December 31, 2016 evaluation of the conversion criteria, remained convertible subsequent to the April 1, 2017 evaluation, and remain convertible subsequent to the July 1, 2017 evaluation, due to the sale price of Vishay's common stock exceeding 130% of the conversion price for the applicable periods in the fourth fiscal quarter of 2016 and first and second fiscal quarters of 2017. The debentures due 2042 will remain convertible until September 30, 2017, at which time the conversion criteria will be reevaluated. At the direction of its Board of Directors, the Company intends, upon future conversion of any of the convertible senior debentures, to repay the principal amounts of the convertible senior debentures in cash and settle any additional amounts in shares of Vishay common stock. The excess of the amount that the Company would pay to the holders of the debentures due 2042 upon conversion over the carrying value of the liability component of the debentures currently convertible has been reclassified as temporary equity on the consolidated condensed financial statements. The Company intends to finance the principal amount of any converted debentures using borrowings under its credit facility. Accordingly, the debt component of the convertible debentures due 2042 continues to be classified as a non-current liability on the consolidated condensed balance sheets.
17
NOTES TO THE CONSOLIDATED CONDENSED FINANCIAL STATEMENTS (dollars in thousands, except per share amounts)
July 1, 2017
December 31, 2016
Credit facility $ 133,000 $ 143,000 Convertible senior debentures, due 2040 109,291 108,120 Convertible senior debentures, due 2041 56,072 55,442 Convertible senior debentures, due 2042 61,956 61,341 Deferred financing costs (9,990) (10,880) 350,329 357,023 Less current portion - - $ 350,329 $ 357,023
Due 2040 Due 2041 Due 2042
Issuance date November 9,
2010 May 13, 2011 May 31, 2012
Maturity date November 15,
2040 May 15, 2041 June 1, 2042 Principal amount $ 275,000 $ 150,000 $ 150,000 Cash coupon rate (per annum) 2.25% 2.25% 2.25%Nonconvertible debt borrowing rate at issuance (per annum) 8.00% 8.375% 7.50%Conversion rate effective June 13, 2017 (per $1 principal amount) 76.6985 55.9705 90.1791 Effective conversion price effective June 13, 2017 (per share) $ 13.04 $ 17.87 $ 11.09 130% of the conversion price (per share) $ 16.95 $ 23.23 $ 14.42
Call date November 20,
2020 May 20, 2021 June 7, 2022

GAAP requires an issuer to separately account for the liability and equity components of the instrument in a manner that reflects the issuer's nonconvertible debt borrowing rate when interest costs are recognized in subsequent periods. The resulting discount on the debt is amortized as non-cash interest expense in future periods. The carrying values of the liability and equity components of the convertible debentures are reflected in the Company's consolidated condensed balance sheets as follows:
Interest is payable on the debentures semi-annually at the cash coupon rate; however, the remaining debt discount is being amortized as additional non-cash interest expense using an effective annual interest rate equal to the Company's estimated nonconvertible debt borrowing rate at the time of issuance. In addition to ordinary interest, contingent interest will accrue in certain circumstances relating to the trading price of the debentures and under certain other circumstances beginning ten years subsequent to issuance. Interest expense related to the debentures is reflected on the consolidated condensed statements of operations for the fiscal quarters ended:
18
NOTES TO THE CONSOLIDATED CONDENSED FINANCIAL STATEMENTS (dollars in thousands, except per share amounts)
Principal amount of
the debentures
Unamortized discount
Embedded derivative
Carrying value of liability
component
Equity component (including temporary
equity) - net carrying value
July 1, 2017 Due 2040 $ 275,000 (166,058) 349 $ 109,291 $ 110,094 Due 2041 $ 150,000 (94,221) 293 $ 56,072 $ 62,246 Due 2042 $ 150,000 (88,228) 184 $ 61,956 $ 57,874
Total $ 575,000 $ (348,507) $ 826 $ 227,319 $ 230,214
December 31, 2016
Due 2040 $ 275,000 (167,273) 393 $ 108,120 $ 110,094 Due 2041 $ 150,000 (94,843) 285 $ 55,442 $ 62,246 Due 2042 $ 150,000 (88,835) 176 $ 61,341 $ 57,874
Total $ 575,000 $ (350,951) $ 854 $ 224,903 $ 230,214
Contractual coupon interest
Non-cash amortization
of debt discount
Non-cash amortization of deferred financing
costs
Non-cash change in value of
derivative liability
Total interest expense
related to the debentures
July 1, 2017 Due 2040 $ 1,547 613 22 (19) $ 2,163 Due 2041 $ 844 314 12 6 $ 1,176 Due 2042 $ 844 306 14 12 $ 1,176
Total $ 3,235 $ 1,233 $ 48 $ (1) $ 4,515
July 2, 2016
Due 2040 $ 1,547 567 22 (41) $ 2,095 Due 2041 $ 844 289 13 (72) $ 1,074 Due 2042 $ 844 283 14 (14) $ 1,127
Total $ 3,235 $ 1,139 $ 49 $ (127) $ 4,296

Interest expense related to the debentures is reflected on the consolidated condensed statements of operations for the six fiscal months ended:
19
NOTES TO THE CONSOLIDATED CONDENSED FINANCIAL STATEMENTS (dollars in thousands, except per share amounts)
Contractual coupon interest
Non-cash amortization
of debt discount
Non-cash amortization of deferred financing
costs
Non-cash change in value of
derivative liability
Total interest expense
related to the debentures
July 1, 2017 Due 2040 $ 3,094 1,215 44 (44) $ 4,309 Due 2041 $ 1,688 622 24 8 $ 2,342 Due 2042 $ 1,688 607 27 8 $ 2,330
Total $ 6,470 $ 2,444 $ 95 $ (28) $ 8,981
July 2, 2016
Due 2040 $ 3,094 1,123 44 (35) $ 4,226 Due 2041 $ 1,688 573 24 (34) $ 2,251 Due 2042 $ 1,688 563 27 (31) $ 2,247
Total $ 6,470 $ 2,259 $ 95 $ (100) $ 8,724

Note 5 – Other Income (Expense) In March 2017, the Company sold its 50% interest in an investment accounted for using the equity method, and recorded a loss of $7,060. The recorded loss includes Vishay's proportionate share of the investee's accumulated other comprehensive loss of $1,110, recognized upon discontinuation of the equity investment. The loss on disposal is not deductible for income tax purposes. There are certain contingencies pending resolution related to the investee, which may require adjustment to the amount of the recognized loss. The resolution of such additional contingencies is not expected to be material to the financial condition, results of operations, or cash flows of the Company.
20
NOTES TO THE CONSOLIDATED CONDENSED FINANCIAL STATEMENTS (dollars in thousands, except per share amounts)
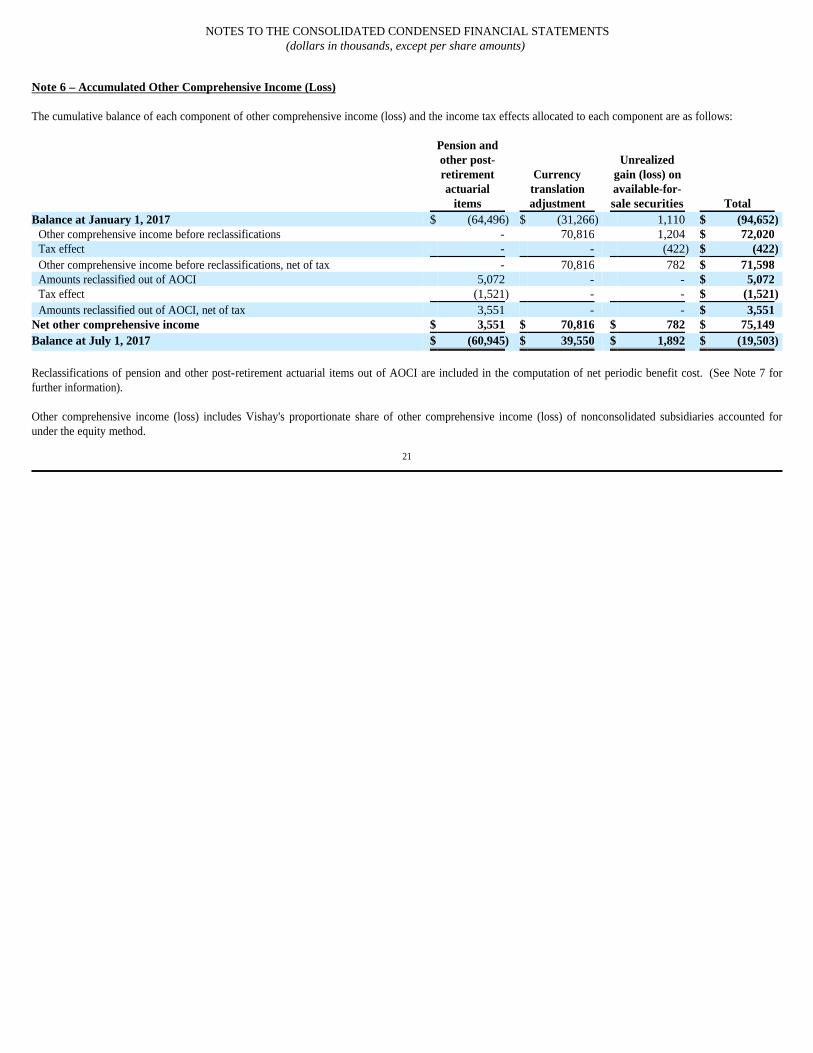
Note 6 – Accumulated Other Comprehensive Income (Loss) The cumulative balance of each component of other comprehensive income (loss) and the income tax effects allocated to each component are as follows:
Reclassifications of pension and other post-retirement actuarial items out of AOCI are included in the computation of net periodic benefit cost. (See Note 7 for further information). Other comprehensive income (loss) includes Vishay's proportionate share of other comprehensive income (loss) of nonconsolidated subsidiaries accounted for under the equity method.
21
NOTES TO THE CONSOLIDATED CONDENSED FINANCIAL STATEMENTS (dollars in thousands, except per share amounts)
Pension and other post-retirement actuarial
items
Currency translation adjustment
Unrealized gain (loss) on available-for-sale securities Total
Balance at January 1, 2017 $ (64,496) $ (31,266) 1,110 $ (94,652) Other comprehensive income before reclassifications - 70,816 1,204 $ 72,020 Tax effect - - (422) $ (422) Other comprehensive income before reclassifications, net of tax - 70,816 782 $ 71,598 Amounts reclassified out of AOCI 5,072 - - $ 5,072 Tax effect (1,521) - - $ (1,521) Amounts reclassified out of AOCI, net of tax 3,551 - - $ 3,551
Net other comprehensive income $ 3,551 $ 70,816 $ 782 $ 75,149 Balance at July 1, 2017 $ (60,945) $ 39,550 $ 1,892 $ (19,503)

Note 7 – Pensions and Other Postretirement Benefits The Company maintains various retirement benefit plans. Defined Benefit Pension Plans The following table shows the components of the net periodic pension cost for the second fiscal quarters of 2017 and 2016 for the Company's defined benefit pension plans:
The following table shows the components of the net periodic pension cost for the six fiscal months ended July 1, 2017 and July 2, 2016 for the Company's defined benefit pension plans:
Net periodic benefit cost in 2017 was significantly impacted by the termination and settlement of the Company's qualified U.S. pension plan in December 2016. The settlement resulted in the immediate recognition of previously unrecognized actuarial items related to the plan in 2016 that were recorded in accumulated other comprehensive income and were being amortized into net periodic pension cost. A final reconciliation of participant data subject to the settlement annuity contract was completed during the second fiscal quarter of 2017. The final annuity pricing adjustment and related items did not have a material impact on the Company's financial results. The Company contributed $4,409 to the Company's Taiwanese pension plans to improve the funded status of those plans in 2017.
22
NOTES TO THE CONSOLIDATED CONDENSED FINANCIAL STATEMENTS (dollars in thousands, except per share amounts)
Fiscal quarter ended
July 1, 2017 Fiscal quarter ended
July 2, 2016
U.S. Plans Non-U.S.
Plans U.S. Plans Non-U.S.
Plans Net service cost $ - $ 925 $ - $ 791 Interest cost 411 1,199 2,889 1,383 Expected return on plan assets - (518) (2,826) (542) Amortization of prior service cost 36 18 36 13 Amortization of losses 83 1,523 1,651 1,201 Curtailment and settlement losses - 330 - 201 Net periodic benefit cost $ 530 $ 3,477 $ 1,750 $ 3,047
Six fiscal months ended
July 1, 2017 Six fiscal months ended
July 2, 2016
U.S. Plans Non-U.S.
Plans U.S. Plans Non-U.S.
Plans Net service cost $ - $ 1,828 $ - $ 1,565 Interest cost 821 2,366 5,889 2,736 Expected return on plan assets - (1,024) (5,651) (1,076) Amortization of prior service cost 72 36 72 25 Amortization of losses 165 3,001 3,301 2,372 Curtailment and settlement losses - 652 - 396 Net periodic benefit cost $ 1,058 $ 6,859 $ 3,611 $ 6,018

Other Postretirement Benefits The following table shows the components of the net periodic benefit cost for the second fiscal quarters of 2017 and 2016 for the Company's other postretirement benefit plans:
The following table shows the components of the net periodic pension cost for the six fiscal months ended July 1, 2017 and July 2, 2016 for the Company's other postretirement benefit plans:
23
NOTES TO THE CONSOLIDATED CONDENSED FINANCIAL STATEMENTS (dollars in thousands, except per share amounts)
Fiscal quarter ended
July 1, 2017 Fiscal quarter ended
July 2, 2016
U.S. Plans Non-U.S.
Plans U.S. Plans Non-U.S.
Plans Service cost $ 33 $ 67 $ 32 $ 68 Interest cost 78 26 85 36 Amortization of prior service (credit) (209) - (209) - Amortization of losses (gains) (23) 15 (7) 17 Net periodic benefit cost $ (121) $ 108 $ (99) $ 121
Six fiscal months ended
July 1, 2017 Six fiscal months ended
July 2, 2016
U.S. Plans Non-U.S.
Plans U.S. Plans Non-U.S.
Plans Service cost $ 66 $ 131 $ 63 $ 135 Interest cost 155 50 170 72 Amortization of prior service (credit) (418) - (418) - Amortization of losses (gains) (46) 29 (15) 34 Net periodic benefit cost $ (243) $ 210 $ (200) $ 241

Note 8 – Stock-Based Compensation The Company has various stockholder-approved programs which allow for the grant of stock-based compensation to officers, employees, and non-employee directors of the Company. The amount of compensation cost related to stock-based payment transactions is measured based on the grant-date fair value of the equity instruments issued. The fair value of each option award is estimated on the date of grant using the Black-Scholes option-pricing model. The Company determines compensation cost for restricted stock units ("RSUs"), phantom stock units, and restricted stock based on the grant-date fair value of the underlying common stock adjusted for expected dividends paid over the required vesting period for non-participating awards. Compensation cost is recognized over the period that an officer, employee, or non-employee director provides service in exchange for the award. The following table summarizes stock-based compensation expense recognized:
The Company recognizes compensation cost for RSUs that are expected to vest and records cumulative adjustments in the period that the expectation changes. The following table summarizes unrecognized compensation cost and the weighted average remaining amortization periods at July 1, 2017 (amortization periods in years):
The Company currently expects all performance-based RSUs to vest and all of the associated unrecognized compensation cost for performance-based RSUs presented in the table above to be recognized.
24
NOTES TO THE CONSOLIDATED CONDENSED FINANCIAL STATEMENTS (dollars in thousands, except per share amounts)
Fiscal quarters ended Six fiscal months ended July 1, 2017 July 2, 2016 July 1, 2017 July 2, 2016 Restricted stock units $ 676 $ 1,085 $ 2,880 2,169 Phantom stock units - - 163 117 Stock options - - - - Total $ 676 $ 1,085 $ 3,043 2,286
Unrecognized Compensation
Cost
Weighted Average
Remaining Amortization
Periods Restricted stock units $ 4,251 1.5 Phantom stock units - 0.0 Stock options - 0.0 Total $ 4,251

2007 Stock Incentive Plan The Company's 2007 Stock Incentive Program (the "2007 Program"), as amended and restated, permits the grant of up to 6,500,000 shares of restricted stock, unrestricted stock, RSUs, stock options, and phantom stock units, to officers, employees, and non-employee directors of the Company. Such instruments are available for grant until May 20, 2024. Restricted Stock Units RSU activity under the 2007 Program as of July 1, 2017 and changes during the six fiscal months then ended are presented below (number of RSUs in thousands):
* The number of RSUs vested includes shares that the Company withheld on behalf of employees to satisfy the statutory tax withholding requirements.
The number of performance-based RSUs that are scheduled to vest increases ratably based on the achievement of defined performance criteria between the established target and maximum levels. RSUs with performance-based vesting criteria are expected to vest as follows (number of RSUs in thousands):
Phantom Stock Units The 2007 Program authorizes the grant of phantom stock units to the extent provided for in the Company's employment agreements with certain executives. Each phantom stock unit entitles the recipient to receive a share of common stock at the individual's termination of employment or any other future date specified in the applicable employment agreement. Phantom stock units participate in dividend distribution on the same basis as the Company's common stock and Class B common stock. Dividend equivalents are issued in the form of additional units of phantom stock. The phantom stock units are fully vested at all times. Phantom stock unit activity under the phantom stock plan as of July 1, 2017 and changes during the six fiscal months then ended are presented below (number of phantom stock units in thousands):
25
NOTES TO THE CONSOLIDATED CONDENSED FINANCIAL STATEMENTS (dollars in thousands, except per share amounts)
Number of
RSUs
Weighted Average
Grant-date Fair Value per
Unit Outstanding: January 1, 2017 1,004 $ 12.74 Granted 304 15.52 Vested* (322) 13.54 Cancelled or forfeited - - Outstanding at July 1, 2017 986 $ 13.34
Expected to vest at July 1, 2017 986
Vesting Date Expected to
Vest Not Expected
to Vest Total January 1, 2018 202 - 202 January 1, 2019 213 - 213 January 1, 2020 167 - 167
Number of
units
Grant-date Fair Value per
Unit Outstanding: January 1, 2017 145 Granted 10 $ 16.25 Dividend equivalents issued 1 Outstanding at July 1, 2017 156

Stock Options In addition to stock options outstanding pursuant to the 2007 Program, during the periods presented, the Company had stock options outstanding under previous stockholder-approved stock option programs. These programs are more fully described in Note 12 to the Company's consolidated financial statements included in its Annual Report on Form 10-K for the year ended December 31, 2016. No additional options may be granted pursuant to these programs. At December 31, 2016, there were approximately 77,000 options outstanding with a weighted average exercise price of $16.29. During the six fiscal months ended July 1, 2017, the remaining approximately 77,000 options were exercised. The total intrinsic value of options exercised during the six fiscal months ended July 1, 2017 was $20.
26
NOTES TO THE CONSOLIDATED CONDENSED FINANCIAL STATEMENTS (dollars in thousands, except per share amounts)

Note 9 – Segment Information Vishay is a global manufacturer and supplier of electronic components. Vishay operates, and its chief operating decision maker makes strategic and operating decisions with regards to assessing performance and allocating resources based on, five reporting segments: MOSFETs, Diodes, Optoelectronic Components, Resistors & Inductors, and Capacitors. These segments represent groupings of product lines based on their functionality:
Vishay's reporting segments generate substantially all of their revenue from product sales to the industrial, automotive, telecommunications, computing, consumer products, power supplies, military and aerospace, and medical end markets. A small portion of revenues is from royalties. The Company evaluates business segment performance on operating income, exclusive of certain items ("segment operating income"). Only dedicated, direct selling, general, and administrative expenses of the segments are included in the calculation of segment operating income. The Company's calculation of segment operating income excludes such selling, general, and administrative costs as global operations, sales and marketing, information systems, finance and administration groups, as well as restructuring and severance costs, goodwill and long-lived asset impairment charges, and other items. Management believes that evaluating segment performance excluding such items is meaningful because it provides insight with respect to intrinsic operating results of the Company. These items represent reconciling items between segment operating income and consolidated operating income. Business segment assets are the owned or allocated assets used by each business. The Company also regularly evaluates gross profit by segment to assist in the analysis of consolidated gross profit. The Company considers segment operating income to be the more important metric because it more fully captures the business operations of the segments.
27
NOTES TO THE CONSOLIDATED CONDENSED FINANCIAL STATEMENTS (dollars in thousands, except per share amounts)
● Metal oxide semiconductor field-effect transistors ("MOSFETs") function as solid-state switches to control power. ● Diodes route, regulate, and block radio frequency, analog, and power signals; protect systems from surges or electrostatic discharge damage; or provide
electromagnetic interference filtering. ● Optoelectronic components emit light, detect light, or do both. ● Resistors and inductors both impede electric current. Resistors are basic components used in all forms of electronic circuitry to adjust and regulate levels of
voltage and current. Inductors use an internal magnetic field to change alternating current phase and resist alternating current. ● Capacitors store energy and discharge it when needed.

The following tables set forth business segment information:
28
NOTES TO THE CONSOLIDATED CONDENSED FINANCIAL STATEMENTS (dollars in thousands, except per share amounts)
MOSFETs Diodes Optoelectronic
Components Resistors &
Inductors Capacitors Total Fiscal quarter ended July 1, 2017: Product Sales $ 114,035 $ 155,717 $ 73,838 $ 209,146 $ 92,120 $ 644,856 Royalty Revenues - - - 36 - $ 36
Total Revenue $ 114,035 $ 155,717 $ 73,838 $ 209,182 $ 92,120 $ 644,892 Gross Profit $ 25,315 $ 41,130 $ 25,466 $ 62,090 $ 18,962 $ 172,963 Segment Operating Income $ 16,637 $ 36,176 $ 21,474 $ 54,688 $ 14,128 $ 143,103 Fiscal quarter ended July 2, 2016: Product Sales $ 102,219 $ 142,118 $ 68,059 $ 192,717 $ 84,856 $ 589,969 Royalty Revenues - - - 82 - $ 82
Total Revenue $ 102,219 $ 142,118 $ 68,059 $ 192,799 $ 84,856 $ 590,051 Gross Profit $ 11,884 $ 37,258 $ 21,618 $ 57,256 $ 18,112 $ 146,128 Segment Operating Income $ 2,560 $ 31,550 $ 15,844 $ 48,571 $ 12,632 $ 111,157
Six fiscal months ended July 1, 2017: Product Sales $ 219,564 $ 300,612 $ 139,520 $ 409,523 $ 181,889 $ 1,251,108 Royalty Revenues - - - 42 - $ 42
Total Revenue $ 219,564 $ 300,612 $ 139,520 $ 409,565 $ 181,889 $ 1,251,150 Gross Profit $ 45,991 $ 78,659 $ 47,767 $ 123,260 $ 38,161 $ 333,838 Segment Operating Income $ 28,398 $ 68,915 $ 38,389 $ 108,585 $ 28,300 $ 272,587 Six fiscal months ended July 2, 2016: Product Sales $ 203,152 $ 277,502 $ 130,834 $ 376,133 $ 172,876 $ 1,160,497 Royalty Revenues - - - 160 - $ 160
Total Revenue $ 203,152 $ 277,502 $ 130,834 $ 376,293 $ 172,876 $ 1,160,657 Gross Profit $ 24,471 $ 69,920 $ 40,799 $ 113,040 $ 35,207 $ 283,437 Segment Operating Income $ 5,178 $ 58,193 $ 29,498 $ 95,454 $ 23,935 $ 212,258
Fiscal quarters ended Six fiscal months ended July 1, 2017 July 2, 2016 July 1, 2017 July 2, 2016 Reconciliation: Segment Operating Income $ 143,103 $ 111,157 $ 272,587 $ 212,258 Restructuring and Severance Costs (481) (4,467) (1,950) (10,942) Unallocated Selling, General, and Administrative Expenses (60,586) (57,282) (123,913) (111,360) Consolidated Operating Income $ 82,036 $ 49,408 $ 146,724 $ 89,956 Unallocated Other Income (Expense) (6,327) (3,028) (20,573) (5,104) Consolidated Income (Loss) Before Taxes $ 75,709 $ 46,380 $ 126,151 $ 84,852

Note 10 – Earnings Per Share The following table sets forth the computation of basic and diluted earnings (loss) per share attributable to Vishay stockholders (shares in thousands):
29
NOTES TO THE CONSOLIDATED CONDENSED FINANCIAL STATEMENTS (dollars in thousands, except per share amounts)
Fiscal quarters ended Six fiscal months ended July 1, 2017 July 2, 2016 July 1, 2017 July 2, 2016 Numerator: Numerator for basic earnings per share:
Net earnings attributable to Vishay stockholders $ 56,190 $ 33,086 $ 92,909 $ 61,100 Interest savings assuming conversion of dilutive exchangeable notes, net of tax - - - 38 Numerator for diluted earnings per share:
Net earnings attributable to Vishay stockholders - diluted $ 56,190 $ 33,086 $ 92,909 $ 61,138
Denominator: Denominator for basic earnings per share:
Weighted average shares 146,226 147,500 146,173 147,597 Outstanding phantom stock units 155 143 155 142 Adjusted weighted average shares 146,381 147,643 146,328 147,739
Effect of dilutive securities:
Convertible and exchangeable debt instruments 8,651 1,995 8,500 2,311 Restricted stock units 268 207 260 187 Dilutive potential common shares 8,919 2,202 8,760 2,498
Denominator for diluted earnings per share:
Adjusted weighted average shares - diluted 155,300 149,845 155,088 150,237
Basic earnings per share attributable to Vishay stockholders $ 0.38 $ 0.22 $ 0.63 $ 0.41 Diluted earnings per share attributable to Vishay stockholders $ 0.36 $ 0.22 $ 0.60 $ 0.41

Diluted earnings (loss) per share for the periods presented do not reflect the following weighted average potential common shares that would have an antidilutive effect or have unsatisfied performance conditions (in thousands):
In periods in which they are dilutive, if the potential common shares related to the exchangeable notes are included in the computation, the related interest savings, net of tax, assuming conversion/exchange is added to the net earnings used to compute earnings per share. The Company's convertible debt instruments are only convertible for specified periods upon the occurrence of certain events. The convertible debentures due 2042 became convertible subsequent to the December 31, 2016 evaluation of the conversion criteria, remained convertible subsequent to the April 1, 2017 evaluation, and remain convertible subsequent to the July 1, 2017 evaluation. In periods that the debentures are not convertible, the certain conditions which could trigger conversion of the remaining debentures have been deemed to be non-substantive, and accordingly, the Company assumes the conversion of these instruments in its diluted earnings per share computation during periods in which they are dilutive. At the direction of its Board of Directors, the Company intends, upon conversion, to repay the principal amounts of the convertible senior debentures, due 2040, due 2041, and due 2042, in cash and settle any additional amounts in shares of Vishay common stock. Accordingly, the debentures are included in the diluted earnings per share computation using the "treasury stock method" (similar to options and warrants) rather than the "if converted method" otherwise required for convertible debt. Under the "treasury stock method," Vishay calculates the number of shares issuable under the terms of the debentures based on the average market price of Vishay common stock during the period, and that number is included in the total diluted shares figure for the period. If the average market price is less than $13.04, no shares are included in the diluted earnings per share computation for the convertible senior debentures due 2040, if the average market price is less than $17.87, no shares are included in the diluted earnings per share computation for the convertible senior debentures due 2041, and if the average market price is less than $11.09, no shares are included in the diluted earnings per share computation for the convertible senior debentures due 2042.
30
NOTES TO THE CONSOLIDATED CONDENSED FINANCIAL STATEMENTS (dollars in thousands, except per share amounts)
Fiscal quarters ended Six fiscal months ended July 1, 2017 July 2, 2016 July 1, 2017 July 2, 2016 Convertible notes:
Convertible Senior Debentures, due 2040 - 20,675 - 20,625 Convertible Senior Debentures, due 2041 8,371 8,230 8,356 8,209
Weighted average employee stock options - 105 - 105 Weighted average other 581 610 581 610

Note 11 – Fair Value Measurements The fair value measurement accounting guidance establishes a valuation hierarchy of the inputs used to measure fair value. This hierarchy prioritizes the inputs to valuation techniques used to measure fair value into three broad levels. The following is a brief description of those three levels:
Level 1: Observable inputs such as quoted prices (unadjusted) in active markets for identical assets or liabilities.
Level 2: Inputs other than quoted prices that are observable for the asset or liability, either directly or indirectly. These include quoted prices for similar assets or liabilities in active markets and quoted prices for identical or similar assets or liabilities in markets that are not active.
Level 3: Unobservable inputs that reflect the Company's own assumptions.
An asset or liability's classification within the hierarchy is determined based on the lowest level input that is significant to the fair value measurement. There have been no changes in the classification of any financial instruments within the fair value hierarchy in the periods presented. The following table provides the financial assets and liabilities carried at fair value measured on a recurring basis:
The Company maintains non-qualified trusts, referred to as "rabbi" trusts, to fund payments under deferred compensation and non-qualified pension plans. Rabbi trust assets consist primarily of marketable securities, classified as available-for-sale and company-owned life insurance assets. The marketable securities held in the rabbi trusts are valued using quoted market prices on the last business day of the period. The company-owned life insurance assets are valued in consultation with the Company's insurance brokers using the value of underlying assets of the insurance contracts. The fair value measurement of the marketable securities held in the rabbi trust is considered a Level 1 measurement and the measurement of the company-owned life insurance assets is considered a Level 2 measurement within the fair value hierarchy.
31
NOTES TO THE CONSOLIDATED CONDENSED FINANCIAL STATEMENTS (dollars in thousands, except per share amounts)
Total
Fair Value Level 1 Level 2 Level 3 July 1, 2017 Assets: Assets held in rabbi trusts $ 43,502 $ 27,940 $ 15,562 $ - Available for sale securities $ 4,335 4,335 - - $ 47,837 $ 32,275 $ 15,562 $ - Liabilities: Embedded derivative - convertible debentures due 2040 $ (349) $ - $ - $ (349) Embedded derivative - convertible debentures due 2041 $ (293) - - (293) Embedded derivative - convertible debentures due 2042 $ (184) - - (184) $ (826) $ - $ - $ (826) December 31, 2016 Assets: Assets held in rabbi trusts $ 41,917 $ 27,297 14,620 $ - Available for sale securities $ 3,969 3,969 - - $ 45,886 $ 31,266 $ 14,620 $ - Liabilities: Embedded derivative - convertible debentures due 2040 $ (393) $ - $ - $ (393) Embedded derivative - convertible debentures due 2041 $ (285) - - (285) Embedded derivative - convertible debentures due 2042 $ (176) - - (176) $ (854) $ - $ - $ (854)

The Company holds available for sale investments in debt securities that are intended to fund a portion of its pension and other postretirement benefit obligations outside of the United States. The investments are valued based on quoted market prices on the last business day of the year. The fair value measurement of the investments is considered a Level 1 measurement within the fair value hierarchy. The convertible senior debentures, due 2040, due 2041, and due 2042, issued by the Company on November 9, 2010, May 13, 2011, and May 31, 2012, respectively, contain embedded derivative features that GAAP requires to be bifurcated and remeasured each reporting period. Each quarter, the change in the fair value of the embedded derivative features, if any, is recorded in the consolidated condensed statements of operations. The Company uses a derivative valuation model to derive the value of the embedded derivative features. Key inputs into this valuation model are the Company's current stock price, risk-free interest rates, the stock dividend yield, the stock volatility, and the debentures' credit spread over LIBOR. The first three aforementioned inputs are based on observable market data and are considered Level 2 inputs while the last two aforementioned inputs are unobservable and thus require management's judgment and are considered Level 3 inputs. The fair value measurement is considered a Level 3 measurement within the fair value hierarchy. The Company enters into forward contracts with highly-rated financial institutions to mitigate the foreign currency risk associated with intercompany loans denominated in a currency other than the legal entity's functional currency. The notional amount of the forward contracts was $105,644 and $100,000 as of July 1, 2017 and December 31, 2016, respectively. The forward contracts are short-term in nature and are expected to be renewed at the Company's discretion until the intercompany loans are repaid. We have not designated the forward contracts as hedges for accounting purposes, and as such the change in the fair value of the contracts is recognized in the consolidated condensed statements of operations as a component of other income (expense). The Company estimates the fair value of the forward contracts based on applicable and commonly used pricing models using current market information and is considered a Level 2 measurement within the fair value hierarchy. The value of the forward contracts was immaterial as of July 1, 2017. The Company does not utilize derivatives or other financial instruments for trading or other speculative purposes. The fair value of the long-term debt, excluding the derivative liabilities and deferred financing costs, at July 1, 2017 and December 31, 2016 is approximately $873,500 and $860,600, respectively, compared to its carrying value, excluding the derivative liabilities and deferred financing costs, of $359,493 and $367,049, respectively. The Company estimates the fair value of its long-term debt using a combination of quoted market prices for similar financing arrangements and expected future payments discounted at risk-adjusted rates, which are considered Level 2 inputs. At July 1, 2017 and December 31, 2016, the Company's short-term investments were comprised of time deposits with financial institutions that have maturities that exceed 90 days from the date of acquisition; however they all mature within one year from the respective balance sheet dates. The Company's short-term investments are accounted for as held-to-maturity debt instruments, at amortized cost, which approximates their fair value. The investments are funded with excess cash not expected to be needed for operations prior to maturity; therefore, the Company believes it has the intent and ability to hold the short-term investments until maturity. At each reporting date, the Company performs an evaluation to determine if any unrealized losses are other-than-temporary. No other-than-temporary impairments have been recognized on these securities, and there are no unrecognized holding gains or losses for these securities during the periods presented. There have been no transfers to or from the held-to-maturity classification. All decreases in the account balance are due to returns of principal at the securities' maturity dates. Interest on the securities is recognized as interest income when earned. At July 1, 2017 and December 31, 2016, the Company's cash and cash equivalents were comprised of demand deposits, time deposits with maturities of three months or less when purchased, and money market funds. The Company estimates the fair value of its cash, cash equivalents, and short-term investments using level 2 inputs. Based on the current interest rates for similar investments with comparable credit risk and time to maturity, the fair value of the Company's cash, cash equivalents, and held-to-maturity short-term investments approximate the carrying amounts reported in the consolidated condensed balance sheets. The Company's financial instruments also include accounts receivable, short-term notes payable, and accounts payable. The carrying amounts for these financial instruments reported in the consolidated condensed balance sheets approximate their fair values.
32
NOTES TO THE CONSOLIDATED CONDENSED FINANCIAL STATEMENTS (dollars in thousands, except per share amounts)

Overview Vishay Intertechnology, Inc. ("Vishay," "we," "us," or "our") is a global manufacturer and supplier of discrete semiconductors and passive components, including power MOSFETs, power integrated circuits, transistors, diodes, optoelectronic components, resistors, capacitors, and inductors. Discrete semiconductors and passive components manufactured by Vishay are used in virtually all types of electronic products, including those in the industrial, computing, automotive, consumer electronic products, telecommunications, power supplies, military/aerospace, and medical industries. We operate in five product segments: MOSFETs; Diodes; Optoelectronic Components; Resistors & Inductors; and Capacitors. Since 1985, we have pursued a business strategy of growth through focused research and development and acquisitions. Through this strategy, we have grown to become one of the world's largest manufacturers of discrete semiconductors and passive components. We expect to continue our strategy of acquisitions while also maintaining a prudent capital structure. We are focused on enhancing stockholder value and improving earnings per share. In addition to our growth plan, we also have opportunistically repurchased our stock. In 2014, our Board of Directors instituted a quarterly dividend payment program and declared the first cash dividend in the history of Vishay. In December 2015, we amended our credit facility to increase our ability to repurchase shares of stock or pay cash dividends. On May 2, 2016, our Board of Directors approved a stock repurchase plan, authorizing us to repurchase, in the aggregate, up to $100 million of our outstanding common stock. The stock repurchase plan expired on May 2, 2017. We repurchased 1,752,454 shares of stock for $23.2 million pursuant to the plan. No shares were repurchased in 2017. On August 2, 2017, our Board of Directors approved a stock repurchase plan, authorizing us to repurchase, in the aggregate, up to $150 million of our outstanding common stock. The stock repurchase plan will expire on June 1, 2018. The stock repurchase plan does not obligate us to acquire any particular amount of common stock, and it may be terminated or suspended at any time at the Company's direction in accordance with the plan. The Company has not repurchased any stock since the inception of this plan. As part of the amendment and restatement of the revolving credit facility in December 2015, we completed an evaluation of our anticipated domestic cash needs over the next several years and our most efficient use of liquidity, with consideration of the amount of cash that can be repatriated to the U.S. efficiently with lesser withholding taxes in foreign jurisdictions. As a result of that evaluation, during the fourth quarter of 2015, we recognized income tax expense of $164.0 million, including U.S. federal and state income taxes, incremental foreign income taxes, and withholding taxes payable to foreign jurisdictions, on $300 million of foreign earnings which we expect to repatriate to the U.S. over the next several years. We repatriated $38 million and $46 million to the U.S. pursuant to this plan in 2017 and 2016, respectively. Our business and operating results have been and will continue to be impacted by worldwide economic conditions. Our revenues are dependent on end markets that are impacted by consumer and industrial demand, and our operating results can be adversely affected by reduced demand in those global markets. For several years, we implemented aggressive cost reduction programs. We continue to monitor the current economic environment and its potential effects on our customers and the end markets that we serve. Additionally, we continue to closely monitor our costs, inventory, and capital resources to respond to changing conditions and to ensure we have the management, business processes, and resources to meet our future needs. In the first fiscal quarter of 2016, we substantially completed the implementation of targeted cost reduction programs that began in the fourth fiscal quarter of 2013. The cost reduction programs initiated in 2015 continue as planned. As a result of a review of the financial results and outlook for our MOSFETs segment following the completion of production transfers, we determined to implement further cost reductions for the MOSFETs segment. In November 2016, we announced an extension of the MOSFETs Enhanced Competitiveness Program. Our cost reduction programs are more fully described in Note 2 to the consolidated condensed financial statements included in Item 1, and in "Cost Management" below. See additional information regarding our competitive strengths and key challenges as disclosed in Part 1 of our Annual Report on Form 10-K for the year ended December 31, 2016, filed with the Securities and Exchange Commission (the "SEC") on February 17, 2017. We utilize several financial metrics, including net revenues, gross profit margin, segment operating income, end-of-period backlog, book-to-bill ratio, inventory turnover, change in average selling prices, net cash and short-term investments (debt), and free cash generation to evaluate the performance and assess the future direction of our business. (See further discussion in "Financial Metrics" and "Financial Condition, Liquidity, and Capital Resources.") The strong level of demand that began in the first fiscal quarter of 2017 continued in the second fiscal quarter of 2017. Net revenues increased versus the prior fiscal quarter and prior year periods. The continued strong order levels resulted in an increase in nearly all key financial metrics compared to the prior fiscal quarter and prior year periods. Net revenues for the fiscal quarter ended July 1, 2017 were $644.9 million, compared to $606.3 million and $590.1 million for the fiscal quarters ended April 1, 2017 and July 2, 2016, respectively. The net earnings attributable to Vishay stockholders for the fiscal quarter ended July 1, 2017 were $56.2 million, or $0.36 per diluted share, compared to $36.7 million, or $0.24 per share for the fiscal quarter ended April 1, 2017 and $33.1 million, or $0.22 per diluted share for the fiscal quarter ended July 2, 2016.
33
Item 2. Management's Discussion and Analysis of Financial Condition and Results of Operations

Net revenues for the six fiscal months ended July 1, 2017 were $1,251.2 million, compared to $1,160.7 million for the six fiscal months ended July 2, 2016. The net earnings attributable to Vishay stockholders for the six fiscal months ended July 1, 2017 were $92.9 million, or $0.60 per diluted share, compared to $61.1 million, or $0.41 per diluted share for the six fiscal months ended July 2, 2016. We define adjusted net earnings as net earnings determined in accordance with GAAP adjusted for various items that management believes are not indicative of the intrinsic operating performance of our business. We define free cash as the cash flows generated from continuing operations less capital expenditures plus net proceeds from the sale of property and equipment. The reconciliations below include certain financial measures which are not recognized in accordance with GAAP, including adjusted net earnings, adjusted earnings per share, and free cash. These non-GAAP measures should not be viewed as alternatives to GAAP measures of performance or liquidity. Non-GAAP measures such as adjusted net earnings, adjusted earnings per share, and free cash do not have uniform definitions. These measures, as calculated by Vishay, may not be comparable to similarly titled measures used by other companies. Management believes that adjusted net earnings and adjusted earnings per share are meaningful because they provide insight with respect to our intrinsic operating results. Management believes that free cash is a meaningful measure of our ability to fund acquisitions, repay debt, and otherwise enhance stockholder value through stock repurchases or dividends. The items affecting comparability are (in thousands, except per share amounts):
* Includes add-back of interest on exchangeable notes in periods where the notes are dilutive. Although the term "free cash" is not defined in GAAP, each of the elements used to calculate free cash for the year-to-date period is presented as a line item on the face of our consolidated condensed statement of cash flows prepared in accordance with GAAP and the quarterly amounts are derived from the year-to-date GAAP statements as of the beginning and end of the respective quarter.
**Results have been recast due to the adoption of ASU 2016-09. See Note 1 to the consolidated condensed financial statements included in Item 1. Our results for the fiscal quarters ended July 1, 2017, April 1, 2017, and July 2, 2016 and six fiscal months ending July 1, 2017 and July 2, 2016 represent the effects of a strong business environment and order activity, our cost reduction programs, and our organic growth initiatives. We experienced a relatively sharp upturn in demand in the first fiscal quarter of 2017 that continued in the second fiscal quarter of 2017 and further improved results. Our percentage of euro-based sales approximates our percentage of euro-based expenses so the foreign currency impact on revenues was substantially offset by the impact on expenses. Our pre-tax results were consistent with expectations based on our business model.
34
Fiscal quarters ended Six fiscal months ended July 1, 2017 April 1, 2017 July 2, 2016 July 1, 2017 July 2, 2016 GAAP net earnings attributable to Vishay stockholders $ 56,190 $ 36,719 $ 33,086 $ 92,909 $ 61,100 Reconciling items affecting operating income: Restructuring and severance costs $ 481 $ 1,469 $ 4,467 $ 1,950 $ 10,942 Reconciling items affecting other income (expense): Loss on disposal of equity affiliate $ - $ 7,060 $ - $ 7,060 $ - Gain on early extinguishment of debt - - (986) - (4,597) Reconciling items affecting tax expense: Effects of cash repatriation program $ (1,240) $ (968) $ (1,217) $ (2,208) $ (1,986) Tax effects of pre-tax items above (156) (441) (1,108) (597) (1,995) Adjusted net earnings $ 55,275 $ 43,839 $ 34,242 $ 99,114 $ 63,464
Adjusted weighted average diluted shares outstanding 155,300 154,876 149,845 155,088 150,237 Adjusted earnings per diluted share * $ 0.36 $ 0.28 $ 0.23 $ 0.64 $ 0.42
Fiscal quarters ended Six fiscal months ended July 1, 2017 April 1, 2017 July 2, 2016 July 1, 2017 July 2, 2016** Net cash provided by continuing operating activities $ 84,592 $ 43,674 $ 74,713 $ 128,266 $ 95,413 Proceeds from sale of property and equipment 345 943 129 1,288 193 Less: Capital expenditures (32,399) (16,668) (31,317) (49,067) (51,073) Free cash $ $52,538 $ 27,949 $ $43,525 $ $80,487 $ 44,533

Financial Metrics We utilize several financial metrics to evaluate the performance and assess the future direction of our business. These key financial measures and metrics include net revenues, gross profit margin, operating margin, segment operating income, end-of-period backlog, and the book-to-bill ratio. We also monitor changes in inventory turnover and our or publicly available average selling prices ("ASP"). Gross profit margin is computed as gross profit as a percentage of net revenues. Gross profit is generally net revenues less costs of products sold, but also deducts certain other period costs, particularly losses on purchase commitments and inventory write-downs. Losses on purchase commitments and inventory write-downs have the impact of reducing gross profit margin in the period of the charge, but result in improved gross profit margins in subsequent periods by reducing costs of products sold as inventory is used. Gross profit margin is clearly a function of net revenues, but also reflects our cost management programs and our ability to contain fixed costs. Operating margin is computed as gross profit less operating expenses as a percentage of net revenues. We evaluate business segment performance on segment operating margin. Only dedicated, direct selling, general, and administrative expenses of the segments are included in the calculation of segment operating income. Segment operating margin is computed as operating income less items such as restructuring and severance costs, asset write-downs, goodwill and indefinite-lived intangible asset impairments, inventory write-downs, gains or losses on purchase commitments, global operations, sales and marketing, information systems, finance and administrative groups, and other items, expressed as a percentage of net revenues. We believe that evaluating segment performance excluding such items is meaningful because it provides insight with respect to intrinsic operating results of the segment. Operating margin is clearly a function of net revenues, but also reflects our cost management programs and our ability to contain fixed costs. End-of-period backlog is one indicator of future revenues. We include in our backlog only open orders that we expect to ship in the next twelve months. If demand falls below customers' forecasts, or if customers do not control their inventory effectively, they may cancel or reschedule the shipments that are included in our backlog, in many instances without the payment of any penalty. Therefore, the backlog is not necessarily indicative of the results to be expected for future periods. An important indicator of demand in our industry is the book-to-bill ratio, which is the ratio of the amount of product ordered during a period as compared with the product that we ship during that period. A book-to-bill ratio that is greater than one indicates that our backlog is building and that we are likely to see increasing revenues in future periods. Conversely, a book-to-bill ratio that is less than one is an indicator of declining demand and may foretell declining revenues. We focus on our inventory turnover as a measure of how well we are managing our inventory. We define inventory turnover for a financial reporting period as our costs of products sold for the four fiscal quarters ending on the last day of the reporting period divided by our average inventory (computed using each fiscal quarter-end balance) for this same period. A higher level of inventory turnover reflects more efficient use of our capital. Pricing in our industry can be volatile. Using our and publicly available data, we analyze trends and changes in average selling prices to evaluate likely future pricing. The erosion of average selling prices of established products is typical for semiconductor products. We attempt to offset this deterioration with ongoing cost reduction activities and new product introductions. Our specialty passive components are more resistant to average selling price erosion. All pricing is subject to governing market conditions and is independently set by us.
35

The quarter-to-quarter trends in these financial metrics can also be an important indicator of the likely direction of our business. The following table shows net revenues, gross profit margin, operating margin, end-of-period backlog, book-to-bill ratio, inventory turnover, and changes in ASP for our business as a whole during the five fiscal quarters beginning with the second fiscal quarter of 2016 through the second fiscal quarter of 2017 (dollars in thousands):
(1) Operating margin for the second, third, and fourth fiscal quarters of 2016 and the first and second fiscal quarters of 2017 includes $4.5 million, $1.2 million, $7.1 million, $1.5 million, and $0.5 million, respectively, of restructuring and severance expenses (see Note 2 to our consolidated condensed financial statements). Operating margin for the third fiscal quarter of 2016 includes $1.6 million of indefinite-lived intangible assets impairment charges.
See "Financial Metrics by Segment" below for net revenues, book-to-bill ratio, and gross profit margin broken out by segment. Revenues increased versus the prior fiscal quarter and second fiscal quarter of 2016. The continued strong demand substantially increased the backlog while the book-to-bill ratio across all segments remained high. Distributors, particularly in Europe and Asia, continue to drive the high order rate. The high order rates have increased product delivery leadtimes, especially in our semiconductor product lines, but also in several passive component product lines. Many of our product lines are operating at or near capacity. Our average selling prices continue to decline, although at a slower pace, primarily due to our commodity semiconductor products. Gross profit margin increased versus the prior fiscal quarter and the second fiscal quarter of 2016. The increases are primarily due to volume, the effects of our cost reduction programs, and manufacturing efficiencies, partially offset by decreases in average selling prices. The book-to-bill ratio in the second fiscal quarter of 2017 remained very strong at 1.27 versus 1.29 in the first fiscal quarter of 2017. The book-to-bill ratios in the second fiscal quarter of 2017 for distributors and original equipment manufacturers ("OEM") were 1.43 and 1.06, respectively, versus ratios of 1.43 and 1.11, respectively, during the first fiscal quarter of 2017. For the third fiscal quarter of 2017, we anticipate revenues between $630 million and $670 million and gross margins of 26% to 28%.
36
2nd Quarter
2016 3rd Quarter
2016 4th Quarter
2016 1st Quarter
2017 2nd Quarter
2017 Net revenues $ 590,051 $ 591,955 $ 570,819 $ 606,258 $ 644,892 Gross profit margin 24.8% 26.0% 23.2% 26.5% 26.8% Operating margin (1) 8.4% 9.7% -8.0% 10.7% 12.7% End-of-period backlog $ 579,800 $ 608,100 $ 653,400 $ 836,500 $ 1,034,000 Book-to-bill ratio 1.02 1.04 1.11 1.29 1.27 Inventory turnover 4.20 4.20 4.40 4.50 4.60 Change in ASP vs. prior quarter -0.7% -0.9% -1.2% -1.3% -0.7%

Financial Metrics by Segment The following table shows net revenues, book-to-bill ratio, gross profit margin, and segment operating margin broken out by segment for the five fiscal quarters beginning with the second fiscal quarter of 2016 through the second fiscal quarter of 2017 (dollars in thousands):
37
2nd Quarter
2016 3rd Quarter
2016 4th Quarter
2016 1st Quarter
2017 2nd Quarter
2017 MOSFETs Net revenues $ 102,219 $ 101,687 $ 101,497 $ 105,529 $ 114,035 Book-to-bill ratio 0.94 1.03 1.14 1.37 1.37 Gross profit margin 11.6% 16.2% 17.0% 19.6% 22.2% Segment operating margin 2.5% 7.4% 9.4% 11.1% 14.6% Diodes Net revenues $ 142,118 $ 141,127 $ 135,291 $ 144,895 $ 155,717 Book-to-bill ratio 1.02 1.06 1.22 1.44 1.41 Gross profit margin 26.2% 25.8% 21.1% 25.9% 26.4% Segment operating margin 22.2% 22.6% 17.7% 22.6% 23.2% Optoelectronic Components Net revenues $ 68,059 $ 72,801 $ 68,491 $ 65,682 $ 73,838 Book-to-bill ratio 1.15 0.98 0.99 1.16 1.11 Gross profit margin 31.8% 33.3% 32.1% 34.0% 34.5% Segment operating margin 23.3% 27.9% 25.9% 25.8% 29.1% Resistors & Inductors Net revenues $ 192,799 $ 192,041 $ 185,503 $ 200,383 $ 209,182 Book-to-bill ratio 1.02 0.99 1.08 1.22 1.23 Gross profit margin 29.7% 30.6% 27.5% 30.5% 29.7% Segment operating margin 25.2% 27.0% 23.7% 26.9% 26.1% Capacitors Net revenues $ 84,856 $ 84,299 $ 80,037 $ 89,769 $ 92,120 Book-to-bill ratio 1.03 1.20 1.03 1.25 1.14 Gross profit margin 21.3% 21.3% 17.1% 21.4% 20.6% Segment operating margin 14.9% 15.7% 11.5% 15.8% 15.3%

Acquisition Activity As part of our growth strategy, we seek to expand through targeted acquisitions of other manufacturers of electronic components that have established positions in major markets, reputations for product quality and reliability, and product lines with which we have substantial marketing and technical expertise. This includes exploring opportunities to acquire targets to gain market share, penetrate different geographic markets, enhance new product development, round out our existing product lines, or grow our high margin niche market businesses. Acquisitions of passive components businesses would likely be made to strengthen and broaden our position as a specialty product supplier; acquisitions of discrete semiconductor businesses would be made to increase market share and to generate synergies. To limit our financial exposure, we have implemented a policy not to pursue acquisitions if our post-acquisition debt would exceed 2.5x our pro forma earnings before interest, taxes, depreciation, and amortization ("EBITDA"). For these purposes, we calculate pro forma EBITDA as the adjusted EBITDA of Vishay and the target for Vishay's four preceding fiscal quarters, with a pro forma adjustment for savings which management estimates would have been achieved had the target been acquired by Vishay at the beginning of the four fiscal quarter period. Our growth plan targets adding, through acquisitions, an average of approximately $100 million of revenues per year. Depending on the opportunities available, we might make several smaller acquisitions or a few larger acquisitions. We intend to make such acquisitions using mainly cash, rather than debt or equity, although we do have capacity on our revolving credit facility if necessary. We are not currently targeting acquisitions with a purchase price larger than $500 million. There is no assurance that we will be able to identify and acquire suitable acquisition candidates at price levels and on terms and conditions we consider acceptable.
38
Cost Management We place a strong emphasis on controlling our costs, and use various measures and metrics to evaluate our cost structure. We define variable costs as expenses that vary with respect to quantity produced. Fixed costs do not vary with respect to quantity produced over the relevant time period. Contributive margin is calculated as net revenue less variable costs. It may be expressed in dollars or as a percentage of net revenue. Management uses this measure to determine the amount of profit to be expected for any change in revenues. While these measures are typical cost accounting measures, none of these measures are recognized in accordance with GAAP. The classification of expenses as either variable or fixed is judgmental and other companies might classify such expenses differently. These measures, as calculated by Vishay, may not be comparable to similarly titled measures used by other companies. We closely monitor variable costs and seek to achieve the contributive margin in our business model. Over a period of many years, we have generally maintained a contributive margin of between 45% - 47% of revenues. The erosion of average selling prices, particularly of our semiconductor products, that is typical of our industry and inflation negatively impact contributive margin and drive us to continually seek ways to reduce our variable costs. Our variable cost reduction efforts include increasing the efficiency in our production facilities by expending capital for automation, reducing materials costs, materials substitution, increasing wafer size and shrinking dies to maximize efficiency in our semiconductor production processes, and other yield improvement activities. Our cost management strategy also includes a focus on controlling fixed costs recorded as costs of products sold or selling, general, and administrative expenses and maintaining our break-even point (adjusted for acquisitions). We seek to limit increases in selling, general, and administrative expenses to the rate of inflation, excluding foreign currency exchange effects and substantially independent of sales volume changes. At constant fixed costs, we would expect each $1 million increase in revenues to increase our operating income by approximately $450,000 to $470,000. Sudden changes in the business conditions, however, may not allow us to quickly adapt our manufacturing capacity and cost structure. Occasionally, our ongoing cost containment activities are not adequate and we must take actions to maintain our cost competitiveness. We incurred significant restructuring expenses in our past to reduce our cost structure. Historically, our primary cost reduction technique was through the transfer of production to the extent possible from high-labor-cost countries to lower-labor-cost countries. We believe that our manufacturing footprint is suitable to serve our customers and end markets, while maintaining lower manufacturing costs. Since 2013, our cost reduction programs have primarily focused on reducing fixed costs, including selling, general, and administrative expenses. In the fourth fiscal quarter of 2013, we announced various cost reduction programs as part of our continuous efforts to improve efficiency and operating performance. The programs initiated in 2013 primarily focused on a plan to enhance the competitiveness of our MOSFETs segment and a voluntary separation / early retirement offer to certain employees Company-wide. We also implemented two other smaller cost reduction programs concerning the manufacturing of products within our Diodes segment. The voluntary separation / early retirement and Diodes segment programs were substantially completed in 2014. We completed the initially planned production transfer as part of the MOSFETs Enhanced Competitiveness Program in the first fiscal quarter of 2016. The production transfer occurred over a period of approximately two years. The manufacture of wafers for certain critical products has been transferred into a more cost-efficient fab. As a consequence, certain other wafer manufacturing previously occurring in-house has been transferred to third-party foundries. We have incurred and may continue to incur other exit costs associated with the production transfer, including certain contract termination costs.
39
The initially-planned production transfer achieved the expected improvement in contributive margin percentage and fixed cost reduction; however, as a result of a decrease in net revenues since the plan was first initiated, gross margin for the MOSFETs segment remained below 20%. As a result of a review of the financial results and outlook for the MOSFETs segment following the completion of production transfers, we determined to implement further cost reductions for the MOSFETs segment. In November 2016, we announced an extension of the MOSFETs Enhanced Competitiveness Program. The extended program includes various cost reduction initiatives, primarily the transfer of all remaining manufacturing operations at our Santa Clara, California facility to other Vishay facilities or third-party subcontractors. The production transfers will be completed in steps by the end of 2017. We expect to incur cash charges of approximately $4 million to $8 million, primarily related to severance, to implement these steps. We expect to realize annualized savings of approximately $8 million to $9 million as a result of these initiatives. We expect to maintain our R&D and management presence in the Silicon Valley area, even after the cessation of manufacturing operations there. The total cash charges for the MOSFETs Enhanced Competitiveness Program are expected to be $24 million to $27 million. We recorded $0.4 million of restructuring and severance expenses in the first six fiscal months of 2017 for the expenses that were recognizable under GAAP during the period and $23.9 million of restructuring and severance expenses since the MOSFETs Enhanced Competitiveness Program was implemented. As a result of our cost reduction activities in our MOSFETs segment, we have established a solid and competitive cost basis for future growth. Segment gross margin improved to 22.2% in the second fiscal quarter of 2017 (which also reflects higher revenues). Programs were also initiated in 2015. The programs initiated in 2015 include a plan to reduce selling, general, and administrative costs company-wide, and targeted streamlining and consolidation of production for certain product lines within our Capacitors and Resistors & Inductors segments. The programs in total are expected to lower costs by approximately $35 million annually (at current volumes) when fully implemented, at expected cash costs of approximately $30 million. The implementation of these programs will not impact planned R&D activities, or our growth initiatives in Asian markets. We recorded $0.5 million of restructuring and severance expenses in the second fiscal quarter of 2017 for expenses that were recognizable under GAAP during the period and $25.2 million of restructuring and severance expenses since these programs were initiated. The remaining expenses associated with these programs will be recorded as they become recognizable under GAAP. The programs announced in 2015 are expected to reduce selling, general, and administrative costs by approximately $17 million annually. These selling, general, and administrative cost reductions were substantially implemented by the end of 2016. We first solicited volunteers to accept a voluntary separation / early retirement offer. The voluntary separation benefits vary by country and job classification, but generally offer a cash loyalty bonus. Additional involuntary terminations were necessary to achieve the cost reduction targets. We began to realize cost savings as a result of these programs in 2016. The targeted plans to streamline and consolidate production of certain product lines are expected to decrease costs of products sold by approximately $18 million annually (at current volumes). These plans include the Zwolle, Netherlands aluminum capacitors facility closure announced on June 30, 2015. Except for the Zwolle and Santa Clara facilities described above, no other facility closures are currently expected pursuant to these programs. Except for the distinct and targeted programs noted above, we do not anticipate any other material restructuring activities in 2017. We believe that we can substantially maintain our trained workforce, even at lower manufacturing activity levels, by reducing hours and limiting the use of subcontractors and foundries. However, a sluggish business environment for the electronics industry or the recurrence of a significant economic downturn may require us to implement additional restructuring initiatives. Our long-term strategy includes growth through the integration of acquired businesses, and GAAP requires plant closure and employee termination costs that we incur in connection with our acquisition activities to be recorded as expenses in our consolidated statement of operations, as such expenses are incurred. We have not incurred any material plant closure or employee termination costs related to any of the businesses acquired since 2011, but we expect to have some level of future restructuring expenses due to acquisitions. Even as we seek to manage our costs, we continue to pursue our growth plans through investing in capacities for strategic product lines, and through increasing our resources for R&D, technical marketing, and field application engineering; supplemented by opportunistic acquisitions of specialty businesses.
40

Foreign Currency Translation We are exposed to foreign currency exchange rate risks, particularly due to transactions in currencies other than the functional currencies of certain subsidiaries. We occasionally use forward exchange contracts to economically hedge a portion of these exposures. GAAP requires that we identify the "functional currency" of each of our subsidiaries and measure all elements of the financial statements in that functional currency. A subsidiary's functional currency is the currency of the primary economic environment in which it operates. In cases where a subsidiary is relatively self-contained within a particular country, the local currency is generally deemed to be the functional currency. However, a foreign subsidiary that is a direct and integral component or extension of the parent company's operations generally would have the parent company's currency as its functional currency. We have both situations among our subsidiaries. Foreign Subsidiaries which use the Local Currency as the Functional Currency We finance our operations in Europe and certain locations in Asia in local currencies, and accordingly, these subsidiaries utilize the local currency as their functional currency. For those subsidiaries where the local currency is the functional currency, assets and liabilities in the consolidated condensed balance sheets have been translated at the rate of exchange as of the balance sheet date. Translation adjustments do not impact the results of operations and are reported as a separate component of stockholders' equity. For those subsidiaries where the local currency is the functional currency, revenues and expenses incurred in the local currency are translated at the average exchange rate for the year. While the translation of revenues and expenses incurred in the local currency into U.S. dollars does not directly impact the statements of operations, the translation effectively increases or decreases the U.S. dollar equivalent of revenues generated and expenses incurred in those foreign currencies. The dollar generally was weaker during the second fiscal quarter of 2017 compared to the prior quarter, with the translation of foreign currency revenues and expenses into U.S. dollars increasing reported revenues and expenses versus the prior quarter, but stronger compared to the prior year quarter, with the translation of foreign currency revenues and expenses into U.S. dollars decreasing reported revenues and expenses versus the prior year quarter. Foreign Subsidiaries which use the U.S. Dollar as the Functional Currency Our operations in Israel and most significant locations in Asia are largely financed in U.S. dollars, and accordingly, these subsidiaries utilize the U.S. dollar as their functional currency. For those foreign subsidiaries where the U.S. dollar is the functional currency, all foreign currency financial statement amounts are remeasured into U.S. dollars. Exchange gains and losses arising from remeasurement of foreign currency-denominated monetary assets and liabilities are included in the results of operations. While these subsidiaries transact most business in U.S. dollars, they may have significant costs, particularly payroll-related, which are incurred in the local currency. The cost of products sold and selling, general, and administrative expense for the second fiscal quarter of 2017 have been unfavorably impacted (compared to the prior quarter) by local currency transactions of subsidiaries which use the U.S. dollar as their functional currency and favorably impacted (compared to the prior year quarter) by local currency transactions of subsidiaries which use the U.S. dollar as their functional currency. We enter into forward contracts with highly-rated financial institutions to mitigate the foreign currency risk associated with intercompany loans denominated in a currency other than the legal entity's functional currency. The notional amount of the forward contracts was $105.6 million as of July 1, 2017. The forward contracts are short-term in nature and are expected to be renewed at our discretion until the intercompany loans are repaid. The forward contracts are carried at fair value in our consolidated condensed balance sheets. We have not designated the forward contracts as hedges for accounting purposes, and as such the change in the fair value of the contracts is recognized in our consolidated condensed statements of operations as a component of other income (expense). We do not utilize derivatives or other financial instruments for trading or other speculative purposes.
41

Results of Operations Statements of operations' captions as a percentage of net revenues and the effective tax rates were as follows:
Net Revenues Net revenues were as follows (dollars in thousands):
The change in net revenues versus the comparable prior periods was as follows (dollars in thousands):
Changes in net revenues were attributable to the following:
We experienced a substantial, broad-based increase in demand for our products in the first fiscal quarter of 2017, which continued in the second fiscal quarter of 2017 and resulted in increased net revenues compared to the prior fiscal quarter and prior year periods. We deduct, from the sales that we record to distributors, allowances for future credits that we expect to provide for returns, scrapped product, and price adjustments under various programs made available to the distributors. We make deductions corresponding to particular sales in the period in which the sales are made, although the corresponding credits may not be issued until future periods. We estimate the deductions based on sales levels to distributors, inventory levels at the distributors, current and projected market trends and conditions, recent and historical activity under the relevant programs, changes in program policies, and open requests for credits. We recorded deductions from gross revenues under our distributor incentive programs of $23.3 million, $21.5 million, and $20.0 million for the fiscal quarters ended July 1, 2017, April 1, 2017, and July 2, 2016, respectively, or 3.5%, 3.4%, and 3.3% of gross revenues, respectively. Actual credits issued under the programs during the fiscal quarters ended July 1, 2017, April 1, 2017 and July 2, 2016 were $20.1 million, $23.4 million, and $14.7 million, respectively. We recorded deductions from gross revenues under our distributor incentive programs of $44.8 million and $41.9 million for the six fiscal months ended July 1, 2017 and July 2, 2016, respectively, or 3.5% and 3.5% of gross revenues, respectively. Actual credits issued under the programs during the six fiscal months ended July 1, 2017 and July 2, 2016 were $43.5 million and $41.2 million, respectively. Increases and decreases in these incentives are largely attributable to the then-current business climate. Gross Profit and Margins Gross profit margins for the fiscal quarter ended July 1, 2017 were 26.8%, versus 26.5% and 24.8%, for the comparable prior quarter and prior year period, respectively. Gross profit margins for the six fiscal months ended July 1, 2017 were 26.7%, versus 24.4% for the comparable prior year period. The increase is due primarily to increased sales volume. We were able to offset the negative impacts of inflation and average selling price decline by cost reductions and innovation, and maintain our contributive margin.
42
Fiscal quarters ended Six fiscal months ended July 1, 2017 April 1, 2017 July 2, 2016 July 1, 2017 July 2, 2016 Cost of products sold 73.2% 73.5% 75.2% 73.3% 75.6%Gross profit 26.8% 26.5% 24.8% 26.7% 24.4%Selling, general & administrative expenses 14.0% 15.6% 15.6% 14.8% 15.7%Operating income (loss) 12.7% 10.7% 8.4% 11.7% 7.8%Income (loss) before taxes and noncontrolling interest 11.7% 8.3% 7.9% 10.1% 7.3%Net earnings (loss) attributable to Vishay stockholders 8.7% 6.1% 5.6% 7.4% 5.3%________ Effective tax rate 25.5% 26.7% 28.4% 26.0% 27.7%
Fiscal quarters ended Six fiscal months ended July 1, 2017 April 1, 2017 July 2, 2016 July 1, 2017 July 2, 2016 Net revenues $ 644,892 $ 606,258 $ 590,051 $ 1,251,150 $ 1,160,657
Fiscal quarter ended July 1, 2017
Six fiscal months ended July 1, 2017
Change in net revenues % change
Change in net revenues % change
April 1, 2017 $ 38,634 6.4% July 2, 2016 $ 54,841 9.3% $ 90,493 7.8%
vs. Prior Quarter
vs. Prior Year Quarter
vs. Prior Year-to-Date
Change attributable to: Change in volume 6.0% 14.0% 12.6%Decrease in average selling prices -0.7% -2.8% -2.9%Foreign currency effects 1.0% -1.0% -1.0%Other 0.1% -0.9% -0.9%Net change 6.4% 9.3% 7.8%

Segments Analysis of revenues and gross profit margins for our segments is provided below. MOSFETs Net revenues and gross profit margin of the MOSFETs segment were as follows (dollars in thousands):
The change in net revenues versus the comparable prior periods was as follows (dollars in thousands):
Changes in MOSFETs segment net revenues were attributable to the following:
In the fiscal quarter and six fiscal months ended July 1, 2017, the MOSFETs segment achieved significant growth in net revenues versus the corresponding prior year periods. The significant increase in volume, especially with Asian end customers and also Asian and European distributors, was only partially offset by declining average selling prices and other negative factors. The significant growth versus the prior fiscal quarter was mainly achieved with Asian distributors. Our IC products business contributed strongly to the growth. The gross profit margin for the second fiscal quarter and first six fiscal months of 2017 was significantly higher than the prior year periods. The increases are primarily attributable to the revenue growth and the implemented cost reduction program (see below), which exceeded the impact from lower average selling prices and cost inflation. The prior year periods were also burdened by the recognition of fixed costs in inventory produced in 2015 due to the restructuring program and sold in the second fiscal quarter of 2016. The increase of the gross profit margin versus the prior quarter is primarily due to higher volume. The friendly business climate led to slightly lower pricing pressure in the second fiscal quarter 2017 for our established MOSFETs products. We have experienced a slight decline in average selling prices versus the prior quarter and a moderate decline versus the prior year periods. In 2013, we announced a cost reduction program to enhance the competitiveness of our MOSFETs segment. The planned production transfers were substantially implemented by the end of the first fiscal quarter of 2016 and began to provide improvement in the third fiscal quarter of 2016. As a result of a review of the financial results and outlook for the MOSFETs segment following the completion of production transfers, we have determined to implement further cost reductions. In November 2016, we announced an extension of the MOSFETs Enhanced Competitiveness Program. The revised program includes various cost reduction initiatives, primarily the transfer of all remaining manufacturing operations at our Santa Clara, California facility to other Vishay facilities or third-party subcontractors. We expect to maintain our R&D and management presence in the Silicon Valley area, even after the cessation of manufacturing operations there. The production transfers will be completed in steps by the end of 2017. We expect to incur cash charges of approximately $4 to $8 million, primarily related to severance, to implement these steps, and expect to realize annualized cost savings of approximately $8 to $9 million as a result of these new initiatives. See "Cost Management" above and Note 2 to our consolidated condensed financial statements. We continue to make capital and R&D investments in this business.
43
Fiscal quarters ended Six fiscal months ended July 1, 2017 April 1, 2017 July 2, 2016 July 1, 2017 July 2, 2016 Net revenues $ 114,035 $ 105,529 $ 102,219 $ 219,564 $ 203,152 Gross profit margin 22.2% 19.6% 11.6% 20.9% 12.0%
Fiscal quarter ended July 1, 2017
Six fiscal months ended July 1, 2017
Change in net revenues % change
Change in net revenues % change
April 1, 2017 $ 8,506 8.1% July 2, 2016 $ 11,816 11.6% $ 16,412 8.1%
vs. Prior Quarter
vs. Prior Year Quarter
vs. Prior Year-to-Date
Change attributable to: Change in volume 8.2% 15.6% 13.8%Decrease in average selling prices -0.5% -2.7% -4.1%Foreign currency effects 0.4% -0.4% -0.4%Other 0.0% -0.9% -1.2%Net change 8.1% 11.6% 8.1%

Diodes Net revenues and gross profit margin of the Diodes segment were as follows (dollars in thousands):
The change in net revenues versus the comparable prior periods was as follows (dollars in thousands):
Changes in Diodes segment net revenues were attributable to the following:
The Diodes segment achieved significant growth in net revenues in the fiscal quarter and six fiscal months ended July 1, 2017 versus the corresponding prior year periods. Significant volume increases, especially in Asia, were only partially offset by declining average selling prices and other negative factors. Significant revenue growth was also achieved versus the prior fiscal quarter primarily due to volume growth, especially with Asian distributors. The gross profit margin increased slightly versus the prior quarter and prior year periods primarily due to volume growth and cost reduction activities, which were partially offset by declining average selling prices and cost inflation. Typical pricing pressure for our established Diodes products continues. We have experienced a slight decline versus the prior fiscal quarter and a moderate price decline versus the prior year periods.
44
Fiscal quarters ended Six fiscal months ended July 1, 2017 April 1, 2017 July 2, 2016 July 1, 2017 July 2, 2016 Net revenues $ 155,717 $ 144,895 $ 142,118 $ 300,612 $ 277,502 Gross profit margin 26.4% 25.9% 26.2% 26.2% 25.2%
Fiscal quarter ended July 1, 2017
Six fiscal months ended July 1, 2017
Change in net revenues % change
Change in net revenues % change
April 1, 2017 $ 10,822 7.5% July 2, 2016 $ 13,599 9.6% $ 23,110 8.3%
vs. Prior Quarter
vs. Prior Year Quarter
vs. Prior Year-to-Date
Change attributable to: Change in volume 7.2% 14.9% 13.7%Decrease in average selling prices -0.5% -3.4% -3.5%Foreign currency effects 0.8% -0.8% -0.8%Other 0.0% -1.1% -1.1%Net change 7.5% 9.6% 8.3%

Optoelectronic Components Net revenues and gross profit margin of the Optoelectronic Components segment were as follows (dollars in thousands):
The change in net revenues versus the comparable prior periods was as follows (dollars in thousands):
Changes in Optoelectronic Components segment net revenues were attributable to the following:
In the fiscal quarter and six fiscal months ended July 1, 2017, the Optoelectronic Components segment achieved significant growth in net revenues versus the corresponding prior year periods. The volume increases, especially with distributors in all regions, were only partially offset by declining average selling prices, a decrease in sales of mobile sensor products to Asian end customers, and other negative factors. The significant growth versus the prior fiscal quarter was primarily due to increased sales to distributors. The gross profit margin increased slightly versus the fiscal quarter ended July 2, 2016 and moderately versus the six fiscal months ended July 2, 2016. The significant volume increase and a more profitable sales mix, were partially offset by lower average selling prices and cost inflation. Gross profit margin increased slightly versus the prior fiscal quarter primarily due to an increase in volume. The pricing pressure for our established Optoelectronic Components products continues. We have experienced a slight decline versus the prior fiscal quarter and a moderate price decline versus the prior year periods.
45
Fiscal quarters ended Six fiscal months ended July 1, 2017 April 1, 2017 July 2, 2016 July 1, 2017 July 2, 2016 Net revenues $ 73,838 $ 65,682 $ 68,059 $ 139,520 $ 130,834 Gross profit margin 34.5% 34.0% 31.8% 34.2% 31.2%
Fiscal quarter ended July 1, 2017
Six fiscal months ended July 1, 2017
Change in net revenues % change
Change in net revenues % change
April 1, 2017 $ 8,156 12.4% July 2, 2016 $ 5,779 8.5% $ 8,686 6.6%
vs. Prior Quarter
vs. Prior Year Quarter
vs. Prior Year-to-Date
Change attributable to: Change in volume 12.6% 15.3% 12.0%Decrease in average selling prices -1.2% -4.4% -3.4%Foreign currency effects 1.2% -0.9% -1.0%Other -0.2% -1.5% -1.0%Net change 12.4% 8.5% 6.6%

Resistors & Inductors Net revenues and gross profit margin of the Resistors & Inductors segment were as follows (dollars in thousands):
The change in net revenues versus the comparable prior periods was as follows (dollars in thousands):
Changes in Resistors & Inductors segment net revenues were attributable to the following:
Net revenues of the Resistors & Inductors segment increased moderately versus the prior fiscal quarter and significantly versus the prior year periods. All regions experienced significant growth in net revenues versus the prior quarter and prior year periods, with Asia experiencing the largest increase. Distribution and the industrial and automotive end-markets contributed the most to the revenue increase. The gross profit margin of the Resistors & Inductors segment remained stable versus the prior year periods and declined slightly versus the prior fiscal quarter. Average selling price reduction and inflationary elements were partially offset by the benefits of the cost reduction program. Foreign currency effects had an unfavorable impact on gross profit margin compared to the prior year periods. Average selling prices declined slightly versus the prior fiscal quarter and prior year periods, consistent with historical performance. Capital spending projects are underway in response to the increased market demand for certain product lines. In 2015, we announced global cost reduction programs which include targeted plans to streamline and consolidate certain product lines, including within our Resistors & Inductors segment. See "Cost Management" above and Note 2 to our consolidated condensed financial statements.
46
Fiscal quarters ended Six fiscal months ended July 1, 2017 April 1, 2017 July 2, 2016 July 1, 2017 July 2, 2016 Net revenues $ 209,182 $ 200,383 $ 192,799 $ 409,565 $ 376,293 Gross profit margin 29.7% 30.5% 29.7% 30.1% 30.0%
Fiscal quarter ended July 1, 2017
Six fiscal months ended July 1, 2017
Change in net revenues % change
Change in net revenues % change
April 1, 2017 $ 8,799 4.4% July 2, 2016 $ 16,383 8.5% $ 33,272 8.8%
vs. Prior Quarter
vs. Prior Year Quarter
vs. Prior Year-to-Date
Change attributable to: Change in volume 3.6% 12.8% 13.5%Decrease in average selling prices -0.4% -2.2% -2.4%Foreign currency effects 1.2% -1.2% -1.4%Other 0.0% -0.9% -0.9%Net change 4.4% 8.5% 8.8%

Capacitors Net revenues and gross profit margin of the Capacitors segment were as follows (dollars in thousands):
The change in net revenues versus the comparable prior periods was as follows (dollars in thousands):
Changes in Capacitors segment net revenues were attributable to the following:
Net revenues of the Capacitors segment for the fiscal quarter and six fiscal months ended July 1, 2017 have increased slightly versus the prior fiscal quarter and significantly versus the prior year periods. Net revenues were particularly strong in the Europe and Americas regions. Region Asia reported an increase in net revenues versus the prior year periods, but a slight decrease versus the prior fiscal quarter. Distribution experienced a significant increase in net revenues. The industrial and automotive end-markets remained stable. The gross profit margin decreased slightly versus prior fiscal quarter and prior year fiscal quarter. Cost savings could not offset the inflationary effects and decreased average selling prices. In addition, there was upward price pressure for certain metals, which unfavorably impacts gross profit margin. Average selling prices decreased slightly versus the prior fiscal quarter and the prior year periods. Capital spending projects are underway in response to the increased market demand for certain product lines. In 2015, we announced global cost reduction programs which include targeted plans to streamline and consolidate certain product lines, including within our Capacitors segment. See "Cost Management" above and Note 2 to our consolidated condensed financial statements.
47
Fiscal quarters ended Six fiscal months ended July 1, 2017 April 1, 2017 July 2, 2016 July 1, 2017 July 2, 2016 Net revenues $ 92,120 $ 89,769 $ 84,856 $ 181,889 $ 172,876 Gross profit margin 20.6% 21.4% 21.3% 21.0% 20.4%
Fiscal quarter ended July 1, 2017
Six fiscal months ended July 1, 2017
Change in net revenues % change
Change in net revenues % change
April 1, 2017 $ 2,351 2.6% July 2, 2016 $ 7,264 8.6% $ 9,013 5.2%
vs. Prior Quarter
vs. Prior Year Quarter
vs. Prior Year-to-Date
Change attributable to: Change in volume 2.5% 12.3% 8.5%Decrease in average selling prices -1.2% -1.9% -1.5%Foreign currency effects 1.4% -1.2% -1.4%Other -0.1% -0.6% -0.4%Net change 2.6% 8.6% 5.2%

Selling, General, and Administrative Expenses Selling, general, and administrative ("SG&A") expenses are summarized as follows (dollars in thousands):
SG&A expenses for the second fiscal quarter were better than expected. The overall decrease in SG&A expenses versus the prior quarter and prior year quarter is primarily attributable to the benefits of our restructuring programs (see "Cost Management" above) and lower amortization expense (see below), partially offset by general salary and cost inflation. The decrease in SG&A expenses as a percentage of revenues is primarily attributable to higher revenues. Certain items included in SG&A expenses impact the comparability of these amounts, as summarized below (in thousands):
Certain intangible assets became fully amortized in the second fiscal quarter of 2017. In September 2016, we began to amortize our Siliconix tradenames, which were previously considered indefinite-lived, over their estimated remaining useful life of 10 years. In 2013 and 2015, we announced restructuring programs targeting SG&A expenses. See "Cost Management" above. Other Income (Expense) Interest expense for the fiscal quarter ended July 1, 2017 increased $0.3 million and $0.8 million versus the fiscal quarters ended April 1, 2017 and July 2, 2016, respectively. Interest expense for the six fiscal months ended July 1, 2017 increased by $1.1 million versus the six fiscal months ended July 2, 2016. The increases are primarily attributable to higher average outstanding balances and slightly higher interest rates on our revolving credit facility in the fiscal quarter and six fiscal months ended July 1, 2017. The following tables analyze the components of the line "Other" on the consolidated condensed statements of operations (in thousands):
48
Fiscal quarters ended Six fiscal months ended July 1, 2017 April 1, 2017 July 2, 2016 July 1, 2017 July 2, 2016 Total SG&A expenses $ 90,446 $ 94,718 $ 92,253 $ 185,164 $ 182,539
as a percentage of revenues 14.0% 15.6% 15.6% 14.8% 15.7%
Fiscal quarters ended Six fiscal months ended July 1, 2017 April 1, 2017 July 2, 2016 July 1, 2017 July 2, 2016 Amortization of intangible assets $ 3,430 $ 3,968 $ 3,630 $ 7,398 $ 7,240
Fiscal quarters ended July 1, 2017 April 1, 2017 Change Foreign exchange gain (loss) $ (760) $ (1,661) $ 901 Interest income 1,534 1,263 271 Other (25) 2 (27) $ 749 $ (396) $ 1,145
Fiscal quarters ended July 1, 2017 July 2, 2016 Change Foreign exchange gain (loss) $ (760) $ 1,246 $ (2,006) Interest income 1,534 1,034 500 Other (25) (24) (1) $ 749 $ 2,256 $ (1,507)
Six fiscal months ended July 1, 2017 July 2, 2016 Change Foreign exchange gain (loss) $ (2,421) $ 919 $ (3,340) Interest income 2,797 2,167 630 Other (23) (51) 28 $ 353 $ 3,035 $ (2,682)

Income Taxes For the fiscal quarter ended July 1, 2017, our effective tax rate was 25.5%, as compared to 26.7% and 28.4% for the fiscal quarters ended April 1, 2017 and July 2, 2016, respectively. For the six fiscal months ended July 1, 2017, our effective tax rate was 26.0%, as compared to 27.7% for the six fiscal months ended July 2, 2016. The effective tax rate is generally less than the U.S. statutory rate primarily because of earnings in foreign jurisdictions. Income tax expense for the fiscal quarter and six fiscal months ended July 1, 2017 includes $1.2 million and $2.2 million, respectively, for the remeasurement of the deferred tax liability recorded for the cash repatriation program announced in the fourth fiscal quarter of 2015. The cash repatriation program is expected to occur over several years, and the deferred tax liability is based on the available sources of cash, applicable tax rates, and other factors and circumstances, as of each respective balance sheet date. Changes in the underlying facts and circumstances result in changes in the deferred tax liability balance, which are recorded as tax benefit or expense. During the second fiscal quarter of 2017, we repatriated $38.0 million pursuant to this program. We operate in a global environment with significant operations in various jurisdictions outside the United States. Accordingly, our consolidated income tax rate is a composite rate reflecting our earnings and the applicable tax rates in the various jurisdictions where we operate. Part of our strategy is to achieve cost savings by operating in countries where we can take advantage of lower labor costs and available tax and other government-sponsored incentives. Accordingly, our effective tax rate is generally less than the U.S. statutory tax rate. Changes in our effective tax rate are largely attributable to changes in the mix of pretax income among our various taxing jurisdictions. During the six fiscal months ended July 1, 2017, the liabilities for unrecognized tax benefits decreased by $2.2 million on a net basis, principally due to payments and settlements, partially offset by increases for tax positions taken in prior periods, interest, and foreign currency effects.
49

Financial Condition, Liquidity, and Capital Resources We focus on our ability to generate cash flows from operations. The cash generated from operations is used to fund our capital expenditure plans, and cash in excess of our capital expenditure needs is available to fund our acquisition strategy, to reduce debt levels, and to pay dividends and repurchase stock. We have generated cash flows from operations in excess of $200 million in each of the past 15 years, and cash flows from operations in excess of $100 million in each of the past 22 years. Management uses a non-GAAP measure, "free cash," to evaluate our ability to fund acquisitions, repay debt, and otherwise enhance stockholder value through stock repurchases or dividends. See "Overview" above for "free cash" definition and reconciliation to GAAP. Vishay has generated positive "free cash" in each of the past 20 years, and "free cash" in excess of $80 million in each of the past 15 years. In this volatile economic environment, we continue to focus on the generation of free cash, including an emphasis on cost controls. We continued to generate positive cash flows from operations and free cash during the fiscal quarter ended July 1, 2017. We expect to generate free cash in 2017 in line with our history. There is no assurance, however, that we will be able to continue to generate cash flows from operations and free cash at the same levels, or at all, going forward if the current economic environment worsens. Beginning in the fourth fiscal quarter of 2010, we have reacted to favorable market conditions to significantly reshape the company's capital structure. We have completed three issuances of low-coupon convertible debentures since the fourth fiscal quarter of 2010, each of which matures thirty years from the date of issuance. We utilized the proceeds of those debenture offerings to repurchase approximately 24% of our outstanding stock prior to implementing these initiatives. On May 2, 2016, our Board of Directors approved a stock repurchase plan, authorizing us to repurchase, in the aggregate, up to $100 million of our outstanding common stock. The stock repurchase plan expired on May 2, 2017. We repurchased 1,752,454 shares of stock for $23.2 million pursuant to the plan, all of which occurred in 2016. On August 2, 2017, our Board of Directors approved a stock repurchase plan, authorizing us to repurchase, in the aggregate, up to $150 million of our outstanding common stock. The stock repurchase plan will expire on June 1, 2018. The stock repurchase plan does not obligate us to acquire any particular amount of common stock, and it may be terminated or suspended at any time at the Company's direction in accordance with the plan. The Company has not repurchased any stock since the inception of this plan. In 2016, we acquired, in two privately negotiated transactions, all of the outstanding exchangeable notes due 2102. The total purchase price for the two transactions was $34.0 million. The exchangeable unsecured notes were issued in 2002 in connection with an acquisition, and were subject to a put and call agreement dated December 13, 2002. The repurchased notes had been exchangeable for approximately 2.5 million shares of our common stock. We also entered into a new, larger, revolving credit facility in 2010, which was amended and restated on August 8, 2013, and further amended and restated on December 10, 2015. The amended and restated credit facility provides an aggregate commitment of $640 million of revolving loans available until December 10, 2020, and we have the ability to request up to $50 million of incremental revolving commitments, subject to the satisfaction of certain conditions. The previous credit agreement was scheduled to mature on August 8, 2018. At July 1, 2017 and December 31, 2016, $133 million and $143 million, respectively, were outstanding under our credit facility. The amended and restated credit facility allows an unlimited amount of defined "Restricted Payments," which include cash dividends to stockholders and share repurchases, provided our pro forma leverage ratio is less than 2.25 to 1. If our leverage ratio is greater than 2.25 to 1, the credit facility allows such payments up to $75 million per annum (subject to a cap of $225 million for the term of the facility). The amended and restated credit facility provides us with significantly more flexibility to execute these transactions, and our ability to utilize some of our foreign-source income for these types of transactions provides even further financial flexibility. Borrowings under the credit facility bear interest at LIBOR plus an interest margin. The applicable interest margin is based on our leverage ratio. Based on our current leverage ratio, borrowings bear interest at LIBOR plus 1.75%. The interest rate on our borrowings will increase to LIBOR plus 2.00% if our leverage ratio equals or exceeds 2.50 to 1 and will decrease to LIBOR plus 1.50% if our leverage ratio decreases below 1.50 to 1. We also pay a fee, also based on our leverage ratio, on undrawn amounts. The undrawn commitment fee, based on our current leverage ratio, is 0.35% per annum. Such undrawn commitment fee will increase to 0.50% per annum if our leverage ratio equals or exceeds 2.50 to 1 and will decrease to 0.30% per annum if our leverage ratio decreases below 1.50 to 1. Prior to the December 10, 2015 amendment and restatement, the credit agreement required Vishay to pay facility fees on the entire commitment amount. The borrowings under the credit facility are secured by a lien on substantially all assets, including accounts receivable, inventory, machinery and equipment, and general intangibles (but excluding real estate, intellectual property registered or licensed for use in, or arising under the laws of, any country other than the United States, assets located outside of the United States and deposit and securities accounts), of Vishay and certain significant subsidiaries located in the United States, and pledges of stock in certain significant domestic and foreign subsidiaries; and are guaranteed by certain significant subsidiaries. Certain of our subsidiaries are permitted to borrow under the credit facility, subject to the satisfaction of specified conditions. Any borrowings by these subsidiaries under the credit facility will be guaranteed by Vishay and certain subsidiaries. The credit facility also limits or restricts us, from, among other things, incurring indebtedness, incurring liens on assets, making investments and acquisitions, and making asset sales, and making other restricted payments (assuming our leverage ratio is greater than 2.25 to 1), and requires us to comply with other covenants, including the maintenance of specific financial ratios.
50
The financial maintenance covenants include (a) an interest expense coverage ratio of not less than 2.00 to 1; and (b) a leverage ratio of not more than 3.25 to 1 (and a pro forma ratio of 2.75 to 1 on the date of incurrence of additional debt). The computation of these ratios is prescribed in Article VI of the Credit Agreement between Vishay Intertechnology, Inc. and JPMorgan Chase Bank, N.A., which has been filed with the SEC as Exhibit 10.1 to our current report on Form 8-K filed December 10, 2015. We were in compliance with all financial covenants under the credit facility at July 1, 2017. Our interest expense coverage ratio and leverage ratio were 13.95 to 1 and 1.75 to 1, respectively. We expect to continue to be in compliance with these covenants based on current projections. If we are not in compliance with all of the required financial covenants, the credit facility could be terminated by the lenders, and all amounts outstanding pursuant to the credit facility could become immediately payable. Additionally, our convertible senior debentures due 2040, due 2041, and due 2042 have cross-default provisions that could accelerate repayment in the event the indebtedness under the credit facility is accelerated. The balance of our revolving credit facility was $143 million at December 31, 2016. We borrowed $283 million and repaid $293 million on our credit facility during the six fiscal months ended July 1, 2017. The average outstanding balance on our credit facility calculated at fiscal month-ends was $219.7 million and the highest amount outstanding on our credit facility at a month end was $273 million during the six fiscal months ended July 1, 2017. Prior to three months before the maturity date, our convertible senior debentures are convertible by the holders under certain circumstances. The convertible debentures due 2042 became convertible subsequent to the December 31, 2016 evaluation of the conversion criteria, remained convertible subsequent to the April 1, 2017 evaluation, and remain convertible subsequent to the July 1, 2017 evaluation, due to the sale price of our common stock exceeding 130% of the conversion price for the applicable periods in the fourth fiscal quarter of 2016 and the first and second fiscal quarters of 2017. Such debentures will remain convertible until September 30, 2017, at which time the conversion criteria will be reevaluated. At the direction of our Board of Directors, we intend, upon conversion, to repay the principal amount of the convertible debentures in cash and settle any additional amounts in shares of our common stock. We intend to finance the principal amount of any converted debentures using borrowings under our credit facility. Accordingly, the debt component of the convertible debentures due 2042 continues to be classified as a noncurrent liability on the consolidated condensed balance sheets. No conversions have occurred to date. The convertible debentures due 2040 and due 2041 are not currently convertible. Management expects to periodically pay down the balance of our revolving credit facility with available cash or use the credit facility to meet short-term financing needs. We expect that cash on-hand and cash flows from operations will be sufficient to meet our longer-term financing needs related to normal operating requirements, regular dividend payments, and our research and development and capital expenditure plans. Additional acquisition activity, share repurchases, or conversion of our convertible debentures may require additional borrowing under our credit facility or may otherwise require us to incur additional debt. No principal payments on our outstanding debt are due before the maturity of our revolving credit facility in December 2020. As of July 1, 2017, substantially all of our cash and cash equivalents and short-term investments were held in countries outside of the United States. Certain payments, such as cash dividends to stockholders, share repurchases, and interest payments on our debt instruments need to be paid by the U.S. parent company, Vishay Intertechnology, Inc. Our U.S. subsidiaries also have operating cash needs. Our substantially undrawn credit facility provides us with significant liquidity in the United States. As part of the amendment and restatement of the revolving credit facility in December 2015, we completed an evaluation of our anticipated domestic cash needs over the next several years and our most efficient use of liquidity, with consideration of the amount of cash that can be repatriated to the U.S. efficiently with lesser withholding taxes in foreign jurisdictions. As a result of that evaluation, during the fourth quarter of 2015, we recognized income tax expense, including U.S. federal and state income taxes, incremental foreign income taxes, and withholding taxes payable to foreign jurisdictions, on $300 million of foreign earnings which we expect to repatriate to the U.S. over the next several years. We repatriated $38.0 million and $46.0 million pursuant to this program in 2017 and 2016, respectively. We continuously monitor legislative developments in the U.S. and other jurisdictions where we operate, and can adapt our repatriation strategy to the extent necessary or prudent, based on changes in law, tax rates, or other regulations. Except as described above, earnings generated by foreign subsidiaries are expected to be reinvested outside of the United States indefinitely. If additional cash is needed to be repatriated to the United States, in addition to various foreign country laws regulating the exportation of the cash and profits, we would be subject to U.S. income taxes (subject to an adjustment for foreign tax credits), state income taxes, incremental foreign income taxes, and withholding taxes payable to various foreign jurisdictions. We invest a portion of our excess cash in highly liquid, high-quality instruments with maturities greater than 90 days, but less than 1 year, which we classify as short-term investments on our consolidated balance sheets. As these investments were funded using a portion of excess cash and represent a significant aspect of our cash management strategy, we include the investments in the calculation of net cash and short-term investments (debt). The interest rates on our short-term investments vary by location, but can be up to 150 bps higher than the interest rates on our cash accounts. The average interest rate on our short-term investments was 0.5% due to the low interest rate environment in Europe. Transactions related to these investments are classified as investing activities on our consolidated condensed statements of cash flows.
51

The following table summarizes the components of net cash and short-term investments (debt) at July 1, 2017 and December 31, 2016 (in thousands):
*Represents the carrying amount of the convertible debentures, which is comprised of the principal amount of the debentures, net of the unamortized discount and the associated embedded derivative liability.
"Net cash and short-term investments (debt)" does not have a uniform definition and is not recognized in accordance with GAAP. This measure should not be viewed as an alternative to GAAP measures of performance or liquidity. However, management believes that an analysis of "net cash and short-term investments (debt)" assists investors in understanding aspects of our cash and debt management. The measure, as calculated by us, may not be comparable to similarly titled measures used by other companies. Our financial condition as of July 1, 2017 continued to be strong, with a current ratio (current assets to current liabilities) of 4.3 to 1, as compared to 4.1 to 1 as of December 31, 2016. The increase in the ratio is primarily due to increases in accounts receivable, inventory, and cash and cash equivalents. Our ratio of total debt to Vishay stockholders' equity was 0.20 to 1 at July 1, 2017, as compared to 0.23 at December 31, 2016. The decrease in the ratio is primarily due to the decrease in long-term debt and increases in retained earnings (accumulated deficit) and accumulated other comprehensive income (loss). Cash flows provided by operating activities were $128.3 million for the six fiscal months ended July 1, 2017, as compared to cash flows provided by operations of $95.4 million for the six fiscal months ended July 2, 2016. The improvement in operating cash flows reflects an increase in net earnings and favorable other operating activities. Cash flows provided by operating activities for the six fiscal months ended July 1, 2017 and July 2, 2016 were negatively impacted by $4.4 million and $17.0 million, respectively, of cash contributions to our Taiwanese pension plans. Cash paid for property and equipment for the six fiscal months ended July 1, 2017 was $49.1 million, as compared to $51.1 million for the six fiscal months ended July 2, 2016. We expect capital spending of approximately $165 million in 2017. The increase from the beginning of the year is due to advancing expansion projects to satisfy demand in certain product lines. Cash paid for dividends to our common and Class B common stockholders totalled $18.3 million and $18.4 million for the six fiscal months ended July 1, 2017 and July 2, 2016, respectively. We expect dividend payments in 2017 to total approximately $36.5 million. However, any future dividend declaration and payment remains subject to authorization by our Board of Directors.
52
July 1, 2017
December 31, 2016
Credit facility $ 133,000 $ 143,000 Convertible senior debentures, due 2040* 109,291 108,120 Convertible senior debentures, due 2041* 56,072 55,442 Convertible senior debentures, due 2042* 61,956 61,341 Deferred financing costs (9,990) (10,880) Total debt 350,329 357,023 Cash and cash equivalents 561,032 471,781 Short-term investments 626,172 626,627 Net cash and short-term investments (debt) $ 836,875 $ 741,385
Contractual Commitments and Off-Balance Sheet Arrangements Our Annual Report on Form 10-K for the year ended December 31, 2016 filed on February 17, 2017, includes a table of contractual commitments. There were no material changes to these commitments since the filing of our Annual Report on Form 10-K. We do not participate in nor have we created any off-balance sheet variable interest entities or other off-balance sheet financing, other than the operating leases described in our Annual Report on Form 10-K for the year ended December 31, 2016. Dividends In 2014, our Board of Directors approved the initiation of a quarterly cash dividend program. Cash dividends of $0.06 per share of common stock and Class B common stock were paid in each quarter of 2014 and 2015. On February 16, 2016, our Board of Directors increased the quarterly cash dividend to $0.0625 per share of common stock and Class B common stock. We expect to continue to pay quarterly dividends, although each dividend is subject to approval by our Board of Directors. The following table summarizes the quarterly cash dividends declared (in thousands):
Safe Harbor Statement From time to time, information provided by us, including but not limited to statements in this report, or other statements made by or on our behalf, may contain "forward-looking" information within the meaning of the Private Securities Litigation Reform Act of 1995. Words such as "believe," "estimate," "will be," "will," "would," "expect," "anticipate," "plan," "project," "intend," "could," "should," or other similar words or expressions often identify forward-looking statements. Such statements are based on current expectations only, and are subject to certain risks, uncertainties, and assumptions, many of which are beyond our control. Should one or more of these risks or uncertainties materialize, or should underlying assumptions prove incorrect, actual results, performance, or achievements may vary materially from those anticipated, estimated, or projected. Among the factors that could cause actual results to materially differ include: general business and economic conditions; difficulties in identifying suitable acquisition candidates, consummating a transaction on terms which we consider acceptable, and integration and performance of acquired businesses; difficulties in new product development; changes in competition and technology in the markets that we serve and the mix of our products required to address these changes; an inability to attract and retain highly qualified personnel, particularly in respect of our acquired businesses; uncertainty related to the effects of changes in foreign currency exchange rates; delays or difficulties in implementing our cost management strategies; and other factors affecting our operations, markets, products, services, and prices that are set forth in our filings with the SEC, including our annual reports on Form 10-K and our quarterly reports on Form 10-Q. We undertake no obligation to publicly update or revise any forward-looking statements, whether as a result of new information, future events, or otherwise. Our 2016 Annual Report on Form 10-K listed various important factors that could cause actual results to differ materially from projected and historic results. We note these factors for investors as permitted by the Private Securities Litigation Reform Act of 1995. Readers can find them in Part I, Item 1A, of that filing under the heading "Risk Factors." You should understand that it is not possible to predict or identify all such factors. Consequently, you should not consider any such list to be a complete set of all potential risks or uncertainties.
53
Fiscal Period Amount Month of Payment Three fiscal months ended April 1, 2017 $ 9,136 March Three fiscal months ended July 1, 2017 9,141 June

Part II, Item 7A, "Quantitative and Qualitative Disclosures About Market Risk," of our Annual Report on Form 10-K for the year ended December 31, 2016, filed with the SEC on February 17, 2017, describes our exposure to market risks. There have been no material changes to our market risks since December 31, 2016.
Conclusion Regarding the Effectiveness of Disclosure Controls and Procedures An evaluation was performed under the supervision and with the participation of our management, including the Chief Executive Officer ("CEO") and Chief Financial Officer ("CFO"), of the effectiveness of the design and operation of our disclosure controls and procedures, as such term is defined under Rule 13a-15(e) and Rule 15d-15(e) promulgated under the Securities Exchange Act of 1934, as amended (the "Exchange Act"). Based on that evaluation, our CEO and CFO concluded that our disclosure controls and procedures were effective as of the end of the period covered by this quarterly report to ensure that information required to be disclosed in reports that we file or submit under the Exchange Act are: (1) recorded, processed, summarized, and reported within the time periods specified in the SEC's rules and forms; and (2) accumulated and communicated to our management, including our CEO and CFO, as appropriate to allow timely decisions regarding required disclosure. Changes in Internal Control Over Financial Reporting There were no changes in our internal control over financial reporting during the period covered by this report that have materially affected, or are reasonably likely to materially affect, our internal control over financial reporting.
54
Item 3. Quantitative and Qualitative Disclosures About Market Risk
Item 4. Controls and Procedures

PART II - OTHER INFORMATION
Item 3 of Part I of our Annual Report on Form 10-K for the year ended December 31, 2016, filed with the SEC on February 17, 2017, describe certain of our legal proceedings. There have been no material developments to the legal proceedings previously disclosed.
There have been no material changes to the risk factors we previously disclosed under Item 1A of Part I of our Annual Report on Form 10-K for the year ended December 31, 2016, filed with the SEC on February 17, 2017.
Not applicable.
Not applicable.
Not applicable.
Not applicable.
____________
55
Item 1. Legal Proceedings
Item 1A. Risk Factors
Item 2. Unregistered Sales of Equity Securities and Use of Proceeds
Item 3. Defaults Upon Senior Securities
Item 4. Mine Safety Disclosures
Item 5. Other Information
Item 6. Exhibits
10.1 Amended and restated Vishay Intertechnology, Inc. 162(m) Cash Bonus Plan. Incorporated by reference to Annex A to our definitive proxy statement, dated March 31, 2017, for our 2017 Annual Meeting of Stockholders.
31.1 Certification pursuant to Rule 13a-14(a) or 15d-14(a) under the Securities Exchange Act of 1934, as adopted pursuant to Section 302 of the Sarbanes-Oxley Act of 2002 - Dr. Gerald Paul, Chief Executive Officer.
31.2 Certification pursuant to Rule 13a-14(a) or 15d-14(a) under the Securities Exchange Act of 1934, as adopted pursuant to Section 302 of the Sarbanes-Oxley Act of 2002 - Lori Lipcaman, Chief Financial Officer.
32.1 Certification Pursuant to 18 U.S.C. Section 1350, as adopted pursuant to Section 906 of the Sarbanes-Oxley Act of 2002 – Dr. Gerald Paul, Chief Executive Officer.
32.2 Certification Pursuant to 18 U.S.C. Section 1350, as adopted pursuant to Section 906 of the Sarbanes-Oxley Act of 2002 – Lori Lipcaman, Chief Financial Officer.
101 Interactive Data File (Quarterly Report on Form 10-Q, for the quarterly period ended July 1, 2017, furnished in XBRL (eXtensible Business Reporting Language)).

SIGNATURES
Pursuant to the requirements of the Securities Exchange Act of 1934, the registrant has duly caused this report to be signed on its behalf by the undersigned thereunto duly authorized.
Date: August 3, 2017
56
VISHAY INTERTECHNOLOGY, INC. /s/ Lori Lipcaman Lori Lipcaman Executive Vice President and Chief Financial Officer (as a duly authorized officer and principal financial and accounting officer)

Exhibit 31.1
CERTIFICATIONS I, Dr. Gerald Paul, certify that:
(a) Designed such disclosure controls and procedures, or caused such disclosure controls and procedures to be designed under our supervision, to ensure that material information relating to the registrant, including its consolidated subsidiaries, is made known to us by others within those entities, particularly during the period in which this report is being prepared;
(b) Designed such internal control over financial reporting, or caused such internal control over financial reporting to be designed under our supervision, to provide reasonable assurance regarding the reliability of financial reporting and the preparation of financial statements for external purposes in accordance with generally accepted accounting principles;
(c) Evaluated the effectiveness of the registrant's disclosure controls and procedures and presented in this report our conclusions about the effectiveness of the disclosure controls and procedures, as of the end of the period covered by this report based on such evaluation; and
(d) Disclosed in this report any change in the registrant's internal control over financial reporting that occurred during the registrant's most recent fiscal quarter that has materially affected, or is reasonably likely to materially affect, the registrant's internal control over financial reporting; and
(a) All significant deficiencies and material weaknesses in the design or operation of internal control over financial reporting which are reasonably likely to adversely affect the registrant's ability to record, process, summarize and report financial information; and
(b) Any fraud, whether or not material, that involves management or other employees who have a significant role in the registrant's internal control over financial reporting.
Date: August 3, 2017
/s/ Gerald Paul Dr. Gerald Paul Chief Executive Officer
1. I have reviewed this quarterly report on Form 10-Q of Vishay Intertechnology, Inc.;
2. Based on my knowledge, this report does not contain any untrue statement of a material fact or omit to state a material fact necessary to make the statements made, in light of the circumstances under which such statements were made, not misleading with respect to the period covered by this report;
3. Based on my knowledge, the financial statements, and other financial information included in this report, fairly present in all material respects the financial condition, results of operations and cash flows of the registrant as of, and for, the periods presented in this report;
4. The registrant's other certifying officer(s) and I are responsible for establishing and maintaining disclosure controls and procedures (as defined in Exchange Act Rules 13a-15(e) and 15d-15(e)) and internal control over financial reporting (as defined in Exchange Act Rules 13a-15(f) and 15d-15(f)) for the registrant and have:
5. The registrant's other certifying officer(s) and I have disclosed, based on our most recent evaluation of internal control over financial reporting, to the registrant's auditors and the audit committee of the registrant's board of directors (or persons performing the equivalent functions):
Exhibit 31.2
CERTIFICATIONS I, Lori Lipcaman, certify that:
(a) Designed such disclosure controls and procedures, or caused such disclosure controls and procedures to be designed under our supervision, to ensure that material information relating to the registrant, including its consolidated subsidiaries, is made known to us by others within those entities, particularly during the period in which this report is being prepared;
(b) Designed such internal control over financial reporting, or caused such internal control over financial reporting to be designed under our supervision, to provide reasonable assurance regarding the reliability of financial reporting and the preparation of financial statements for external purposes in accordance with generally accepted accounting principles;
(c) Evaluated the effectiveness of the registrant's disclosure controls and procedures and presented in this report our conclusions about the effectiveness of the disclosure controls and procedures, as of the end of the period covered by this report based on such evaluation; and
(d) Disclosed in this report any change in the registrant's internal control over financial reporting that occurred during the registrant's most recent fiscal quarter that has materially affected, or is reasonably likely to materially affect, the registrant's internal control over financial reporting; and
(a) All significant deficiencies and material weaknesses in the design or operation of internal control over financial reporting which are reasonably likely to adversely affect the registrant's ability to record, process, summarize and report financial information; and
(b) Any fraud, whether or not material, that involves management or other employees who have a significant role in the registrant's internal control over financial reporting.
Date: August 3, 2017
/s/ Lori Lipcaman Lori Lipcaman Chief Financial Officer
1. I have reviewed this quarterly report on Form 10-Q of Vishay Intertechnology, Inc.;
2. Based on my knowledge, this report does not contain any untrue statement of a material fact or omit to state a material fact necessary to make the statements made, in light of the circumstances under which such statements were made, not misleading with respect to the period covered by this report;
3. Based on my knowledge, the financial statements, and other financial information included in this report, fairly present in all material respects the financial condition, results of operations and cash flows of the registrant as of, and for, the periods presented in this report;
4. The registrant's other certifying officer(s) and I are responsible for establishing and maintaining disclosure controls and procedures (as defined in Exchange Act Rules 13a-15(e) and 15d-15(e)) and internal control over financial reporting (as defined in Exchange Act Rules 13a-15(f) and 15d-15(f)) for the registrant and have:
5. The registrant's other certifying officer(s) and I have disclosed, based on our most recent evaluation of internal control over financial reporting, to the registrant's auditors and the audit committee of the registrant's board of directors (or persons performing the equivalent functions):

Exhibit 32.1
CERTIFICATION PURSUANT TO 18 U.S.C. SECTION 1350,
AS ADOPTED PURSUANT TO SECTION 906 OF THE SARBANES-OXLEY ACT OF 2002
In connection with the Quarterly Report of Vishay Intertechnology, Inc. (the "Company") on Form 10-Q for the fiscal quarter ended July 1, 2017 as filed with the Securities and Exchange Commission on the date hereof (the "Report"), I, Dr. Gerald Paul, Chief Executive Officer of the Company, certify, pursuant to 18 U.S.C. section 1350, as adopted pursuant to section 906 of the Sarbanes-Oxley Act of 2002, that:
/s/ Gerald Paul Dr. Gerald Paul Chief Executive Officer August 3, 2017
(1) The Report fully complies with the requirements of section 13(a) or 15(d) of the Securities Exchange Act of 1934; and
(2) The information contained in the Report fairly presents, in all material respects, the financial condition and results of operations of the Company.

Exhibit 32.2
CERTIFICATION PURSUANT TO 18 U.S.C. SECTION 1350,
AS ADOPTED PURSUANT TO SECTION 906 OF THE SARBANES-OXLEY ACT OF 2002
In connection with the Quarterly Report of Vishay Intertechnology, Inc. (the "Company") on Form 10-Q for the fiscal quarter ended July 1, 2017 as filed with the Securities and Exchange Commission on the date hereof (the "Report"), I, Lori Lipcaman, Chief Financial Officer of the Company, certify, pursuant to 18 U.S.C. section 1350, as adopted pursuant to section 906 of the Sarbanes-Oxley Act of 2002, that:
/s/ Lori Lipcaman Lori Lipcaman Chief Financial Officer August 3, 2017
(1) The Report fully complies with the requirements of section 13(a) or 15(d) of the Securities Exchange Act of 1934; and
(2) The information contained in the Report fairly presents, in all material respects, the financial condition and results of operations of the Company.