united states securities and exchange … · as filed with the securities and exchange commission...
TRANSCRIPT
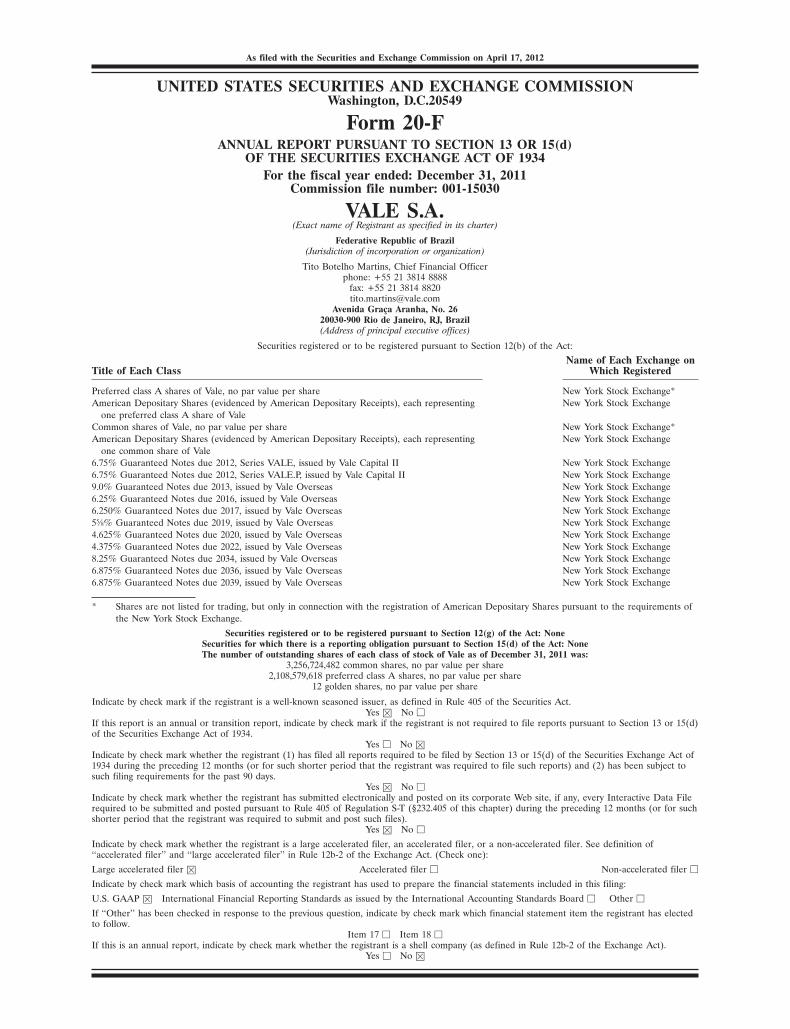
As filed with the Securities and Exchange Commission on April 17, 2012
UNITED STATES SECURITIES AND EXCHANGE COMMISSIONWashington, D.C.20549
Form 20-FANNUAL REPORT PURSUANT TO SECTION 13 OR 15(d)
OF THE SECURITIES EXCHANGE ACT OF 1934For the fiscal year ended: December 31, 2011
Commission file number: 001-15030
VALE S.A.(Exact name of Registrant as specified in its charter)
Federative Republic of Brazil(Jurisdiction of incorporation or organization)
Tito Botelho Martins, Chief Financial Officerphone: +55 21 3814 8888
fax: +55 21 3814 [email protected]
Avenida Graca Aranha, No. 2620030-900 Rio de Janeiro, RJ, Brazil(Address of principal executive offices)
Securities registered or to be registered pursuant to Section 12(b) of the Act:
Name of Each Exchange onTitle of Each Class Which Registered
Preferred class A shares of Vale, no par value per share New York Stock Exchange*American Depositary Shares (evidenced by American Depositary Receipts), each representing New York Stock Exchange
one preferred class A share of ValeCommon shares of Vale, no par value per share New York Stock Exchange*American Depositary Shares (evidenced by American Depositary Receipts), each representing New York Stock Exchange
one common share of Vale6.75% Guaranteed Notes due 2012, Series VALE, issued by Vale Capital II New York Stock Exchange6.75% Guaranteed Notes due 2012, Series VALE.P, issued by Vale Capital II New York Stock Exchange9.0% Guaranteed Notes due 2013, issued by Vale Overseas New York Stock Exchange6.25% Guaranteed Notes due 2016, issued by Vale Overseas New York Stock Exchange6.250% Guaranteed Notes due 2017, issued by Vale Overseas New York Stock Exchange55⁄8% Guaranteed Notes due 2019, issued by Vale Overseas New York Stock Exchange4.625% Guaranteed Notes due 2020, issued by Vale Overseas New York Stock Exchange4.375% Guaranteed Notes due 2022, issued by Vale Overseas New York Stock Exchange8.25% Guaranteed Notes due 2034, issued by Vale Overseas New York Stock Exchange6.875% Guaranteed Notes due 2036, issued by Vale Overseas New York Stock Exchange6.875% Guaranteed Notes due 2039, issued by Vale Overseas New York Stock Exchange
* Shares are not listed for trading, but only in connection with the registration of American Depositary Shares pursuant to the requirements ofthe New York Stock Exchange.
Securities registered or to be registered pursuant to Section 12(g) of the Act: NoneSecurities for which there is a reporting obligation pursuant to Section 15(d) of the Act: NoneThe number of outstanding shares of each class of stock of Vale as of December 31, 2011 was:
3,256,724,482 common shares, no par value per share2,108,579,618 preferred class A shares, no par value per share
12 golden shares, no par value per share
Indicate by check mark if the registrant is a well-known seasoned issuer, as defined in Rule 405 of the Securities Act.Yes � No �
If this report is an annual or transition report, indicate by check mark if the registrant is not required to file reports pursuant to Section 13 or 15(d)of the Securities Exchange Act of 1934.
Yes � No �Indicate by check mark whether the registrant (1) has filed all reports required to be filed by Section 13 or 15(d) of the Securities Exchange Act of1934 during the preceding 12 months (or for such shorter period that the registrant was required to file such reports) and (2) has been subject tosuch filing requirements for the past 90 days.
Yes � No �Indicate by check mark whether the registrant has submitted electronically and posted on its corporate Web site, if any, every Interactive Data Filerequired to be submitted and posted pursuant to Rule 405 of Regulation S-T (§232.405 of this chapter) during the preceding 12 months (or for suchshorter period that the registrant was required to submit and post such files).
Yes � No �
Indicate by check mark whether the registrant is a large accelerated filer, an accelerated filer, or a non-accelerated filer. See definition of‘‘accelerated filer’’ and ‘‘large accelerated filer’’ in Rule 12b-2 of the Exchange Act. (Check one):
Large accelerated filer � Accelerated filer � Non-accelerated filer �
Indicate by check mark which basis of accounting the registrant has used to prepare the financial statements included in this filing:
U.S. GAAP � International Financial Reporting Standards as issued by the International Accounting Standards Board � Other �
If ‘‘Other’’ has been checked in response to the previous question, indicate by check mark which financial statement item the registrant has electedto follow.
Item 17 � Item 18 �If this is an annual report, indicate by check mark whether the registrant is a shell company (as defined in Rule 12b-2 of the Exchange Act).
Yes � No �
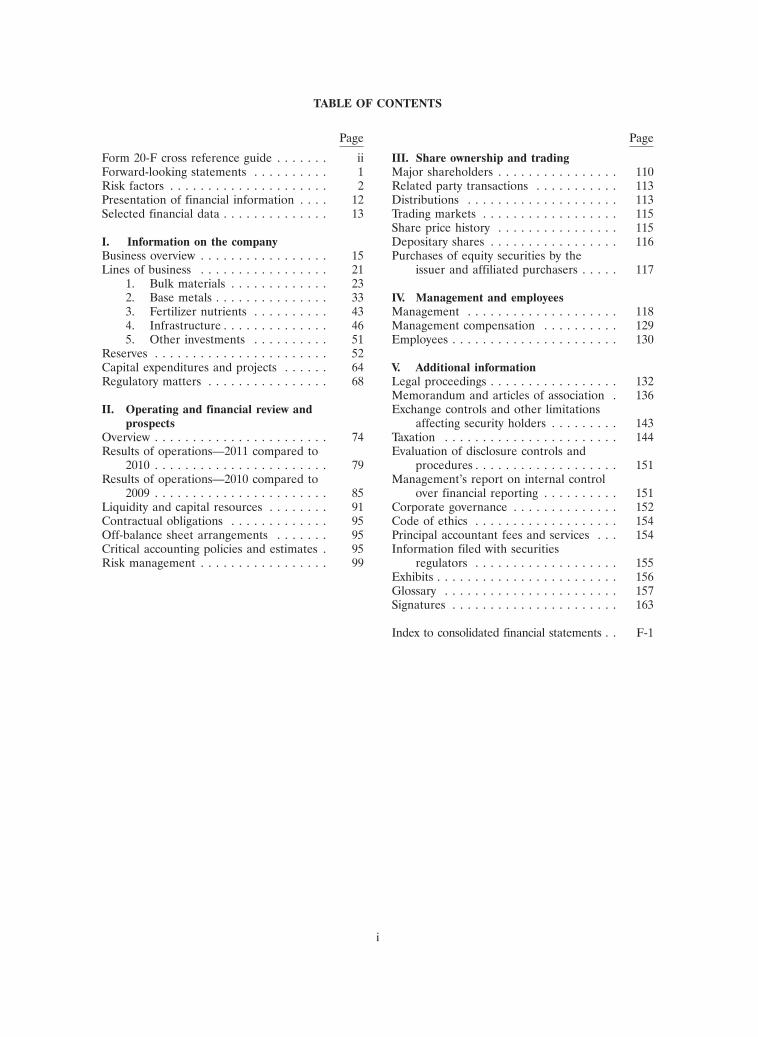
TABLE OF CONTENTS
Page Page
Form 20-F cross reference guide . . . . . . . ii III. Share ownership and tradingForward-looking statements . . . . . . . . . . 1 Major shareholders . . . . . . . . . . . . . . . . 110Risk factors . . . . . . . . . . . . . . . . . . . . . 2 Related party transactions . . . . . . . . . . . 113Presentation of financial information . . . . 12 Distributions . . . . . . . . . . . . . . . . . . . . 113Selected financial data . . . . . . . . . . . . . . 13 Trading markets . . . . . . . . . . . . . . . . . . 115
Share price history . . . . . . . . . . . . . . . . 115I. Information on the company Depositary shares . . . . . . . . . . . . . . . . . 116Business overview . . . . . . . . . . . . . . . . . 15 Purchases of equity securities by theLines of business . . . . . . . . . . . . . . . . . 21 issuer and affiliated purchasers . . . . . 117
1. Bulk materials . . . . . . . . . . . . . 232. Base metals . . . . . . . . . . . . . . . 33 IV. Management and employees3. Fertilizer nutrients . . . . . . . . . . 43 Management . . . . . . . . . . . . . . . . . . . . 1184. Infrastructure . . . . . . . . . . . . . . 46 Management compensation . . . . . . . . . . 1295. Other investments . . . . . . . . . . 51 Employees . . . . . . . . . . . . . . . . . . . . . . 130
Reserves . . . . . . . . . . . . . . . . . . . . . . . 52Capital expenditures and projects . . . . . . 64 V. Additional informationRegulatory matters . . . . . . . . . . . . . . . . 68 Legal proceedings . . . . . . . . . . . . . . . . . 132
Memorandum and articles of association . 136II. Operating and financial review and Exchange controls and other limitations
prospects affecting security holders . . . . . . . . . 143Overview . . . . . . . . . . . . . . . . . . . . . . . 74 Taxation . . . . . . . . . . . . . . . . . . . . . . . 144Results of operations—2011 compared to Evaluation of disclosure controls and
2010 . . . . . . . . . . . . . . . . . . . . . . . 79 procedures . . . . . . . . . . . . . . . . . . . 151Results of operations—2010 compared to Management’s report on internal control
2009 . . . . . . . . . . . . . . . . . . . . . . . 85 over financial reporting . . . . . . . . . . 151Liquidity and capital resources . . . . . . . . 91 Corporate governance . . . . . . . . . . . . . . 152Contractual obligations . . . . . . . . . . . . . 95 Code of ethics . . . . . . . . . . . . . . . . . . . 154Off-balance sheet arrangements . . . . . . . 95 Principal accountant fees and services . . . 154Critical accounting policies and estimates . 95 Information filed with securitiesRisk management . . . . . . . . . . . . . . . . . 99 regulators . . . . . . . . . . . . . . . . . . . 155
Exhibits . . . . . . . . . . . . . . . . . . . . . . . . 156Glossary . . . . . . . . . . . . . . . . . . . . . . . 157Signatures . . . . . . . . . . . . . . . . . . . . . . 163
Index to consolidated financial statements . . F-1
i

FORM 20-F CROSS REFERENCE GUIDE
Item Form 20-F caption Location in this report Page
1 Identity of directors, senior management andadvisers . . . . . . . . . . . . . . . . . . . . . . . . Not applicable . . . . . . . . . . . . . . . . . . . . . . –
2 Offer statistics and expected timetable . . . . . . . Not applicable . . . . . . . . . . . . . . . . . . . . . . –
3 Key information3A Selected financial data . . . . . . . . . . . . . . . Selected financial data . . . . . . . . . . . . . . . . . 133B Capitalization and indebtedness . . . . . . . . . Not applicable . . . . . . . . . . . . . . . . . . . . . . –3C Reasons for the offer and use of proceeds . . Not applicable . . . . . . . . . . . . . . . . . . . . . . –3D Risk factors . . . . . . . . . . . . . . . . . . . . . Risk factors . . . . . . . . . . . . . . . . . . . . . . . . 2
4 Information on the Company4A History and development of the company . . . Business Overview, Capital expenditures
and projects . . . . . . . . . . . . . . . . . . . . . . 15, 644B Business overview . . . . . . . . . . . . . . . . . . Business overview, Lines of business,
Reserves, Regulatory matters . . . . . . . . . . . 15, 21, 52, 684C Organizational structure . . . . . . . . . . . . . . Exhibit 8 . . . . . . . . . . . . . . . . . . . . . . . . . . –4D Property, plant and equipment . . . . . . . . . Lines of business, Capital expenditures
and projects, Regulatory matters . . . . . . . . . 21, 64, 68
4A Unresolved staff comments . . . . . . . . . . . . . . None . . . . . . . . . . . . . . . . . . . . . . . . . . . . –
5 Operating and financial review and prospects5A Operating results . . . . . . . . . . . . . . . . . . Results of operations (2011 compared to
2010, and 2010 compared to 2009) . . . . . . . . 79, 855B Liquidity and capital resources . . . . . . . . . . Liquidity and capital resources . . . . . . . . . . . . 915C Research and development, patents and
licenses, etc. . . . . . . . . . . . . . . . . . . . . Capital expenditures and projects . . . . . . . . . . 645D Trend information . . . . . . . . . . . . . . . . . Results of operations (2011 compared to
2010, and 2010 compared to 2009) . . . . . . . . 79, 855E Off-balance sheet arrangements . . . . . . . . . Off-balance sheet arrangements . . . . . . . . . . . 95
Critical accounting policies and estimates . . . . . 955F Tabular disclosure of contractual obligations . Contractual obligations . . . . . . . . . . . . . . . . . 955G Safe harbor . . . . . . . . . . . . . . . . . . . . . Forward-looking statements . . . . . . . . . . . . . . 1
6 Directors, senior management and employees –6A Directors and senior management . . . . . . . Management . . . . . . . . . . . . . . . . . . . . . . . 1186B Compensation . . . . . . . . . . . . . . . . . . . . Management compensation . . . . . . . . . . . . . . 1296C Board practices . . . . . . . . . . . . . . . . . . . Management—Board of directors . . . . . . . . . . 1186D Employees . . . . . . . . . . . . . . . . . . . . . . Employees . . . . . . . . . . . . . . . . . . . . . . . . 1306E Share ownership . . . . . . . . . . . . . . . . . . Major shareholders,
Employees—Performance-basedcompensation . . . . . . . . . . . . . . . . . . . . . 110, 131
7 Major shareholders and related partytransactions
7A Major shareholders . . . . . . . . . . . . . . . . . Major shareholders . . . . . . . . . . . . . . . . . . . 1107B Related party transactions . . . . . . . . . . . . Related party transactions . . . . . . . . . . . . . . . 1137C Interests of experts and counsel . . . . . . . . . Not applicable . . . . . . . . . . . . . . . . . . . . . . –
8 Financial information8A Consolidated statements and other financial
information . . . . . . . . . . . . . . . . . . . . . Financial statements . . . . . . . . . . . . . . . . . . F-1Distributions . . . . . . . . . . . . . . . . . . . . . . . 113Legal proceedings . . . . . . . . . . . . . . . . . . . . 132
8B Significant changes . . . . . . . . . . . . . . . . . Not applicable . . . . . . . . . . . . . . . . . . . . . . –
9 The offer and listing9A Offer and listing details . . . . . . . . . . . . . . Share price history . . . . . . . . . . . . . . . . . . . 1159B Plan of distribution . . . . . . . . . . . . . . . . . Not applicable . . . . . . . . . . . . . . . . . . . . . . –9C Markets . . . . . . . . . . . . . . . . . . . . . . . . Trading markets . . . . . . . . . . . . . . . . . . . . . 115
ii

Item Form 20-F caption Location in this report Page
9D Selling shareholders . . . . . . . . . . . . . . . . Not applicable . . . . . . . . . . . . . . . . . . . . . . –9E Dilution . . . . . . . . . . . . . . . . . . . . . . . . Not applicable . . . . . . . . . . . . . . . . . . . . . . –9F Expenses of the issue . . . . . . . . . . . . . . . Not applicable . . . . . . . . . . . . . . . . . . . . . . –
10 Additional information10A Share capital . . . . . . . . . . . . . . . . . . . . Memorandum and articles
of association—Common shares andpreferred shares . . . . . . . . . . . . . . . . . . . 136
10B Memorandum and articles of association . . Memorandum and articles of association . . . . . 13610C Material contracts . . . . . . . . . . . . . . . . . Lines of business; Results of operations;
Related party transactions . . . . . . . . . . . . . 21, 79, 11310D Exchange controls . . . . . . . . . . . . . . . . . Exchange controls and other limitations
affecting security holders . . . . . . . . . . . . . . 14310E Taxation . . . . . . . . . . . . . . . . . . . . . . . Taxation . . . . . . . . . . . . . . . . . . . . . . . . . . 14410F Dividends and paying agents . . . . . . . . . . Not applicable . . . . . . . . . . . . . . . . . . . . . . –10G Statement by experts . . . . . . . . . . . . . . . Reserves . . . . . . . . . . . . . . . . . . . . . . . . . . 5210H Documents on display . . . . . . . . . . . . . . Information filed with securities
regulators . . . . . . . . . . . . . . . . . . . . . . . . 15510I Subsidiary information . . . . . . . . . . . . . . Not applicable . . . . . . . . . . . . . . . . . . . . . . –
11 Quantitative and qualitative disclosures aboutmarket risk . . . . . . . . . . . . . . . . . . . . . Risk management . . . . . . . . . . . . . . . . . . . . 99
12 Description of securities other than equitysecurities
12A Debt securities . . . . . . . . . . . . . . . . . . . Not applicable . . . . . . . . . . . . . . . . . . . . . . –12B Warrants and rights . . . . . . . . . . . . . . . . Not applicable . . . . . . . . . . . . . . . . . . . . . . –12C Other securities . . . . . . . . . . . . . . . . . . Not applicable . . . . . . . . . . . . . . . . . . . . . . –12D American Depositary Shares . . . . . . . . . . Depositary shares . . . . . . . . . . . . . . . . . . . . 116
13 Defaults, dividend arrearages anddelinquencies . . . . . . . . . . . . . . . . . . . . Not applicable . . . . . . . . . . . . . . . . . . . . . . –
14 Material modifications to the rights of securityholders and use of proceeds . . . . . . . . . . . Not applicable . . . . . . . . . . . . . . . . . . . . . . –
15 Controls and procedures . . . . . . . . . . . . . . . Evaluation of disclosure controls andprocedures . . . . . . . . . . . . . . . . . . . . . . . 151
Management’s report on internal controlover financial reporting . . . . . . . . . . . . . . . 151
16 16A Audit Committee financial expert . . . . . . . Management—Fiscal Council . . . . . . . . . . . . . 12616B Code of ethics . . . . . . . . . . . . . . . . . . . Code of ethics . . . . . . . . . . . . . . . . . . . . . . 15416C Principal accountant fees and services . . . . Principal accountant fees and services . . . . . . . 15416D Exemptions from the listing standards for Management—Fiscal Council; Corporate
audit committees . . . . . . . . . . . . . . . . . . governance . . . . . . . . . . . . . . . . . . . . . . . 126, 15216E Purchase of equity securities by the issuer Purchases of equity securities by the issuer
and affiliated purchasers . . . . . . . . . . . . . and affiliated purchasers . . . . . . . . . . . . . . 11716F Change in registrant’s certifying accountant . Not applicable . . . . . . . . . . . . . . . . . . . . . . –16G Corporate governance . . . . . . . . . . . . . . Corporate governance . . . . . . . . . . . . . . . . . 15216H Mine safety disclosure . . . . . . . . . . . . . . Not applicable . . . . . . . . . . . . . . . . . . . . . . –
17 Financial statements . . . . . . . . . . . . . . . . . . Not applicable . . . . . . . . . . . . . . . . . . . . . . –
18 Financial statements . . . . . . . . . . . . . . . . . . Financial statements . . . . . . . . . . . . . . . . . . F-1
19 Exhibits . . . . . . . . . . . . . . . . . . . . . . . . . . Exhibits . . . . . . . . . . . . . . . . . . . . . . . . . . 156
iii

FORWARD-LOOKING STATEMENTS
This annual report contains statements that may constitute forward-looking statements within themeaning of the safe harbor provisions of the U.S. Private Securities Litigation Reform Act of 1995. Many ofthose forward-looking statements can be identified by the use of forward-looking words such as ‘‘anticipate,’’‘‘believe,’’ ‘‘could,’’ ‘‘expect,’’ ‘‘should,’’ ‘‘plan,’’ ‘‘intend,’’ ‘‘estimate’’ and ‘‘potential,’’ among others. Thosestatements appear in a number of places and include statements regarding our intent, belief or currentexpectations with respect to:
� our direction and future operation;
� the implementation of our principal operating strategies, including our potential participation inacquisition, divestiture or joint venture transactions or other investment opportunities;
� the implementation of our financing strategy and capital expenditure plans;
� the exploration of mineral reserves and development of mining facilities;
� the depletion and exhaustion of mines and mineral reserves;
� trends in commodity prices and demand for commodities;
� the future impact of competition and regulation;
� the payment of dividends or interest on shareholders’ equity;
� industry trends, including the direction of prices and expected levels of supply and demand;
� other factors or trends affecting our financial condition or results of operations; and
� the factors discussed under Risk factors.
We caution you that forward-looking statements are not guarantees of future performance and involverisks and uncertainties. Actual results may differ materially from those in forward-looking statements as aresult of various factors. These risks and uncertainties include factors relating to (a) the countries in which weoperate, mainly Brazil and Canada, (b) the global economy, (c) capital markets, (d) the mining and metalsbusinesses and their dependence upon global industrial production, which is cyclical by nature, and (e) thehigh degree of global competition in the markets in which we operate. For additional information on factorsthat could cause our actual results to differ from expectations reflected in forward-looking statements, seeRisk factors. Forward-looking statements speak only as of the date they are made, and we do not undertakeany obligation to update them in light of new information or future developments. All forward-lookingstatements attributed to us or a person acting on our behalf are expressly qualified in their entirety by thiscautionary statement, and you should not place undue reliance on any forward-looking statement.
Vale S.A. is a stock corporation, or sociedade por acoes, organized on January 11, 1943 and existing underthe laws of the Federative Republic of Brazil for an unlimited period of time. Its head offices are located atAvenida Graca Aranha, No. 26, 20030-900 Rio de Janeiro, RJ, Brazil, and its telephone number is55-21-3814-4477.
In this report, references to ‘‘Vale’’ are to Vale S.A. References to ‘‘we,’’ ‘‘us’’ or the ‘‘Company’’ are to Valeand, except where the context otherwise requires, its consolidated subsidiaries. References to our ‘‘preferred shares’’are to our preferred class A shares. References to our ‘‘ADSs’’ or ‘‘American Depositary Shares’’ include both ourcommon American Depositary Shares (our ‘‘common ADSs’’), each of which represents one common share ofVale, and our preferred class A American Depositary Shares (our ‘‘preferred ADSs’’), each of which represents one
1

class A preferred share of Vale. American Depositary Shares are represented by American Depositary Receipts(‘‘ADRs’’) issued by the depositary. References to our ‘‘HDSs’’ or ‘‘Hong Kong Depositary Shares’’ include bothour common Hong Kong Depositary Shares (our ‘‘common HDSs’’), each of which represents one common shareof Vale, and our class A preferred Hong Kong Depositary Shares (our ‘‘preferred HDSs’’), each of which representsone preferred Class A share of Vale. Hong Kong Depositary Shares are represented by Hong Kong DepositaryReceipts (‘‘HDRs’’) issued by the depositary. Unless otherwise specified, we use metric units.
References to ‘‘real,’’ ‘‘reais’’ or ‘‘R$’’ are to the official currency of Brazil, the real (singular) or reais(plural). References to ‘‘U.S. dollars’’ or ‘‘US$’’ are to United States dollars. References to ‘‘CAD’’ are to Canadiandollars, and references to ‘‘A$’’ are to Australian dollars.
RISK FACTORS
Risks relating to our business
The mining industry is highly exposed to the cyclicality of global economic activity and requires significantinvestments of capital.
The mining industry is primarily a supplier of industrial raw materials. Industrial production tends tobe the most cyclical and volatile component of global economic activity, which affects demand for mineralsand metals. At the same time, investment in mining requires a substantial amount of funds in order toreplenish reserves, expand production capacity, build infrastructure and preserve the environment. Thesensitivity to industrial production, together with the need for significant long-term capital investments, areimportant sources of risk for the financial performance and growth prospects of Vale and the mining industrygenerally.
Adverse economic developments in China could have a negative impact on our revenues, cash flow andprofitability.
China has been the main driver of global demand for minerals and metals over the last few years. In2011, Chinese demand represented 63% of global demand for seaborne iron ore, 43% of global demand fornickel and 39% of global demand for copper. The percentage of our gross operating revenues attributable tosales to consumers in China was 32.4% in 2011. Although China largely withstood the global recession of2008/2009, a contraction of China’s economic growth could result in lower demand for our products, leadingto lower revenues, cash flow and profitability. Poor performance in the Chinese real estate sector, the largestconsumer of carbon steel in China, could also negatively impact our results.
Our business can be adversely affected by declines in demand for the products our customers produce,including steel (for our iron ore and coal business), stainless steel (for our nickel business) and agriculturalcommodities (for our fertilizer nutrients business).
Demand for our iron ore, coal and nickel products depends on global demand for steel. Iron ore andiron ore pellets, which together accounted for 71.5% of our 2011 operating revenues, are used to producecarbon steel. Nickel, which accounted for 9.5% of our 2011 gross operating revenues, is used mainly toproduce stainless and alloy steels. Demand for steel depends heavily on global economic conditions, but italso depends on a variety of regional and sectoral factors. The prices of different steels and the performanceof the global steel industry are highly cyclical and volatile, and these business cycles in the steel industry affectdemand and prices for our products. In addition, vertical backward integration of the steel industry and theuse of scrap could reduce the global seaborne trade of iron ore.
The demand for fertilizers is affected by global prices of agricultural commodities. A sustained declinein the price of one or more agricultural commodities could negatively impact our fertilizer nutrients business.
2

The prices we charge, including prices for iron ore, nickel and copper, are subject to volatility.
Our iron ore prices are based on a variety of pricing options, which generally use spot price indices asa basis for determining the customer price. Our prices for nickel and copper are based on reported prices forthese metals on commodity exchanges such as the London Metal Exchange (‘‘LME’’) and the New YorkMercantile Exchange (‘‘NYMEX’’). Our prices and revenues for these products are consequently volatile,which may adversely affect our cash flow. Global prices for metals are subject to significant fluctuations andare affected by many factors, including actual and expected global macroeconomic and political conditions,levels of supply and demand, the availability and cost of substitutes, inventory levels, investments bycommodity funds and others and actions of participants in the commodity markets.
Increased availability of alternative nickel sources or substitution of nickel from end-use applications couldadversely affect our nickel business.
Scrap nickel competes directly with primary nickel as a source of nickel for use in the production ofstainless steel, and the choice between them is largely driven by their relative prices and availability. In 2011,the stainless steel scrap ratio remained relatively unchanged from 2010, at 43%. Nickel pig iron, a productdeveloped by Chinese steel and alloy makers that utilizes lateritic nickel ores, competes with other nickelsources in the production of stainless steel. In 2011, estimated Chinese nickel pig iron and ferro-nickelproduction increased 67%, representing 16% of global nickel output. Demand for primary nickel may benegatively affected by the direct substitution of primary nickel with other materials in current applications. Inresponse to high nickel prices or other factors, producers and consumers of stainless steel may partially shiftfrom stainless steel with high nickel content (series 300) to stainless steels with either lower nickel content(series 200) or no nickel content (series 400), which would adversely affect demand for nickel.
We may not be able to adjust production volume in a timely or cost-efficient manner in response tochanges in demand.
During periods of high demand, our ability to rapidly increase production capacity is limited, whichcould render us unable to satisfy demand for our products. Moreover, we may be unable to completeexpansions and greenfield projects in time to take advantage of rising demand for iron ore, nickel or otherproducts. When demand exceeds our production capacity, we may meet excess customer demand bypurchasing iron ore, iron ore pellets or nickel from joint ventures or unrelated parties and reselling it, whichwould increase our costs and narrow our operating margins. If we are unable to satisfy excess customerdemand in this way, we may lose customers. In addition, operating close to full capacity may expose us tohigher costs, including demurrage fees due to capacity restraints in our logistics systems.
Conversely, operating at significant idle capacity during periods of weak demand may expose us tohigher unit production costs since a significant portion of our cost structure is fixed in the short-term due tothe high capital intensity of mining operations. In addition, efforts to reduce costs during periods of weakdemand could be limited by labor regulations or previous labor or government agreements.
Regulatory, political, economic and social conditions in the countries in which we have operations orprojects could adversely impact our business and the market price of our securities.
Our financial performance may be negatively affected by regulatory, political, economic and socialconditions in countries in which we have significant operations or projects, particularly Argentina, Australia,Brazil, Canada, Chile, China, Colombia, France, Guinea, Indonesia, Japan, Liberia, Malawi, Mozambique,New Caledonia, Norway, Oman, Peru, the United Kingdom and Zambia.
Our operations depend on authorizations and concessions from governmental regulatory agencies inthe countries in which we operate. For details about the authorizations and concessions upon which ouroperations depend, see Information on the Company—Regulatory matters. We are subject to laws andregulations in many jurisdictions that can change at any time, and changes in laws and regulations mayrequire modifications to our technologies and operations and result in unanticipated capital expenditures.
3

Actual or potential political changes and changes in economic policy may undermine investorconfidence, which may hamper investment and thereby reduce economic growth, and otherwise may adverselyaffect the economic and other conditions under which we operate in ways that could have a materiallynegative effect on our business.
Disagreements with local communities in which we operate could adversely impact our business andreputation.
Disputes with communities in which we operate may arise from time to time. Although we contributeto local communities with taxes, job and business opportunities and social programs, community expectationsare complex and involve multiple stakeholders with different interests. Some of our operations and reservesare located on or near lands owned or used by indigenous or aboriginal tribes or other groups. Theseindigenous peoples may have rights to review or participate in natural resource management, and wenegotiate with them to mitigate impacts of our operations or to obtain access to their lands.
Disagreements or disputes with local groups, including indigenous or aboriginal groups, could causedelays or interruptions to our operations, adversely affect our reputation or otherwise hamper our ability todevelop our reserves and conduct our operations. Protesters have taken actions to disrupt our operations andprojects, and they may continue to do so in the future. Although we vigorously defend ourselves againstillegal acts, future attempts by protesters to harm our operations could adversely affect our business.
We could be adversely affected by changes in government policies, including the imposition of new taxes orroyalties on mining activities.
Mining is subject to government regulation in the form of taxes and royalties, which can have animportant financial impact on our operations. In the countries where we are present, governments mayimpose new taxes, raise existing taxes and royalty rates, reduce tax exemptions and benefits, or change thebasis on which taxes are calculated in a manner that is unfavorable to us. Governments that have committedto provide a stable taxation or regulatory environment may shorten the duration of those commitments.
Concessions, authorizations, licenses and permits are subject to expiration, to limitation on renewal and tovarious other risks and uncertainties.
Some of our mining concessions are subject to fixed expiration dates and might only be renewed alimited number of times for a limited period of time. Apart from mining concessions, we may need to obtainvarious authorizations, licenses and permits from governmental or other regulatory bodies in connection withthe operation of our mines, which may be subject to fixed expiration dates or periodic review or renewal.While we anticipate that renewals will be given as and when sought, there is no assurance that such renewalswill be granted as a matter of course and there is no assurance that new conditions will not be imposed inconnection therewith. Fees for mining concessions might increase substantially due to the passage of timefrom the original issuance of each individual exploration license. If so, our business objectives might beimpeded by the costs of holding or renewing our mining concessions. Accordingly, we need to continuallyassess the mineral potential of each mining concession, particularly at the time of renewal, to determine if thecosts of maintaining the mining concessions are justified by the results of operations to date, and might electto let some of our concessions lapse. There can be no assurance that concessions will be obtained on termsfavorable to us, or at all, for our future intended mining or exploration targets.
In a number of jurisdictions where we have exploration projects, we may be required to retrocede tothe state a certain portion of the area covered by the exploration license as a condition to obtaining a miningconcession. This retrocession requirement can lead to a substantial loss of part of the mineral depositoriginally identified in our feasibility studies. For more information on mining concessions and other similarrights, see Regulatory matters.
4

Our projects are subject to risks that may result in increased costs or delay in their implementation.
We are investing to maintain and further increase our production capacity, logistics capabilities and toexpand the scope of the minerals we produce. Our projects are subject to a number of risks that mayadversely affect our growth prospects and profitability, including the following:
� We may encounter delays or higher than expected costs in obtaining the necessary equipment orservices and in implementing new technologies to build and operate a project.
� Our efforts to develop projects according to schedule may be hampered by a lack ofinfrastructure, including a reliable power supply.
� Suppliers and contractors may fail to meet their obligations to us.
� We may face unexpected weather conditions or other force majeure events.
� We may fail to obtain, or experience delays or higher than expected costs in obtaining, therequired permits and licenses to build a project.
� Changes in market conditions or regulations may make a project less profitable than expected atthe time we initiated work on it.
� There may be accidents or incidents during project implementation.
� We may face shortages of skilled personnel.
Operational problems could materially and adversely affect our business and financial performance.
Ineffective project management and operational breakdowns might require us to suspend or curtailoperations, which could generally reduce our productivity. Ineffective project management could mean thatwe are not able to perform the continuous operation of our activities. Operational breakdowns could entailfailure of critical plant and machinery. There can be no assurance that ineffective project management orother operational problems will not occur. Any damages to our projects or delays in our operations caused byineffective project management or operational breakdowns could materially and adversely affect our businessand results of operations.
Our business is subject to a number of operational risks that may adversely affect our results ofoperations, such as:
� We may face unexpected weather conditions or other force majeure events.
� Adverse mining conditions may delay and hamper our ability to produce the expected quantity ofminerals and to meet specifications required by customers.
� There may be accidents or incidents during business operations involving our mines, plants,railroads, ports and ships.
� We may experience delays or interruptions in the transportation of our products, including withrailroads, ports and ships.
� Some of our development projects are located in regions where tropical diseases, AIDS and othercontagious diseases are a major public health issue and pose health and safety risks to ouremployees. If we are unable to ensure the health and safety of our employees, our operationsmay be adversely affected.
� Labor disputes may disrupt our operations from time to time.
5

Rules governing ocean transport of iron ore fines could affect our operations.
A portion of our production is in the form of non-concentrate iron ore. This type of ore has beenoccasionally compared to fines, which are small particles of ore. Current studies are analyzing whether theseores, when transported with a high moisture content, may begin to act like a fluid, although we have norecord of such an event occurring. This might cause cargo to become less stable, presenting potential dangersto navigation. The operational risks depend on many factors, including the characteristics of the ore, thecircumstances under which they are transported and the type of vessel used. To manage these risks, theshipping industry and maritime insurers generally follow rules adopted under the International Maritime SolidBulk Cargoes (IMSBC) Code, but those rules do not currently specifically address the transportation ofnon-concentrate iron ore such as we produce in the Carajas mineral province in our Northern System.Potential changes to the rules are currently under consideration under the auspices of the InternationalMaritime Organization (IMO). We believe that the safety of our shipping practices is evidenced by our longtrack record of safe operations, but regulatory changes could require us to modify our practices for handlingor shipping our Carajas production, and these measures could increase our costs, require new investment, andeven limit the volume of our exports of Carajas iron ore.
Our business could be adversely affected by the failure of our counterparties to perform their obligations.
Customers, suppliers, contractors and other counterparties may fail to perform existing contracts andobligations, which may unfavorably impact our operations and financial results. The ability of suppliers andcustomers to perform their obligations may be adversely affected in times of financial stress and economicdownturn. Suppliers are also subject to capacity constraints in times of high demand which may affect theirability to fulfill their commitments.
We currently operate important parts of our pelletizing, bauxite, nickel, coal, copper and steelbusinesses through joint ventures with other companies. Important parts of our electricity investments and ouroil and gas projects are operated through consortia. Our forecasts and plans for these joint ventures andconsortia assume that our partners will observe their obligations to make capital contributions, purchaseproducts and, in some cases, provide skilled and competent managerial personnel. If any of our partners failsto observe its commitments, the affected joint venture or consortium may not be able to operate inaccordance with its business plans, or we may have to increase the level of our investment to implement theseplans. For more information about our joint ventures, see Information on the Company—Lines of business.
Our business is subject to environmental, health and safety incidents or accidents.
Our operations involve the use, handling, discharge and disposal of hazardous materials into theenvironment and the use of natural resources, and the mining industry is generally subject to significant risksand hazards, including the potential for fire or explosion, gas leaks, escape of polluting substances or otherhazardous materials, rockfall incidents in underground mining operations and incidents involving mobileequipment or machinery. This could occur by accident or by a breach of operating standards, and could resultin a significant incident, including damage to or destruction of mineral properties or production facilities,personal injury or death, environmental damage, delays in production, monetary losses and possible legalliability. Vale has health, safety and environmental standards in place to mitigate the risk of such incidents oraccidents. Notwithstanding our standards, policies and controls, our operations remain subject to incidents oraccidents, which could adversely affect our business or reputation.
Environmental, health and safety regulation, including regulation pertaining to climate change, mayadversely affect our business.
Nearly all aspects of our activities, products, services and projects around the world are subject toenvironmental, health and safety regulation, which may expose us to increased liability or increased costs.Such regulations require us to obtain environmental licenses, permits and authorizations for our operations,and to conduct environmental impact assessments in order to get approval for our projects and permission forinitiating construction. Additionally, all significant changes to existing operations must also undergo the same
6

procedures. Difficulties in obtaining permits may lead to construction delays or cost increases, and in somecases may lead us to postpone or even abandon a project. Environmental regulation also imposes standardsand controls on activities relating to mineral research, mining, pelletizing activities, railway and marineservices, ports, decommissioning, refining, distribution and marketing of our products. Such regulation maygive rise to significant costs and liabilities. In addition, community activist groups and other stakeholders mayincrease demands for socially responsible and environmentally sustainable practices, which could entailsignificant costs and reduce our profitability. Private litigation relating to these or other matters may adverselyaffect our financial condition or cause harm to our reputation.
Environmental regulation in many countries in which we operate has become stricter in recent years,and it is possible that more regulation or more aggressive enforcement of existing regulations will adverselyaffect us by imposing restrictions on our activities and products, creating new requirements for the issuance orrenewal of environmental licenses, raising our costs or requiring us to engage in expensive reclamation efforts.
Concern over climate change and efforts to comply with international undertakings could leadgovernments to impose limits on carbon emissions or carbon taxes and emissions trading schemes applicableto our operations, which could adversely affect our operating costs or our capital expenditure requirements.For example, the Brazilian government has adopted a decree under the carbon emissions law (PolıticaNacional de Mudancas Climaticas) that contemplates specific limits on carbon emissions to be established in2012 and phased in through 2020, and the Australian government has introduced a carbon pricing mechanismthat commences in July 2012.
Natural disasters may inflict severe damage to our operations and projects in the countries where weoperate and/or may cause a negative impact in our sales to countries adversely affected by such disasters.
Natural disasters, such as wind storms, floods, earthquakes and tsunamis may adversely affect ouroperations and projects in the countries where we operate, and may cause a contraction in sales to countriesadversely affected due to, among other factors, power outages and the destruction of industrial facilities andinfrastructure. Moreover, although the physical impact of climate change on our business remains highlyuncertain, we may experience changes in rainfall patterns, water shortages, rising sea levels, increased stormintensity and flooding as a result of climate change, which may adversely affect our operations. OnJanuary 11, 2012, we determined that force majeure had occurred under a number of our iron ore salescontracts due to high rainfall in the Brazilian states of Minas Gerais, Rio de Janeiro and Espırito Santo,which created serious challenges to the operations of our Southeastern and Southern Systems. The forcemajeure was lifted on January 23, 2012.
We may not have adequate insurance coverage for some business risks.
Our businesses are generally subject to a number of risks and hazards, which could result in damageto, or destruction of, mineral properties, facilities and equipment. The insurance we maintain against risksthat are typical in our business may not provide adequate coverage. Insurance against some risks (includingliabilities for environmental pollution or certain hazards or interruption of certain business activities) may notbe available at a reasonable cost, or at all. As a result, accidents or other negative developments involving ourmining, production or transportation facilities could have a material adverse effect on our operations.
Our reserve estimates may materially differ from mineral quantities that we may be able to actually recover;our estimates of mine life may prove inaccurate; and market price fluctuations and changes in operatingand capital costs may render certain ore reserves uneconomical to mine.
Our reported ore reserves are estimated quantities of ore and minerals that we have determined canbe economically mined and processed under present and assumed future conditions to extract their mineralcontent. There are numerous uncertainties inherent in estimating quantities of reserves and in projectingpotential future rates of mineral production, including factors beyond our control. Reserve reporting involvesestimating deposits of minerals that cannot be measured in an exact manner, and the accuracy of any reserveestimate is a function of the quality of available data and engineering and geological interpretation and
7
judgment. As a result, no assurance can be given that the indicated amount of ore will be recovered or that itwill be recovered at the rates we anticipate. Estimates may vary, and results of our mining and productionsubsequent to the date of an estimate may lead to revisions of estimates. Reserve estimates and estimates ofmine life may require revisions based on actual production experience and other factors. For example,fluctuations in the market prices of minerals and metals, reduced recovery rates or increased operating andcapital costs due to inflation, exchange rates or other factors may render proven and probable reservesuneconomic to exploit and may ultimately result in a restatement of reserves. Such restatement could affectdepreciation and amortization rates, and have an adverse effect on our financial performance.
We may not be able to replenish our reserves, which could adversely affect our mining prospects.
We engage in mineral exploration, which is highly speculative in nature, involves many risks andfrequently is non-productive. Our exploration programs, which involve significant expenditures, may fail toresult in the expansion or replacement of reserves depleted by current production. If we do not develop newreserves, we will not be able to sustain our current level of production beyond the remaining lives of ourexisting mines.
Drilling and production risks could adversely affect the mining process.
Once mineral deposits are discovered, it can take a number of years from the initial phases of drillinguntil production is possible, during which the economic feasibility of production may change. Substantial timeand expenditures are required to:
� establish mineral reserves through drilling;
� determine appropriate mining and metallurgical processes for optimizing the recovery of metalcontained in ore;
� obtain environmental and other licenses;
� construct mining, processing facilities and infrastructure required for greenfield properties; and
� obtain the ore or extract the minerals from the ore.
If a project proves not to be economically feasible by the time we are able to exploit it, we may incursubstantial losses and be obliged to take write-downs. In addition, potential changes or complicationsinvolving metallurgical and other technological processes arising during the life of a project may result indelays and cost overruns that may render the project not economically feasible.
We face rising extraction costs over time as reserves deplete.
Reserves are gradually depleted in the ordinary course of a given mining operation. As miningprogresses, distances to the primary crusher and to waste deposits become longer, pits become steeper andunderground operations become deeper. In addition, for some types of reserves, mineralization gradedecreases and hardness increases at increased depths. As a result, over time, we usually experience rising unitextraction costs with respect to each mine. Several of our mines have been operating for long periods, and wewill likely experience rising extraction costs per unit in the future at these operations in particular.
Labor disputes may disrupt our operations from time to time.
A substantial number of our employees, and some of the employees of our subcontractors, arerepresented by labor unions and are covered by collective bargaining or other labor agreements, which aresubject to periodic negotiation. Negotiation may become more difficult in times of higher prices andconsequently higher profits in the mining and metals industries, as labor unions may seek wage increases andother forms of additional compensation.
8

Strikes and other labor disruptions at any of our operations could adversely affect the operation offacilities and the timing of completion and cost of our capital projects. For more information about laborrelations, see Management and employees—Employees. Moreover, we could be adversely affected by labordisruptions involving unrelated parties that may provide us with goods or services.
We may face shortages of equipment, services and skilled personnel.
The mining industry has faced worldwide shortages of mining and construction equipment, spare parts,contractors and other skilled personnel during periods of high demand for minerals and metals and intensedevelopment of mining projects. We may experience longer lead-times for mining equipment and problemswith the quality of contracted engineering, construction and maintenance services. We compete with othermining companies for highly skilled management and staff with relevant industry and technical experience,and we may not be able to attract and retain such people. Shortages during peak periods could negativelyimpact our operations, resulting in higher production or capital expenditure costs, production interruptions,higher inventory costs, project delays and potentially lower production and revenues.
Higher energy costs or energy shortages would adversely affect our business.
Energy costs are a significant component of our cost of production, representing 13.4% of our totalcost of goods sold in 2011. To fulfill our energy needs, we depend on the following sources: oil by-products,which represented 37% of total energy needs in 2011, electricity (21%), coal (19%), natural gas (15%) andother energy sources (8%), using figures converted into tons of oil equivalent (‘‘TOE’’).
Fuel costs represented 9.3% of our cost of goods sold in 2011. Increases in oil and gas pricesadversely affect margins in our logistics services, mining, iron ore pellets and nickel businesses.
Electricity costs represented 4.1% of our total cost of goods sold in 2011. If we are unable to securereliable access to electricity at acceptable prices, we may be forced to curtail production or may experiencehigher production costs, either of which would adversely affect our results of operations. We face the risk ofenergy shortages in the countries where we have operations and projects due to excess demand or weatherconditions, such as floods or droughts.
Electricity shortages have occurred throughout the world, and there can be no assurance that growthin power generation capacity in the countries in which we operate will be sufficient to meet futureconsumption increases. Future shortages, and government efforts to respond to or prevent shortages, mayadversely impact the cost or supply of electricity for our operations. Through our subsidiary PT ValeIndonesia Tbk (‘‘PTVI’’) (formerly known as PT International Nickel Indonesia Tbk), we process lateriticnickel ores using a pyrometallurgical process, which is energy-intensive. Although PTVI currently generates amajority of the electricity for its operations from its own hydroelectric power plants, low rainfall or otherhydrological factors could adversely affect electricity production at PTVI’s plants in the future, which couldsignificantly increase the risk of higher costs or lower production volume.
Price volatility—relative to the U.S. dollar—of the currencies in which we conduct operations couldadversely affect our financial condition and results of operations.
A substantial portion of our revenues and debt is denominated in U.S. dollars, and changes inexchange rates may result in (i) losses or gains on our net U.S. dollar-denominated indebtedness and accountsreceivable and (ii) fair value losses or gains on our currency derivatives used to stabilize our cash flow in U.S.dollars. In 2011, we had currency losses of US$1.382 billion, while in 2010 and 2009 we had currency gains ofUS$102 million and US$665 million, respectively. In addition, the price volatility of the Brazilian real, theCanadian dollar, the Australian dollar, the Indonesian rupiah and other currencies against the U.S. dollaraffect our results since most of our costs of goods sold are denominated in currencies other than the U.S.dollar, principally the real (59% in 2011) and the Canadian dollar (15% in 2011), while our revenues are
9

mostly U.S. dollar-denominated. We expect currency fluctuations to continue to affect our financial income,expense and cash flow generation.
Significant volatility in currency prices may also result in disruption of foreign exchange markets andmay limit our ability to transfer or to convert certain currencies into U.S. dollars and other currencies for thepurpose of making timely payments of interest and principal on our indebtedness. The central banks andgovernments of the countries in which we operate may institute restrictive exchange rate policies in the futureand impose taxes on foreign exchange transactions.
The integration between the Company and those acquisition targets that are a key part of the Company’sstrategies might prove more difficult than anticipated.
We may not be able to successfully integrate our acquired businesses. We have grown our business inpart through acquisitions, and some of our future growth could depend on acquisitions. Integration ofacquisition targets might take longer than expected and the costs associated with integration of acquisitiontargets might be higher than anticipated. In addition, if the focus on post-acquisition integration impacts theperformance of our existing businesses, our results and operations may be adversely affected. Completedacquisitions could fail to achieve the increased revenues, cost savings or operational benefits that wereanticipated at the time of their conception. Acquisitions could lead to the incurrence of substantial costs as aresult of, for example, unforeseen liabilities arising from acquired businesses, inability to retain key staff,inconsistencies in standards, controls, procedures and policies between the Company and the acquisitiontarget which could negatively affect our financial condition and results of operations. In addition, managementattention could be diverted from ordinary responsibilities to integration issues.
We are involved in several legal proceedings that could have a material adverse effect on our business inthe event of an outcome that is unfavorable to us.
We are involved in several legal proceedings in which adverse parties have claimed substantialamounts. Although we are vigorously contesting them, the outcomes of these proceedings are uncertain andmay result in obligations that could materially adversely affect our business and the value of our shares, ADSsand HDSs. In addition, under Brazilian law, a taxpayer intending to challenge a tax assessment in the judicialsystem must ordinarily provide the court with a bond or security in the amount of the assessment in order tosuspend collection efforts. In some of our tax litigation cases, we may be required to post bond or some formof security with the court, and, depending on the nature, amount and scope of such a bond or pledge, thismay have a significant financial impact on our business. For additional information, see Additionalinformation—Legal proceedings.
Risks relating to our corporate structure
Our controlling shareholder has significant influence over Vale, and the Brazilian government has certainveto rights.
As of March 31, 2012, Valepar S.A. (‘‘Valepar’’) owned 52.7% of our outstanding common stock and32.4% of our total outstanding capital. As a result of its share ownership, Valepar can control the outcome ofsome actions that require shareholder approval. For a description of our ownership structure and of theValepar shareholders’ agreement, see Share ownership and trading—Major shareholders.
The Brazilian government owns 12 golden shares of Vale, granting it limited veto power over certaincompany actions, such as changes to our name, the location of our headquarters and our corporate purposeas it relates to mining activities. For a detailed description of the Brazilian government’s veto powers, seeAdditional information—Memorandum and articles of association—Common shares and preferred shares.
10

Our governance and compliance processes may fail to prevent regulatory penalties and reputational harm.
We operate in a global environment, and our activities straddle multiple jurisdictions and complexregulatory frameworks with increased enforcement activities worldwide. Our governance and complianceprocesses, which include the review of internal control over financial reporting, may not prevent futurebreaches of law, accounting or governance standards. We may be subject to breaches of our Code of EthicalConduct, business conduct protocols and instances of fraudulent behavior and dishonesty by our employees,contractors or other agents. Our failure to comply with applicable laws and other standards could subject usto fines, loss of operating licenses and reputational harm.
It could be difficult for investors to enforce any judgment obtained outside Brazil against us or any of ourassociates.
Our investors may be located in jurisdictions outside Brazil and could seek to bring actions against usor our directors or officers in the courts of their home jurisdictions. The Company is a Brazilian company,and the majority of our officers and directors are residents of Brazil. The vast majority of our assets and theassets of our officers and directors are likely to be located in jurisdictions other than the home jurisdictions ofour investors. It might not be possible for the investors to effect service of process within their homejurisdictions on us or on our officers or directors who reside outside their home jurisdictions. In addition,foreign court orders will be enforceable in the courts of Brazil without a re-examination of the merits only ifpreviously confirmed by the Brazilian Superior Court of Justice (Superior Tribunal de Justica), whichconfirmation will only be granted if such judgment: (a) fulfills all formalities required for its enforceabilityunder the laws of the country where it was issued; (b) was issued by a competent court after due service ofprocess on the Company or after sufficient evidence of the Company’s absence has been given, as requiredunder applicable law; (c) is not subject to appeal; (d) was authenticated by a Brazilian consulate in thecountry in which it was issued and is accompanied by a sworn translation into the Portuguese language; and(e) is not contrary to Brazilian national sovereignty, public policy or good morals. Therefore, investors mightnot be able to recover against us or our directors and officers on judgments of the courts of their homejurisdictions predicated upon the laws of such jurisdictions.
Risks relating to our depositary shares
If ADR holders or HDR holders exchange ADSs or HDSs, respectively, for the underlying shares, they risklosing the ability to remit foreign currency abroad.
The custodian for the shares underlying our ADSs and HDSs maintains a registration with the CentralBank of Brazil entitling it to remit U.S. dollars outside Brazil for payments of dividends and otherdistributions relating to the shares underlying our ADSs and HDSs or upon the disposition of the underlyingshares. If an ADR holder or HDR holder exchanges its ADSs or HDSs for the underlying shares, it will beentitled to rely on the custodian’s registration for U.S. dollars for only five business days from the date ofexchange. Thereafter, an ADR holder or HDR holder may not be able to obtain and remit foreign currencyabroad upon the disposition of, or distributions relating to, the underlying shares unless it obtains its ownregistration under Resolution No. 2,689 of the National Monetary Council (‘‘CMN’’), which permits qualifyinginstitutional foreign investors to buy and sell securities on the BM&FBOVESPA. For more informationregarding these exchange controls, see Additional information—Exchange controls and other limitations affectingsecurity holders. If an ADR holder or HDR holder attempts to obtain its own registration, it may incurexpenses or suffer delays in the application process, which could delay the receipt of dividends or otherdistributions relating to the underlying shares or the return of capital in a timely manner.
We cannot assure ADR holders or HDR holders that the custodian’s registration or any registrationobtained will not be affected by future legislative changes, or that additional restrictions applicable to ADRholders or HDR holders, the disposition of the underlying shares or the repatriation of the proceeds fromdisposition will not be imposed in the future.
11

ADR holders and HDR holders may be unable to exercise preemptive rights relating to the sharesunderlying their ADSs and HDSs.
ADR holders and HDR holders may not be able to exercise preemptive rights or other types of rightswith respect to the underlying shares. The ability of ADR holders and HDR holders to exercise preemptiverights is not assured, particularly if the applicable law in the holder’s jurisdiction (for example, the SecuritiesAct in the United States or the Companies Ordinance in Hong Kong) requires that either a registrationstatement be effective or an exemption from registration be available with respect to those rights, as is in thecase in the United States, or that any document offering preemptive rights be registered as a prospectus, as isthe case in Hong Kong. We are not obligated to file a registration statement in the United States, or to makeany other similar filing in any other jurisdiction, relating to preemptive rights or to undertake steps that maybe needed to make exemptions from registration available, and we cannot assure holders that we will file anyregistration statement or take such steps. We are also not obligated to extend the offer of preemptive rightsto HDR holders through the depositary. For a more complete description of preemptive rights with respect tothe underlying shares, see Additional information—Memorandum and articles of association—Preemptive rights.
ADR holders and HDR holders may encounter difficulties in the exercise of voting rights.
ADR holders and HDR holders do not have the rights of shareholders. They have only thecontractual rights set forth for their benefit under the deposit agreements. ADR holders and HDR holdersare not permitted to attend shareholders’ meetings, and they may only vote by providing instructions to thedepositary. In the event that we fail to provide the depositary with voting materials on a timely basis, or thedepositary does not provide sufficient time for ADR holders and HDR holders to submit voting instructions,ADR holders and HDR holders will not be able to vote. With respect to ADSs for which instructions are notreceived, the depositary may, subject to certain limitations, grant a proxy to a person designated by us.
The legal protections for holders of our securities differ from one jurisdiction to another and may beinconsistent, unfamiliar or less effective than investors anticipate.
We are a global company with securities traded in several different markets and investors located inmany different countries. The legal regime for the protection of investors varies around the world, sometimesin important respects, and investors in our securities should recognize that the protections and remediesavailable to them may be different from those to which they are accustomed in their home markets. We aresubject to securities legislation in several countries, which have different rules, supervision and enforcementpractices. The only corporate law applicable to us is the law of Brazil, with its specific substantive rules andjudicial procedures. We are subject to corporate governance rules in several jurisdictions where our securitiesare listed, but as a foreign private issuer, we are not required to follow many of the corporate governancerules that apply to U.S. domestic issuers with securities listed on the New York Stock Exchange, and we arenot subject to the U.S. proxy rules. Similarly, we have been granted waivers and exemptions from certainrequirements of the Rules Governing the Listing of Securities on The Stock Exchange of Hong Kong Limited(‘‘HKEx Listing Rules’’), the Codes on Takeovers and Mergers and Share Repurchases and the Securities andFutures Ordinance of Hong Kong that are generally applicable to issuers listed in Hong Kong.
PRESENTATION OF FINANCIAL INFORMATION
We have prepared our financial statements in this annual report in accordance with generally acceptedaccounting principles in the United States (‘‘U.S. GAAP’’). We also publish financial statements in accordancewith International Financial Reporting Standards (‘‘IFRS’’), which differ in certain respects from U.S. GAAP,and use IFRS in reports to Brazilian shareholders, in CVM filings, and in determining the legal minimumdividend under Brazilian law.
Our financial statements and the other financial information in this annual report have beentranslated from Brazilian reais into U.S. dollars on the basis explained in Note 3 to our financial statements,unless we indicate otherwise.
12

SELECTED FINANCIAL DATA
The tables below present selected consolidated financial information as of and for the periodsindicated. You should read this information together with our consolidated financial statements in this annualreport.
Statement of income data
For the year ended December 31,
2007 2008 2009 2010 2011
(US$ million)Net operating revenues . . . . . . . . . . . . . . . . . . . . . . . . . . . . . . . . . . . . . 32,242 37,426 23,311 45,293 58,990Cost of products and services . . . . . . . . . . . . . . . . . . . . . . . . . . . . . . . . . (16,463) (17,641) (13,621) (18,814) (23,573)Selling, general and administrative expenses . . . . . . . . . . . . . . . . . . . . . . . . . (1,245) (1,748) (1,130) (1,701) (2,334)Research and development . . . . . . . . . . . . . . . . . . . . . . . . . . . . . . . . . . . (733) (1,085) (981) (878) (1,674)Impairment of goodwill . . . . . . . . . . . . . . . . . . . . . . . . . . . . . . . . . . . . . – (950) – – –Gain on sale of assets . . . . . . . . . . . . . . . . . . . . . . . . . . . . . . . . . . . . . . – – – – 1,513Other expenses . . . . . . . . . . . . . . . . . . . . . . . . . . . . . . . . . . . . . . . . . . (607) (1,254) (1,522) (2,205) (2,810)
Operating income . . . . . . . . . . . . . . . . . . . . . . . . . . . . . . . . . . . . . . . . 13,194 14,748 6,057 21,695 30,112
Non-operating income (expenses):Financial income (expenses), net . . . . . . . . . . . . . . . . . . . . . . . . . . . . . . (1,291) (1,975) 351 (1,725) (1,672)Exchange and monetary gains, net . . . . . . . . . . . . . . . . . . . . . . . . . . . . . 2,553 364 675 344 (1,641)Gain on sale of investments . . . . . . . . . . . . . . . . . . . . . . . . . . . . . . . . . 777 80 40 – –
Subtotal . . . . . . . . . . . . . . . . . . . . . . . . . . . . . . . . . . . . . . . . . . . 2,039 (1,531) 1,066 (1,381) (3,313)
Income before income taxes and equity results . . . . . . . . . . . . . . . . . . . . . . . 15,233 13,217 7,123 20,314 26,799Income taxes charge . . . . . . . . . . . . . . . . . . . . . . . . . . . . . . . . . . . . . . . (3,201) (535) (2,100) (3,705) (5,282)Equity in results of affiliates and joint ventures and change in provision for gains on
equity investments . . . . . . . . . . . . . . . . . . . . . . . . . . . . . . . . . . . . . . . 595 794 433 987 1,135
Net income from continuing operations . . . . . . . . . . . . . . . . . . . . . . . . . . . . 12,627 13,476 5,456 17,596 22,652Discontinued operations, net of tax . . . . . . . . . . . . . . . . . . . . . . . . . . . . . . – – – (143) –Net income . . . . . . . . . . . . . . . . . . . . . . . . . . . . . . . . . . . . . . . . . . . . 12,627 13,476 5,456 17,453 22,652
Net income (loss) attributable to non-controlling interests . . . . . . . . . . . . . . . . . 802 258 107 189 (233)
Net income attributable to Company’s shareholders . . . . . . . . . . . . . . . . . . . . . 11,825 13,218 5,349 17,264 22,885
Total cash paid to shareholders(1) . . . . . . . . . . . . . . . . . . . . . . . . . . . . . . . 1,875 2,850 2,724 3,000 9,000
(1) Consists of total cash paid to shareholders during the period, whether classified as dividends or interest on shareholders’ equity.
13

Earnings per share
For the year ended December 31,(1)
2007 2008 2009 2010 2011
(US$, except as noted)Earnings per share:
Per common share . . . . . . . . . . . . . . . . . . . . . . . . . . . . . . . . . 2.41 2.58 0.97 3.23 4.33Per preferred share . . . . . . . . . . . . . . . . . . . . . . . . . . . . . . . . 2.41 2.58 0.97 3.23 4.33
Weighted average number of shares outstanding (in thousands)(2)(3):Common shares . . . . . . . . . . . . . . . . . . . . . . . . . . . . . . . . . . 2,943,216 3,028,817 3,181,706 3,210,023 3,197,063Preferred shares . . . . . . . . . . . . . . . . . . . . . . . . . . . . . . . . . . 1,889,171 1,946,454 2,030,700 2,035,783 1,984,030Treasury common shares underlying convertible notes . . . . . . . . . . . . 34,510 56,582 74,998 18,416 18,416Treasury preferred shares underlying convertible notes . . . . . . . . . . . . 18,478 30,295 77,580 47,285 47,285
Total . . . . . . . . . . . . . . . . . . . . . . . . . . . . . . . . . . . . . . . 4,885,375 5,062,148 5,364,984 5,311,507 5,246,794
Distributions to shareholders per share(4):In US$ . . . . . . . . . . . . . . . . . . . . . . . . . . . . . . . . . . . . . . . 0.39 0.56 0.53 0.57 1.74In R$ . . . . . . . . . . . . . . . . . . . . . . . . . . . . . . . . . . . . . . . . 0.74 1.09 1.01 0.98 2.89
(1) Share and per-share amounts for all periods give retroactive effect to all stock splits. We carried out a two-for-one stock split inSeptember 2007.
(2) Each common ADS represents one common share and each preferred ADS represents one preferred share.(3) Changes in the number of shares outstanding reflect a global equity offering in July 2008 and share repurchase programs conducted
from October 2008 to May 2009, from September 2010 to October 2010 and from May 2011 to November 2011. For more informationsee Share ownership and trading—Purchases of equity securities by the issuer and affiliated purchasers.
(4) Our distributions to shareholders may be classified as either dividends or interest on shareholders’ equity. In many years, part of eachdistribution has been classified as interest on shareholders’ equity and part has been classified as dividends. For information aboutdistributions paid to shareholders, see Share ownership and trading—Distributions.
Balance sheet data
At December 31,
2007 2008 2009 2010 2011
(US$ million)Current assets . . . . . . . . . . . . . . . . . . . . . . . . . . . . . . . . . . . . . . . . . . . 11,380 23,238 21,294 31,791 21,736Property, plant and equipment, net and intangible assets . . . . . . . . . . . . . . . . . . 54,625 49,329 68,810 84,370 90,030Investments in affiliated companies and joint ventures and other investments . . . . . . 2,922 2,408 4,585 4,497 8,093Other assets . . . . . . . . . . . . . . . . . . . . . . . . . . . . . . . . . . . . . . . . . . . . 7,790 5,017 7,590 8,481 8,869
Total assets . . . . . . . . . . . . . . . . . . . . . . . . . . . . . . . . . . . . . . . . . . . 76,717 79,992 102,279 129,139 128,728
Current liabilities . . . . . . . . . . . . . . . . . . . . . . . . . . . . . . . . . . . . . . . . . 10,083 7,237 9,181 17,912 11,043Long-term liabilities(1) . . . . . . . . . . . . . . . . . . . . . . . . . . . . . . . . . . . . . . 13,195 10,173 12,703 17,195 16,033Long-term debt(2) . . . . . . . . . . . . . . . . . . . . . . . . . . . . . . . . . . . . . . . . 17,608 17,535 19,898 21,591 21,538
Total liabilities . . . . . . . . . . . . . . . . . . . . . . . . . . . . . . . . . . . . . . . . . 40,886 34,945 41,782 56,698 48,614Redeemable non-controlling interests . . . . . . . . . . . . . . . . . . . . . . . . . . . . 375 599 731 712 505
Shareholders’ equity:Capital stock . . . . . . . . . . . . . . . . . . . . . . . . . . . . . . . . . . . . . . . . . 12,306 23,848 23,839 23,726 36,903Additional paid-in capital . . . . . . . . . . . . . . . . . . . . . . . . . . . . . . . . . . 498 393 411 2,188 (61)Mandatorily convertible notes—common ADSs . . . . . . . . . . . . . . . . . . . . . 1,288 1,288 1,578 290 290Mandatorily convertible notes—preferred ADSs . . . . . . . . . . . . . . . . . . . . . 581 581 1,225 644 644Reserves and retained earnings . . . . . . . . . . . . . . . . . . . . . . . . . . . . . . 18,603 16,446 29,882 42,051 39,939
Total Company shareholders’ equity . . . . . . . . . . . . . . . . . . . . . . . . . . . . . 33,276 42,556 56,935 68,899 77,715
Non-controlling interests . . . . . . . . . . . . . . . . . . . . . . . . . . . . . . . . . . . 2,180 1,892 2,831 2,830 1,894
Total shareholders’ equity . . . . . . . . . . . . . . . . . . . . . . . . . . . . . . . . . . 35,456 44,448 59,766 71,729 79,609
Total liabilities and shareholders’ equity . . . . . . . . . . . . . . . . . . . . . . . . . 76,717 79,992 102,279 129,139 128,728
(1) Excludes long-term debt.(2) Excludes current portion of long-term debt.
14

I. INFORMATION ON THE COMPANY
BUSINESS OVERVIEW
Summary
We are the second-largest metals and mining company in the world and the largest in the Americas,based on market capitalization. We are the world’s largest producer of iron ore and iron ore pellets and theworld’s second-largest producer of nickel. We are one of the world’s largest producers of manganese ore andferroalloys. We also produce copper, thermal and metallurgical coal, phosphates, potash, cobalt and platinumgroup metals (‘‘PGMs’’). To support our growth strategy, we are actively engaged in mineral explorationefforts in 27 countries around the globe. We operate large logistics systems in Brazil and other regions of theworld, including railroads, maritime terminals and ports, which are integrated with our mining operations. Inaddition, we have a maritime freight portfolio to transport iron ore. Directly and through affiliates and jointventures, we also have investments in energy and steel businesses.
The following table presents the breakdown of our total gross operating revenues attributable to eachof our main lines of business.
Year ended December 31,
2009 2010 2011
(US$ million) (% of total) (US$ million) (% of total) (US$ million) (% of total)Bulk materials:
Iron ore . . . . . . . . . . . . . . . US$12,831 53.6% US$26,384 56.8% US$35,008 58.0%Iron ore pellets . . . . . . . . . . . 1,352 5.6 6,402 13.7 8,150 13.5Manganese . . . . . . . . . . . . . 145 0.6 258 0.6 171 0.3Ferroalloys . . . . . . . . . . . . . . 372 1.6 664 1.4 561 0.9Coal . . . . . . . . . . . . . . . . . 505 2.1 770 1.6 1,058 1.7
Subtotal–bulk materials . . . . . US$15,205 63.5% US$34,478 74.2% US$44,948 74.4%Base metals:
Nickel . . . . . . . . . . . . . . . . US$ 3,260 13.6% US$ 3,835 8.2% US$ 5,720 9.5%Copper . . . . . . . . . . . . . . . . 1,130 4.7 1,608 3.4 2,692 4.4PGMs . . . . . . . . . . . . . . . . 132 0.6 101 0.2 492 0.8Other precious metals . . . . . . . 65 0.3 72 0.2 246 0.4Cobalt . . . . . . . . . . . . . . . . 42 0.2 30 0.1 94 0.2Aluminum . . . . . . . . . . . . . . 2,050 8.6 2,554 5.5 383 0.6
Subtotal–base metals . . . . . . US$ 6,679 28.0% US$ 8,200 17.6% US$ 9,627 15.9%Fertilizer nutrients . . . . . . . . . . 413 1.7 1,846 4.0 3,547 5.9Logistics . . . . . . . . . . . . . . . . 1,104 4.6 1,465 3.2 1,726 2.9Other products and services(1) . . . 538 2.2 492 1.1 541 0.9
Total gross operating revenues . . . . US$23,939 100.0% US$46,481 100.0% US$60,389 100.0%
(1) Includes kaolin, pig iron and energy.
� Bulk materials:
� Iron ore and iron ore pellets. We operate four systems in Brazil for producing anddistributing iron ore, which we refer to as the Northern, Southeastern, Southern andMidwestern systems. The Northern and the Southeastern systems are fully integrated,consisting of mines, railroads, a maritime terminal and a port. The Southern Systemconsists of three mining sites and two maritime terminals. We operate 10 pellet plants inBrazil and two in Oman, both of which have been ramping up since November 2011. Wealso have a 50% stake in a joint venture that owns three integrated pellet plants in Braziland 25% stakes in two pellet companies in China.
15
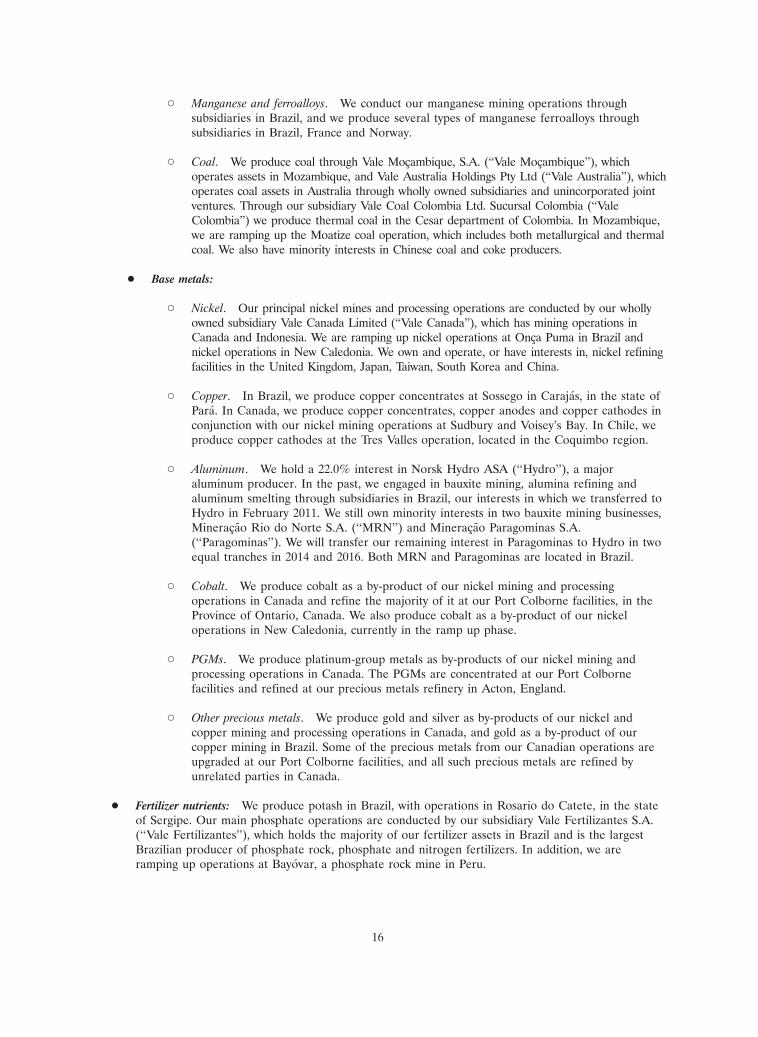
� Manganese and ferroalloys. We conduct our manganese mining operations throughsubsidiaries in Brazil, and we produce several types of manganese ferroalloys throughsubsidiaries in Brazil, France and Norway.
� Coal. We produce coal through Vale Mocambique, S.A. (‘‘Vale Mocambique’’), whichoperates assets in Mozambique, and Vale Australia Holdings Pty Ltd (‘‘Vale Australia’’), whichoperates coal assets in Australia through wholly owned subsidiaries and unincorporated jointventures. Through our subsidiary Vale Coal Colombia Ltd. Sucursal Colombia (‘‘ValeColombia’’) we produce thermal coal in the Cesar department of Colombia. In Mozambique,we are ramping up the Moatize coal operation, which includes both metallurgical and thermalcoal. We also have minority interests in Chinese coal and coke producers.
� Base metals:
� Nickel. Our principal nickel mines and processing operations are conducted by our whollyowned subsidiary Vale Canada Limited (‘‘Vale Canada’’), which has mining operations inCanada and Indonesia. We are ramping up nickel operations at Onca Puma in Brazil andnickel operations in New Caledonia. We own and operate, or have interests in, nickel refiningfacilities in the United Kingdom, Japan, Taiwan, South Korea and China.
� Copper. In Brazil, we produce copper concentrates at Sossego in Carajas, in the state ofPara. In Canada, we produce copper concentrates, copper anodes and copper cathodes inconjunction with our nickel mining operations at Sudbury and Voisey’s Bay. In Chile, weproduce copper cathodes at the Tres Valles operation, located in the Coquimbo region.
� Aluminum. We hold a 22.0% interest in Norsk Hydro ASA (‘‘Hydro’’), a majoraluminum producer. In the past, we engaged in bauxite mining, alumina refining andaluminum smelting through subsidiaries in Brazil, our interests in which we transferred toHydro in February 2011. We still own minority interests in two bauxite mining businesses,Mineracao Rio do Norte S.A. (‘‘MRN’’) and Mineracao Paragominas S.A.(‘‘Paragominas’’). We will transfer our remaining interest in Paragominas to Hydro in twoequal tranches in 2014 and 2016. Both MRN and Paragominas are located in Brazil.
� Cobalt. We produce cobalt as a by-product of our nickel mining and processingoperations in Canada and refine the majority of it at our Port Colborne facilities, in theProvince of Ontario, Canada. We also produce cobalt as a by-product of our nickeloperations in New Caledonia, currently in the ramp up phase.
� PGMs. We produce platinum-group metals as by-products of our nickel mining andprocessing operations in Canada. The PGMs are concentrated at our Port Colbornefacilities and refined at our precious metals refinery in Acton, England.
� Other precious metals. We produce gold and silver as by-products of our nickel andcopper mining and processing operations in Canada, and gold as a by-product of ourcopper mining in Brazil. Some of the precious metals from our Canadian operations areupgraded at our Port Colborne facilities, and all such precious metals are refined byunrelated parties in Canada.
� Fertilizer nutrients: We produce potash in Brazil, with operations in Rosario do Catete, in the stateof Sergipe. Our main phosphate operations are conducted by our subsidiary Vale Fertilizantes S.A.(‘‘Vale Fertilizantes’’), which holds the majority of our fertilizer assets in Brazil and is the largestBrazilian producer of phosphate rock, phosphate and nitrogen fertilizers. In addition, we areramping up operations at Bayovar, a phosphate rock mine in Peru.
16

� Logistics: We are a leading operator of logistics services in Brazil and other regions of the world,with railroads, maritime terminals and ports. Two of our four iron ore systems incorporate anintegrated railroad network linked to automated port and terminal facilities, which provide railtransportation for our mining products, general cargo and passengers, bulk terminal storage, andship loading services for our mining operations and for customers. We also own a majority stake inSociedade de Desenvolvimento do Corredor de Nacala—S.A. (‘‘SDCN’’), with railroad concessionsin Malawi and Mozambique, and have plans to construct a world-class logistics infrastructure tosupport our operations in Central and Eastern Africa. In addition, since 2010 we have an agreementfor partial assignment, subject to government approvals, of a 756-kilometer railroad concession toprovide support to our Rio Colorado potash project in Argentina. We conduct seaborne dry bulkshipping and provide tug boat services. We own and charter vessels to transport iron ore that we sellon a cost and freight (‘‘CFR’’) basis to customers. Our tug boat services provide an efficient and safetowing service at our terminals in Brazil. We also own a 31.3% interest in Log-In LogısticaIntermodal S.A. (‘‘Log-In’’), which provides intermodal logistics services in Brazil, Argentina andUruguay, and a 45.8% interest in MRS Logıstica S.A. (‘‘MRS’’), which transports our iron oreproducts from the Southern System mines to our Guaıba Island and Itaguaı maritime terminals, inthe state of Rio de Janeiro.
Business strategy
Our mission is to transform natural resources into prosperity and sustainable development. Our visionis to become the number one global natural resources company, creating long-term value through excellenceand passion for people and the planet. We aim to increase our demand driver, mineral and geographicaldiversification and logistics capabilities. Iron ore and nickel will continue to be our main businesses while weboost the production capacity of our copper, coking coal and fertilizer nutrients businesses. To enhance ourcompetitiveness, we will continue to invest in our railroads, maritime terminals, maritime freight portfolio andpower generation capacity. We continue to seek opportunities to make strategic acquisitions and partnerships,while focusing on disciplined capital management in order to maximize return on invested capital and totalreturn to shareholders. We also dispose of assets from time to time that we have determined to benon-strategic or in order to optimize the structure of our business portfolio, but no such divestitures occurredin 2011. Below are the highlights of our major business strategies.
Maintaining our leadership position in the global iron ore market
We continue to consolidate our leadership in the global iron ore market. In 2011 and 2010, we had anestimated market share of 24.3% and 24.7%, respectively, of the total volume traded in the seaborne market.We are committed to maintaining our leadership position in the global iron ore market, by focusing ourproduct line to capture industry trends, increasing our production capacity in line with demand growth,controlling costs, strengthening our logistics infrastructure of railroads, ports, shipping and distributioncenters, and strengthening relationships with customers. Our diversified portfolio of high quality products,strong technical marketing strategy, efficient logistics and strong and long-standing relationships with majorcustomers will help us achieve this goal. We have also encouraged steelmakers to develop steel projects inBrazil through joint ventures in which we may hold minority stakes, in order to create additional demand forour iron ore.
Achieving leadership in the nickel business
We are the world’s second-largest nickel producer, with large-scale, long-life and low-cost operations, asubstantial resource base, diversified mining operations producing nickel from nickel sulfides and laterites,advanced technology and a robust growth profile. We have refineries in North America, Europe and Asia,which produce an array of products for use in most nickel applications. We are a leading producer ofhigh-quality nickel products for non-stainless steel applications, such as plating, alloy steels, high nickel alloysand batteries, which represented 66% of our nickel sales in 2011. Our long-term goal is to strengthen ourleadership in the nickel business.
17

Expanding our copper businesses
We operate the Sossego copper mine in Carajas, in the Brazilian state of Para, and the Tres Vallescopper mine in Chile. We also recover copper in conjunction with our nickel operations, principally atSudbury and Voisey’s Bay, in Canada. We believe that our copper projects, most of which are situated inCarajas, could be among the most competitive in the world in terms of investment cost per metric ton of ore.We are in the final phase of construction of the Salobo project to produce copper concentrate. We expectthese copper mines to benefit from our infrastructure facilities serving the Northern System. We aredeveloping the Konkola North copper mine in Zambia, Africa through a joint venture with African RainbowMinerals Limited (‘‘ARM’’), which has an 80% stake in the project, with the remaining 20% stake held byZambia Consolidated Copper Mines Ltd. We are also engaged in mineral exploration in several countries inorder to increase our reserve base.
Investing in coal
We are pursuing various opportunities to become a large global player in the coal business. We havecoal operating assets and a portfolio of exploration projects in Mozambique, Australia and Colombia, andminority interests in two joint ventures in China. We intend to continue pursuing organic growth in the coalbusiness through the expansion of the Moatize project in Mozambique, the development of more advancedcoal exploration projects in Australia and Colombia, and mineral exploration initiatives in several countries.
Investing in fertilizer nutrients
We are actively investing to become one of the world’s largest producers of potash and phosphaterock in order to benefit from rising global consumption of agricultural products, which is expected to growsignificantly in coming years, especially in emerging market countries. We expect per capita income growthand the growing use of biofuels to drive demand for fertilizers. In this context, Brazil is expected to play a keyrole in the global agricultural market, given its position as a global agricultural powerhouse and its growthpotential, mainly due to its access to water and arable land.
We operate a potash mine in Brazil (Taquari-Vassouras) and the Bayovar phosphate rock operation inPeru, and, in 2010, we expanded our fertilizer nutrients operations through the acquisition of Brazilianphosphate and nitrogen operations, now consolidated under our wholly owned subsidiary Vale Fertilizantes.Our portfolio also includes potash projects in Argentina, Brazil and Canada, as well as several phosphate rockand potash mineral exploration projects around the world as part of our growth strategy. For moreinformation, see—Significant changes in our business below.
Diversification and expansion of our resource base
We are actively engaged in a mineral exploration program, with efforts in 27 countries around theglobe. We are mainly seeking new deposits of coal, copper, iron ore, manganese ore, nickel, phosphates andpotash. Mineral exploration is an important part of our organic growth strategy.
Enhancing our logistics capacity to support our bulk materials business
We believe that the quality of our railway assets and extensive experience as a railroad and portoperator, together with the lack of efficient transportation for general cargo in Brazil, position us as a leaderin the logistics business in Brazil. We have been expanding the capacity of our railroads, primarily to meet theneeds of our iron ore business.
To support our commercial strategy for our iron ore business, we continue to invest in a dedicatedmaritime freight shuttle service from Brazil to Asia and in the development of distribution centers in Asia andthe Middle East, in order to minimize freight costs and maximize flexibility, so as to enhance thecompetitiveness of our iron ore business in these regions.
In order to position ourselves for future expansion of our coal production in Mozambique andleverage our presence in Africa, we acquired an additional 16% of SDCN, bringing our total stake in SDCN
18

to 67% at year-end, and we plan to expand its capacity, by rehabilitating the existing railroad. New railroadswill be constructed to develop the logistics corridor from our mine to a new port to be built atNacala-a-Velha.
Optimizing our energy matrix
Energy management and efficient supply have become a priority for us. As a large consumer ofelectricity, we believe that investing in power generation projects to support our operations will help protectus against volatility in the price of energy, regulatory uncertainties and the risk of energy shortages.Accordingly, we have developed hydroelectric power generation plants in Brazil, Canada and Indonesia, andwe currently generate 48% of our worldwide electricity needs from our own plants, after accounting for thetransfer of our aluminum production portfolio.
We are seeking to develop a cleaner energy matrix by investing to develop clean energy sources suchas biofuels and windpower, and focusing on reducing our carbon footprint.
Significant changes in our business
We summarize below major acquisitions, divestitures and other significant developments since thebeginning of 2011.
Index-based pricing for iron ore
Starting in the first half of 2010, we reached agreements with all our iron ore customers to movecontracts from annual benchmark pricing to index-based pricing to better reflect market fundamentals. Theprevious annual benchmark pricing system for iron ore, based on annual bilateral negotiations, was initiallyreplaced by a system under which iron ore prices were established quarterly, based on a three-month averageof price indices for the period ending one month before the beginning of the new quarter. Since the lastquarter of 2011, we have also reached agreements with some customers to price our products on a quarterlybasis using the current quarter’s three-month average of price indices and, with other customers, using themonthly average of the price indices or spot prices. The move towards increased price flexibility brings moreefficiency and transparency to iron ore pricing and allows for the recognition of quality differences, whichhelps encourage long-term investment. In addition, many customers value the ability to know beforehand theprice to be paid in each quarter.
Consolidation of phosphate operations in Brazil
On December 12, 2011, our wholly owned subsidiary Mineracao Naque S.A. concluded a tender offerto acquire up to 100% of the publicly held shares of our subsidiary Vale Fertilizantes. As a result of thepublic offer, we acquired 211,014 common shares and 82,919,456 preferred shares of Vale Fertilizantes,representing 83.8% of the publicly held common shares and 94.0% of the publicly held preferred shares ofVale Fertilizantes, which correspond to 0.1% of the total common shares and 29.8% of the total preferredshares of Vale Fertilizantes. Both the common and preferred shares were acquired for R$25.00 per share,amounting to a total of R$2.1 billion (US$1.1 billion). Shortly thereafter, Vale Fertilizantes’ registration as apublicly listed company in Brazil was cancelled. In January 2012, the shareholders of Vale Fertilizantesapproved the redemption of the remaining free floating common and preferred shares. As a result, Vale holds100% of the common shares and 100% of the preferred shares of Vale Fertilizantes.
Acquisition of Biopalma in Brazil
In February 2011, we invested US$173.5 million to acquire control of Biopalma, in the Brazilian stateof Para. Biopalma will produce palm oil, a raw material used to make biodiesel, and most of the productionwill be used for a B20 mix (a blend of 20% biodiesel and 80% regular diesel) to power our fleet oflocomotives, heavy-duty machinery and equipment. Our investment in producing biodiesel is part of ourstrategic emphasis on global sustainability and greenhouse gas emissions reduction.
19
Acquisition of stake in Belo Monte energy project
In June 2011, we acquired 9% of Norte Energia S.A. (‘‘NESA’’). NESA was established to developand operate the Belo Monte hydroelectric plant in the Brazilian state of Para. Vale reimbursed the seller forcapital invested in NESA and will assume future capital investment commitments related to the acquiredstake, which are estimated at US$1.6 billion. The acquisition is consistent with our strategy of reducingoperational costs and minimizing energy price and supply risks.
Organic growth
We have an extensive program of investments in the organic growth of our businesses. Our maininvestment projects are summarized under—Capital expenditures and projects. The most significant projectsthat have come on stream since the beginning of 2011 are summarized below:
� Onca Puma—In March of 2011, we started the ramp-up of Onca Puma, a ferro-nickel operation(mine and processing plant) in the Brazilian state of Para, built mostly on lateritic nickel depositsof saprolitic ore. Its nominal production capacity is 53,000 metric tons per year of nickelcontained in ferro-nickel, its final product.
� Oman—We started up production of direct reduction pellets in the industrial site of Sohar,Oman, with estimated aggregate capacity of 9.0 Mtpy. Each plant has capacity to produce 4.5Mtpy. The first plant is producing at full capacity rates and the second plant has been ramping upsince November 2011. The bulk terminal and a distribution center with the capacity to handle 40Mt annually are fully operational.
� Estreito—In 2011, four of the eight turbines of the Estreito hydroelectric power plant becameoperational. Estreito is our first hydroelectric power plant in the Northern region and is locatedin the Tocantins River, on the border of the Brazilian states of Maranhao and Tocantins. Theplant will have an installed capacity of 1,087 megawatts. We have a 30% stake in the consortiumthat operates the plant.
� Moatize—The first phase of the Moatize coal project began operations in August 2011. Totalcapacity is 11 Mtpy, 8.5 Mt of coking coal, chiefly premium hard coking coal, and 2.5 Mt ofthermal coal. In November 2011, the Board of Directors approved Moatize II, which will increasecoal production capacity in Mozambique to 22 Mtpy, as well as the implementation of the NacalaCorridor project, a world-class logistics railway and port infrastructure to support the expansion ofproduction capacity at Moatize.
� Karebbe—The Karebbe hydroelectric power plant in Sulawesi, Indonesia came on stream inSeptember 2011 and is projected to add 90 megawatts of average generating capacity. The plantsupplies power to our Indonesian operations, which reduces our production costs and enables thepotential expansion of nickel matte production.
Aluminum portfolio management
In February 2011, we transferred a substantial part of our aluminum businesses to Hydro, anintegrated aluminum company with operations in Norway and other countries that is listed on the Oslo StockExchange and the London Stock Exchange (ticker symbol: NHY). We transferred our interests in AlumınioBrasileiro S.A. (‘‘Albras’’), Alumina do Norte do Brasil S.A. (‘‘Alunorte’’) and Companhia de Alumina doPara (‘‘CAP’’), with net debt of US$655 million, along with off-take rights and outstanding commercialcontracts, for US$503 million in cash and shares in Hydro representing a 22% interest in its equity. As part ofthe transaction, we transferred the Paragominas bauxite mine and all of our other Brazilian bauxite mineralrights (apart from rights owned through our stake in MRN) to the newly incorporated company Paragominas,60% of which we transferred to Hydro in exchange for US$578 million in cash. We will transfer our interestin Paragominas in two equal tranches in 2014 and 2016, each in exchange for US$200 million in cash, subjectto certain contingent adjustments. In addition, under the agreement, we have appointed one director toHydro’s board.
20

LINES OF BUSINESS
Our principal lines of business consist of mining and logistics services. We also invest in energy tosupply part of our consumption. This section presents information about operations, production, sales andcompetition and is organized as follows.
1. Bulk materials 2.2 Copper2.2.1 Operations
1.1 Iron ore 2.2.2 Production1.1.1 Operations 2.2.3 Customers and sales1.1.2 Production 2.2.4 Competition
1.2 Iron ore pellets 2.3 Aluminum1.2.1 Operations1.2.2 Production 2.4 PGMs and other precious metals
1.3 Iron ore and iron ore pellets 2.5 Cobalt1.3.1 Customers, sales and marketing1.3.2 Competition 3. Fertilizer nutrients
1.4 Manganese ore 3.1 Phosphates
1.5 Ferroalloys 3.2 Potash
1.6 Manganese ore and ferroalloys: 3.3 Customers and salessales and competition
3.4 Competition1.7 Coal
1.7.1 Operations 4. Infrastructure1.7.2 Production1.7.3 Customers and sales 4.1 Logistics1.7.4 Competition 4.1.1 Railroads
4.1.2 Ports and maritime terminals2. Base metals 4.1.3 Shipping
2.1 Nickel 4.2 Energy2.1.1 Operations 4.2.1 Electric power2.1.2 Production 4.2.2 Oil and natural gas2.1.3 Customers and sales2.1.4 Competition 5. Other investments
21

17APR201209515974
22

1. Bulk materials
Our bulk materials business includes iron ore mining, iron ore pellet production, manganese oremining, ferroalloy production and coal production. Each of these activities is described below.
1.1 Iron ore
1.1.1 Operations
We conduct our iron ore business in Brazil primarily at the parent-company level and through ourwholly owned subsidiary Mineracao Corumbaense Reunidas S.A. (‘‘MCR’’). Our mines, all of which areopen-pit, and their related operations are mainly concentrated in three systems: the Southeastern System, theSouthern System and the Northern System, each with its own transportation capabilities. We also conductmining operations in the Midwestern System and through our joint venture Samarco Mineracao S.A.(‘‘Samarco’’).
Our share of capital
Company System Voting Total Partners
(%)Vale . . . . . . . . . . . . . . . . Northern, Southeastern, Southern and – – –
MidwesternMCR . . . . . . . . . . . . . . . Midwestern 100.0 100.0 –Samarco . . . . . . . . . . . . . – 50.0 50.0 BHP Billiton plc
Southeastern System
The Southeastern System mines are located in the Iron Quadrangle region of the state of MinasGerais, where they are divided into three mining sites: Itabira (comprised of two mines, with two majorbeneficiation plants), Minas Centrais (comprised of three mines, with three major beneficiation plants andone secondary plant) and Mariana (comprised of three mines, with four major beneficiation plants).
The ore reserves in these mining sites have high ratios of itabirite ore relative to hematite ore.Itabirite ore has iron grade of 35-60% and requires concentration to achieve shipping grade.
We conduct open-pit mining operations in the Southeastern System. At the three mining sites, wegenerally process the run-of-mine by means of standard crushing, classification and concentration steps,producing sinter feed, lump ore and pellet feed in the beneficiation plants located at the mining sites. In2011, we produced 64% of the electric energy consumed in the Southeastern System at our hydroelectricpower plants.
We own and operate integrated railroad and terminal networks in the three mining sites, which areaccessible by road or by spur tracks of our EFVM railroad. The EFVM railroad connects these mines to theTubarao port in Vitoria, in the state of Espırito Santo. For a more detailed description of the networks,see—Logistics.
Southern System
The Southern System mines are located in the Iron Quadrangle region of the state of Minas Gerais inBrazil. The mines of our subsidiary Mineracoes Brasileiras Reunidas S.A. (‘‘MBR’’) are operated at theparent-company level pursuant to an asset lease agreement. The Southern System has three major miningsites: Minas Itabirito (comprised of four mines, with two major beneficiation plants and three secondarybeneficiation plants); Vargem Grande (comprised of three mines and one major beneficiation plant); andParaopeba (comprised of four mines and four beneficiation plants).
23

We beneficiate run-of-mine obtained from open pit mining operations into sinter feed, lump ore andpellet feed. In 2011, we produced 94% of the electric energy consumed in the Southern System at ourhydroelectric power plants.
The ore reserves in the mining sites have high ratios of itabirite ore relative to hematite ore. Itabiriteore has iron grade of 35-60% and requires concentration to achieve shipping grade. We generally process therun-of-mine by means of standard crushing, classification and concentration steps, producing sinter feed, lumpore and pellet feed in the beneficiation plants located at the mining sites.
We enter into freight contracts with MRS, an affiliate railway company in which we own a 45.8%stake, to transport our iron ore products at market prices from the mines to our Guaıba Island and Itaguaımaritime terminals in the state of Rio de Janeiro.
Northern System
The Northern System mines, located in the Carajas mineral province of the Brazilian state of Para,contain some of the largest iron ore deposits in the world. The reserves are divided into Serra Norte, SerraSul and Serra Leste (northern, southern and eastern ranges) situated 35 kilometers apart. Since 1985, we havebeen conducting mining activities in the northern range, which is divided into three main mining bodies(N4W, N4E and N5). The Northern System has open-pit mines and an ore-processing plant. The mines arelocated on public lands for which we hold mining concessions.
The ore reserves in the Northern System are comprised of hematite. Because of the high grade(66.7% on average) of the Northern System deposits, we do not need to operate a concentration plant atCarajas. The beneficiation process consists simply of sizing operations, including screening, hydrocycloning,crushing and filtration. Output from the beneficiation process consists of sinter feed and pellet feed. Weobtain all of the electrical power for the Northern System at market prices from regional utilities.
We operate an integrated railroad and maritime terminal network in the Northern System. Aftercompletion of the beneficiation process, our EFC railroad transports the iron ore to the Ponta da Madeiramaritime terminal in the state of Maranhao. To support our Carajas operations, we have housing and otherfacilities in a nearby township. These operations are accessible by road, air and rail.
Midwestern System
The Midwestern System is comprised of the mines of Urucum and Corumba, located in the state ofMato Grosso do Sul.
We conduct open-pit mining operations in the Midwestern System. The Urucum ore reserves containa high ratio of hematite ore. In September 2009, we concluded the acquisition of the Corumba mine, wherewe produce lump ores. At the Urucum and Corumba mines, we generally process the run-of-mine by meansof standard crushing and classification steps, producing lumps and fines.
Iron ore products from the Urucum and Corumba mines are delivered to customers by bargestraveling along the Paraguay and Parana rivers.
Samarco
We own 50.0% of Samarco, which operates an integrated system comprised of a mine site, pipeline,three pellet plants and a port. Samarco’s Alegria mine site, located in Mariana, Minas Gerais, is in the sameregion as our Mariana site in the Southeastern System.
The ore reserves of Samarco are typically of itabirite type. Two beneficiation plants, located at thesite, process the run-of-mine by means of standard crushing, milling and concentration steps, producing pelletfeed and sinter feed.
24

Iron ore from Alegria and Fazendao, in our Southeastern System, supplies the Samarco pellet plantsusing a 396-kilometer pipeline, the longest pipeline in the world for the conveyance of iron ore. Samarco hasits own port facilities to transport its production.
1.1.2 Production
The following table sets forth information about our iron ore production.Production for the year ended December 31, Recovery
Mine/Plant Type 2009 2010 2011 rate
(million metric tons) (%)Southeastern System
ItabiraCaue(1) . . . . . . . . . . . . . . . . Open pit 13.8 19.3 18.6 63.7Conceicao(1) . . . . . . . . . . . . . Open pit 17.3 19.4 21.4 74.2
Minas CentraisAgua Limpa(2) . . . . . . . . . . . . Open pit 1.4 5.0 5.0 52.2Gongo Soco . . . . . . . . . . . . . . Open pit 2.7 6.8 5.3 100Brucutu . . . . . . . . . . . . . . . . Open pit 23.6 29.7 30.9 73.1Andrade(3) . . . . . . . . . . . . . . Open pit 0.7 – – –
MarianaAlegria . . . . . . . . . . . . . . . . . Open pit 12.1 13.6 14.7 80.9Fabrica Nova(4) . . . . . . . . . . . Open pit 13.7 12.5 13.2 72.4Fazendao(5) . . . . . . . . . . . . . . Open pit 3.1 10.6 11.1 100
Total Southeastern System . . . . . . . . . . . . . . 88.5 116.9 120.2Southern System
Minas ItabiritoSegredo/Joao Pereira(6) . . . . . . . Open pit 8.4 12.4 11.8 72.2Sapecado/Galinheiro(7) . . . . . . . Open pit 9.8 17.7 18.6 64.7
Vargem GrandeTamandua(8) . . . . . . . . . . . . . Open pit 7.3 8.6 8.8 79.7Capitao do Mato(8) . . . . . . . . . Open pit 8.0 8.2 7.3 79.7Aboboras . . . . . . . . . . . . . . . Open pit 5.4 5.2 5.3 100
ParaopebaJangada . . . . . . . . . . . . . . . . Open pit – 3.5 5.1 100Corrego do Feijao . . . . . . . . . . Open pit 5.6 6.8 6.8 77.9Capao Xavier(9) . . . . . . . . . . . Open pit 10.9 9.3 8.4 78Mar Azul . . . . . . . . . . . . . . . Open pit – 3.0 4.1 100
Total Southern System . . . . . . . . . . . . . . . . . 55.2 74.7 76.3Midwestern System
Corumba . . . . . . . . . . . . . . . . . Open pit 0.4 2.8 4.1 50.0Urucum . . . . . . . . . . . . . . . . . Open pit 0.5 1.4 1.5 76.0
Total Midwestern System . . . . . . . . . . . . . . . 1.0 4.2 5.6Northern System
Serra Norte(10)N4W . . . . . . . . . . . . . . . . . . Open pit 30.9 33.4 38.9 92.4N4E . . . . . . . . . . . . . . . . . . Open pit 16.9 22.2 20.1 92.4N5 . . . . . . . . . . . . . . . . . . . Open pit 36.8 45.6 50.8 92.4
Total Northern System . . . . . . . . . . . . . . . . . 84.6 101.2 109.8
Vale . . . . . . . . . . . . . . . . . . . . . . . . . . . . . . . 229.3 297.0 311.8Samarco(11) . . . . . . . . . . . . . . . . . . . . . . . . . . 8.6 10.8 10.8 57.6
Total . . . . . . . . . . . . . . . . . . . . . . . . . . . . . . . 238.0 307.8 322.6
(1) The run-of-mine from the Minas do Meio and Conceicao mines is sent to the Caue and Conceicao concentration plants.(2) Agua Limpa mine (previously named Agua Limpa/Cururu mine) and plants are owned by Baovale, in which we own 100% of the
voting shares and 50% of the total shares. Production figures for Agua Limpa have not been adjusted to reflect our ownership interest.(3) The lease for the Andrade mine was terminated in 2009.(4) Fabrica Nova ore is sent to the Alegria and Fabrica Nova plants.(5) Fazendao ore is sent to Samarco’s beneficiation plant.(6) Segredo and Joao Pereira ore is processed at the Fabrica plant.(7) Galinheiro and Sapecado ore is processed at the Pico plant.(8) Tamandua and Capitao do Mato ores are processed at the Vargem Grande plant.(9) Capao Xavier ore is processed at the Mutuca plant.(10) All Serra Norte ores are processed at the Carajas plant.(11) Production figures for Samarco, in which we have a 50% interest, are adjusted to reflect our ownership interest.
25

1.2 Iron ore pellets
1.2.1 Operations
Directly and through joint ventures, we produce iron ore pellets in Brazil, Oman and China, as setforth in the following table. Our total estimated nominal capacity is 43.7 Mtpy, not including the nominalcapacity of our joint ventures of 22.2 Mtpy from Samarco, 4.5 Mtpy from Hispanobras, 1.2 Mtpy from ZhuhaiYPM and 1.2 Mtpy from Anyang Yu Vale Yongtong Pellet Co., Ltd. (‘‘Anyang’’). After ramping up our pelletplants in Oman, we will add 9.0 Mtpy of nominal capacity.
Our share of capital
Company Site of operation Voting (%) Total Partners
Brazil:Vale . . . . . . . . . . . . . . . Tubarao, Fabrica, Vargem – – –
Grande and Sao LuısHispanobras . . . . . . . . . . Tubarao 51.0 50.9 Arcelor MittalSamarco . . . . . . . . . . . . Mariana and Anchieta 50.0 50.0 BHP Billiton plc
Oman:Vale Oman Pelletizing
Company LLC (VOPC)(1) Sohar industrial complex 100.0 100.0 –China:
Zhuhai YPM . . . . . . . . . . Zhuhai, Guangdong 25.0 25.0 Zhuhai Yueyufeng Iron and Steel Co. Ltd.,Pioneer Iron and Steel Group Coo, Ltd.(2)
Anyang . . . . . . . . . . . . . Anyang, Henan 25.0 25.0 Anyang Iron & Steel Co. Ltd.
(1) VOPC is currently 100% owned by Vale entities, but 30% of the shareholding of VOPC will be transferred to Oman Oil CompanyS.A.O.C. (‘‘OOC’’) during 2012 pursuant to a Shareholders’ Agreement dated 29 May 2010 between Vale International and OOC.
(2) Based on the most recent publicly filed business license of Zhuhai YPM.
In the Tubarao port area, in the Brazilian state of Espırito Santo, we operate our wholly owned pelletplants, Tubarao I and II, four plants we lease under operating leases and our jointly-owned plant,Hispanobras. We send iron ore from our Southeastern System mines to these plants and use our logisticsinfrastructure to distribute their final products.
Our Sao Luıs pellet plant, located in the Brazilian state of Maranhao, is part of the Northern System.We send Carajas iron ore to this plant and ship its production to customers through our Ponta da Madeiramaritime terminal.
The Fabrica and Vargem Grande pellet plants, located in the Brazilian state of Minas Gerais, are partof the Southern System. We send some of the iron ore from the Fabrica mine to the Fabrica plant, and ironore from the Pico mine to the Vargem Grande plant. We transport pellets from the Vargem Grande plantusing MRS, and pellets from the Fabrica plant using both MRS and EFVM.
We started up a pelletizing operation in the Sohar industrial complex in Oman, in the Middle East.The two pellet plants will each have production capacity of 4.5 Mtpy, totaling 9 Mtpy of capacity for directreduction pellets. The first plant is producing at full capacity rates and the second plant has been ramping upsince November 2011. The pellet plants are located in an area where we will have a distribution center withcapacity to handle 40 Mtpy.
Samarco operates three pellet plants in two operating sites with nominal capacity of 22.3 Mtpy. Thepellet plants are located in the Ponta Ubu unit, in Anchieta, Espırito Santo. In April 2011, our Board ofDirectors approved the construction of a fourth pellet plant with capacity of 8.3 Mtpy, increasing Samarco’siron ore pellet capacity to 30.5 Mtpy.
The Zhuhai YPM pellet plant, in China, is part of the Yueyufeng Steelmaking Complex. It has portfacilities, which we use to receive feed from our mines in Brazil. Zhuhai YPM’s main customer is ZhuhaiYueyufeng Iron & Steel (‘‘YYF’’), which is also located in the Yueyufeng Steelmaking Complex. We also owna 25.0% interest in Anyang, which is a pelletizing operation in China with the capacity to produce 1.2 Mtpythat started production in March 2011.
26

We sell pellet feed to our pelletizing joint ventures at market prices. Historically, we have supplied allof the iron ore requirements of our wholly owned production pellet plants and joint ventures, except forSamarco, Zhuhai YPM and Anyang, to which we supply only part of their requirements. Of our total 2011pellet production, 71.2% was blast furnace pellets and 28.8% was direct reduction pellets, which are used insteel mills that employ the direct reduction process rather than blast furnace technology.
We sell iron ore to our pelletizing joint ventures. In 2011, we sold 4.5 million metric tons toHispanobras, 12.0 million metric tons to Samarco and 1.2 million metric tons to Zhuhai YPM.
1.2.2 Production
The following table sets forth information about our main iron ore pellet production.
Production for the year ended December 31,
Company 2009 2010 2011
(million metric tons)Vale(1) . . . . . . . . . . . . . . . . . . . . . . . . . . . 15.3 36.3 39.0Hispanobras(2) . . . . . . . . . . . . . . . . . . . . . . 0.6 1.9 2.1Samarco(2) . . . . . . . . . . . . . . . . . . . . . . . . 8.0 10.8 10.7Zhuhai YPM(2) . . . . . . . . . . . . . . . . . . . . . 0.3 0.3 0.3Anyang(2) . . . . . . . . . . . . . . . . . . . . . . . . . – – 0.2
Total . . . . . . . . . . . . . . . . . . . . . . . . . . . 24.2 49.3 52.3
(1) Figure includes actual production, including production from the four pellet plants we leased in 2008. We signed a 10-year operatinglease contract for Itabrasco’s pellet plant in October 2008. We signed a five-year operating lease contract for Kobrasco’s pellet plant inJune 2008. We signed a 30-year operating lease contract for Nibrasco’s two pellet plants in May 2008.
(2) Production figures for Hispanobras, Samarco, Zhuhai YPM and Anyang have been adjusted to reflect our ownership interest.
1.3 Iron ore and iron ore pellets
1.3.1 Customers, sales and marketing
We supply all of our iron ore and iron ore pellets (including our share of joint-venture pelletproduction) to the steel industry. Prevailing and expected levels of demand for steel products affect demandfor our iron ore and iron ore pellets. Demand for steel products is influenced by many factors, such as globalmanufacturing production, civil construction and infrastructure spending. For further information aboutdemand and prices, see Operating and financial review and prospects—Demand and prices.
In 2011, China accounted for 44.1% of our iron ore and iron ore pellet shipments, and Asia as awhole accounted for 62.4%. Europe accounted for 18.9%, followed by Brazil with 13.4%. Our 10 largestcustomers collectively purchased 131.7 million metric tons of iron ore and iron ore pellets from us,representing 44.0% of our 2011 iron ore and iron ore pellet shipments and 46.0% of our total iron ore andiron ore pellet revenues. In 2011, no individual customer accounted for more than 10.0% of our iron ore andiron ore pellet shipments.
In 2011, the Asian market (mainly Japan, South Korea and Taiwan) and the European market werethe primary markets for our blast furnace pellets, while North America, the Middle East and North Africawere the primary markets for our direct reduction pellets.
We strongly emphasize customer service in order to improve our competitiveness. We work with ourcustomers to understand their main objectives and to provide them with iron ore solutions to meet specificcustomer needs. Using our expertise in mining, agglomeration and iron-making processes, we search fortechnical solutions that will balance the best use of our world-class mining assets and the satisfaction of ourcustomers. We believe that our ability to provide customers with a total iron ore solution and the quality ofour products are both very important advantages helping us to improve our competitiveness in relation to
27

competitors who may be more conveniently located geographically. In addition to offering technical assistanceto our customers, we operate sales support offices in Tokyo (Japan), Seoul (South Korea), Singapore, Dubai(UAE) and Shanghai (China), which support the sales made by our wholly owned subsidiary ValeInternational, located in St. Prex, Switzerland. These offices also allow us to stay in close contact with ourcustomers, monitor their requirements and our contract performance, and ensure that our customers receivetimely deliveries.
1.3.2 Competition
The global iron ore and iron ore pellet markets are highly competitive. The main factors affectingcompetition are price, quality and range of products offered, reliability, operating costs and shipping costs.
Our biggest competitors in the Asian market are located in Australia and include subsidiaries andaffiliates of BHP Billiton plc (‘‘BHP Billiton’’) and Rio Tinto Ltd (‘‘Rio Tinto’’). Although the transportationcosts of delivering iron ore from Australia to Asian customers are generally lower than ours as a result ofAustralia’s geographical proximity, we are competitive in the Asian market for two main reasons. First, steelcompanies generally seek to obtain the types (or blends) of iron ore and iron ore pellets that can produce theintended final product in the most economic and efficient manner. Our iron ore has low impurity levels andother properties that generally lead to lower processing costs. For example, in addition to its high grade, thealumina grade of our iron ore is very low compared to Australian ores, reducing consumption of coke andincreasing productivity in blast furnaces, which is particularly important during periods of high demand. Whenmarket demand is very strong, our quality differential is in many cases more valuable to customers than afreight differential. Second, steel companies often develop sales relationships based on a reliable supply of aspecific mix of iron ore and iron ore pellets. We have a customer-oriented marketing policy and placespecialized personnel in direct contact with our customers to help determine the blend that best suits eachparticular customer.
In terms of reliability, our ownership and operation of logistics facilities in the Northern andSoutheastern Systems help us ensure that our products are delivered on time and at a relatively low cost. Inaddition, we continue to develop a low-cost freight portfolio, aimed at enhancing our ability to offer ourproducts in the Asian market at competitive prices and to increase our market share. To support this strategy,we ordered new ships, purchased used vessels and entered into medium- and long-term freight contracts.
Our principal competitors in Europe are Kumba Iron Ore Limited, Luossavaara Kiirunavaara AB(‘‘LKAB’’), Societe Nationale Industrielle et Miniere (‘‘SNIM’’) and Iron Ore Company of Canada (‘‘IOC’’),a subsidiary of Rio Tinto. We are competitive in the European market not only for the same reasons we arecompetitive in Asia, but also due to the proximity of our port facilities to European customers.
The Brazilian iron ore market is also competitive. There are several small iron ore producers and newcompanies with developing projects, such as Anglo Ferrous Brazil, MMX, Ferrous Resources and BahiaMineracao. Some steel companies, including Gerdau S.A. (‘‘Gerdau’’), Companhia Siderurgica Nacional(‘‘CSN’’), V&M do Brasil S.A. (‘‘Mannesmann’’), Usiminas and Arcelor Mittal, also have iron ore miningoperations. Although pricing is relevant, quality and reliability are important competitive factors as well. Webelieve that our integrated transportation systems, high-quality ore and technical services make us a strongcompetitor in the Brazilian market.
The demand for iron ore is seasonally stronger in the months of December, March and April.Demand also tends to be moderately weaker in the first half of each year relative to the second half.
With respect to pellets, our major competitors are LKAB, Cliffs Natural Resources Inc., ArcelorMittal Mines Canada (formerly Quebec Cartier Mining Co.), IOC and Gulf Industrial Investment Co.
28

1.4 Manganese ore
We conduct our manganese mining operations in Brazil through our wholly owned subsidiaries ValeManganes S.A. (‘‘Vale Manganes’’), Vale Mina do Azul S.A. (‘‘Vale Mina do Azul’’) and MCR.
Our share of capital
Company Location Voting Total
(%)Brazil:
Vale Manganes . . . . . . . . . . . . . . . . . . Minas Gerais 100.0 100.0MCR . . . . . . . . . . . . . . . . . . . . . . . Mato Grosso do Sul 100.0 100.0Vale Mina do Azul(1) . . . . . . . . . . . . . . Para 100.0 100.0
(1) In August 2011, we organized Vale Mina do Azul, an entity 100% owned by Vale, to operate our manganese mine in the Brazilian stateof Para. Before that, Mina do Azul mine was operated by Vale Manganes.
Our mines produce three types of manganese ore products:
� metallurgical ore, used primarily for the production of ferroalloys;
� natural manganese dioxide, suitable for the manufacture of electrolytic batteries; and
� chemical ore, used in several industries for the production of fertilizer, pesticides and animalfeed, and used as a pigment in the ceramics industry.
We operate on-site beneficiation plants at our Azul mine and at the Urucum mines, which areaccessible by road. The Azul and Urucum mines have high-grade ores (at least 40% manganese grade), whileour Morro da Mina mine has low-grade ores (24% manganese grade). All of these mines obtain electricalpower at market prices from regional electric utilities. The following table sets forth information about ourmanganese production.
Production for the year ended December 31, RecoveryMine Type 2009 2010 2011 rate
(million metric tons) (%)Azul . . . . . . . . . . . . . . . . . . . . . . . . . . . . . . . Open pit 1.4 1.6 2.1 66.6Morro da Mina . . . . . . . . . . . . . . . . . . . . . . . . Open pit 0.1 0.1 0.1 88.0Urucum . . . . . . . . . . . . . . . . . . . . . . . . . . . . . Underground 0.2 0.2 0.3 80.4
Total . . . . . . . . . . . . . . . . . . . . . . . . . . . . . . . . . . . . . . . 1.7 1.8 2.5
1.5 Ferroalloys
The following table sets forth the subsidiaries through which we conduct our ferroalloys business.
Our share of capital
Company Location Voting Total
(%)Vale Manganes . . . . . . . . . . . . . . . Minas Gerais and Bahia, Brazil 100.0 100.0Vale Manganese France SAS . . . . . . . Dunkerque, France 100.0 100.0Vale Manganese Norway AS . . . . . . . . Mo I Rana, Norway 100.0 100.0
We produce several types of manganese ferroalloys, such as high carbon and medium carbon ferro-manganese and ferro-silicon manganese. Our facilities have total nominal capacity of 651,000 metric tons peryear. The production of ferroalloys consumes significant amounts of electricity, representing 11.7% of ourtotal consumption in 2011. The electricity supply for our ferroalloy plant in the Brazilian states of Minas
29

Gerais and Bahia and Mo I Rana, Norway are provided through long-term contracts. For information on therisks associated with potential energy shortages, see Risk factors.
The following table sets forth information about our ferroalloys production.
Production for the year ended December 31,
Company 2009 2010 2011
(thousand metric tons)Vale Manganes(1) . . . . . . . . . . . . . . . . . . 99 207 204Vale Manganese France SAS(2) . . . . . . . . . . 45 138 131Vale Manganese Norway AS . . . . . . . . . . . . 79 106 101
Total . . . . . . . . . . . . . . . . . . . . . . . . . 223 451 436
(1) Vale Manganes has three plants in Brazil: Barbacena and Ouro Preto in the state of Minas Gerais and Simoes Filho in the state ofBahia.
(2) Vale Manganese France SAS shut down its only furnace in August 2008 due to technical problems, resuming production in September2009.
1.6 Manganese ore and ferroalloys: sales and competition
The markets for manganese ore and ferroalloys are highly competitive. Competition in the manganeseore market takes place in two segments. High-grade manganese ore competes on a global seaborne basis,while low-grade ore competes on a regional basis. For some ferroalloys, high-grade ore is mandatory, whilefor others high- and low-grade ores are complementary. The main suppliers of high-grade ores are located inSouth Africa, Gabon, Australia and Brazil. The main producers of low-grade ores are located in the Ukraine,China, Ghana, Kazakhstan, India and Mexico.
The ferroalloy market is characterized by a large number of participants who compete primarily onthe basis of price. The principal competitive factors in this market are the costs of manganese ore, electricity,logistics and reductants. We compete both with stand-alone producers and integrated producers that also minetheir own ore. Our competitors are located principally in countries that produce manganese ore or steel. Forfurther information about demand and prices, see Operating and financial review and prospects—Demand andprices.
1.7 Coal
1.7.1 Operations
We produce metallurgical and thermal coal through our subsidiaries Vale Mocambique, which operatesMoatize, and Vale Australia, which operates coal assets in Australia through wholly owned companies andunincorporated joint ventures, and thermal coal through our subsidiary Vale Colombia.
30

We also have a minority interest in two Chinese companies, Henan Longyu EnergyResources Co., Ltd. (‘‘Longyu’’) and Shandong Yankuang International Coking Company Ltd. (‘‘Yankuang’’),as set forth in the following table.
Our shareCompany Business Location of capital Partners
(%)Vale Australia Australia:
Integra Coal . . . . . . . . Metallurgical and thermal coal Hunter Valley, New South Wales 61.2 Nippon Steel (‘‘NSC’’), JFEGroup (‘‘JFE’’), Posco,Toyota Tsusho Australia,Chubu ElectricPower Co. Ltd
Carborough Downs . . . . Metallurgical coal Bowen Basin, Queensland 85.0 JFE, Posco, Tata SteelIsaac Plains . . . . . . . . . Metallurgical and thermal coal Bowen Basin, Queensland 50.0 IP Coal Pty Ltd (a 100%
owned subsidiary of AquilaResources Limited)(1)
Broadlea . . . . . . . . . . Metallurgical and thermal coal Bowen Basin, Queensland 100.0 –
Vale ColombiaEl Hatillo . . . . . . . . . . Thermal coal Colombia 100.0 –
Longyu . . . . . . . . . . . . . Coal and other related products Henan Province, China 25.0 Yongmei Group Co., Ltd.(former Yongcheng Coal &Electricity(Group) Co. Ltd.), ShanghaiBaosteel InternationalEconomic &Trading Co., Ltd. and otherminority shareholders
Yankuang . . . . . . . . . . . Metallurgical coke and Shandong Province, China 25.0 Yankuang Group Co.methanol Limited, Itochu Corporation
Vale MocambiqueMoatize . . . . . . . . . . . Metallurgical and thermal coal Tete, Mozambique 95.0 Empresa Mocambicana de
Exploracao Mineira, S.A.(‘‘EMEM’’)
(1) Aquila Resources Limited has announced the sale, through IP Coal Pty Ltd, to Sumitomo Corporation of its joint venture interest inIsaac Plains, which is subject to our preferential rights to purchase within 60 days of receiving a notice of offer from IP Coal Pty Ltd.
Integra Coal Operations (underground and open-cut). The Integra Coal Operations are located 10kilometers northwest of Singleton in the Hunter Valley of New South Wales, Australia. The operations arecomprised of an underground coal mine that produces coal by longwall methods and an open-cut mine. Coalfrom the mines is processed at a coal handling and processing plant (‘‘CHPP’’) with a capacity of 1,200 metrictons per hour, loaded onto trains at a purpose-built rail loadout facility for transport to the port of Newcastle,New South Wales, Australia.
Carborough Downs. Carborough Downs is located in the Central Bowen Basin in central Queensland,Australia, 15 kilometers east of the township of Moranbah and 180 kilometers southwest of the coastal city ofMackay. Carborough Downs mining leases overlie the Rangal Coal Measures of the Bowen Basin with theeconomic seams of Leichardt and Vermont. Both seams have coking properties and can be beneficiated toproduce coking coal and pulverized coal injection (‘‘PCI’’) products. The Leichardt seam is currently our maintarget for development and constitutes 100% of the current reserve and resource base. Carborough Downscoal is processed at the Carborough Downs CHPP, which is capable of processing 1,000 metric tons per hour,and which operates seven days per week. The product is loaded onto trains at a rail loadout facility andtransported 172 kilometers to the Dalrymple Bay Coal Terminal, Queensland, Australia.
Isaac Plains. The Isaac Plains open-cut mine is located close to Carborough Downs in centralQueensland. The mine is managed by Isaac Plains Coal Management on behalf of the joint venture parties.The coal is classified as a medium volatile bituminous coal with low sulfur content. Coal is processed at theIsaac Plains CHPP and railed 180 kilometers to the Dalrymple Bay Coal Terminal.
31
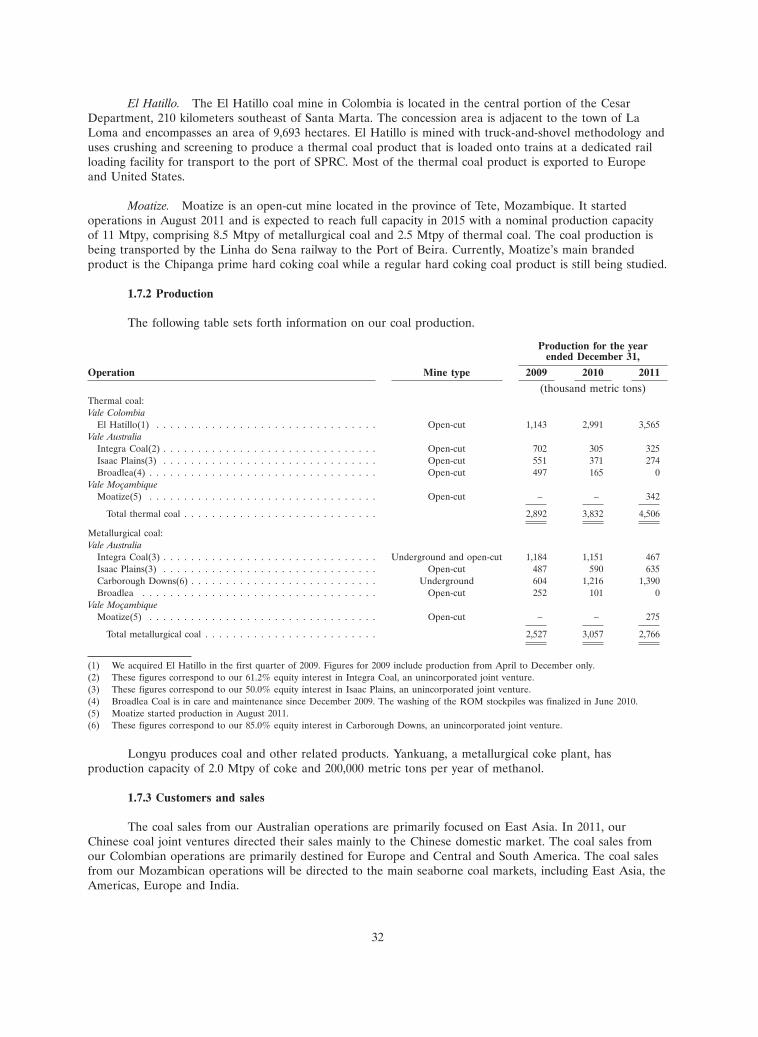
El Hatillo. The El Hatillo coal mine in Colombia is located in the central portion of the CesarDepartment, 210 kilometers southeast of Santa Marta. The concession area is adjacent to the town of LaLoma and encompasses an area of 9,693 hectares. El Hatillo is mined with truck-and-shovel methodology anduses crushing and screening to produce a thermal coal product that is loaded onto trains at a dedicated railloading facility for transport to the port of SPRC. Most of the thermal coal product is exported to Europeand United States.
Moatize. Moatize is an open-cut mine located in the province of Tete, Mozambique. It startedoperations in August 2011 and is expected to reach full capacity in 2015 with a nominal production capacityof 11 Mtpy, comprising 8.5 Mtpy of metallurgical coal and 2.5 Mtpy of thermal coal. The coal production isbeing transported by the Linha do Sena railway to the Port of Beira. Currently, Moatize’s main brandedproduct is the Chipanga prime hard coking coal while a regular hard coking coal product is still being studied.
1.7.2 Production
The following table sets forth information on our coal production.
Production for the yearended December 31,
Operation Mine type 2009 2010 2011
(thousand metric tons)Thermal coal:Vale Colombia
El Hatillo(1) . . . . . . . . . . . . . . . . . . . . . . . . . . . . . . . . Open-cut 1,143 2,991 3,565Vale Australia
Integra Coal(2) . . . . . . . . . . . . . . . . . . . . . . . . . . . . . . . Open-cut 702 305 325Isaac Plains(3) . . . . . . . . . . . . . . . . . . . . . . . . . . . . . . . Open-cut 551 371 274Broadlea(4) . . . . . . . . . . . . . . . . . . . . . . . . . . . . . . . . . Open-cut 497 165 0
Vale MocambiqueMoatize(5) . . . . . . . . . . . . . . . . . . . . . . . . . . . . . . . . . Open-cut – – 342
Total thermal coal . . . . . . . . . . . . . . . . . . . . . . . . . . . . 2,892 3,832 4,506
Metallurgical coal:Vale Australia
Integra Coal(3) . . . . . . . . . . . . . . . . . . . . . . . . . . . . . . . Underground and open-cut 1,184 1,151 467Isaac Plains(3) . . . . . . . . . . . . . . . . . . . . . . . . . . . . . . . Open-cut 487 590 635Carborough Downs(6) . . . . . . . . . . . . . . . . . . . . . . . . . . . Underground 604 1,216 1,390Broadlea . . . . . . . . . . . . . . . . . . . . . . . . . . . . . . . . . . Open-cut 252 101 0
Vale MocambiqueMoatize(5) . . . . . . . . . . . . . . . . . . . . . . . . . . . . . . . . . Open-cut – – 275
Total metallurgical coal . . . . . . . . . . . . . . . . . . . . . . . . . 2,527 3,057 2,766
(1) We acquired El Hatillo in the first quarter of 2009. Figures for 2009 include production from April to December only.(2) These figures correspond to our 61.2% equity interest in Integra Coal, an unincorporated joint venture.(3) These figures correspond to our 50.0% equity interest in Isaac Plains, an unincorporated joint venture.(4) Broadlea Coal is in care and maintenance since December 2009. The washing of the ROM stockpiles was finalized in June 2010.(5) Moatize started production in August 2011.(6) These figures correspond to our 85.0% equity interest in Carborough Downs, an unincorporated joint venture.
Longyu produces coal and other related products. Yankuang, a metallurgical coke plant, hasproduction capacity of 2.0 Mtpy of coke and 200,000 metric tons per year of methanol.
1.7.3 Customers and sales
The coal sales from our Australian operations are primarily focused on East Asia. In 2011, ourChinese coal joint ventures directed their sales mainly to the Chinese domestic market. The coal sales fromour Colombian operations are primarily destined for Europe and Central and South America. The coal salesfrom our Mozambican operations will be directed to the main seaborne coal markets, including East Asia, theAmericas, Europe and India.
32

1.7.4 Competition
The global coal industry, which is primarily comprised of the markets for hard coal (metallurgical coaland thermal coal) and brown coal/lignite, is highly competitive. Growth in the demand for steel, especially inAsia, underpins strong demand for metallurgical coal. Major port and rail constraints in some of the countriesin which major suppliers are located could lead to limited availability of incremental metallurgical coalproduction.
The global seaborne thermal coal market has significantly expanded in recent years. Growth inthermal coal demand is closely related to growth in electricity consumption, which will continue to be drivenby global economic growth, particularly from emerging economies. Large existing fleets of coal-fired powerplants with long life cycles take decades to replace or upgrade, keeping a high share of thermal coal in theelectricity matrix of countries with high consumption. The cost of fuel is typically the largest variable costinvolved in electricity generation and coal is currently the most competitively priced fossil fuel for thispurpose.
Competition in the coal industry is based primarily on the economics of production costs, coal qualityand transportation costs. We believe that our operations and project pipeline are competitive, and our keycompetitive strengths include the strategic geographic location of our current and future supply bases and ourproduction cash costs relative to several other coal producers.
Major participants in the coal seaborne market are subsidiaries and affiliates of Xstrata plc(‘‘Xstrata’’), BHP Billiton, PT Bumi Resources Tbk., Anglo Coal, Drummond Company, Inc., Rio Tinto, TeckCominco, Peabody and the Shenhua Group, among others.
2. Base metals
2.1 Nickel
2.1.1 Operations
We conduct our nickel operations primarily through our wholly owned subsidiary Vale Canada, whichoperates two nickel production systems, one in the North Atlantic and the other in the Asia Pacific. In March
33
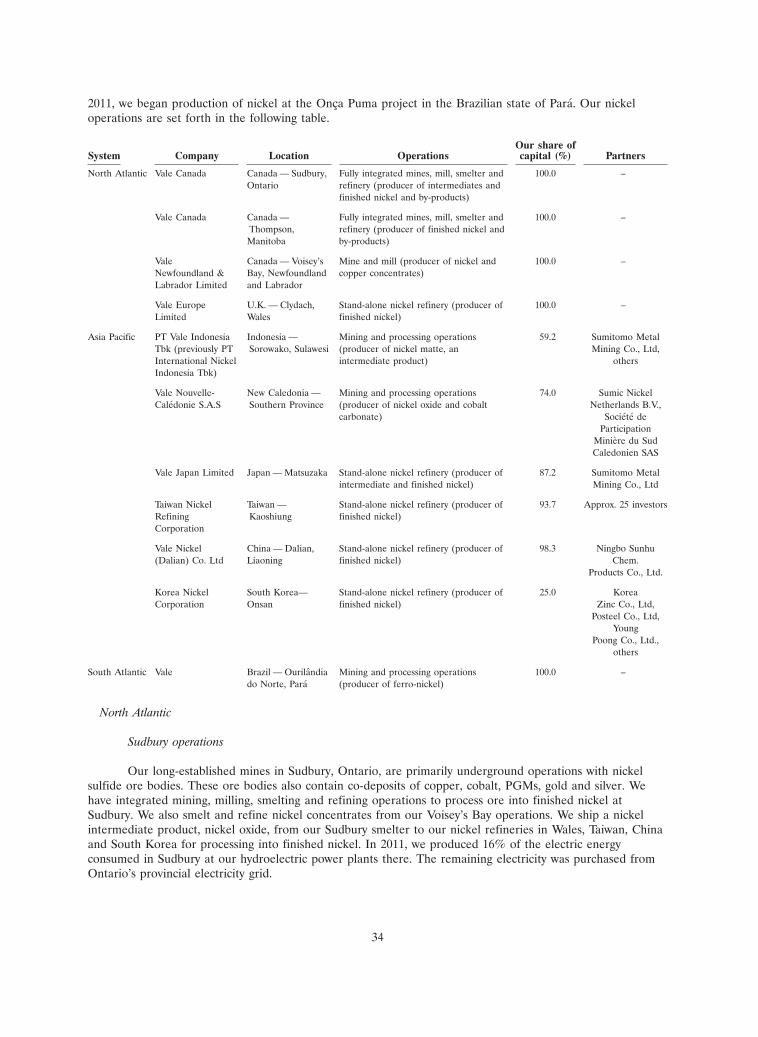
2011, we began production of nickel at the Onca Puma project in the Brazilian state of Para. Our nickeloperations are set forth in the following table.
Our share ofSystem Company Location Operations capital (%) Partners
North Atlantic Vale Canada Canada — Sudbury, Fully integrated mines, mill, smelter and 100.0 –Ontario refinery (producer of intermediates and
finished nickel and by-products)
Vale Canada Canada — Fully integrated mines, mill, smelter and 100.0 –Thompson, refinery (producer of finished nickel andManitoba by-products)
Vale Canada — Voisey’s Mine and mill (producer of nickel and 100.0 –Newfoundland & Bay, Newfoundland copper concentrates)Labrador Limited and Labrador
Vale Europe U.K. — Clydach, Stand-alone nickel refinery (producer of 100.0 –Limited Wales finished nickel)
Asia Pacific PT Vale Indonesia Indonesia — Mining and processing operations 59.2 Sumitomo MetalTbk (previously PT Sorowako, Sulawesi (producer of nickel matte, an Mining Co., Ltd,International Nickel intermediate product) othersIndonesia Tbk)
Vale Nouvelle- New Caledonia — Mining and processing operations 74.0 Sumic NickelCaledonie S.A.S Southern Province (producer of nickel oxide and cobalt Netherlands B.V.,
carbonate) Societe deParticipation
Miniere du SudCaledonien SAS
Vale Japan Limited Japan — Matsuzaka Stand-alone nickel refinery (producer of 87.2 Sumitomo Metalintermediate and finished nickel) Mining Co., Ltd
Taiwan Nickel Taiwan — Stand-alone nickel refinery (producer of 93.7 Approx. 25 investorsRefining Kaoshiung finished nickel)Corporation
Vale Nickel China — Dalian, Stand-alone nickel refinery (producer of 98.3 Ningbo Sunhu(Dalian) Co. Ltd Liaoning finished nickel) Chem.
Products Co., Ltd.
Korea Nickel South Korea— Stand-alone nickel refinery (producer of 25.0 KoreaCorporation Onsan finished nickel) Zinc Co., Ltd,
Posteel Co., Ltd,Young
Poong Co., Ltd.,others
South Atlantic Vale Brazil — Ourilandia Mining and processing operations 100.0 –do Norte, Para (producer of ferro-nickel)
North Atlantic
Sudbury operations
Our long-established mines in Sudbury, Ontario, are primarily underground operations with nickelsulfide ore bodies. These ore bodies also contain co-deposits of copper, cobalt, PGMs, gold and silver. Wehave integrated mining, milling, smelting and refining operations to process ore into finished nickel atSudbury. We also smelt and refine nickel concentrates from our Voisey’s Bay operations. We ship a nickelintermediate product, nickel oxide, from our Sudbury smelter to our nickel refineries in Wales, Taiwan, Chinaand South Korea for processing into finished nickel. In 2011, we produced 16% of the electric energyconsumed in Sudbury at our hydroelectric power plants there. The remaining electricity was purchased fromOntario’s provincial electricity grid.
34

In February 2011, we shut down one furnace at our Sudbury smelter due to an operational problem.The furnace was restarted in late June 2011. The furnace stoppage resulted in a negative impact ofapproximately 16,700 metric tons of production of nickel and 17,300 metric tons of copper.
Thompson operations
Our long-established mines in Thompson, Manitoba, are primarily underground operations with nickelsulfide ore bodies. The ore bodies also contain co-deposits of copper and cobalt. We currently have integratedmining, milling, smelting and refining operations to process ore into finished nickel at Thompson. We alsosmelt and refine an intermediate product, nickel concentrate, from our Voisey’s Bay operations. Low-costenergy is available from purchased hydroelectric power at our Thompson operations.
We are transitioning our Thompson operations to a mining and milling business, and phasing outsmelting and refining by 2015. This enables us to better align processing capacity with mineral reserves whilemeeting our environmental commitments. The current mineral reserves in Thompson are not sufficient tosustain the operation of the smelter and refinery at full capacity over the long term and do not support theinvestment of the significant capital that would be required under new pending federal sulfur dioxide emissionstandards that are expected to come into effect in 2015.
Voisey’s Bay operations
Our Voisey’s Bay operation in Newfoundland and Labrador is comprised of the Ovoid mine, anopen-pit mine, and deposits with the potential for underground operations at a later stage. We mine nickelsulfide ore bodies, which also contain deposits of copper and cobalt. Until 2013, we will mill Voisey’s Bay oreon site and ship it as an intermediate product (nickel concentrates) primarily to our Sudbury and Thompsonoperations for final processing (smelting and refining), while copper concentrate produced is sold in themarket. Beyond 2013, the nickel concentrates will be shipped to our hydrometallurgical plant beingconstructed at the Long Harbour site to produce finished nickel, while the copper concentrate will continueto be produced at Voisey’s Bay and sold in the market. The electricity requirements of our Voisey’s Bayoperations are supplied through diesel generators.
Clydach operations
Clydach is a stand-alone nickel refinery in Wales, U.K., that processes a nickel intermediate product,nickel oxide, supplied from our Sudbury operations to produce finished nickel in the form of powders andpellets.
Asia Pacific
Sulawesi operations
Our subsidiary PTVI operates an open cast mining area and related processing facility in Sorowako onthe Island of Sulawesi, Indonesia. PTVI mines nickel saprolitic laterite ore and produces nickel matte, whichis shipped primarily to our nickel refinery in Japan. Pursuant to life-of-mine off-take agreements, PTVI sells80% of its production to our wholly owned subsidiary Vale Canada and 20% of its production to SumitomoMetal Mining Co., Ltd. (‘‘Sumitomo’’). PTVI is a public company whose shares are traded on the IndonesiaStock Exchange. We hold 59.2% of its share capital, Sumitomo holds 20.3%, and 20.5% is publicly held.
Energy costs are a significant component of our nickel production costs for the processing of lateriticsaprolitic ores at our PTVI operations in Indonesia. A major part of the electric furnace power requirementsof PTVI is supplied at low cost by its three hydroelectric power plants on the Larona River: Larona,Balambano and Karebbe. PTVI has thermal generating facilities in order to supplement its hydroelectricpower supply with a source of energy that is not subject to hydrological factors. In 2011, the hydroelectric
35
power plants provided 93% of the electric energy consumed at our Indonesian operations, with the thermalgenerators providing the remainder.
Asian refinery operations
Our 87.2%-owned subsidiary Vale Japan Limited (‘‘Vale Japan’’) operates a refinery in Matsuzaka,Japan, which produces intermediate and finished nickel products, primarily using nickel matte sourced fromPTVI. Vale Japan is a privately-owned company controlled by Vale, with the minority interest held bySumitomo (12.8%).
We also operate or have investments in nickel refining operations in Taiwan through our 93.7% stakein Taiwan Nickel Refining Corporation (‘‘TNRC’’), in China through our 98.3% interest in Vale Nickel(Dalian) Co. Ltd. (‘‘VNDC’’) and in South Korea through our 25.0% stake in Korea Nickel Corporation(‘‘KNC’’). TNRC, VNDC and KNC produce finished nickel for the local stainless steel industry in Taiwan,China and South Korea, respectively, primarily using intermediate products containing about 75% nickel (inthe form of nickel oxide) from our Matsuzaka Japan and Sudbury operations.
New Caledonian operations
We are ramping up our Vale Nouvelle-Caledonie S.A.S (‘‘VNC’’) nickel operation in New Caledoniain the South Pacific. VNC utilizes a High Pressure Acid Leach (‘‘HPAL’’) process to treat limonitic lateriteand saprolitic laterite ores. We expect to ramp up VNC over a four-year period to reach nominal productioncapacity of 60,000 metric tons per year of nickel contained in nickel oxide and 4,600 metric tons of cobalt,once nickel oxide production starts. In order to accelerate cash generation, the resulting nickel and cobaltsolution from HPAL is currently sold to customers as an intermediate product, nickel hydroxide cake(‘‘NHC’’). We hold 74% of the share capital of VNC, Sumic Nickel Netherlands B.V. (‘‘Sumic’’) (a jointventure between Sumitomo and Mitsui) holds 21% and Societe de Participation Miniere du Sud CaledonienSAS holds 5%. Sumic has a put option to sell us 25%, 50%, or 100% of its shares, at a price based on thelower of the book value or the market value of the shares, and we are currently in discussions with Sumicconcerning its continued participation in VNC.
South Atlantic
We are continuing to ramp up the Onca Puma project in Ourilandia do Norte, in the Brazilian stateof Para. The Onca Puma mine is built on lateritic nickel deposits of saprolitic laterite ore, and is expected toreach a nominal capacity of 53,000 metric tons per year of nickel contained in ferro-nickel, its final product.
36

2.1.2 Production
The following table sets forth our annual mine production by operating mine (or on an aggregatebasis for PTVI because it has mining areas rather than mines) and the average percentage grades of nickeland copper. The mine production at PTVI represents the product from PTVI’s dryer kilns delivered toPTVI’s smelting operations and does not include nickel losses due to smelting. For our Sudbury, Thompsonand Voisey’s Bay operations, the production and average grades represent the mine product delivered to thoseoperations’ respective processing plants and do not include adjustments due to beneficiation, smelting orrefining. The following table sets forth information about ore production at our nickel mining sites.
2009 2010 2011
(thousands of metric tons, except percentages)Grade Grade Grade
% % % % % %Production Copper Nickel Production Copper Nickel Production Copper Nickel
Ontario operating minesCopper Cliff North . . . . . 524 0.96 1.06 326 1.13 1.13 892 1.15 1.03Copper Cliff South(1) . . . . 78 1.45 1.40 – – – – – –Creighton . . . . . . . . . . . 395 1.57 1.82 426 2.65 3.10 991 1.72 2.22Stobie . . . . . . . . . . . . . 1,198 0.64 0.72 775 0.59 0.69 1,568 0.61 0.74Garson . . . . . . . . . . . . 328 1.93 1.45 246 2.16 1.60 640 1.78 2.08Coleman . . . . . . . . . . . 624 3.28 1.64 786 2.74 1.73 1,363 3.02 1.77Ellen . . . . . . . . . . . . . – – – 86 0.56 0.75 131 0.45 0.90Totten . . . . . . . . . . . . . – – – 16 2.54 1.74 28 1.01 0.97
Total Ontariooperations . . . . . . 3,145 1.49% 1.19% 2,660 1.78% 1.53% 5,612 1.61% 1.45%
Manitoba operating minesThompson . . . . . . . . . . 1,270 – 1.98 1,325 – 1.83 1,182 – 1.76Birchtree . . . . . . . . . . . 769 – 1.48 832 – 1.41 721 – 1.36
Total Manitobaoperations . . . . . . 2,040 – 1.79% 2,158 – 1.67% 1,903 – 1.61%
Voisey’s Bay operating minesOvoid . . . . . . . . . . . . . 990 2.57 3.20 1,510 2.44 3.20 2,366 2.39 3.38
Total Voisey’s Bayoperations . . . . . . 990 2.57% 3.20% 1,510 2.44% 3.20% 2,366 2.39 3.38%
Sulawesi operating mining areasSorowako . . . . . . . . . . . 3,598 – 2.02 4,176 – 2.00 3,848 – 1.95
Total Sulawesioperations . . . . . . 3,598 – 2.02% 4,176 – 2.00% 3,848 – 1.95%
New Caledonia operating minesVNC . . . . . . . . . . . . . – – – 326 – 1.31 1,043 – 1.29
Total New CaledoniaOperations . . . . . . – – – 326 – 1.31% 1,043 – 1.29%
Brazil operating minesOnca Puma . . . . . . . . . . – – – 1,259 – 1.93 1,466 – 1.86
Total Brazil operations . – – – 1,259 – 1.93% 1,466 – 1.86%
(1) This mine has been closed indefinitely since January 2009.
37

The following table sets forth information about our nickel production, including: (i) nickel refinedthrough our facilities, (ii) nickel further refined into specialty products and (iii) intermediates designated forsale. The numbers below are reported on an ore-source basis.
Production for the year ended December 31,
Mine Type 2009 2010 2011
(thousand metric tons)Sudbury(1) . . . . . . . . . . . . . . . . . . . . . . . . . . . . . . Underground 43.6 22.4 59.7Thompson(1) . . . . . . . . . . . . . . . . . . . . . . . . . . . . Underground 28.8 29.8 25.0Voisey’s Bay(2) . . . . . . . . . . . . . . . . . . . . . . . . . . . Open pit 39.7 42.3 68.9Sorowako(3) . . . . . . . . . . . . . . . . . . . . . . . . . . . . . Open cast 68.8 78.4 67.8Onca Puma(4) . . . . . . . . . . . . . . . . . . . . . . . . . . . . Open pit – – 7.0New Caledonia(5) . . . . . . . . . . . . . . . . . . . . . . . . . . Open pit – – 5.1External(6) . . . . . . . . . . . . . . . . . . . . . . . . . . . . . . – 5.8 5.9 8.0
Total(7) . . . . . . . . . . . . . . . . . . . . . . . . . . . . . . . . . . . . . . . . 186.7 178.7 241.5
(1) Primary nickel production only (i.e., does not include secondary nickel from unrelated parties).(2) Includes finished nickel produced at our Sudbury and Thompson operations, as well as some finished nickel produced by unrelated
parties under toll-smelting and toll-refining arrangements.(3) We have a 59.2% interest in PTVI, which owns the Sorowako mines, and these figures include the minority interests.(4) Primary production only. Nickel contained in ferro-nickel.(5) Primary production only and adjusted for the payable nickel amount. Nickel contained in NHC.(6) Finished nickel processed at our facilities using feeds purchased from unrelated parties.(7) Excludes finished nickel produced under toll-smelting and refining arrangements covering purchased intermediates with unrelated
parties. Unrelated-party tolling of purchased intermediates was 5.2 thousand metric tons in 2009, none in 2010 and none in 2011.
2.1.3 Customers and sales
Our nickel customers are broadly distributed on a global basis. In 2011, 53% of our total nickel saleswere delivered to customers in Asia, 27% to North America, 17% to Europe and 3% to other markets. Wehave short-term fixed-volume contracts with customers for the majority of our expected annual nickel sales.These contracts generally provide stable demand for a significant portion of our annual production.
Nickel is an exchange-traded metal, listed on the LME, and most nickel products are priced accordingto a discount or premium to the LME price, depending primarily on the nickel product’s physical andtechnical characteristics. Our finished nickel products represent what is known in the industry as ‘‘primary’’nickel, meaning nickel produced principally from nickel ores (as opposed to ‘‘secondary’’ nickel, which isrecovered from recycled nickel-containing material). Finished primary nickel products are distinguishable interms of the following characteristics, which determine the product price level and the suitability for variousend-use applications:
� nickel content and purity level: (i) intermediates with various levels of nickel content, (ii) nickelpig iron has 1.5-6% nickel, (iii) ferro-nickel has 10-40% nickel, (iv) standard LME grade nickelhas a minimum of 99.8% nickel, and (v) high purity nickel has a minimum of 99.9% nickel anddoes not contain specific elemental impurities;
� shape (such as pellets, discs, squares, strips and foams); and
� size.
In 2011, the principal end-use applications for nickel were:
� austenitic stainless steel (64% of global nickel consumption);
� non-ferrous alloys, alloy steels and foundry applications (19% of global nickel consumption);
38

� nickel plating (9% of global nickel consumption); and
� specialty applications, such as batteries, chemicals and powder metallurgy (9% of global nickelconsumption).
In 2011, 66% of our refined nickel sales were made which into non-stainless steel applications,compared to the industry average for primary nickel producers of 36%, which brings more stability to oursales volumes. As a result of our focus on such higher-value segments, our average realized nickel prices forrefined nickel have typically exceeded LME cash nickel prices.
We offer sales and technical support to our customers on a global basis. We have a well-establishedglobal marketing network for finished nickel, based at our head office in Toronto, Canada. We also have salesand technical support offices in St. Prex (Switzerland), Saddle Brook, New Jersey (United States), Tokyo(Japan), Shanghai (China), Singapore, Kaohsiung (Taiwan), Bangkok (Thailand) and Bridgetown (Barbados).For information about demand and prices, see below Operating and financial review and prospects—Demandand prices.
2.1.4 Competition
The global nickel market is highly competitive. Our key competitive strengths include our long-lifemines, our low cash costs of production relative to other nickel producers, sophisticated exploration andprocessing technologies, and a diversified portfolio of products. Our global marketing reach, diverse productmix, and technical support direct our products to the applications and geographic regions that offer thehighest margins for our products.
Our nickel deliveries represented 16% of global consumption for primary nickel in 2011. In additionto us, the largest suppliers in the nickel industry (each with its own integrated facilities, including nickelmining, processing, refining and marketing operations) are Mining and Metallurgical Company Norilsk Nickel,Jinchuan Nonferrous Metals Corporation, BHP Billiton and Xstrata. Together with us, these companiesaccounted for about 51% of global finished primary nickel production in 2011.
While stainless steel production is a major driver of global nickel demand, stainless steel producerscan use nickel products with a wide range of nickel content, including secondary nickel (scrap). The choicebetween primary and secondary nickel is largely based on their relative prices and availability. In recent years,secondary nickel has accounted for about 43-48% of total nickel used for stainless steels, and primary nickelhas accounted for about 52-57%. In 2006, a new primary nickel product entered the market, known as nickelpig iron. This low-grade nickel product made in China from imported lateritic ores (primarily from thePhilippines and Indonesia) is primarily suitable for use in stainless steel production. With higher nickel pricesand strong demand from the stainless steel industry, Chinese domestic production of nickel pig iron andlow-grade ferro-nickel continues to expand. In 2011, Chinese nickel pig iron and ferro-nickel production isestimated to have been greater than 250,000 metric tons, representing 16% of world primary nickel supply.
Competition in the nickel market is based primarily on quality, reliability of supply and price. Webelieve our operations are competitive in the nickel market because of the high quality of our nickel productsand our relatively low production costs.
There is no material seasonality in the demand for nickel, although demand for nickel has beenslightly weaker in the third quarter.
39

2.2 Copper
2.2.1 Operations
We conduct our copper operations at the parent-company level in Brazil and through our whollyowned subsidiaries in Canada and Chile.
Our share of capital
Company Location Voting Total Partners
(%)Vale . . . . . . . . . . . . . . . . . . . . . . . . . . . . . . . . . . Brazil – – –Vale Canada . . . . . . . . . . . . . . . . . . . . . . . . . . . . . Canada 100.0 100.0 –Tres Valles . . . . . . . . . . . . . . . . . . . . . . . . . . . . . . Chile 100.0 90.0 Compania Minera
Werenfried
Brazilian operations
Our Sossego copper mine in Carajas, in the state of Para, has two main copper ore bodies, Sossegoand Sequeirinho. The copper ore is mined by open-pit method, and the run-of-mine is processed by means ofstandard primary crushing and conveying, SAG milling (a semi-autogenous mill that uses a large rotatingdrum filled with ore, water and steel grinding balls to transform the ore into a fine slurry), ball milling,copper concentrate flotation, tailings disposal, concentrate thickening, filtration and load out. We truck theconcentrate to a storage terminal in Parauapebas and then transport it via the EFC railroad to the Ponta daMadeira maritime terminal in Sao Luıs, in the state of Maranhao.
We constructed an 85-kilometer road to link Sossego to the Carajas air and rail facilities and a powerline that allows us to purchase electrical power at market prices. We have a long-term energy supply contractwith Eletronorte.
Canadian operations
In Canada, we recover copper in conjunction with our nickel operations, principally at Sudbury andVoisey’s Bay. At Sudbury, we produce two intermediate copper products, copper concentrates and copperanodes, and we also produce electrowon copper cathode as a by-product of our nickel refining operations. AtVoisey’s Bay, we produce copper concentrates.
Chilean operations
In Chile, we produce copper cathodes at the Tres Valles operation, located in Salamanca, in theCoquimbo region. The plant has an estimated annual production capacity of 18,500 metric tons of coppercathode (metal plate), and is our first industrial-scale cathode plant using a hydrometallurgical process. TheTres Valles operations include two copper oxide mines: Don Gabriel, an open-pit mine, and Papomono, anunderground mine, as well as an SX-EW plant that produces copper cathodes.
40

2.2.2 Production
The following table sets forth information on our copper production.
Production for the year ended December 31,
Mine Type 2009 2010 2011
(thousand metric tons)Brazil:
Sossego . . . . . . . . . . . . . . . . . . . . . . . . . . . . . . Open pit 117 117 109Canada:
Sudbury . . . . . . . . . . . . . . . . . . . . . . . . . . . . . . Underground 42 34 101Voisey’s Bay . . . . . . . . . . . . . . . . . . . . . . . . . . . . Open pit 24 33 51Thompson . . . . . . . . . . . . . . . . . . . . . . . . . . . . . Underground 1 1 1External(1) . . . . . . . . . . . . . . . . . . . . . . . . . . . . – 14 22 31
Chile:Tres Valles . . . . . . . . . . . . . . . . . . . . . . . . . . . . . Open pit and – – 9
underground
Total . . . . . . . . . . . . . . . . . . . . . . . . . . . . . . . . . . . . . . . . . 198 207 302
(1) We process copper at our facilities using feed purchased from unrelated parties.
2.2.3 Customers and sales
Copper concentrates from Sossego are sold under medium- and long-term contracts to coppersmelters in South America, Europe and Asia. We have long-term off-take agreements to sell the entireproduction of copper concentrates from the first phase of the Salobo project to smelters. We have long-termcopper supply agreements with Xstrata Copper Canada for the sale of copper anodes and most of the copperconcentrates produced in Sudbury. Copper concentrates from Voisey’s Bay are sold under medium-termcontracts to customers in Europe. Electrowon copper from Sudbury is sold in North America undershort-term sales agreements.
2.2.4 Competition
The global copper cathode market is highly competitive. Producers are integrated mining companiesand custom smelters, covering all regions of the world, while consumers are principally wire rod and copper-alloy producers. Competition occurs mainly on a regional level and is based primarily on production costs,quality, reliability of supply and logistics costs. The world’s largest copper cathode producers are CorporacionNacional del Cobre de Chile (‘‘Codelco’’), Aurubis AG, Freeport-McMoRan Copper & Gold Inc. (‘‘Freeport-McMoRan’’), Jiangxi Copper Corporation Ltd. and Xstrata, operating at the parent-company level or throughsubsidiaries. Our participation in the global copper cathode market is marginal.
Copper concentrate and copper anode are intermediate products in the copper production chain. Boththe concentrate and anode markets are competitive, having numerous producers but fewer participants andsmaller volumes than in the copper cathode market due to high levels of integration by the major copperproducers.
In the copper concentrate market, the main producers are mining companies located in SouthAmerica and Indonesia, while consumers are custom smelters located in Europe and Asia. Competition in thecustom copper concentrate market occurs mainly on a global level and is based on production costs, quality,logistics costs and reliability of supply. The largest competitors in the copper concentrate market areFreeport-McMoRan, Xstrata, BHP Billiton, Antofagasta plc and Anglo American plc, operating at the parent-company level or through subsidiaries. Our market share in 2011 was about 3.0% of the total custom copperconcentrate market.
The copper anode/blister market has very limited trade within the copper industry; generally, anodesare produced to supply each company’s integrated refinery. The trade in anodes/blister is limited to thosefacilities that have more smelting capacity than refining capacity or to those situations where logistics costsavings provide an incentive to source anodes from outside smelters. The largest competitors in the copperanode market are Codelco, Anglo American and Xstrata, operating at the parent-company level or throughsubsidiaries.
41

There is no material seasonality in the demand for copper, although demand for copper is generallyweaker throughout the second half of the year.
2.3 Aluminum
We hold a 22.0% interest in Hydro, a major aluminum producer, which we account for on the equitymethod. In the past, we engaged in bauxite mining, alumina refining and aluminum smelting throughsubsidiaries in Brazil, our interests in which we transferred to Hydro in February 2011. We still own minorityinterests in MRN and Paragominas, which are bauxite mining businesses located in Brazil, and which we alsoaccount for on the equity method. We will transfer our remaining interest in Paragominas to Hydro in twoequal tranches in 2014 and 2016.
2.4 PGMs and other precious metals
As by-products of our Sudbury nickel operations in Canada, we recover significant quantities ofPGMs, as well as small quantities of gold and silver. We also recover gold as a by-product of our operationsat our Sossego copper mine in Carajas, in the Brazilian state of Para. We operate a processing facility in PortColborne, Ontario, which produces PGMs, gold and silver intermediate products. We have a refinery inActon, England, where we process our intermediate products, as well as feeds purchased from unrelatedparties and toll-refined materials. In 2011, PGM concentrates from our Sudbury operations supplied about54% of our PGM production, which also includes metals purchased from unrelated parties. Our base metalsmarketing department sells our own PGMs and other precious metals, as well as products from unrelatedparties and toll-refined products, on a sales agency basis.
The following table sets forth information on our precious metals production.
Mine(1) Type 2009 2010 2011
(thousand troy ounces)Sudbury:
Platinum . . . . . . . . . . . . . . . . . . . . . . . . . . . . . . . . . . . . . . . Underground 103 35 174Palladium . . . . . . . . . . . . . . . . . . . . . . . . . . . . . . . . . . . . . . Underground 152 60 248Gold . . . . . . . . . . . . . . . . . . . . . . . . . . . . . . . . . . . . . . . . . Underground 49 42 182
Sossego:Gold . . . . . . . . . . . . . . . . . . . . . . . . . . . . . . . . . . . . . . . . . Open pit 98 102 90
(1) Production figures exclude precious metals purchased from unrelated parties and toll-refined materials.
2.5 Cobalt
We recover significant quantities of cobalt as a by-product of our Canadian nickel operations. In 2011,we produced 1,469 metric tons of refined cobalt metal at our Port Colborne refinery and 594 metric tons ofcobalt in a cobalt-based intermediate product at our Thompson nickel operations in Canada. Our remainingcobalt production consisted of 611 metric tons of cobalt contained in other intermediate products (such asnickel concentrates). We are increasing our production of cobalt as a by-product of our nickel production atthe VNC operations in New Caledonia, which is currently ramping up. We sell cobalt on a global basis. Ourcobalt metal, which is electro-refined at our Port Colborne refinery, has very high purity levels (99.8%).Cobalt metal is used in the production of various alloys, particularly for aerospace applications, as well as themanufacture of cobalt-based chemicals.
42

The following table sets forth information on our cobalt production.
Production for the year ended December 31,
Mine Type 2009 2010 2011
(metric tons)Sudbury . . . . . . . . . . . . . . . . . . . . . . . . . . . . . . . Underground 359 302 593Thompson . . . . . . . . . . . . . . . . . . . . . . . . . . . . . . Underground 181 189 158Voisey’s Bay . . . . . . . . . . . . . . . . . . . . . . . . . . . . . Open pit 971 524 1,585New Caledonia . . . . . . . . . . . . . . . . . . . . . . . . . . . Open pit – – 245
External(1) . . . . . . . . . . . . . . . . . . . . . . . . . . . . – 64 51 93
Total . . . . . . . . . . . . . . . . . . . . . . . . . . . . . . . . . . . . . . . . . . 1,575 1,066 2,675
(1) These figures do not include tolling of feeds purchased from unrelated parties.
3. Fertilizer nutrients
3.1 Phosphates
We operate our phosphates business through subsidiaries and joint ventures, as set forth in thefollowing table.
Our share of capital
Company Location Voting Total Partners
(%)Vale Fertilizantes . . . . . . . . . . . . . . . . . . . . . . . . . . . . . . . Uberaba, Brazil 100.0% 100.0% –MVM Resources International, B.V. . . . . . . . . . . . . . . . . . . . . Bayovar, Peru 51.0% 40.0% Mosaic,
Mitsui & CoVale Cubatao. . . . . . . . . . . . . . . . . . . . . . . . . . . . . . . . . . Cubatao, Brazil 100.0% 100.0% –
Vale Fertilizantes is a producer of phosphate rock, phosphate fertilizers (‘‘P’’) (e.g., monoammoniumphosphate (‘‘MAP’’), dicalcium phosphate (‘‘DCP’’), triple superphosphate (‘‘TSP’’) and singlesuperphosphate (‘‘SSP’’)) and nitrogen (‘‘N’’) fertilizers (e.g., ammonium nitrate and urea). It is the largestproducer of phosphate and nitrogen crop nutrients in Brazil. Vale Fertilizantes operates the followingphosphate rock mines: Catalao, in the state of Goias, and Tapira, Patos de Minas and Araxa, all in the stateof Minas Gerais, and Cajati, in the state of Sao Paulo, in Brazil. In addition, Vale Fertilizantes has nineprocessing plants for the production of phosphate and nitrogen nutrients, located at Catalao, Goias; Araxaand Uberaba, Minas Gerais; Guara, Cajati, and three plants in Cubatao, Sao Paulo; and Araucaria, Parana.
Besides the phosphate and nitrogen operations of Vale Fertilizantes, since 2010 we have also operatedthe Bayovar phosphate rock mine in Peru, which is expected to reach nominal capacity of 3.9 Mtpy by 2014.Bayovar is a world-class resource with a low mining cost of phosphate rock production.
The following table sets forth information about our phosphate rock production.
Production for the year ended December 31,
Mine Type 2010 2011
(thousand metric tons) (thousand metric tons)Bayovar . . . . . . . . . . . . . . . . . . . . . . . . . . . . . . . . . Open pit 791 2,544Catalao . . . . . . . . . . . . . . . . . . . . . . . . . . . . . . . . . Open pit 626 947Tapira . . . . . . . . . . . . . . . . . . . . . . . . . . . . . . . . . . Open pit 2,068 2,011Patos de Minas . . . . . . . . . . . . . . . . . . . . . . . . . . . . Open pit 43 44Araxa . . . . . . . . . . . . . . . . . . . . . . . . . . . . . . . . . . Open pit 1,182 1,231Cajati . . . . . . . . . . . . . . . . . . . . . . . . . . . . . . . . . . Open pit 545 582
Total . . . . . . . . . . . . . . . . . . . . . . . . . . . . . . . . . . 5,255 7,359
43

The following table sets forth information about our phosphate and nitrogen nutrients production.
Production for the year ended December 31,
Product 2010 2011
(thousand metric tons) (thousand metric tons)Monoammonium phosphate (MAP) . . . . . . . . . . . . . . . . . . . . . . . . . . . 898 823Triple superphosphate (TSP) . . . . . . . . . . . . . . . . . . . . . . . . . . . . . . . 788 811Single superphosphate (SSP) . . . . . . . . . . . . . . . . . . . . . . . . . . . . . . . 2,239 2,638Dicalcium phosphate (DCP) . . . . . . . . . . . . . . . . . . . . . . . . . . . . . . . 491 580Ammonia . . . . . . . . . . . . . . . . . . . . . . . . . . . . . . . . . . . . . . . . . . 508 619Urea . . . . . . . . . . . . . . . . . . . . . . . . . . . . . . . . . . . . . . . . . . . . . 511 628Nitric acid . . . . . . . . . . . . . . . . . . . . . . . . . . . . . . . . . . . . . . . . . 454 468Ammonium nitrate . . . . . . . . . . . . . . . . . . . . . . . . . . . . . . . . . . . . 447 458
3.2 Potash
We conduct potash operations in Brazil at the parent-company level. We lease Taquari-Vassouras, theonly potash mine in Brazil (in Rosario do Catete, in the state of Sergipe), from Petrobras—PetroleoBrasileiro S.A., the Brazilian state-owned oil company. The lease, signed in 1991, became effective in 1992 foran initial period of 25 years, and the parties have recently agreed upon an extension of the lease agreementfor 30 more years. The following table sets forth information on our potash production.
Production for the year ended December 31,
Mine Type 2009 2010 2011 Recovery rate
(thousand metric tons) (%)Taquari-Vassouras . . . . . . . . . . . . . Underground 717 662 625 85.7
3.3 Customers and sales
All potash sales from the Taquari-Vassouras mine are to the Brazilian market. In 2011, our productionrepresented approximately 9% of total potash consumption in Brazil. We have a strong presence andlong-standing relationships with the major players in Brazil, with more than 60% of our sales generated fromfour traditional customers.
Our phosphate products are mainly sold to fertilizer blenders. In 2011, our production representedapproximately 37% of total phosphate consumption in Brazil, with imports representing 35% of total supply.In the high-concentration segment, our production supplied more than 33% of total Brazilian consumption,with products like MAP and TSP. In the low-concentration phosphate nutrients segment, our productionrepresented approximately 49% of total Brazilian consumption, with products like SSP and DCP.
3.4 Competition
Fertilizers have strong demand growth potential, which is anchored in market fundamentals similar tothose underlying the global demand for minerals, metals and energy. Rapid per capita income growth inemerging economies causes diet changes towards an increasing consumption of proteins that ultimatelycontribute to boost fertilizer use. More recently, global output of biofuels has started to boom as theyemerged as an alternative source of energy to reduce world reliance on sources of climate-changinggreenhouse gases. Given that key inputs for the production of biofuels—sugar cane, corn, palm and soybeans—are intensive in the use of fertilizers, they are becoming another major driver of the global demandfor crop nutrients.
The industry is divided into three major nutrients: potash, phosphate and nitrogen. There are verylimited resources of potash around the world, with Canada, Russia and Belarus being the most importantsources. Due to the lack of mineral resources, the high level of investment and the long time required for aproject to mature, it is unlikely that other regions will emerge as major potash producers over the next fewyears. In addition, the potash industry is highly concentrated, with the 10 major producers accounting for
44

more than 94% of total world production capacity. While potash is a very scarce resource, phosphate is moreavailable, but all major exporters are located in the northern region of Africa (Morocco, Algeria and Tunisia)and in the United States. The top five phosphate rock producers (China, Morocco, the United States, Russiaand Tunisia) account for 76% of global production, of which roughly 9% is exported. However, higher value-added products such as MAP and DAP are usually traded instead of phosphate rock due to cost efficiency.
Brazil is one of the largest agribusiness markets in the world due to its high production, exports andconsumption of grains and biofuels. It is the fourth-largest consumer of fertilizers in the world and one of thelargest importers of potash, phosphates, phosphoric acid and urea. Brazil imports 91% of its potashconsumption, which amounted to 7.5 Mtpy of KCl (potassium chloride) in 2011, 44% higher than 2010, fromRussian, Belarussian, Canadian and German producers, in descending order. In terms of global consumption,China, the United States, Brazil and India represent 59% of the total, with Brazil alone representing 13% ofthe total. Our project portfolios are highly competitive in terms of cost and logistics within these regions.
Most phosphate rock concentrate is consumed locally by downstream integrated producers, with theseaborne market corresponding to 16% of total phosphate rock production. Major phosphate rock exportersare concentrated in North Africa, mainly through state-owned companies, with Moroccan OCP Group holding37% of the total seaborne market. Brazil imports 19% of the total phosphate nutrients it needs through bothphosphate fertilizer products and phosphate rock. The phosphate rock imports supply non-integratedproducers of phosphate fertilizers products such as SSP, TSP and MAP.
Nitrogen-based fertilizers are derived primarily from ammonia (NH3), which, in turn, is made fromnitrogen present in the air and natural gas, making this an energy-intensive nutrient. Ammonia and urea arethe main inputs for nitrogen-based fertilizers. Consumption of nitrogen-based fertilizers has a regional profiledue to the high cost associated with transportation and storage of ammonia, which requires refrigerated andpressurized facilities. As a result, only 12% of the ammonia produced worldwide is traded. North America isthe main importer, accounting for 35% of global trade. Main exporting regions are Central America, Russia,Eastern Europe and the Middle East.
45
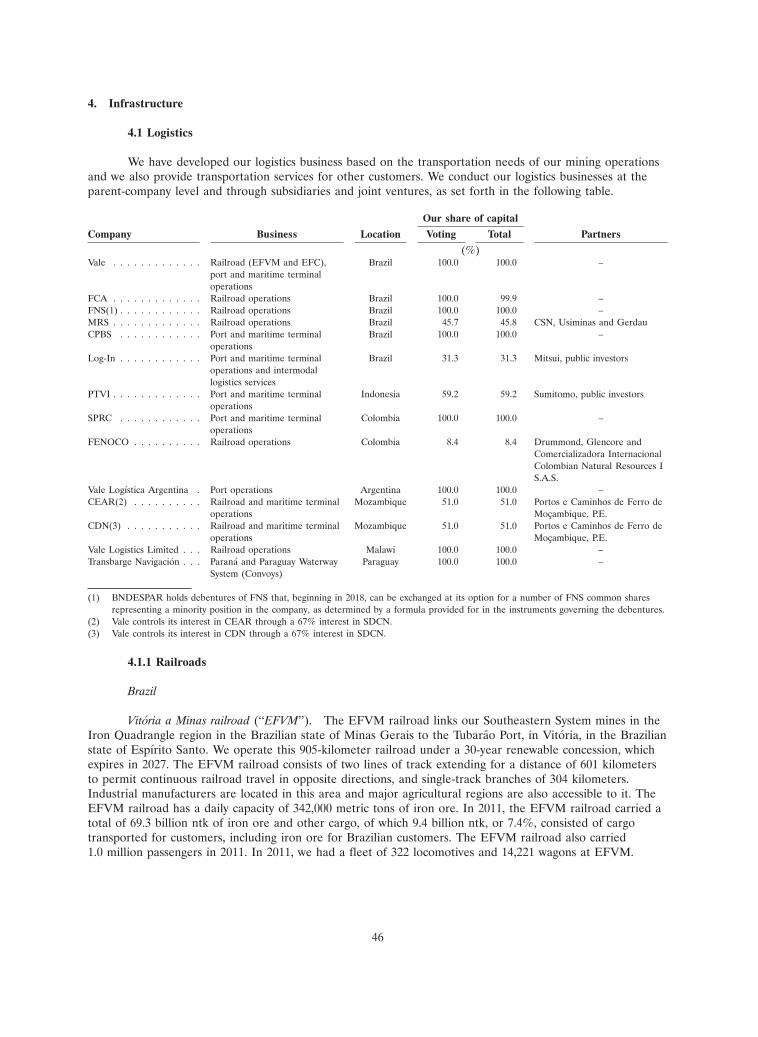
4. Infrastructure
4.1 Logistics
We have developed our logistics business based on the transportation needs of our mining operationsand we also provide transportation services for other customers. We conduct our logistics businesses at theparent-company level and through subsidiaries and joint ventures, as set forth in the following table.
Our share of capital
Company Business Location Voting Total Partners
(%)Vale . . . . . . . . . . . . . Railroad (EFVM and EFC), Brazil 100.0 100.0 –
port and maritime terminaloperations
FCA . . . . . . . . . . . . . Railroad operations Brazil 100.0 99.9 –FNS(1) . . . . . . . . . . . . Railroad operations Brazil 100.0 100.0 –MRS . . . . . . . . . . . . . Railroad operations Brazil 45.7 45.8 CSN, Usiminas and GerdauCPBS . . . . . . . . . . . . Port and maritime terminal Brazil 100.0 100.0 –
operationsLog-In . . . . . . . . . . . . Port and maritime terminal Brazil 31.3 31.3 Mitsui, public investors
operations and intermodallogistics services
PTVI . . . . . . . . . . . . . Port and maritime terminal Indonesia 59.2 59.2 Sumitomo, public investorsoperations
SPRC . . . . . . . . . . . . Port and maritime terminal Colombia 100.0 100.0 –operations
FENOCO . . . . . . . . . . Railroad operations Colombia 8.4 8.4 Drummond, Glencore andComercializadora InternacionalColombian Natural Resources IS.A.S.
Vale Logıstica Argentina . Port operations Argentina 100.0 100.0 –CEAR(2) . . . . . . . . . . Railroad and maritime terminal Mozambique 51.0 51.0 Portos e Caminhos de Ferro de
operations Mocambique, P.E.CDN(3) . . . . . . . . . . . Railroad and maritime terminal Mozambique 51.0 51.0 Portos e Caminhos de Ferro de
operations Mocambique, P.E.Vale Logistics Limited . . . Railroad operations Malawi 100.0 100.0 –Transbarge Navigacion . . . Parana and Paraguay Waterway Paraguay 100.0 100.0 –
System (Convoys)
(1) BNDESPAR holds debentures of FNS that, beginning in 2018, can be exchanged at its option for a number of FNS common sharesrepresenting a minority position in the company, as determined by a formula provided for in the instruments governing the debentures.
(2) Vale controls its interest in CEAR through a 67% interest in SDCN.(3) Vale controls its interest in CDN through a 67% interest in SDCN.
4.1.1 Railroads
Brazil
Vitoria a Minas railroad (‘‘EFVM’’). The EFVM railroad links our Southeastern System mines in theIron Quadrangle region in the Brazilian state of Minas Gerais to the Tubarao Port, in Vitoria, in the Brazilianstate of Espırito Santo. We operate this 905-kilometer railroad under a 30-year renewable concession, whichexpires in 2027. The EFVM railroad consists of two lines of track extending for a distance of 601 kilometersto permit continuous railroad travel in opposite directions, and single-track branches of 304 kilometers.Industrial manufacturers are located in this area and major agricultural regions are also accessible to it. TheEFVM railroad has a daily capacity of 342,000 metric tons of iron ore. In 2011, the EFVM railroad carried atotal of 69.3 billion ntk of iron ore and other cargo, of which 9.4 billion ntk, or 7.4%, consisted of cargotransported for customers, including iron ore for Brazilian customers. The EFVM railroad also carried1.0 million passengers in 2011. In 2011, we had a fleet of 322 locomotives and 14,221 wagons at EFVM.
46

Carajas railroad (‘‘EFC’’). We operate the EFC railroad under a 30-year renewable concession, whichexpires in 2027. EFC is located in the Northern System, beginning at our Carajas iron ore mines in theBrazilian state of Para and extending 892 kilometers to our Ponta da Madeira maritime terminal complexfacilities located near the Itaqui Port in the Brazilian state of Maranhao. Its main cargo is iron ore, principallycarried for us. It has a daily capacity of 313,970 metric tons of iron ore. In 2011, the EFC railroad carried atotal of 98.1 billion ntk of iron ore and other cargo, 2.8 billion ntk of which was cargo for customers,including iron ore for Brazilian customers. EFC also carried 352,928 passengers in 2011. EFC supports thelargest capacity train in Latin America, which measures 3.4 kilometers, weighs 42,300 gross metric tons whenloaded and has 330 cars. In 2011, EFC had a fleet of 234 locomotives and 14,261 wagons.
Ferrovia Centro-Atlantica (‘‘FCA’’). Our subsidiary FCA operates the central-east regional railwaynetwork of the Brazilian national railway system under a 30-year renewable concession, which expires in 2026.The central east network has 8,023 kilometers of track extending into the states of Sergipe, Bahia, EspıritoSanto, Minas Gerais, Rio de Janeiro and Goias and Brasılia, the Federal District of Brazil. It connects withour EFVM railroad near the cities of Belo Horizonte, in the state of Minas Gerais and Vitoria, in the state ofEspırito Santo. FCA operates on the same track gauge as our EFVM railroad and provides access to theSantos Port in the state of Sao Paulo. In 2011, the FCA railroad transported a total of 10.7 billion ntk ofcargo for customers. In 2011, FCA had a fleet of 481 locomotives and 12,413 wagons.
Ferrovia Norte-Sul railroad (‘‘FNS’’). We have a 30-year renewable subconcession for the commercialoperation of a 720-kilometer stretch of the FNS railroad in Brazil. Since 1989, we have operated a segment ofthe FNS, which connects to the EFC railroad, enabling access to the port of Itaqui, in Sao Luıs, where ourPonta da Madeira maritime terminal is located. A 452-kilometer extension was concluded in December 2008.In 2011, the FNS railroad transported a total of 1.9 billion ntk of cargo for customers. This new railroadcreates a new corridor for the transportation of general cargo, mainly for the export of soybeans, rice andcorn produced in the center-northern region of Brazil. In 2011, FNS had a fleet of 6 locomotives and 375wagons.
The principal items of cargo of the EFVM, EFC, FCA and FNS railroads are:
� iron ore and iron ore pellets, carried for us and customers;
� steel, coal, pig iron, limestone and other raw materials carried for customers with steel millslocated along the railroad;
� agricultural products, such as soybeans, soybean meal and fertilizers; and
� other general cargo, such as building materials, pulp, fuel and chemical products.
We charge market prices for customer freight, including iron ore pellets originating from jointventures and other enterprises in which we do not have a 100% equity interest. Market prices vary based onthe distance traveled, the type of product transported and the weight of the freight in question, and areregulated by the Brazilian transportation regulatory agency, ANTT (Agencia Nacional de TransportesTerrestres).
MRS Logıstica S.A. (‘‘MRS’’). The MRS railroad is 1,643 kilometers long and links the Brazilianstates of Rio de Janeiro, Sao Paulo and Minas Gerais. In 2011, the MRS railroad carried a total of151.87 million metric tons of cargo, including 113.51 million metric tons of iron ore and other cargo fromVale.
Colombia
Ferrocarriles del Norte de Colombia S.A. (‘‘FENOCO’’). We own an 8.4% equity stake in FENOCO, acompany that owns a concession to restore and operate the Chiriguana—Santa Marta tranche (220
47

kilometers) of the Atlantic Railroad, which connects the Cesar coal-producing region with various ports in theAtlantic Ocean.
Argentina
On August 24, 2010, through our subsidiary Potasio Rıo Colorado S.A., we executed an agreementwith Ferrosur Roca S.A. for partial assignment, subject to governmental approvals, of a 756-kilometer railroadadministrative concession. This concession is important to the support of the Rio Colorado potash project andour strategy to become a leading global player in the fertilizer business.
Africa
Consistent with our decision to invest in the Nacala Corridor and following on our September 2010acquisition of a 51.0% stake in SDCN, in June 2011, we acquired an additional 16% stake in SDCN forUS$8 million, reaching a 67% total participation in the company at year end. In December 2011, we executeda concession agreement with the Republic of Malawi with respect to a 137-kilometer railroad to be built fromChikwawa to Nkaya Junction in Malawi. The SDCN acquisition and the concession in Malawi will allow theexpansion of Moatize and facilitate the creation of a world-class logistics infrastructure to support ouroperations in Central and Eastern Africa. We will invest in the capacity expansion of the Nacala logisticscorridor through the rehabilitation of the existing railroads in Mozambique and Malawi, respectively owned byCorredor de Desenvolvimento do Norte S.A. (‘‘CDN’’) and Central East African Railway Company Limited(‘‘CEAR’’), each a 51%-owned subsidiary of SDCN, and through the construction of railway links fromMoatize to a new deep water maritime terminal to be built in Nacala-a-Velha.
We are currently studying the possible construction of an integrated railway-port system fortransporting iron ore output from Simandou, in Guinea.
4.1.2 Ports and maritime terminals
Brazil
We operate a port and six maritime terminals principally as a means to complete the delivery of ouriron ore and iron ore pellets to bulk carrier vessels serving the seaborne market. See—Bulk materials—Ironore pellets—Operations. We also use our port and terminals to handle customers’ cargo. In 2011, 10% of thecargo handled by our port and terminals represented cargo handled for customers.
Tubarao Port. The Tubarao Port, which covers an area of 18 square kilometers, is located near theVitoria Port in the Brazilian state of Espırito Santo and contains four maritime terminals: (i) an iron oremaritime terminal, (ii) Praia Mole Terminal, (iii) Terminal de Produtos Diversos, and (iv) Terminal de GraneisLıquidos.
� The iron ore maritime terminal has two piers. Pier I can accommodate two vessels at a time, oneof up to 170,000 DWT on the southern side and one of up to 200,000 DWT on the northern side.Pier II can accommodate one vessel of up to 400,000 DWT at a time, limited at 20 meters draftplus tide. In Pier I there are two ship loaders, which can load up to a combined total of 26,700metric tons per hour. In Pier II there are two ship loaders that work alternately and can eachload up to 16,000 metric tons per hour. In 2011, 102.9 million metric tons of iron ore and ironore pellets were shipped through the terminal for us. The iron ore maritime terminal has astockyard capacity of 3.2 million metric tons.
� Praia Mole terminal is principally a coal terminal and handled 10.9 million metric tons in 2011.See Additional information—Legal proceedings.
� Terminal de Produtos Diversos handled 6.4 million metric tons of grains and fertilizers in 2011.
� Terminal de Graneis Lıquidos handled 1.0 million metric tons of bulk liquid in 2011.
48

Ponta da Madeira maritime terminal. The Ponta da Madeira maritime terminal is located near theItaqui Port in the Brazilian state of Maranhao. The terminal facilities can accommodate four vessels. Pier Ican accommodate vessels displacing up to 420,000 DWT. Pier II can accommodate vessels of up to 155,000DWT. Pier I has a maximum loading rate of 16,000 tons per hour. Pier II has a maximum loading rate of8,000 tons per hour. Pier III, which has two berths and three shiploaders, can accommodate vessels of up to220,000 DWT at the south berths and 180,000 DWT at the north berths and has a maximum loading rate of8,000 metric tons per hour in each shiploader. Cargo shipped through our Ponta da Madeira maritimeterminal consists principally of our own iron ore production. Other cargo includes manganese ore, copperconcentrate and pig iron produced by us and pig iron and soybeans for unrelated parties. In 2011,100.5 million metric tons of iron ore were handled through the terminal. The Ponta da Madeira maritimeterminal has a stockyard capacity of 6.2 million metric tons.
Itaguaı maritime terminal—Cia. Portuaria Baıa de Sepetiba (‘‘CPBS’’). CPBS is a wholly ownedsubsidiary that operates the Itaguaı terminal, in the Sepetiba Port, in the Brazilian state of Rio de Janeiro.Itaguaı’s maritime terminal has a pier that allows the loading of ships up to 18 meters of draft and up to230,000 DWT. In 2011, the terminal uploaded 21.5 million metric tons of iron ore.
Guaıba Island maritime terminal. We operate a maritime terminal on Guaıba Island in the SepetibaBay, in the Brazilian state of Rio de Janeiro. The iron ore terminal has a pier that allows the loading of shipsof up to 300,000 DWT. In 2011, the terminal uploaded 37.6 million metric tons of iron ore.
Inacio Barbosa maritime terminal (‘‘TMIB’’). We operate the Inacio Barbosa maritime terminal,located in the Brazilian state of Sergipe. The terminal is owned by Petrobras. Vale and Petrobras entered intoan agreement in December 2002, which allows Vale to operate this terminal for a period of 10 years. In 2011,1.0 million metric tons of fuel and agricultural and steel products were shipped through TMIB.
Santos maritime terminal (‘‘TUF’’). We operate a maritime terminal, through our subsidiary ValeFertilizantes, in Santos, in the Brazilian state of Sao Paulo. The terminal has a pier that is equipped toreceive ships of up to 67,000 DWT. In 2011, the terminal handled 2.6 million metric tons of ammonia andbulk solids, 21.4% higher than 2010. In July 2011, we signed an agreement to form a joint venture with ValeFertilizantes to exploit the concession of TUF previously enjoyed by Vale Fertilizantes. Under the agreement,we will pay R$150 million (US$95 million) for the acquisition of 51% of the joint venture and will invest anadditional R$432 million (US$274 million) to finance the investment program of TUF.
Colombia
Sociedad Portuaria Rio Cordoba (‘‘SPRC’’). SPRC is a seaport facility wholly owned by Vale and usedto export coal from the El Hatillo operation, as well as other nearby mines. The port is located in Cienaga,on the Caribbean coast of Colombia, in the Magdalena Department, about 67 kilometers from Barranquillaand 31 kilometers from Santa Marta.
Argentina
Vale Logıstica Argentina S.A. (‘‘Vale Logıstica Argentina’’) operates a terminal at the San Nicolasport located in the province of Buenos Aires, Argentina, where Vale Logıstica Argentina has a permit to usea stockyard of 20,000 square meters until October 2016 and an agreement with third parties for an extrastockyard of 27,000 square meters. We expect to handle 1.9 million metric tons of iron and manganese orethrough this port in 2012, which will come from Corumba, Brazil, through the Paraguay and Parana rivers, forshipment to Asian and European markets. The loading rate of this port is 15,000 tons per day and theunloading rate is 11,000 tons per day.
Indonesia
PTVI owns and operates two ports in Indonesia to support its nickel mining activities.
49

� The Balantang Special Port is located in Balantang Village, South Sulawesi, and has two types ofpiers, with total capacity of 6,000 DWT: a barge slip for barges with capacity of up to 4,000 DWTfor dry bulk cargo and a general cargo wharf for vessels of up to 2,000 DWT.
� The Harapan Tanjung Mangkasa Special Port is located in Harapan Tanjung Mangkasa Village,South Sulawesi, with mooring buoys that can accommodate vessels displacing up to 20,000 DWT,and a terminal that can accommodate fuel tanker vessels with capacity of up to 2,000 DWT,totaling capacity of 22,000 DWT.
4.1.3 Shipping
In addition to the iron ore seaborne shipping conducted to support our iron ore and pellets business(See—Bulk Materials—Iron Ore—Operations), and the shipping and loading in the Parana and Paraguaywaterway system conducted to support our bulk material operations, we also operate tug boat services.
We continue to develop and operate a low-cost fleet of vessels, comprised of our own ships and shipshired pursuant to medium and long-term contracts, to support our bulk materials business. Over the last fewyears, we purchased 22 used capesize vessels. We have also placed orders with shipyards for the constructionof 19 very large ore carriers (‘‘VLOC’’) each with a capacity of 400,000 DWT and 4 additional capesizevessels, each with a capacity of 180,000 DWT. The first 4 very large ore carriers and the 4 capesize vesselswere delivered in 2011. At the end of 2011, 30 of our own vessels were in operation, along with 22 usedcapesizes, 4 VLOC and 4 new capesizes of 180,000 DWT. In addition to our VLOCs, another 16 have beenordered for construction by third party ship owners to be chartered by Vale and dedicated to transport Vale’siron ore to its customers. We expect this service to enhance our ability to offer our iron ore products in theAsian market at competitive prices and to increase our market share in China and the global seabornemarket. In 2011, we shipped 89.9 million metric tons of iron ore and pellets on a CFR basis, of which82.4 million metric tons were shipped to China.
In the Parana and Paraguay waterway system, we transport iron ore and manganese ores through ourwholly owned subsidiary Transbarge Navigacion, which transported 1.7 million tons through the waterwaysystem in 2011, and our wholly owned subsidiary Vale Logıstica Argentina, which loaded 1.5 million tons ofore at Saint Nicolas Port into ocean-going vessels in 2011. In 2010, we also purchased two new convoys (twopushers and 32 barges) that will begin operations in 2012.
We operate a fleet of 28 tug boats in maritime terminals in Brazil, specifically in Vitoria (in the stateof Espırito Santo), Trombetas and Vila do Conde (in the state of Para), Sao Luıs (in the state of Maranhao),Mangaratiba (in the state of Rio de Janeiro) and Aracaju (in the state of Sergipe).
We own 31.3% of Log-In, which conducts intermodal logistics services. Log-In offers port handlingand container transportation services by sea as well as container storage. It operates owned and charteredships for coastal shipping, a container terminal (Terminal Vila Velha—TVV) and multimodal terminals. In2011, Log-In’s coastal shipping service transported 153,350 twenty-foot equivalent units (‘‘teus’’) and TVVhandled 276,245 teus.
4.2 Energy
4.2.1 Electric power
We have developed our energy assets based on the current and projected energy needs of our miningoperations, with the goal of reducing our energy costs and minimizing the risk of energy shortages.
50
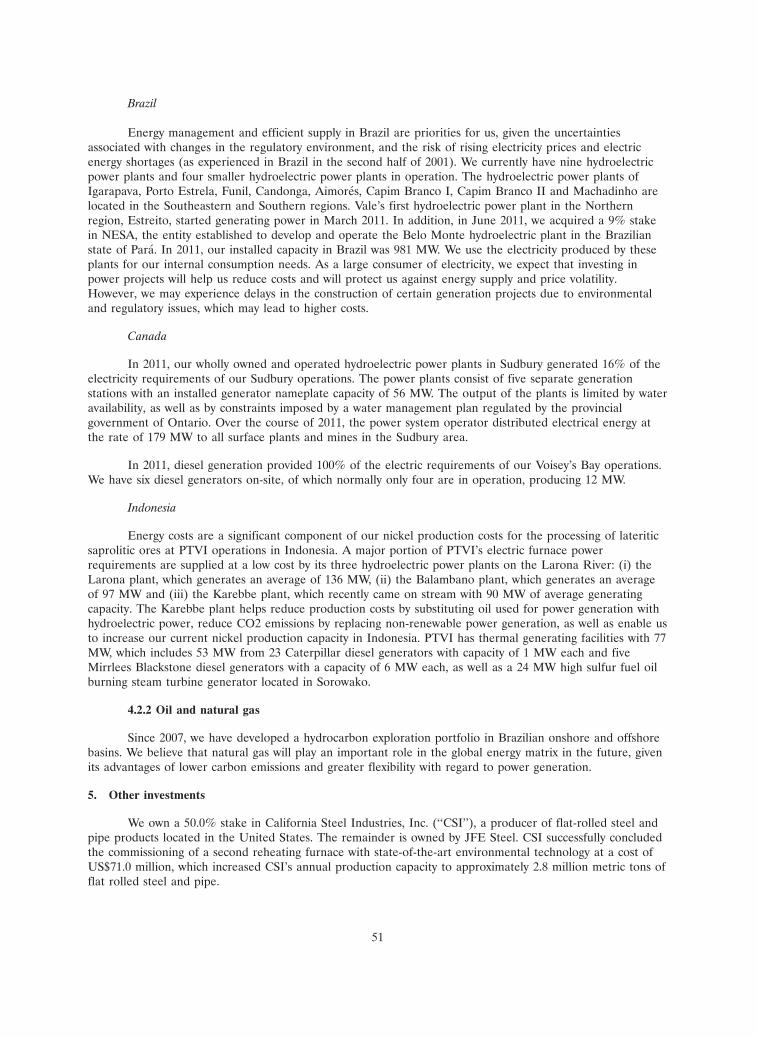
Brazil
Energy management and efficient supply in Brazil are priorities for us, given the uncertaintiesassociated with changes in the regulatory environment, and the risk of rising electricity prices and electricenergy shortages (as experienced in Brazil in the second half of 2001). We currently have nine hydroelectricpower plants and four smaller hydroelectric power plants in operation. The hydroelectric power plants ofIgarapava, Porto Estrela, Funil, Candonga, Aimores, Capim Branco I, Capim Branco II and Machadinho arelocated in the Southeastern and Southern regions. Vale’s first hydroelectric power plant in the Northernregion, Estreito, started generating power in March 2011. In addition, in June 2011, we acquired a 9% stakein NESA, the entity established to develop and operate the Belo Monte hydroelectric plant in the Brazilianstate of Para. In 2011, our installed capacity in Brazil was 981 MW. We use the electricity produced by theseplants for our internal consumption needs. As a large consumer of electricity, we expect that investing inpower projects will help us reduce costs and will protect us against energy supply and price volatility.However, we may experience delays in the construction of certain generation projects due to environmentaland regulatory issues, which may lead to higher costs.
Canada
In 2011, our wholly owned and operated hydroelectric power plants in Sudbury generated 16% of theelectricity requirements of our Sudbury operations. The power plants consist of five separate generationstations with an installed generator nameplate capacity of 56 MW. The output of the plants is limited by wateravailability, as well as by constraints imposed by a water management plan regulated by the provincialgovernment of Ontario. Over the course of 2011, the power system operator distributed electrical energy atthe rate of 179 MW to all surface plants and mines in the Sudbury area.
In 2011, diesel generation provided 100% of the electric requirements of our Voisey’s Bay operations.We have six diesel generators on-site, of which normally only four are in operation, producing 12 MW.
Indonesia
Energy costs are a significant component of our nickel production costs for the processing of lateriticsaprolitic ores at PTVI operations in Indonesia. A major portion of PTVI’s electric furnace powerrequirements are supplied at a low cost by its three hydroelectric power plants on the Larona River: (i) theLarona plant, which generates an average of 136 MW, (ii) the Balambano plant, which generates an averageof 97 MW and (iii) the Karebbe plant, which recently came on stream with 90 MW of average generatingcapacity. The Karebbe plant helps reduce production costs by substituting oil used for power generation withhydroelectric power, reduce CO2 emissions by replacing non-renewable power generation, as well as enable usto increase our current nickel production capacity in Indonesia. PTVI has thermal generating facilities with 77MW, which includes 53 MW from 23 Caterpillar diesel generators with capacity of 1 MW each and fiveMirrlees Blackstone diesel generators with a capacity of 6 MW each, as well as a 24 MW high sulfur fuel oilburning steam turbine generator located in Sorowako.
4.2.2 Oil and natural gas
Since 2007, we have developed a hydrocarbon exploration portfolio in Brazilian onshore and offshorebasins. We believe that natural gas will play an important role in the global energy matrix in the future, givenits advantages of lower carbon emissions and greater flexibility with regard to power generation.
5. Other investments
We own a 50.0% stake in California Steel Industries, Inc. (‘‘CSI’’), a producer of flat-rolled steel andpipe products located in the United States. The remainder is owned by JFE Steel. CSI successfully concludedthe commissioning of a second reheating furnace with state-of-the-art environmental technology at a cost ofUS$71.0 million, which increased CSI’s annual production capacity to approximately 2.8 million metric tons offlat rolled steel and pipe.
51

We have a 26.9% stake in the ThyssenKrupp Companhia Siderurgica do Atlantico (‘‘TKCSA’’)integrated steel slab plant in the Brazilian state of Rio de Janeiro. The plant started operations during thethird quarter of 2010, and produced 3.2 Mt in 2011. The plant will ultimately have a production capacity of5.0 Mtpy and will consume 8.5 million metric tons of iron ore and iron ore pellets per year, suppliedexclusively by Vale. We are also involved in three other steel projects in Brazil, Companhia Siderurgica doPecem (‘‘CSP’’), which was already approved by our Board of Directors, as well as Acos Laminados do Para(‘‘Alpa’’) and Companhia Siderurgica Ubu (‘‘CSU’’), which are both in earlier stages of development.
We have a 61.5% stake in CADAM S.A. (‘‘CADAM’’), located on the border of the Brazilian statesof Para and Amapa, in the Amazon area in northern Brazil. CADAM produces kaolin for paper coating andalso conducts research into other uses for kaolin products in order to develop a more diversified portfolio.CADAM’s reserves are principally concentrated in the open-pit Morro do Felipe mine, in Vitoria do Jari, inthe state of Amapa. The beneficiation plant and private port facilities are situated on the west bank of theJari River, in Munguba, in the Brazilian state of Para. CADAM produces the following products: Amazon SB,Amazon Premium and Amazon Plus. They are sold mainly in the European, Asian and Latin Americanmarkets. CADAM obtains electricity from its own thermal power plant. In 2011, CADAM produced 370,969metric tons of kaolin.
Until recently, we conducted a pig iron operation in northern Brazil, which utilized two conventionalmini-blast furnaces to produce 350,000 metric tons of pig iron per year, using iron ore from our Carajasmines in northern Brazil. In February 2012, we began shutting down all of our pig iron operations.
RESERVES
Presentation of information concerning reserves
The estimates of proven and probable ore reserves at our mines and projects and the estimates ofmine life included in this annual report have been prepared by our staff of experienced geologists andengineers, unless otherwise stated, and calculated in accordance with the technical definitions established bythe SEC. Under the SEC’s Industry Guide 7:
� Reserves are the part of a mineral deposit that could be economically and legally extracted orproduced at the time of the reserve determination.
� Proven (measured) reserves are reserves for which (a) quantity is computed from dimensionsrevealed in outcrops, trenches, working or drill holes; grade and/or quality are computed from theresults of detailed sampling; and (b) the sites for inspection, sampling and measurement arespaced so closely and the geologic character is so well defined that size, shape, depth and mineralcontent of reserves are well-established.
� Probable (indicated) reserves are reserves for which quantity and grade and/or quality arecomputed from information similar to that used for proven (measured) reserves, but the sites forinspection, sampling and measurement are farther apart or are otherwise less adequately spaced.The degree of assurance, although lower than that for proven (measured) reserves, is high enoughto assume continuity between points of observation.
We periodically revise our reserve estimates when we have new geological data, economic assumptionsor mining plans. During 2011, we performed an analysis of our reserve estimates for certain projects andoperations, which is reflected in new estimates as of December 31, 2011. Reserve estimates for each operationassume that we either have or will obtain all of the necessary rights and permits to mine, extract and processore reserves at each mine. Where we own less than 100% of the operation, reserve estimates have not beenadjusted to reflect our ownership interest. Certain figures in the tables, discussions and notes have beenrounded. For a description of risks relating to reserves and reserve estimates, see Risk factors.
52

Our reserve estimates are based on certain assumptions about future prices. We have determined thatour reported reserves could be economically produced if future prices for the products identified in thefollowing table were equal to the three-year average historical prices through December 31, 2011. For thispurpose, we used the three-year historical average prices set forth in the following table.
Commodity Three-year average historical price Pricing source
(US$ per metric ton, unless otherwise stated)Iron ore:
Lump ore—Midwestern System . . . 78.42 Average realized pricePellet feed—Samarco . . . . . . . . . 111.83 Average realized pricePellet feed—Southeastern System . . 106.23 Average realized pricePellet feed—Southern System . . . . 95.58 Average realized priceSinter feed—Northern System . . . . 102.56 Average realized priceSinter feed—Southeastern System . . 100.37 Average realized priceSinter feed—Southern System . . . . 95.63 Average realized price
Coal:Hard metallurgical—Moatize . . . . . 209.70 Reference price for standard hard
coking coalMetallurgical—Australia . . . . . . . 177.26 Average realized priceThermal—Australia . . . . . . . . . . 93.43 Average realized priceThermal—El Hatillo . . . . . . . . . . 81.90 Average realized pricePCI—Australia . . . . . . . . . . . . . 147.98 Average realized price
Base metals:Nickel . . . . . . . . . . . . . . . . . . 19,775.44 Average LME spot price for nickelCopper . . . . . . . . . . . . . . . . . 7,165.02 Average LME spot price for copper
Nickel by-products:Platinum . . . . . . . . . . . . . . . . 1,484.00/ t oz Average realized pricePalladium . . . . . . . . . . . . . . . . 530.93/ t oz Average realized priceGold . . . . . . . . . . . . . . . . . . . 1,310.23/ t oz Average realized priceCobalt . . . . . . . . . . . . . . . . . . 16.37/ lb 99.3% low cobalt metal (source: Metal
Bulletin)
Fertilizer nutrients:Phosphate . . . . . . . . . . . . . . . . 145.00 Average benchmark price for
phosphate concentrate, FOB Morocco(source: Fertilizer Week)
Potash . . . . . . . . . . . . . . . . . . 466.00 Average benchmark price for potash,FOB Vancouver (source: FertilizerWeek)
Other:Manganese . . . . . . . . . . . . . . . 260.00 CIF China, 44% manganese grade
(source: CRU)Kaolin . . . . . . . . . . . . . . . . . . 238.00 Average realized price
Iron ore reserves
The following tables set forth our iron ore reserves and other information about our iron ore mines.Total iron ore reserves increased 6.4% from 2010 to 2011, reflecting an updated geological model which
53

incorporated new drilling data from Conceicao, Galinheiro, Sapecado and Serra Leste deposits, which morethan offset mining depletion.
Summary of total iron ore reserves(1)
Proven – 2011 Probable – 2011 Total – 2011 Total – 2010
Tonnage Grade Tonnage Grade Tonnage Grade Tonnage Grade
Southeastern System . . . . . 2,200.6 49.6 1,307.7 49.2 3,508.3 49.4 3,499.0 50.6Southern System . . . . . . . 2,085.2 49.0 2,124.9 46.6 4,210.1 47.8 3,271.3 50.3Midwestern System . . . . . . 7.7 62.6 27.2 62.1 34.9 62.2 35.4 62.2Northern System . . . . . . . 4,928.7 66.7 2,453.9 66.6 7,382.7 66.7 7,260.0 66.7
Vale Total . . . . . . . . . . 9,222.2 58.6 5,913.7 55.6 15,135.9 57.4 14,065.7 58.9
Samarco(2) . . . . . . . . . . 1,104.2 42.3 925.2 39.8 2,029.4 41.2 2,068.9 41.2
Total . . . . . . . . . . . . . 10,326.4 56.9 6,838.9 53.4 17,165.3 55.5 16,134.6 56.6
(1) Tonnage is stated in millions of metric tons of wet run-of-mine, based on the following moisture content: Southeastern System 4%;Southern System 5%; Midwestern System 3%; Northern System 6%; and Samarco 7%. Grade is % of Fe.
(2) Reserves of Samarco’s Alegria iron ore mines. Our equity interest in Samarco is 50.0% and the reserve figures have not been adjustedto reflect our ownership interest.
Iron ore reserves per mine in the Southeastern System(1)
Proven – 2011 Probable – 2011 Total – 2011 Total – 2010
Tonnage Grade Tonnage Grade Tonnage Grade Tonnage Grade
Itabira siteConceicao . . . . . . . . . . 524.6 46.1 105.9 47.9 630.5 46.4 295.5 51.9Minas do Meio . . . . . . . 235.8 51.7 81.6 48.5 317.4 50.9 471.6 54.6
Minas Centrais siteAgua Limpa(2) . . . . . . . 34.2 41.8 10.1 42.1 44.2 41.9 45.1 41.7Gongo Soco . . . . . . . . 40.0 66.7 10.8 66.2 50.8 66.6 54.8 65.4Brucutu . . . . . . . . . . . 247.5 51.0 288.2 48.7 535.7 49.8 652.2 49.0Apolo . . . . . . . . . . . . 292.4 57.4 339.7 55.1 632.1 56.1 632.1 56.1
Mariana siteAlegria . . . . . . . . . . . 139.9 49.1 26.6 46.6 166.5 48.7 178.9 49.2Fabrica Nova . . . . . . . . 451.1 45.6 349.0 44.1 800.1 45.0 830.9 45.2Fazendao . . . . . . . . . . 235.2 49.8 95.7 50.1 330.9 49.9 337.8 49.9
Total Southeastern System . . 2,200.6 49.6 1,307.7 49.2 3,508.3 49.4 3,499.0 50.6
(1) Tonnage is stated in millions of metric tons of wet run-of-mine, based on the following moisture content: Itabira site 2%; MinasCentrais site 7%; Mariana site 4%. Grade is % of Fe. Approximate drill hole spacing used to classify the reserves were: 100m � 100mto proven reserves and 200m � 200m to probable reserves.
(2) Vale’s equity interest in Agua Limpa is 50.0% and the reserve figures have not been adjusted to reflect our ownership interest.
54
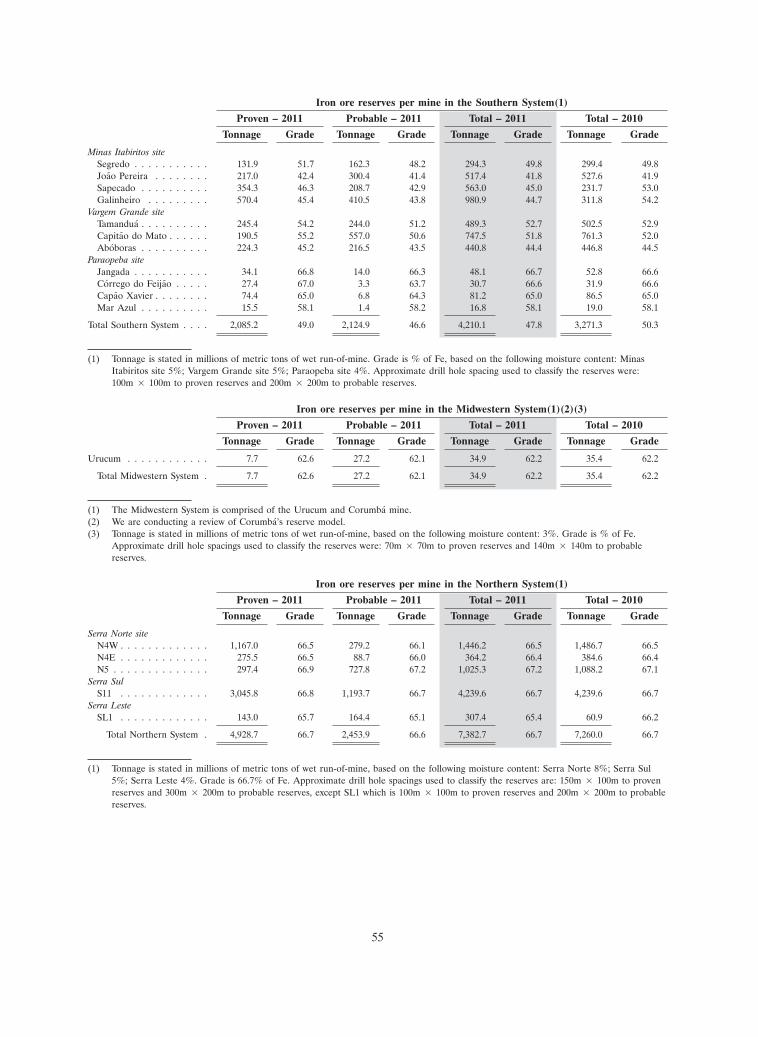
Iron ore reserves per mine in the Southern System(1)
Proven – 2011 Probable – 2011 Total – 2011 Total – 2010
Tonnage Grade Tonnage Grade Tonnage Grade Tonnage Grade
Minas Itabiritos siteSegredo . . . . . . . . . . . 131.9 51.7 162.3 48.2 294.3 49.8 299.4 49.8Joao Pereira . . . . . . . . 217.0 42.4 300.4 41.4 517.4 41.8 527.6 41.9Sapecado . . . . . . . . . . 354.3 46.3 208.7 42.9 563.0 45.0 231.7 53.0Galinheiro . . . . . . . . . 570.4 45.4 410.5 43.8 980.9 44.7 311.8 54.2
Vargem Grande siteTamandua . . . . . . . . . . 245.4 54.2 244.0 51.2 489.3 52.7 502.5 52.9Capitao do Mato . . . . . . 190.5 55.2 557.0 50.6 747.5 51.8 761.3 52.0Aboboras . . . . . . . . . . 224.3 45.2 216.5 43.5 440.8 44.4 446.8 44.5
Paraopeba siteJangada . . . . . . . . . . . 34.1 66.8 14.0 66.3 48.1 66.7 52.8 66.6Corrego do Feijao . . . . . 27.4 67.0 3.3 63.7 30.7 66.6 31.9 66.6Capao Xavier . . . . . . . . 74.4 65.0 6.8 64.3 81.2 65.0 86.5 65.0Mar Azul . . . . . . . . . . 15.5 58.1 1.4 58.2 16.8 58.1 19.0 58.1
Total Southern System . . . . 2,085.2 49.0 2,124.9 46.6 4,210.1 47.8 3,271.3 50.3
(1) Tonnage is stated in millions of metric tons of wet run-of-mine. Grade is % of Fe, based on the following moisture content: MinasItabiritos site 5%; Vargem Grande site 5%; Paraopeba site 4%. Approximate drill hole spacing used to classify the reserves were:100m � 100m to proven reserves and 200m � 200m to probable reserves.
Iron ore reserves per mine in the Midwestern System(1)(2)(3)
Proven – 2011 Probable – 2011 Total – 2011 Total – 2010
Tonnage Grade Tonnage Grade Tonnage Grade Tonnage Grade
Urucum . . . . . . . . . . . . 7.7 62.6 27.2 62.1 34.9 62.2 35.4 62.2
Total Midwestern System . 7.7 62.6 27.2 62.1 34.9 62.2 35.4 62.2
(1) The Midwestern System is comprised of the Urucum and Corumba mine.(2) We are conducting a review of Corumba’s reserve model.(3) Tonnage is stated in millions of metric tons of wet run-of-mine, based on the following moisture content: 3%. Grade is % of Fe.
Approximate drill hole spacings used to classify the reserves were: 70m � 70m to proven reserves and 140m � 140m to probablereserves.
Iron ore reserves per mine in the Northern System(1)
Proven – 2011 Probable – 2011 Total – 2011 Total – 2010
Tonnage Grade Tonnage Grade Tonnage Grade Tonnage Grade
Serra Norte siteN4W . . . . . . . . . . . . . 1,167.0 66.5 279.2 66.1 1,446.2 66.5 1,486.7 66.5N4E . . . . . . . . . . . . . 275.5 66.5 88.7 66.0 364.2 66.4 384.6 66.4N5 . . . . . . . . . . . . . . 297.4 66.9 727.8 67.2 1,025.3 67.2 1,088.2 67.1
Serra SulS11 . . . . . . . . . . . . . 3,045.8 66.8 1,193.7 66.7 4,239.6 66.7 4,239.6 66.7
Serra LesteSL1 . . . . . . . . . . . . . 143.0 65.7 164.4 65.1 307.4 65.4 60.9 66.2
Total Northern System . 4,928.7 66.7 2,453.9 66.6 7,382.7 66.7 7,260.0 66.7
(1) Tonnage is stated in millions of metric tons of wet run-of-mine, based on the following moisture content: Serra Norte 8%; Serra Sul5%; Serra Leste 4%. Grade is 66.7% of Fe. Approximate drill hole spacings used to classify the reserves are: 150m � 100m to provenreserves and 300m � 200m to probable reserves, except SL1 which is 100m � 100m to proven reserves and 200m � 200m to probablereserves.
55

Iron ore reserves per Samarco(1)(2)
Proven – 2011 Probable – 2011 Total – 2011 Total – 2010
Tonnage Grade Tonnage Grade Tonnage Grade Tonnage Grade
SamarcoAlegria Norte/Centro . . . . . 681.3 44.0 548.0 40.7 1,229.3 42.5 1,252.1 42.6Alegria Sul . . . . . . . . . . . 423.0 39.6 377.1 38.5 800.1 39.1 816.8 39.1
Total Samarco . . . . . . . . 1,104.2 42.3 925.2 39.8 2,029.4 41.2 2,068.9 41.2
(1) Tonnage is stated in millions of metric tons of wet run-of-mine based on the following moisture content: 7%. Grade is % of Fe.Approximate drill hole spacings used to classify the reserves are: Alegria Norte/Centro, 150m � 100m to proven reserves and200m � 300m to probable reserves; Alegria Sul, 100m � 100m to proven reserves and 200m � 200m to probable reserves.
(2) Vale’s equity interest in Samarco mines is 50.0% and the reserve figures have not been adjusted to reflect our ownership interest.
Southeastern System iron ore mines
ProjectedType Operating since exhaustion date Vale interest
(%)Itabira site
Conceicao . . . . . . . . . . . . . . . . . . . . . . . . . . . . Open pit 1957 2025 100.0Minas do Meio . . . . . . . . . . . . . . . . . . . . . . . . . Open pit 1976 2022 100.0
Minas Centrais siteAgua Limpa . . . . . . . . . . . . . . . . . . . . . . . . . . . Open pit 2000 2016 50.0Gongo Soco . . . . . . . . . . . . . . . . . . . . . . . . . . . Open pit 2000 2022 100.0Brucutu . . . . . . . . . . . . . . . . . . . . . . . . . . . . . Open pit 1994 2023 100.0Apolo . . . . . . . . . . . . . . . . . . . . . . . . . . . . . . Open pit – 2039 100.0
Mariana siteAlegria . . . . . . . . . . . . . . . . . . . . . . . . . . . . . . Open pit 2000 2023 100.0Fabrica Nova . . . . . . . . . . . . . . . . . . . . . . . . . . Open pit 2005 2034 100.0Fazendao . . . . . . . . . . . . . . . . . . . . . . . . . . . . Open pit 1976 2044 100.0
Southern System iron ore mines
ProjectedType Operating since exhaustion date Vale interest
(%)Minas Itabiritos site
Segredo . . . . . . . . . . . . . . . . . . . . . . . . . . . . . Open pit 2003 2035 100.0Joao Pereira . . . . . . . . . . . . . . . . . . . . . . . . . . . Open pit 2003 2035 100.0Sapecado . . . . . . . . . . . . . . . . . . . . . . . . . . . . Open pit 1942 2037 100.0Galinheiro . . . . . . . . . . . . . . . . . . . . . . . . . . . . Open pit 1942 2036 100.0
Vargem Grande siteTamandua . . . . . . . . . . . . . . . . . . . . . . . . . . . . Open pit 1993 2036 100.0Capitao do Mato . . . . . . . . . . . . . . . . . . . . . . . . Open pit 1997 2040 100.0Aboboras . . . . . . . . . . . . . . . . . . . . . . . . . . . . Open pit 2004 2033 100.0
Paraopeba siteJangada . . . . . . . . . . . . . . . . . . . . . . . . . . . . . Open pit 2001 2019 100.0Corrego do Feijao . . . . . . . . . . . . . . . . . . . . . . . Open pit 2003 2015 100.0Capao Xavier . . . . . . . . . . . . . . . . . . . . . . . . . . Open pit 2004 2018 100.0Mar Azul . . . . . . . . . . . . . . . . . . . . . . . . . . . . Open pit 2006 2017 100.0
Midwestern System iron ore mines
ProjectedType Operating since exhaustion date Vale interest
(%)Urucum . . . . . . . . . . . . . . . . . . . . . . . . . . . . . . . Open pit 1994 2029 100.0
56
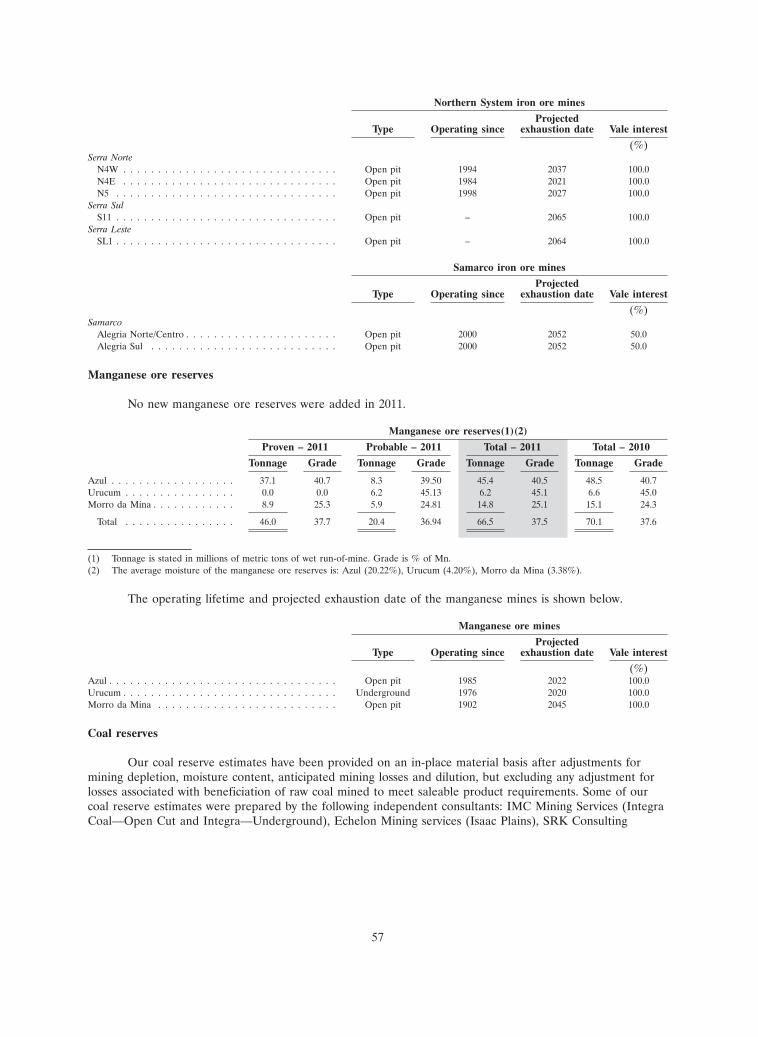
Northern System iron ore mines
ProjectedType Operating since exhaustion date Vale interest
(%)Serra Norte
N4W . . . . . . . . . . . . . . . . . . . . . . . . . . . . . . . Open pit 1994 2037 100.0N4E . . . . . . . . . . . . . . . . . . . . . . . . . . . . . . . Open pit 1984 2021 100.0N5 . . . . . . . . . . . . . . . . . . . . . . . . . . . . . . . . Open pit 1998 2027 100.0
Serra SulS11 . . . . . . . . . . . . . . . . . . . . . . . . . . . . . . . . Open pit – 2065 100.0
Serra LesteSL1 . . . . . . . . . . . . . . . . . . . . . . . . . . . . . . . . Open pit – 2064 100.0
Samarco iron ore mines
ProjectedType Operating since exhaustion date Vale interest
(%)Samarco
Alegria Norte/Centro . . . . . . . . . . . . . . . . . . . . . . Open pit 2000 2052 50.0Alegria Sul . . . . . . . . . . . . . . . . . . . . . . . . . . . Open pit 2000 2052 50.0
Manganese ore reserves
No new manganese ore reserves were added in 2011.
Manganese ore reserves(1)(2)
Proven – 2011 Probable – 2011 Total – 2011 Total – 2010
Tonnage Grade Tonnage Grade Tonnage Grade Tonnage Grade
Azul . . . . . . . . . . . . . . . . . . 37.1 40.7 8.3 39.50 45.4 40.5 48.5 40.7Urucum . . . . . . . . . . . . . . . . 0.0 0.0 6.2 45.13 6.2 45.1 6.6 45.0Morro da Mina . . . . . . . . . . . . 8.9 25.3 5.9 24.81 14.8 25.1 15.1 24.3
Total . . . . . . . . . . . . . . . . 46.0 37.7 20.4 36.94 66.5 37.5 70.1 37.6
(1) Tonnage is stated in millions of metric tons of wet run-of-mine. Grade is % of Mn.(2) The average moisture of the manganese ore reserves is: Azul (20.22%), Urucum (4.20%), Morro da Mina (3.38%).
The operating lifetime and projected exhaustion date of the manganese mines is shown below.
Manganese ore mines
ProjectedType Operating since exhaustion date Vale interest
(%)Azul . . . . . . . . . . . . . . . . . . . . . . . . . . . . . . . . . Open pit 1985 2022 100.0Urucum . . . . . . . . . . . . . . . . . . . . . . . . . . . . . . . Underground 1976 2020 100.0Morro da Mina . . . . . . . . . . . . . . . . . . . . . . . . . . Open pit 1902 2045 100.0
Coal reserves
Our coal reserve estimates have been provided on an in-place material basis after adjustments formining depletion, moisture content, anticipated mining losses and dilution, but excluding any adjustment forlosses associated with beneficiation of raw coal mined to meet saleable product requirements. Some of ourcoal reserve estimates were prepared by the following independent consultants: IMC Mining Services (IntegraCoal—Open Cut and Integra—Underground), Echelon Mining services (Isaac Plains), SRK Consulting
57

(Carborough Downs) and Snowden Mining Industry Consultants Pty Ltd. (Moatize), each of whom hasconsented to the inclusion of these estimates herein.
Coal ore reserves(1)
Coal type Proven – 2011 Probable – 2011 Total – 2011 Total – 2010
(tonnage) (tonnage) (calorific value) (tonnage) (calorific value)Integra Coal:
Integra Open-cut . . . Metallurgical & thermal 18.6 6.2 24.8 29.9 25.2 29.9Integra
Underground—Middle LiddellSeam . . . . . . . . Metallurgical – 10.7 10.7 – 12.5 –
IntegraUnderground—Hebden Seam . . . Metallurgical – 30.8 30.8 – 30.8 –
Total Integra Coal . 18.6 47.7 66.3 68.5
Carborough Downs—Underground . . . . . Metallurgical & PCI 35.1 5.2 40.3 31.7 (PCI) 42.3 31.7 (PCI)
Isaac Plains North Open Metallurgical, PCI & 17.4 1.2 18.6 23.4Cut . . . . . . . . . . . thermal 31.0 (PCI) 31.0 (PCI)
27.8 (thermal) 27.8 (thermal)El Hatillo . . . . . . . . Thermal 32.7 – 32.7 25.2 46.7 25.8Moatize . . . . . . . . . Metallurgical & thermal l 419.9 532.0 951.9 27.2 954.0 27.2
Total . . . . . . . . . . 523.7 586.1 1,109.8 1,134.9
(1) Tonnage is stated in millions of metric tons. Reserves are reported on a variable basis in regard to moisture: Integra Open Cut on in-situestimated basis, Integra Underground on in-situ estimated basis + 2%, Carborough Downs on air dried basis, and Isaac Plains North onin-situ estimated basis + 2%. El Hatillo reserves are based on in-situ moisture and Moatize is reported on an air-dried basis. Calorific valueof product coal derived from beneficiation of ROM coal is typically stated in MJ/kg. Calorific value is used in marketing thermal and PCIcoals.
(2) The reserves stated above by deposit are on a 100% shareholding basis. Vale’s ownership interest in accordance with the table below shouldbe used to calculate the portion of reserves directly attributable to Vale.
Reserves at Integra Open Cut, the Middle Liddell Seam for Integra Underground, Carborough Downsand Isaac Plains decreased in 2011 due to mining depletion. Reserves for the Hebden Seam for IntegraUnderground remained the same. The reduction in the El Hatillo reserves reflects the mine ROM productionin 2011, but also revisions to the geological model, underlying economic assumptions and mining plans. Thereduction of reserves at Moatize reflects the mine production in the second half of 2011.
Coal mines
ProjectedType Operating since exhaustion date Vale interest
(%)Integra Coal:
Open-cut . . . . . . . . . . . . . . . . . . . . . . . . . . . . . . Open pit 1991 2019 61.2Middle Liddell Seam . . . . . . . . . . . . . . . . . . . . . . . Underground 1999 2016 61.2Hebden Seam . . . . . . . . . . . . . . . . . . . . . . . . . . . Underground – 2027 61.2
Carborough Downs . . . . . . . . . . . . . . . . . . . . . . . . . Underground 2006 2022 85.0Isaac Plains . . . . . . . . . . . . . . . . . . . . . . . . . . . . . . Open pit 2006 2026 50.0El Hatillo . . . . . . . . . . . . . . . . . . . . . . . . . . . . . . . Open pit 2007 2018 100.0Moatize . . . . . . . . . . . . . . . . . . . . . . . . . . . . . . . . Open pit 2011 2046 95.0
58

Nickel ore reserves
Our nickel reserve estimates are of in-place material after adjustments for mining depletion andmining losses (or screening and drying in the cases of PTVI and VNC) and recoveries, with no adjustmentsmade for metal losses due to processing.
Nickel ore reserves(1)
Proven – 2011 Probable – 2011 Total – 2011 Total – 2010
Tonnage Grade Tonnage Grade Tonnage Grade Tonnage Grade
CanadaSudbury . . . . . . . . . . . . . . . . . . . . . . . . . . . . 59.8 1.20 45.6 1.14 105.4 1.18 112.3 1.20Thompson . . . . . . . . . . . . . . . . . . . . . . . . . . 7.7 1.83 19.9 1.72 27.5 1.75 26.7 1.72Voisey’s Bay . . . . . . . . . . . . . . . . . . . . . . . . . 18.7 2.80 3.1 0.65 21.8 2.50 24.1 2.58
IndonesiaPTVI . . . . . . . . . . . . . . . . . . . . . . . . . . . . . 72.1 1.84 37.3 1.70 109.4 1.79 113.7 1.79
New CaledoniaVNC . . . . . . . . . . . . . . . . . . . . . . . . . . . . . . 100.4 1.34 26.4 1.85 126.8 1.44 126.4 1.44
BrazilOnca Puma . . . . . . . . . . . . . . . . . . . . . . . . . . 47.1 1.74 35.8 1.25 82.9 1.52 82.7 1.73
Total . . . . . . . . . . . . . . . . . . . . . . . . . . . . . . . 305.8 1.59 168.1 1.46 473.8 1.54 485.9 1.59
(1) Tonnage is stated in millions of dry metric tons. Grade is % of nickel.
In Canada, reserves at our Sudbury operations decreased due primarily to mining depletion andreclassification of mineral reserves to mineral resources and certain re-interpretations. Reserves at ourThompson operations increased slightly due to resources-to-reserves conversion that offset mine depletionsincurred during the year. Reserves at our Voisey’s Bay operations decreased primarily due to mining depletionthat was partially offset by resources being converted to reserves.
Reserves at PTVI decreased as a result of adjustments for mining depletion and changes in oremodeling and pit designs that were partially offset by the conversion of resources to reserves.
Reserves grades at Onca Puma changed from 2010 estimates due to re-evaluation of dilution factors.At VNC, there was a slight increase in the reserve estimates from 2010 due to a change in the plant feedconstraint that allowed for more high magnesia material than in prior estimates.
Nickel ore mines
ProjectedType Operating since exhaustion date Vale interest
(%)Canada
Sudbury . . . . . . . . . . . . . . . . . . . . . . . . Underground 1885 2040 100.0Thompson . . . . . . . . . . . . . . . . . . . . . . Underground 1961 2026 100.0Voisey’s Bay . . . . . . . . . . . . . . . . . . . . . Open pit 2005 2023 100.0
IndonesiaPTVI . . . . . . . . . . . . . . . . . . . . . . . . . Open cast 1977 2035 59.2
New CaledoniaVNC . . . . . . . . . . . . . . . . . . . . . . . . . Open pit 2011 2041 74.0
BrazilOnca Puma . . . . . . . . . . . . . . . . . . . . . . Open pit 2011 2044 100.0
59

Copper ore reserves
Our copper reserve estimates are of in-place material after adjustments for mining depletion andmining losses and recoveries, with no adjustments made for metal losses due to processing.
Copper ore reserves(1)
Proven – 2011 Probable – 2011 Total – 2011 Total – 2010
Tonnage Grade Tonnage Grade Tonnage Grade Tonnage Grade
CanadaSudbury . . . . . . . . . . . . . . . 59.8 1.50 45.6 1.52 105.4 1.51 112.3 1.53Thompson . . . . . . . . . . . . . – – – – – – 26.7 0.10Voisey’s Bay . . . . . . . . . . . . 18.7 1.56 3.1 0.36 21.8 1.39 24.1 1.48
BrazilSossego . . . . . . . . . . . . . . . 133.4 0.83 20.8 0.67 154.1 0.81 165.7 0.84Salobo . . . . . . . . . . . . . . . 569.2 0.74 543.5 0.64 1,112.8 0.69 1,116.0 0.69
Total . . . . . . . . . . . . . . . 781.1 0.83 613.0 0.71 1,394.1 0.78 1,444.8 0.77
(1) Tonnage is stated in millions of dry metric tons. Grade is % of copper.
In Canada, our copper ore reserve estimates decreased for the same reasons discussed above inconnection with nickel reserves, since these deposits are also of polymetallic ore. In addition, we determinedthat there was not enough geological confidence to report copper as mineral reserves any longer inThompson, although we have recovered there for many years and will continue to recover copper inconcentrate as a by-product of the nickel operations. In Brazil, reserves at Sossego have decreased from lastyear due to mine depletions, partially offset by new drilling results that increased the mineral reserves. Thechange of reserves at Salobo is due to an updated mining plan that assumes higher operational costs relativeto increases in assumed prices. The Salobo mine is currently in the pre-operating phase.
Copper ore mines
ProjectedType Operating since exhaustion date Vale interest
(%)Canada
Sudbury . . . . . . . . . . . . . . . . . . . . . . . . . . . . . . Underground 1885 2040 100.0Voisey’s Bay . . . . . . . . . . . . . . . . . . . . . . . . . . . . Open pit 2005 2023 100.0
BrazilSossego . . . . . . . . . . . . . . . . . . . . . . . . . . . . . . . Open pit 2004 2023 100.0Salobo . . . . . . . . . . . . . . . . . . . . . . . . . . . . . . . Open pit – 2046 100.0
PGMs and other precious metals reserves
We expect to recover significant quantities of precious metals as by-products of our Canadianoperations, Sossego and from the Salobo project. Our reserve estimates are of in-place material after
60

adjustments for mining depletion and mining losses and recoveries, with no adjustments made for metal lossesdue to processing.
Precious metals reserves(1)
Proven – 2011 Probable – 2011 Total – 2011 Total – 2010
Tonnage Grade Tonnage Grade Tonnage Grade Tonnage Grade
CanadaSudbury
Platinum . . . . . . . . . . . . . 59.8 0.7 45.6 1.2 105.4 0.8 112.3 0.9Palladium . . . . . . . . . . . . 59.8 0.8 45.6 1.4 105.4 1.1 112.3 1.1Gold . . . . . . . . . . . . . . . 59.8 0.3 45.6 0.5 105.4 0.4 112.3 0.4
BrazilSossego
Gold . . . . . . . . . . . . . . . 133.4 0.2 20.8 0.2 154.1 0.2 165.7 0.3Salobo
Gold . . . . . . . . . . . . . . . 569.2 0.45 543.5 0.40 1,112.8 0.43 1,116.0 0.4
Total – Gold . . . . . . . . . 762.4 0.39 609.9 0.40 1,372.3 0.40 1,394.0 0.4
(1) Tonnage is stated in millions of dry metric tons. Grade is grams per dry metric ton.
In Canada our mineral reserve estimates for platinum, palladium and gold decreased for the reasonsdiscussed above in connection with nickel reserves. In Brazil, reserves at Sossego have decreased from lastyear due to mining depletions, partially offset by new drilling results that increased the mineral reserves. Thechange of reserves at Salobo is due to an updated mining plan that assumes higher operational costs relativeto increases in assumed prices.
Precious metals mines
Operating ProjectedType since exhaustion date Vale interest
(%)Canada
Sudbury . . . . . . . . . . . . . . . . . . . . . . . . . . Underground 1885 2040 100.0Brazil
Sossego . . . . . . . . . . . . . . . . . . . . . . . . . . Open pit 2004 2023 100.0Salobo . . . . . . . . . . . . . . . . . . . . . . . . . . Open pit – 2046 100.0
Cobalt ore reserves
We expect to recover significant quantities of cobalt as a by-product of our Canadian operations andfrom the VNC project. Our cobalt reserve estimates are of in-place material after adjustments for miningdepletion and mining losses (or screening in the case of VNC) and recoveries, with no adjustments made formetal losses due to processing.
Cobalt ore reserves(1)
Proven – 2011 Probable – 2011 Total – 2011 Total – 2010
Tonnage Grade Tonnage Grade Tonnage Grade Tonnage Grade
CanadaSudbury . . . . . . . . . . . . . . . 59.8 0.04 45.6 0.03 105.4 0.04 112.3 0.04Voisey’s Bay . . . . . . . . . . . . 18.7 0.14 3.1 0.03 21.8 0.12 24.1 0.12
New CaledoniaVNC . . . . . . . . . . . . . . . . 100.4 0.12 26.4 0.08 126.8 0.11 126.4 0.11
Total . . . . . . . . . . . . . . . 178.9 0.10 75.1 0.05 254.0 0.08 262.8 0.08
(1) Tonnage is stated in millions of metric tons. Grade is % of cobalt.
61

Our cobalt reserve estimates decreased in 2011 for the reasons discussed above in connection withnickel reserves.
Cobalt ore mines
Operating ProjectedType since exhaustion date Vale interest
(%)Canada
Sudbury . . . . . . . . . . . . . . . . . . . . . . . . . . Underground 1885 2040 100.0Voisey’s Bay . . . . . . . . . . . . . . . . . . . . . . . Open pit 2005 2023 100.0
New CaledoniaVNC . . . . . . . . . . . . . . . . . . . . . . . . . . . Open pit – 2041 74.0
Phosphate reserves
Our phosphate reserve estimates are of in-place material after adjustments for mining dilution, withno adjustments made for process recovery. The decrease in our phosphate reserve estimates reflects mineproduction and sales in 2011.
Phosphate reserves(1)
Proven – 2011 Probable – 2011 Total – 2011 Total – 2010
Tonnage Grade Tonnage Grade Tonnage Grade Tonnage Grade
Bayovar . . . . . . . . . . . . . . . . 229.0 17.3 1.9 15.9 230.9 17.2 239.0 17.2Catalao . . . . . . . . . . . . . . . . 52.9 10.3 7.6 10.2 60.5 10.3 66.7 10.4Tapira . . . . . . . . . . . . . . . . . 255.7 7.0 461.6 6.6 717.3 6.7 732.6 6.7Araxa . . . . . . . . . . . . . . . . . 142.8 11.7 4.7 9.4 147.5 11.6 155.9 11.6Cajati . . . . . . . . . . . . . . . . . 77.1 5.3 48.3 4.7 125.4 5.1 130.5 5.2Salitre . . . . . . . . . . . . . . . . . – – 205.7 11.4 205.7 11.4 206.0 11.4
Total . . . . . . . . . . . . . . . . 757.5 11.06 729.8 7.91 1,487.3 9.48 1,530.4 9.5
(1) Tonnage is stated in millions of dry metric tons. Grade is % of P2O5.
Phosphate rock ore mine
Operating ProjectedType since exhaustion date Vale interest
(%)Bayovar . . . . . . . . . . . . . . . . . . . . . . . . . . . Open pit 2010 2037 40.0(1)Catalao . . . . . . . . . . . . . . . . . . . . . . . . . . . Open pit 1982 2020 100.0Tapira . . . . . . . . . . . . . . . . . . . . . . . . . . . . Open pit 1979 2054 100.0Araxa . . . . . . . . . . . . . . . . . . . . . . . . . . . . Open pit 1977 2027 100.0Cajati . . . . . . . . . . . . . . . . . . . . . . . . . . . . Open pit 1970 2035 100.0Salitre . . . . . . . . . . . . . . . . . . . . . . . . . . . . Open pit – 2033 100.0
(1) Vale holds 51% of the voting capital and 40% of the total capital of MVM Resources International, B.V., the entity that controlsBayovar.
62

Potash ore reserves
Our reserve estimates are of in-place material after adjustments for mining depletion and mininglosses and recoveries, with no adjustments made for metal losses due to processing.
Potash ore reserves(1)
Proven – 2011 Probable – 2011 Total – 2011 Total – 2010
Tonnage Grade Tonnage Grade Tonnage Grade Tonnage Grade
Taquari-Vassouras . . . . . . . . . . 8.5 28.0 3.0 28.0 11.5 28.0 13.4 28.0Rio Colorado . . . . . . . . . . . . . – – 360.8 34.2 360.8 34.2 360.8 34.2
Total . . . . . . . . . . . . . . . . 8.5 28.0 363.8 34.1 372.3 34.0 374.2 34.0
(1) Tonnage is stated in millions of dry metric tons. Grade is % of KCl.
Potash ore mines
Operating ProjectedType since exhaustion date Vale interest
(%)Taquari-Vassouras(1) . . . . . . . . . . . . . . . . . . . . Underground 1986 2016 100.0Rio Colorado . . . . . . . . . . . . . . . . . . . . . . . . Solution mining – 2039 100.0
(1) We have a 25-year lease, which was signed in 1991, with Petrobras.
Kaolin ore reserves
Our reserve estimates are of in-place material after adjustments for mining depletion and mininglosses and recoveries, with no adjustments made for metal losses due to processing.
Kaolin ore reserves(1)
Proven – 2011 Probable – 2011 Total – 2011 Total – 2010
Tonnage Brightness Tonnage Brightness Tonnage Brightness Tonnage Brightness
Morro doFelipe . . . . 29.8 86.7 12.2 86.7 42.0 86.7 31.2 86.7
(1) Tonnage is stated in millions of metric tons. Brightness is stated in percentage terms.
Reserves at Morro do Felipe increased to 42.0 million metric tons, primarily reflecting an update tothe geological model with detailed new deposits.
Kaolin ore mines
Operating ProjectedType since exhaustion date Vale interest
(%)Morro do Felipe . . . . . . . . . . . . . . . . . . . . . . . Open pit 1976 2060 61.5
63

CAPITAL EXPENDITURES AND PROJECTS
We have an extensive program of investments in the organic growth of our businesses. During 2011,we made capital expenditures and other investments of US$17.994 billion, of which US$13.426 billion wasorganic growth, while US$4.568 billion was invested in maintaining existing operations. As previouslydisclosed, the 2012 investment budget approved by our Board of Directors in November 2011 isUS$12.949 billion for project execution, US$2.357 billion for research and development (R&D) andUS$6.106 billion for sustaining existing operations. The capital expenditures, including R&D expenses, arereported on the basis of financial disbursements. A large part of the capital expenditures budget will beinvested in Brazil (63.7%) and in Canada (11.7%). The remainder is allocated to investments in Argentina,Australia, Chile, China, Guinea, Indonesia, Malaysia, Mozambique, New Caledonia, and Peru, among othercountries.
2010 expenditures 2011 expenditures 2012 budget
(US$ million) (US$ million) (US$ million) (% of total)Organic growth . . . . . . . . . . . . . . . . . US$9,375 US$13,426 US$15,309 71.5%
Project execution . . . . . . . . . . . . . . 8,239 11,684 12,949 60.5Research and development . . . . . . . . . 1,136 1,742 2,357 11.0
Investments to sustain existing operations . 3,330 4,568 6,106 28.5
Total . . . . . . . . . . . . . . . . . . . . . . . US$12,705 US$17,994 US$21,411 100.0%
The following table summarizes by major business area the breakdown of our capital expenditures in2010 and 2011 and our investment budget for 2012.
2010 2011 2012 budget
(US$ million) (% of total) (US$ million) (% of total) (US$ million) (% of total)Bulk materials . . . . . . US$7,046 55.5% US$10,247 56.9% US$11,903 55.6%
Ferrous minerals . . . 6,079 47.8 9,049 50.3 10,002 46.7Coal . . . . . . . . . . 967 7.6 1,197 6.7 1,901 8.9
Base metals . . . . . . . 2,973 23.4 4,082 22.7 4,630 21.6Fertilizer nutrients . . . 843 6.6 1,347 7.5 2,050 9.6Logistics for general
cargo(1) . . . . . . . . 247 1.9 446 2.5 518 2.4Energy . . . . . . . . . . 656 5.2 820 4.6 775 3.6Steel . . . . . . . . . . . 186 1.5 460 2.6 621 2.9Other . . . . . . . . . . . 755 5.9 592 3.3 914 4.3
Total . . . . . . . . . . US$12,705 100.0% US$17,994 100.0% US$21,411 100.0%
(1) Investments in logistics dedicated to a particular business segment are included with that segment in our capital expenditure data.
The following table sets forth total expenditures in 2011 for our main investment projects andexpenditures budgeted for those projects in 2012, together with estimated total expenditures for each project
64

and the estimated start-up date of each project as of December 31, 2011. The information below describingthe status of each project has generally not been updated to reflect developments since December 31, 2011.
Estimated Actual Expected capex
Business area Project(1) Start-up 2011(2) 2012 Total(3)
(US$ million)Iron ore mining and logistics . . Carajas – Additional 40 Mtpy 2H13 496 622 2,968
CLN 150 Mtpy 1H14 1,486 890 3,477Carajas Serra Sul S11D 2H16 736 794 8,039Serra Leste 1H13 116 239 478Conceicao Itabiritos 2H13 366 184 1,174Vargem Grande Itabiritos 1H14 371 429 1,645Conceicao Itabiritos II 2H14 150 297 1,189Simandou I – Zogota 1H12 178 380 1,260Teluk Rubiah 1H14 168 367 1,371Oman(4) 2011 278 17 1,356
Pellet plants . . . . . . . . . . . . Tubarao VIII 2H12 187 239 968Samarco IV(5) 1H14 – – 1,693
Coal mining and logistics . . . . Moatize(4) 2011 696 64 1,882Moatize II 2H14 73 499 2,068Nacala Corridor 2H14 38 691 4,444Eagle Downs(5) 1H16 19 87 875
Copper mining . . . . . . . . . . Salobo 1H12 586 296 2,337Salobo II 2H13 267 581 1,427
Nickel mining and refining . . . Long Harbour 2H13 1,066 1,208 3,600Totten 2H13 124 157 759
Potash mining and logistics . . . Rio Colorado 2H14 608 1,081 5,915
Energy . . . . . . . . . . . . . . . Biodiesel 2015 208 227 633Estreito(4) 2011 83 53 878Karebbe(4) 2011 93 5 410Belo Monte(5) 1H15 86 48 1,628
Steelmaking . . . . . . . . . . . . CSP(4) 1H15 261 563 2,648
(1) Projects approved by the Board of Directors.(2) All figures presented on a cash basis.(3) Estimated total capital expenditure cost for each project.(4) Projects delivered in 2011.(5) Expected capex is relative to Vale’s stake in each project.
Bulk materials and logistics projects
Iron ore mining and logistics projects:
� Carajas—Additional 40 Mtpy. Construction of an iron ore dry processing plant located in Carajas, inthe Brazilian state of Para. The installation license was issued and civil engineering works andearthworks services to install the conveyor belt are in progress. The project has an estimatednominal capacity of 40 Mtpy. The project is 48% complete, with total realized expenditures ofUS$1.5 billion. Start-up is expected for the second half of 2013.
� CLN 150 Mtpy. Expansion of Northern system railway and port capacity, including the constructionof a fourth pier at the Ponta da Madeira maritime terminal in the Brazilian state of Maranhao.Offshore civil engineering works at Ponta da Madeira maritime terminal have started, and we areassembling the ship loaders and conveyor belts. The civil engineering necessary for the installation ofthe car dumpers has concluded, and mechanical assembly has begun. Earthworks in the railway lineand terminal are in progress. One of the required railway installation licenses is expected to beissued in the second half of 2012. The project will increase EFC’s logistics nominal capacity to
65

approximately 150 Mtpy. The project is 67% complete, with total realized expenditures ofUS$2.3 billion. Start-up is expected for the first half of 2014.
� Carajas Serra Sul S11D. Development of a mine and processing plant, located in the Southernrange of Carajas, in the Brazilian state of Para. We are investing capital for earthworks services andbuilding the access road, prior to the issuance of environmental permits. We expect to receive thepreliminary environmental license in the first half of 2012, with the installation license expected tobe issued in the first half of 2013. The project has an estimated nominal capacity of 90 Mtpy. Theproject is 25% complete, with total realized expenditures of US$1.1 billion. Start-up is expected forthe second half of 2016.
� Serra Leste. Construction of a new processing plant located in Carajas, in the Brazilian state ofPara. Civil engineering works for the plant and excavation are underway. We expect the installationlicenses to be issued in the first half of 2012. The project has an estimated nominal capacity of 6Mtpy. The project is 26% complete, with total realized expenditures of US$143 million. Start-up isexpected for the first half of 2013.
� Conceicao Itabiritos. Construction of a concentration plant, located in the Southeastern System. Themills assembly was finalized and the issuance of the pending installation license for the energytransmission line is expected in the first half of 2012. The project has an estimated nominal capacityof 12 Mtpy. The project is 86% complete, with total realized expenditures of US$553 million.Start-up is expected for the second half of 2013.
� Vargem Grande Itabiritos. Construction of a new iron ore treatment plant in the Southern System,with an estimated nominal capacity of 10 Mtpy. The installation license was issued in 2009. Weexpect to receive the installation license for the energy transmission line and for the electricalsub-station in the first half of 2012. The project is 46% complete, with total realized expenditures ofUS$429 million. Start-up is expected for the first half of 2014.
� Conceicao Itabiritos II. Adaptation of the plant to process low-grade itabirites, located in theSoutheastern System. The heavy equipment was received and assembly has started. Civil engineeringworks for the installation of primary crushers are ongoing. The installation license has been issued.The project has an estimated nominal capacity of 19 Mtpy. The project is 20% complete, with totalrealized expenditures of US$159 million. Start-up is expected for the second half of 2014.
� Simandou I—Zogota. Development of the Zogota mine and processing plant in Simandou South,Guinea. The project has an estimated nominal capacity of 15 Mtpy. The project is in an early stageof development and first production is expected in 2012.
� Teluk Rubiah. Construction of a maritime terminal with enough depth for the 400,000 dwt vesselsand a stockyard in Teluk Rubiah, Malaysia. The stockyard will be capable of handling up to 30 Mtpyof iron ore products. The preliminary environmental license, construction and installation licenseshave been issued. The operation license is expected to be issued in the first half of 2014. The projectis on schedule and we are executing earthworks. The project is 14% complete, with total realizedexpenditures of US$215 million. Start-up is expected in the first half of 2014.
Pellet plant projects:
� Tubarao VIII. Eighth pellet plant at our existing complex at the Tubarao Port, Espırito Santo,Brazil. We are assembling equipment and metallic structures. Issuance of the operation license isexpected for the second half of 2012. We expect the plant to have production capacity of 7.5 Mtpy.The plant is 80% complete, with total realized expenditures of US$612 million. Start-up is expectedin the second half of 2012.
� Samarco IV. Construction of Samarco’s fourth pellet plant, and an expansion of the mine, pipelineand maritime terminal infrastructure. The project has an estimated nominal capacity of 8.3 Mtpy,increasing Samarco’s capacity to 30.5 Mtpy. The project is 18% complete. The budget is fullysourced by Samarco. Start-up is expected for the first half of 2014.
66

Coal mining and logistics projects:
� Moatize II. New pit and duplication of the Moatize CHPP, as well as all related infrastructure,located in Tete, Mozambique. Geological research studies and a detailed engineering project are inprogress. There are no pending installation licenses. The project will increase Moatize’s totalnominal capacity to 22 Mtpy (70% coking coal and 30% thermal). The project is 4% complete, withtotal realized expenditures of US$73 million. Start-up is expected in the second half of 2014.
� Nacala Corridor. Railway and port infrastructure connecting Moatize site to the Nacala-a-Velhamaritime terminal, located in Nacala, Mozambique. The project comprises the recovery of 682 km ofthe existing railway in Malawi and Mozambique, the construction of a maritime terminal and 230 kmof new railways, composed by a 201 km stretch connecting Moatize to Nkaya, Malawi, and 29 kmlinking the railway to Nacala-a-Velha. The concession agreement with the government of Malawi fora railway crossing the country has been signed. Development of the engineering project is inprogress. Vegetation clearing licenses were obtained for the construction of the railway and maritimeterminal in Mozambique. The project has an estimated nominal capacity of 18 Mtpy. The project isin an early stage of development, with total realized expenditures of US$38 million. Start-up isexpected in the second half of 2014.
� Eagle Downs. New underground mine development including CHPP, as well as all relatedinfrastructure, located in the Bowen Basin, Queensland, Australia. The project is planned to bedeveloped in a 50/50 JV with Aquila Coal Pty Ltd, a subsidiary of Aquila Resources Limited. Theproject has an estimated nominal capacity of 4 Mtpy (100% coking coal). The project was approvedby both JV participant boards and is in an early stage of development, with total realizedexpenditures of US$19 million. Start-up is expected for the first half of 2016.
Base metal projects
Copper mining projects:
� Salobo. Development of mine, plant and related infrastructure, located in Maraba, in the Brazilianstate of Para. The primary and secondary crushers, primary screening and conveyor belt have beencommissioned. The project has an estimated nominal capacity of 100,000 tpy of copper inconcentrate. The project is 97% complete, with total realized expenditures of US$2.0 billion. Start-upis expected for the first half of 2012.
� Salobo II. Salobo expansion, raising of the tailing dam height and increasing the mine capacity,located in Maraba, in the Brazilian state of Para. Civil works at the flotation circuit are in progressand the construction of the ball mill was initiated. The plant operating license is expected to beissued in the second half of 2013. The project is expected to provide an additional estimated nominalcapacity of 100,000 tpy of copper in concentrate. The project is 49% complete, with total realizedexpenditures of US$354 million. Start-up is expected in the second half of 2013.
Nickel mining and refining projects:
� Long-Harbour. Construction of a hydrometallurgical facility in Long Harbour, Newfoundland andLabrador, Canada. The plant is under construction and electromechanical assembly is in progress.The plant will have an estimated nominal refining capacity of 50,000 tpy of finished nickel, andassociated copper and cobalt. The project is 59% complete, with total realized expenditures ofUS$1.7 billion. Start-up is expected in the second half of 2013.
� Totten. Nickel mine (re-opening) in Sudbury, Ontario, Canada. The project has an estimatednominal capacity of 8,200 tpy. The project is 51% complete, and US$402 million of expenditureshave been realized. Start-up is expected for the second half of 2013.
67

Fertilizers nutrients projects
Potash mining and logistics projects:
� Rio Colorado. Investments in a solution mining system, located in Mendoza, Argentina, includingthe renovation of railway tracks (440 km), construction of a railway spur (350 km) and a maritimeterminal in Bahia Blanca, Argentina. An employee camp has been built in Malargue, Mendoza. Theenvironmental licenses for the construction of the new railway and agreements with four Argentinianprovinces have been obtained. The issuance of an installation license is expected for the first half of2012. The project has an estimated nominal capacity of 4.3 Mtpy of potash (KCl). The project is27% complete, with total realized expenditures of US$826 million. Start-up is expected in the secondhalf of 2014.
Energy projects
� Biodiesels. Project to produce biodiesel from palm oil. Plantation of 80,000 ha of palm trees locatedin the Brazilian state of Para. The biodiesel plant’s FEL III is expected for July 2013, while thepreliminary environmental license and construction and installation license issuance are all expectedfor the second half of 2013. The project has an estimated nominal capacity of 360,000 tpy ofbiodiesel. US$343 million of expenditures have been realized. Start-up is expected for 2015.
� Belo Monte. The Belo Monte Hydroelectric Power Plant will be built on the Xingu River, in theBrazilian state of Para and will have an installed capacity of 11,233 MW. Vale has a 9% stake inNESA, the company established to develop and operate the Belo Monte hydroelectric plant. Vale’sshare of Belo Monte capacity will supply Vale’s demand on the northern region of Brazil. Theproject is in an early stage of development, with total realized expenditures of US$85 million.Start-up is expected in the first half of 2015.
Steel projects
� Companhia Siderurgica do Pecem (‘‘CSP’’). Development of a steel slab plant in the Brazilian stateof Ceara in partnership with Dongkuk Steel Mill Co. (‘‘Dongkuk’’) and Posco, two major steelproducers in South Korea. Vale holds 50% of the joint venture. The project implementation startedin December 2011. Preliminary environmental and installation licenses were already obtained. Theproject will have an estimated nominal capacity of 3.0 Mtpy. Start-up is expected in the first half of2015.
REGULATORY MATTERS
We are subject to a wide range of governmental regulation in all the jurisdictions in which we operateworldwide. The following discussion summarizes the kinds of regulation that have the most significant impacton our operations.
Mining rights
In order to conduct mining activities, we are generally required to obtain some form of governmentalpermits, which differ in form depending on the jurisdiction but may include concessions, licenses, claims,tenements, leases or permits (all of which we refer to below as ‘‘concessions’’). Some concessions are ofindefinite duration, but many have specified expiration dates and may not be renewable. The legal andregulatory regime governing concessions differs among jurisdictions, often in important ways. For example inmany jurisdictions, including Brazil, mineral resources belong to the State and may only be extracted pursuantto a concession. In other jurisdictions, including Canada, a substantial part of our mining operations isconducted pursuant to mining rights we own or pursuant to leases, often from government agencies.
68

The table below summarizes our principal mining concessions and other similar rights. In addition tothe concessions described below, we have exploration licenses and Brazilian exploration applications withpriority covering 7.03 million hectares in Brazil and 18.2 million hectares in other countries.
Approximate area coveredLocation Concession or other right (in hectares) Expiration date
Brazil Mining concessions(1) 650,810 Indefinite
Canada Mining concessions (total) 265,804 2011-2032
Ontario Mineral leases 20,994 2012-2032Patented mineral rights 82,969 None
Mining license of occupation 3,075 Indefinite
Manitoba Order in Council leases 109,043 2020-2025Mineral leases 4,854 2013Potash leases 6,533 2016-2030
Patented mining claims 378
Newfoundland and Labrador Mining leases 1,599 2027
Saskatchewan Potash leases 27,404 2029-2032Petroleum and natural gas leases 8,955 2013-2016
Indonesia Contract of work(2) 190,510 2025
Australia Mining tenements 26,917 2011-2041
New Caledonia Mining concessions 21,269 2016-2051
Peru Mining concessions(3) 187,617 Indefinite
Colombia Mining concessions 10,730 2028-2032
Argentina Mining concessions 88,707 Indefinite
Chile Mining concessions 58,903 Indefinite
Mozambique Mining concessions 23,780 2032
Zambia Mining concessions(4) 68,550 2012-2033
China Mining concessions(5) 12,383 2034
DRC Mining concessions(4) 9,200 2039
Guinea Mining concessions 102,400 2035
(1) Includes mining applications.(2) Under the Mining Law that came into effect in 2009, we may be entitled to apply for at least one 10-year extension.(3) The Peruvian mining regime comprises only a single license type. The area reported reflects only licenses involving mining activities.(4) 50-50 joint venture with African Rainbow Minerals Limited.(5) Joint Venture with Henan Longyu Energy Resources Co., Ltd. Vale has a minority equity interest of 25%.
Many concessions impose specific obligations on the concessionaire governing such matters as howoperations are conducted and what investments are required to be made. Our ability to maintain our mineralrights depends on meeting these requirements, which often involve significant capital expenditures andoperating costs.
Regulation of mining activities
Mining and mineral processing are subject to extensive regulation, which differs in each jurisdiction inwhich we operate. Our major operations are subject to legislation and regulations that apply to miningactivities, which in many countries include state or provincial law in addition to national or federal law. Manyof our concessions, particularly for large operations, impose additional obligations on us as the concessionaire.
The jurisdictions in which we operate typically have government agencies that are charged withgranting mining concessions and monitoring compliance with mining law and regulations. For example, miningactivities in Brazil are supervised by the National Department of Mineral Production (Departamento Nacionalde Producao Mineral—DNPM), an agency of the federal Ministry of Mines and Energy.
69

Changes in mining legislation can have significant effects on our operations. Among the jurisdictionsin which we currently have major operations, there are several proposed or recently adopted changes inmining legislation that could materially affect us. These include the following:
� The Brazilian government is planning to propose changes to the Brazilian Mining Code, which ifadopted may have important implications for mining operations in Brazil or require additionalcapital expenditures.
� In Indonesia, a Mining Law, which came into effect in January 2009, introduced a new licensingregime and called for certain adjustments to mining contracts with the Indonesian government.Regulations implementing the Mining Law have gradually been promulgated by the government,but more are expected. The trend is towards a more regulated environment in the country,including benchmark price or reference price rules for nickel products, which have previouslybeen unregulated. In addition, regulations requiring mining companies to process commoditiesbefore exporting them and mandating foreign companies to divest a portion of their stake todomestic entities have also recently been promulgated. In addition, the Indonesian Governmenthas issued a list of nine principal items it intends to adjust in existing contracts of work, includingarea adjustments, taxes and non-tax state revenue obligations, domestic value added requirements,the duration of any extension, application of a license form for any extensions, priority for localand national contractors and restrictions on use of affiliated companies for mining services. PTVIhas submitted to the government its positions regarding these nine items, but no furtherdiscussions were initiated by the government during 2011. PTVI continues to monitordevelopments with respect to the Mining Law and its implementing regulations and assess theimpacts that these may have on PTVI’s current operations and its future prospects in Indonesia.Until all of the implementing regulations are promulgated, we will be unable to fully determinehow and to what extent PTVI’s Contract of Work and operations will be affected.
� In New Caledonia, a mining law was passed in March 2009 requiring new mining projects toobtain formal authorization rather than simply a declaration. Our application for authorization(replacing a 2005 declaration) must be made by April 2012 and, once submitted, we should obtainthe authorization by April 2015. We believe it is unlikely that the application for the authorizationwill be rejected, but there is a risk that new conditions will be imposed.
� In Guinea, a mining code adopted in 2011 imposes on all mining projects a requirement for 15%government participation. Additionally, the new code creates an obligation for an applicant for amining concession to present a retrocession plan under which 50% of the area it researchedduring the exploration phase is retroceded to the government.
� In Mozambique, the Ministry of Natural Resources is following other African countries inproposing a new mining code with more detailed provisions that reinforce the rights of localcommunities, give preference to domestic services and establish the possibility of governmentparticipation in the case of strategic projects, which have not yet been defined.
Environmental regulations
We are also subject to environmental regulations that apply to the specific types of mining andprocessing activities we conduct. We require approvals, licenses, permits or authorizations from governmentalauthorities to operate, and in most jurisdictions the development of new facilities requires us to submitenvironmental impact statements for approval and often to make additional investments to mitigateenvironmental impacts. We must also operate our facilities in compliance with the terms of the approvals,licenses, permits or authorizations. We are taking several steps to improve the efficiency of the licensingprocess, including stronger integration of our environmental and project development teams, the developmentof a Best Practices Guide for Environmental Licensing and the Environment, the deployment of highly-skilledspecialist teams, closer interaction with environmental regulators and the creation of an Executive Committeeto expedite internal decisions regarding licensing.
70

Environmental regulations affecting our operations relate, among other matters, to emissions into theair, soil and water; recycling and waste management; protection and preservation of forests, coastlines, naturalcaverns, watersheds and other features of the ecosystem; water use; climate change and decommissioning andreclamation. In many cases, the mining concessions or environmental permits under which we operate imposespecific environmental requirements on our operations. Environmental regulations can sometimes change andongoing compliance can require significant costs for capital expenditures, operating costs, reclamation costsand compliance. For example, in Brazil, a suit challenging a Brazilian environmental decree that permitsmining in certain subterraneous areas may adversely affect our ability to conduct some mining operations oreven our reserves.
Environmental legislation is becoming stricter worldwide, which could lead to greater costs forenvironmental compliance. For instance, if we are required to modify installations, substitute carbon-intensivefuels and process inputs, develop new operational procedures or purchase new equipment, our environmentalcompliance costs could increase. In particular, we expect heightened attention from various governments toreducing greenhouse gas emissions as a result of concern over climate change. Some important environmentalregulation and compliance initiatives are described below, but it is unclear whether additional operating orcapital expenditures will be required to comply with enacted amendments or what effect these regulations willhave on our business, financial results or cash flow from operations:
� Our operations in Canada and at PTVI in Indonesia are subject to air emission regulations thataddress, among other things, sulfur dioxide (‘‘SO2’’), particulates and metals. In Canada, we aremaking significant capital investments to ensure compliance with these emissions standards. InIndonesia, PTVI and the Ministry of Environment have agreed upon an SO2 emission reductionplan, which is currently being implemented and is scheduled for completion in 2013.
� The Canadian federal government’s efforts to legislate greenhouse gas emission reduction targetsfor the industrial sectors have slowed down. The three provinces in which Vale operates, Ontario,Manitoba and Newfoundland, have made limited progress in setting greenhouse gas emissiontargets, with the exception of Manitoba, which has set a provincial target based on 1990 levels.The legislation enacted by the Manitoba government is not anticipated to impact our operations.The Ontario government has enacted legislation that requires annual reporting of greenhouse gasemissions. The provinces of Ontario and Manitoba are considering emissions trading schemes tolimit greenhouse gas emissions. The three provinces have begun consulting with variousstakeholders with respect to climate change initiatives and are also focusing on adaptationstrategies.
� In Canada, a number of studies have been completed or are in progress in Sudbury and PortColborne related to contamination of soil and water from past and continuing activities. We aretaking steps, in partnership with other stakeholders, to remediate the ecological impact of ouractivities.
� The Australian government has recently introduced a carbon pricing scheme which will operateinitially like a carbon tax with a fixed (but increasing) carbon permit price and will then transitioninto a cap and trade scheme after three years. The scheme takes effect on July 1, 2012 and willimpact Vale’s Australian operations.
� In October 2009, Indonesia adopted legislation on Environmental Protection and Management. Itsets out a broad regulatory structure and provides that many important details will be clarified inlater implementing regulations.
� Brazil adopted a decree under the federal carbon emissions law in December 2010 thatcontemplates specific limits on carbon emissions to be established in late 2011 and phased inthrough 2020. The law establishes a voluntary commitment to cut Brazil’s greenhouse gasemissions between 36.1% and 38.9% by 2020, based on 2020 projected emissions, and several
71

regulated industries, including the steel, forestry, agriculture and power generation sectors, havedesigned plans to reduce their greenhouse gas emissions. By 2012, the government plans to issuerules establishing specific limits on carbon emissions from other sectors of the economy, includingmining and fertilizers. The Mining and Energy Ministry, with the participation of the BrazilianMining Association (Instituto Brasileiro de Mineracao—IBRAM) presented the mining sector planin December 2011.
� As part of the Global Reporting Initiative, which provides a reporting framework for economic,environmental and social sustainability, we launched a Sustainability Action Plan (PAS) in 2008.The PAS deals with issues related to water resources, waste treatment and disposal, emissions andenergy, which are also associated with the target variable compensation of all employees. Theoutcome of the PAS indicators provides the Board with relevant inputs for its decision-makingprocess regarding the investments needed for improvement in these areas as well as furtherexploring their potential.
Royalties and other taxes on mining activities
We are required in many jurisdictions to pay royalties or taxes on our revenues or profits frommineral extractions and sales. These payments are an important element of the economic performance of amining operation. The following royalties and taxes apply in some of the jurisdictions in which we have ourlargest operations:
� In Brazil, we pay a royalty known as the CFEM (Compensacao Financeira pela Exploracao deRecursos Minerais) on the revenues from the sale of minerals we extract, net of taxes, insurancecosts and costs of transportation. The current rates on our products are: 2% for iron ore, copper,nickel, fertilizers and other materials; 3% on bauxite, potash and manganese ore; and 1% ongold. The Brazilian government is preparing to propose changes in the CFEM regime. Anychanges must be incorporated into a final proposal by the DNPM, which is then subject toapproval by the Brazilian National Congress. We are currently engaged in several administrativeand legal proceedings alleging that we have failed to pay the proper amount of CFEM. SeeAdditional information—Legal proceedings—CFEM-related proceedings.
� The Canadian provinces in which we operate charge us a tax on profits from mining operations.Profit from mining operations is generally determined by reference to gross revenue from the saleof mine output and deducting certain costs, such as mining and processing costs and investmentin processing assets. The statutory mining tax rates are 10% in Ontario; with graduated rates upto 17% in Manitoba; and a combined mining and royalty tax rate of 16% in Newfoundland andLabrador. The mining tax paid is deductible for company income tax purposes.
� In Indonesia, our subsidiary PTVI pays a royalty fee on, among other items, its nickel productionon the concession area and has made certain other commitments. The royalty payment was basedon sales volume (US$78 per metric ton of contained nickel matte, and US$140 or US$156 permetric ton of contained cobalt, based on total production). During 2011, the royalty payment wasequal to 0.44% of revenues from the sale of nickel in matte products, while the average yearlyroyalty payment for the period from 2008 to 2011 was equal to 0.5% of revenues from the sale ofnickel in matte.
� In Australia, royalty is payable on revenues from the sale of minerals. In Queensland, it is 7% ofthe value (net of freight and late dispatch costs) up to A$100 per ton and 10% of the valuethereafter. In New South Wales, it is a percentage of the value of production—total revenue(which is net of certain costs and levies) less allowable deductions—of 6.2% for deepunderground mines, 7.2% for underground mines and 8.2% for open cut mines.
72

� The Australian government has introduced a mineral resource rent tax (‘‘MRRT’’), which appliesbeginning in July 2012. The MRRT will tax profits generated from the exploitation of coal andiron ore resources in Australia. The tax will be levied at an effective rate of 22.5% of assessableprofit and will be deductible for company income tax purposes. The difference between theMRRT and royalties paid to each state government is that the royalties are based on the volumeand value of the resource, whereas the MRRT is based on profits. However, companies will begiven a credit for any state-based royalties paid where the MRRT is payable.
� In December 2011, the Brazilian states of Para and Minas Gerais created a new tax on mineralproduction (Taxa de Fiscalizacao de Recursos Minerais—TFRM), due beginning in April 2012. For2012, the rate of TFRM will be (i) R$6.906 per ton of mineral produced in the state of Para, and(ii) R$2.3291 per ton of mineral transferred or sold in the state of Minas Gerais. Industryassociations believe that the TFRM is unconstitutional and plan to initiate legal proceedingschallenging the applicability of the legislation.
Regulation of other activities
In addition to mining and environmental regulation, we are subject to comprehensive regulatoryregimes for some of our other activities, including rail transport, electricity generation, and oil and gas. Weare also subject to more general legislation on workers’ health and safety, safety and support of communitiesnear mines, and other matters.
Our Brazilian railroad business is subject to regulation and supervision by the Brazilian Ministry ofTransportation and the transportation regulatory agency (Agencia Nacional de Transportes Terrestres—ANTT),and operates pursuant to concession contracts granted by the federal government. The concession contractsimpose certain shareholder ownership limitations. The concession contract for FCA limits shareholderownership to 20% of the voting capital of the concessionaire, unless such limit is waived by ANTT. We own99.9% of FCA, which ANTT has authorized. The 20% ownership limitation does not apply to our EFVM,EFC and FNS railroads. ANTT also sets different tariff ceilings for railroad services for each of theconcessionaires and each of the different products transported. So long as these limits are respected, theactual prices charged can be negotiated directly with the users of such services.
The MRS concession contract provides that each shareholder can only own up to 20% of the votingcapital of the concessionaire, unless otherwise permitted by ANTT. As a result of our acquisitions of CAEMIand Ferteco, our share in the voting capital of MRS surpassed this threshold. As a result, Vale waived itsvoting and veto rights with respect to MRS shares in accordance with a 2006 ANTT resolution. We continueto have some voting rights with respect to shares owned by a subsidiary.
Our railroad concession contracts have a duration of 30 years and are renewable. The FCA and MRSconcessions expire in 2026, and the concessions for EFC and EFVM expire in 2027. We also own thesubconcession for commercial operation for 30 years of a 720-kilometer segment of the FNS railroad, inBrazil. This concession expires in 2037.
In 2011, ANTT approved new resolutions, which (i) expanded the trackage rights for concessionairesoperating in the railway network and confirmed the ability of non-concessionaires to make investments in therailway network in order to accommodate increased demand, (ii) increased concessionaire obligations andcustomers rights, (iii) redefined the methodology for assessment of productivity targets by concessionaires and(iv) established a mechanism for ANTT to adjudicate disputes among concessionaires and betweenconcessionaires and non-concessionaires with respect to railway use. Rail concessionaires and the NationalAssociation of Rail Carriers (Associacao Nacional dos Transportadores Ferroviarios—ATNF), filed a petitionwith ANTT claiming that such regulatory changes would violate the concession agreements. Additionally, railconcessionaires are discussing with ANTT certain technical and economic aspects of these recent regulationsin order to clarify the content of the new regulations, to conform them with Brazilian federal law and therelevant concession agreements, and to protect the investments made by concessionaires.
73

In January 2012, ANTT submitted for public comment a proposed regulation to the tariffs charged bythe rail concessionaires that would reduce the ceiling for the tariffs able to be charged by concessionaires,which could affect some of our contracts. We will provide comments to ANTT and will continue to work withANTT so that any approved regulation conforms to the terms and conditions set forth at the time ourconcession contracts were executed and to applicable law.
In connection with the approval in 2006 of our acquisition of Vale Canada, we made a number ofundertakings that expired in October 2011 to the Canadian Minister of Industry under the Investment CanadaAct. We believe we were substantially in compliance with these undertakings, which included locating ourglobal nickel business in Toronto, Canada; enhancing investments in a number of areas in Canada; andhonoring agreements with provincial governments, local governments, labor unions and aboriginal groups.
Some of our products are subject to regulations applicable to the marketing and distribution ofchemicals and other substances. For example, the European Commission has adopted a European ChemicalsPolicy, known as REACH (‘‘Registration, Evaluation, and Authorization of Chemicals’’). Under REACH,manufacturers and importers were required to register new substances prior to their entry into the Europeanmarket and in some cases may be subject to an authorization process. A company that fails to comply withthe REACH regulations could face restrictions to commercialize its products in Europe. We have compliedwith registration requirements for the substances we import into or manufacture in the EU in 2011 andcontinue to take measures to manage our exposure to the authorization process.
II. OPERATING AND FINANCIAL REVIEW AND PROSPECTS
Overview
We recorded strong performance in 2011, which is reflected in all-time high figures for operatingrevenue, operating margin, cash generation and net earnings. Our shipments of iron ore and pellets, whichtotaled almost 300 million metric tons, were our highest ever, while our sales of nickel and copper were thehighest since 2008.
Vale is deeply committed to creating shareholder value, with a strong focus on efficient capitalmanagement. To that end, we have implemented several initiatives aimed at minimizing risks of delays andcost overruns in the execution of our projects and have taken a more proactive stance towards returningexcess cash to shareholders.
In successfully generating record levels of cash while prudently allocating our capital resources wecontinue to meet the challenge for growth companies: to finance growth, to maintain a sound balance sheetand to meet shareholders’ expectations for capital return.
Below are the main highlights of Vale’s performance in 2011:
� gross operating revenue of US$60.4 billion;
� operating income of US$30.1 billion;
� operating margin, measured as the ratio of operating income to net operating revenues, of 48.5%excluding the gain on the sale of our aluminum assets in February 2011;
� record return of capital to shareholders of US$12.0 billion, through cash dividends ofUS$9.0 billion, equal to US$1.74 per share, and US$3.0 billion in share repurchases;
� net income of US$22.9 billion, or US$4.33 per preferred and common share; and
� strong financial position, supported by cash holdings of US$3.5 billion, availability of significantmedium and long-term credit lines and a low-risk debt portfolio.
74

Demand and prices
The following table sets forth our average realized prices for our principal products for each of theperiods indicated.
Year ended December 31,
2007 2008 2009 2010 2011
(US$ per metric ton, except where indicated)Iron ore . . . . . . . . . . . . . . . . . . . . . . . . . . . 45.33 67.32 55.99 103.50 136.07Iron ore pellets . . . . . . . . . . . . . . . . . . . . . . 78.62 131.76 73.75 161.29 193.79Manganese . . . . . . . . . . . . . . . . . . . . . . . . . 107.34 350.46 147.06 230.22 165.70Ferroalloys . . . . . . . . . . . . . . . . . . . . . . . . . 1,311.48 2,709.60 1,395.26 1,547.84 1,443.01Nickel . . . . . . . . . . . . . . . . . . . . . . . . . . . . 37,442.28 21,662.14 14,596.55 21,980.19 22,680.41Copper . . . . . . . . . . . . . . . . . . . . . . . . . . . 6,611.27 6,331.07 5,229.39 7,730.09 8,420.73Potash . . . . . . . . . . . . . . . . . . . . . . . . . . . . 264.09 591.18 521.46 410.56 505.28Platinum (US$/oz) . . . . . . . . . . . . . . . . . . . . . 1,314.25 1,557.07 1,073.98 1,661.20 1,716.81Cobalt (US$/lb) . . . . . . . . . . . . . . . . . . . . . . 24.56 31.01 10.03 15.09 15.63Coal:
Thermal coal . . . . . . . . . . . . . . . . . . . . . 53.73 85.38 66.60 70.40 95.54Metallurgical coal . . . . . . . . . . . . . . . . . . 67.37 170.55 115.55 149.96 235.27
Phosphates:MAP . . . . . . . . . . . . . . . . . . . . . . . . . . – – – 565.34 679.65TSP . . . . . . . . . . . . . . . . . . . . . . . . . . – – – 451.80 585.98SSP . . . . . . . . . . . . . . . . . . . . . . . . . . . – – – 221.36 281.53DCP . . . . . . . . . . . . . . . . . . . . . . . . . . – – – 570.49 679.63Nitrogen . . . . . . . . . . . . . . . . . . . . . . . . – – – 450.86 612.01
Iron ore and iron ore pellets
Demand for our iron ore and iron ore pellets is a function of global demand for carbon steel.Demand for carbon steel, in turn, is strongly influenced by global industrial production. Iron ore and iron orepellets are priced based on a wide array of quality levels and physical characteristics. Various factors influenceprice differences among the several types of iron ore, such as the iron content of specific ore deposits, thevarious beneficiation and purifying processes required to produce the desired final product, particle size,moisture content and the type and concentration of contaminants (such as phosphorus, alumina andmanganese ore) in the ore. Fines, lump ore and pellets typically command different prices.
Demand from China has been a principal driver of world demand and of prices. Chinese iron oreimports reached 686.1 million metric tons in 2011, 10.8% above the 619.1 million metric tons imported in2010 and 9.3% higher than 2009 levels, due mainly to the continued growth in Chinese steel productionthroughout 2011. We expect China’s economic growth to continue at a high rate during 2012, mainly drivenby domestic demand.
Our iron ore prices are based on a variety of pricing options, which generally use spot price indices asa basis for determining the customer price.
Manganese and ferroalloys
The prices of manganese ore and ferroalloys are mainly influenced by trends in the carbon steelmarket. Ferroalloy prices are also influenced by the prices of the main production inputs, includingmanganese ore, power and coke. We sell manganese ore mainly at spot prices or at prices established on aquarterly basis. Ferroalloy prices are negotiated on a quarterly basis.
Nickel
Nickel is an exchange-traded metal, listed on the LME. Most nickel products are priced using adiscount or premium to the LME price, depending on the nickel product’s physical and technical
75

characteristics. Demand for nickel is strongly affected by stainless steel production, which represents, onaverage, 60-65% of global nickel consumption.
We have short-term fixed-volume contracts with customers for the majority of our expected annualnickel sales. These contracts, together with our sales for non-stainless steel applications (alloy steels, highnickel alloys, plating and batteries), provide stable demand for a significant portion of our annual production.In 2011, 66% of our refined nickel sales were made into non-stainless steel applications, compared to theindustry average for primary nickel producers of 36%, bringing more stability to our sales volumes. As aresult of our focus on such higher-value segments, our average realized nickel prices for refined nickel havetypically exceeded LME cash nickel prices.
Primary nickel (including ferro-nickel, nickel pig iron and nickel cathode) and secondary nickel(i.e., scrap) are competing nickel sources for stainless steel production. The choice between different types ofprimary and secondary nickel is largely driven by their relative price and availability. In recent years,secondary nickel has accounted for about 43-48% of total nickel used for stainless steels, and primary nickelhas accounted for about 52-57%. In 2011, Chinese nickel pig iron and ferro-nickel production is estimated tohave exceeded 250,000 metric tons, representing 16% of world primary nickel supply, compared to 11% of theworld’s supply in 2010.
Long-term market fundamentals for nickel are expected to remain positive. While a number of nickelprojects will be ramping-up in the short-term, future project development is becoming increasinglychallenging. Nickel is widely used in consumer and industrial applications, and its use tends to grow as acountry’s economy develops. We anticipate continued income growth within emerging economies will drivehigher nickel consumption over the medium-term.
Copper
Growth in copper demand in recent years has been driven primarily by Chinese imports, given theimportant role copper plays in construction in addition to electrical and consumer applications. Copper pricesare determined on the basis of (i) prices of copper metal on terminal markets, such as the LME and theNYMEX, and (ii) in the case of intermediate products such as copper concentrate (which comprise most ofour sales) and copper anode, treatment and refining charges negotiated with each customer. Under a pricingsystem referred to as MAMA (‘‘month after month of arrival’’), sales of copper concentrates and anodes areprovisionally priced at the time of shipment, and final prices are settled on the basis of the LME price for afuture period, generally one to three months after the shipment date.
Supply growth has struggled to keep pace with growing copper demand, with average mine growth ofonly 1.4% per annum over the past five years. These circumstances led to a strong 17% rise in copper pricesin 2011, relative to 2010. We anticipate market fundamentals to remain strong as demand growth continuesand the supply response remains challenging.
Fertilizer nutrients
Demand for fertilizers is based on market fundamentals similar to those underlying global demand forminerals, metals and energy. Rapid per capita income growth in emerging economies generally causes dietarychanges marked by an increase in the consumption of proteins, which ultimately contributes to increaseddemand for fertilizer nutrients. Demand is also driven by the demand for bio-fuels, which have emerged as analternative source of energy to reduce world reliance on sources of climate-changing greenhouse gases,because key inputs for the production of biofuels—sugar cane, corn and palm—are intensive in the use offertilizers.
Sales of fertilizers are mainly on a spot basis using international benchmarks, although some largeimporters in China and India often sign annual contracts. Seasonality is an important factor for pricedetermination throughout the year, since agricultural production in each region depends on climate conditionsfor crop production.
76

Aluminum
We have a 22.0% interest in Hydro, a major aluminum producer, which we acquired in February 2011when we transferred the major part of our aluminum businesses to Hydro. For the periods prior to thetransaction, our sales of aluminum were made at prices based on the LME of the previous month. Our salesof alumina were based on a percentage of the aluminum price traded on the LME, and our prices for bauxitewere determined by a formula linked to the price of aluminum for the three-month futures contracts on theLME and to the price of alumina FOB Australia.
Coal
Demand for metallurgical coal is driven by demand for steel, with growth expected especially in Asia.Demand for thermal coal is closely related to electricity consumption, which will continue to be driven byglobal economic growth, particularly in emerging market economies. Since April 2010, prices for metallurgicalcoal have been established on a quarterly basis for the majority of the seaborne term contract volumes,although some sellers have begun introducing monthly pricing and a minority of the seaborne trade volumescontinue to employ annual pricing. Most of our term contracts have been priced on a quarterly basis sinceApril 2010. Price negotiations for thermal coal are held both on a spot and an annual basis.
Logistics
Demand for our transportation services in Brazil is primarily driven by Brazilian economic growth,mainly in the agricultural and steel sectors. We earn our logistics revenues primarily from fees charged tocustomers for the transportation of cargo via our railroads, port and ships. Our railways generate most ofthese revenues. Nearly all of our logistics revenues are denominated in reais and subject to adjustments forchanges in fuel prices. Prices in the Brazilian market for railroad services are subject to ceilings set by theBrazilian regulatory authorities, but they primarily reflect competition with the trucking industry.
Production and sales volumes
Our financial performance depends, among other factors, on the volume of production at ourfacilities. We publish a quarterly production report, which is available on our website and filed with the SECon Form 6-K. Increases in the capacity of our facilities resulting from our capital expenditure program havean important effect on our performance. Our results are also affected by acquisitions and dispositions ofbusinesses or assets, and they may be affected in the future by new acquisitions or dispositions. For moreinformation on acquisitions since the beginning of 2011, see Information on the Company—Business overview—Significant changes in our business. We had no dispositions of businesses in 2011.
77

The following table sets forth, for our principal products, the total volumes we sold in each of theperiods indicated.
Year ended December 31,
2007 2008 2009 2010 2011
(thousand metric tons)Iron ore . . . . . . . . . . . . . . . . . . . . . . . . . . . . . . . . . 262,687 264,023 229,174 254,902 257,287Iron ore pellets . . . . . . . . . . . . . . . . . . . . . . . . . . . . . 33,670 32,218 18,087 39,512 41,861Manganese . . . . . . . . . . . . . . . . . . . . . . . . . . . . . . . . 708 759 986 1,119 1,032Ferroalloys . . . . . . . . . . . . . . . . . . . . . . . . . . . . . . . . 488 396 253 401 386Nickel . . . . . . . . . . . . . . . . . . . . . . . . . . . . . . . . . . 268 276 223 174 252Copper . . . . . . . . . . . . . . . . . . . . . . . . . . . . . . . . . . 300 320 216 208 302Potash . . . . . . . . . . . . . . . . . . . . . . . . . . . . . . . . . . 674 499 792 682 568Platinum . . . . . . . . . . . . . . . . . . . . . . . . . . . . . . . . . 345 411 233 97 446Cobalt . . . . . . . . . . . . . . . . . . . . . . . . . . . . . . . . . . 2.494 3.087 1.854 0.902 2.721Coal:
Thermal coal . . . . . . . . . . . . . . . . . . . . . . . . . . . . 603 1,405 3,083 4,234 5,342Metallurgical coal . . . . . . . . . . . . . . . . . . . . . . . . . 1,894 2,682 2,590 3,150 2,330
Phosphates:MAP . . . . . . . . . . . . . . . . . . . . . . . . . . . . . . . . – – – 703 907TSP . . . . . . . . . . . . . . . . . . . . . . . . . . . . . . . . . – – – 461 594SSP . . . . . . . . . . . . . . . . . . . . . . . . . . . . . . . . . – – – 1,533 2,501DCP . . . . . . . . . . . . . . . . . . . . . . . . . . . . . . . . . – – – 284 556Nitrogen . . . . . . . . . . . . . . . . . . . . . . . . . . . . . . – – – 747 1,278
Currency price changes
Our results of operations are affected in several ways by changes in currency exchange rates. The mostimportant of these are the following:
� Most of our revenues are denominated in U.S. dollars, while most of our costs of goods sold aredenominated in other currencies, principally the real (59% in 2011), the U.S. dollar (19% in 2011)and the Canadian dollar (15% in 2011). As a result, changes in exchange rates affect our costsand operating margins. Our margins are adversely affected by a decline in the value of the U.S.dollar.
� Most of our long-term debt is denominated in currencies other than the real (US$14.703 billion atDecember 31, 2011), principally the U.S. dollar. Because our functional currency for accountingpurposes is the Brazilian real, changes in the value of the U.S. dollar against the real result in anexchange gain or loss on our net liabilities.
� We had real-denominated debt of US$7.997 billion at December 31, 2011. Since most of ourrevenue is in U.S. dollars, we use swaps to convert our debt service from reais to U.S. dollars.Changes in the value of the U.S. dollar against the real result in fair value variation on thesederivatives, affecting our financial results. For more information on our use of derivatives,see—Risk management.
A decline in the value of the U.S. dollar tends to result in: (i) lower operating margins and (ii) higherfinancial results due to currency gains on our net U.S. dollar-denominated liabilities and fair value gains onour currency derivatives. Conversely, an increase in the value of the U.S. dollar tends to result in: (i) betteroperating margins and (ii) lower financial results, due to exchange losses on our net U.S. dollar-denominatedliabilities and fair value losses on our currency derivatives.
The U.S. dollar depreciated against both the real and the Canadian dollar during the first half of 2011but began to appreciate in the second half of the year, after the aggravation of the Eurozone’s debt crisis inlate July. As of December 31, 2011, the U.S. dollar had appreciated 12.1% against the real and 2.2% againstthe Canadian dollar relative to December 31, 2010. The average value of the U.S. dollar in 2011, compared to2010, was 4.8% lower against the real and 4.4% lower against the Canadian dollar. These currency price
78

changes affected our operating margins and resulted in higher foreign exchange gains and gains onderivatives, as described under—Critical accounting policies and estimates—Derivatives.
Operating expenses
Our principal operating expenses consist of: (i) cost of goods sold, (ii) selling, general andadministrative expenses and (iii) research and development expenses. Our cost of goods sold consists of costsof energy (fuel and electric energy), materials (such as components for railroad and mining equipment),outsourced services (especially ore and waste removal, transportation and maintenance), purchased productsfor processing or resale (such as iron ore, iron ore pellets, nickel and aluminum products), personnel, anddepreciation and depletion. Our selling, general and administrative expenses consist principally of personnelexpense, sales expense and depreciation. Our research and development expenses consist primarily ofinvestments related to mineral exploration and studies for the development of projects, which are recorded asexpenses until the economic viability of the related mining activities can be established.
Results of operations—2011 compared to 2010
Revenues
Our net operating revenues increased 30.2%, to US$58.990 billion, in 2011, primarily as a result of(i) higher prices for our major products, especially for iron ore and other bulk materials, (ii) the increase innickel volumes following the end of labor strikes and resumption of our nickel production in Ontario and(iii) the inclusion of a full year of results for fertilizers compared to seven months in 2010. These effects werepartly offset by the effect of the sale of our aluminum assets in February 2011. Of a total increase ofUS$13.697 billion in gross revenues, US$9.575 billion was attributable to higher prices for iron ore and ironore pellets.
The following table summarizes our gross revenues by product and our net operating revenues for theperiods indicated.
Year ended December 31,
2010 2011 % change
(US$ million)Bulk Materials:
Iron ore . . . . . . . . . . . . . . . . . . . . . . . . . . . . . . . . . . . . . . . . . US$26,384 US$35,008 32.7Iron ore pellets . . . . . . . . . . . . . . . . . . . . . . . . . . . . . . . . . . . . . 6,402 8,150 27.3Manganese . . . . . . . . . . . . . . . . . . . . . . . . . . . . . . . . . . . . . . . . 258 171 (33.7)Ferroalloys . . . . . . . . . . . . . . . . . . . . . . . . . . . . . . . . . . . . . . . . 664 561 (15.5)Coal . . . . . . . . . . . . . . . . . . . . . . . . . . . . . . . . . . . . . . . . . . . 770 1,058 37.4
Subtotal . . . . . . . . . . . . . . . . . . . . . . . . . . . . . . . . . . . . . . . . 34,478 44,948 30.4Base Metals:
Nickel and other products(1) . . . . . . . . . . . . . . . . . . . . . . . . . . . . . 4,712 8,118 72.3Copper concentrate(2) . . . . . . . . . . . . . . . . . . . . . . . . . . . . . . . . . 934 1,126 20.6Aluminum products(3) . . . . . . . . . . . . . . . . . . . . . . . . . . . . . . . . . 2,554 383 (85.0)
Subtotal . . . . . . . . . . . . . . . . . . . . . . . . . . . . . . . . . . . . . . . . 8,200 9,627 17.4Fertilizers:
Potash . . . . . . . . . . . . . . . . . . . . . . . . . . . . . . . . . . . . . . . . . . 280 287 2.5Phosphates . . . . . . . . . . . . . . . . . . . . . . . . . . . . . . . . . . . . . . . . 1,211 2,395 97.8Nitrogen . . . . . . . . . . . . . . . . . . . . . . . . . . . . . . . . . . . . . . . . . 337 782 132.0Others fertilizer products . . . . . . . . . . . . . . . . . . . . . . . . . . . . . . . 18 83 361.1
Subtotal . . . . . . . . . . . . . . . . . . . . . . . . . . . . . . . . . . . . . . . . 1,846 3,547 92.1Logistics:
Railroads . . . . . . . . . . . . . . . . . . . . . . . . . . . . . . . . . . . . . . . . . 1,107 1,265 14.3Ports . . . . . . . . . . . . . . . . . . . . . . . . . . . . . . . . . . . . . . . . . . . 353 461 30.6Shipping . . . . . . . . . . . . . . . . . . . . . . . . . . . . . . . . . . . . . . . . . 5 – –
Subtotal . . . . . . . . . . . . . . . . . . . . . . . . . . . . . . . . . . . . . . . . 1,465 1,726 17.8Other products and services(4) . . . . . . . . . . . . . . . . . . . . . . . . . . . . . 492 541 10.0
Gross revenues . . . . . . . . . . . . . . . . . . . . . . . . . . . . . . . . . . . . 46,481 60,389 29.9Value added tax . . . . . . . . . . . . . . . . . . . . . . . . . . . . . . . . . . (1,188) (1,399) 17.8
Net operating revenues . . . . . . . . . . . . . . . . . . . . . . . . . . . . US$45,293 US$58,990 30.2
(1) Includes nickel co-products and by-products (copper, precious metals, cobalt and others).(2) Does not include copper produced as a nickel co-product.(3) Reflects aluminum operations sold in February 2011.(4) Includes kaolin, pig iron and energy.
79

The following table summarizes, for the periods indicated, the distribution of our operating revenuesbased on the geographical location of our customers.
Operating revenue by destination
2010 2011
(US$ million) (% of total) (US$ million) (% of total)North America
Canada . . . . . . . . . . . . . . . . . . . . . . . . . . . . . US $1,126 2.4% US $1,403 2.3%United States . . . . . . . . . . . . . . . . . . . . . . . . . . 828 1.8 1,672 2.8Mexico . . . . . . . . . . . . . . . . . . . . . . . . . . . . . 74 0.2 102 0.2
2,028 4.4 3,177 5.3South America
Brazil . . . . . . . . . . . . . . . . . . . . . . . . . . . . . . 8,150 17.5 10,914 18.1Other . . . . . . . . . . . . . . . . . . . . . . . . . . . . . . 810 1.7 1,108 1.8
8,960 19.3 12,022 19.9Asia
China . . . . . . . . . . . . . . . . . . . . . . . . . . . . . . 15,379 33.1 19,571 32.4Japan . . . . . . . . . . . . . . . . . . . . . . . . . . . . . . 5,240 11.3 7,238 12.0South Korea . . . . . . . . . . . . . . . . . . . . . . . . . . 1,934 4.2 2,779 4.6Taiwan . . . . . . . . . . . . . . . . . . . . . . . . . . . . . . 1,179 2.5 1,281 2.1Other . . . . . . . . . . . . . . . . . . . . . . . . . . . . . . 1,059 2.2 989 1.6
24,791 53.3 31,858 52.8Europe
Germany . . . . . . . . . . . . . . . . . . . . . . . . . . . . 3,092 6.7 3,792 6.3United Kingdom . . . . . . . . . . . . . . . . . . . . . . . . 1,060 2.3 1,351 2.2Italy . . . . . . . . . . . . . . . . . . . . . . . . . . . . . . . 1,043 2.2 1,908 3.2France . . . . . . . . . . . . . . . . . . . . . . . . . . . . . . 716 1.5 801 1.3Other . . . . . . . . . . . . . . . . . . . . . . . . . . . . . . 3,001 6.4 3,585 5.9
8,912 19.2 11,437 18.9Rest of the world . . . . . . . . . . . . . . . . . . . . . . . . . 1,790 3.9 1,895 3.1
Total . . . . . . . . . . . . . . . . . . . . . . . . . . . . . . . US$ 46,481 100.0% US$ 60,389 100.0%
Revenues by segment
Bulk materials
The 30.4% increase in revenues from sales of bulk materials primarily reflected higher prices for ironore and iron ore pellets. Our average realized prices were up 31.5% for iron ore and 20.2% for iron orepellets, due primarily to strong demand from China while demand remained slow elsewhere, particularly inEurope. Volume sold was also up for iron ore (0.9%) and for iron ore pellets (5.9%).
Revenues from bulk materials were also positively affected by higher prices for coal. Our averagerealized prices were up 35.7% for thermal coal, based on demand from the power industry, and 56.9% formetallurgical coal, based on demand from the steel industry, especially in China. The volume of metallurgicalcoal sold was adversely affected by heavy rains and flooding in Australia in the early part of 2011, while thevolume of thermal coal sold increased based on higher production in Colombia and the start of production atMoatize.
Revenues from sales of both manganese and ferroalloys declined on lower prices and lower volumessold.
Base metals
The 17.4% increase in gross revenues from sales of base metals primarily reflected higher volumes ofnickel sold. With the end of labor strikes at our production sites in Sudbury and Voisey’s Bay in the secondhalf of 2010, the volume of nickel sold was 44.8% higher in 2011. The average sale price for nickel also
80

increased 3.2%, reflecting an increase in the LME price due to continued strong demand. Revenues fromsales of copper concentrate were also higher, based on higher prices. These effects were partly offset by thesale of our aluminum business in February 2011, because for 2011 we had only two months of aluminumsales.
Fertilizers
We acquired our principal phosphate operations in May 2010, and the 92.1% increase in revenuesfrom sales of fertilizers in 2011 primarily reflects a full year of these operations compared to seven months in2010. In addition, prices were up for both phosphates (13.1% higher average realized price) and nitrogen(35.7% higher average realized price), due to strong demand especially from the Brazilian agricultural sector.
Logistics
Gross revenues from sales of logistics services increased 17.8%. Revenues from railroad transportationincreased 14.3%. Revenues from port operations increased 30.6% due to higher imports for the steel industry.
Operating costs and expenses
Year ended December 31,
2010 2011 % change
(US$ million)Cost of ores and metals . . . . . . . . . . . . . . . . . . . . . . US$ 13,326 US$ 17,898 34.3Cost of aluminum products . . . . . . . . . . . . . . . . . . . . 2,108 289 (86.3)Cost of logistic services . . . . . . . . . . . . . . . . . . . . . . 1,040 1,402 34.8Cost of fertilizer products . . . . . . . . . . . . . . . . . . . . . 1,556 2,701 73.6Others . . . . . . . . . . . . . . . . . . . . . . . . . . . . . . . . 784 1,283 63.6
Cost of goods sold . . . . . . . . . . . . . . . . . . . . . . . . . 18,814 23,573 25.3Selling, general and administrative expenses . . . . . . . . . . 1,701 2,334 37.2Research and development . . . . . . . . . . . . . . . . . . . . 878 1,674 90.7Gain on sale of assets . . . . . . . . . . . . . . . . . . . . . . . – (1,513) –
Other costs and expenses . . . . . . . . . . . . . . . . . . . . . 2,205 2,810 27.4
Total operating costs and expenses . . . . . . . . . . . . . . US$ 23,598 US$ 28,878 22.4
Cost of goods sold
The following table summarizes the components of our cost of goods sold for the periods indicated.
Year ended December 31,
2010 2011 % change
(US$ million)Outsourced services . . . . . . . . . . . . . . . . . . . . . . . . US$ 2,740 US$ 4,244 54.9Materials costs . . . . . . . . . . . . . . . . . . . . . . . . . . . 2,861 3,758 31.4Energy:
Fuel . . . . . . . . . . . . . . . . . . . . . . . . . . . . . . . . 1,880 2,182 16.1Electric energy . . . . . . . . . . . . . . . . . . . . . . . . . . 1,211 967 (20.1)
Subtotal . . . . . . . . . . . . . . . . . . . . . . . . . . . . 3,091 3,149 1.9Acquisition of iron ore and pellets . . . . . . . . . . . . . . . . 963 1,411 46.5Acquisition of other products:
Nickel . . . . . . . . . . . . . . . . . . . . . . . . . . . . . . . 358 606 69.3Aluminum . . . . . . . . . . . . . . . . . . . . . . . . . . . . 285 18 (93.7)Other . . . . . . . . . . . . . . . . . . . . . . . . . . . . . . . 58 239 312.1
Subtotal . . . . . . . . . . . . . . . . . . . . . . . . . . . . 701 863 23.1Personnel . . . . . . . . . . . . . . . . . . . . . . . . . . . . . . 2,081 3,138 50.8Depreciation and depletion . . . . . . . . . . . . . . . . . . . . 2,803 3,735 33.3Others . . . . . . . . . . . . . . . . . . . . . . . . . . . . . . . . 3,574 3,275 (8.4)
Total . . . . . . . . . . . . . . . . . . . . . . . . . . . . . . . . US$ 18,814 US$ 23,573 25.3
81

� The largest factors in the 25.3% increase in cost of goods sold were the resumption of normalnickel operations in Ontario, the inclusion of a full year of the phosphate business acquired in2010 and the start-up of Onca Puma. Out of the total increase of US$4.759 billion, these threefactors accounted for US$3.501 billion. Additional important factors were the appreciation onaverage of the Brazilian real against the U.S. dollar during 2011, which accounted forUS$764 million of additional cost of goods sold, and higher sales volumes, which accounted forUS$268 million of additional cost of goods sold.
� The increases in costs of goods sold attributable to the resumption of Ontario operations and thestart-up of Onca Puma were primarily in the following line items: outsourced services(US$441 million), materials (US$367 million), energy (US$242 million), personnel(US$492 million) and depreciation (US$502 million).
� The increases in costs of goods sold attributable to the full year of fertilizer operations wereprimarily in the following line items: outsourced services (US$277 million), materials(US$656 million), energy (US$237 million), personnel (US$159 million) and depreciation(US$230 million), partially offset by the purchase price allocation in inventories in connectionwith our acquisition in 2010.
� The increases in costs were partially offset by the sale of our aluminum assets, which reducedcosts by US$1.819 billion, primarily in these line items: energy costs (US$712 million), materials(US$494 million) and product acquisitions (US$268 million). The reduction in energy costs wasparticularly significant.
� These factors were partially offset by our efforts to reduce costs by optimizing the flow ofmaterials, optimizing plant and labor utilization, and cutting administrative costs, among othermeasures.
� In addition to the general factors described above: (i) higher outsourced services costs wereaffected by increased freight prices, (ii) higher costs for acquisition of products from third partiesreflected higher nickel purchases because of operational problems at the Copper Cliff smelter andhigher prices of iron ore and iron ore pellets, and (iii) higher personnel costs reflected the signingof a new collective agreement in Brazil.
Selling, general and administrative expenses
Selling, general and administrative expenses increased by 37.2%, or US$633 million, as a result ofhigher head count due to acquisitions, the signing of a new collective bargaining agreement in Brazil and theappreciation of the Brazilian real against the U.S. dollar.
Research and development expenses
Research and development expenses increased by 90.7%, which reflects expenditures for feasibility andother studies for new projects, mineral exploration, natural gas exploration and the development of newprocesses and technological improvements.
Other costs and expenses
Other costs and expenses increased by US$605 million, mainly due to pre-operating and start-upexpenses related to our Onca Puma and Vale New Caledonia projects and contingency expenses.
82

Operating income by segment
The following table provides information about our operating income by segment and as a percentageof revenues for the years indicated.
Year ended December 31,
2010 2011Segment operating income (loss) Segment operating income (loss)
(US$ million) (% of net operating (US$ million) (% of net operatingrevenues) revenues)
Bulk materials:Iron ore . . . . . . . . . . . . . . . . . . . . US$ 17,347 66.7% US$ 24,030 69.6%Iron ore pellets . . . . . . . . . . . . . . . . 3,511 57.2 4,427 56.2Manganese ore . . . . . . . . . . . . . . . . 105 41.8 (39) –Ferroalloys . . . . . . . . . . . . . . . . . . . 270 44.9 52 10.1Coal . . . . . . . . . . . . . . . . . . . . . . . (169) – (484) –
Base metals:Nickel and other products . . . . . . . . . . 165 3.5 1,073 13.2Copper concentrate . . . . . . . . . . . . . . 197 21.8 146 13.2Aluminum products . . . . . . . . . . . . . . 286 11.3 73 19.3
Fertilizers:Potash . . . . . . . . . . . . . . . . . . . . . (29) – (87) –Phosphates . . . . . . . . . . . . . . . . . . . (27) – 243 10.6Nitrogen . . . . . . . . . . . . . . . . . . . . (41) – 6 0.9Other fertilizer products . . . . . . . . . . . 1 8.3 70 100.0
Logistics:Railroads . . . . . . . . . . . . . . . . . . . . 85 9.2 (139) –Ports . . . . . . . . . . . . . . . . . . . . . . 47 15.4 48 11.6Shipping . . . . . . . . . . . . . . . . . . . . (8) – – –
Other products and services . . . . . . . . . . (45) – (820) –
Subtotal . . . . . . . . . . . . . . . . . . . . . . 21,695 47.9% 28,599 48.5%Gain on sale of assets . . . . . . . . . . . . . . – – 1,513 –
Total . . . . . . . . . . . . . . . . . . . . . US$ 21,695 47.9% US$ 30,112 51.0%
Operating income as a percentage of net operating revenues increased from 47.9% in 2010 to 51.0%in 2011. In general, all segments benefited from higher prices and volumes sold. The improvement inoperating margin in nickel also reflected the resumption of normal operations after the end of the labordisruption in Canada. Lower margins for manganese and ferroalloys reflected weak markets and lowervolumes.
Non-operating income (expenses)
The following table details our net non-operating income (expenses) for the periods indicated.
Year ended December 31,
2010 2011
(US$ million)Financial income . . . . . . . . . . . . . . . . . . . . . . . . . . . . . . . . . . . . . . . . . . . . . US$ 290 US$ 718Financial expenses . . . . . . . . . . . . . . . . . . . . . . . . . . . . . . . . . . . . . . . . . . . . (2,646) (2,465)Gains on derivatives, net . . . . . . . . . . . . . . . . . . . . . . . . . . . . . . . . . . . . . . . . 631 75Foreign exchange and monetary gains (losses), net . . . . . . . . . . . . . . . . . . . . . . . . . . 344 (1,641)
Non-operating income (expenses) . . . . . . . . . . . . . . . . . . . . . . . . . . . . . . . . . . . (US$ 1,381) (US$ 3,313)
83

We had net non-operating expenses of US$3.313 billion in 2011, compared to net US$1.381 billion in2010. The principal factor in the change was the high level of foreign exchange losses in 2011. This and theother factors in the change are described below:
� The net impact of foreign exchange and monetary variations was a charge of US$1.641 billion,due to appreciation of the U.S. dollar (in which most our debt is denominated) against theBrazilian real (which is our functional currency). This compares with a gain of US$344 million in2010, when there was a small depreciation of the U.S. dollar.
� The increase in financial income reflected the high level of cash we built up during late 2010 and2011, prior to our dividend payments and share repurchases in the fourth quarter of 2011.
� Financial expenses declined by 6.8%, mainly due to a favorable change in the amount recognizedfor change in the fair value of our outstanding shareholder debentures.
� The net effect of fair value changes in derivatives had a positive impact on earnings ofUS$75 million in 2011 and US$631 million in 2010. This reflected the following categories ofderivatives transactions:
� Currency and interest rate swaps—We recognized net expense of US$59 million in 2011,compared to net income of US$771 million in 2010. These swaps are primarily to convertdebt denominated in other currencies into U.S. dollars to protect our cash flow fromexchange rate volatility.
� Nickel derivatives—We recognized net income of US$103 million in 2011 and net expense ofUS$84 million in 2010. These derivatives are entered into as part of our nickel priceprotection program.
� Bunker oil derivatives—We recognized net income of US$37 million in 2011. Thesederivatives were structured to minimize the volatility of the cost of maritime freight.
Income taxes
For 2011, we recorded net income tax expense of US$5.282 billion, compared to US$3.705 billion in2010. The effective tax rate on our pretax income was 19.7%, lower than the statutory rate, mainly because ofthe tax benefit of shareholder distributions categorized as interest on shareholders’ equity. For moreinformation, see Note 6 to our consolidated financial statements. Exchange variations directly impact theexchange gains or losses recognized on transactions between the parent company and certain subsidiaries withlower statutory tax rates. Although those gains and losses are eliminated from reported consolidated pretaxamounts in the consolidation and currency re-measurement process, they are not eliminated for tax purposessince in Brazil there is no consolidated income tax regime. Our effective tax rate has historically been lowerthan the Brazilian statutory rate because: (i) income of some non-Brazilian subsidiaries is subject to lowerrates of tax; (ii) we are entitled under Brazilian law to deduct the amount of our distributions to shareholdersthat we classify as interest on shareholders’ equity; (iii) we benefit from tax incentives applicable to ourearnings on production in certain regions of Brazil; and (iv) functional currency movements on somenon-Brazilian subsidiaries are not taxable under Brazilian law. In addition, some of the foreign exchangevariations that affect our operating results are not taxable.
Affiliates and joint ventures
Our equity in the results of affiliates and joint ventures resulted in a net gain of US$1.135 billion in2011, compared to a net gain of US$987 million in 2010. Our joint venture Samarco representedUS$878 million of the 2011 amount, and the increase in 2011 is attributable to higher sales volumes andhigher prices for iron ore pellets.
84

Results of operations—2010 compared to 2009
Revenues
Our net operating revenues increased 94.3%, to US$45.293 billion, in 2010, primarily as a result ofhigher prices for our major products. In response to strong demand, volumes sold increased for iron ore andother bulk materials, but not for nickel and copper due largely to the effect of the labor dispute at ourSudbury and Voisey’s Bay operations, which has now ended. Of a total increase of US$22.542 billion in grossrevenues, US$15.571 billion was attributable to higher prices for iron ore and iron ore pellets.
The following table summarizes our gross revenues by product and our net operating revenues for theperiods indicated.
Year ended December 31,
2009 2010 % change
(US$ million)Bulk Materials:
Iron ore . . . . . . . . . . . . . . . . . . . . . . . . . . . . . . . . . . . US$ 12,831 US$ 26,384 105.6Iron ore pellets . . . . . . . . . . . . . . . . . . . . . . . . . . . . . . . 1,352 6,402 373.5Manganese . . . . . . . . . . . . . . . . . . . . . . . . . . . . . . . . . . 145 258 77.9Ferroalloys . . . . . . . . . . . . . . . . . . . . . . . . . . . . . . . . . . 372 664 78.5Coal . . . . . . . . . . . . . . . . . . . . . . . . . . . . . . . . . . . . . . 505 770 52.5
Subtotal . . . . . . . . . . . . . . . . . . . . . . . . . . . . . . . . . . 15,205 34,478 126.8Base Metals:
Nickel and other products (1) . . . . . . . . . . . . . . . . . . . . . . . 3,947 4,712 19.4Copper concentrate (2) . . . . . . . . . . . . . . . . . . . . . . . . . . . 682 934 37.0Aluminum products . . . . . . . . . . . . . . . . . . . . . . . . . . . . . 2,050 2,554 24.6
Subtotal . . . . . . . . . . . . . . . . . . . . . . . . . . . . . . . . . . 6,679 8,200 22.8Fertilizers:
Potash . . . . . . . . . . . . . . . . . . . . . . . . . . . . . . . . . . . . 413 280 (32.2)Phosphates . . . . . . . . . . . . . . . . . . . . . . . . . . . . . . . . . . – 1,211 –Nitrogen . . . . . . . . . . . . . . . . . . . . . . . . . . . . . . . . . . . – 337 –Other fertilizer products . . . . . . . . . . . . . . . . . . . . . . . . . . – 18 –
Subtotal . . . . . . . . . . . . . . . . . . . . . . . . . . . . . . . . . . 413 1,846 347.0Logistics:
Railroads . . . . . . . . . . . . . . . . . . . . . . . . . . . . . . . . . . . 838 1,107 32.1Ports . . . . . . . . . . . . . . . . . . . . . . . . . . . . . . . . . . . . . 264 353 33.7Shipping . . . . . . . . . . . . . . . . . . . . . . . . . . . . . . . . . . . 2 5 –
Subtotal . . . . . . . . . . . . . . . . . . . . . . . . . . . . . . . . . . 1,104 1,465 32.7Other products and services (3) . . . . . . . . . . . . . . . . . . . . . . . 538 492 (8.6)
Gross revenues . . . . . . . . . . . . . . . . . . . . . . . . . . . . . . . 23,939 46,481 94.2Value added tax . . . . . . . . . . . . . . . . . . . . . . . . . . . . (628) (1,188) 89.2
Net operating revenues . . . . . . . . . . . . . . . . . . . . . . . US$ 23,311 US$ 45,293 94.3
(1) Includes nickel co-products and by-products (copper, precious metals, cobalt and others).(2) Does not include copper produced as a nickel co-product.(3) Includes kaolin, pig iron and energy.
85

The following table summarizes, for the periods indicated, the distribution of our operating revenuesbased on the geographical location of our customers.
Operating revenue by destination
2009 2010
(US$ million) (% of total) (US$ million) (% of total)North America
Canada . . . . . . . . . . . . . . . . . . . . . . . . . . . . . US$ 886 3.7% US$ 1,126 2.4%United States . . . . . . . . . . . . . . . . . . . . . . . . . . 832 3.5 828 1.8Mexico . . . . . . . . . . . . . . . . . . . . . . . . . . . . . 24 0.1 74 0.2
1,742 7.3 2,028 4.4South America
Brazil . . . . . . . . . . . . . . . . . . . . . . . . . . . . . . 3,655 15.3 8,150 17.5Other . . . . . . . . . . . . . . . . . . . . . . . . . . . . . . 342 1.4 810 1.7
3,997 16.7 8,960 19.3Asia
China . . . . . . . . . . . . . . . . . . . . . . . . . . . . . . 9,003 37.6 15,379 33.1Japan . . . . . . . . . . . . . . . . . . . . . . . . . . . . . . 2,412 10.1 5,240 11.3South Korea . . . . . . . . . . . . . . . . . . . . . . . . . . 883 3.7 1,934 4.2Taiwan . . . . . . . . . . . . . . . . . . . . . . . . . . . . . . 681 2.8 1,179 2.5Other . . . . . . . . . . . . . . . . . . . . . . . . . . . . . . 654 2.7 1,059 2.2
13,633 56.9 24,791 53.3Europe
Germany . . . . . . . . . . . . . . . . . . . . . . . . . . . . 1,085 4.5 3,092 6.7United Kingdom . . . . . . . . . . . . . . . . . . . . . . . . 492 2.1 1,060 2.3Italy . . . . . . . . . . . . . . . . . . . . . . . . . . . . . . . 335 1.4 1,043 2.2France . . . . . . . . . . . . . . . . . . . . . . . . . . . . . . 336 1.4 716 1.5Belgium . . . . . . . . . . . . . . . . . . . . . . . . . . . . . 336 1.4 440 0.9Other . . . . . . . . . . . . . . . . . . . . . . . . . . . . . . 1,452 6.1 2,562 5.5
4,036 16.9 8,912 19.2Rest of the world . . . . . . . . . . . . . . . . . . . . . . . . . 531 2.2 1,790 3.9
Total . . . . . . . . . . . . . . . . . . . . . . . . . . . . . . . US$ 23,939 100.0% US$ 46,481 100.0%
Revenues by segment
Iron ore. Gross revenues from sales of iron ore increased 105.6% in 2010 compared to 2009,primarily as a result of an 84.9% increase in the average sale price and an 11.2% increase in volume sold.The increase in the average sales price resulted from strong demand for iron ore. The increase in volume wasa consequence of the worldwide economic recovery. Given strong demand pressure, the market for iron orehas been very tight, with rising spot prices and a decreasing stock-to-consumption ratio in China relative tolast year.
Iron ore pellets. Gross revenues from sales of iron ore pellets increased 373.5%, driven by a 118.5%increase in volume sold due to increased utilization of production capacity and a 118.7% increase in theaverage sales price due to strong demand.
Manganese ore. Gross revenues from sales of manganese ore increased 77.9%, driven by a 56.5%increase in the average sale price and a 13.5% increase in volume sold due to the demand from the steelindustry, partially offset by stoppage occurred in mines for operational maintenance.
Ferroalloys. Gross revenues from sales of ferroalloys increased 78.5%, due primarily to a 60.7%increase in volume sold in connection with the recovery of the steel industry and a 10.9% increase in theaverage sales price.
Coal. Gross revenues from sales of coal increased 52.5%, mainly due to the consolidation of salesfrom Vale Colombia, which Vale acquired in the first quarter of 2009, as well as higher average sales pricereflecting better market conditions. The improvement in sales prices for metallurgical coal reflected newquarterly index-based pricing arrangements with our customers similar to those we adopted in our iron orebusiness. Metallurgical coal revenues increased by 57.9% due to high prices (29.8% higher than in 2009) and
86

higher volumes sold (21.6% higher than in 2009). Thermal coal revenues increased by 44.7% due to higherprices (5.7% higher than in 2009) and higher volumes sold (37.3% higher than in 2009).
Nickel and other products. Gross revenues from this segment increased 19.4%, mainly due to anincrease in prices, partially offset by a decrease in volumes as a result of the labor strikes at our productionplants in Sudbury and Voisey’s Bay. The segment includes sales of nickel (representing 57.5% of base metalsgross revenues for 2010) and sales of copper that is a by-product of our nickel operations. Gross revenuesfrom nickel sales increased 17.6%, primarily due to a 50.6% increase in the average sales price due to anincrease in the LME price, which was partially offset by a 22.8% decrease in volume sold. Gross revenuesfrom copper sales increased 50.1%, primarily due to a 59.5% increase in the average sales price, which waspartially offset by a 23.0% decrease in the volume sold.
Copper concentrate. Gross revenues from sales of copper concentrate increased 37.0%, reflecting a40.5% increase in the average sales price as a result of structural limitations on growth in the supply ofconcentrates. The increase was partially offset by a 2.6% decrease in volume sold.
Aluminum products. Gross revenues from sales of aluminum-related products increased 24.6%,primarily reflecting an increase in the average sales price as a result of an increase in the LME price. Wetransferred our aluminum business in Albras, Alunorte and CAP, among other items, to Hydro in February2011.
Potash. Gross revenues from sales of potash decreased 32.2%, mainly due to a 21.2% decrease in theaverage sales price and a 13.9% decrease in volume sold explained by the recovery of inventories.
Phosphates and nitrogen. We had revenues from sales of phosphates and nitrogen for the first time in2010 due to the acquisition of fertilizer assets in Brazil.
Logistics services. Gross revenues from sales of logistics services increased 32.7%. Revenues fromrailroad transportation increased 32.1%, primarily reflecting the rise in transportation of agricultural productsand steel industry inputs and products in 2010. Revenues from port operations increased 33.7% due tochanges in the mix of goods carried.
Other products and services. Gross revenues from sales of other products and services decreased8.6%, primarily due to the classification of kaolin within discontinued operations in the first quarter of 2010.
Operating costs and expenses
Year ended December 31,
2009 2010 % change
(US$ million)Cost of ores and metals . . . . . . . . . . . . . . . . . . . . . . . . . . . . . US$ 9,853 US$ 13,326 35.2Cost of aluminum products . . . . . . . . . . . . . . . . . . . . . . . . . . . 2,087 2,108 1.0Cost of logistic services . . . . . . . . . . . . . . . . . . . . . . . . . . . . . 779 1,040 33.5Cost of fertilizer products . . . . . . . . . . . . . . . . . . . . . . . . . . . . 173 1,556 799.4Others . . . . . . . . . . . . . . . . . . . . . . . . . . . . . . . . . . . . . . . 729 784 7.5
Cost of goods sold . . . . . . . . . . . . . . . . . . . . . . . . . . . . . . . . 13,621 18,814 38.1Selling, general and administrative expenses . . . . . . . . . . . . . . . . . 1,130 1,701 50.5Research and development . . . . . . . . . . . . . . . . . . . . . . . . . . . 981 878 (10.5)Other costs and expenses . . . . . . . . . . . . . . . . . . . . . . . . . . . . 1,522 2,205 44.9
Total operating costs and expenses . . . . . . . . . . . . . . . . . . . . . US$ 17,254 US$ 23,598 36.8
87

Cost of goods sold
The following table summarizes the components of our cost of goods sold for the periods indicated.
Year ended December 31,
2009 2010 % change
(US$ million)Outsourced services . . . . . . . . . . . . . . . . . . . . . . . . . . . . . . . US$ 2,264 US$ 2,740 21.0Materials costs . . . . . . . . . . . . . . . . . . . . . . . . . . . . . . . . . . 2,698 2,861 6.0Energy:
Fuel . . . . . . . . . . . . . . . . . . . . . . . . . . . . . . . . . . . . . . 1,277 1,880 47.2Electric energy . . . . . . . . . . . . . . . . . . . . . . . . . . . . . . . . 844 1,211 43.5
Subtotal . . . . . . . . . . . . . . . . . . . . . . . . . . . . . . . . . 2,121 3,091 45.7Acquisition of iron ore and pellets . . . . . . . . . . . . . . . . . . . . . . . 155 963 521.3Acquisition of other products:
Nickel . . . . . . . . . . . . . . . . . . . . . . . . . . . . . . . . . . . . . 271 358 32.1Aluminum . . . . . . . . . . . . . . . . . . . . . . . . . . . . . . . . . . 279 285 2.2Other . . . . . . . . . . . . . . . . . . . . . . . . . . . . . . . . . . . . . 38 58 52.6
Subtotal . . . . . . . . . . . . . . . . . . . . . . . . . . . . . . . . . 588 701 19.2Personnel . . . . . . . . . . . . . . . . . . . . . . . . . . . . . . . . . . . . . 1,939 2,081 7.3Depreciation and depletion . . . . . . . . . . . . . . . . . . . . . . . . . . . 2,332 2,803 20.2Others . . . . . . . . . . . . . . . . . . . . . . . . . . . . . . . . . . . . . . . 1,524 3,574 134.5
Total . . . . . . . . . . . . . . . . . . . . . . . . . . . . . . . . . . . . . US$ 13,621 US$ 18,814 38.1
� Our total cost of goods sold increased 38.1% from 2009 to 2010. The increase is attributable tothe increase in volume sold and to exchange rate variations, partially offset by our continuousefforts to reduce costs. Of the US$5.193 billion increase in cost of goods sold, higher volume soldand exchange rate variations were responsible for US$1.775 billion and US$1.323 billion,respectively. Also contributing to the increase was a higher level of purchases of third-partyproducts for resale in order to meet excess demand, as well as our acquisition of fertilizer assets.These factors were partially offset by our efforts to reduce costs by optimizing the flow ofmaterials, optimizing plant and labor utilization, and cutting administrative costs, among othermeasures.
� Outsourced services costs (primarily for operational services such as waste removal, cargo freightand maintenance of equipment and facilities) increased 21.0%, driven primarily by higher volumesold and the appreciation of the Brazilian real against the U.S. dollar.
� Materials costs increased 6.0%, driven primarily by higher volume sold and the appreciation ofthe Brazilian real against the U.S. dollar, partially offset by lower maintenance expense in 2010reflecting accelerated expenditures in 2009.
� Energy costs increased 45.7%, driven primarily by higher volume sold, higher average prices andthe appreciation of the Brazilian real against the U.S. dollar.
� Costs for the acquisition of products from third parties increased 124.0%, driven primarily by thepurchase of iron ore and iron ore pellets. In 2009, Vale did not purchase iron ore pellets fromthird parties, due to the lower level of demand during the financial crisis.
� Personnel costs increased 7.3%, due primarily to higher production volumes and the appreciationof the Brazilian real against the U.S. dollar, partially offset by lower production of nickel.
� Depreciation and depletion expense increased 20.2%, driven primarily by the general increase involume sold and the appreciation of the Brazilian real against the U.S. dollar, partially offset bylower volumes of nickel sold due to the strikes.
88

� Other costs of goods sold increased 134.5%, primarily reflecting higher expenditures for miningroyalties, inventory adjustments in the ferrous minerals business, the effects of fair value inventoryadjustments made as part of the purchase price allocation of US$98 million in connection withour acquisition of the fertilizers business and increased demurrage costs as a result of greateractivity during 2010.
Selling, general and administrative expenses
Selling, general and administrative expenses increased by 50.5%, or US$571 million, due primarily tohigher volumes sold, increased personnel expenses, outsourced services and exchange rate variations.
Research and development expenses
Research and development expenses decreased by 10.5%. The US$103 million decrease primarilyreflects changes in the status of some gas and energy projects that we determined were viable, so the relatedexpenditures were recorded as capital expenditures rather than expenses, as in prior periods.
Other costs and expenses
Other costs and expenses increased by US$683 million, mainly due to provisions for losses onproperty, plant and equipment and disposal of materials, start-up expenses related to our New Caledoniaoperations and pre-operating expenses related to our Onca Puma, Salobo and Moatize projects.
Operating income by segment
The following table provides information about our operating income by segment and as a percentageof revenues for the years indicated.
Year ended December 31,
2009 2010Segment operating income (loss) Segment operating income (loss)
(US$ million) (% of net operating (US$ million) (% of net operatingrevenues) revenues)
Bulk materials:Iron ore . . . . . . . . . . . . . . . . . . . . US$6,659 52.6% US$17,347 66.7%Iron ore pellets . . . . . . . . . . . . . . . . 19 1.5 3,511 57.2Manganese ore . . . . . . . . . . . . . . . . 31 21.7 105 41.8Ferroalloys . . . . . . . . . . . . . . . . . . . 34 10.4 270 44.9Coal . . . . . . . . . . . . . . . . . . . . . . . (105) – (169) –
Base metals:Nickel and other products . . . . . . . . . . (361) – 165 3.5Copper concentrate . . . . . . . . . . . . . . 129 19.5 197 21.8Aluminum products . . . . . . . . . . . . . . (191) – 286 11.3
Fertilizers:Potash . . . . . . . . . . . . . . . . . . . . . 180 45.5 (29) –Phosphates . . . . . . . . . . . . . . . . . . . – – (27) –Nitrogen . . . . . . . . . . . . . . . . . . . . – – (41) –Others fertilizer products . . . . . . . . . . . – – 1 8.3
Logistics:Railroads . . . . . . . . . . . . . . . . . . . . 65 9.3 85 9.2Ports . . . . . . . . . . . . . . . . . . . . . . 36 15.9 47 15.4Shipping . . . . . . . . . . . . . . . . . . . . (7) – (8) –
Other products and services . . . . . . . . . . (432) – (45) –
Total . . . . . . . . . . . . . . . . . . . . . . . . US$6,057 26.0% US$21,695 47.9%
89

Operating income as a percentage of net operating revenues increased from 26.0% in 2009 to 47.9%in 2010. In general, the segments benefited from higher prices and volumes sold, as summarized in moredetail below.
� The increase in operating margin for iron ore and iron ore pellets primarily reflects higheraverage sales prices and volumes sold.
� The increase in operating margins for manganese and ferroalloys is attributable to higher salesprices and volumes sold as a result of the recovery of the steel industry.
� The decrease in operating margin for coal is attributable to higher expenses related to thepre-operating phase of Vale Mocambique.
� The increase in operating margins for nickel and other products is attributable to higher marketprices.
� The negative operating margin for our fertilizer segment is attributable primarily to the fair valueallocated to inventories as part of the purchase accounting adjustments in connection with the2010 acquisitions.
� The increase in operating margin in the aluminum products segment resulted primarily fromhigher average sales prices.
Non-operating income (expenses)
The following table details our net non-operating income (expenses) for the periods indicated.
Year ended December 31,
2009 2010
(US$ million)Financial income . . . . . . . . . . . . . . . . . . . . . . . . . . . . . . . . . . . . . . . . . . . . . . . . . . . . US$ 381 US$ 290Financial expenses . . . . . . . . . . . . . . . . . . . . . . . . . . . . . . . . . . . . . . . . . . . . . . . . . . . (1,558) (2,646)Gains (losses) on derivatives, net . . . . . . . . . . . . . . . . . . . . . . . . . . . . . . . . . . . . . . . . . . 1,528 631Foreign exchange and monetary gains, net . . . . . . . . . . . . . . . . . . . . . . . . . . . . . . . . . . . . . 675 344Gain on sale of assets . . . . . . . . . . . . . . . . . . . . . . . . . . . . . . . . . . . . . . . . . . . . . . . . . 40 –
Non-operating income (expenses) . . . . . . . . . . . . . . . . . . . . . . . . . . . . . . . . . . . . . . . . . . US$ 1,066 US$ (1,381)
We had net non-operating expenses of US$1.381 billion in 2010, compared to net non-operatingincome of US$1.066 billion in 2009. The change in net non-operating income (expenses) was affected by thefollowing factors:
� A decrease in financial income of US$91 million, mainly due to a lower average cash balance.
� An increase in financial expenses of US$1.088 billion, principally due to fair value changes in ourliability under our shareholder debentures, IOF (financial operations tax) charges related to theconversion of our mandatorily convertible notes due June 2010 and higher financial interest dueto a higher average level of debt.
� Lower foreign exchange and indexation gains due to foreign exchange loss, resulting from thecombination of lower cash balances, treasury positions in U.S. dollars in 2010 and appreciation ofthe Brazilian real against the U.S. dollar in 2010.
� No gain on sales of assets in 2010, compared to a US$40 million gain in 2009. The net gain in2009 was mainly attributable to the sale of shares of Usiminas.
90

Income taxes
For 2010, we recorded net income tax expense of US$3.705 billion, compared to US$2.100 billion in2009. The effective tax rate on our pretax income was 18%, lower than the statutory rate, mainly because of aretroactive tax benefit eligible for recognition this year related to our Carajas iron ore operations and the taxbenefit of shareholder distributions categorized as interest on shareholders’ equity. For more information, seeNote 6 to our consolidated financial statements.
Exchange variations directly impact the exchange gains or losses recognized on transactions betweenthe parent company and certain subsidiaries with lower statutory tax rates. Although those gains and lossesare eliminated from reported consolidated pretax amounts in the consolidation and currency re-measurementprocess, they are not eliminated for Brazilian tax purposes since in Brazil there is no consolidated income taxregime. Our effective tax rate has historically been lower than the Brazilian statutory rate because: (i) incomeof some non-Brazilian subsidiaries is subject to lower statutory rates of tax; (ii) we are entitled underBrazilian law to deduct the amount of our distributions to shareholders that we classify as interest onshareholders’ equity; (iii) we benefit from tax incentives applicable to our earnings on production in certainregions of Brazil; and (iv) functional currency movements on some non-Brazilian subsidiaries are not taxableunder Brazilian law. In addition, some of the foreign exchange variations that affect our operating results arenot taxable.
Affiliates and joint ventures
Our equity in the results of affiliates and joint ventures resulted in a net gain of US$987 million in2010, compared to a net gain of US$433 million in 2009. Our joint venture Samarco representsUS$798 million of the 2010 amount, and the increase in 2010 is attributable to higher sales volume andhigher prices for iron ore pellets.
LIQUIDITY AND CAPITAL RESOURCES
Overview
In the ordinary course of business, our principal funding requirements are for capital expenditures,dividend payments and debt service. We have historically met these requirements by using cash generatedfrom operating activities and through borrowings, supplemented occasionally by dispositions of assets.
For 2012, we have budgeted capital expenditures of US$21.4 billion, and announced a minimumdividend payment of US$6.0 billion to be paid in two installments of US$3.0 billion, with the first installmentin April and the second in October. We paid US$9.0 billion in dividends during 2011 and repurchasedUS$3.0 billion of our common and preferred shares during the second half of 2011.
We expect our operating cash flow and cash holdings to be sufficient to meet these anticipatedrequirements. We also regularly review acquisition and investment opportunities and, when suitableopportunities arise, we make acquisitions and investments to implement our business strategy. We may fundthese investments with borrowings.
Sources of funds
Our principal sources of funds are operating cash flow and borrowings. Our operating activitiesgenerated cash flows of US$24.5 billion in 2011.
91

Our major new borrowing transactions in 2011 and to date in 2012 are summarized below:
� In January 2012, our wholly owned finance subsidiary Vale Overseas issued US$1 billion notesdue 2022, guaranteed by Vale, with a coupon of 4.375% per year, payable semi-annually. In April2012, Vale Overseas reopened the notes and issued an additional US$1.250 billion.
� In August 2011, we entered into an agreement with a syndicate of financial institutions to financethe acquisition of five large ore carriers of 400,000 DWT and two capesize bulkers of 180,000DWT. The agreement provides a secured term loan facility of up to approximatelyUS$530 million, which corresponds to 80% of the contract price of the vessels. As ofDecember 31, 2011, Vale had drawn US$178 million under the facility. The banks also have thebenefit of an insurance policy provided by K-Sure (Korea Trade Insurance Corporation).
� In January 2011, we entered into an agreement with a group of commercial banks with theguarantee of the official Italian credit agency, Servizi Assicurativi Del Commercio Estero S.p.A—SACE, to provide us with a US$300 million facility with a final tenor of 10 years to guaranteelines of credit provided by commercial banks. As of December 31, 2011, we had drawn down allamounts available under this facility.
In addition to the transactions described above, during 2011 we also borrowed US$1.761 billion underour existing financing agreements.
In February 2011, we concluded the transfer to Hydro of a substantial portion of our aluminum assets,including our interests in Albras, Alunorte and CAP, together with off-take rights, outstanding commercialcontracts and net debt of US$655 million. In this transaction we received US$503 million in cash and 22% ofHydro’s outstanding common shares. Also as part of the transaction, we transferred the Paragominas bauxitemine and all of our other Brazilian bauxite mineral rights (apart from rights owned through our stake inMRN) to Paragominas, 60% of which we transferred to Hydro in exchange for US$578 million in cash. Wewill transfer our remaining interest in Paragominas to Hydro in two equal tranches in 2014 and 2016, each inexchange for US$200 million, subject to certain contingent adjustments.
In April 2011, we entered into a new revolving credit agreement with a syndicate of banks that addedUS$3 billion to the total amount available under our revolving credit facilities, which can be drawn byVale S.A., Vale Canada and Vale International. As of December 31, 2011, none of the borrowers had drawnany amounts under these facilities.
Uses of funds
Capital expenditures
Capital expenditures amounted to US$18.0 billion in 2011, and we have budgeted US$21.4 billion for2012. Our actual capital expenditures may differ from the budgeted amount for a variety of reasons, includingunexpected changes in currency prices. These capital expenditure figures include some amounts that aretreated as current expenses for accounting purposes, such as expenses for project development, maintenanceof existing assets and research and development. For more information about the specific projects for whichwe have budgeted funds, see—Capital expenditures and projects.
Distributions
We paid total dividends of US$9 billion in 2011 (including distributions classified as interest onshareholders’ equity). In January 2011, we paid an extraordinary dividend of US$1 billion and announced aminimum dividend for the year of US$4 billion, consisting of US$2 billion in April 2011 and US$2 billion inOctober 2011. Subsequently, we also paid additional dividends of US$3 billion in August 2011 and
92

US$1 billion in October 2011. The minimum dividend we have announced for 2012 is US$6.0 billion, payablein two equal installments in April and October.
Tax payments
We paid US$7.293 billion in income tax during 2011. This amount includes US$3.746 billion in socialcontribution tax (Contribuicao Social sobre o Lucro Lıquido—CSLL) that we paid as a result of a recentadverse decision by a Brazilian court, in order to avoid a penalty that would otherwise have applied 30 daysafter the decision. Vale continues to dispute the merits of this proceeding, which relates to the exemptionfrom CSLL for export revenues. The amount we paid had previously been provisioned.
Share repurchases
We repurchased US$3 billion of our common and preferred shares during the second half of 2011.For more information, see—Purchase of equity securities by the issuer and affiliated purchasers.
Acquisitions
In December 2011, we concluded a tender offer to acquire up to 100% of the publicly held shares ofour subsidiary Vale Fertilizantes. As a result of the public offer, we acquired 83.8% of the publicly heldcommon shares and 94.0% of the publicly held preferred shares of Vale Fertilizantes, which correspond to0.1% of the total common shares and 29.8% of the total preferred shares of Vale Fertilizantes. Both thecommon and preferred shares were acquired for R$25.00 per share, amounting to a total of R$2.1 billion(US$1.1 billion). Shortly thereafter, Vale Fertilizantes’ registration as a publicly listed company in Brazil wascancelled. The shareholders of Vale Fertilizantes held a general shareholders meeting in January 2012 andapproved the redemption of the remaining free floating common and preferred shares. As a result, Vale holds100% of the common shares and 100% of the preferred shares of Vale Fertilizantes. For more information,see—Significant changes in our business.
Debt
At December 31, 2011, we had aggregate outstanding debt of US$23.055 billion. Our outstandinglong-term debt (including the current portion of long-term debt and accrued charges) was US$23.033 billion,compared with US$24.414 billion at the end of 2010. At December 31, 2011, US$648 million of our debt wassecured by liens on some of our assets. At December 31, 2011, the average debt maturity was 9.81 years,compared to 9.92 years in 2010.
Our short-term debt consists primarily of U.S. dollar-denominated trade financing with commercialbanks. At December 31, 2011, we had US$22 million of outstanding short-term debt.
Our major categories of long-term indebtedness are as follows. The amounts given below include thecurrent portion of long-term debt and exclude accrued charges.
� U.S. dollar-denominated loans and financing (US$3.189 billion at December 31, 2011). Thiscategory includes export financing lines, loans from export credit agencies, and loans fromcommercial banks and multilateral organizations. The largest facility is a pre-export financingfacility linked to future receivables from export sales, which was originally entered in the amountof US$6.0 billion. The outstanding amount at December 31, 2011 was US$650 million.
� U.S. dollar-denominated fixed rate notes (US$10.483 billion at December 31, 2011). Through ourfinance subsidiary Vale Overseas Limited, we have issued in public offerings several series offixed-rate debt securities with a Vale guarantee, totaling US$9.131 billion. Our subsidiary ValeCanada has outstanding fixed rate debt in the amount of US$1.351 billion.
93
� Euro-denominated fixed rate notes (US$970 million at December 31, 2011). On March 24, 2010,we issued A750 million of fixed-rate notes in a global public offering. These notes are due in 2018and have a coupon of 4.375% per year, payable annually.
� Real-denominated non-convertible debentures (US$2.505 billion at December 31, 2011). InNovember 2006, we issued non-convertible debentures in the amount of approximatelyUS$2.600 billion, in two series, with four- and seven-year maturities. The first series,approximately US$700 million at issuance, matured in 2010. The second series, approximatelyUS$1.900 billion at issuance, matures in 2013 and bears interest at the Brazilian CDI interest rateplus 0.25% per year. At December 31, 2011, the total amount of the second series wasUS$2.157 billion.
� Other debt (US$5.553 billion at December 31, 2011). We have outstanding debt, principally owedto BNDES and Brazilian commercial banks, denominated in Brazilian reais and other currencies.
We also have a variety of credit lines. At December 31, 2011, these included the following:
� A credit line for US$530 million with a syndicate of financial institutions to finance theacquisition of five large ore carriers and two capesize bulkers at two Korean shipyards. As ofDecember 31, 2011, we had drawn US$178 million under this facility.
� A credit line for US$1 billion with Export Development Canada to finance our investmentprogram. As of December 31, 2011, we had drawn US$500 million under this facility.
� A US$1.2 billion facility with The Export-Import Bank of China and the Bank of China Limitedto finance the construction of 12 very large ore carriers. As of December 31, 2011, we had drawnUS$467 million under this facility.
� Framework agreements signed in May 2008 with the Japan Bank for International Cooperation(‘‘JBIC’’) and Nippon Export and Investment Insurance (‘‘NEXI’’) for US$5 billion of financingfor mining, logistics and power generation projects. We have a fully drawn US$300 million exportfacility, through our subsidiary PTVI, with Japanese financial institutions to finance theconstruction of the Karebbe hydroelectric power plant on the Larona River in Sulawesi,Indonesia.
� Credit lines for R$7.3 billion, or US$4.0 billion, with BNDES to help finance our investmentprogram. As of December 31, 2011, we had drawn the equivalent of US$1.496 billion under thisfacility.
� Facilities with BNDES totaling R$877 million, or US$492 million, to finance the acquisition ofdomestic equipment. As of December 31, 2011, we had drawn the equivalent of US$329 millionunder these facilities.
We have revolving credit facilities with syndicates of international banks. At December 31, 2011, thetotal amount available under these facilities was US$4.1 billion. A portion of these facilities, US$1.1 billion,will expire in May 2012. As of December 31, 2011, we had not drawn any amounts under these facilities, butUS$107 million of letters of credit were issued and outstanding under a facility of Vale Canada.
Some of our long-term debt instruments contain financial covenants. Our principal covenants requireus to maintain certain ratios, such as debt to EBITDA and interest coverage. We believe that our existingcovenants will not significantly restrict our ability to borrow additional funds as needed to meet our capitalrequirements.
94
Shareholder Debentures
At the time of the first stage of our privatization in 1997, we issued shareholder revenue interestsknown in Brazil as ‘‘debentures participativas’’ to our then-existing shareholders. The terms of the debentureswere established to ensure that our pre-privatization shareholders, including the Brazilian government, wouldparticipate alongside us in potential future financial benefits that we derive from exploiting certain mineralresources that were not taken into account in determining the minimum purchase price of our shares in theprivatization. In accordance with the debentures deed, holders have the right to receive semi-annual paymentsequal to an agreed percentage of our net revenues (revenues less value-added tax, transport fee and insuranceexpenses related to the trading of the products) from certain identified mineral resources that we owned atthe time of the privatization, to the extent that we exceed defined thresholds of sales volume relating tocertain mineral resources, and from the sale of mineral rights that we owned at that time. Our obligation tomake payments to the holders will cease when the relevant mineral resources are exhausted.
We have been making semi-annual payments to holders of shareholder debentures, which reachedUS$7 million in 2009, US$10 million in 2010 and US$14 million in 2011. See Note 20 to our consolidatedfinancial statements for a description of the terms of the debentures.
CONTRACTUAL OBLIGATIONS
The following table summarizes our contractual obligations at December 31, 2011. This table excludesother common non-contractual obligations that we may have, including pension obligations, deferred taxliabilities and contingent obligations arising from uncertain tax positions, all of which are discussed in thenotes to our consolidated financial statements.
Payments due by period
Less thanTotal 1 year 2013-2014 2015-2016 Thereafter
(US$ million)Long-term debt(1) . . . . . . . . . . . . . . . . . US$22,700 US$1,162 US$4,415 US$2,559 US$14,564Short-term debt . . . . . . . . . . . . . . . . . . . 22 22 – – –Short-term debt associated with assets held for
sale . . . . . . . . . . . . . . . . . . . . . . . . . 8 8 – – –Interest payments(2) . . . . . . . . . . . . . . . . 14,324 1,311 2,353 1,891 8,769Operating lease obligations(3) . . . . . . . . . . . 1,537 153 255 220 909Purchase obligations(4) . . . . . . . . . . . . . . 16,396 7,858 4,640 1,753 2,145
Total . . . . . . . . . . . . . . . . . . . . . . . . US$54,987 US$10,514 US$11,663 US$6,423 US$26,387
(1) Amounts include the current portion of long-term debt and do not include accrued charges.(2) Consists of estimated future payments of interest on our loans, financings and debentures, calculated based on interest rates and
foreign exchange rates applicable at December 31, 2011 and assuming (i) that all amortization payments and payments at maturity onour loans, financings and debentures will be made on their scheduled payments dates, and (ii) that our perpetual bonds are redeemedon the first permitted redemption date.
(3) Amounts include fixed payments related to the operating lease contracts for the pellet plants.(4) Obligations to purchase materials. Amounts are based on contracted prices, except for purchases of iron ore from mining companies
located in Brazil, which are based on Q1 2012 average prices.
OFF-BALANCE SHEET ARRANGEMENTS
At December 31, 2011, we did not have any off-balance sheet arrangements as defined in the SEC’sForm 20-F. For information on our contingent liabilities see Note 20 to our consolidated financial statements.
CRITICAL ACCOUNTING POLICIES AND ESTIMATES
We believe that the following are our critical accounting policies. We consider an accounting policy tobe critical if it is important to our financial condition and results of operations and if it requires significant
95

judgments and estimates on the part of our management. For a summary of all of our significant accountingpolicies, see Note 3 to our consolidated financial statements.
Mineral reserves and useful life of mines
We regularly evaluate and update our estimates of proven and probable mineral reserves. Our provenand probable mineral reserves are determined using generally accepted estimation techniques. Calculating ourreserves requires us to make assumptions about future conditions that are highly uncertain, including futureore prices, currency prices, inflation rates, mining technology, availability of permits and production costs.Changes in some or all of these assumptions could have a significant impact on our recorded proven andprobable reserves.
One of the ways we make our ore reserve estimates is to determine the mine closure dates used inrecording the fair value of our asset retirement obligations for environmental and site reclamation costs andthe periods over which we amortize our mining assets. Any change in our estimates of total expected futuremine or asset lives could have an impact on the depreciation, depletion and amortization charges recorded inour consolidated financial statements under cost of goods sold. Changes in the estimated lives of our minescould also significantly impact our estimates of environmental and site reclamation costs, which are describedin greater detail below.
Environmental and site reclamation costs
Expenditures relating to ongoing compliance with environmental regulations are charged againstearnings or capitalized as appropriate. These ongoing programs are designed to minimize the environmentalimpact of our activities.
We recognize a liability for the fair value of our estimated asset retirement obligations in the period inwhich they are incurred, if a reasonable estimate can be made. We consider the accounting estimates relatedto reclamation and closure costs to be critical accounting estimates because:
� we will not incur most of these costs for a number of years, requiring us to make estimates over along period;
� reclamation and closure laws and regulations could change in the future or circumstancesaffecting our operations could change, either of which could result in significant changes to ourcurrent plans;
� calculating the fair value of our asset retirement obligations requires us to assign probabilities toprojected cash flows, to make long-term assumptions about inflation rates, to determine ourcredit-adjusted risk-free interest rates and to determine market risk premiums that areappropriate for our operations; and
� given the significance of these factors in the determination of our estimated environmental andsite reclamation costs, changes in any or all of these estimates could have a material impact onnet income. In particular, given the long periods over which many of these charges are discountedto present value, changes in our assumptions about credit-adjusted risk-free interest rates couldhave a significant impact on the size of our provision.
Our Environmental Department defines the rules and procedures that should be used to evaluate ourasset retirement obligations. The future costs of retirement of our mines and sites are reviewed annually, ineach case considering the actual stage of exhaustion and the projected exhaustion date of each mine and site.The future estimated retirement costs are discounted to present value using a credit-adjusted risk-free interestrate. At December 31, 2011, we estimated the fair value of our aggregate total asset retirement obligations tobe US$1.77 billion.
96

Impairment of long-lived assets and goodwill
We have made acquisitions that included a significant amount of goodwill, as well as intangible andtangible assets. Under generally accepted accounting principles, except for goodwill and indefinite-lifeintangible assets, all long-lived assets, including these acquired assets, are amortized over their estimateduseful lives, and are tested to determine if they are recoverable from operating earnings on an undiscountedcash flow basis over their useful lives whenever events or changes in circumstances indicate that the carryingvalue may not be recoverable. Factors that could trigger an impairment review include the following:
� significant underperformance relating to expected historical or projected future operating resultsof entities or business units;
� significant changes in the way we use the acquired assets or our overall business strategy; or
� significant negative industry or macroeconomic trends.
When we determine that the carrying value of definite-life intangible assets and long-lived assets maynot be recoverable based upon verification of one or more of the above indicators of impairment, we measureany impairment loss based on a projected discounted cash flow method using a discount rate estimatedpursuant to technical criteria to be commensurate with the risk inherent in our current business model.
We are required to assign goodwill to reporting units and to assess each reporting unit’s goodwill forimpairment at least annually and whenever circumstances indicating that recognized goodwill might not befully recovered are identified. On September 15, 2011, FASB issued Accounting Standards Update (ASU)No. 2011-08, Intangibles—Goodwill and Other (Topic 350): Testing Goodwill for Impairment. The standardprovides the option to first assess qualitative factors to determine whether it is necessary to further performthe first and second steps of the goodwill impairment test. In assessing the qualitative factors, if it is morelikely than not that the fair value of the reporting unit exceeds its carrying amount, the first and second stepsof the goodwill impairment test are not required and no goodwill impairment charge is required. Otherwise,the entity will be required to perform the first and second steps of the goodwill impairment test to assesswhether an impairment exists. In the first step of a goodwill impairment test, we compare a reporting unit’sfair value with its carrying amount to identify any potential goodwill impairment loss. If the carrying amountof a reporting unit exceeds the unit’s fair value, we carry out the second step of the impairment test tomeasure the amount, if any, of the unit’s goodwill impairment loss. Goodwill arising from a businesscombination with a continuing non-controlling interest is tested for impairment by using an approach that isconsistent with the approach that the entity used to measure the non-controlling interest at the acquisitiondate. For equity investees we determine annually whether there is an other-than-temporary decline in the fairvalue of the investment.
For impairment test purposes, management determined discounted cash flows based on approvedbudget assumptions. Gross margin projections were based on past performance and management’sexpectations of market developments. Information about sales prices is consistent with the forecasts includedin industry reports, taking into account quoted prices when available and appropriate. The discount rates usedreflect specific risks relating to the relevant assets in each reporting unit, depending on their composition andlocation.
Recognition of additional goodwill impairment charges in the future would depend on severalestimates, including market conditions, recent actual results and management’s forecasts. This information willbe obtained when our assessment is updated during the fourth quarter of 2012, or earlier if impairmentindicators are identified. It is not possible at this time to determine whether an impairment charge will betaken in the future and if it were to be taken, whether such charge would be material.
97

Derivatives
We are required to recognize all derivative financial instruments, whether designated in hedgingrelationships or not, on our balance sheet and to measure such instruments at fair value. The gain or loss infair value is included in current earnings, unless the derivative to which the gain or loss is attributablequalifies for hedge accounting. We have entered into cash flow hedges that qualify for hedge accounting.Unrealized fair value adjustments to cash flow hedges are recognized in other comprehensive income. We usewell-known market participants’ valuation methodologies to compute the fair value of instruments. Toevaluate the financial instruments, we use estimates and judgments related to present values, taking intoaccount market curves, projected interest rates, exchange rates, forward market prices and their respectivevolatilities, when applicable. We evaluate the impact of credit risk on financial instruments and derivativetransactions, and we enter into transactions with financial institutions that we consider to have a high creditquality. The exposure limits to financial institutions are proposed annually by the Executive Risk Committeeand approved by the Board of Executive Officers. The financial institution’s credit risk tracking is performedmaking use of a credit risk valuation methodology that considers, among other information, published ratingsprovided by international rating agencies and other management judgments. During 2011, we implementedhedge accounting partially for strategic nickel hedge and for a foreign exchange hedge. At December 31,2011, we had US$37 million of realized gains related to derivative instruments designated as cash flow hedges.In 2011, we recorded to the income statement gains of US$75 million in relation to derivative instruments.
Income taxes
We recognize deferred tax effects of tax loss carryforwards and temporary differences in ourconsolidated financial statements. We record a valuation allowance when we believe that it is more likely thannot that tax assets will not be fully recoverable in the future.
When we prepare our consolidated financial statements, we estimate our income taxes based onregulations in the various jurisdictions where we conduct business. This requires us to estimate our actualcurrent tax exposure and to assess temporary differences that result from deferring treatment of certain itemsfor tax and accounting purposes. These differences result in deferred tax assets and liabilities, which we showon our consolidated balance sheet. We must then assess the likelihood that our deferred tax assets will berecovered from future taxable income. To the extent we believe that recovery is not likely, we establish avaluation allowance. When we establish a valuation allowance or increase this allowance in an accountingperiod, we record a tax expense in our statement of income. When we reduce the valuation allowance, werecord a tax benefit in our statement of income.
Determining our provision for income taxes, our deferred tax assets and liabilities and any valuationallowance to be recorded against our net deferred tax assets requires significant management judgment,estimates and assumptions about matters that are highly uncertain. For each income tax asset, we evaluate thelikelihood of whether some portion or the entire asset will not be realized. The valuation allowance made inrelation to accumulated tax loss carryforwards depends on our assessment of the probability of generation offuture taxable profits within the legal entity in which the related deferred tax asset is recorded, based on ourproduction and sales plans, selling prices, operating costs, environmental costs, group restructuring plans forsubsidiaries and site reclamation costs and planned capital costs.
Contingencies
We disclose material contingent liabilities unless the possibility of any loss arising is consideredremote, and we disclose material contingent assets where the inflow of economic benefits is probable. Wediscuss our material contingencies in Note 20 to our consolidated financial statements.
We record an estimated loss from a loss contingency when information available prior to the issuanceof our financial statements indicates that it is probable that a future event will confirm that an asset has beenimpaired or a liability has been incurred at the date of the financial statements, and the amount of the loss
98

can be reasonably estimated. In particular, given the nature of Brazilian tax legislation, the assessment ofpotential tax liabilities requires significant management judgment. By their nature, contingencies will only beresolved when one or more future events occurs or fails to occur, and typically those events will occur anumber of years in the future. Assessing such liabilities, particularly in the Brazilian legal environment,inherently involves the exercise of significant management judgment and estimates of the outcome of futureevents.
The provision for contingencies at December 31, 2011, totaling US$1.686 billion, consists of provisionsof US$751 million for labor, US$248 million for civil, US$654 million for tax and US$33 million for otherclaims.
Employee post-retirement benefits
We sponsor defined benefit pension plans covering some of our employees. The determination of theamount of our obligations for pension benefits depends on certain actuarial assumptions. These assumptionsare described in Note 18 to our consolidated financial statements and include, among others, the expectedlong-term rate of return on plan assets and increases in salaries. In accordance with U.S. GAAP, actual resultsthat differ from our assumptions and are not a component of net benefit costs for the year are recorded inother comprehensive income (loss).
RISK MANAGEMENT
The aim of our risk management strategy is to promote enterprise-wide risk management thatsupports our growth strategy, strategic plan, corporate governance practices and financial flexibility to supportmaintenance of investment grade status. We developed an integrated framework for managing risk, whichconsiders the impact on our business of not only market risk factors (market risk), but also risks arising fromthird party obligations (credit risk), risks associated with inadequate or failed internal processes, people,systems or external events (operational risk) and risks associated with political and regulatory conditions incountries in which we operate (political risk).
In furtherance of this objective and in order to further improve our corporate governance practices,our Board of Directors has established a company-wide risk management policy and an Executive RiskManagement Committee. The risk management policy requires that we regularly evaluate and monitor thecorporate risk on a consolidated basis in order to guarantee that our overall risk level remains in line with theguidelines defined by the Board of Directors and the Executive Board.
The Executive Risk Management Committee is responsible for supporting the Board of ExecutiveOfficers in performing risk analysis and for issuing opinions regarding proper risk management. Thecommittee is also responsible for the supervision and revision of the principles and instruments ofcompany-wide risk management, in addition to reporting periodically to the Board of Executive Officersregarding the major risks we are exposed to and the impact of new investments, projects and disinvestmentsin our risk profile. As of April 2012, the members of the Executive Risk Management Committee were: TitoBotelho Martins, Chief Financial Officer and Executive Director for Investor Relations, Procurement andShared Services, Jose Carlos Martins, Executive Officer responsible for Ferrous Minerals Operations andMarketing, Sonia Zagury, Corporate Finance Director, Efrem Jose Daumas Junior, Planning, Developmentand Continuous Improvement Director and Roberto Moretzsohn, Marketing and Sales Base Metals Director.
Under our risk management policy, we may assign specific risk limits to certain management activitiesthat require market, credit or sovereign risk limits. Those limits will be observed and evaluated using certainrisk metrics, including Value at Risk (VaR).
99
Market risk
We are exposed to various market risk factors that can impact our financial stability and cash flow. Anassessment of the potential impact of the consolidated market risk exposure is performed periodically toinform our decision making processes and growth strategy, ensure financial flexibility and monitor future cashflow volatility.
When necessary, market risk mitigation strategies are evaluated and implemented. Some of thesestrategies may incorporate financial instruments, including derivatives. The financial instrument portfolios aremonitored on a monthly basis, enabling us to properly monitor financial results and their impact on cash flow,and ensure correlation between the strategies implemented and the proposed objectives.
Considering the nature of our business and operations, the main market risk factors that we areexposed to are: interest rates, foreign exchange rates, product prices and input costs.
We recognize all derivatives on our balance sheet at fair value, and the gain or loss in fair value isrecognized in our current earnings, except as described in the next paragraph. Fair value accounting ofderivatives may introduce unintended volatility in our quarterly earnings. However, it does not generatevolatility in our cash flows, given the nature of our derivatives transactions.
Under the Standard Accounting for Derivative Financial Instruments and Hedging Activities, allderivatives, whether designated as hedging relationships or not, are required to be recorded on the balancesheet at fair value, and the gain or loss in fair value is included in current earnings, unless the derivative isdesignated as in a hedging relationship, thereby qualifying as hedge accounting. In order to be deemed aneffective hedging relationship, a change in the fair value of the derivative must be offset by an equal andopposite change in the fair value of the underlying hedged item. In accordance with these requirements, weperform effectiveness tests in order to assess the effectiveness of the hedging relationships and quantifyineffectiveness for all designated hedges.
At December 31, 2011, Vale had outstanding positions designated as hedging relationships, or morespecifically, cash flow hedges. A cash flow hedge is a hedge of the exposure to the variability in expectedfuture cash flows that is attributable to a particular risk, such as a forecasted purchase or sale. If a derivativeis designated as cash flow hedge, the effective portion of the change in the fair value of the derivative isrecorded in other comprehensive income and recognized in the income statement at the time the hedged itemis recorded, enabling gains and losses on the hedging instrument to be recognized in the income statement inthe same period as offsetting losses or gains on the hedged item. However, the ineffective portion of changesin the fair value of the derivatives designated as hedges is recognized in the income statement. Consequently,if a portion of a derivative contract is excluded for purposes of effectiveness testing, the value of suchexcluded portion is recognized on the income statement.
100

The asset (liability) balances at December 31, 2011 and 2010 and the movement in fair value ofderivative financial instruments are shown in the following table.
Interestrates Fuel/
(LIBOR)/ Aluminum Copper/ NaturalCurrencies products Coal Nickel Freight gas Total
Fair value at January 1, 2010 . . . US$870 US$(87) US$– US$(28) US$29 US$49 US$833Financial settlement . . . . . . . . (1,329) 63 3 97 (25) (35) (1,226)Unrealized gains (losses) in the
year . . . . . . . . . . . . . . . . 832 (36) (5) (137) (5) 3 652Effect of exchange rate changes . 18 (1) – 1 (1) (1) 16
Unrealized gain (loss) atDecember 31, 2010 . . . . . . . US$391 US$(61) US$(2) US$(67) US$(2) US$16 US$275
Fair value at January 1, 2011 . . . US$391 US$(61) US$(2) US$(67) US$(2) US$16 US$275Financial settlement . . . . . . . . (435) 4 2 (89) 2 (49) (565)Unrealized gains (losses) in the
year . . . . . . . . . . . . . . . . (95) – – 317 – 37 259Effect of exchange rate changes . (107) 57 – – – – (50)
Unrealized gain (loss) atDecember 31, 2011 . . . . . . . US$(246) US$– US$– US$161 US$– US$4 US$(81)
Foreign exchange rate and interest rate risks
Our cash flows are exposed to the volatility of several currencies against the U.S. dollar. While mostof our product prices are indexed to U.S. dollars, most of our costs, disbursements and investments areindexed to currencies other than the U.S. dollar, principally the Brazilian real and the Canadian dollar. Wefrequently use derivative instruments, primarily forward transactions and swaps, in order to reduce ourpotential cash flow volatility arising from this currency mismatch.
We use swap transactions to effectively convert debt linked to Brazilian reais into U.S. dollars. Thesetransactions typically have similar—or sometimes earlier—settlement dates than the final maturity dates of theassociated debt instruments. Likewise, the notional amounts of the swap transactions are similar to theprincipal and interest payments of the debt, subject to liquidity market conditions. The swaps with shortersettlement dates are then renegotiated over time so that their final maturity matches, or approaches, thedebt’s final maturity. At each settlement date, the results of the swap transactions partially offset the impactof the foreign exchange rate in Vale’s obligations, helping stabilize the cash disbursements in U.S. dollars.
In the event of an appreciation (depreciation) of the Brazilian real against the U.S. dollar, thenegative (positive) impact on our real-denominated debt obligations (interest and/or principal payment)measured in U.S. dollars will be partially offset by an associated positive (negative) effect from any existingswap transaction, regardless of the U.S. dollar/real exchange rate on the payment date. The same rationaleapplies to debt denominated in other currencies and their respective swaps.
We are also exposed to interest rate risk on loans and financings. Our floating rate debt consistsmainly of loans including export pre-payments, commercial bank loans and multilateral organization loans. Ingeneral, the U.S. dollar floating rate debt is subject to changes in LIBOR (London Interbank Offer Rate) inU.S. dollars. To mitigate the impact of interest rate volatility on our cash flows, we take advantage of naturalhedges resulting from the correlation between commodity prices and U.S. dollar floating interest rates. If suchnatural hedges are not present, we may opt to obtain the same effect by using financial instruments.
Our floating rate debt denominated in reais includes debentures issued in the Brazilian market andloans provided by BNDES and commercial local banks. Interest on these obligations is mainly based on theCDI (Interbank Deposit Certificate), the benchmark interest rate in the Brazilian interbank market, and theTJLP, the benchmark Brazilian long-term interest rate.
101

The following table sets forth our floating and fixed rate long-term debt, categorized by Brazilian reaisand other currencies, and as a percentage of our total long-term debt portfolio at the dates indicated, exceptfor accrued charges and translation adjustments, as reflected in our consolidated financial statements.
At December 31,
2010 2011
(US$ million, except percentages)Floating rate debt:
Real-denominated . . . . . . . . . . . . . . . . . . . . . . . . . . . . . 7,476 30.2% 7,595 33.5%Denominated in other currencies . . . . . . . . . . . . . . . . . . . . 4,969 20.1% 3,250 14.3%Denominated in other currencies associated with assets held for
sale(1) . . . . . . . . . . . . . . . . . . . . . . . . . . . . . . . . . . 702 2.8% – –
Fixed rate debt:Real-denominated . . . . . . . . . . . . . . . . . . . . . . . . . . . . . 123 0.5% 400 1.8%Denominated in other currencies . . . . . . . . . . . . . . . . . . . . 11,503 46.4% 11,455 50.4%
Subtotal . . . . . . . . . . . . . . . . . . . . . . . . . . . . . . . . . . . . 24,773 100.0% 22,700 100.0%Accrued charges . . . . . . . . . . . . . . . . . . . . . . . . . . . . . . . 343 – 333 –Accrued charges associated with assets held for sale(1) . . . . . . . . 3 – – –
Total . . . . . . . . . . . . . . . . . . . . . . . . . . . . . . . . . . . . . 25,118 – 23,033 –
(1) We transferred our aluminum business in Albras, Alunorte and CAP, among other items, to Hydro in February 2011, in exchange for a22.0% equity interest in Hydro as part of the consideration.
The following table provides information about our debt obligations as of December 31, 2011. Itpresents the principal cash flows and related weighted average interest rates of these obligations by expectedmaturity date. Weighted average variable interest rates are based on the applicable reference rate atDecember 31, 2011. Actual cash flows of these debt obligations are denominated mainly in U.S. dollars orreais, as indicated.
Weighted Fair valueaverage cash flow atinterest December 31,
rate(1)(2) 2012 2013 2014 2015 2016 To 2040 Total 2011(3)
(%) (US$ million)US$-denominatedFixed rate:
Bonds . . . . . . . 6.49 402 124 – 300 952 8,461 10,239 11,597Loans . . . . . . . 8.50 – – – – – 39 39 39
Floating rate:Loans . . . . . . . 6.63 123 145 173 173 173 828 1,615 1,705Trade finance . . 1.86 375 435 35 35 35 660 1,575 1,598
Subtotal . . . . 900 704 208 508 1,160 9,988 13,468 14,939
Real-denominatedFixed rate loans . . 3.95 9 29 42 51 53 216 400 474Floating rate loans . 8.52 235 2,440 952 364 362 2,878 7,231 7,235
Subtotal . . . . 244 2,469 994 415 415 3,094 7,631 7,709
Denominated inother currencies
Fixed rateEurobonds . . . 4.93 – – – – – 970 970 1,034Loans . . . . . 8.67 9 3 23 24 27 121 207 207
Floating rate loans . 3.31 9 8 6 5 5 28 61 61
Subtotal . . . . 18 11 29 29 32 1,119 1,238 1,301
No maturity . . . . – – – – – 363 363 363
Total . . . . . . . . . 1,162 3,184 1,231 952 1,607 14,564 22,700 24,312
(1) Weighted average interest rates do not take into account the effect of the derivatives.(2) Weighted average variable interest rates are based on the applicable reference rate at December 31, 2011.(3) Includes only long-term debt obligations.
102

As of December 31, 2011, the total principal amount and interest of our real-denominated debtconverted through swaps into U.S. dollars was US$6.0 billion and the total principal amount and interest ofour euro-denominated debt converted through swaps into U.S. dollars was US$649 million, with an averagecost in U.S. dollars of 3.22% per year after swap transactions and with maturity until September 2029. Mostof those contracts are subject to semi-annual interest payments.
Protection program for real-denominated debt indexed to CDI
In order to reduce cash flow volatility, we entered into swap transactions to convert to U.S. dollars thecash flows on debt instruments denominated in reais linked to CDI. In those swaps, Vale pays either fixedrates or floating LIBOR rates in U.S. dollars and receives payments linked to CDI.
These instruments were used to convert cash flows from: debentures issued in 2006 with a nominalvalue of R$5.5 billion (US$2.5 billion at the disbursement date), credit export notes issued in 2008 with anominal value of R$2.0 billion (US$1.1 billion at the disbursement date) and procurement financing obtainedin 2006 and 2007 with a nominal value of R$1.0 billion (US$464 million at the disbursement dates).
Notional value at Fair value atDecember 31, December 31,Average Final
Flow 2011 2010 Index rate maturity 2011 2010
(million) (US$ million)CDI vs. fixed rate swapReceivable . . . . . . . . . . . . . . . . . . R$ 5,542 R$ 5,542 CDI 103.03% 2015 3,049 3,447Payable . . . . . . . . . . . . . . . . . . . . US$3,144 US$3,144 USD 3.87% (3,252) (3,248)
Total . . . . . . . . . . . . . . . . . . . . . (203) 199
CDI vs. floating rate swapReceivable . . . . . . . . . . . . . . . . . . R$ 428 R$ 428 CDI 103.51% 2015 242 272Payable . . . . . . . . . . . . . . . . . . . . US$ 250 US$ 250 LIBOR 0.99% (260) (262)
Total . . . . . . . . . . . . . . . . . . . . . (18) 10
Protection program for real-denominated debt indexed to TJLP
In order to reduce cash flow volatility, we entered into swap transactions to convert to U.S. dollars thecash flows related to indebtedness to BNDES indexed to TJLP. In these swaps, we pay either fixed or floatingrates in U.S. dollars and receive payments linked to TJLP.
Notional value at Fair value atDecember 31, December 31,Average Final
Flow 2011 2010 Index rate maturity 2011 2010
(million) (US$ million)TJLP vs. fixed rate swap(1)Receivable . . . . . . . . . . . . . . . . . . R$ 3,107 R$ 2,418 TJLP 1.37% 2019 1,567 1,244Payable . . . . . . . . . . . . . . . . . . . . US$1,611 US$1,228 USD 2.65% (1,576) (1,180)
Total . . . . . . . . . . . . . . . . . . . . . (9) 64
TJLP vs. floating rate swap(1)Receivable . . . . . . . . . . . . . . . . . . R$ 774 R$ 739 TJLP 0.96% 2019 372 371Payable . . . . . . . . . . . . . . . . . . . . US$ 365 US$ 372 LIBOR (1.14)% (309) (343)
Total . . . . . . . . . . . . . . . . . . . . . 63 28
(1) Due to TJLP derivatives market liquidity constraints, some swap trades were done through CDI equivalency.
103

Protection program for real-denominated fixed debt
In order to hedge against cash flow volatility, we entered into a swap transaction to convert the cashflows from loans with BNDES in Brazilian reais linked to a fixed rate into U.S. dollars linked to a fixed rate.In these swaps, we receive fixed rates in reais and pay fixed rates in U.S. dollars.
Notional value at Fair value atDecember 31, December 31,Average Final
Flow 2011 2010 Index rate maturity 2011 2010
(million) (US$ million)BRL fixed rate vs. USD fixed rate swapReceivable . . . . . . . . . . . . . . . . . R$ 615 R$ 204 Fixed 4.64% 2016 277 94.2Payable . . . . . . . . . . . . . . . . . . . US$355 US$121 USD (1.20)% (300) (93.6)
Total . . . . . . . . . . . . . . . . . . . . (23) 0.6
Foreign exchange cash flow hedges
We entered into swap transactions to mitigate our exchange rate exposure arising from the currencymismatch between our revenues in U.S. dollars and our disbursements and investments in reais. Thosetransactions were designated as cash flow hedges.
Notional value at Fair value atDecember 31, December 31,Average Final
Flow 2011 2010 Index rate maturity 2011 2010
(million) (US$ million)Receivable . . . . . . . . . . . . . . . . R$ 820 R$ 880 Fixed 6.2% 2011 427 522Payable . . . . . . . . . . . . . . . . . . US$450 US$510 USD 0% (440) (500)
Total . . . . . . . . . . . . . . . . . . . . (13) 22
Protection program for euro-denominated floating rate debt
We entered into a swap transaction to convert the cash flows from a 2003 euro-denominated loanlinked to EURIBOR (Euro Interbank Offered Rate) to U.S. Dollars linked to LIBOR. In this trade, wereceived floating rates in euros (EURIBOR) and paid floating rates in U.S. dollars (LIBOR). This programended in 2011.
Notional value at Fair value atDecember 31, December 31,Average Final
Flow 2011 2010 Index rate maturity 2011 2010
(million) (US$ million)Receivable . . . . . . . . . . . . . . . . – A 2 EUR – 2011 – 3.2Payable . . . . . . . . . . . . . . . . . . – US$3 USD – – (2.7)
Total . . . . . . . . . . . . . . . . . . . . – 0.5
104

Protection program for euro-denominated fixed rate debt
We entered into a swap transaction to convert cash flows from loans in euros linked to a fixed rate toU.S. dollars linked to a fixed rate. In this swap, we receive fixed rates in euros and pay fixed rates in U.S.dollars. This trade was used to convert the cash flow of a debt denominated in euros, with a notional amountof A750 million that was issued in 2010.
Notional value at Fair value atDecember 31, December 31,Average Final
Flow 2011 2010 Index rate maturity 2011 2010
(million) (US$ million)Receivable . . . . . . . . . . . . . . . . A 500 A 500 EUR 4.375% 2014 723 760Payable . . . . . . . . . . . . . . . . . . US$675 US$675 USD 4.712% (759) (769)
Total . . . . . . . . . . . . . . . . . . . . (36) (9)
Protection program for US$ floating rate debt
Our wholly owned subsidiary Vale Canada entered into a swap to convert U.S. dollar floating ratedebt into U.S dollar fixed rate debt in connection with debt issued in 2004 with a notional amount ofUS$200 million. In this swap, we paid fixed rates in U.S. dollars and received floating rates in LIBOR. Thisprogram ended in 2011.
Notional value at Fair value atDecember 31, December 31,Average Final
Flow 2011 2010 Index rate maturity 2011 2010
(million) (US$ million)Receivable . . . . . . . . . . . . . . . . – US$100 USD – 2011 – 100Payable . . . . . . . . . . . . . . . . . . USD – – (104)
Total . . . . . . . . . . . . . . . . . . . . – (4)
Protection program for interest rates
In the fourth quarter of 2011, we entered into a forward transaction relating to 10-year U.S. treasurynotes in order to help protect against certain insurance debt costs that are indexed to this rate.
Notional value at Fair value atDecember 31, December 31,Average Final
Flow 2011 2010 Buy/Sell rate maturity 2011 2010
(million) (US$ million)Forward . . . . . . . . . . . . . . . . . . US$900 – Buy 1.9423% 2012 (5.3) –
105

Foreign exchange protection program for fixed price coal sales
In order to reduce cash flow volatility associated with a fixed price coal contract, we entered into anAustralian dollar forward purchase contract to equalize production cost and revenue currencies exposure. Thisprogram ended in 2011.
Notional value at Fair value atDecember 31, December 31,Average rate Final
Flow 2011 2010 Buy/Sell (AUD/USD) maturity 2011 2010
(million) (US$ million)Forward . . . . . . . . . . . . . – AUD$7 Buy – 2011 – 2
Protection program for cash investment yield exposure
In order to link the returns of part of the cash invested on the Brazilian market to U.S. dollar yield,we entered into a swap transaction to convert real-denominated cash investments in CDI to a fixed rate inU.S. dollars. In these swaps, we received U.S. dollars at fixed rates and paid reais linked to CDI. Thisprogram ended in December 2011.
Foreign exchange protection program for Vale’s bid offer for assets in the African copperbelt
In order to reduce the volatility of South African rands on the value of a bid, denominated in U.S.dollars, we had placed for assets in the African copperbelt, we entered into rand-denominated forwardpurchase transactions in April 2011. On July 2011, we terminated our offer to purchase these assets. Thetransactions relative to this program were settled on July 2011.
Foreign exchange protection program for cash flow
In order to hedge cash flow volatility, we entered into a swap transaction to convert part of our cashflow linked to reais to a fixed rate in U.S. dollars. In those swaps, Vale paid fixed rates in U.S. dollars andreceived fixed rates in reais. This program ended in December 2011.
Product price and input cost risk
We are also exposed to market risks associated with commodity price volatility. In line with our riskmanagement policy, we also employ risk mitigation strategies, including forward transactions, futures contractsand zero-cost collars, to mitigate against the effects of commodity price volatility on our cash flows.
Nickel sales hedging program
In order to reduce cash flow volatility in 2011 and 2012, we entered into forward-sale transactions thatwere accounted for as cash flow hedges. These transactions fixed the prices of part of the sales in the period.
Notional amount at Fair value atDecember 31, December 31,Average strike Final
Flow 2011 2010 Buy/Sell (USD/ton) maturity 2011 2010
(ton) (US$ million)Forward . . . . . . . . . . . . . . . . . . . 19,998 18,750 Sell 25,027 2012 125 (52)
Nickel fixed price program
We entered into derivatives in connection with fixed price nickel sales contracts to preserve exposureto nickel price fluctuations. These transactions are intended to achieve a minimum price equal to the averageLME price on the date of product delivery. These transactions normally involve buying nickel forwards(over-the-counter) or futures (exchange traded) contracts and are usually settled on the settlement dates of
106

the related commercial contracts. We also have contracts subject to margin calls for some nickel tradesexecuted by Vale Canada, but the total cash amount as of December 2011 was not material. Whenever the‘‘Nickel sales hedging program’’, described above, is executed, this program is interrupted.
Notional amount at Fair value atDecember 31, December 31,Average strike Final
Flow 2011 2010 Buy/Sell (USD/ton) maturity 2011 2010
(ton) (US$ million)Nickel futures . . . . . . . . . . . . . . . . 162 2,172 Buy 21,346 2012 (0.4) 13
Nickel purchase protection program
In order to reduce cash flow volatility and eliminate the mismatch between the pricing of purchasednickel (concentrate, cathode, sinter and other) and the pricing of the final product sold to our customers, weentered into hedging transactions. The items purchased are raw materials utilized to produce refined nickel.The transactions are usually implemented by the sale of nickel forward or future contracts at LME orover-the-counter operations.
Notional amount at Fair value atDecember 31, December 31,Average strike Final
Flow 2011 2010 Buy/Sell (USD/ton) maturity 2011 2010
(ton) (US$ million)Nickel futures . . . . . . . . . . . . . . . . 228 108 Sell 18,744 2012 0.03 (0.2)
Bunker oil purchase protection program
In order to reduce the impact of bunker oil price fluctuation on our freight costs, we have enteredinto bunker oil derivatives, usually through forward purchases and swaps. We had no open positions onDecember 31, 2011.
Notional amount at Fair value atAverage strikeDecember 31, December 31,(USD/metric FinalFlow 2011 2010 Buy/Sell ton) maturity 2011 2010
(metric ton) (US$ million)Forward . . . . . . . . . . . . . . . . . . . – 240,000 Buy – 2011 – 11
Copper scrap purchase protection program
This program was implemented in order to reduce cash flow volatility due to the quotation periodmismatch between the pricing period of copper scrap purchase and the pricing period of sale of final productsto customers. Copper scrap, combined with other raw materials or inputs, is used to produce copper by ValeCanada, our wholly owned subsidiary. This program usually is implemented by the sale of forwards or futureson the LME or over-the-counter operations.
Notional amount at Fair value atDecember 31, December 31,Average strike Final
Flow 2011 2010 Buy/Sell (USD/lbs) maturity 2011 2010
(lbs) (US$ million)Forward . . . . . . . . . . . . . . . . . . . 892,869 386,675 Sell 3.5 2012 0.1 (0.3)
Embedded derivatives—raw material and intermediate products purchase
Our cash flow is also exposed to various market risks associated with certain of our contracts thatcontain embedded derivatives or behave as derivatives. These derivatives may be embedded in, but are notlimited to, commercial contracts, purchase agreements, leases, bonds, insurance policies and loans.
107

Our wholly owned subsidiary Vale Canada has nickel concentrate and raw materials purchaseagreements, in which there are provisions tied to the movement of nickel and copper prices, which function asembedded derivatives.
Notional amount at Fair value atDecember 31, December 31,Average strike Final
Flow 2011 2010 Buy/Sell (USD/ton) maturity 2011 2010
(ton) (US$ million)Nickel forwards . . . . . . . . . . . . . . . 1,951 1,960 Sell 18,337 2012 (0.36) (1.0)Copper forwards . . . . . . . . . . . . . . 6,653 6,389 7,495 0.48 (3.2)
Total . . . . . . . . . . . . . . . . . . . . . 0.12 (4.2)
Credit risk
Commercial credit risk management
We are exposed to credit risk arising from trade receivables, derivative transactions, paymentguarantees and cash investments. Our credit risk management process provides a framework for assessing andmanaging counterparties’ credit risk and for maintaining our risk at an acceptable level. In order to protectagainst commercial credit exposure, our Board of Executive Officers sets annually global credit risk limits andworking capital limits, both monitored on a monthly basis, and the risk management department approvescredit risk limits for each counterparty.
We assign an internal credit rating to each counterparty using our own quantitative methodology forcredit risk analysis, which is based on market prices, external credit ratings and financial information of thecounterparty, as well as qualitative information regarding the counterparty’s strategic position and history ofcommercial relations.
Based on the counterparty’s credit risk, or based on our consolidated credit risk profile, risk mitigationstrategies may be used to minimize credit risk in order to meet the risk level approved by the Board ofExecutive Officers. The main credit risk mitigation strategies include credit risk insurance, mortgages, lettersof credit and corporate guarantees, among others.
From a geographic standpoint, we have a well-diversified accounts receivable portfolio, with China,Europe, Brazil and Japan the regions with most significant exposure. According to each region, differentguarantees can be used to enhance the credit quality of the receivables. Each counterparty position in theportfolio is periodically monitored and we automatically block additional sales to customers in delinquency.
Treasury credit risk management
To manage the credit exposure arising from cash investments and derivative instruments, ourExecutive Board approves, on an annual basis, credit limits by counterparty. Furthermore, the riskmanagement department controls our portfolio diversification, the aggregate exposure related to counterpartycredit spread volatility and the overall credit risk of the treasury portfolio. All positions are monitored dailyand are reported monthly to the Executive Risk Management Committee and to the Board of ExecutiveOfficers.
To calculate the exposure we face to a counterparty that has entered into several derivativetransactions with us, we consider the aggregate exposure of each derivative transaction executed with thiscounterparty. We also assess the creditworthiness of its counterparties in treasury operations, employing aninternal methodology similar to that used for commercial credit risk management, which aims to define adefault probability for each counterparty based on market prices, credit ratings and the counterparty’sfinancial information.
108

Our credit risk management processes provide a framework for assessing and managing counterpartycredit risk and for maintaining our risk at an acceptable level. The Executive Risk Management Committeeanalyzes and recommends to the Board of Executive Officers the maximum credit risk exposure to tradereceivables and the maximum credit risk exposure to financial institutions that are acceptable at both thecounterparty and at the portfolio level.
Operational risk
Operational risk management is the structured approach we take to manage uncertainty related toinadequate or failed internal processes, people and systems and to external events.
We mitigate operational risk with new controls and improvement of existing ones, with transfer of riskthrough insurance and establishment of financial provisions. As a result, the Company seeks to have a clearview of its major risks, the best cost-benefit mitigation plans it must invest in and the controls in place tomonitor the impact of operational risk closely and to efficiently allocate capital to reduce it.
More specifically, our operational risk management involves a consistent and systematic process toassess and manage risks that could prevent the Company from reaching its business objectives. The mostimportant events are analyzed to understand the causes and respective controls that can prevent the eventand/or respond and recover from the event. Standard risk measures such as the Most Foreseeable Loss andthe Residual Risk, both based on Vale’s Risk Matrix, are part of the risk management process, which enablesconsistent discussions by our management regarding whether additional resources are required to lower risklevels. The most significant risks identified in the process are reported to the Executive Risk ManagementCommittee where decisions are made and action plans approved to further reduce risks where necessary.
109

III. SHARE OWNERSHIP AND TRADING
MAJOR SHAREHOLDERS
Valepar is Vale’s controlling shareholder. Valepar is a special-purpose company organized under thelaws of Brazil that was incorporated for the sole purpose of holding an interest in Vale. Valepar does not haveany other business activity. Valepar acquired its controlling stake in Vale from the Brazilian government in1997 as part of the first stage of Vale’s privatization.
The following table sets forth information regarding ownership of Vale shares as of March 31, 2012 bythe shareholders we know beneficially own more than 5% of any class of our outstanding capital stock, and byour directors and executive officers as a group.
Common shares owned % of class Preferred shares owned % of class
Valepar(1) . . . . . . . . . . . 1,716,435,045 52.7% 20,340,000 1.0%BNDESPAR(2) . . . . . . . . 218,386,481 6.7% 69,432,771 3.3%Aberdeen Asset Managers
Limited(3) . . . . . . . . . 1,257,000 Less than 1.0% 105,832,561 5.0%Directors and executive
officers as a group . . . . 54,344 Less than 1.0% 931,154 Less than 1.0%
(1) See the following tables for information about Valepar’s shareholders.(2) BNDESPAR is a wholly owned subsidiary of BNDES. The figures do not include common shares beneficially (as opposed to directly)
owned by BNDESPAR.(3) Based on a reported beneficial ownership dated March 23, 2012. Aberdeen Asset Managers Limited is a subsidiary of Aberdeen Asset
Management plc.
The Brazilian government also owns 12 golden shares of Vale, which give it veto powers over certainactions, such as changes to our name, the location of our headquarters and our corporate purpose as itrelates to mining activities.
The table below set forth information regarding ownership of Valepar common shares as of March 31,2012.
Common shares owned % of class
Valepar shareholdersLitel Participacoes S.A.(1) . . . . . . . . . . . . . . . . . . . . . . . . . . . . . . . . . . . . . . 637,443,857 49.00%Eletron S.A.(2) . . . . . . . . . . . . . . . . . . . . . . . . . . . . . . . . . . . . . . . . . . . . 380,708 0.03Bradespar S.A.(3) . . . . . . . . . . . . . . . . . . . . . . . . . . . . . . . . . . . . . . . . . . . 275,965,821 21.21Mitsui(4) . . . . . . . . . . . . . . . . . . . . . . . . . . . . . . . . . . . . . . . . . . . . . . . . 237,328,059 18.24BNDESPAR(5) . . . . . . . . . . . . . . . . . . . . . . . . . . . . . . . . . . . . . . . . . . . . 149,787,385 11.51
Total . . . . . . . . . . . . . . . . . . . . . . . . . . . . . . . . . . . . . . . . . . . . . . . . . 1,300,905,830 100.00%
(1) Litel owns 200,864,272 preferred class A shares of Valepar, which represents 71.41% of the preferred class A shares. LitelA, an affiliateof Litel, owns 80,416,931 preferred class A shares of Valepar, which represents 28.59% of the preferred class A shares. LitelB, also anaffiliate of Litel, owns 21,932,068 preferred class C shares of Valepar, which represents 29.25% of the preferred class C shares.
(2) Eletron owns 27,755 preferred class C shares of Valepar, which represents 0.04% of the preferred class C shares.(3) Bradespar is controlled by a control group consisting of Cidade de Deus—Cia. Comercial Participacoes, Fundacao Bradesco, NCF
Participacoes S.A. and Nova Cidade de Deus Participacoes S.A. Bradespar owns 12,532,065 preferred class C shares of Valepar, whichrepresents 16.71% of the preferred class C shares. Brumado Holdings Ltda., a subsidiary of Bradespar, owns 7,587,000 preferredclass A shares of Valepar, which represents 10.12% of the class.
(4) Mitsui owns 17,302,209 preferred class C shares of Valepar, which represents 23.08% of the preferred class C shares.(5) BNDESPAR owns 15,598,969 preferred class C shares of Valepar, which represents 20.80% of the preferred class C shares.
110

The table below sets forth information regarding ownership of Litel Participacoes S.A., one ofValepar’s shareholders, as of March 31, 2012.
Common shares owned % of class
Litel Participacoes S.A. shareholders(1)
BB Carteira Ativa . . . . . . . . . . . . . . . . . . . . . . . . . . . . . . . . . . . . . . . . . . . 193,740,121 78.40%
Carteira Ativa II . . . . . . . . . . . . . . . . . . . . . . . . . . . . . . . . . . . . . . . . . . . 53,387,982 21.60
Caixa de Previdencia dos Funcionarios do Banco do Brasil . . . . . . . . . . . . . . . . . . . 19 –
Others . . . . . . . . . . . . . . . . . . . . . . . . . . . . . . . . . . . . . . . . . . . . . . . . . 219 –
Directors and executive officers as a group . . . . . . . . . . . . . . . . . . . . . . . . . . . . 4 –
Total . . . . . . . . . . . . . . . . . . . . . . . . . . . . . . . . . . . . . . . . . . . . . . . . . 247,128,345 100.00%
(1) Each of BB Carteira Ativa and Carteira Ativa II is a Brazilian investment fund. BB Carteira Ativa is 100.00% owned by Caixa dePrevidencia dos Funcionarios do Banco do Brasil (‘‘Previ’’). Carteira Ativa II is 59.36% owned by Funcef, 35.81% owned by Petros and4.84% owned by Fundacao Cesp. Each of Previ, Petros, Funcef and Fundacao Cesp is a Brazilian pension fund.
The shareholders of Valepar are parties to a shareholders’ agreement, ending in 2017. The Valeparshareholders’ agreement also:
� grants rights of first refusal on any transfer of Valepar shares and preemptive rights on any newissue of Valepar shares;
� prohibits the direct acquisition of Vale shares by Valepar’s shareholders unless authorized by theother shareholders party to the agreement;
� prohibits encumbrances on Valepar shares (other than in connection with financing an acquisitionof Vale shares);
� requires each party generally to retain control of its special purpose company holding its interestin shares of Valepar, unless the rights of first refusal previously mentioned are observed;
� allocates seats on Valepar’s and Vale’s boards among representatives of the parties;
� commits the Valepar shareholders to support a Vale dividend policy of distributing 50% of Vale’snet profit for each fiscal year, unless the Valepar shareholders commit to support a differentdividend policy for a given year;
� provides for the maintenance by Vale of a capital structure that does not exceed specified debt toequity thresholds;
� requires the Valepar shareholders to vote their indirectly held Vale shares and to cause theirrepresentatives on Vale’s Board of Directors to vote only in accordance with decisions made atValepar meetings held prior to meetings of Vale’s Board of Directors or shareholders; and
� establishes supermajority voting requirements for certain significant actions relating to Valeparand to Vale.
Pursuant to the Valepar shareholders’ agreement, Valepar cannot support any of the following actionswith respect to Vale without the consent of at least 75% of the holders of Valepar’s common shares:
� any amendment of Vale’s bylaws;
111
� any increase of Vale’s capital stock by share subscription, creation of a new class of shares,change in the characteristics of the existing shares or any reduction of Vale’s capital stock;
� any issuance of debentures of Vale, whether or not convertible into shares of Vale, participationcertificates upon compensation (partes beneficiarias), call options (bonus de subscricao) or anyother security of Vale;
� any determination of issuance price for any new shares of capital stock or other security of Vale;
� any amalgamation, spin-off or merger to which Vale is a party, as well as any change to Vale’scorporate form;
� any dissolution, receivership, bankruptcy or any other voluntary act for financial reorganization orany suspension thereof;
� the election and replacement of Vale’s Board of Directors, including the Chairman of the Board,and any executive officer of Vale;
� the disposal or acquisition by Vale of an equity interest in any company, as well as the acquisitionof any shares of capital stock of Vale or Valepar;
� the participation by Vale in a group of companies or in a consortium of any kind;
� the execution by Vale of agreements relating to distribution, investment, sales exportation,technology transfer, trademark license, patent exploration, license to use and leases;
� the approval and amendment of Vale’s business plan;
� the determination of the compensation of the executive officers and directors of Vale, as well asthe duties of the Board of Directors and the Board of Executive Officers;
� any profit sharing among the members of the Board of Directors or Board of Executive Officersof Vale;
� any change in the corporate purpose of Vale;
� the distribution or non-distribution of any dividends (including distributions classified as intereston shareholders’ equity) on any shares of capital stock of Vale other than as provided in Vale’sbylaws;
� the appointment and replacement of Vale’s independent auditor;
� the creation of any ‘‘in rem’’ guarantee, granting of guarantees including rendering of sureties byVale with respect to obligations of any unrelated party, including any affiliates or subsidiaries;
� the passing of any resolution on any matter which, pursuant to applicable law, entitles ashareholder to withdrawal rights;
� the appointment and replacement by the Board of Directors of any representative of Vale insubsidiaries, companies related to Vale or other companies in which Vale is entitled to appointdirectors and officers; and
� any change in the debt to equity threshold, as defined in the shareholders’ agreement.
112

In addition, the shareholders’ agreement provides that any issuance of participation certificates byVale and any disposition by Valepar of Vale shares requires the unanimous consent of all of Valepar’sshareholders.
RELATED PARTY TRANSACTIONS
We have arm’s-length commercial relationships in the ordinary course of our business with Mitsui, ashareholder of Valepar (our controlling shareholder) and we have arm’s-length financial relationships in theordinary course of our business with Bradesco, which is controlled by the same controlling group asBradespar, also a shareholder of Valepar.
BNDES is the parent company of one of our major shareholders, BNDESPAR. We and BNDES, theBrazilian state-owned development bank, are parties to a contract relating to authorizations for miningexploration. This contract, which we refer to as the Mineral Risk Contract, provides for the joint developmentof certain unexplored mineral deposits that form part of our Northern System (Carajas), as well asproportional participation in any profits earned from the development of such resources. Iron ore andmanganese ore deposits already identified at the time we entered into the Mineral Risk Contract (in March1997) were specifically excluded from the contract. In 2007, the Mineral Risk Contract was extendedindefinitely, with specific rules for all exploration projects and exploration targets and mineral rights coveredunder the contract. In addition, BNDES has provided us with a R$7.3 billion, or US$4.3 billion, credit facilityto help us finance our investment programs; BNDES holds a total of R$679.4 million, or US$363.6 million, indebentures of our subsidiary Salobo Metais S.A. with a subscription right, subject to certain conditions, forSalobo’s preferred shares in exchange for such debentures; and its subsidiary BNDESPAR holds a total ofR$1.406 billion, or US$816 million, in debentures, exchangeable into FNS shares, that were issued to financethe expansion of the FNS railroad. BNDES has also participated in certain of our other financingarrangements. For more information on our transactions with BNDES, see Operating and financial review andprospects—Liquidity and capital resources.
For information regarding investments in affiliated companies and joint ventures and for informationregarding transactions with major related parties, see Notes 14 and 24 to our consolidated financialstatements.
DISTRIBUTIONS
Under our dividend policy, our Board of Executive Officers announces, by no later than January 31 ofeach year, a proposal to be approved by our Board of Directors of a minimum amount, expressed in U.S.dollars, that will be distributed in that year to our shareholders. Distributions may be classified either asdividends or interest on shareholders’ equity, and references to ‘‘dividends’’ should be understood to includeall distributions regardless of their classification, unless stated otherwise. We determine the minimum dividendpayment in U.S. dollars, considering our expected free cash flow generation in the year of distribution. Theproposal establishes two installments, to be paid in April and October of each year. Each installment issubmitted to the Board of Directors for approval at meetings in April and October. Once approved, dividendsare converted into and paid in reais at the Brazilian real/U.S. dollar exchange rates announced by the CentralBank of Brazil on the last business day before the Board meetings in April and October of each year. TheBoard of Executive Officers can also propose to the Board of Directors, depending on the evolution of ourcash flow performance, an additional payment to shareholders of an amount over and above the minimumdividend initially established.
For 2012, our Board of Executive Officers has proposed a minimum dividend of US$6.0 billion. Wepay the same amount per share on both common and preferred shares in accordance with our bylaws. Thisdividend is payable in two equal installments in April and October 2012. The first installment of this dividend,in the amount of US$3.0 billion, will be paid on April 30, 2012.
113

Under Brazilian law and our bylaws, we are required to distribute to our shareholders an annualamount equal to not less than 25% of the distributable amount, referred to as the mandatory dividend, unlessthe Board of Directors advises our shareholders at our shareholders’ meeting that payment of the mandatorydividend for the preceding year is inadvisable in light of our financial condition. For a discussion of dividenddistribution provisions under Brazilian corporate law and our bylaws, see Additional information.
Distributions classified as dividends which are paid to ADR and HDR holders and to non-residentshareholders will not be subject to Brazilian withholding tax, except that a distribution from profits generatedprior to December 31, 1995 will be subject to Brazilian withholding tax at varying rates. Distributionsclassified as interest on shareholders’ equity which are paid to ADR and HDR holders and to non-residentshareholders are currently subject to Brazilian withholding tax. See Additional information—Taxation—Brazilian tax considerations.
By law, we are required to hold an annual shareholders’ meeting by April 30 of each year at which anannual dividend may be declared. Additionally, our Board of Directors may declare interim dividends. UnderBrazilian corporate law, dividends are generally required to be paid to the holder of record on a dividenddeclaration date within 60 days following the date the dividend was declared, unless a shareholders’ resolutionsets forth another date of payment, which, in either case, must occur prior to the end of the fiscal year inwhich the dividend was declared. A shareholder has a three-year period from the dividend payment date toclaim dividends (or payments of interest on shareholders’ equity) in respect of its shares, after which we willhave no liability for such payments. From 1997 to 2003, all distributions took the form of interest onshareholders’ equity. In many years, part of the distribution has been made in the form of interest onshareholders’ equity and part as dividends. See Additional information—Memorandum and articles ofassociation—Common shares and preferred shares.
We make cash distributions on the common shares and preferred shares underlying the ADSs in reaisto the custodian on behalf of the depositary. The custodian then converts such proceeds into U.S. dollars andtransfers such U.S. dollars to be delivered to the depositary for distribution to holders of ADRs and HDRs,net of the depositary’s fees. For information on taxation of dividend distributions, see Additionalinformation—Taxation—Brazilian tax considerations.
The following table sets forth the cash distributions we paid to holders of common shares andpreferred shares for the periods indicated. Amounts have been restated to give effect to stock splits that wecarried out in subsequent periods. We have calculated U.S. dollar conversions using the commercial sellingrate in effect on the date of payment. Amounts are stated before any applicable withholding tax.
Reais per share U.S. dollars per share atYear Payment date Dividends Interest on equity Total payment date
2005 . . . . . . . . . . . . . . . . . . . April 29 0.28 – 0.28 0.11
October 31 0.22 0.17 0.39 0.18
2006 . . . . . . . . . . . . . . . . . . . April 28 0.12 0.17 0.29 0.14
October 31 0.01 0.28 0.29 0.14
2007 . . . . . . . . . . . . . . . . . . . April 30 0.22 0.13 0.35 0.17
October 31 0.01 0.38 0.39 0.22
2008 . . . . . . . . . . . . . . . . . . . April 30 0.20 0.24 0.44 0.26
October 31 0.14 0.51 0.65 0.30
2009 . . . . . . . . . . . . . . . . . . . April 30 0.52 – 0.52 0.24
October 30 – 0.49 0.49 0.29
2010 . . . . . . . . . . . . . . . . . . . April 30 – 0.42 0.42 0.24
October 31 – 0.56 0.56 0.34
2011 . . . . . . . . . . . . . . . . . . . January 31 – 0.32 0.32 0.19
April 29 – 0.61 0.61 0.38
August 26 0.93 – 0.93 0.58
October 31 0.39 0.63 1.02 0.58
114
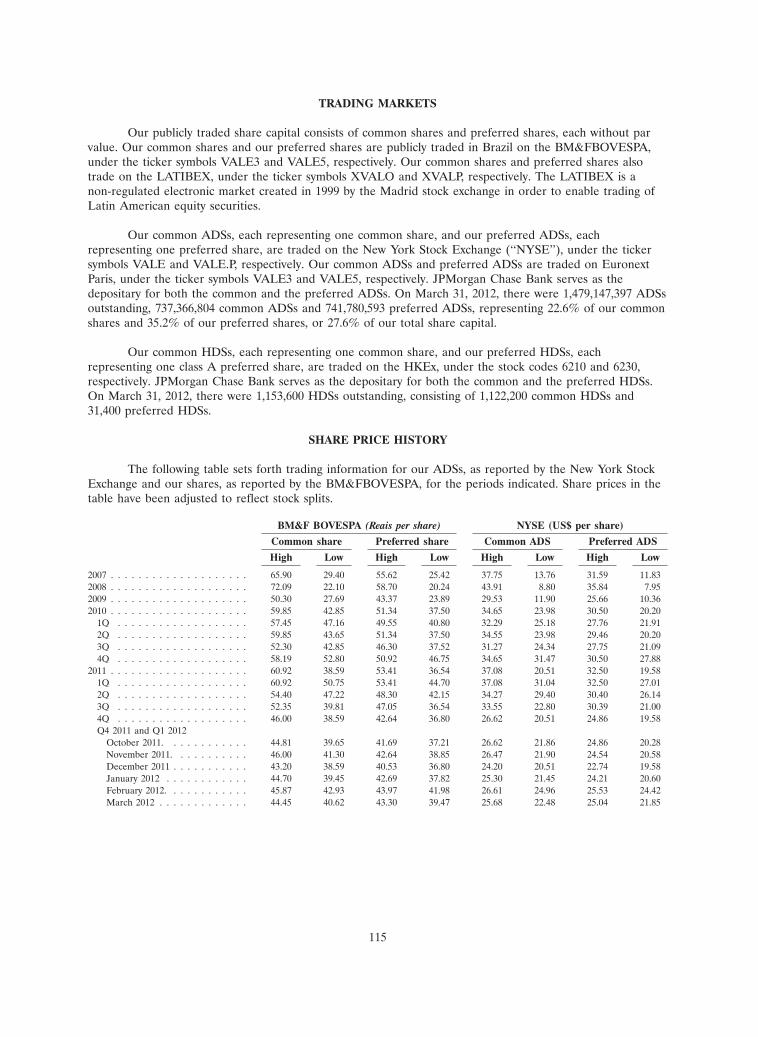
TRADING MARKETS
Our publicly traded share capital consists of common shares and preferred shares, each without parvalue. Our common shares and our preferred shares are publicly traded in Brazil on the BM&FBOVESPA,under the ticker symbols VALE3 and VALE5, respectively. Our common shares and preferred shares alsotrade on the LATIBEX, under the ticker symbols XVALO and XVALP, respectively. The LATIBEX is anon-regulated electronic market created in 1999 by the Madrid stock exchange in order to enable trading ofLatin American equity securities.
Our common ADSs, each representing one common share, and our preferred ADSs, eachrepresenting one preferred share, are traded on the New York Stock Exchange (‘‘NYSE’’), under the tickersymbols VALE and VALE.P, respectively. Our common ADSs and preferred ADSs are traded on EuronextParis, under the ticker symbols VALE3 and VALE5, respectively. JPMorgan Chase Bank serves as thedepositary for both the common and the preferred ADSs. On March 31, 2012, there were 1,479,147,397 ADSsoutstanding, 737,366,804 common ADSs and 741,780,593 preferred ADSs, representing 22.6% of our commonshares and 35.2% of our preferred shares, or 27.6% of our total share capital.
Our common HDSs, each representing one common share, and our preferred HDSs, eachrepresenting one class A preferred share, are traded on the HKEx, under the stock codes 6210 and 6230,respectively. JPMorgan Chase Bank serves as the depositary for both the common and the preferred HDSs.On March 31, 2012, there were 1,153,600 HDSs outstanding, consisting of 1,122,200 common HDSs and31,400 preferred HDSs.
SHARE PRICE HISTORY
The following table sets forth trading information for our ADSs, as reported by the New York StockExchange and our shares, as reported by the BM&FBOVESPA, for the periods indicated. Share prices in thetable have been adjusted to reflect stock splits.
BM&F BOVESPA (Reais per share) NYSE (US$ per share)
Common share Preferred share Common ADS Preferred ADS
High Low High Low High Low High Low
2007 . . . . . . . . . . . . . . . . . . . . 65.90 29.40 55.62 25.42 37.75 13.76 31.59 11.832008 . . . . . . . . . . . . . . . . . . . . 72.09 22.10 58.70 20.24 43.91 8.80 35.84 7.952009 . . . . . . . . . . . . . . . . . . . . 50.30 27.69 43.37 23.89 29.53 11.90 25.66 10.362010 . . . . . . . . . . . . . . . . . . . . 59.85 42.85 51.34 37.50 34.65 23.98 30.50 20.20
1Q . . . . . . . . . . . . . . . . . . . 57.45 47.16 49.55 40.80 32.29 25.18 27.76 21.912Q . . . . . . . . . . . . . . . . . . . 59.85 43.65 51.34 37.50 34.55 23.98 29.46 20.203Q . . . . . . . . . . . . . . . . . . . 52.30 42.85 46.30 37.52 31.27 24.34 27.75 21.094Q . . . . . . . . . . . . . . . . . . . 58.19 52.80 50.92 46.75 34.65 31.47 30.50 27.88
2011 . . . . . . . . . . . . . . . . . . . . 60.92 38.59 53.41 36.54 37.08 20.51 32.50 19.581Q . . . . . . . . . . . . . . . . . . . 60.92 50.75 53.41 44.70 37.08 31.04 32.50 27.012Q . . . . . . . . . . . . . . . . . . . 54.40 47.22 48.30 42.15 34.27 29.40 30.40 26.143Q . . . . . . . . . . . . . . . . . . . 52.35 39.81 47.05 36.54 33.55 22.80 30.39 21.004Q . . . . . . . . . . . . . . . . . . . 46.00 38.59 42.64 36.80 26.62 20.51 24.86 19.58Q4 2011 and Q1 2012
October 2011. . . . . . . . . . . . 44.81 39.65 41.69 37.21 26.62 21.86 24.86 20.28November 2011. . . . . . . . . . . 46.00 41.30 42.64 38.85 26.47 21.90 24.54 20.58December 2011 . . . . . . . . . . . 43.20 38.59 40.53 36.80 24.20 20.51 22.74 19.58January 2012 . . . . . . . . . . . . 44.70 39.45 42.69 37.82 25.30 21.45 24.21 20.60February 2012. . . . . . . . . . . . 45.87 42.93 43.97 41.98 26.61 24.96 25.53 24.42March 2012 . . . . . . . . . . . . . 44.45 40.62 43.30 39.47 25.68 22.48 25.04 21.85
115

DEPOSITARY SHARES
JPMorgan Chase Bank serves as the depositary for our ADSs and HDSs. ADR holders and HDRholders are required to pay various fees to the depositary, and the depositary may refuse to provide anyservice for which a fee is assessed until the applicable fee has been paid.
ADR holders and HDR holders are required to pay the depositary amounts in respect of expensesincurred by the depositary or its agents on behalf of ADR holders and HDR holders, including expensesarising from compliance with applicable law, taxes or other governmental charges, facsimile transmission orconversion of foreign currency into U.S. or Hong Kong dollars. In this case, the depositary may decide in itssole discretion to seek payment by either billing holders or by deducting the fee from one or more cashdividends or other cash distributions. The depositary may recover any unpaid taxes or other governmentalcharges owed by an ADR holder or HDR holder by billing such holder, by deducting the fee from one ormore cash dividends or other cash distributions, or by selling underlying shares after reasonable attempts tonotify the holder, with the holder liable for any remaining deficiency.
ADR holders are also required to pay additional fees for certain services provided by the depositary,as set forth in the table below.
Depositary service Fee payable by ADR holders
Issuance, cancellation and delivery of ADRs, including in connection with sharedistributions, stock splits . . . . . . . . . . . . . . . . . . . . . . . . . . . . . . . . . . . . US$5.00 or less per 100 ADSs (or portion
thereof)
Distribution of dividends . . . . . . . . . . . . . . . . . . . . . . . . . . . . . . . . . . . . . US$0.02 or less per ADS
Withdrawal of shares underlying ADSs . . . . . . . . . . . . . . . . . . . . . . . . . . . . . US$5.00 or less per 100 ADSs (or portionthereof)
Transfers, combining or grouping of ADRs . . . . . . . . . . . . . . . . . . . . . . . . . . US$1.50 or less per ADS
HDR holders are also required to pay additional fees for certain services provided by the depositary,as set forth in the table below.
Depositary service Fee payable by HDR holders
Issuance, cancellation and delivery of HDRs, including in connection with sharedistributions, stock splits . . . . . . . . . . . . . . . . . . . . . . . . . . . . . . . . . . . . HK$0.40 or less per HDS (or portion thereof)
Distribution of dividends and other cash distributions . . . . . . . . . . . . . . . . . . . . HK$0.40 or less per HDS
Transfer of certificated or direct registration HDRs . . . . . . . . . . . . . . . . . . . . . HK$2.50 or less per HDS
Administration fee assessed annually . . . . . . . . . . . . . . . . . . . . . . . . . . . . . . HK$0.40 or less per HDS (or portion thereof)
The depositary reimburses us for certain expenses we incur in connection with the ADR and HDRprograms, subject to a ceiling agreed between us and the depositary from time to time. These reimbursableexpenses currently include legal and accounting fees, listing fees, investor relations expenses and fees payableto service providers for the distribution of material to ADR holders and HDR holders. For the year endedDecember 31, 2011, the depositary reimbursed us US$19 million in connection with the ADR and HDRprograms.
116

PURCHASES OF EQUITY SECURITIES BY THE ISSUER AND AFFILIATED PURCHASERS
On November 25, 2011, we announced the completion of the US$3 billion share repurchase programapproved by the Board of Directors on June 30, 2011. Vale acquired 39,536,080 common shares, at an averageprice of US$26.25 per share, and 81,451,900 preferred shares, at an average price of US$24.09 per share(including shares of each class in the form of American Depositary Receipts), for a total aggregate purchaseprice of US$3.0 billion. The repurchased shares represent 3.10% of the free float of common shares, and4.24% of the free float of preferred shares, outstanding before the launching of the program. The sharesacquired will be held in treasury for cancellation. See Note 17 to our consolidated financial statements forfurther information.
The results of our share repurchase program for 2011 are set forth below.
Total number of Maximum number (orshares (or units) approximate US$ value)
Total number of Average price Minimum price Maximum price purchased as part of of shares (or units) thatshares (or units) paid per share paid per share paid per share publicly announced may yet be purchased
Period purchased (or units) (US$) (or units) (US$) (or units) (US$) plans or programs under the program
Common sharesAugust 2011 . . . . 13,737,500 27.32 25.60 31.98 13,737,500 –September 2011 . . 12,251,380 26.37 23.27 27.98 12,251,380 –November 2011 . . 13,547,200 25.04 22.40 26.18 13,547,200 –
Total . . . . . . . 39,536,080 26.25 22.40 31.98 39,536,080 –
Preferred sharesAugust 2011 . . . . 27,425,300 24.81 23.48 29.10 27,425,300 –September 2011 . . 25,680,600 24.20 21.60 25.47 25,680,600 –November 2011 . . 28,346,000 23.30 21.03 24.34 28,346,000 –
Total . . . . . . . 81,451,900 24.09 21.03 29.10 81,451,900 –
On October 11, 2010, we completed a US$2 billion share repurchase program under which weacquired 21,682,700 common shares, at an average price of US$31.31 per share, and 48,197,700 preferredshares, at an average price of US$27.40 per share, corresponding respectively to 1.67% and 2.45% of the freefloat of each class at the outset of the program.
On May 29, 2009, we terminated a US$762 million share repurchase program under which weacquired 18,415,859 common shares, at an average price of US$12.35 per share, and 47,284,800 preferredclass A shares, at an average price of US$11.31 per share, corresponding respectively to 1.5% and 2.4% of theoutstanding shares of each class on the date the program was launched.
117

IV. MANAGEMENT AND EMPLOYEES
MANAGEMENT
Board of Directors
Our Board of Directors sets general guidelines and policies for our business and monitors theimplementation of those guidelines and policies by our executive officers. Our bylaws provide that the Boardof Directors consist of 11 members and 11 alternates, each of whom serves on behalf of a particular director.Each director (and his or her respective alternate) is elected for a two-year term at a general shareholders’meeting, can be re-elected, and is subject to removal at any time.
The Board of Directors holds regularly scheduled meetings on a monthly basis and holds additionalmeetings when called by the chairman, vice-chairman or any two directors. Decisions of the Board ofDirectors require a quorum of a majority of the directors and are taken by majority vote. Alternate directorsmay attend and vote at meetings in the absence of the director for whom the alternate director is acting.
Our bylaws establish the following technical and advisory committees to the Board of Directors.
� The Executive Development Committee is responsible for reporting on general human resourcespolicies, analyzing and reporting on the adequacy of compensation levels for our executiveofficers, proposing and updating guidelines for evaluating the performance of our executiveofficers and reporting on policies relating to health and safety.
� The Strategy Committee is responsible for reviewing and making recommendations to the Boardof Directors concerning the strategic guidelines and plan submitted annually to the Board by ourexecutive officers, our annual and multi-annual investment budgets, investment or divestitureopportunities submitted by executive officers and mergers and acquisitions.
� The Finance Committee is responsible for reviewing and making recommendations to the Boardof Directors concerning our corporate risks and financial policies and the internal financialcontrol systems, compatibility between the level of distributions to shareholders and theparameters established in the annual budget and the consistency between our general dividendpolicy and capital structure.
� The Accounting Committee is responsible for nominating an employee to be responsible for ourinternal auditing, reporting on auditing policies and the execution of our annual auditing plan,tracking the results of our internal auditing, and identifying, prioritizing, and submittingrecommendations to the executive officers and analyzing and making recommendations withregard to our annual report and financial statements.
� The Governance and Sustainability Committee is responsible for evaluating and recommendingimprovements to the effectiveness of our corporate governance practices and the functioning ofour Board of Directors, recommending improvements to the code of ethical conduct and ourmanagement system in order to avoid conflicts of interests between Vale and its shareholders ormanagement, issuing reports on potential conflicts of interest between Vale and its shareholdersor management and reporting on policies relating to corporate responsibility, such asenvironmental and social responsibility.
Ten of our 11 current directors (and nine of their respective alternates) were appointed by Valepar,our controlling shareholder, pursuant to Valepar’s shareholders’ agreement. One Director and his alternatewere appointed by the employees, pursuant to our bylaws. Non-controlling shareholders holding commonshares representing at least 15% of our voting capital, and preferred shares representing at least 10% of ourtotal share capital, have the right to appoint one member and an alternate to our Board of Directors. Our
118

employees and our non-controlling shareholders each have the right, as a class, to appoint one director andan alternate. All of our current directors were elected or re-elected, as the case may be, at our annualshareholders’ meeting held on April 19, 2011. Their terms will expire in 2013.
The following table lists the current members of the Board of Directors and each director’s alternate.
Year first Year firstDirector(1) elected Alternate director(1) elected
Ricardo Jose da Costa Flores (chairman) . . . . . . . . 2010 Marco Geovanne Tobias da Silva . . . . . . . . . . . . . 2011Mario da Silveira Teixeira Junior (vice-chairman) . . . 2003 Joao Moises de Oliveira . . . . . . . . . . . . . . . . . . 2000Jose Ricardo Sasseron . . . . . . . . . . . . . . . . . . . 2007 Deli Soares Pereira . . . . . . . . . . . . . . . . . . . . 2009Robson Rocha . . . . . . . . . . . . . . . . . . . . . . . 2011 Sandro Kohler Marcondes . . . . . . . . . . . . . . . . 2011Nelson Henrique Barbosa Filho . . . . . . . . . . . . . 2011 Eustaquio Wagner Guimaraes Gomes . . . . . . . . . . 2011Renato da Cruz Gomes . . . . . . . . . . . . . . . . . . 2001 Luiz Carlos de Freitas . . . . . . . . . . . . . . . . . . . 2007Fuminobu Kawashima . . . . . . . . . . . . . . . . . . . 2011 Hajime Tonoki . . . . . . . . . . . . . . . . . . . . . . . 2009Oscar Augusto de Camargo Filho . . . . . . . . . . . . 2003 Eduardo de Oliveira Rodrigues Filho . . . . . . . . . . 2011Luciano Galvao Coutinho . . . . . . . . . . . . . . . . . 2007 Paulo Sergio Moreira da Fonseca . . . . . . . . . . . . 2008Jose Mauro Mettrau Carneiro da Cunha . . . . . . . . 2010 Vacant . . . . . . . . . . . . . . . . . . . . . . . . . . . . –Paulo Soares de Souza(2) . . . . . . . . . . . . . . . . . 2011 Raimundo Nonato Alves Amorim(2) . . . . . . . . . . 2009
(1) Appointed by Valepar and approved at the shareholders’ meeting unless otherwise indicated.(2) Appointed by our employees and approved at the shareholders’ meeting.
Below is a summary of the business experience, activities and areas of expertise of our currentdirectors.
Ricardo Jose da Costa Flores, 48: Chairman of Vale’s Board of Directors since November 2010.
Other current director or officer positions: Chief Executive Officer of Previ, the pension fund of theemployees of Banco do Brasil, since June 2010; Chairman of the Board of Directors, since December 2010;and Chief Executive Officer of Valepar since November 2010.
Professional experience: President of Federacao Nacional de Capitalizacao (‘‘FENACAP’’) andVice-President of Confederacao Nacional das Empresas de Seguros Gerais, Previdencia Privada e Vida, SaudeComplementar e Capitalizacao (‘‘CNSeg’’), both of which are insurance industry trade associations, fromJanuary 2008 to March 2011; Chairman of the Board of Directors of Brasilcap Capitalizacao S.A.(‘‘Brasilcap’’), a financial institution affiliated with Banco do Brasil, from October 2007 to March 2011;Vice-President of the Credit, Accounting and Global Risk Management committee of Banco do Brasil, aBrazilian state-owned and publicly held financial institution, from April 2009 to May 2010, where he alsoserved as the Vice-President of Government Relations from June 2008 to April 2009, as the officerresponsible for insurance, pension plans and capitalization from August 2007 to June 2008 and as the officerresponsible for operational assets restructuring from May 2004 to July 2007; Chairman of the Board ofDirectors of Banco Nossa Caixa S.A. (‘‘Nossa Caixa’’) from January 2009 to November 2009, andAtivos S.A.—Securitizadora de Creditos Financeiros from May 2004 to August 2007; Director ofBrasilveıculos Companhia de Seguros S.A. (‘‘Brasilveıculos’’) from October 2007 to September 2008; Directorof Brasilprev Seguros e Previdencia S.A. (‘‘Brasilprev’’), and Brasilsaude Companhia de Seguros S.A. fromOctober 2007 to August 2008, both private companies engaged in insurance activity; member of the FiscalCouncil of various energy companies, namely, Companhia Energetica do Rio Grande do Norte (‘‘COSERN’’)from April 2006 to January 2008, Companhia Energetica de Pernambuco (‘‘CELPE’’) from March 2004 toMarch 2006, CPFL Geracao de Energia S.A. (‘‘CPFL Geracao’’) and Companhia Paulista de Forca e Luz(‘‘CPFL’’) from April 2006 to January 2008. Mr. Flores was also the Executive Officer of Federacao Brasileirade Bancos (‘‘FEBRABAN’’) from June 2009 to November 2009.
Academic background: Degree in Economics from the Centro de Ensino Unificado de Brasılia(‘‘CEUB’’), Faculdade de Ciencias Economicas, Contabeis e Administracao in Brasılia; post-graduate degreesin Project Analysis from Fundacao Getulio Vargas (‘‘FGV’’) and in Project Development from the Instituto
119
de Planejamento Economico e Social; Executive MBA degree from Universidade de Sao Paulo (‘‘USP’’) andMBA Controller degree from FIPECAFI/USP.
Mario da Silveira Teixeira Junior, 66: Director of Vale since April 2003, Vice-Chairman of Vale’sBoard of Directors since May 2003.
Other current director or officer positions: Vice-Chairman of the Board of Directors of Valepar since2003; Member of the Board of Directors of Banco Bradesco S.A. (‘‘Banco Bradesco’’), a publicly-heldfinancial institution, since 1999; Member of the Board of Directors of Bradespar S.A. (‘‘Bradespar’’), apublicly-held investment holding company; and Member of the Board of Directors of BradescoLeasing S.A.—Arrendamento Mercantil, a subsidiary of Banco Bradesco engaged in the provision of financialleasing operations.
Professional experience: President of Bradespar; Executive Vice-President, Executive Managing Officerand Department Officer at Banco Bradesco; Officer of Bradesco S.A. Corretora de Tıtulos e ValoresMobiliarios, a subsidiary of Banco Bradesco that provides securities brokerage and research services, fromMarch 1983 to January 1984; Executive Vice-President of the Associacao Nacional dos Bancos deInvestimento (‘‘ANBID’’), an association of investment banks; Member of the Board of Directors of theAssociacao Brasileira das Companhias Abertas (‘‘ABRASCA’’), an association of Brazilian publicly heldcompanies; Vice-Chairman of the Board of Directors of BES Investimento do Brasil S.A.—Banco deInvestimento, an investment bank and subsidiary of Banco Espırito Santo, from 2001 to 2007; Member of theBoard of Directors of CSN, a publicly-held steel company, Latasa S.A. (‘‘Latasa’’), now called RexamBeverage Can South America S.A., an aluminum products manufacturer, Sao Paulo Alpargatas S.A., aclothing and sporting goods manufacturer, Tigre S.A.—Tubos e Conexoes, a pipe and construction materialsmanufacturer, Everest Leasing S.A. Arrendamento Mercantil, a leasing company affiliated with BancoBradesco, as well as the electric utility companies CPFL, CPFL Geracao, and Companhia Piratininga deForca e Luz and the electric utility holding companies CPFL Energia S.A. (‘‘CPFL Energia’’) and VBCEnergia S.A.
Academic background: Degree in Civil Engineering and post-graduate degree in BusinessAdministration from Universidade Presbiteriana Mackenzie, Sao Paulo.
Jose Ricardo Sasseron, 56: Director of Vale since April 2007.
Other current director or officer positions: Social Security Officer of Previ since June 2006; Member ofthe Board of Directors of Valepar since April 2007.
Professional experience: Chairman of the Board of Directors of Sauıpe S.A., a private hotel and resortdevelopment and management company, from 2005 to 2007; Member of the Advisory Board of Previ, from2004 to 2006 and Chairman of the Fiscal Council of Previ from 1996 to 1998.
Academic background: Degree in History from USP.
Robson Rocha, 53: Director of Vale since April 2011.
Other current director or officer positions: Vice-President for Human Resources Management andSustainable Development of Banco do Brasil since April 2009.
Professional experience: Vice-Chairman of CPFL Energia from April 2010 to April 2011; Member ofthe Board of Directors of Nossa Caixa from May to November 2009; Officer of Banco do Brasil from May2008 to April 2009.
Academic background: Degree in Business Administration from UNICENTRO—Newton Paiva, BeloHorizonte; post-graduate degree in Strategic Management from Universidade Federal de Minas Gerais
120

(‘‘UFMG’’); Master’s degree in Marketing from Fundacao Ciencias Humanas—Pedro Leopoldo; and an MBAdegree in Finance from Fundacao Dom Cabral.
Nelson Henrique Barbosa Filho, 42: Director of Vale since April 2011.
Other current director or officer positions: Executive Secretary of the Ministry of Finance since 2011;Chairman of the Board of Directors of Banco do Brasil since 2009; Director of Brasilveıculos, an insurancecompany affiliated with Banco do Brasil, since 2011.
Professional experience: Director of Brasilcap from 2010 to 2011; adviser to the Presidency of BNDESfrom 2005 to 2006; Director of EPE—Empresa de Pesquisa Energetica, a state-owned energy researchcompany, from 2007 to 2009; Secretary of Economic Policy of the Ministry of Finance from 2008 to 2010,where he also served as Secretary of Economic Monitoring from 2007 to 2008 and Assistant Secretary forEconomic Policy from 2006 to 2007.
Academic background: Degree and Master’s degree in Economics from Universidade Federal do Riode Janeiro (‘‘UFRJ’’) and a Ph.D. in Economics from New School for Social Research.
Renato da Cruz Gomes, 59: Director of Vale since April 2001.
Other current director or officer positions: Executive Officer and Member of the Board of Directors ofValepar since 2001; Investor Relations Executive Officer of Bradespar since 2000.
Professional experience: Various positions at BNDES from 1976 to 2000; Member of the Board ofDirectors of Iochpe Maxion S.A., a publicly-held company with investments in the auto parts and railwayequipment industries, Globo Cabo S.A., now called Net Servicos de Comunicacao S.A. (‘‘Net’’), a Braziliancable TV operator, Latasa and the Brazilian pulp and paper manufacturers Aracruz Celulose S.A., now calledFibria S.A., and Bahia Sul Celulose S.A., now called Suzano Celulose S.A.
Academic background: Degree in Engineering from UFRJ and post-graduate degree in ManagementDevelopment from Sociedade de Desenvolvimento Empresarial (‘‘SDE’’).
Fuminobu Kawashima, 59: Director of Vale since April 2011.
Other current director or officer positions: Representative Director of Mitsui, a publicly-held tradingcompany, since June 2011.
Professional experience: Senior Executive Managing Officer at Mitsui from April 2011 to March 2012,where he also served as Executive Managing Officer and Chief Operating Officer of the Marine & Aerospacebusiness unit from April 2010 to March 2011, Managing Officer and Chief Operating Officer of the Energybusiness unit from 2007 to 2010, General Manager of the Energy business unit of the LNG project divisionfrom 2005 to 2007 and General Manager of the Energy business unit of the Natural Gas division from May toSeptember 2005; Director of Japan Australia LNG (MIMI) Pty Ltd., an oil and gas company, from 2005 to2007; Director of Mitsui Oil Co. Ltd., a petroleum products company, from 2007 to 2009 and Director ofKyokuto Petroleum Industries Ltd., an oil refinery, from 2007 to 2009.
Academic background: Degree in Economics from Hitotsubashi University in Japan; post-graduatedegree in Economic Development from Keble College, Oxford.
Oscar Augusto de Camargo Filho, 74: Director of Vale since September 2003.
Other current director or officer positions: Director of Valepar since 2003; partner of CWH ConsultoriaEmpresarial, a business consulting firm since 2003.
121

Professional experience: Chairman of the Board of Directors of MRS from 1999 to 2003 and ChiefExecutive Officer and Member of the Board of Directors of CAEMI—Mineracao e Metalurgia S.A.(‘‘CAEMI’’), a mining holding company that was acquired by Vale in 2006, from 1990 to 2003, whereMr. Camargo Filho also held various positions from 1973 to 2003; various positions at Motores Perkins S.A.,including commercial officer and sales and services manager, from 1963 to 1973.
Academic background: Law degree from USP.
Luciano Galvao Coutinho, 65: Director of Vale since August 2007.
Other current director or officer positions: President of BNDES since 2007.
Professional experience: Partner of LCA Consultores, a business consulting firm, from 1995 until 2007and partner of Macrotempo Consultoria, also a business consulting firm, from 1990 to 2007; member of theBoard of Directors of Petrobras from 2009 to 2011, of Ripasa S.A. Celulose e Papel, a paper manufacturer,from 2002 to 2005, and of Guaraniana, now Neoenergia S.A., an energy company, from 2003 to 2004, andExecutive Secretary of the Ministry of Science and Technology from 1985 to 1988. Mr. Coutinho is an invitedprofessor at the Universidade Estadual de Campinas (‘‘UNICAMP’’) and has been a visiting professor at USP,the University of Paris XIII, the University of Texas and the Ortega y Gasset Institute.
Academic background: Degree in Economics from USP; Master’s degree in Economics from theEconomic Research Institute of USP and a Ph.D. in Economics from Cornell University.
Jose Mauro Mettrau Carneiro da Cunha, 62: Director of Vale since June 2010.
Other current director or officer positions: Chairman of the Board of Directors of a number ofpublicly-held Brazilian telecommunication companies, including Tele Norte Leste Participacoes S.A., TelemarNorte Leste S.A., Coari Participacoes S.A. and Calais Participacoes S.A. since 2007, Tele Norte CelularParticipacoes S.A. since 2008, and Brasil Telecom S.A. since 2009; Chairman of the Board of Directors ofTNL PCS S.A. (‘‘TNL’’), a telecommunications company, since 2007; Member of the Board of Directors ofSanto Antonio Energia S.A., a Brazilian energy company, since 2008, Log-In since 2007 and Lupatech S.A., apublicly-held oil and gas production support company, since 2006; Alternate Memer of the Board of Directorsof Telemar Participacoes S.A., a Brazilian telecommunications company, since 2008.
Professional experience: Member of the Board of Directors of Braskem S.A., a Brazilianpetrochemical company, from 2007 to April 2010, where he previously served as Vice-President of StrategicPlanning from 2003 to 2005, Politeno Industria e Comercio S.A., a manufacturer of polyethylene andthermoplastic resins, from 2003 to 2004, Banco do Estado do Espırito Santo (‘‘BANESTES’’), a financialinstitution, from 2008 to 2009, LIGHT Servicos de Eletricidade S.A., an energy distributor, from 1997 to2000, Aracruz Celulose S.A., a paper manufacturer, from 1997 to 2002, and TNL from 1999 to 2003, wherehe also served as an Alternate Member of the Board of Directors in 2006.
Academic background: Degree in Mechanical Engineering from Universidade Catolica de Petropolisin Rio de Janeiro; executive education program in management at the Anderson School of Management atthe University of California at Los Angeles.
Paulo Soares de Souza, 46: Director of Vale since April 2011.
Professional experience: Alternate Member of the Board of Directors of Vale from 2007 to 2009;union leader since 1997, and President of Itabira’s Labor Union (Sindicato dos Trabalhadores nas Industrias deExtracao Mineral e de Pesquisa, Prospeccao, Extracao e Beneficiamento do Ferro e Metais Basicos e demaisMinerais Metalicos e nao Metalicos) since 2003.
122

Academic background: Technical degree as an electrician from Servico Social da Industria (SESI)School of Technology.
Executive officers
The executive officers are responsible for day-to-day operations and the implementation of the generalpolicies and guidelines set forth by the Board of Directors. Our bylaws provide for a minimum of six and amaximum of 11 executive officers. The executive officers hold weekly meetings and hold additional meetingswhen called by any executive officer. Under Brazilian corporate law, executive officers must be Brazilianresidents.
The Board of Directors appoints executive officers for two-year terms and may remove them at anytime. The following table lists our current executive officers.
Year ofappointment Position Age
Murilo Pinto de Oliveira Ferreira . . . . . 2011 Chief Executive Officer 58Tito Botelho Martins . . . . . . . . . . . . . 2006 Chief Financial Officer and Executive Director for Investor Relations, 49
Procurement and Shared ServicesJose Carlos Martins . . . . . . . . . . . . . 2004 Executive Officer (Ferrous Minerals Operations and Marketing) 62Eduardo de Salles Bartolomeo . . . . . . . 2006 Executive Officer (Fertilizer and Coal Operations and Marketing) 48Galib Abrahao Chaim . . . . . . . . . . . . 2011 Executive Officer (Implementation of Capital Projects) 61Humberto Ramos de Freitas . . . . . . . . 2011 Executive Officer (Logistics and Mineral Exploration) 58Gerd Peter Poppinga . . . . . . . . . . . . . 2011 Executive Officer (Base Metals Operations, Marketing and Information 52
Technology)Vania Lucia Chaves Somavilla . . . . . . . 2011 Executive Officer (Human Resources, Health and Safety, Sustainability, 52
Energy and Corporate Affairs)
Below is a summary of the business experience, activities and areas of expertise of our currentexecutive officers.
Murilo Pinto de Oliveira Ferreira, 58: Chief Executive Officer of Vale and Member of Vale’sStrategy and Disclosure Committees since May 2011.
Other current director or officer positions: President of the Board of Directors (Conselho de Gestor) ofAssociacao Instituto Tecnologico Vale—ITV, a non-profit entity sponsored by Vale engaged in technologicaldevelopment, since 2011.
Professional experience: Executive Officer of Vale with responsibility over several differentdepartments from 2005 to 2008, including Aluminum, Holdings, Business Development, Energy, Nickel andBase Metals; Chief Executive Officer of Vale Canada from 2007 to 2008 and member of the Board ofDirectors from 2006 to 2007; Chairman of the Board of Directors of Alunorte from 2005 to 2008, MRN from2006 to 2008 and Valesul Alumıno S.A., a subsidiary of Vale involved in the production of aluminum, from2006 to 2008; Member of the Board of Commissioners of PTVI, from 2007 to 2008. Mr. Ferreira has been aMember of the Board of Directors of several companies, including Usiminas, a Brazilian steel company, from2006 to 2008, and was a partner at Studio Investimentos, an asset management firm with a focus on theBrazilian stock market, from October 2009 to March 2011.
Academic background: Degree in Business Administration from FGV in Sao Paulo; post-graduatedegree in Business Administration and Finance from FGV in Rio de Janeiro and an executive educationprogram in M&A at the IMD, Lausanne, Switzerland.
Tito Botelho Martins, 49: Chief Financial Officer and Executive Officer for Investor Relations,Procurement and Shared Services of Vale since November 2011.
123

Other current director or officer positions: Chairman of the Board of Directors of MRN; Member ofthe Board of Directors of Hydro, a publicly held aluminum company in Norway.
Professional experience: Executive Officer of Vale with responsibility over several differentdepartments since 2006, including Base Metals, Nonferrous Minerals, Energy, and Corporate Affairs; ChiefExecutive Officer of CAEMI, a mining company acquired by Vale, and Chairman and Chief Executive Officerof MBR from 2003 to 2006; and Managing Officer of the corporate finance department of Vale from August1999 to September 2003. Previously, Mr. Martins was a Member of the Board of Directors of Fundacao Valedo Rio Doce de Seguridade Social (‘‘Valia’’), a pension plan for Brazilian employees of Vale, FerroviasBandeirantes S.A. (‘‘Ferroban’’), a railway company, Aco Minas Gerais S.A. (‘‘Acominas’’), a steel company,Gulf Industrial Investment Company (‘‘GIIC’’), an iron ore pelletizing company in the country of Bahrain,and at our affiliated companies FCA, Samarco, Itabrasco and Hispanobras.
Academic background: Degree in Economics from the Universidade Federal de Minas Gerais;Master’s degree in Business Administration from UFRJ; executive education programs at INSEAD (France)and at the Kellogg School of Management at Northwestern University.
Jose Carlos Martins, 62: Executive Officer for Ferrous Minerals Operations and Marketing of Valesince November 2011.
Other current director or officer positions: Member of the Board of Directors of Samarco.
Professional experience: Executive Officer of Vale with responsibility over several differentdepartments since 2004, including Marketing, Sales and Strategy, Ferrous Minerals, and New BusinessDevelopment. Member of the Board of Directors of Usiminas from 2005 to 2006 and from 2008 to 2009;President of South America Aluminum Can Production and Marketing for Rexam PLC, a global consumerpackaging group; President of Latasa from 1999 until Rexam PLC bought Latasa in 2003; Executive Officerfor Steel Production of CSN from 1997 until 1999; and Chief Executive Officer at Acos Villares, a steelmanufacturer, where Mr. Martins also held several other important positions from 1986 until 1996.
Academic background: Degree in Economics from Pontifıcia Universidade Catolica in Sao Paulo.
Eduardo de Salles Bartolomeo, 48: Executive Officer for Fertilizer and Coal Operations andMarketing of Vale since November 2011.
Other current director or officer positions: Member of the Board of Directors of Log-In since 2007.
Professional experience: Executive Officer of Vale with responsibility over several differentdepartments since 2007, including Integrated Operations, Logistics, Project Management, Sustainability, andEngineering. Mr. Bartolomeo was also President of Petroflex, a polyethylene duct and conduit manufacturer,from August to December 2006; Officer of the logistics operations department of Vale between January 2004and July 2006; Manager of Corporate Planning, Plant Manager, Corporate Logistics Manager and RegionalDirector at Companhia de Bebidas das Americas (‘‘Ambev’’), a brewery company, from 1994 to 2003; andhead of the steel conversion sector at COSIPA, a Brazilian steel producer, until 1991.
Academic background: Degree in Metallurgical Engineering from the Universidade FederalFluminense and MBA from the Katholieke Universiteit in Leuven, Belgium.
Galib Abrahao Chaim, 61: Executive Officer for Implementation of Capital Projects of Vale sinceNovember 2011.
Professional experience: Project Director of Vale for the Department of Coal for projects in Australia,Mozambique, Zambia and Indonesia and Country Manager for Mozambique from 2005 to 2011; Industrial
124

Director for Alunorte from 1994 to 2005; Industrial Superintendent for Albras from 1984 to 1994; andTechnical Superintendent of MRN from 1979 to 1984.
Academic Background: Degree in Engineering from the Universidade Federal de Minas Gerais;Master’s degree in Business Administration from Fundacao Getulio Vargas.
Humberto Ramos de Freitas, 58: Executive Officer for Logistics and Mineral Exploration of Valesince November 2011.
Other current director or officer positions: Member of the Board of Directors of MRS since December2010; Chairman of the Board of ABTP—Associacao Brasileira de Terminais Portuarios, a non-profitorganization that deals with issues related to Brazilian ports, since May 2009.
Professional experience: Logistics Operations Director of Vale from September 2009 to June 2010;Director for Ports and Navigation of Vale from March 2007 to August 2009; President, from August 2003 toFebruary 2007 and Chief Executive Officer, from August 2003 to February 2007, of Valesul Alumınio S.A., asubsidiary of Vale involved in the production of aluminum; General Superintendent of Ports for CSN fromDecember 1997 to November 1998.
Academic background: Degree in Metallurgical Engineering from the Ouro Preto School of Mines;Executive Development Program at the Kellogg School of Management at Northwestern University; BusinessDevelopment Partnership (EDP) from Fundacao Dom Cabral; senior executive education program at M.I.T.
Gerd Peter Poppinga, 52: Executive Officer for Base Metals Operations, Marketing and InformationTechnology of Vale since November 2011.
Other current director or officer positions: President Commissioner of PTVI since March 2010 andMember of the Board of Commissioners since April 2009; President and Chief Executive Officer of ValeCanada since January 2012; Chairman of the Board of Directors of VNC since June 2011, and a Membersince November 2007.
Professional experience: Executive Vice President for Asia Pacific of Vale Canada from November2009 to November 2011; Director for Strategy, Business Development, Human Resources and Sustainability ofVale Canada from May 2008 to October 2009; Director for Strategy and Information Technology of ValeCanada from November 2007 to April 2008. From 1985 until 1999, Mr. Poppinga also held several positionsat Mineracao da Trinidade S.A.—SAMITRI, a publicly held mining company that was acquired by Vale in2001.
Academic Background: Degree in Geology from Universidade Federal do Rio de Janeiro (UFRJ)and Universitat Erlangen, Germany; post-graduate degree in Geology and Mining Engineering from theUniversitat Clausthal—Zellerfeld, Germany; specialization in Geostatistics from the Universidade Federal deOuro Preto (UFOP); Executive MBA from Fundacao Dom Cabral; Senior Leadership Program at M.I.T.;Leadership Program at IMD Business School, Lausanne, Switzerland; and Strategic Megatrends with AsiaFocus program at Kellogg Singapore.
Vania Lucia Chaves Somavilla, 52: Executive Officer for Human Resources, Health and Safety,Sustainability, Energy and Corporate Affairs of Vale since May 2011.
Other current director or officer positions: Chairman of the Board of Directors of Vale Florestar S.A.since 2011.
Professional experience: Director of the Department of the Environment Sustainability at Vale fromJanuary 2010 until May 2011; Director for Energy Commercialization of Vale from March 2004 until January2010; Chief Executive Officer of the Instituto Ambiental Vale from 2010 until 2011; Member of the Board of
125

Directors of Albras from 2009 to 2011; Chief Executive Officer of Vale Florestar S.A., during 2010. Inconnection with her roles at Vale, Ms. Somavilla was also member of the executive board of severalcompanies and consortia in the energy sector from 2004 until 2010. She was also head of New BusinessDevelopment for Energy Generation and of Project Development and Implementation for large and smallhydroelectric plant projects at Companhia Energetica de Minas Gerais—CEMIG, a publicly held companyinvolved in the generation, transmission, distribution and sale of electricity, from 1995 until 2001.
Academic Background: Degree in Civil Engineering from UFMG; post-graduate degree in DamEngineering from UFOP; specialization in Management of Hydro Power Utilities from SIDA, Stockholm,Sweden; MBA degree in Corporate Finance from IBMEC/Belo Horizonte; Transformational Leadershipprogram from M.I.T. and Mastering Leadership program from IMD.
Conflicts of interest
Under Brazilian corporate law, if a director or an executive officer has a conflict of interest with theCompany in connection with any proposed transaction, the director or executive officer may not vote in anydecision of the Board of Directors or of the board of executive officers regarding such transaction and mustdisclose the nature and extent of the conflicting interest for transcription in the minutes of the meeting. Inany case, a director or an executive officer may not transact any business with the Company, except onreasonable or fair terms and conditions that are identical to the terms and conditions prevailing in the marketor offered by unrelated parties.
Fiscal Council
We have a fiscal council established in accordance with Brazilian law. The primary responsibilities ofthe fiscal council under Brazilian corporate law are to monitor management’s activities, review the Company’sfinancial statements, and report its findings to the shareholders. Pursuant to a written policy, our FiscalCouncil requires management to obtain the Fiscal Council’s approval before engaging any external auditor toprovide any audit or permitted non-audit services to Vale or its consolidated subsidiaries. Under the policy,the Fiscal Council has pre-approved a detailed list of services based on detailed proposals from our auditorsup to specified monetary limits. The list of pre approved services is updated periodically. Services that are notlisted, that exceed the specified limits, or that relate to internal controls must be separately pre-approved bythe Fiscal Council. The policy also sets forth a list of prohibited services. The Fiscal Council is provided withreports on the services provided under the policy on a periodic basis, review and monitor the Company’sexternal auditor’s independence and objectivity. The Fiscal Council has the power to review and evaluate theperformance of the Company’s external auditors on an annual basis and make a recommendation to theBoard of Directors on whether the Company should remove and replace its existing external auditors. TheFiscal Council may also recommend withholding the payment of compensation to the independent auditorsand has the power to mediate disagreements between management and the auditors regarding financialreporting.
Under our bylaws, our Fiscal Council is also responsible for establishing procedures for the receipt,retention and treatment of any complaints related to accounting, controls and audit issues, as well asprocedures for the confidential, anonymous submission of concerns regarding such matters.
Brazilian law requires the members of a fiscal council to meet certain eligibility requirements. Amember of our Fiscal Council cannot (i) hold office as a member of the board of directors, fiscal council oradvisory committee of any company that competes with Vale or otherwise has a conflicting interest with Vale,unless compliance with this requirement is expressly waived by shareholder vote, (ii) be an employee ormember of senior management or the Board of Directors of Vale or its subsidiaries or affiliates, or (iii) be aspouse or relative within the third degree by affinity or consanguinity of an officer or director of Vale.
126

We are required by both the SEC and the NYSE listed company audit committee rules to comply withExchange Act Rule 10A-3, which requires, absent an exemption, a standing audit committee composed ofmembers of the Board of Directors that meet specified requirements. In lieu of establishing an independentaudit committee, we have given our Fiscal Council the necessary powers to qualify for the exemption set forthin Exchange Act Rule 10A-3(c)(3). We believe our Fiscal Council satisfies the independence and otherrequirements of Exchange Act Rule 10A-3 that would apply in the absence of our reliance on the exemption.Pursuant to our undertakings to the HKEx, the Fiscal Council must be comprised of at least three memberswho satisfy specified independence requirements set out in the HKEx Listing Rules. We have received awritten confirmation of independence pursuant to Rule 3.13 of the HKEx Listing Rules from eaech of themembers of our Fiscal Council appointed by Valepar and consider them able to satisfy these independencerequirements.
Our Board of Directors has determined that one of the members of our Fiscal Council, Mr. AnıbalMoreira dos Santos, is an audit committee financial expert. In addition, Mr. Moreira dos Santos meets theapplicable independence requirements for Fiscal Council membership under Brazilian law and the NYSEindependence requirements that would apply to audit committee members in the absence of our reliance onthe exemption set forth in Exchange Act Rule 10A-3(c)(3).
Members of the Fiscal Council are elected by our shareholders for one-year terms. The currentmembers of the Fiscal Council and their respective alternates were elected on April 19, 2011. The terms ofthe members of the Fiscal Council expire at the next annual shareholders’ meeting following election.
Two members of our Fiscal Council (and the respective alternates) may be elected by non-controllingshareholders: one member may be appointed by our preferred shareholders and one member may beappointed by minority holders of common shares pursuant to applicable CVM rules.
The following table lists the current and alternate members of the Fiscal Council.
Current member First year of appointment Alternate First year of appointment
Antonio Henrique Pinheiro Marcus Pereira Aucelio(1) . . . . . 2008Silveira(1) . . . . . . . . . . . . . 2011
Arnaldo Jose Vollet(2) . . . . . . . 2011 Cıcero da Silva(2) . . . . . . . . . . 2009Marcelo Amaral Moraes(2) . . . . . 2004 Oswaldo Mario Pego de Amorim
Azevedo(2) . . . . . . . . . . . . . 2004Anıbal Moreira dos Santos(2) . . . 2005 Vacant . . . . . . . . . . . . . . . . . –
(1) Appointed by preferred shareholders.(2) Appointed by Valepar.
Below is a summary of the business experience, activities and areas of expertise of the members of ourFiscal Council.
Antonio Henrique Pinheiro Silveira, 47: Member of Vale’s Fiscal Council since April 2011.
Other director or officer positions: Secretary of Economic Management of the Ministry of Financesince 2008; Director of Companhia de Seguros Alianca do Brasil, a private insurance company, since 2010,and of Norte Energia SA, a private energy company, since July 2010.
Professional experience: Assistant Secretary for Economic Management of the Ministry of Financefrom 2007 to 2008 and Assistant Chief Economic Advisor of the Ministry of Planning, Budget andManagement of Brazil from 2004 to 2007. He also served as Chairman of Banco Nordeste do Brasil, aprivately-held bank, from 2008 to 2010; Director of Empresa Gestora de Ativos—EMGEA, a private assetmanagement entity, from 2007 to 2008; and member of the senior management of Companhia Docas doEstado da Bahia, a port services provider, from 2005 to 2007.
Academic Background: Bachelor’s, Master’s and Ph.D. degrees in Economics from UFRJ.
127

Arnaldo Jose Vollet, 63: Member of Vale’s Fiscal Council since April 2011.
Professional experience: Executive Officer of BB DTVM, a subsidiary of Banco do Brasil, from 2002to 2009; Finance and Investor Relations Officer of Companhia de Energia Eletrica da Bahia—Coelba, apublicly held electricity company, from 2000 to 2002; Member of the Fiscal Council of Telesp CelularParticipacoes, a publicly held telecommunications company, from 1999 to 2000; Member of the Fiscal Councilof CELP—Companhia de Eletricidade de Pernambuco, a publicly held electricity company, from 2004 to2009; Director of Guaraniana, now called Neoenergia S.A., a publicly held electricity holding company, from2002 to 2003; Alternate Member of the Board of Directors of CEMIG—Companhia de Energia de MinasGerais, a publicly held electricity company, from 2003 to 2005; Member of the Board of Directors of Pronorand Nitrocarbono, both chemical companies, from 1997 to 1998.
Academic background: Degree in Mathematics from USP and MBA degree in Finance fromIBMEC/RJ.
Marcelo Amaral Moraes, 44: Member of Vale’s Fiscal Council since April 2004.
Other director or officer positions: Managing Executive Officer at Capital DynamicsInvestimentos Ltda. since January 2012; Member of the Deliberative Council of ABVCAP since 2010.
Professional experience: Managing Executive Officer and partner responsible for specialized funds atStratus Investimentos Ltda., a private equity and venture capital firm, from 2006 to 2010; Investment Managerat Bradespar from 2000 to 2006; worked in the mergers and acquisitions and capital markets departments ofBanco Bozano, Simonsen from 1995 to 2000; Alternate Member of the Board of Directors of Net from 2004to 2005; Alternate Member of the Board of Directors of Vale in 2003.
Academic background: Degree in Economics from UFRJ, an MBA with emphasis in finance fromUFRJ/COPPEAD, and a post-graduate degree in business law and arbitration from FGV in Sao Paulo.
Anıbal Moreira dos Santos, 73: Member of Vale’s Fiscal Council since April 2005.
Other director or officer positions: Member of Fiscal Council of Log-In since 2009.
Professional experience: From 1998 until his retirement in 2003, Mr. Moreira dos Santos served asExecutive Officer of several CAEMI subsidiaries, including Caemi Canada Inc., Caemi CanadaInvestments Inc., CMM Overseas, Ltd., Caemi International Holdings BV and Caemi InternationalInvestments NV, and as Chief Accounting Officer of CAEMI from 1983 to 2003. He also served as Memberof the Fiscal Council of CADAM from 1999 to 2003 and as an Alternate Member of the Board of Directorsof MBR and Empreedimentos Brasileiros de Mineracao, an iron ore asset holding company, from 1998 to2003.
Academic background: Degree in Accounting from FGV in Rio de Janeiro.
128

MANAGEMENT COMPENSATION
Under our bylaws, our shareholders are responsible for establishing the aggregate compensation wepay to the members of our Board of Directors and our Board of Executive Officers, and the Board ofDirectors allocates the compensation among its members and the Board of Executive Officers.
Our shareholders determine this annual aggregate compensation at the general shareholders’ meetingeach year. In order to establish aggregate director and officer compensation, our shareholders usually takeinto account various factors, which range from attributes, experience and skills of our directors and executiveofficers to the recent performance of our operations. Once aggregate compensation is established, themembers of our Board of Directors are then responsible for distributing such aggregate compensation incompliance with our bylaws among the directors and executive officers. The Executive DevelopmentCommittee makes recommendations to the Board concerning the annual aggregate compensation of theexecutive officers. In addition to fixed compensation, our executive officers are also eligible for bonuses andincentive payments.
For the year ended December 31, 2011, the amount paid to the executive officers is set forth in thetable below.
For the year ended December 31, 2011
(US$ million)Fixed compensation and in kind benefits . . . . . . . . . . . . . . . . . . . . . . . . . . . . . . . 11.7Variable compensation . . . . . . . . . . . . . . . . . . . . . . . . . . . . . . . . . . . . . . . . . . 25.3Pension, retirement or similar benefits . . . . . . . . . . . . . . . . . . . . . . . . . . . . . . . . . 2.1Severance . . . . . . . . . . . . . . . . . . . . . . . . . . . . . . . . . . . . . . . . . . . . . . . . . 59.0Social security contributions(1) . . . . . . . . . . . . . . . . . . . . . . . . . . . . . . . . . . . . . 19.1
Total paid to the executive officers . . . . . . . . . . . . . . . . . . . . . . . . . . . . . . . . . . . 117.1
(1) Social security contributions to the Brazilian government with respect to the executive officers.
We paid US$2.8 million in aggregate to the members of our Board of Directors for services in allcapacities, all of which was fixed compensation. There are no pension, retirement or similar benefits for themembers of our Board of Directors. As of March 31, 2012, the total number of common shares owned by ourdirectors and executive officers was 54,344, and the total number of preferred shares owned by our directorsand executive officers was 931,154. None of our directors or executive officers beneficially owns 1% or moreof any class of our shares.
Fiscal Council
We paid an aggregate of US$660,409 to members of the Fiscal Council in 2011. In addition, themembers of the Fiscal Council are reimbursed for travel expenses related to the performance of theirfunctions.
Advisory committees
We paid an aggregate of US$189,538 to members of our advisory committees in 2011. UnderArticle 15 of our bylaws, those members who are directors or officers of Vale are not entitled to additionalcompensation for participating on a committee. Members of our advisory committees are reimbursed fortravel expenses related to the performance of their functions.
129

EMPLOYEES
The following tables set forth the number of our employees by business and by location as of thedates indicated.
At December 31,
2009 2010 2011By business:Bulk materials . . . . . . . . . . . . . . . . . . . . . . . . . . . . . . . . . . . . . . . 35,760 40,986 48,362Base metals operations . . . . . . . . . . . . . . . . . . . . . . . . . . . . . . . . . . 18,031 17,855 18,168Fertilizer nutrients . . . . . . . . . . . . . . . . . . . . . . . . . . . . . . . . . . . . 1,156 6,054 6,903Corporate activities . . . . . . . . . . . . . . . . . . . . . . . . . . . . . . . . . . . . 5,089 5,890 6,213
Total . . . . . . . . . . . . . . . . . . . . . . . . . . . . . . . . . . . . . . . . . . . 60,036 70,785 79,646
At December 31,
2009 2010 2011By location:South America . . . . . . . . . . . . . . . . . . . . . . . . . . . . . . . . . . . . . . 47,242 57,525 64,766North America . . . . . . . . . . . . . . . . . . . . . . . . . . . . . . . . . . . . . . 6,972 6,390 6,617Europe . . . . . . . . . . . . . . . . . . . . . . . . . . . . . . . . . . . . . . . . . . . 660 598 615Asia . . . . . . . . . . . . . . . . . . . . . . . . . . . . . . . . . . . . . . . . . . . . 4,007 3,797 4,088Oceania . . . . . . . . . . . . . . . . . . . . . . . . . . . . . . . . . . . . . . . . . . 1,040 1,845 2,186Africa . . . . . . . . . . . . . . . . . . . . . . . . . . . . . . . . . . . . . . . . . . . 115 630 1,374
Total . . . . . . . . . . . . . . . . . . . . . . . . . . . . . . . . . . . . . . . . . . . 60,036 70,785 79,646
We negotiate wages and benefits with a large number of unions worldwide that represent ouremployees. We have collective agreements with unionized employees at our Argentine, Australian, Brazilian,Canadian, French, Indonesian, Malawian, Mozambican, New Caledonian, Norwegian, Paraguayan, Peruvianand U.K. operations.
We recently resolved two labor disputes that affected our Canadian operations. These were resolved inJuly 2010, with striking employees at our Canadian nickel operations in Sudbury and Port Colborne, Ontario,and in January 2011, with striking employees working in mining and mill operations at Voisey’s Bay,Newfoundland, with the entering into of new five-year collective bargaining agreements with the unionsrepresenting the employees previously on strike. In September 2011, we entered into a three year collectiveagreement with the union representing the employees in our Thompson Manitoba Operations. The collectiveagreements include a defined contribution pension plan for new employees and adjustments in variablecompensation programs that support the achievement of strategic objectives and rewards performance, amongvarious other improvements to the collective bargaining agreement.
Wages and benefits
Wages and benefits for Vale and its subsidiaries are generally established on a company-by-companybasis. Vale establishes its wage and benefits programs for Vale and its subsidiaries, other than Vale Canada, inperiodic negotiations with unions. In November 2011, Vale reached a two-year agreement with the Brazilianunions. A salary increase of 8.6% was implemented in November 2011, and another salary increase of 8% willbe implemented in November 2012 for our employees in Brazil as part of that agreement. The provisions ofVale’s collective bargaining agreements with its unions also apply to Vale’s non-unionized employees. ValeCanada establishes wages and benefits for its unionized employees through collective agreements. Fornon-unionized employees, Vale Canada undertakes an annual review of salaries. Vale and its subsidiariesprovide their employees and their dependents with other benefits, including supplementary medical assistance.
130

Pension plans
Brazilian employees of Vale and of most of its Brazilian subsidiaries are eligible to participate inpension plans managed by Valia. Sponsored by Vale and such subsidiaries, Valia is a nonprofit,complementary social security foundation with both financial and administrative autonomy.
Most of the participants in plans held by Valia are participants in a plan named ‘‘Vale Mais,’’ whichValia implemented in May 2000. This plan is primarily a defined contribution plan with a defined benefitfeature relating to service prior to May 2000 and another defined benefit feature to cover temporary orpermanent disability, pension and financial protection to dependents in case of death. Valia also operates adefined benefit plan, closed to new participants since May 2000, with benefits based on years of service, salaryand social security benefits. This plan covers retired participants and their beneficiaries, as well as a relativelysmall number of employees that declined to transfer from the old plan to the ‘‘Vale Mais’’ plan when it wasestablished in May 2000.
Our wholly-owned subsidiary Vale Canada sponsors defined benefit pension plans and definedcontribution pension plans, principally for employees in Canada, the United States, the United Kingdom andIndonesia. As a result of the collective bargaining agreement reached with the union representing employeesat our Canadian nickel operations in Thompson, Manitoba, in September 2011, all of the defined benefitplans of Vale Canada are now closed to new employees. All new employees of Vale Canada participate indefined contribution pension plans. In addition, Vale Canada provides post-retirement benefits for eligibleemployees, including post-retirement health, dental and ophthalmological benefits.
In the Asia-Pacific region, the types of pension plans we provide varies. Defined benefit plans exist inSingapore, Mongolia, Malaysia, Kazakhstan, South Korea, and Japan. Defined contribution plans exist inChina, Philippines, India, Hong Kong and Thailand, with Hong Kong having no company match and Chinahaving various plans with a company match portion, based on city. One location, Taiwan, offers a hybrid planwith a mix of a defined benefit and defined contribution plan.
Performance-based compensation
All Vale parent-company employees receive incentive compensation each year in an amount based onthe performance of Vale, the performance of the employee’s department and the performance of theindividual employee. Similar incentive compensation arrangements are in place at our subsidiaries.
Certain Vale employees are also eligible to receive deferred bonuses with vesting periods of threeyears based on Vale’s performance as measured by total shareholder return relative to a group of peercompanies over the vesting period. Since 2008, qualifying management personnel have been eligible toparticipate at their option in a bonus program tied to preferred share ownership. Under the program, eachqualified employee may elect to invest part of their bonus either in Vale preferred shares for eligibleemployees receiving an incentive payment in Brazil, or in ADRs representing Vale preferred shares foreligible employees receiving an incentive payment outside Brazil. If the employee continues to be employedby us and has held the preferred shares (or ADRs) for the entire duration of the relevant cycle of thematching program, at the expiration of the applicable three year term of the program, the employee willreceive a cash payment to be applied to purchase in the open market a number of additional preferred shares(or ADRs) equal to the number of preferred shares (or ADRs) purchased by the employee pursuant to theprogram. During the three-year term of the incentive program, participating employees have the right to sellall or part of the preferred shares (or ADRs) purchased through the program, however such employees forfeitthe right to the matching reward for all shares sold prior to the expiration of the term of the program. Forthe 2011-2013 cycle, 1,122 employees participated in the program.
131

V. ADDITIONAL INFORMATION
LEGAL PROCEEDINGS
We and our subsidiaries are defendants in numerous legal actions in the normal course of business,including civil, administrative, tax, social security and labor proceedings. The most significant proceedings arediscussed below. Except as otherwise noted below, the amounts claimed, and the amounts of our provisionsfor possible losses, are stated as of December 31, 2011. See Note 20 to our consolidated financial statementsfor further information.
Praia Mole suit
We are among the defendants in a public civil action filed by Brazilian federal government agencies inNovember 1997 seeking to annul the concession agreements under which the defendants operate the PraiaMole maritime terminal in the Brazilian state of Espırito Santo. The case was decided in our favor inNovember 2007 with a decision recognizing the validity of that concession agreement, however, the federalpublic prosecutor filed an appeal with the federal circuit court in April 2008, which is still pending.
Itabira suits
We are a defendant in two separate actions brought by the municipality of Itabira, in the Brazilianstate of Minas Gerais. In the first action, filed in August 1996, the municipality of Itabira alleges that ourItabira iron ore mining operations have caused environmental and social harm, and claims damages withrespect to the alleged environmental degradation of the site of one of our mines, as well as the immediaterestoration of the affected ecological complex and the performance of compensatory environmental programsin the region. The damages sought, as adjusted from the date of the claim, amount to approximatelyR$2.686 billion (US$1.438 billion). There have been hearings in this action, a report favorable to Vale wasissued, and a request for additional expert evidence presented by the municipality has been granted. A finaldecision is still pending.
In the second action, filed in September 1996, the municipality of Itabira claims the right to bereimbursed for expenses it has incurred in connection with public services rendered as a consequence of ourmining activities. The damages sought, as adjusted from the date of the claim, amount to approximatelyR$3.111 billion (US$1.665 billion). This case had been suspended pending consideration of our request toinclude favorable evidence from a separate lawsuit. In January 2012, our request was denied and, once thecourt is notified, the lawsuit will resume.
CFEM-related proceedings
We are engaged in numerous administrative and judicial proceedings relating to the mining royaltyknown as the CFEM. For more information about CFEM, see Regulatory Matters—Royalties and other taxes onmining activities. These arise out of a large number of assessments by the DNPM, an agency of the Ministryof Mines and Energy of the Brazilian government. The proceedings concern different interpretations of thedeductibility of tax and transportation expenditures, DNPM’s method of estimating sales, the statute oflimitations, due process of law, payment of royalties on pellet sales and CFEM charges on the revenuesgenerated by our subsidiaries abroad.
We believe that the DNPM’s claims are without merit, and we are contesting them using the availableavenues of recourse under Brazilian law, beginning with challenges in administrative tribunals and proceedingwith challenges in the judicial courts. We have received some favorable decisions and some unfavorabledecisions, but none of the disputes has been finally resolved and we cannot predict the amount of timerequired before final judicial resolutions. The federal government has established a working group withrepresentatives of Vale and DNPM to review the basis of calculation of the CFEM, which is among the issuesin dispute.
132

The aggregate amount claimed in the pending assessments is approximately R$5.640 billion(US$3.019 billion) (including interest and penalties through December 31, 2011).
ICMS tax assessments
In December 2011, the tax authority of the Brazilian state of Minas Gerais issued six tax assessments(autos de infracao) against us for additional payments of the value-added tax on services and circulation ofgoods (ICMS) on the iron ore we transport from our mining sites in the state of Minas Gerais to our facilitiesin the state of Espırito Santo. The tax authority asserts that the calculation of ICMS should be based on themarket value of the iron ore transported, as opposed to the cost of production of the ore, which is themanner by which we calculated the ICMS owed in years past. These tax assessments cover the year 2006, inan aggregate amount of R$1.2 billion (US$642 million). We have already presented our defense against eachof these assessments at the administrative level. While this issue remains unresolved, the tax authority is likelyto issue additional assessments covering years subsequent to 2006.
Tax litigation in Switzerland
We are engaged in a dispute with Swiss authorities concerning the application of a tax exemption toour Swiss subsidiary Vale International. The exemption provides for a 60% tax exemption, which increases to80% if certain employment and investment conditions are met. Our position is that these conditions havebeen met, and the Swiss federal authority contends that they were not met for the tax years from 2006through 2009. The Vaud cantonal authority had originally accepted our position, but reversed itself after thefederal authority commenced litigation challenging its application of the exemption. In March 2012, thecantonal tax authority issued tax assessments against Vale International in the aggregate amount of212 million Swiss francs (US$226 million), reflecting the position that the conditions for the additional 20%exemption were not met. We believe these assessments are unjustified, and we will contest them before theSwiss courts.
Tax litigation
We are engaged in legal proceedings concerning the contention of the Brazilian federal tax authority(Receita Federal) that we should pay Brazilian corporate income tax and social security contributions on thenet income of our non-Brazilian subsidiaries and affiliates. The position of the tax authority is based onArticle 74 of Brazilian Provisional Measure 2,158-34/2001 (‘‘Article 74’’), a tax regulation issued in 2001 byBrazil’s President, and on implementing regulations adopted by the tax authority under Article 74.
For accounting purposes, we have determined that the payment of additional taxes under Article 74 isreasonably possible, but not probable, and accordingly we have not established any provision. We intend tocontinue to vigorously defend our interests in all the related proceedings.
Our direct judicial challenge
In 2003, prior to receiving any assessment of taxes under Article 74, we initiated a legal proceeding(mandado de seguranca) challenging the applicability of the regulation based on the following arguments:(i) Article 74 disregards certain provisions on the taxation of profits in double taxation treaties between Braziland the countries where some of our subsidiaries and affiliates are based; (ii) the Brazilian Tax Code prohibitsthe establishment of conditions and timing of any such tax by means of a provisional measure; (iii) even ifArticle 74 is valid, currency exchange gains and losses must be excluded from the net income of our foreignsubsidiaries and affiliates in the calculation of taxes owed; and (iv) the application of the regulation to netincome generated before December 2001 would violate the constitutional principle prohibiting retroactiveapplication of tax laws.
In 2005, the court of first instance ruled against us on the merits of the case, and we appealed. In2011, our appeal was rejected by the Federal Court of Appeals (Tribunal Regional Federal da 2ª Regiao).
133

In December 2011, we filed new appeals before the Superior Court of Justice, with respect to ourarguments regarding the violations to federal law and international treaties, and the Supreme Court (SupremoTribunal Federal), with respect to our constitutional arguments. In March 2012, we obtained a new ruling fromthe Superior Court of Justice suspending all collection efforts by the tax authorities in respect of Article 74assessments, pending a final ruling on the merits of our challenge. The Brazilian federal tax authority hasappealed from this decision.
Constitutional challenges to Article 74 are pending before Brazil’s Supreme Court. CNI (ConfederacaoNacional da Industria), a major national industry association, filed a direct constitutional challenge (acaodireta de inconstitucionalidade) in 2001, and a decision in that case would have general applicability withrespect to the constitutional arguments against Article 74. Other taxpayers and groups have also appealedfrom lower courts to the Supreme Court in cases challenging Article 74, and in April 2012 the Supreme Courtdetermined that its decision to be made in an appeal brought by Cooperativa Agropecuaria Mouraoense(Coamo) will be generally applicable with respect to the constitutional arguments. Even if the Supreme Courtdecides the constitutional questions against the taxpayers, we intend to continue pursuing our other legalarguments.
Tax assessments and our administrative claims
The tax authority has issued four tax assessments (autos de infracao) against us for payment of taxes inaccordance with Article 74, as follows (including interest and penalties through December 31, 2011):
� Notice of assessment issued in 2007 covering the years 1996—2002, for taxes of R$992 million,plus interest and penalties of R$2.101 billion.
� Notice of assessment issued in 2008 covering the years 2003—2006, for taxes of R$4.076 billion,plus interest and penalties of R$6.778 billion.
� Notice of assessment issued in 2009 covering the year 2007, for taxes of R$5.742 billion, plusinterest and penalties of R$7.497 billion.
� Notice of assessment issued in 2010 covering the year 2008, for taxes of R$1.604 billion, plusinterest and penalties of R$1.897 billion.
We have challenged each assessment with the tax authority and on appeal to the CARF (ConselhoAdministrativo de Recursos Fiscais), which is an appellate administrative tribunal within the tax authority.Although each assessment relates to different factual circumstances and not all of our arguments apply to allfour assessments, these challenges generally assert that Article 74 conflicts with certain provisions of Brazil’sinternational tax treaties on the taxation of dividends, and they dispute the application and calculation of fineson the claimed amounts. We have raised other arguments in respect of the validity of Article 74 in our directjudicial challenge to the regulation, as discussed above. While challenges to Article 74 remain unresolved, thetax authority is likely to issue additional assessments covering years subsequent to 2008 in order to preserveits rights in light of the applicable statute of limitations. We intend to challenge any such assessments.
Decisions of the tax administration may be challenged in judicial courts, with two or sometimes threelevels of judicial review. While tax claims are being contested in administrative proceedings, the tax authoritycannot seek to collect the assessed amounts. However, if the administrative review process concludes withoutdismissing the assessment, the tax authority can seek to collect payment, and the taxpayer can only suspendcollection efforts if it challenges the administrative decision in the judicial courts. Under Brazilian law, ataxpayer that appeals to the courts must ordinarily provide a bond or security in commensurate amount withthe court in order to suspend collection efforts. Although we may contest the application and scope of thebond requirement under the circumstances of our challenges to Article 74 if in the future we need to appealadministrative decisions to the judicial courts, it is likely that in such circumstances we would be required topost bond or some form of security with the court, and, depending on the nature, amount and scope of suchbond, this may have a significant financial impact.
134

During the first quarter of 2012, we received demands for payment in respect of these assessments,because the tax authorities asserted that no further disputes were pending at the administrative level withrespect to those amounts. These demands are suspended by the March 2012 injunction of the Superior Courtof Justice in our direct judicial challenge to Article 74. While this injunction remains in force, the taxauthorities cannot seek collection from us in respect of any Article 74 assessments and, for such time, we arethus not required to post bond in order to avoid collection.
Railway litigation
In August 2006, the Brazilian federal rail network, Rede Ferroviaria Federal S.A.—RFFSA, filed abreach of contract claim against us for R$3.054 billion (US$1.641 billion) in damages, stemming from a 1994agreement regarding the construction of two railway networks. The RFFSA has since been succeeded asplaintiff by the Brazilian government.
In 1994, prior to its privatization, Vale entered into a contract with RFFSA to build two railwaynetworks in Belo Horizonte, Brazil, which were to be incorporated into an existing railway segment, in aproject called ‘‘Transposicao de Belo Horizonte.’’ We subsequently entered into a related agreement with theBrazilian government to begin the construction of an alternative railway segment, because the initially agreedupon segments could not be built.
Before the RFFSA lawsuit was filed, we filed a claim against RFFSA, now succeeded as defendant bythe Brazilian government, which challenged the inflation adjustment provisions in the contract with RFFSA.We contend that the method of calculation employed by the Brazilian government is not lawful underBrazilian law.
Pursuant to a partial settlement, the construction costs of the new segment will be set off against thedamages sought under the original RFFSA claim, which would significantly reduce the amount we would berequired to pay in damages if such claim is decided in the Brazilian government’s favor.
Gold forward contracts litigation
We were a defendant in a case brought by the pension fund Petros with respect to certain goldforward contracts entered into in 1988 and 1989, which, following a resolution passed by the Braziliangovernment, through the Brazilian Central Bank, we were obligated to settle in cash instead of by physicaldelivery. In its suit, Petros claimed that the inflation adjustment provided for in the contracts did notadequately compensate it for monetary losses arising from the government’s measures to control inflation.
In April 2011, the Superior Court of Justice ruled against us in this matter. Although this decision canstill be reversed, we were required to pay the total amount of R$346.8 million (US$185.6 million) claimed byPetros in the lawsuit. If the decision is reversed, we will be entitled to recover this amount under a bankguarantee.
There are ten other cases arising under similar facts. The total amount claimed in these cases isR$130.4 million (US$69.8 million).
Transger suit
One of our subsidiaries, FCA, is a defendant in a suit first filed in state court in Minas Gerais byTransger S.A. (‘‘Transger’’) and later moved to federal court. Transger seeks money damages and theannulment of certain General Meetings that occurred in early 2003, at which shareholders approved anincrease in FCA’s share capital, on the grounds of allegedly abusive acts by FCA’s controlling group. Thecourt of first instance initially ruled against the defendants, but subsequently rescinded the judgment to allowfor the preparation of an additional expert report.
135

MEMORANDUM AND ARTICLES OF ASSOCIATION
Company objectives and purposes
Our corporate purpose is defined by our bylaws to include:
� the exploration of mineral deposits in Brazil and abroad by means of research, extraction,processing, industrialization, transportation, shipment and commerce of mineral goods;
� the building and operation of railways and the provision of our own or unrelated-party rail traffic;
� the building and operation of our own or unrelated-party maritime terminals, and the provision ofshipping activities and port services;
� the provision of logistics services integrated with cargo transport, including inflow management,storage, transshipment, distribution and delivery, all within a multimodal transport system;
� the production, processing, transport, industrialization and commercialization of any and allsources and forms of energy, including the production, generation, transmission, distribution andcommercialization of our own products, derivatives and sub products;
� the engagement, in Brazil or abroad, of other activities that may be of direct or indirectconsequence for the achievement of our corporate purposes, including research, industrialization,purchases and sales, importation and exportation, the development, industrialization andcommercialization of forest resources and the provision of services of any kind whatsoever; and
� the establishment or participation, in any fashion, in other companies, consortia or associationsdirectly or indirectly related to our business purpose.
Common shares and preferred shares
Set forth below is certain information concerning our authorized and issued share capital and a briefsummary of certain significant provisions of our bylaws and Brazilian corporate law. This description does notpurport to be complete and is qualified by reference to our bylaws (an English translation of which we havefiled with the SEC) and to Brazilian corporate law.
Our bylaws authorize the issuance of up to 3.6 billion common shares and up to 7.2 billion preferredshares, in each case based solely on the approval of the Board of Directors without any additionalshareholder approval.
Each common share entitles the holder thereof to one vote at meetings of our shareholders. Holdersof common shares are not entitled to any preference relating to our dividends or other distributions.
Holders of preferred shares and the golden shares are generally entitled to the same voting rights asholders of common shares, except with respect to the election of members of the Board of Directors, and areentitled to a preferential dividend as described below. Non-controlling shareholders holding common sharesrepresenting at least 15% of our voting capital, and preferred shares representing at least 10% of our totalshare capital, have the right to appoint each one member and an alternate to our Board of Directors. If nogroup of common or preferred shareholders meets the thresholds described above, shareholders holdingpreferred or common shares representing at least 10% of our total share capital are entitled to combine theirholdings to appoint one member and an alternate to our Board of Directors. Holders of preferred shares,including the golden shares, may elect one member of the permanent Fiscal Council and the respectivealternate. Non-controlling holders of common shares may also elect one member of the Fiscal Council and analternate, pursuant to applicable CVM rules.
136

The Brazilian government holds 12 golden shares of Vale. The golden shares are preferred shares thatentitle the holder to the same rights (including with respect to voting and dividend preference) as holders ofpreferred shares. In addition, the holder of the golden shares is entitled to veto any proposed action relatingto the following matters:
� a change in our name;
� a change in the location of our head office;
� a change in our corporate purpose as regards mining activities;
� any liquidation of the Company;
� any disposal or winding up of activities in any of the following parts of our iron ore miningintegrated systems:
(a) mineral deposits, ore deposits, mines;
(b) railways; or
(c) ports and maritime terminals;
� any change in the bylaws relating to the rights afforded to the classes of capital stock issued byus; and
� any change in the bylaws relating to the rights afforded the golden shares.
Calculation of distributable amount
At each annual shareholders’ meeting, the Board of Directors is required to recommend, based on theexecutive officers’ proposal, how to allocate our earnings for the preceding fiscal year. For purposes ofBrazilian corporate law, a company’s net income after income taxes and social contribution taxes for suchfiscal year, net of any accumulated losses from prior fiscal years and amounts allocated to employees’ andmanagement’s participation in earnings represents its ‘‘net profits’’ for such fiscal year. In accordance withBrazilian corporate law, an amount equal to our net profits, as further reduced by amounts allocated to thelegal reserve, to the fiscal incentive investment reserve, to the contingency reserve or to the unrealized incomereserve established by us in compliance with applicable law (discussed below) and increased by reversals ofreserves constituted in prior years, is available for distribution to shareholders in any given year. Suchamount, the adjusted net profits, is referred to herein as the distributable amount. We may also establishdiscretionary reserves, such as reserves for investment projects.
The Brazilian corporate law provides that all discretionary allocations of net profits, includingdiscretionary reserves, the contingency reserve, the unrealized income reserve and the reserve for investmentprojects, are subject to approval by the shareholders voting at the annual meeting and can be transferred tocapital or used for the payment of dividends in subsequent years. The fiscal incentive investment reserve andlegal reserve are also subject to approval by the shareholders voting at the annual meeting and may betransferred to capital but are not available for the payment of dividends in subsequent years.
The sum of certain discretionary reserves may not exceed the amount of our paid-in capital. Whensuch limit is reached, our shareholders may vote to use the excess to pay in capital, increase capital ordistribute dividends.
Our calculation of net profits and allocations to reserves for any fiscal year are determined on thebasis of financial statements prepared in accordance with Brazilian corporate law. Our consolidated financialstatements have been prepared in accordance with U.S. GAAP and, although our allocations to reserves and
137

dividends will be reflected in these financial statements, investors will not be able to calculate such allocationsor required dividend amounts from our consolidated financial statements.
Mandatory dividend
The Brazilian corporate law and our bylaws prescribe that we must distribute to our shareholders inthe form of dividends or interest on shareholders’ equity an annual amount equal to not less than 25% of thedistributable amount, referred to as the mandatory dividend, unless the Board of Directors advises ourshareholders at our general shareholders’ meeting that payment of the mandatory dividend for the precedingyear is inadvisable in light of our financial condition. To date, our Board of Directors has never determinedthat payment of the mandatory dividend was inadvisable. The Fiscal Council must review any suchdetermination and report it to the shareholders. In addition to the mandatory dividend, our Board ofDirectors may recommend to the shareholders payment of dividends from other funds legally availabletherefore. Any payment of interim dividends will be netted against the amount of the mandatory dividend forthat fiscal year. The shareholders must also approve the recommendation of the Board of Directors withrespect to any required distribution. The amount of the mandatory dividend is subject to the size of the legalreserve, the contingency reserve, and the unrealized income reserve. The amount of the mandatory dividend isnot subject to the size of the discretionary depletion reserve. See—Calculation of distributable amount.
Dividend preference of preferred shares
Pursuant to our bylaws, holders of preferred shares and the golden shares are entitled to a minimumannual non-cumulative preferential dividend equal to (i) at least 3% of the book value per share, calculatedin accordance with the financial statements which serve as reference for the payment of dividends, or (ii) 6%of their pro rata share of our paid-in capital, whichever is higher. To the extent that we declare dividends inany particular year in amounts which exceed the preferential dividends on preferred shares, and after holdersof common shares have received distributions equivalent, on a per share basis, to the preferential dividendson preferred shares, holders of common shares and preferred shares shall receive the same additionaldividend amount per share. Since the first step of our privatization in 1997, we have had sufficientdistributable amounts to be able to distribute equal amounts to both common and preferred shareholders.
Other matters relating to our preferred shares
Our bylaws do not provide for the conversion of preferred shares into common shares. In addition,the preferred shares do not have any preference upon our liquidation and there are no redemption provisionsassociated with the preferred shares.
Distributions classified as shareholders’ equity
Brazilian companies are permitted to pay limited amounts to shareholders and treat such payments asan expense for Brazilian income tax purposes. Our bylaws provide for the distribution of interest onshareholders’ equity as an alternative form of payment to shareholders. The interest rate applied is limited tothe Brazilian long-term interest rate, or TJLP, for the applicable period. The deduction of the amount ofinterest paid cannot exceed the greater of (1) 50% of net income (after the deduction of the provision ofsocial contribution on net profits and before the deduction of the provision of the corporate income tax)before taking into account any such distribution for the period in respect of which the payment is made or(2) 50% of the sum of retained earnings and profit reserves. Any payment of interest on shareholders’ equityis subject to Brazilian withholding income tax. See Additional information—Taxation. Under our bylaws, theamount paid to shareholders as interest on shareholders’ equity (net of any withholding tax) may be includedas part of any mandatory and minimum dividend. Under Brazilian corporate law, we are obligated todistribute to shareholders an amount sufficient to ensure that the net amount received, after payment by us ofapplicable Brazilian withholding taxes in respect of the distribution of interest on shareholders’ equity, is atleast equal to the mandatory dividend.
138

Mandatorily convertible notes
In 2009, our wholly owned subsidiary Vale Capital II issued mandatorily convertible notes in twoseries, both due June 15, 2012. The series VALE-2012 notes (US$293 million principal amount) aremandatorily convertible into ADSs representing an aggregate maximum of 18,415,859 common shares. Theseries VALE.P-2012 notes (US$649 million principal amount) are mandatorily convertible into ADSsrepresenting an aggregate maximum of 47,284,791 preferred shares.
The mandatorily convertible notes of Vale Capital II can convert before maturity under specifiedcircumstances. The conversion rate for all series will depend on the market price of the ADSs on theconversion date. Under the indentures governing the notes, additional remuneration is due to each noteholderin an amount in U.S. dollars equal to any cash distribution net of any applicable withholding tax and feespaid by the Depositary of our ADSs to the holder of one ADS, multiplied by the number of ADSs that wouldbe received by the noteholder upon conversion of the notes at the conversion rate specified in the applicableindenture.
Voting rights
Each common share entitles the holder thereof to one vote at meetings of our shareholders. Holdersof preferred shares are entitled to the same voting rights as holders of common shares except for the electionof members of the Board of Directors, which will no longer apply in the event of any dividend arrearage, asdescribed below. One of the members of the permanent Fiscal Council and his or her alternate are elected bymajority vote of the holders of preferred shares. Holders of preferred shares and common shares may, incertain circumstances, combine their respective holdings to elect members of our Board of Directors, asdescribed under—Common shares and preferred shares.
The golden shares entitle the holder thereof to the same voting rights as holders of preferred shares.The golden shares also confer certain other significant veto rights in respect of particular actions, as describedunder—Common shares and preferred shares.
The Brazilian corporate law provides that non-voting or restricted-voting shares, such as the preferredshares, acquire unrestricted voting rights beginning when a company has failed for three consecutive fiscalyears (or for any shorter period set forth in a company’s constituent documents) to pay any fixed or minimumdividend to which such shares are entitled and continuing until payment thereof is made. Our bylaws do notset forth any such shorter period.
Any change in the preferences or advantages of our preferred shares, or the creation of a class ofshares having priority over the preferred shares, would require the approval of the holder of the goldenshares, who can veto such matters, as well as the approval of the holders of a majority of the outstandingpreferred shares, voting as a class at a special meeting.
Shareholders’ meetings
Our Ordinary General Shareholders’ Meeting is convened by April of each year for shareholders toresolve upon our financial statements, distribution of profits, election of Directors and Fiscal CouncilMembers, if necessary, and compensation of senior management. Extraordinary General Shareholders’Meetings are convened by the Board of Directors as necessary in order to decide all other matters relating toour corporate purposes and to pass such other resolutions as may be necessary.
Pursuant to Brazilian corporate law, shareholders voting at a general shareholders’ meeting have thepower, among other powers, to:
� amend the bylaws;
139

� elect or dismiss members of the Board of Directors and members of the Fiscal Council at anytime;
� establish the remuneration of senior management and members of the Fiscal Council;
� receive annual reports by management and accept or reject management’s financial statementsand recommendations including the allocation of net profits and the distributable amount forpayment of the mandatory dividend and allocation to the various reserve accounts;
� authorize the issuance of convertible and secured debentures;
� suspend the rights of a shareholder in default of obligations established by law or by the bylaws;
� accept or reject the valuation of assets contributed by a shareholder in consideration for issuanceof capital stock;
� pass resolutions to reorganize our legal form, to merge, consolidate or split us, to dissolve andliquidate us, to elect and dismiss our liquidators and to examine their accounts; and
� authorize management to file for bankruptcy or to request a judicial restructuring.
Pursuant to CVM recommendations and as stipulated in our undertakings to the HKEx, all generalshareholders’ meetings, including the annual shareholders’ meeting, require no fewer than 30 days notice toshareholders prior to the scheduled meeting date. Where any general shareholders’ meeting is adjourned,15 days prior notice to shareholders of the reconvened meeting is required. Pursuant to Brazilian corporatelaw, this notice to shareholders is required to be published no fewer than three times, in the Diario Oficial doEstado do Rio de Janeiro and in a newspaper with general circulation in the city where we have our registeredoffice, in Rio de Janeiro. Our shareholders have previously designated Jornal do Commercio for this purpose.Also, because our shares are traded on the BM&FBOVESPA, we must publish a notice in a Sao Paulo basednewspaper. Such notice must contain the agenda for the meeting and, in the case of an amendment to ourbylaws, an indication of the meeting’s subject matter. In addition, under our bylaws, the holder of the goldenshares is entitled to a minimum of 15 days prior formal notice to its legal representative of any generalshareholders’ meeting to consider any proposed action subject to the veto rights accorded to the goldenshares. See—Common shares and preferred shares.
A shareholders’ meeting may be held if shareholders representing at least one-quarter of the votingcapital are present, except as otherwise provided, including for meetings convened to amend our bylaws,which require a quorum of at least two-thirds of the voting capital. If no such quorum is present, notice mustagain be given in the same manner as described above, and a meeting may then be convened without anyspecific quorum requirement, subject to the minimum quorum and voting requirements for certain matters, asdiscussed below. A shareholder without a right to vote may attend a general shareholders’ meeting and takepart in the discussion of matters submitted for consideration.
Except as otherwise provided by law, resolutions of a shareholders’ meeting are passed by a simplemajority vote, abstentions not being taken into account. Under Brazilian corporate law, the approval ofshareholders representing at least one-half of the issued and outstanding voting shares is required for thetypes of action described below, as well as, in the case of the first two items below, a majority of issued andoutstanding shares of the affected class:
� creating a new class of preferred shares or disproportionately increasing an existing class ofpreferred shares relative to the other classes of preferred shares, other than to the extentpermitted by the bylaws;
140

� changing a priority, preference, right, privilege or condition of redemption or amortization of anyclass of preferred shares or creating a new class of shares with greater privileges than the existingclasses of preferred shares;
� reducing the mandatory dividend;
� changing the corporate purposes;
� merging us with another company or consolidating or splitting us;
� participating in a centralized group of companies as defined under Brazilian corporate law;
� dissolving or liquidating us; and
� canceling any ongoing liquidation of us.
Whenever the shares of any class of capital stock are entitled to vote, each share is entitled to onevote. Annual shareholders’ meetings must be held by April 30 of each year. Shareholders’ meetings are called,convened and presided over by the chairman or, in case of his absence, by the vice-chairman of our Board ofDirectors. In the case of temporary impediment or absence of the chairman or vice-chairman of the Board ofDirectors, the shareholders’ meetings may be chaired by their respective alternates, or in the absence orimpediment of such alternates, by a director especially appointed by the chairman of the Board of Directors.A shareholder may be represented at a general shareholders’ meeting by a proxy appointed in accordancewith applicable Brazilian law not more than one year before the meeting, who must be a shareholder, acompany officer, a lawyer or a financial institution.
Redemption rights
Our common shares and preferred shares are not redeemable, except that a dissenting shareholder isentitled under Brazilian corporate law to obtain redemption upon a decision made at a shareholders’ meetingapproving any of the items listed above, as well as:
� any decision to transfer all of our shares to another company in order to make us a wholly ownedsubsidiary of such company, a stock merger;
� any decision to approve the acquisition of control of another company at a price which exceedscertain limits set forth in Brazilian corporate law; or
� in the event that the entity resulting from (a) a merger, (b) a stock merger as described inclause (i) above or (c) a spin-off that we conduct fails to become a listed company within120 days of the general shareholders’ meeting at which such decision was taken.
Only holders of shares adversely affected by shareholder decisions altering the rights, privileges orpriority of a class of shares or creating a new class of shares may require us to redeem their shares. The rightof redemption triggered by shareholder decisions to merge, consolidate or to participate in a centralizedgroup of companies may only be exercised if our shares do not satisfy certain tests of liquidity, among others,at the time of the shareholder resolution. The right of redemption lapses 30 days after publication of theminutes of the relevant general shareholders’ meeting, unless, as in the case of resolutions relating to therights of preferred shares or the creation of a new class of preferred shares, the resolution is subject toconfirmation by the preferred shareholders (which must be made at a special meeting to be held within oneyear), in which case the 30-day term is counted from the publication of the minutes of the special meeting.
We would be entitled to reconsider any action giving rise to redemption rights within 10 daysfollowing the expiration of such rights if the redemption of shares of dissenting shareholders would jeopardizeour financial stability. Any redemption pursuant to Brazilian corporate law would be made at no less than the
141
book value per share, determined on the basis of the last balance sheet approved by the shareholders;provided that if the general shareholders’ meeting giving rise to redemption rights occurred more than60 days after the date of the last approved balance sheet, a shareholder would be entitled to demand that hisor her shares be valued on the basis of a new balance sheet dated within 60 days of such generalshareholders’ meeting.
Preemptive rights
Each of our shareholders has a general preemptive right to subscribe for shares in any capitalincrease, in proportion to his or her shareholding. A minimum period of 30 days following the publication ofnotice of a capital increase is assured for the exercise of the right, and the right is transferable. Under ourbylaws and Brazilian corporate law, and subject to the requirement for shareholder approval of any necessaryincrease to our authorized share capital, our Board of Directors may decide not to extend preemptive rightsto our shareholders, or to reduce the 30-day period for the exercise of preemptive rights, in each case withrespect to any issuance of shares, debentures convertible into shares or warrants in the context of a publicoffering. In the event of a capital increase that would maintain or increase the proportion of capitalrepresented by preferred shares, holders of preferred shares will have preemptive rights to subscribe only tonewly issued preferred shares. In the event of a capital increase that would reduce the proportion of capitalrepresented by preferred shares, shareholders will have preemptive rights to subscribe for preferred shares, inproportion to their shareholdings, and for common shares only to the extent necessary to prevent dilution oftheir overall interest in us. In the event of a capital increase that would maintain or increase the proportionof capital represented by common shares, shareholders will have preemptive rights to subscribe only to newlyissued common shares. In the event of a capital increase that would reduce the proportion of capitalrepresented by common shares, holders of common shares will have preemptive rights to subscribe forpreferred shares only to the extent necessary to prevent dilution of their overall interest in us.
Tag-along rights
According to Brazilian corporate law, in the event of a sale of control of a company, the acquirer isobliged to offer to holders of voting shares the right to sell their shares for a price equal to at least 80% ofthe price paid for the voting shares representing control.
Form and transfer of shares
Our preferred shares and common shares are in book-entry form registered in the name of eachshareholder or its nominee. The transfer of such shares is made under Brazilian corporate law, which providesthat a transfer of shares is effected by our transfer agent, Banco Bradesco S.A., upon presentation of validshare transfer instructions to us by a transferor or its representative. When preferred shares or commonshares are acquired or sold on a Brazilian stock exchange, the transfer is effected on the records of ourtransfer agent by a representative of a brokerage firm or the stock exchange’s clearing system. Transfers ofshares by a foreign investor are made in the same way and are executed by the investor’s local agent, who isalso responsible for updating the information relating to the foreign investment furnished to the Central Bankof Brazil.
The BM&FBOVESPA operates a central clearing system through Companhia Brasileira de Liquidacaoe Custodia, or CBLC. A holder of our shares may participate in this system and all shares elected to be putinto the system will be deposited in custody with CBLC (through a Brazilian institution that is duly authorizedto operate by the Central Bank of Brazil and maintains a clearing account with CBLC). The fact that suchshares are subject to custody with the relevant stock exchange will be reflected in our registry of shareholders.Each participating shareholder will, in turn, be registered in the register of our beneficial shareholders that ismaintained by CBLC and will be treated in the same way as registered shareholders.
142

EXCHANGE CONTROLS AND OTHER LIMITATIONSAFFECTING SECURITY HOLDERS
Under Brazilian corporate law, there are no restrictions on ownership of our capital stock byindividuals or legal entities domiciled outside Brazil. However, the right to convert dividend payments andproceeds from the sale of preferred shares or common shares into foreign currency and to remit suchamounts outside Brazil is subject to restrictions under foreign investment legislation which generally requires,among other things, that the relevant investment be registered with the Central Bank of Brazil. Theserestrictions on the remittance of foreign capital abroad could hinder or prevent the depositary bank and itsagents for the preferred shares or common shares represented by ADSs and HDSs from converting dividends,distributions or the proceeds from any sale of preferred shares, common shares or rights, as the case may be,into U.S. dollars or Hong Kong dollars and remitting such amounts abroad. Delays in, or refusal to grant anyrequired government approval for conversions of Brazilian currency payments and remittances abroad ofamounts owed to holders of ADSs and HDSs could adversely affect holders of ADRs and HDRs.
Under Resolution No. 2,689/2000 of the CMN, foreign investors may invest in almost all financialassets and engage in almost all transactions available in the Brazilian financial and capital markets, providedthat certain requirements are fulfilled. In accordance with Resolution No. 2,689/2000, the definition of foreigninvestor includes individuals, legal entities, mutual funds and other collective investment entities, domiciled orheadquartered outside Brazil.
Under Resolution No. 2,689/2000, a foreign investor must:
(1) appoint at least one representative in Brazil, with powers to perform actions relating to itsinvestment,
(2) complete the appropriate foreign investor registration form,
(3) register as a foreign investor with the CVM, and register its foreign investment with the CentralBank of Brazil, and
(4) appoint a custodian, duly licensed by the Central Bank of Brazil, if the Brazilian representative initem (1) is not a financial institution.
Resolution No. 2,689/2000 specifies the manner of custody and the permitted means for tradingsecurities held by foreign investors under the resolution.
Moreover, the offshore transfer or assignment of securities or other financial assets held by foreigninvestors pursuant to Resolution No. 2,689/2000 is prohibited, except for transfers resulting from a corporatereorganization, or occurring upon the death of an investor by operation of law or will.
Resolution No. 1,927/1992 of the CMN provides for the issuance of depositary receipts in foreignmarkets in respect of shares of Brazilian issuers. It provides that the proceeds from the sale of ADSs byholders of ADRs outside Brazil are not subject to Brazilian foreign investment controls and holders of ADSswho are not residents of a low-tax jurisdiction (paıs com tributacao favorecida), as defined by Brazilian law,will be entitled to favorable tax treatment.
An electronic registration has been issued to the custodian in the name of the depositary with respectto the ADSs and HDSs. Pursuant to this electronic registration, the custodian and the depositary are able toconvert dividends and other distributions with respect to the underlying shares into foreign currency and toremit the proceeds outside Brazil. If a holder exchanges ADSs or HDSs for preferred shares or commonshares, the holder must, within five business days, seek to obtain its own electronic registration with theCentral Bank of Brazil under Law No. 4,131/1962 and Resolution No. 2,689/2000. Thereafter, unless theholder has registered its investment with the Central Bank of Brazil, such holder may not convert into foreign
143
currency and remit outside Brazil the proceeds from the disposition of, or distributions with respect to, suchpreferred shares or common shares.
Under Brazilian law, whenever there is a serious imbalance in Brazil’s balance of payments or reasonsto foresee a serious imbalance, the Brazilian government may impose temporary restrictions on the remittanceto foreign investors of the proceeds of their investments in Brazil, and on the conversion of Brazilian currencyinto foreign currencies. Such restrictions may hinder or prevent the custodian or holders who have exchangedADSs or HDSs for underlying preferred shares or common shares from converting distributions or theproceeds from any sale of such shares, as the case may be, into U.S. dollars or Hong Kong dollars andremitting such U.S. dollars or Hong Kong dollars abroad. In the event the custodian is prevented fromconverting and remitting amounts owed to foreign investors, the custodian will hold the reais it cannot convertfor the account of the holders of ADRs or HDRs who have not been paid. The depositary will not invest thereais and will not be liable for interest on those amounts. Any reais so held will be subject to devaluation riskagainst the U.S. dollar or Hong Kong dollar.
TAXATION
The following summary contains a description of the principal Brazilian and U.S. federal income taxconsequences of the ownership and disposition of preferred shares, common shares, ADSs or HDSs. Youshould know that this summary does not purport to be a comprehensive description of all the taxconsiderations that may be relevant to a holder of preferred shares, common shares, ADSs or HDSs.
Holders of preferred shares, common shares, ADSs or HDSs should consult their own tax advisors todiscuss the tax consequences of the purchase, ownership and disposition of preferred shares, common shares,ADSs or HDSs, including, in particular, the effect of any state, local or other national tax laws.
Although there is at present no treaty to avoid double taxation between Brazil and the United States,but only a common understanding between the two countries according to which income taxes paid in onemay be offset against taxes to be paid in the other, both countries’ tax authorities have been havingdiscussions that may result in the execution of such a treaty. In this regard, the two countries signed a TaxInformation Exchange Agreement on March 20, 2007. We cannot predict whether or when such a treaty willenter into force or how, if entered into, such a treaty will affect the U.S. holders, as defined below, ofpreferred shares, common shares or ADSs.
Brazilian tax considerations
The following discussion summarizes the principal Brazilian tax consequences of the acquisition,ownership and disposition of preferred shares, common shares, ADSs or HDSs by a holder not deemed to bedomiciled in Brazil for purposes of Brazilian taxation (‘‘Non-Brazilian Holder’’). It is based on the tax laws ofBrazil and regulations thereunder in effect on the date hereof, which are subject to change (possibly withretroactive effect). This discussion does not specifically address all of the Brazilian tax considerationsapplicable to any particular Non-Brazilian Holder. Therefore, Non-Brazilian Holders should consult their owntax advisors concerning the Brazilian tax consequences of an investment in preferred shares, common shares,ADSs or HDSs.
Shareholder distributions
For Brazilian corporations, such as the Company, distributions to shareholders are classified as eitherdividend or interest on shareholders’ equity.
Dividends
Amounts distributed as dividends, including distributions in kind, will generally not be subject towithholding income tax if the distribution is paid by us from profits of periods beginning on or after
144

January 1, 1996 (1) to the depositary in respect of our preferred shares or common shares underlying theADSs or HDSs or (2) to a Non-Brazilian Holder in respect of our preferred shares or common shares.Dividends paid from profits generated before January 1, 1996 may be subject to Brazilian withholding incometax at varying rates depending on the year the profits were generated.
Interest on shareholders’ equity
Amounts distributed as interest on shareholders’ equity are generally subject to withholding incometax at the rate of 15%, except where:
(1) the beneficiary is exempt from tax in Brazil, in which case the distribution will not be subject towithholding income tax;
(2) the beneficiary is located in a jurisdiction that does not impose income tax or where themaximum income tax rate is lower than 20% (a ‘‘Low Tax Jurisdiction’’) or where internallegislation imposes restrictions on the disclosure of the shareholding structure or the ownership ofthe investment, in which case the applicable withholding income tax rate is 25%; or
(3) the effective beneficiary is resident in Japan, in which case the applicable withholding income taxrate is 12.5%.
Interest on shareholders’ equity is calculated as a percentage of shareholders’ equity, as stated in thestatutory accounting records. The interest rate applied may not exceed TJLP, the benchmark Brazilianlong-term interest rate. In addition, the amount of distributions classified as interest on shareholders’ equitymay not be more than the greater of (1) 50% of net income (after the deduction of social contribution on netprofits but before taking into account such payment of interest and the provision for corporate income tax)for the period in respect of which the payment is made and (2) 50% of the sum of retained earnings andprofit reserves.
Payments of interest on shareholders’ equity are deductible for the purposes of corporate income taxand social contribution on net profit, to the extent of the limits described above. The tax benefit to theCompany in the case of a distribution by way of interest on shareholders’ equity is a reduction in theCompany’s corporate tax charge by an amount equivalent to 34% of such distribution.
Taxation of capital gains
Taxation of Non-Brazilian Holders on capital gains depends on the status of the holder as either:
(1) (i) not resident or domiciled in a Low Tax Jurisdiction or where internal legislation imposesrestrictions on the disclosure of shareholding structure or the ownership of the investment andregistered its investment in Brazil in accordance with Resolution No. 2,689 (a 2,689 Holder), or(ii) a holder of ADSs or HDSs; or
(2) any other Non-Brazilian Holder.
Investors identified in item 1 are subject to favorable tax treatment, as described below.
According to Law No. 10,833, dated December 29, 2003, capital gains realized by a Non-BrazilianHolder from the disposition of ‘‘assets located in Brazil’’ are subject to taxation in Brazil.
Preferred shares and common shares qualify as assets located in Brazil, and the disposition of suchassets by a Non-Brazilian Holder may be subject to income tax on the gains assessed, in accordance with therules described below, regardless of whether the transaction is carried out with another Non-Brazilian residentor with a Brazilian resident.
145
There is some uncertainty as to whether ADSs or HDSs qualify as ‘‘assets located in Brazil’’ forpurposes of Law No. 10,833/03. Arguably, neither ADSs nor HDSs constitute assets located in Brazil andtherefore the gains realized by a Non-Brazilian Holder on the disposition of ADSs or HDSs to anotherNon-Brazilian resident should not be subject to income tax in Brazil. However, it cannot be guaranteed thatthe Brazilian courts will uphold this interpretation of the definition of ‘‘assets located in Brazil’’ in connectionwith the taxation of gains realized by a Non-Brazilian Holder on the disposition of ADSs or HDSs.Consequently, gains on a disposition of ADSs or HDSs by a Non-Brazilian Holder (whether in a transactioncarried out with another Non-Brazilian Holder or a person domiciled in Brazil) may be subject to income taxin Brazil in accordance with the rules applicable to a disposition of shares.
Although there are grounds to sustain otherwise, the deposit of preferred shares or common shares inexchange for ADSs or HDSs may be subject to Brazilian income tax if the acquisition cost of the preferredshares or common shares being deposited is lower than the average price of the preferred shares or commonshares (as the case may be), which is determined as either:
(1) the average price per preferred share or common share on the Brazilian stock exchange in whichthe greatest number of such shares were sold on the day of deposit; or
(2) if no preferred shares or common shares were sold on that day, the average price on theBrazilian stock exchange in which the greatest number of preferred shares or common shareswere sold in the 15 trading sessions immediately preceding such deposit.
The positive difference between the average price of the preferred shares or common sharescalculated as described above and their acquisition cost will be considered to be a capital gain subject toincome tax in Brazil. In some circumstances, there are grounds to sustain that such taxation is not applicablewith respect to any 2,689 Holder, provided he is not located in a Low Tax Jurisdiction.
The withdrawal of ADSs or HDSs in exchange for preferred shares or common shares is not subjectto Brazilian income tax, subject to compliance with applicable regulations regarding the registration of theinvestment with the Central Bank of Brazil.
For the purpose of Brazilian taxation, the income tax rules on gains related to disposition of preferredshares or common shares vary depending on:
� the domicile of the Non-Brazilian Holder;
� the method by which such Non-Brazilian Holder has registered his investment with the CentralBank of Brazil; and
� how the disposition is carried out, as described below.
The gain realized as a result of a transaction on a Brazilian stock, future and commodities exchange isthe difference between: (i) the amount in Brazilian currency realized on the sale or disposition and (ii) theacquisition cost, without any adjustment for inflation, of the securities that are the subject of the transaction.
Any gain realized by a Non-Brazilian Holder on a sale or disposition of preferred shares or commonshares carried out on the Brazilian stock exchange is:
� exempt from income tax where the Non-Brazilian Holder (i) is a 2,689 Holder; and (ii) is notlocated in a Low Tax Jurisdiction;
146

� subject to income tax at a rate of 15% where the Non-Brazilian Holder either (A) (i) is not a2,689 Holder and (ii) is not resident or domiciled in a Low Tax Jurisdiction or (B) (i) is a 2,689Holder and (ii) is resident or domiciled in a Low Tax Jurisdiction; or
� subject to income tax at a rate of 25% where the Non-Brazilian Holder (i) is not a 2,689 Holderand (ii) is resident or domiciled in a Low Tax Jurisdiction.
The sale or disposition of common shares carried out on the Brazilian stock exchange is subject towithholding tax at the rate of 0.005% on the sale value. This withholding tax can be offset against theeventual income tax due on the capital gain. A 2,689 Holder that is not resident or domiciled in a Low TaxJurisdiction is not required to withhold income tax.
Any gain realized by a Non-Brazilian Holder on a sale or disposition of preferred shares or commonshares that is not carried out on the Brazilian stock exchange is subject to income tax at a 15% rate, exceptfor gain realized by a resident in a Low Tax Jurisdiction, which is subject to income tax at the rate of 25%.
With respect to transactions arranged by a broker that are conducted on the Brazilian non-organizedover-the-counter market, a withholding income tax at a rate of 0.005% on the sale value is also levied on thetransaction and can be offset against the eventual income tax due on the capital gain. There can be noassurance that the current favorable treatment of 2,689 Holders will continue in the future.
In the case of a redemption of preferred shares, common shares, ADSs or HDSs or a capitalreduction by a Brazilian corporation, the positive difference between the amount received by anyNon-Brazilian Holder and the acquisition cost of the preferred shares, common shares, ADSs or HDSs beingredeemed is treated as capital gain and is therefore generally subject to income tax at the rate of 15%, whilethe 25% rate applies to residents in a Low Tax Jurisdiction.
Any exercise of pre-emptive rights relating to our preferred shares or common shares will not besubject to Brazilian taxation. Any gain realized by a Non-Brazilian Holder on the disposition of pre-emptiverights relating to preferred shares or common shares in Brazil will be subject to Brazilian income taxation inaccordance with the same rules applicable to the sale or disposition of preferred shares or common shares.
Tax on foreign exchange and financial transactions
Foreign exchange transactions
Brazilian law imposes a tax on foreign exchange transactions, or an IOF/Exchange Tax, due on theconversion of reais into foreign currency and on the conversion of foreign currency into reais. Currently, formost foreign currency exchange transactions, the rate of IOF/Exchange is 0.38%.
Effective as of December 1, 2011, the inflow of resources into Brazil for the acquisition orsubscription of common shares through public offerings in Brazilian financial and capital markets by aNon-Brazilian Holder are exempt from the IOF/Exchange rate, provided that the issuer has registered itsshares for trading on the Brazilian stock exchange, as well as the inflow of resources into Brazil originatingfrom the cancellation of depository receipts, provided that they are invested in the Brazilian stock exchange.
The outflow of resources from Brazil related to investments carried out by a Non-Brazilian Holder inthe Brazilian financial and capital markets is currently subject to IOF/Exchange at a zero percent rate. In anycase, the Brazilian government may increase such rates at any time, up to 25%, with no retroactive effect.
147

Transactions involving bonds and securities
Brazilian law imposes a tax on transactions involving bonds and securities, or an IOF/Bonds Tax,including those carried out on the Brazilian stock exchange. The rate of IOF/Bonds Tax applicable totransactions involving publicly traded bonds and securities in Brazil is currently zero. However, the BrazilianGovernment may increase such rate at any time up to 1.5% of the transaction amount per day, but the taxcannot be applied retroactively. In addition, the transfer of shares traded on the Brazilian stock exchange toback the issuance of depositary receipts are subject to IOF/Bonds Tax at a rate of 1.5% starting November 19,2009.
Other Brazilian taxes
There are no Brazilian inheritance, gift or succession taxes applicable to the ownership, transfer ordisposition of preferred shares, common shares, ADSs or HDSs by a Non-Brazilian Holder, except for giftand inheritance taxes which are levied by some states of Brazil on gifts made or inheritances bestowed by aNon-Brazilian Holder to individuals or entities resident or domiciled within such states in Brazil. There areno Brazilian stamp, issue, registration, or similar taxes or duties payable by holders of preferred shares orcommon shares or ADSs or HDSs.
U.S. federal income tax considerations
This summary does not purport to be a comprehensive description of all the U.S. federal income taxconsequences of the acquisition, holding or disposition of the preferred shares, common shares or ADSs. Thissummary applies to U.S. holders, as defined below, who hold their preferred shares, common shares or ADSsas capital assets and does not apply to special classes of holders, such as:
� certain financial institutions,
� insurance companies,
� dealers in securities or foreign currencies,
� tax-exempt organizations,
� securities traders who elect to account for their investment in preferred shares, common shares orADSs on a mark-to-market basis,
� persons holding preferred shares, common shares or ADSs as part of hedge, straddle, conversionor other integrated financial transactions for tax purposes,
� holders whose functional currency for U.S. federal income tax purposes is not the U.S. dollar,
� partnerships or other holders treated as ‘‘pass-through entities’’ for U.S. federal income taxpurposes,
� persons subject to the alternative minimum tax, or
� persons owning, actually or constructively, 10% or more of our voting shares.
This discussion is based on the Internal Revenue Code of 1986, as amended to the date hereof,administrative pronouncements, judicial decisions and final, temporary and proposed Treasury Regulations, allas in effect on the date hereof. These authorities are subject to differing interpretations and may be changed,perhaps retroactively, so as to result in U.S. federal income tax consequences different from those discussedbelow. There can be no assurance that the U.S. Internal Revenue Service (the ‘‘IRS’’) will not challenge oneor more of the tax consequences discussed herein or that a court will not sustain such a challenge in theevent of litigation. This summary does not address any aspect of state, local or non-U.S. tax law.
148

YOU SHOULD CONSULT YOUR TAX ADVISORS WITH REGARD TO THE APPLICATION OFTHE U.S. FEDERAL INCOME TAX LAWS TO YOUR PARTICULAR SITUATIONS AS WELL AS ANY TAXCONSEQUENCES ARISING UNDER THE LAWS OF ANY STATE, LOCAL OR NON-U.S. TAXINGJURISDICTION.
This discussion is also based, in part, on representations of the depositary and the assumption thateach obligation in the deposit agreement and any related agreement will be performed in accordance with itsterms.
For purposes of this discussion, you are a ‘‘U.S. holder’’ if you are a beneficial owner of preferredshares, common shares or ADSs that is, for U.S. federal income tax purposes and are:
� a citizen or resident alien individual of the United States,
� a corporation created or organized in or under the laws of the United States or of any politicalsubdivision thereof, or
� otherwise subject to U.S. federal income taxation on a net income basis with respect to thepreferred shares, common shares or ADSs.
The term U.S. holder also includes certain former citizens of the United States.
In general, if you are the beneficial owner of American depositary receipts evidencing ADSs, you willbe treated as the beneficial owner of the preferred shares or common shares represented by those ADSs forU.S. federal income tax purposes. Deposits and withdrawals of preferred shares or common shares by you inexchange for ADSs will not result in the realization of gain or loss for U.S. federal income tax purposes. Yourtax basis in such preferred shares will be the same as your tax basis in such ADSs, and the holding period inwhich preferred shares or common shares will include the holding period in such ADSs.
Taxation of dividends
The gross amount of a distribution paid on ADSs, preferred shares or common shares, includingdistributions paid in the form of payments of interest on capital for Brazilian tax purposes, out of our currentor accumulated earnings and profits (as determined for U.S. federal income tax purposes) will be taxable toyou as foreign source dividend income and will not be eligible for the dividends-received deduction allowed tocorporate shareholders under U.S. federal income tax law. The amount of any such distribution will includethe amount of Brazilian withholding taxes, if any, withheld on the amount distributed. To the extent that adistribution exceeds our current and accumulated earnings and profits, such distribution will be treated as anontaxable return of capital to the extent of your basis in the ADSs, preferred shares or common shares, asthe case may be, with respect to which such distribution is made, and thereafter as a capital gain.
You will be required to include dividends paid in reais in income in an amount equal to their U.S.dollar value calculated by reference to an exchange rate in effect on the date such distribution is received bythe depositary, in the case of ADSs, or by you, in the case of common shares or preferred shares. If thedepositary or you do not convert such reais into U.S. dollars on the date they are received, it is possible thatyou will recognize foreign currency loss or gain, which would be ordinary loss or gain, when the reais areconverted into U.S. dollars. If you hold ADSs, you will be considered to receive a dividend when the dividendis received by the depositary.
Subject to certain exceptions for short-term and hedged positions, the U.S. dollar amount of dividendsreceived by certain noncorporate taxpayers, including individuals, prior to January 1, 2013 with respect to theADSs will be subject to taxation at a maximum rate of 15% if the dividends are ‘‘qualified dividends.’’Dividends paid on the ADSs will be treated as qualified dividends if (i) the ADSs are readily tradable on anestablished securities market in the United States and (ii) the Company was not, in the year prior to the yearin which the dividend was paid, and is not, in the year in which the dividend is paid, a passive foreign
149

investment company (‘‘PFIC’’). The ADSs are listed on the New York Stock Exchange and will qualify asreadily tradable on an established securities market in the United States so long as they are so listed. Basedon Vale’s audited financial statements and relevant market and shareholder data, Vale believes that it was nottreated as a PFIC for U.S. federal income tax purposes with respect to its 2010 or 2011 taxable year. Inaddition, based on Vale’s audited financial statements and its current expectations regarding the value andnature of its assets, the sources and nature of its income, and relevant market and shareholder data, Valedoes not anticipate becoming a PFIC for its 2012 taxable year.
Based on existing guidance, it is not entirely clear whether dividends received with respect to thepreferred shares and common shares will be treated as qualified dividends (and therefore whether suchdividends will qualify for the maximum rate of taxation of 15%), because the preferred shares and commonshares are not themselves listed on a U.S. exchange. In addition, the U.S. Treasury has announced itsintention to promulgate rules pursuant to which holders of ADSs, preferred shares or common stock andintermediaries through whom such securities are held will be permitted to rely on certifications from issuersto establish that dividends are treated as qualified dividends. Because such procedures have not yet beenissued, it is unclear whether we will be able to comply with them. You should consult your own tax advisorsregarding the availability of the reduced dividend tax rate in light of your own particular circumstances.
Subject to generally applicable limitations and restrictions, you will be entitled to a credit against yourU.S. federal income tax liability, or a deduction in computing your U.S. federal taxable income, for Brazilianincome taxes withheld by us. You must satisfy minimum holding period requirements to be eligible to claim aforeign tax credit for Brazilian taxes withheld on dividends. The limitation on foreign taxes eligible for creditis calculated separately for specific classes of income. For this purpose dividends paid by us on our shares willgenerally constitute ‘‘passive income’’. Foreign tax credits may not be allowed for withholding taxes imposedin respect of certain short-term or hedged positions in securities or in respect of arrangements in which aU.S. holder’s expected economic profit is insubstantial. You should consult your own tax advisors concerningthe implications of these rules in light of your particular circumstances.
Taxation of capital gains
Upon a sale or exchange of preferred shares, common shares or ADSs, you will recognize a capitalgain or loss for U.S. federal income tax purposes equal to the difference, if any, between the amount realizedon the sale or exchange and your adjusted tax basis in the preferred shares, common shares or ADSs. Thisgain or loss will be long-term capital gain or loss if your holding period in the preferred shares, commonshares or ADSs exceeds one year. The net amount of long-term capital gain recognized by individual U.S.holders prior to January 1, 2013 generally is subject to taxation at a maximum rate of 15%. Your ability to usecapital losses to offset income is subject to limitations.
Any gain or loss will be U.S. source gain or loss for U.S. foreign tax credit purposes. Consequently, ifa Brazilian withholding tax is imposed on the sale or disposition of ADSs, preferred shares or commonshares, and you do not receive significant foreign source income from other sources you may not be able toderive effective U.S. foreign tax credit benefits in respect of such Brazilian withholding tax. You shouldconsult your own tax advisor regarding the application of the foreign tax credit rules to your investment in,and disposition of, ADSs, preferred shares or common shares.
If a Brazilian tax is withheld on the sale or disposition of shares, the amount realized by a U.S. holderwill include the gross amount of the proceeds of such sale or disposition before deduction of the Braziliantax. See—Brazilian tax considerations above.
Information reporting and backup withholding
Information returns may be filed with the Internal Revenue Service in connection with distributionson the preferred shares, common shares or ADSs and the proceeds from their sale or other disposition. Youmay be subject to United States backup withholding tax on these payments if you fail to provide yourtaxpayer identification number or comply with certain certification procedures or otherwise establish an
150

exemption from backup withholding. If you are required to make such a certification or to establish such anexemption, you generally must do so on IRS Form W-9.
The amount of any backup withholding from a payment to you will be allowed as a credit against yourU.S. federal income tax liability and may entitle you to a refund, provided that the required information istimely furnished to the Internal Revenue Service.
EVALUATION OF DISCLOSURE CONTROLS AND PROCEDURES
Our management, with the participation of our chief executive officer and chief financial officer, hasevaluated the effectiveness of our disclosure controls and procedures as of December 31, 2011. There areinherent limitations to the effectiveness of any system of disclosure controls and procedures, including thepossibility of human error and the circumvention or overriding of the controls and procedures. Accordingly,even effective disclosure controls and procedures can only provide reasonable assurance of achieving theircontrol objectives.
Our chief executive officer and chief financial officer have concluded that our disclosure controls andprocedures were effective to provide reasonable assurance that information required to be disclosed by us inthe reports filed or submitted under the Exchange Act is recorded, processed, summarized and reported,within the time periods specified in the applicable rules and forms, and that it is accumulated andcommunicated to our management, including our chief executive officer and chief financial officer, asappropriate to allow timely decisions regarding required disclosure.
MANAGEMENT’S REPORT ON INTERNAL CONTROL OVER FINANCIAL REPORTING
Our management is responsible for establishing and maintaining adequate internal control overfinancial reporting. Our internal control over financial reporting is a process designed to provide reasonableassurance regarding the reliability of financial reporting and the preparation of financial statements forexternal purposes in accordance with generally accepted accounting principles. Our internal control overfinancial reporting includes those policies and procedures that: (i) pertain to the maintenance of records that,in reasonable detail, accurately and fairly reflect the transactions and dispositions of the assets of theCompany; (ii) provide reasonable assurance that transactions are recorded to permit preparation of financialstatements in accordance with generally accepted accounting principles, and that receipts and expenditures ofthe Company are being made only in accordance with authorizations of management and directors of theCompany; and (iii) provide reasonable assurance regarding prevention or timely detection of unauthorizedacquisition, use, or disposition of our assets that could have a material effect on the financial statements.Because of its inherent limitations, internal control over financial reporting may not prevent or detectmisstatements. Also, projections of any evaluation of the effectiveness to future periods are subject to the riskthat controls may become inadequate and that the degree of compliance with the policies or procedures maydeteriorate.
Our management has assessed the effectiveness of Vale’s internal control over financial reporting as ofDecember 31, 2011 based on the criteria established in ‘‘Internal Control—Integrated Framework’’ issued bythe Committee of Sponsoring Organizations of the Treadway Commission (‘‘COSO’’). Based on suchassessment and criteria, our management has concluded that our internal control over financial reporting waseffective as of December 31, 2011. The effectiveness of our internal control over financial reporting as ofDecember 31, 2011 has been audited by PricewaterhouseCoopers Auditores Independentes, an independentregistered public accounting firm, as stated in their report which appears herein.
Our management identified no change in our internal control over financial reporting during our fiscalyear ended December 31, 2011 that has materially affected or is reasonably likely to materially affect ourinternal control over financial reporting.
151

CORPORATE GOVERNANCE
Under NYSE rules, foreign private issuers are subject to more limited corporate governancerequirements than U.S. domestic issuers. As a foreign private issuer, we must comply with four principalNYSE corporate governance rules: (1) we must satisfy the requirements of Exchange Act Rule 10A-3 relatingto audit committees; (2) our chief executive officer must promptly notify the NYSE in writing after anyexecutive officer becomes aware of any non-compliance with the applicable NYSE corporate governancerules; (3) we must provide the NYSE with annual and interim written affirmations as required under theNYSE corporate governance rules; and (4) we must provide a brief description of any significant differencesbetween our corporate governance practices and those followed by U.S. companies under NYSE listingstandards. The table below briefly describes the significant differences between our domestic practice and theNYSE corporate governance rules.
NYSE corporate governance rule forSection U.S. domestic issuers Our approach
303A.01 A listed company must have a majority of independent We are a controlled company because more than a majority ofdirectors. ‘‘Controlled companies’’ are not required to comply our voting power for the appointment of directors iswith this requirement. controlled by Valepar. As a controlled company, we would not
be required to comply with the majority of independentdirector requirements if we were a U.S. domestic issuer. Thereis no legal provision or policy that requires us to haveindependent directors.
303A.03 The non-management directors of a listed company must meet We do not have any management directors.at regularly scheduled executive sessions without management.
303A.04 A listed company must have a nominating/corporate We do not have a nominating committee. As a controlledgovernance committee composed entirely of independent company, we would not be required to comply with thedirectors, with a written charter that covers certain minimum nominating/corporate governance committee requirements ifspecified duties. we were a U.S. domestic issuer. However, we do have a‘‘Controlled companies’’ are not required to comply with this Governance and Sustainability Committee, which is anrequirement. advisory committee to the Board of Directors and may include
members who are not directors. According to its charter, thiscommittee is responsible for:� evaluating and recommending improvements to the
effectiveness of our corporate governance practices andthe functioning of the Board of Directors;
� recommending improvements to our code of ethicalconduct and management system in order to avoidconflicts of interest between us and our shareholders ormanagement;
� issuing reports on potential conflicts of interest betweenus and our shareholders or management; and
� reporting on policies relating to corporate responsibility,such as environmental and social responsibility
The committee’s charter requires at least one of its membersto be independent. For this purpose, an independent memberis a person who:� does not have any current relationship with us other
than being part of a committee, or being a shareholderof the Company;
� does not participate, directly or indirectly, in the salesefforts or provision of services by Vale;
� is not a representative of the controlling shareholders;� has not been an employee of the controlling shareholder
or of entities affiliated with a controlling shareholder;and
� has not been an executive officer of the controllingshareholder.
152
NYSE corporate governance rule forSection U.S. domestic issuers Our approach
303A.05 A listed company must have a compensation committee As a controlled company, we would not be required to complycomposed entirely of independent directors, with a written with the compensation committee requirements if we were acharter that covers certain minimum specified duties. U.S. domestic issuer. However, we have an Executive‘‘Controlled companies’’ are not required to comply with this Development Committee, which is an advisory committee torequirement. the Board of Directors and may include members who are not
directors. This committee is responsible for:� reporting on general human resources policies;� analyzing and reporting on the adequacy of
compensation levels for our executive officers;� proposing and updating guidelines for evaluating the
performance of our executive officers; and� reporting on policies relating to health and safety.
303A.06 A listed company must have an audit committee with a In lieu of appointing an audit committee composed of303A.07 minimum of three independent directors who satisfy the independent members of the Board of Directors, we have
independence requirements of Rule 10A-3 under the established a permanent conselho fiscal, or fiscal council, inExchange Act, with a written charter that covers certain accordance with the applicable provisions of Brazilianminimum specified duties. corporate law, and provided the fiscal council with additional
powers to permit it to meet the requirements of Exchange ActRule 10A-3(c)(3).
The Fiscal Council currently has four members. UnderBrazilian corporate law, which provides standards for theindependence of the Fiscal Council from us and ourmanagement, none of the members of the Fiscal Council maybe a member of the Board of Directors or an executiveofficer. Management does not elect any Fiscal Councilmember. Our Board of Directors has determined that one ofthe members of our Fiscal Council meets the New York StockExchange independence requirements that would apply toaudit committee members in the absence of our reliance onExchange Act Rule 10A-3(c)(3).
The responsibilities of the Fiscal Council are set forth in itscharter. Under our bylaws, the charter must give the FiscalCouncil responsibility for the matters required under Braziliancorporate law, as well as responsibility for:� establishing procedures for the receipt, retention and
treatment of complaints related to accounting, controlsand audit issues, as well as procedures for theconfidential, anonymous submission of concernsregarding such matters;
� recommending and assisting the Board of Directors inthe appointment, establishment of compensation anddismissal of independent auditors;
� pre-approving services to be rendered by theindependent auditors;
� overseeing the work performed by the independentauditors, with powers to recommend withholding thepayment of compensation to the independent auditors;and
� mediating disagreements between management and theindependent auditors regarding financial reporting.
303A.08 Shareholders must be given the opportunity to vote on all Under Brazilian corporate law, shareholder pre-approval isequity-compensation plans and material revisions thereto, with required for the adoption of any equity compensation plans.limited exemptions set forth in the NYSE rules.
303A.09 A listed company must adopt and disclose corporate We have not published formal corporate governancegovernance guidelines that cover certain minimum specified guidelines.subjects.
153

NYSE corporate governance rule forSection U.S. domestic issuers Our approach
303A.10 A listed company must adopt and disclose a code of business We have adopted a formal code of ethical conduct, whichconduct and ethics for directors, officers and employees, and applies to our directors, officers and employees. We reportpromptly disclose any waivers of the code for directors or each year in our annual report on Form 20-F any waivers ofexecutive officers. the code of ethical conduct granted for directors or executive
officers. Our code of ethical conduct has a scope that issimilar, but not identical, to that required for a U.S. domesticcompany under the NYSE rules.We also have a code of ethics that applies specifically toemployees in the corporate finance, investor relations andaccounting departments.
303A.12 a) Each listed company CEO must certify to the NYSE each We are subject to (b) and (c) of these requirements, but notyear that he or she is not aware of any violation by the (a).company of NYSE corporate governance listing standards.
b) Each listed company CEO must promptly notify the NYSEin writing after any executive officer of the listed companybecomes aware of any non-compliance with any applicableprovisions of this Section 303A.
c) Each listed company must submit an executed WrittenAffirmation annually to the NYSE. In addition, each listedcompany must submit an interim Written Affirmation as andwhen required by the interim Written Affirmation formspecified by the NYSE.
CODE OF ETHICS
We have adopted a code of ethical conduct that applies to all Board members, executive officers andemployees, including the chief executive officer, the chief financial officer and the principal accounting officer.We have posted this code of ethical conduct on our Web site, at: http://www.vale.com (under English Version/Investors/Corporate Governance/Code of Ethics). Copies of our code of ethical conduct may be obtainedwithout charge by writing to us at the address set forth on the front cover of this Form 20-F. We have notgranted any implicit or explicit waivers from any provision of our code of ethical conduct since its adoption.
PRINCIPAL ACCOUNTANT FEES AND SERVICES
PricewaterhouseCoopers Auditores Independentes billed the following fees to us for professionalservices in 2010 and 2011.
Year ended December 31,
2010 2011
(US$ thousand)Audit fees . . . . . . . . . . . . . . . . . . . . . . . . . . . . . . . . . . . . . . . . . . . . . . . . . . . . 11,752 10,354Audit-related fees . . . . . . . . . . . . . . . . . . . . . . . . . . . . . . . . . . . . . . . . . . . . . . . 496 794Tax fees . . . . . . . . . . . . . . . . . . . . . . . . . . . . . . . . . . . . . . . . . . . . . . . . . . . . . 106 –
Total fees . . . . . . . . . . . . . . . . . . . . . . . . . . . . . . . . . . . . . . . . . . . . . . . . . . . 12,354 11,148
‘‘Audit fees’’ are the aggregate fees billed by PricewaterhouseCoopers for the audit of our annualfinancial statements, for the audit of the statutory financial statements of our subsidiaries, and reviews ofinterim financial statements and attestation services that are provided in connection with statutory andregulatory filings or engagements. They also include billed fees, which are services that only the independentauditor reasonably can provide, including the provision of comfort letters and consents in connection withstatutory and regulatory filings and the review of documents filed with the SEC and other capital markets orlocal financial reporting regulatory bodies. ‘‘Audit-related fees’’ are fees charged by PricewaterhouseCoopersfor assurance and related services that are reasonably related to the performance of the audit or review ofour financial statements and are not reported under ‘‘Audit fees.’’ In 2011 and 2010, ‘‘Audit-related fees’’
154
consisted primarily of fees for services related to due diligence and special reviews. ‘‘Tax fees’’ relate primarilyto the review of annual tax returns and review of accuracy of the tax computation procedures with respect toincome tax and sales taxes.
INFORMATION FILED WITH SECURITIES REGULATORS
We are subject to various information and disclosure requirements in those countries in which oursecurities are traded, and file financial statements and other periodic reports with the CVM,BM&FBOVESPA, the SEC, the French securities regulator Autorite des Marches Financiers, and the HKEx.
� Brazil. Vale’s Common Shares and Class A Preferred Shares are listed on BM&FBOVESPA inSao Paulo, Brazil, its primary listing venue. As a result, we are subject to the information anddisclosure requirements of Brazilian Corporate Law, as amended. We are also subject to theperiodic disclosure requirements of CVM rules applicable to listed companies and toBM&FBOVESPA’s ‘‘Level 1’’ Corporate Governance Requirements. Our CVM filings areavailable from the CVM at http://www.cvm.gov.br or from BM&FBOVESPA athttp://www.bmfbovespa.com.br. In addition, as with all of our security filings, they may beaccessed at our website, http://www.vale.com.
� United States. As a result of our ADSs being listed on the New York Stock Exchange, we aresubject to the information requirements of the Securities Exchange Act of 1934, as amended, andaccordingly file reports and other information with the SEC. Reports and other information filedby us with the SEC may be inspected and copied at the public reference facilities maintained bythe SEC at 100 F Street, N.E., Washington, D.C., 20549. You can obtain further informationabout the operation of the Public Reference Room by calling the SEC at 1-800-SEC-0330. Youmay also inspect Vale’s reports and other information at the offices of the New York StockExchange, 11 Wall Street, New York, New York 10005, on which Vale’s ADSs are listed. Our SECfilings are also available to the public from the SEC at http://www.sec.gov. For furtherinformation on obtaining copies of Vale’s public filings at the New York Stock Exchange, youshould call (212) 656-5060.
� France. As a result of the admission to listing and trading of the ADSs on NYSE EuronextParis, we must comply with certain French periodic and ongoing disclosure rules (for example,annual report with audited financial statements and interim financial statements) and anti-fraudrules, which prohibit market-abuse practices and devices, including insider trading, marketmanipulation and disclosure of false or misleading information. In general, the Company isdeemed to comply with the French periodic and ongoing disclosure rules through its compliancewith U.S. disclosure rules.
� Hong Kong. As a result of the listing and trading of our HDSs on the HKEx, we must complywith the HKEx Listing Rules, subject to certain waivers granted by the HKEx, including certainperiodic and ongoing disclosure rules, such as annual reports with audited financial statementsand interim financial statements. In accordance with the HKEx Listing Rules, we are required toupload reports and other information onto the website of the HKEx.
155
EXHIBITS
Exhibit Number
1 Bylaws of Vale S.A., as amended on May 18, 2011, incorporated by reference to the current report onForm 6-K furnished to the Securities and Exchange Commission on May 18, 2011 (File No. 001-15030)
8 List of subsidiaries12.1 Certification of Chief Executive Officer of Vale pursuant to Rules 13a-14 and 15d-14 under the
Securities Exchange Act of 193412.2 Certification of Chief Financial Officer of Vale pursuant to Rules 13a-14 and 15d-14 under the
Securities Exchange Act of 193413.1 Certification of Chief Executive Officer and Chief Financial Officer of Vale, pursuant to Section 906 of
the Sarbanes-Oxley Act of 200215.1 Consent of PricewaterhouseCoopers15.2 Consent of IMC Mining Services15.3 Consent of SRK Consulting15.4 Consent of Echelon Mining Services15.5 Consent of Snowden Mining Industry Consultants Pty Ltd(101) Interactive Data File*
* In accordance with Rule 406T of Regulation S-T promulgated by the Securities and Exchange Commission, Exhibit 101is deemed not filed or part of a registration statement or prospectus for purposes of sections 11 or 12 of the SecuritiesAct of 1933, is deemed not filed for purposes of section 18 of the Securities Exchange Act of 1934, and otherwise isnot subject to liability under these sections.
The amount of long-term debt securities of Vale or its subsidiaries authorized under any individualoutstanding agreement does not exceed 10% of Vale’s total assets on a consolidated basis. Vale hereby agreesto furnish the SEC, upon its request, a copy of any instruments defining the rights of holders of its long-termdebt or of its subsidiaries for which consolidated or unconsolidated financial statements are required to befiled.
156
GLOSSARY
Alumina . . . . . . . . . . . . . . . . Aluminum oxide. It is the main component of bauxite, and extracted frombauxite ore in a chemical refining process. It is the principal raw materialin the electro-chemical process from which aluminum is produced.
Aluminum . . . . . . . . . . . . . . . A white metal that is obtained in the electro-chemical process of reducingaluminum oxide.
Anthracite . . . . . . . . . . . . . . . The hardest coal type, which contains a high percentage of fixed carbonand a low percentage of volatile matter. Anthracite is the highest rankedcoal and it contains 90% fixed carbon, more than any other form of coal.Anthracite has a semi-metallic luster and is capable of burning with littlesmoke. Mainly used for metallurgical purposes.
Austenitic stainless steel . . . . . Steel that contains a significant amount of chromium and sufficient nickelto stabilize the austenite microstructure, giving to the steel goodformability and ductility and improving its high temperature resistance.They are used in a wide variety of applications, ranging from consumerproducts to industrial process equipment, as well as for power generationand transportation equipment, kitchen appliances and many otherapplications where strength, corrosion and high temperature resistance arerequired.
A$ . . . . . . . . . . . . . . . . . . . . The Australian dollar.
Bauxite . . . . . . . . . . . . . . . . . A rock composed primarily of hydrated aluminum oxides. It is theprincipal ore of alumina, the raw material from which aluminum is made.
Beneficiation . . . . . . . . . . . . . A variety of processes whereby extracted ore from mining is reduced toparticles that can be separated into ore-mineral and waste, the formersuitable for further processing or direct use.
CAD . . . . . . . . . . . . . . . . . . The Canadian dollar.
CFR . . . . . . . . . . . . . . . . . . Cost and freight. Indicates that all costs related to the transportation ofgoods up to a named port of destination will be paid by the seller of thegoods.
Coal . . . . . . . . . . . . . . . . . . . Coal is a black or brownish-black solid combustible substance formed bythe decomposition of vegetable matter without access to air. The rank ofcoal, which includes anthracite, bituminous coal (both are called hardcoal), sub-bituminous coal, and lignite, is based on fixed carbon, volatilematter, and heating value.
Cobalt . . . . . . . . . . . . . . . . . Cobalt is a hard, lustrous, silver-gray metal found in ores, and used in thepreparation of magnetic, wear-resistant, and high-strength alloys(particularly for jet engines and turbines). Its compounds are also used inthe production of inks, paints, and varnishes.
Coke . . . . . . . . . . . . . . . . . . Coal that has been processed in a coke oven, for use as a reduction agentin blast furnaces and in foundries for the purposes of transforming ironore into pig iron.
Concentration . . . . . . . . . . . . Physical, chemical or biological process to increase the grade of the metalor mineral of interest.
Copper . . . . . . . . . . . . . . . . . A reddish brown metallic element. Copper is highly conductive, boththermally and electrically. It is highly malleable and ductile and is easilyrolled into sheet and drawn into wire.
157

Copper anode . . . . . . . . . . . . Copper anode is a metallic product of the converting stage of smeltingprocess that is cast into blocks and generally contains 99% copper grade,which requires further processing to produce refined copper cathodes.
Copper cathode . . . . . . . . . . . Copper plate with purity higher than or equal to 99.9% that is producedby an electrolytic process.
Copper concentrate . . . . . . . . Material produced by concentration of copper minerals contained in thecopper ore. It is the raw material used in smelters to produce coppermetal.
DRI . . . . . . . . . . . . . . . . . . . Direct reduced iron. Iron ore lumps or pellets converted by the directreduction process, used mainly as a scrap substitute in electric arc furnacesteelmaking.
DWT . . . . . . . . . . . . . . . . . . Deadweight ton. The measurement unit of a vessel’s capacity for cargo,fuel oil, stores and crew, measured in metric tons of 1,000 kg. A vessel’stotal deadweight is the total weight the vessel can carry when loaded to aparticular load line.
Electrowon copper cathode . . . Refined copper cathode is a metallic product produced by anelectrochemical process in which copper is recovered by dissolving copperanode in an electrolyte and plating it onto an electrode. Electrowon coppercathodes generally contain 99.99% copper grade.
Embedded derivatives . . . . . . . A financial instrument within a contractual arrangement such as leases,purchase agreements and guarantees. Its function is to modify some or allof the cash flow that would otherwise be required by the contract, such ascaps, floors or collars.
Emissions trading . . . . . . . . . . Emissions trading is a market-based scheme for environmentalimprovement that allows parties to buy and sell permits for emissions orcredits for reductions in emissions of certain pollutants.
Fe unit . . . . . . . . . . . . . . . . . A measure of the iron grade in the iron ore that is equivalent to 1% irongrade in one metric ton of iron ore.
Ferroalloys . . . . . . . . . . . . . . Ferroalloys are alloys of iron that contain one or more other chemicalelements. These alloys are used to add these other elements into moltenmetal, usually in steelmaking. The principal ferroalloys are those ofmanganese, silicon and chromium.
FOB . . . . . . . . . . . . . . . . . . Free on board. It indicates that the purchaser pays for shipping, insuranceand all the other costs associated with transportation of the goods to theirdestination.
Gold . . . . . . . . . . . . . . . . . . A precious metal sometimes found free in nature, but usually found inconjunction with silver, quartz, calcite, lead, tellurium, zinc or copper. It isthe most malleable and ductile metal, a good conductor of heat andelectricity and unaffected by air and most reagents.
Grade . . . . . . . . . . . . . . . . . The proportion of metal or mineral present in ore or any other hostmaterial.
Hard metallurgical coal . . . . . . Metallurgical coking coal with the required properties to produce astronger/harder metallurgical coke.
Hematite Ore . . . . . . . . . . . . Hematite is an iron oxide mineral, but also denotes the high-grade iron oretype within the iron deposits.
158

Iridium . . . . . . . . . . . . . . . . . A dense, hard, brittle, silvery-white transition metal of the platinum familythat occurs in natural alloys with platinum or osmium. Iridium is used inhigh-strength alloys that can withstand high temperatures, primarily inhigh-temperature apparatus, electrical contacts, and as a hardening agentfor platinum.
Iron ore pellets . . . . . . . . . . . Agglomerated ultra-fine iron ore particles of a size and quality suitable forparticular iron making processes. Our iron ore pellets range in size from8 mm to 18 mm.
Itabirite Ore . . . . . . . . . . . . . Itabirite is a banded iron formation and denotes the low-grade iron oretype within the iron deposits.
Kaolin . . . . . . . . . . . . . . . . . A fine white aluminum silicate clay derived from rock composed chiefly offeldspar, which is used as a coating agent, filler, extender and absorbent inthe paper, paint, ceramics and other industries.
Lump ore . . . . . . . . . . . . . . . Iron ore or manganese ore with the coarsest particle size in the range of6.35 mm to 50 mm in diameter, but varying slightly between differentmines and ores.
Manganese . . . . . . . . . . . . . . A hard brittle metallic element found primarily in the minerals pyrolusite,hausmannite and manganite. Manganese is essential to the production ofvirtually all steels and is important in the production of cast iron.
Metallurgical coal . . . . . . . . . . A bituminous hard coal with a quality that allows the production of coke.Normally used in coke ovens for metallurgical purposes.
Methanol . . . . . . . . . . . . . . . An alcohol fuel largely used in the production of chemical and plasticcompounds.
Mineral deposit(s) . . . . . . . . . A mineralized body that has been intersected by a sufficient number ofclosely spaced drill holes and/or underground/surface samples to supportsufficient tonnage and grade of metal(s) or mineral(s) of interest towarrant further exploration-development work.
Mineral resource . . . . . . . . . . A concentration or occurrence of minerals of economic interest in suchform and quantity that could justify an eventual economic extraction. Thelocation, quantity, grade, geological characteristics and continuity of amineral resource are known, estimated or interpreted from specificgeological evidence through drill holes, trenches and/or outcrops. Mineralresources are sub-divided, in order of increasing geological confidence, intoInferred, Indicated and Measured Resources.
Nickel . . . . . . . . . . . . . . . . . A silvery white metal that takes on a high polish. It is hard, malleable,ductile, somewhat ferromagnetic, and a fair conductor of heat andelectricity. It belongs to the iron-cobalt group of metals and is chieflyvaluable for the alloys it forms, such as stainless steel and other corrosion-resistant alloys.
Nickel laterite . . . . . . . . . . . . Deposits are formed by intensive weathering of olivine-rich ultramaficrocks such as dunite, peridotite and komatite.
Nickel limonitic laterite . . . . . . Type of nickel laterite located at the top of the laterite profile. It consistslargely of goethite and contains 1-2% nickel. Also contains concentrationson cobalt.
Nickel matte . . . . . . . . . . . . . An intermediate smelter product that must be further refined to obtainpure metal.
159

Nickel pig iron . . . . . . . . . . . . A low-grade nickel product, made from lateritic ores, suitable primarily foruse in stainless steel production. Nickel pig iron typically has a nickelgrade of 1.5-6% produced from blast furnaces. Nickel pig iron can alsocontain chrome, manganese, and impurities such as phosphorus, sulfur andcarbon. Low grade ferro-nickel (FeNi) produced in China through electricfurnaces is often also referred to as nickel pig iron.
Nickel saprolitic laterite . . . . . Type of nickel laterite located at the bottom of the laterite profile andcontains on average 1.5-2.5% nickel.
Nickel sulfide . . . . . . . . . . . . Formed through magmatic processes where nickel combines with sulphurto form a sulphide phase. Pentlandite is the most common nickel sulphideore mineral mined and often occurs with chalcopyrite, a common coppersulphide mineral.
Ntk . . . . . . . . . . . . . . . . . . . Net ton (the weight of the goods being transported excluding the weight ofthe wagon) kilometer.
Open-pit mining . . . . . . . . . . Method of extracting rock or minerals from the earth by their removalfrom an open pit. Open-pit mines for extraction of ore are used whendeposits of commercially useful minerals or rock are found near thesurface; that is, where the overburden (surface material covering thevaluable deposit) is relatively thin or the material of interest is structurallyunsuitable for underground mining.
Oxides . . . . . . . . . . . . . . . . . Compounds of oxygen with another element. For example, magnetite is anoxide mineral formed by the chemical union of iron with oxygen.
Palladium . . . . . . . . . . . . . . . A silver-white metal that is ductile and malleable, used primarily inautomobile-emissions control devices, jewelry, electrical and chemicalapplications.
PCI . . . . . . . . . . . . . . . . . . . Pulverized coal injection. Type of coal with specific properties ideal fordirect injection via the tuyeres of blast furnaces. This type of coal does notrequire any processing or coke making, and can be directly injected intothe blast furnaces, replacing lump cokes to be charged from the top of theblast furnaces.
Pellet feed fines . . . . . . . . . . . Ultra-fine iron ore (less than 0.15 mm) generated by mining and grinding.This material is aggregated into iron ore pellets through an agglomerationprocess.
Pelletizing . . . . . . . . . . . . . . . Iron ore pelletizing is a process of agglomeration of ultra-fines produced iniron ore exploitation and concentration steps. The three basic stages of theprocess are: (i) ore preparation (to get the correct fineness); (ii) mixingand balling (additive mixing and ball formation); and (iii) firing (to getceramic bonding and strength).
PGMs . . . . . . . . . . . . . . . . . Platinum group metals. Consist of platinum, palladium, rhodium,ruthenium, osmium and iridium.
Phosphate . . . . . . . . . . . . . . . A phosphorous compound, which occurs in natural ores and is used as araw material for primary production of fertilizer nutrients, animal feedsand detergents.
Pig iron . . . . . . . . . . . . . . . . Product of smelting iron ore usually with coke and limestone in a blastfurnace.
160

Platinum . . . . . . . . . . . . . . . . A dense, precious, grey-white transition metal that is ductile and malleableand occurs in some nickel and copper ores. Platinum is resistant tocorrosion and is used in jewelry, laboratory equipment, electrical contacts,dentistry, automobile-emissions control devices, flat panel TVs and harddisk drives.
Potash . . . . . . . . . . . . . . . . . A potassium chloride compound, chiefly KCl, used as simple fertilizer andin the production of mixture fertilizer.
Precious metals . . . . . . . . . . . Metals valued for their color, malleability, and rarity, with a high economicvalue driven not only by their practical industrial use, but also by their roleas investments. The widely-traded precious metals are gold, silver, platinumand palladium.
Primary nickel . . . . . . . . . . . . Nickel produced directly from mineral ores.
Probable (indicated) reserves . . Reserves for which quantity and grade and/or quality are computed frominformation similar to that used for proven (measured) reserves, but thesites for inspection, sampling and measurement are farther apart or areotherwise less adequately spaced. The degree of assurance, although lowerthan that for proven (measured) reserves, is high enough to assumecontinuity between points of observation.
Proven (measured) reserves . . . Reserves for which (a) quantity is computed from dimensions revealed inoutcrops, trenches, working or drill holes; grade and/or quality arecomputed from the results of detailed sampling and (b) the sites forinspection, sampling and measurement are spaced so closely and thegeologic character is so well defined that size, shape, depth and mineralcontent of reserves are well-established.
Real, reais or R$ . . . . . . . . . . The official currency of Brazil is the real (singular) (plural: reais).
Reserves . . . . . . . . . . . . . . . . The part of a mineral deposit that could be economically and legallyextracted or produced at the time of the reserve determination.
Rhodium . . . . . . . . . . . . . . . A hard, silvery-white, durable metal that has a high reflectance and isprimarily used in combination with platinum for automobile-emissioncontrol devices and as an alloying agent for hardening platinum.
ROM . . . . . . . . . . . . . . . . . . Run-of-mine. Ore in its natural (unprocessed) state, as mined, withouthaving been crushed.
Ruthenium . . . . . . . . . . . . . . A hard, white metal that can harden platinum and palladium used to makesevere wear-resistant electrical contacts and in other applications in theelectronics industry.
Secondary or scrap nickel . . . . Stainless steel or other nickel-containing scrap.
Seaborne market . . . . . . . . . . Comprises the total ore trade between countries using ocean bulk vessels.
Silver . . . . . . . . . . . . . . . . . . A ductile and malleable metal used in photography, coins and medalfabrication, and in industrial applications.
Sinter feed (also known asfines) . . . . . . . . . . . . . . . . Iron ore fines with particles in the range of 0.15 mm to 6.35 mm in
diameter. Suitable for sintering.
Sintering . . . . . . . . . . . . . . . . The agglomeration of sinter feed, binder and other materials, into acoherent mass by heating without melting, to be used as metallic chargeinto a blast furnace.
161

Slabs . . . . . . . . . . . . . . . . . . The most common type of semi-finished steel. Traditional slabs measure 10inches thick and 30-85 inches wide (and average 20 feet long), while theoutput of the recently developed ‘‘thin slab’’ casters is two inches thick.Subsequent to casting, slabs are sent to the hot-strip mill to be rolled intocoiled sheet and plate products.
Stainless steel . . . . . . . . . . . . Alloy steel containing at least 10% chromium and with superior corrosionresistance. It may also contain other elements such as nickel, manganese,niobium, titanium, molybdenum, copper, in order to improve mechanical,thermal properties and service life. It is primarily classified as austenitic(200 and 300 series), ferritic (400 series), martensitic, duplex orprecipitation hardening grades.
Stainless steel scrap ratio . . . . The ratio of secondary nickel units (either in the form of nickel-bearing,stainless steel scrap, or in alloy steel, foundry and nickel-based alloy scrap)relative to all nickel units consumed in the manufacture of new stainlesssteel.
Thermal coal . . . . . . . . . . . . . A type of coal that is suitable for energy generation in thermal powerstations.
Troy ounce . . . . . . . . . . . . . . One troy ounce equals 31.103 grams.
Underground mining . . . . . . . Mineral exploitation in which extraction is carried out beneath the earth’ssurface.
U.S. dollars or US$ . . . . . . . . The United States dollar.
162
SIGNATURES
The registrant hereby certifies that it meets all of the requirements for filing on Form 20-F and that ithas duly caused and authorized the undersigned to sign this annual report on its behalf.
VALE S.A.
By: /s/ Murilo Pinto de Oliveira Ferreira
Name: Murilo Pinto de Oliveira FerreiraTitle: Chief Executive Officer
By: /s/ Tito Botelho Martins
Name: Tito Botelho MartinsTitle: Chief Financial Officer
Date: April 17, 2012
163

14NOV201111161635
Vale S.A.
Index to Consolidated Financial Statements
Nr.
Report of Independent Registered Public Accounting Firm . . . . . . . . . . . . . . . . . . . . . . . . . . . . . . F-2
Management’s Report on Internal Control Over Financial Reporting . . . . . . . . . . . . . . . . . . . . . . . F-3
Consolidated Balance Sheets as of December 31, 2011 and December 31, 2010 . . . . . . . . . . . . . . . . F-4
Consolidated Statements of Income for the years ended December 31, 2011, 2010 and 2009 . . . . . . . . F-6
Consolidated Statements of Comprehensive Income (deficit) for the years ended December 31, 2011,2010 and 2009 . . . . . . . . . . . . . . . . . . . . . . . . . . . . . . . . . . . . . . . . . . . . . . . . . . . . . . . . . . . F-7
Consolidated Statements of Cash Flows for the years ended December 31, 2011, 2010 and 2009 . . . . . F-8
Consolidated Statements of Changes in Stockholders’ Equity for the years ended December 31, 2011,2010 and 2009 . . . . . . . . . . . . . . . . . . . . . . . . . . . . . . . . . . . . . . . . . . . . . . . . . . . . . . . . . . . F-10
Notes to the Consolidated Financial Statements . . . . . . . . . . . . . . . . . . . . . . . . . . . . . . . . . . . . . . F-12
F-1

14NOV201111161635Report of independent registered
public accounting firm
To the Board of Directors and StockholdersVale S.A.
In our opinion, the accompanying consolidated balance sheets and the related consolidated statementsof income, of comprehensive income, of cash flows and of changes in stockholders’ equity present fairly, in allmaterial respects, the financial position of Vale S.A. and its subsidiaries (the ‘‘Company’’) at December 31,2011 and 2010, and the results of their operations and their cash flows for each of the three years in theperiod ended December 31, 2011 in conformity with accounting principles generally accepted in the UnitedStates of America. Also in our opinion, the Company maintained, in all material respects, effective internalcontrol over financial reporting as of December 31, 2011, based on criteria established in Internal Control—Integrated Framework issued by the Committee of Sponsoring Organizations of the Treadway Commission(COSO). The Company’s management is responsible for these financial statements, for maintaining effectiveinternal control over financial reporting and for its assessment of the effectiveness of internal control overfinancial reporting, included in the accompanying Management’s Report on Internal Control over FinancialReporting. Our responsibility is to express opinions on these financial statements and on the Company’sinternal control over financial reporting based on our integrated audits. We conducted our audits inaccordance with the standards of the Public Company Accounting Oversight Board (United States). Thosestandards require that we plan and perform the audits to obtain reasonable assurance about whether thefinancial statements are free of material misstatement and whether effective internal control over financialreporting was maintained in all material respects. Our audits of the financial statements included examining,on a test basis, evidence supporting the amounts and disclosures in the financial statements, assessing theaccounting principles used and significant estimates made by management, and evaluating the overall financialstatement presentation. Our audit of internal control over financial reporting included obtaining anunderstanding of internal control over financial reporting, assessing the risk that a material weakness exists,and testing and evaluating the design and operating effectiveness of internal control based on the assessedrisk. Our audits also included performing such other procedures as we considered necessary in thecircumstances. We believe that our audits provide a reasonable basis for our opinions.
A company’s internal control over financial reporting is a process designed to provide reasonableassurance regarding the reliability of financial reporting and the preparation of financial statements forexternal purposes in accordance with generally accepted accounting principles. A company’s internal controlover financial reporting includes those policies and procedures that (i) pertain to the maintenance of recordsthat, in reasonable detail, accurately and fairly reflect the transactions and dispositions of the assets of thecompany; (ii) provide reasonable assurance that transactions are recorded as necessary to permit preparationof financial statements in accordance with generally accepted accounting principles, and that receipts andexpenditures of the company are being made only in accordance with authorizations of management anddirectors of the company; and (iii) provide reasonable assurance regarding prevention or timely detection ofunauthorized acquisition, use, or disposition of the company’s assets that could have a material effect on thefinancial statements.
Because of its inherent limitations, internal control over financial reporting may not prevent or detectmisstatements. Also, projections of any evaluation of effectiveness to future periods are subject to the riskthat controls may become inadequate because of changes in conditions, or that the degree of compliance withthe policies or procedures may deteriorate.
Rio de Janeiro, February 15, 2012/s/ PricewaterhouseCoopers
PricewaterhouseCoopersAuditores IndependentesCRC 2SP000160/O-5 ‘‘F’’ RJMarcos Donizete PanassolContador CRC 1SP155975/O-8 ‘‘S’’ RJ
F-2

14NOV201111161635
Management’s Report on Internal Control over Financial Reporting
The management of Vale S.A (Vale) is responsible for establishing and maintaining adequate internalcontrol over financial reporting.
The company’s internal control over financial reporting is a process designed to provide reasonableassurance regarding the reliability of financial reporting and the preparation of financial statements forexternal purposes in accordance with generally accepted accounting principles. The company’s internal controlover financial reporting includes those policies and procedures that: (i) pertain to the maintenance of recordsthat, in reasonable detail, accurately and fairly reflect the transactions and dispositions of the assets of thecompany; (ii) provide reasonable assurance that transactions are recorded as necessary to permit preparationof financial statements in accordance with generally accepted accounting principles, and that receipts andexpenditures of the company are being made only in accordance with authorizations of management anddirectors of the company; and (iii) provide reasonable assurance regarding prevention or timely detection ofunauthorized acquisition, use, or disposition of the company’s assets that could have a material effect on thefinancial statements.
Because of its inherent limitations, internal control over financial reporting may not prevent or detectmisstatements. Also, projections of any evaluation of the effectiveness to future periods are subject to the riskthat controls may become inadequate because of changes in conditions, and that the degree of compliancewith the policies or procedures may deteriorate.
Vale’s management has assessed the effectiveness of the company’s internal control over financialreporting as of December 31, 2011 based on the criteria established in Internal Control—IntegratedFramework issued by the Committee of Sponsoring Organizations of the Treadway Commission—COSO.Based on such assessment and criteria, Vale’s management has concluded that the company’s internal controlover financial reporting was effective as of December 31, 2011.
The effectiveness of the company’s internal control over financial reporting as of December 31, 2011has been audited by PricewaterhouseCoopers Auditores Independentes, an independent registered publicaccounting firm, as stated in their report which appears herein.
February 15, 2012
/s/ Murilo Ferreira
Murilo FerreiraChief Executive Officer
/s/ Tito Martins
Tito MartinsChief Financial Officer
F-3
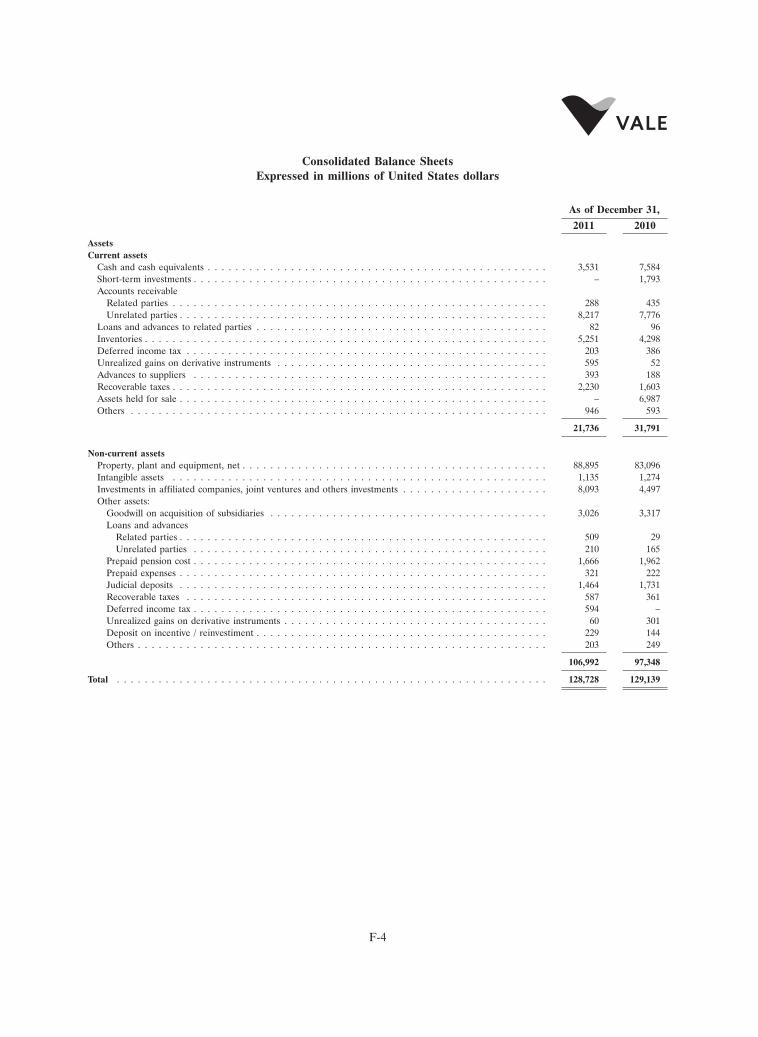
14NOV201111161635
Consolidated Balance SheetsExpressed in millions of United States dollars
As of December 31,
2011 2010
AssetsCurrent assets
Cash and cash equivalents . . . . . . . . . . . . . . . . . . . . . . . . . . . . . . . . . . . . . . . . . . . . . . . . . 3,531 7,584Short-term investments . . . . . . . . . . . . . . . . . . . . . . . . . . . . . . . . . . . . . . . . . . . . . . . . . . . – 1,793Accounts receivable
Related parties . . . . . . . . . . . . . . . . . . . . . . . . . . . . . . . . . . . . . . . . . . . . . . . . . . . . . . 288 435Unrelated parties . . . . . . . . . . . . . . . . . . . . . . . . . . . . . . . . . . . . . . . . . . . . . . . . . . . . . 8,217 7,776
Loans and advances to related parties . . . . . . . . . . . . . . . . . . . . . . . . . . . . . . . . . . . . . . . . . . 82 96Inventories . . . . . . . . . . . . . . . . . . . . . . . . . . . . . . . . . . . . . . . . . . . . . . . . . . . . . . . . . . 5,251 4,298Deferred income tax . . . . . . . . . . . . . . . . . . . . . . . . . . . . . . . . . . . . . . . . . . . . . . . . . . . . 203 386Unrealized gains on derivative instruments . . . . . . . . . . . . . . . . . . . . . . . . . . . . . . . . . . . . . . . 595 52Advances to suppliers . . . . . . . . . . . . . . . . . . . . . . . . . . . . . . . . . . . . . . . . . . . . . . . . . . . 393 188Recoverable taxes . . . . . . . . . . . . . . . . . . . . . . . . . . . . . . . . . . . . . . . . . . . . . . . . . . . . . . 2,230 1,603Assets held for sale . . . . . . . . . . . . . . . . . . . . . . . . . . . . . . . . . . . . . . . . . . . . . . . . . . . . . – 6,987Others . . . . . . . . . . . . . . . . . . . . . . . . . . . . . . . . . . . . . . . . . . . . . . . . . . . . . . . . . . . . 946 593
21,736 31,791
Non-current assetsProperty, plant and equipment, net . . . . . . . . . . . . . . . . . . . . . . . . . . . . . . . . . . . . . . . . . . . . 88,895 83,096Intangible assets . . . . . . . . . . . . . . . . . . . . . . . . . . . . . . . . . . . . . . . . . . . . . . . . . . . . . . 1,135 1,274Investments in affiliated companies, joint ventures and others investments . . . . . . . . . . . . . . . . . . . . . 8,093 4,497Other assets:
Goodwill on acquisition of subsidiaries . . . . . . . . . . . . . . . . . . . . . . . . . . . . . . . . . . . . . . . . 3,026 3,317Loans and advances
Related parties . . . . . . . . . . . . . . . . . . . . . . . . . . . . . . . . . . . . . . . . . . . . . . . . . . . . . 509 29Unrelated parties . . . . . . . . . . . . . . . . . . . . . . . . . . . . . . . . . . . . . . . . . . . . . . . . . . . 210 165
Prepaid pension cost . . . . . . . . . . . . . . . . . . . . . . . . . . . . . . . . . . . . . . . . . . . . . . . . . . . 1,666 1,962Prepaid expenses . . . . . . . . . . . . . . . . . . . . . . . . . . . . . . . . . . . . . . . . . . . . . . . . . . . . . 321 222Judicial deposits . . . . . . . . . . . . . . . . . . . . . . . . . . . . . . . . . . . . . . . . . . . . . . . . . . . . . 1,464 1,731Recoverable taxes . . . . . . . . . . . . . . . . . . . . . . . . . . . . . . . . . . . . . . . . . . . . . . . . . . . . 587 361Deferred income tax . . . . . . . . . . . . . . . . . . . . . . . . . . . . . . . . . . . . . . . . . . . . . . . . . . . 594 –Unrealized gains on derivative instruments . . . . . . . . . . . . . . . . . . . . . . . . . . . . . . . . . . . . . . 60 301Deposit on incentive / reinvestiment . . . . . . . . . . . . . . . . . . . . . . . . . . . . . . . . . . . . . . . . . . 229 144Others . . . . . . . . . . . . . . . . . . . . . . . . . . . . . . . . . . . . . . . . . . . . . . . . . . . . . . . . . . . 203 249
106,992 97,348
Total . . . . . . . . . . . . . . . . . . . . . . . . . . . . . . . . . . . . . . . . . . . . . . . . . . . . . . . . . . . . . . 128,728 129,139
F-4

14NOV201111161635
Consolidated Balance Sheets (Continued)Expressed in millions of United States dollars
(Except number of shares)
As of December 31,
2011 2010
Liabilities and stockholders’ equityCurrent liabilities
Suppliers . . . . . . . . . . . . . . . . . . . . . . . . . . . . . . . . . . . . . . . . . . . . . . . . . . . . . . . . . . 4,814 3,558Payroll and related charges . . . . . . . . . . . . . . . . . . . . . . . . . . . . . . . . . . . . . . . . . . . . . . . . 1,307 1,134Minimum annual remuneration attributed to stockholders . . . . . . . . . . . . . . . . . . . . . . . . . . . . . . 1,181 4,842Current portion of long-term debt . . . . . . . . . . . . . . . . . . . . . . . . . . . . . . . . . . . . . . . . . . . . 1,495 2,823Short-term debt . . . . . . . . . . . . . . . . . . . . . . . . . . . . . . . . . . . . . . . . . . . . . . . . . . . . . . 22 139Loans from related parties . . . . . . . . . . . . . . . . . . . . . . . . . . . . . . . . . . . . . . . . . . . . . . . . 24 21Provision for income taxes . . . . . . . . . . . . . . . . . . . . . . . . . . . . . . . . . . . . . . . . . . . . . . . . 507 751Taxes payable and royalties . . . . . . . . . . . . . . . . . . . . . . . . . . . . . . . . . . . . . . . . . . . . . . . . 524 264Employees postretirement benefits . . . . . . . . . . . . . . . . . . . . . . . . . . . . . . . . . . . . . . . . . . . 147 168Railway sub-concession agreement payable . . . . . . . . . . . . . . . . . . . . . . . . . . . . . . . . . . . . . . . 66 76Unrealized losses on derivative instruments . . . . . . . . . . . . . . . . . . . . . . . . . . . . . . . . . . . . . . 73 35Provisions for asset retirement obligations . . . . . . . . . . . . . . . . . . . . . . . . . . . . . . . . . . . . . . . 73 75Liabilities associated with assets held for sale . . . . . . . . . . . . . . . . . . . . . . . . . . . . . . . . . . . . . – 3,152Others . . . . . . . . . . . . . . . . . . . . . . . . . . . . . . . . . . . . . . . . . . . . . . . . . . . . . . . . . . . . 810 874
11,043 17,912
Non-current liabilitiesEmployees postretirement benefits . . . . . . . . . . . . . . . . . . . . . . . . . . . . . . . . . . . . . . . . . . . 2,446 2,442Loans from related parties . . . . . . . . . . . . . . . . . . . . . . . . . . . . . . . . . . . . . . . . . . . . . . . . 91 2Long-term debt . . . . . . . . . . . . . . . . . . . . . . . . . . . . . . . . . . . . . . . . . . . . . . . . . . . . . . 21,538 21,591Provisions for contingencies (Note 20 (b)) . . . . . . . . . . . . . . . . . . . . . . . . . . . . . . . . . . . . . . . 1,686 2,043Unrealized losses on derivative instruments . . . . . . . . . . . . . . . . . . . . . . . . . . . . . . . . . . . . . . 663 61Deferred income tax . . . . . . . . . . . . . . . . . . . . . . . . . . . . . . . . . . . . . . . . . . . . . . . . . . . . 5,654 8,085Provisions for asset retirement obligations . . . . . . . . . . . . . . . . . . . . . . . . . . . . . . . . . . . . . . . 1,697 1,293Debentures . . . . . . . . . . . . . . . . . . . . . . . . . . . . . . . . . . . . . . . . . . . . . . . . . . . . . . . . . 1,336 1,284Others . . . . . . . . . . . . . . . . . . . . . . . . . . . . . . . . . . . . . . . . . . . . . . . . . . . . . . . . . . . . 2,460 1,985
37,571 38,786
Redeemable noncontrolling interest . . . . . . . . . . . . . . . . . . . . . . . . . . . . . . . . . . . . . . . . . . . . 505 712
Commitments and contingencies (Note 20)
Stockholders’ equityPreferred class A stock—7,200,000,000 no-par-value shares authorized and 2,108,579,618 (2010—
2,108,579,618) issued . . . . . . . . . . . . . . . . . . . . . . . . . . . . . . . . . . . . . . . . . . . . . . . . . . 16,728 10,370Common stock—3,600,000,000 no-par-value shares authorized and 3,256,724,482 (2010—3,256,724,482)
issued . . . . . . . . . . . . . . . . . . . . . . . . . . . . . . . . . . . . . . . . . . . . . . . . . . . . . . . . . . . 25,837 16,016Treasury stock—181,099,814 (2010—99,649,571) preferred and 86,911,207 (2010—47,375,394) common shares . . . (5,662) (2,660)Additional paid-in capital . . . . . . . . . . . . . . . . . . . . . . . . . . . . . . . . . . . . . . . . . . . . . . . . . (61) 2,188Mandatorily convertible notes—common shares . . . . . . . . . . . . . . . . . . . . . . . . . . . . . . . . . . . . 290 290Mandatorily convertible notes—preferred shares . . . . . . . . . . . . . . . . . . . . . . . . . . . . . . . . . . . 644 644Other cumulative comprehensive loss . . . . . . . . . . . . . . . . . . . . . . . . . . . . . . . . . . . . . . . . . . (5,673) (333)Undistributed retained earnings . . . . . . . . . . . . . . . . . . . . . . . . . . . . . . . . . . . . . . . . . . . . . 41,130 42,218Unappropriated retained earnings . . . . . . . . . . . . . . . . . . . . . . . . . . . . . . . . . . . . . . . . . . . . 4,482 166
Total Company stockholders’ equity . . . . . . . . . . . . . . . . . . . . . . . . . . . . . . . . . . . . . . . . . . . 77,715 68,899Noncontrolling interests . . . . . . . . . . . . . . . . . . . . . . . . . . . . . . . . . . . . . . . . . . . . . . . . 1,894 2,830
Total stockholders’ equity . . . . . . . . . . . . . . . . . . . . . . . . . . . . . . . . . . . . . . . . . . . . . . . . . 79,609 71,729
Total . . . . . . . . . . . . . . . . . . . . . . . . . . . . . . . . . . . . . . . . . . . . . . . . . . . . . . . . . . . . . . 128,728 129,139
The accompanying notes are an integral part of these financial statements.
F-5

14NOV201111161635
Consolidated Statements of IncomeExpressed in millions of United States dollars
(Except per share amounts)
Year ended as of December 31,
2011 2010 2009
Operating revenues, net of discounts, returns and allowancesSales of ores and metals . . . . . . . . . . . . . . . . . . . . . . . . . . . . . . . . . . . . . . . . . . . . . 53,200 39,422 19,502Aluminum products . . . . . . . . . . . . . . . . . . . . . . . . . . . . . . . . . . . . . . . . . . . . . . . 383 2,554 2,050Revenues from logistic services . . . . . . . . . . . . . . . . . . . . . . . . . . . . . . . . . . . . . . . . . 1,726 1,465 1,104Fertilizer products . . . . . . . . . . . . . . . . . . . . . . . . . . . . . . . . . . . . . . . . . . . . . . . . 3,547 1,845 413Others . . . . . . . . . . . . . . . . . . . . . . . . . . . . . . . . . . . . . . . . . . . . . . . . . . . . . . . 1,533 1,195 870
60,389 46,481 23,939Taxes on revenues . . . . . . . . . . . . . . . . . . . . . . . . . . . . . . . . . . . . . . . . . . . . . . . . (1,399) (1,188) (628)
Net operating revenues . . . . . . . . . . . . . . . . . . . . . . . . . . . . . . . . . . . . . . . . . . . . . . 58,990 45,293 23,311
Operating costs and expensesCost of ores and metals sold . . . . . . . . . . . . . . . . . . . . . . . . . . . . . . . . . . . . . . . . . . . (17,898) (13,326) (9,853)Cost of aluminum products . . . . . . . . . . . . . . . . . . . . . . . . . . . . . . . . . . . . . . . . . . . (289) (2,108) (2,087)Cost of logistic services . . . . . . . . . . . . . . . . . . . . . . . . . . . . . . . . . . . . . . . . . . . . . . (1,402) (1,040) (779)Cost of fertilizer products . . . . . . . . . . . . . . . . . . . . . . . . . . . . . . . . . . . . . . . . . . . . (2,701) (1,556) (173)Others . . . . . . . . . . . . . . . . . . . . . . . . . . . . . . . . . . . . . . . . . . . . . . . . . . . . . . . (1,283) (784) (729)
(23,573) (18,814) (13,621)Selling, general and administrative expenses . . . . . . . . . . . . . . . . . . . . . . . . . . . . . . . . . . (2,334) (1,701) (1,130)Research and development expenses . . . . . . . . . . . . . . . . . . . . . . . . . . . . . . . . . . . . . . (1,674) (878) (981)Gain on sale of assets . . . . . . . . . . . . . . . . . . . . . . . . . . . . . . . . . . . . . . . . . . . . . . 1,513 – –Others . . . . . . . . . . . . . . . . . . . . . . . . . . . . . . . . . . . . . . . . . . . . . . . . . . . . . . . (2,810) (2,205) (1,522)
(28,878) (23,598) (17,254)
Operating income . . . . . . . . . . . . . . . . . . . . . . . . . . . . . . . . . . . . . . . . . . . . . . . . . . 30,112 21,695 6,057
Non-operating income (expenses)Financial income . . . . . . . . . . . . . . . . . . . . . . . . . . . . . . . . . . . . . . . . . . . . . . . . . 718 290 381Financial expenses . . . . . . . . . . . . . . . . . . . . . . . . . . . . . . . . . . . . . . . . . . . . . . . . (2,465) (2,646) (1,558)Gains (losses) on derivatives, net . . . . . . . . . . . . . . . . . . . . . . . . . . . . . . . . . . . . . . . . 75 631 1,528Foreign exchange and indexation gains (losses), net . . . . . . . . . . . . . . . . . . . . . . . . . . . . . . (1,641) 344 675Gain (loss) on sale of investments . . . . . . . . . . . . . . . . . . . . . . . . . . . . . . . . . . . . . . . . – – 40
(3,313) (1,381) 1,066Income before discontinued operations, income taxes and equity results . . . . . . . . . . . . . . . . . . . . 26,799 20,314 7,123
Income taxesCurrent . . . . . . . . . . . . . . . . . . . . . . . . . . . . . . . . . . . . . . . . . . . . . . . . . . . . . (5,547) (4,996) (2,084)Deferred . . . . . . . . . . . . . . . . . . . . . . . . . . . . . . . . . . . . . . . . . . . . . . . . . . . . 265 1,291 (16)
(5,282) (3,705) (2,100)
Equity in results of affiliates, joint ventures and other investments . . . . . . . . . . . . . . . . . . . . . . . 1,135 987 433Net income from continuing operations . . . . . . . . . . . . . . . . . . . . . . . . . . . . . . . . . . . . . . 22,652 17,596 5,456Discontinued operations, net of tax . . . . . . . . . . . . . . . . . . . . . . . . . . . . . . . . . . . . . . . . – (143) –
Net income . . . . . . . . . . . . . . . . . . . . . . . . . . . . . . . . . . . . . . . . . . . . . . . . . . . . . 22,652 17,453 5,456
Net income (loss) attributable to noncontrolling interests . . . . . . . . . . . . . . . . . . . . . . . . . . . . (233) 189 107Net loss attributable to redeemable noncontrolling interests . . . . . . . . . . . . . . . . . . . . . . . . . .
Net income attributable to the Company’s stockholders . . . . . . . . . . . . . . . . . . . . . . . . . . . . . 22,885 17,264 5,349
Earnings per share attributable to Company’s stockholders:
Earnings per preferred share . . . . . . . . . . . . . . . . . . . . . . . . . . . . . . . . . . . . . . . . . . 4.33 3.23 0.97Earnings per common share . . . . . . . . . . . . . . . . . . . . . . . . . . . . . . . . . . . . . . . . . . . 4.33 3.23 0.97Earnings per convertible note linked to preferred share . . . . . . . . . . . . . . . . . . . . . . . . . . . . 6.39 4.76 1.71Earnings per convertible note linked to common share . . . . . . . . . . . . . . . . . . . . . . . . . . . . 8.15 6.52 2.21
The accompanying notes are an integral part of these financial statements.
F-6

14NOV201111161635
Consolidated Statements of Comprehensive Income (deficit)Expressed in millions of United States dollars
Year ended as of December 31,
2011 2010 2009
Comprehensive income is comprised as follows:Company’s stockholders:
Net income attributable to Company’s stockholders . . . . . . . . . . . . . . . . . . . . . . . . . 22,885 17,264 5,349Cumulative translation adjustments . . . . . . . . . . . . . . . . . . . . . . . . . . . . . . . . . . . (4,985) 1,519 9,721
Available-for-sale securitiesGross balance as of the period/year end . . . . . . . . . . . . . . . . . . . . . . . . . . . . . . . (13) 12 (47)Tax (expense) benefit . . . . . . . . . . . . . . . . . . . . . . . . . . . . . . . . . . . . . . . . . . 11 (9) 30
(2) 3 (17)Surplus (deficit) accrued pension plan
Gross balance as of the period/year end . . . . . . . . . . . . . . . . . . . . . . . . . . . . . . . (740) (53) 10Tax (expense) benefit . . . . . . . . . . . . . . . . . . . . . . . . . . . . . . . . . . . . . . . . . . 232 32 (14)
(508) (21) (4)Participation on other comprehensive income from affiliated companyCash flow hedge
Gross balance as of the period . . . . . . . . . . . . . . . . . . . . . . . . . . . . . . . . . . . . 130 (16) 11Tax (expense) benefit . . . . . . . . . . . . . . . . . . . . . . . . . . . . . . . . . . . . . . . . . . 25 (10) (9)
155 (26) 2
Total comprehensive income attributable to Company’s stockholders . . . . . . . . . . . . . . . . . . 17,545 18,739 15,051
Noncontrolling interests:Net income attributable to noncontrolling interests . . . . . . . . . . . . . . . . . . . . . . . . . . (233) 189 107Cumulative translation adjustments . . . . . . . . . . . . . . . . . . . . . . . . . . . . . . . . . . . (210) 104 823Pension plan . . . . . . . . . . . . . . . . . . . . . . . . . . . . . . . . . . . . . . . . . . . . . . . . 4 – –Cash flow hedge . . . . . . . . . . . . . . . . . . . . . . . . . . . . . . . . . . . . . . . . . . . . . . 1 40 (18)
Total comprehensive income (deficit) attributable to Noncontrolling interests . . . . . . . . . . . . . (438) 333 912
Total comprehensive income . . . . . . . . . . . . . . . . . . . . . . . . . . . . . . . . . . . . . . . . . 17,107 19,072 15,963
The accompanying notes are an integral part of these financial statements.
F-7

14NOV201111161635Consolidated Statements of Cash Flows
Expressed in millions of United States dollars
Year ended as ofDecember 31,
2011 2010 2009
Cash flows from operating activities:Net income . . . . . . . . . . . . . . . . . . . . . . . . . . . . . . . . . . . . . . . . . . . . . . . . . . . 22,652 17,453 5,456
Adjustments to reconcile net income to cash from operations:Depreciation, depletion and amortization . . . . . . . . . . . . . . . . . . . . . . . . . . . . . . . . 4,122 3,260 2,722Dividends received . . . . . . . . . . . . . . . . . . . . . . . . . . . . . . . . . . . . . . . . . . . . . 1,038 1,161 386Equity in results of affiliates, joint ventures and other investments . . . . . . . . . . . . . . . . . . (1,135) (987) (433)Deferred income taxes . . . . . . . . . . . . . . . . . . . . . . . . . . . . . . . . . . . . . . . . . . . (265) (1,291) 16Loss on disposal of property, plant and equipment . . . . . . . . . . . . . . . . . . . . . . . . . . . 223 623 293Gain on sale of assets available for sale . . . . . . . . . . . . . . . . . . . . . . . . . . . . . . . . . (1,513) – (40)Discontinued operations, net of tax . . . . . . . . . . . . . . . . . . . . . . . . . . . . . . . . . . . . – 143 –Foreign exchange and indexation gains, net . . . . . . . . . . . . . . . . . . . . . . . . . . . . . . . 2,879 (787) (1,095)Unrealized derivative losses (gains), net . . . . . . . . . . . . . . . . . . . . . . . . . . . . . . . . . 490 594 (1,382)Unrealized interest (income) expense, net . . . . . . . . . . . . . . . . . . . . . . . . . . . . . . . . 194 187 (25)Others . . . . . . . . . . . . . . . . . . . . . . . . . . . . . . . . . . . . . . . . . . . . . . . . . . . . (183) 58 20
Decrease (increase) in assets:Accounts receivable . . . . . . . . . . . . . . . . . . . . . . . . . . . . . . . . . . . . . . . . . . . . . (821) (3,800) 616Inventories . . . . . . . . . . . . . . . . . . . . . . . . . . . . . . . . . . . . . . . . . . . . . . . . . . (1,343) (425) 530Recoverable taxes . . . . . . . . . . . . . . . . . . . . . . . . . . . . . . . . . . . . . . . . . . . . . . (563) 42 108Others . . . . . . . . . . . . . . . . . . . . . . . . . . . . . . . . . . . . . . . . . . . . . . . . . . . . (315) 307 (455)
Increase (decrease) in liabilities:Suppliers . . . . . . . . . . . . . . . . . . . . . . . . . . . . . . . . . . . . . . . . . . . . . . . . . . . 1,076 928 121Payroll and related charges . . . . . . . . . . . . . . . . . . . . . . . . . . . . . . . . . . . . . . . . . 285 214 159Income taxes . . . . . . . . . . . . . . . . . . . . . . . . . . . . . . . . . . . . . . . . . . . . . . . . . (2,478) 1,311 (234)Others . . . . . . . . . . . . . . . . . . . . . . . . . . . . . . . . . . . . . . . . . . . . . . . . . . . . 153 192 373
Net cash provided by operating activities . . . . . . . . . . . . . . . . . . . . . . . . . . . . . . . . . . 24,496 19,183 7,136
Cash flows from investing activities:Short term investments . . . . . . . . . . . . . . . . . . . . . . . . . . . . . . . . . . . . . . . . . . . 1,793 1,954 (1,439)Loans and advances receivable . . . . . . . . . . . . . . . . . . . . . . . . . . . . . . . . . . . . . .
Related parties . . . . . . . . . . . . . . . . . . . . . . . . . . . . . . . . . . . . . . . . . . . . . .Loan proceeds . . . . . . . . . . . . . . . . . . . . . . . . . . . . . . . . . . . . . . . . . . . . . – (28) (181)Repayments . . . . . . . . . . . . . . . . . . . . . . . . . . . . . . . . . . . . . . . . . . . . . . . – – 7
Others . . . . . . . . . . . . . . . . . . . . . . . . . . . . . . . . . . . . . . . . . . . . . . . . . . . (178) (30) (25)Judicial deposits . . . . . . . . . . . . . . . . . . . . . . . . . . . . . . . . . . . . . . . . . . . . . . . (186) (94) (132)Investments . . . . . . . . . . . . . . . . . . . . . . . . . . . . . . . . . . . . . . . . . . . . . . . . . . (504) (87) (1,947)Additions to property, plant and equipment . . . . . . . . . . . . . . . . . . . . . . . . . . . . . . . (16,075) (12,647) (8,096)Proceeds from disposal of investments . . . . . . . . . . . . . . . . . . . . . . . . . . . . . . . . . . 1,081 – 606Acquisition (sale) of subsidiaries . . . . . . . . . . . . . . . . . . . . . . . . . . . . . . . . . . . . . – (6,252) (1,952)
Net cash used in investing activities . . . . . . . . . . . . . . . . . . . . . . . . . . . . . . . . . . . . . (14,069) (17,184) (13,159)
F-8

14NOV201111161635Consolidated Statements of Cash Flows (Continued)
Expressed in millions of United States dollars
Year ended as ofDecember 31,
2011 2010 2009
Cash flows from financing activities:Short-term debt . . . . . . . . . . . . . . . . . . . . . . . . . . . . . . . . . . . . . . . . . . . . . . .
Additions . . . . . . . . . . . . . . . . . . . . . . . . . . . . . . . . . . . . . . . . . . . . . . . . . 859 2,233 1,285Repayments . . . . . . . . . . . . . . . . . . . . . . . . . . . . . . . . . . . . . . . . . . . . . . . . (955) (2,132) (1,254)
Loans . . . . . . . . . . . . . . . . . . . . . . . . . . . . . . . . . . . . . . . . . . . . . . . . . . . . .Related parties . . . . . . . . . . . . . . . . . . . . . . . . . . . . . . . . . . . . . . . . . . . . . .
Proceeds . . . . . . . . . . . . . . . . . . . . . . . . . . . . . . . . . . . . . . . . . . . . . . . . . 19 24 16Repayments . . . . . . . . . . . . . . . . . . . . . . . . . . . . . . . . . . . . . . . . . . . . . . . (1) (25) (373)
Issuances of long-term debt . . . . . . . . . . . . . . . . . . . . . . . . . . . . . . . . . . . . . . . .Third parties . . . . . . . . . . . . . . . . . . . . . . . . . . . . . . . . . . . . . . . . . . . . . . . .
Proceeds . . . . . . . . . . . . . . . . . . . . . . . . . . . . . . . . . . . . . . . . . . . . . . . . . 1,564 4,436 3,104Repayments . . . . . . . . . . . . . . . . . . . . . . . . . . . . . . . . . . . . . . . . . . . . . . . (2,621) (2,629) (307)
Treasury stock . . . . . . . . . . . . . . . . . . . . . . . . . . . . . . . . . . . . . . . . . . . . . . . . (3,002) (1,510) (9)Mandatorily convertible notes . . . . . . . . . . . . . . . . . . . . . . . . . . . . . . . . . . . . . . . – – 934Transactions of noncontrolling interest . . . . . . . . . . . . . . . . . . . . . . . . . . . . . . . . . . (1,134) 660 –Dividends and interest attributed to Company’s stockholders . . . . . . . . . . . . . . . . . . . . . (9,000) (3,000) (2,724)Dividends and interest attributed to noncontrolling interest . . . . . . . . . . . . . . . . . . . . . . (100) (140) (47)
Net cash provided by (used in) financing activities . . . . . . . . . . . . . . . . . . . . . . . . . . . . (14,371) (2,083) 625
Increase (decrease) in cash and cash equivalents . . . . . . . . . . . . . . . . . . . . . . . . . . . . (3,944) (84) (5,398)Effect of exchange rate changes on cash and cash equivalents . . . . . . . . . . . . . . . . . . . . . (109) 375 2,360Cash and cash equivalents, beginning of period . . . . . . . . . . . . . . . . . . . . . . . . . . . . . 7,584 7,293 10,331
Cash and cash equivalents, end of period . . . . . . . . . . . . . . . . . . . . . . . . . . . . . . . . . 3,531 7,584 7,293
Cash paid during the period for:Interest on short-term debt . . . . . . . . . . . . . . . . . . . . . . . . . . . . . . . . . . . . . . . . . (3) (5) (1)Interest on long-term debt . . . . . . . . . . . . . . . . . . . . . . . . . . . . . . . . . . . . . . . . . (1,143) (1,097) (1,113)Income tax . . . . . . . . . . . . . . . . . . . . . . . . . . . . . . . . . . . . . . . . . . . . . . . . . . (7,293) (1,972) (1,331)
Non-cash transactions . . . . . . . . . . . . . . . . . . . . . . . . . . . . . . . . . . . . . . . . . . . . .Income tax paid with credits . . . . . . . . . . . . . . . . . . . . . . . . . . . . . . . . . . . . . . . . (681) – –Interest capitalized . . . . . . . . . . . . . . . . . . . . . . . . . . . . . . . . . . . . . . . . . . . . . 234 164 266Conversion of mandatorily convertible notes using 75,435,238 treasury stock (see note 17) . . . .
The accompanying notes are an integral part of these financial statements.
F-9

14NOV201111161635Consolidated Statements of Changes in Stockholders’ Equity
Expressed in millions of United States dollars(Except number of shares)
Year ended as of December 31,
2011 2010 2009
Preferred class A stock (including twelve golden shares)Beginning of the period . . . . . . . . . . . . . . . . . . . . . . . . . . . . . . . . . . 10,370 9,727 9,727Capital increase . . . . . . . . . . . . . . . . . . . . . . . . . . . . . . . . . . . . . . . 6,358 –Transfer from undistributed retained earnings . . . . . . . . . . . . . . . . . . . . . . – 643 –
End of the period . . . . . . . . . . . . . . . . . . . . . . . . . . . . . . . . . . . . . 16,728 10,370 9,727
Common stockBeginning of the period . . . . . . . . . . . . . . . . . . . . . . . . . . . . . . . . . . 16,016 15,262 15,262Capital increase . . . . . . . . . . . . . . . . . . . . . . . . . . . . . . . . . . . . . . . 9,821 –Transfer from undistributed retained earnings . . . . . . . . . . . . . . . . . . . . . . – 754 –
End of the period . . . . . . . . . . . . . . . . . . . . . . . . . . . . . . . . . . . . . 25,837 16,016 15,262
Treasury stockBeginning of the period . . . . . . . . . . . . . . . . . . . . . . . . . . . . . . . . . . (2,660) (1,150) (1,141)Sales (acquisitions) . . . . . . . . . . . . . . . . . . . . . . . . . . . . . . . . . . . . . (3,002) (1,510) (9)
End of the period . . . . . . . . . . . . . . . . . . . . . . . . . . . . . . . . . . . . . (5,662) (2,660) (1,150)
Additional paid-in capitalBeginning of the period . . . . . . . . . . . . . . . . . . . . . . . . . . . . . . . . . . 2,188 411 393
Change in the period . . . . . . . . . . . . . . . . . . . . . . . . . . . . . . . . . . (2,249) 1,777 18
End of the period . . . . . . . . . . . . . . . . . . . . . . . . . . . . . . . . . . . . . (61) 2,188 411
Mandatorily convertible notes—common sharesBeginning of the period . . . . . . . . . . . . . . . . . . . . . . . . . . . . . . . . . . 290 1,578 1,288
Change in the period . . . . . . . . . . . . . . . . . . . . . . . . . . . . . . . . . . – (1,288) 290
End of the period . . . . . . . . . . . . . . . . . . . . . . . . . . . . . . . . . . . . . 290 290 1,578
Mandatorily convertible notes—preferred sharesBeginning of the period . . . . . . . . . . . . . . . . . . . . . . . . . . . . . . . . . . 644 1,225 581
Change in the period . . . . . . . . . . . . . . . . . . . . . . . . . . . . . . . . . . – (581) 644
End of the period . . . . . . . . . . . . . . . . . . . . . . . . . . . . . . . . . . . . . 644 644 1,225
Other cumulative comprehensive income (deficit)Cumulative translation adjustmentsBeginning of the period . . . . . . . . . . . . . . . . . . . . . . . . . . . . . . . . . . (253) (1,772) (11,493)
Change in the period . . . . . . . . . . . . . . . . . . . . . . . . . . . . . . . . . . (4,985) 1,519 9,721
End of the period . . . . . . . . . . . . . . . . . . . . . . . . . . . . . . . . . . . . . (5,238) (253) (1,772)
Unrealized gain (loss)—available-for-sale securities, net of taxBeginning of the period . . . . . . . . . . . . . . . . . . . . . . . . . . . . . . . . . . 3 – 17
Change in the period . . . . . . . . . . . . . . . . . . . . . . . . . . . . . . . . . . (2) 3 (17)
End of the period . . . . . . . . . . . . . . . . . . . . . . . . . . . . . . . . . . . . . 1 3 –
Surplus (deficit) of accrued pension planBeginning of the period . . . . . . . . . . . . . . . . . . . . . . . . . . . . . . . . . (59) (38) (34)
Change in the period . . . . . . . . . . . . . . . . . . . . . . . . . . . . . . . . . (508) (21) (4)
End of the period . . . . . . . . . . . . . . . . . . . . . . . . . . . . . . . . . . . . (567) (59) (38)
Participation on other comprehensive income of subsidiariesCash flow hedge
Beginning of the period . . . . . . . . . . . . . . . . . . . . . . . . . . . . . . . . . (24) 2 –Change in the period . . . . . . . . . . . . . . . . . . . . . . . . . . . . . . . . . 155 (26) 2
End of the period . . . . . . . . . . . . . . . . . . . . . . . . . . . . . . . . . . . . 131 (24) 2
Total other cumulative comprehensive income (deficit) . . . . . . . . . . . . . . . . . . (5,673) (333) (1,808)
F-10

14NOV201111161635Consolidated Statements of Changes in Stockholders’ Equity (Continued)
Expressed in millions of United States dollars(Except number of shares)
Year ended as of December 31,
2011 2010 2009
Undistributed retained earningsBeginning of the period . . . . . . . . . . . . . . . . . . . . . . . . . . . . . . . . . . 42,218 28,508 18,340Transfer from/to unappropriated retained earnings . . . . . . . . . . . . . . . . . . . 13,221 15,107 10,168Transfer to capitalized earnings . . . . . . . . . . . . . . . . . . . . . . . . . . . . . . (14,309) (1,397) –
End of the period . . . . . . . . . . . . . . . . . . . . . . . . . . . . . . . . . . . . . 41,130 42,218 28,508
Unappropriated retained earningsBeginning of the period . . . . . . . . . . . . . . . . . . . . . . . . . . . . . . . . . . 166 3,182 9,616
Net income attributable to the Company’s stockholders . . . . . . . . . . . . . . . 22,885 17,264 5,349Remuneration of mandatorily convertible notes
Preferred class A stock . . . . . . . . . . . . . . . . . . . . . . . . . . . . . . . . (97) (72) (58)Common stock . . . . . . . . . . . . . . . . . . . . . . . . . . . . . . . . . . . . . (70) (61) (93)
Dividends and interest attributed to stockholders’ equityPreferred class A stock . . . . . . . . . . . . . . . . . . . . . . . . . . . . . . . . (2,143) (1,940) (570)Common stock . . . . . . . . . . . . . . . . . . . . . . . . . . . . . . . . . . . . . (3,038) (3,100) (894)
Appropriation from/to undistributed retained earnings . . . . . . . . . . . . . . . . (13,221) (15,107) (10,168)
End of the period . . . . . . . . . . . . . . . . . . . . . . . . . . . . . . . . . . . . . 4,482 166 3,182
Total Company stockholders’ equity . . . . . . . . . . . . . . . . . . . . . . . . . . . . . 77,715 68,899 56,935
Noncontrolling interestsBeginning of the period . . . . . . . . . . . . . . . . . . . . . . . . . . . . . . . . . . 2,830 2,831 1,892Disposals (acquisitions) of noncontrolling interests . . . . . . . . . . . . . . . . . . . (631) 1,629 83Cumulative translation adjustments . . . . . . . . . . . . . . . . . . . . . . . . . . . . (210) 104 823Cash flow hedge . . . . . . . . . . . . . . . . . . . . . . . . . . . . . . . . . . . . . . 1 40 (18)Net income (loss) attributable to noncontrolling interests . . . . . . . . . . . . . . . . (233) 189 107Net income (loss) attributable to redeemable noncontrolling interests . . . . . . . . . 207 – –Dividends and interest attributable to noncontrolling interests . . . . . . . . . . . . . (105) (104) (56)Capitalization of stockholders advances . . . . . . . . . . . . . . . . . . . . . . . . . . 31 27 –Pension plan . . . . . . . . . . . . . . . . . . . . . . . . . . . . . . . . . . . . . . . . 4 – –Assets and liabilities held for sale . . . . . . . . . . . . . . . . . . . . . . . . . . . . . – (1,886) –
End of the period . . . . . . . . . . . . . . . . . . . . . . . . . . . . . . . . . . . . . 1,894 2,830 2,831
Total stockholders’ equity . . . . . . . . . . . . . . . . . . . . . . . . . . . . . . . . . . 79,609 71,729 59,766
Number of shares issued and outstanding:Preferred class A stock (including twelve golden shares) . . . . . . . . . . . . . . . . 2,108,579,618 2,108,579,618 2,108,579,618Common stock . . . . . . . . . . . . . . . . . . . . . . . . . . . . . . . . . . . . . . . 3,256,724,482 3,256,724,482 3,256,724,482
Beginning of the period . . . . . . . . . . . . . . . . . . . . . . . . . . . . . . . . . (147,024,965) (152,579,803) (151,792,203)Acquisitions . . . . . . . . . . . . . . . . . . . . . . . . . . . . . . . . . . . . . . (120,987,980) (69,880,400) (831,400)Conversions . . . . . . . . . . . . . . . . . . . . . . . . . . . . . . . . . . . . . . 1,924 75,435,238 43,800
End of the period . . . . . . . . . . . . . . . . . . . . . . . . . . . . . . . . . . . . (268,011,021) (147,024,965) (152,579,803)
5,097,293,079 5,218,279,135 5,212,724,297
The accompanying notes are an integral part of these financial statements.
F-11

14NOV201111161635Notes to the Consolidated Financial Statements
Expressed in millions of United States dollars, unless otherwise stated
1 The Company and its operations
Vale S.A., (‘‘Vale’’, ‘‘Company’’ or ‘‘we’’) is a limited liability company incorporated in Brazil.Operations are carried out through Vale and our subsidiary companies, joint ventures and affiliates, andmainly consist of mining, basic metals production, fertilizers, logistics and steel activities.
At December 31, 2011, our principal consolidated operating subsidiaries are the following:
Subsidiary % ownership % voting capital Location Principal activity
Compania Minera Miski Mayo S.A.C. . . . . . . . 40.00 51.00 Peru FertilizerFerrovia Centro-Atlantica S. A. . . . . . . . . . . . 99.99 99.99 Brazil LogisticsFerrovia Norte Sul S.A. . . . . . . . . . . . . . . . 100.00 100.00 Brazil LogisticsMineracao Corumbaense Reunida S.A.—MCR . . 100.00 100.00 Brazil Iron Ore and ManganesePT International Nickel Indonesia Tbk . . . . . . . 59.20 59.20 Indonesia NickelSociedad Contractual Minera Tres Valles . . . . . . 90.00 90.00 Chile CopperVale Australia Pty Ltd. . . . . . . . . . . . . . . . . 100.00 100.00 Australia CoalVale Austria Holdings GMBH . . . . . . . . . . . . 100.00 100.00 Austria Holding and ExplorationVale Canada Limited . . . . . . . . . . . . . . . . . 100.00 100.00 Canada NickelVale Coal Colombia Ltd. . . . . . . . . . . . . . . . 100.00 100.00 Colombia CoalVale Fertilizantes S.A . . . . . . . . . . . . . . . . . 99.05 99.98 Brazil FertilizerVale International S.A . . . . . . . . . . . . . . . . . 100.00 100.00 Switzerland TradingVale Manganes S.A. . . . . . . . . . . . . . . . . . . 100.00 100.00 Brazil Manganese and FerroalloysVale Mina do Azul S. A. . . . . . . . . . . . . . . . 100.00 100.00 Brazil ManganeseVale Mocambique S.A. . . . . . . . . . . . . . . . . 100.00 100.00 Mozambique CoalVale Nouvelle-Caledonie SAS . . . . . . . . . . . . 74.00 74.00 New Caledonia NickelVale Oman Pelletizing Company LLC . . . . . . . . 100.00 100.00 Oman PelletsVale Shipping Holding PTE Ltd. . . . . . . . . . . 100.00 100.00 Singapore Logistics
2 Basis of consolidation
All majority-owned subsidiaries in which we have both share and management control areconsolidated. All significant intercompany accounts and transactions are eliminated. Subsidiaries over whichcontrol is achieved through other means, such as stockholders agreement, are also consolidated even if wehold less than 51% of voting capital. Our variable interest entities in which we are the primary beneficiary areconsolidated. Investments in unconsolidated affiliates and joint ventures are accounted under the equitymethod (Note 14).
We evaluate the carrying value of our equity investments in relation to publicly quoted market priceswhen available. If the quoted market price is lower than book value, and such decline is considered otherthan temporary, we write-down our equity investments to the level of the quoted market value.
We define joint ventures as businesses in which we and a small group of other partners eachparticipate actively in the overall entity management, based on a stockholders agreement. We define affiliatesas businesses in which we participate as a noncontrolling interest but with significant influence over theoperating and financial policies of the investee.
Our participation in hydroelectric projects in Brazil is made via consortium contracts under which wehave undivided interests in the assets, and are liable for our proportionate share of liabilities and expenses,which are based on our proportionate share of power output. We do not have joint liability for anyobligations. No separate legal or tax status is granted to consortia under the Brazilian law. Accordingly, werecognize our proportionate share of costs and our undivided interest in assets relating to hydroelectricprojects (note 12).
F-12

14NOV201111161635Notes to the Consolidated Financial Statements (Continued)
Expressed in millions of United States dollars, unless otherwise stated
3 Summary of significant accounting policies
The preparation of financial statements requires management to make estimates and assumptions thataffect the reported amounts of assets and liabilities and disclosure of contingent assets and liabilities at thedate of the financial statements and the reported amounts of revenues and expenses during the reportingperiod. Estimates are used for, but not limited to, the selection of useful lives of property, plant andequipment, impairment, provisions necessary for contingent liabilities, fair values assigned to assets andliabilities acquired in business combinations, income tax valuation allowances, employee post retirementbenefits and other similar evaluations. Actual results could differ from those estimated.
a) Basis of presentation
We have prepared our consolidated financial statements in accordance with United States generallyaccepted accounting principles (‘‘US GAAP’’), which differ in certain respects from the accounting practicesadopted in Brazil (‘‘BR GAAP’’), compliant with International Financial Reporting Standards (‘‘IFRS’’) asissued by the International Accounting Standard Board (‘‘IASB’’), which are the basis for our statutoryfinancial statements.
The Brazilian Real is the parent Company’s functional currency. We have selected the US dollar asour reporting currency.
In 2011, based on entity business assessment, the subsidiary Vale International had its functionalcurrency changed from Brazilian Real to US dollar. This change did not cause significant effects in thefinancial statements presented.
All assets and liabilities have been translated to US dollars at the closing rate of exchange at eachbalance sheet date (or, if unavailable, the first available exchange rate). All statement of income accountshave been translated to US dollars at the average exchange rates prevailing during the respective periods.Capital accounts are recorded at historical exchange rates. Translation gains and losses are recorded in theCumulative Translation Adjustments account (‘‘CTA’’) in stockholders’ equity.
The results of operations and financial position of our entities that have a functional currency otherthan the US dollar, have been translated into US dollars and adjustments to translate those statements intoUS dollars are recorded in the CTA in stockholders’ equity.
The exchange rates used to translate the assets and liabilities of the Brazilian operations atDecember 31, 2011 and 2010, were R$1.8683 and R$1.6662, respectively.
The net transaction gain (loss) included in our statement of income (‘‘Foreign exchange andindexation gains (losses), net’’) was US$ (1,382), US$102 and US$665 in the years ended December 31, 2011,2010 and 2009, respectively.
F-13

14NOV201111161635Notes to the Consolidated Financial Statements (Continued)
Expressed in millions of United States dollars, unless otherwise stated
3 Summary of significant accounting policies (Continued)
b) Information by Segment and Geographic Area
The company discloses information by consolidated operational business segment and revenues byconsolidated geographic area, in accordance with the principles and concepts used by decision makers inevaluating performance. The information is analyzed by segment as follows:
Bulk Material—includes the extraction of iron ore and pellet production and transport systems ofNorth, South and Southeast, including railroads, ports and terminals, related to mining operations. Themanganese ore and ferroalloys are also included in this segment.
Basic metals—comprises the production of non-ferrous minerals, including nickel operations(co-products and byproducts), copper and aluminum—includes the trading of aluminum, alumina refining andaluminum smelting metals and investments in joint ventures and associated bauxite mining.
Fertilizers—comprises three major groups of nutrients: potash, phosphate and nitrogen. This businessis being formed through a combination of acquisitions and organic growth. This is a new business reported in2010.
Logistic services—includes our system of cargo transportation for third parties divided into railtransport, port and shipping services.
Others—comprises our investments in joint ventures and associate in other businesses.
c) Cash equivalents and short-term investments
Cash flows from overnight investments and fundings are reported net. Short-term investments thathave a ready market and original maturities of 90 days or less are classified as ‘‘Cash equivalents’’. Theremaining investments, between 91 day and 360 day maturities are stated at fair value and presented as‘‘Short-term investments’’.
d) Non-current assets and liabilities
Assets and liabilities that are realizable or due more than 12 months after the balance sheet date areclassified as non-current.
e) Inventories
Inventories are recorded at the average cost of purchase or production, reduced to market value (netrealizable value less a reasonable margin) when lower. Stockpiled inventories are accounted as processedwhen they are removed from the mine. The cost of finished goods is comprised of depreciation and all directcosts necessary to convert stockpiled inventories into finished goods.
We classify proven and probable reserve quantities attributable to stockpiled inventories as inventories.These reserve quantities are not included in the total proven and probable reserve quantities used in the unitsof production, depreciation, depletion and amortization calculations.
F-14

14NOV201111161635Notes to the Consolidated Financial Statements (Continued)
Expressed in millions of United States dollars, unless otherwise stated
3 Summary of significant accounting policies (Continued)
We periodically assess our inventories to identify obsolete or slow-moving inventories and, if needed,we recognize definitive allowances for them.
f) Removal of waste materials to access mineral deposits
Stripping costs (the costs associated with the removal of overburdened and other waste materials)incurred during the development of a mine, before production takes place, are capitalized as part of thedepreciable cost of developing the property. Such costs are subsequently amortized during the useful life ofthe mine based on proven and probable reserves.
Post-production stripping costs are included in the cost of the inventory produced (that is extracted),at each mine individually during the period that stripping costs are incurred.
g) Property, plant and equipment and intangible assets
Property, plant and equipment are recorded at cost, including interest cost incurred during theconstruction of major new facilities. We compute depreciation on the straight-line method at annual averagerates which take into consideration the useful lives of the assets, as follows: 3.73% for railroads, 1.5% forbuildings, 4.23% for installations and 7.73% for other equipment. Expenditures for maintenance and repairsare charged to operating costs and expenses as incurred.
We capitalize the costs of developing major new ore bodies or expanding the capacity of operatingmines and amortize these to operations on the unit-of-production method based on the total probable andproven quantity of ore to be recovered. Exploration costs are expensed. Once the economic viability of miningactivities is established, subsequent development costs are capitalized.
Separately acquired intangible assets are shown at historical cost. Intangible assets acquired in abusiness combination are recognized at fair value at the acquisition date. All our intangible assets havedefinite useful lives and are carried at cost less accumulated amortization, which is calculated using thestraight-line method over their estimated useful lives.
h) Business combinations
We apply accounting for business combinations to record acquisitions of interests in other companies.The ‘‘purchase method’’, requires that we reasonably determine the fair value of the identifiable tangible andintangible assets and liabilities assumed of acquired companies and segregate goodwill as an intangible asset.
We assign goodwill to reporting units and test each reporting unit’s goodwill for impairment at leastannually, and whenever circumstances indicating that recognized goodwill may not be fully recovered areidentified. We perform the annual goodwill impairment tests during the last quarter of each year.
Goodwill is reviewed for impairment utilizing a two step process. In the first step, we compare areporting unit’s fair value with its carrying amount to identify any potential goodwill impairment loss. If thecarrying amount of a reporting unit exceeds the unit’s fair value, based on a discounted cash flow analysis, we
F-15

14NOV201111161635Notes to the Consolidated Financial Statements (Continued)
Expressed in millions of United States dollars, unless otherwise stated
3 Summary of significant accounting policies (Continued)
carry out the second step of the impairment test, measuring and recording the amount, if any, of the unit’sgoodwill impairment loss.
i) Impairment of long-lived assets
All long-lived assets are tested to determine if they are recoverable from operating earnings on anundiscounted cash flow basis over their useful lives whenever events or changes in circumstance indicate thatthe carrying value may not be recoverable.
When we determine that the carrying value of long-lived assets and definite-life intangible assets maynot be recoverable, we measure any impairment loss based on a projected discounted cash flow method usinga discount rate determined to be commensurate with the inherent risk of our current business model.
j) Available-for-sale equity securities
Equity securities classified as ‘‘available-for-sale’’ are recorded pursuant to accounting for certaininvestments in debt and equity securities. Accordingly, we classify unrealized holding gains and losses, net oftaxes, as a separate component of stockholders’ equity until realized.
k) Compensated absences
The liability for future compensation for employee vacations is fully accrued as earned.
l) Derivatives and hedging activities
We apply accounting for derivative financial instruments and hedging activities, as amended. Thisstandard requires that we recognize all derivative financial instruments as either assets or liabilities on ourbalance sheet and measure such instruments at fair value. Changes in the fair value of derivatives arerecorded in each period in current earnings or in other comprehensive income, in the latter case dependingon whether a transaction is designated as an effective hedge and has been effective during the period.
m) Asset retirement obligations
Our asset retirement obligations consist primarily of estimated closure costs. The initial measurementis recognized as a liability discounted to present value and subsequently accreted through earnings. An assetretirement cost equal to the initial liability is capitalized as part of the related asset’s carrying value anddepreciated during the asset’s useful life.
n) Revenues and expenses
Revenues are recognized when title is transferred to the customer or services are rendered. Revenuefrom exported products is recognized when such products are loaded on board the ship. Revenues fromproducts sold in the domestic market are recognized when delivery is made to the customer. Revenues fromlogistic services are recognized when the service order is fulfilled. Expenses and costs are recognized on theaccrual basis.
F-16

14NOV201111161635Notes to the Consolidated Financial Statements (Continued)
Expressed in millions of United States dollars, unless otherwise stated
3 Summary of significant accounting policies (Continued)
o) Income taxes
The deferred tax effects of tax loss carryforwards and temporary differences are recognized pursuantto accounting for income taxes. A valuation allowance is made when we believe that it is more likely than notthat tax assets will not be fully recovered in the future.
p) Earnings per share
Earnings per share are computed by dividing net income by the weighted average number of commonand preferred shares outstanding during the period.
q) Interest attributed to stockholders’ equity (dividend)
Brazilian corporations are permitted to distribute interest attributable to stockholders’ equity. Thecalculation is based on the stockholders’ equity amounts as stated in the statutory accounting records and theinterest rate applied may not exceed the long-term interest rate (TJLP) determined by the Brazilian CentralBank. Also, such interest may not exceed 50% of net income for the year nor 50% of retained earnings plusrevenue reserves as determined by ‘‘Brazilian GAAP’’.
The notional interest charge is tax deductible in Brazil. The benefit to us, as opposed to making adividend payment, is a reduction in our income tax charge. Income tax of 15% is withheld on behalf of thestockholders relative to the interest distribution. Under Brazilian law, interest attributed to stockholders’equity is considered as part of the annual minimum mandatory dividend (Note 17). This notional interestdistribution is treated for accounting purposes as a deduction from stockholders’ equity in a manner similar toa dividend and the tax credit recorded in income.
r) Pension and other post retirement benefits
We sponsor private pensions and other post retirement benefits for our employees which areactuarially determined and recognized as an asset or liability or both depending on the funded or unfundedstatus of each plan in accordance with ‘‘employees’ accounting for defined benefit pension and other postretirement plans’’. The cost of our defined benefit and prior service costs or credits that arise during theperiod and are not components of net periodic benefit costs are recorded in other cumulative comprehensiveincome (deficit).
4 Accounting pronouncements
Accounting standards adopted in 2011
Accounting Standards Update—ASU number 2011-12 Comprehensive Income (Topic 220). Theamendments in this update supersede certain pending paragraphs in Accounting Standards UpdateNo. 2011-05, Comprehensive Income (Topic 220): Presentation of Comprehensive Income, to effectively deferonly those changes in update 2011-05 that relate to the presentation of reclassification adjustments out ofaccumulated other comprehensive income. The amendments in this Update are effective for public entities forfiscal years, and interim periods within those years, beginning after December 15, 2011.
F-17

14NOV201111161635Notes to the Consolidated Financial Statements (Continued)
Expressed in millions of United States dollars, unless otherwise stated
4 Accounting pronouncements (Continued)
ASU number 2011-11 Balance Sheet: Disclosures about Offsetting Assets and Liabilities (Topic 210).Entities are required to disclose both gross information and net information about both instruments andtransactions eligible for offset in the statement of financial position and instruments and transactions subjectto an agreement similar to a master netting arrangement. This scope would include derivatives, sale andrepurchase agreements and reverse sale and repurchase agreements, and securities borrowing and securitieslending arrangements. This pronouncement will be effective for annual reporting periods beginning on orafter January 1, 2013, and interim periods within those annual periods.
ASU number 2011-08 Intangibles—Goodwill and Other (Topic 350). The objective of this Update is tosimplify how entities, both public and nonpublic, test goodwill for impairment. The amendments in the updatepermit an entity to first assess qualitative factors to determine whether it is more likely than not that the fairvalue of a reporting unit is less than its carrying amount as a basis for determining whether it is necessary toperform the two-step goodwill impairment test described in Topic 350. The amendments are effective forannual and interim goodwill impairment tests performed for fiscal years beginning after December 15, 2011.
ASU number 2011-05 Comprehensive Income (Topic 220): Presentation of Comprehensive Income.The objective of this update is to improve the comparability, consistency, and transparency of financialreporting and to increase the prominence of items reported in other comprehensive income, so an entity hasthe option to present the total of comprehensive income, the components of net income, and the componentsof other comprehensive income. The amendments are effective for fiscal years, and interim periods withinthose years, beginning after December 15, 2011.
ASU number 2011-04: Amendments to Achieve Common Fair Value Measurement and DisclosureRequirements in USGAAP and IFRSs. The amendments in this update generally represent clarifications ofTopic 820, but also include some instances where a particular principle or requirement for measuring fairvalue or disclosing information about fair value measurements has changed. The amendments are effectiveduring interim and annual periods beginning after December 15, 2011.
ASU number 2011-03: Transfers and Servicing (Topic 860): Reconsideration of Effective Control forRepurchase Agreements. The amendments in this update remove from the assessment of effective control(1) the criterion requiring the transferor to have the ability to repurchase or redeem the financial assets onsubstantially the agreed terms, even in the event of default by the transferee, and (2) the collateralmaintenance implementation guidance related to that criterion. The Company adopted this standard with noimpact on our financial position, results of operations or liquidity. The amendments in this update areeffective for the first interim or annual period beginning on or after December 15, 2011.
ASU number 2011-02: Receivables (Topic 310)—A Creditor’s Determination of Whether aRestructuring Is a Troubled Debt Restructuring. The amendments in this update would provide additionalguidance to assist creditors in determining whether a restructuring of a receivable meets the criteria to beconsidered a troubled debt restructuring. The Company adopted this standard with no impact on its financialposition, results of operations or liquidity. The amendments in this update are effective for the first interim orannual period beginning on or after June 15, 2011.
F-18

14NOV201111161635Notes to the Consolidated Financial Statements (Continued)
Expressed in millions of United States dollars, unless otherwise stated
5 Major acquisitions and disposals
a) Sale of aluminum assets
In February 2011, we concluded the transaction announced in May, 2010 with Norsk Hydro ASA(Hydro), to transfer all of our stakes in Albras-Alumınio Brasileiro S.A. (Albras), Alunorte-Alumina do Nortedo Brasil S.A. (Alunorte) and Companhia de Alumina do Para (CAP), along with its respective off-take rightsand outstanding commercial contracts, and 60% of Mineracao Paragominas S.A (Paragominas), and all ourother Brazilian bauxite mineral rights. On December 31, 2010 these assets were demonstrated as assets heldfor sale in our balance sheet.
For this transaction we received US$ 1,081 in cash and 22% equivalent to 447,834,465 shares ofHydro’s outstanding common shares outstanding (approximately US$ 3.5 billion according to Hydro’s closingshare price at the date of the transaction). Three and five years after the closing of the transaction, we willreceive two equal tranches of US$ 200 each in cash, related to the remaining payment of 40% of MineracaoParagominas S.A. From the date of the transaction, Hydro has been accounted for by the equity method.
The gain on this transaction, of US$ 1,513 was recorded in the income statement in the line Gain onsale of assets.
b) Fertilizers Businesses
In 2010, we acquired 78.92% of the total capital and 99.83% of the voting capital of ValeFertilizantes S.A and 100% of the total capital of Vale Fosfatados. In 2011 we concluded several transactionsincluding a public offer to acquire the free floating shares of Vale Fertilizantes S.A. During this offer both thecommon and preferred shares were acquired for R$ 25.00 per share, amounting to a total of R$ 2,078 billion,equivalent to US$ 1,134 at the date the financial settlement of the transaction. After the public offer, we hold99.05% of the total shares of Vale Fertilizantes S.A.
The purchase price allocation based on the fair values of acquired assets and liabilities was based onstudies performed by us with the assistance of external valuation specialists and was finalized during 2011.
F-19

14NOV201111161635Notes to the Consolidated Financial Statements (Continued)
Expressed in millions of United States dollars, unless otherwise stated
5 Major acquisitions and disposals (Continued)
The goodwill balance arises primarily due to the synergies between the acquired assets and the potashoperations in Taquari-Vassouras, Carnalita, Rio Colorado and Neuquem and phosphates in Bayovar I and II,in Peru, and Evate, in Mozambique. The future development of our projects combined with the acquisition ofthe portfolio of fertilizer assets will allow Vale to be one of the top players in the global fertilizer business.
Purchase price . . . . . . . . . . . . . . . . . . . . . . . . . . . . . . . . . . . . . . . . . . . . . . . . . . . . . . . . . . . . . . . . . . . 5,795Non-controlling consideration . . . . . . . . . . . . . . . . . . . . . . . . . . . . . . . . . . . . . . . . . . . . . . . . . . . . . . . . . . 767Book value of property, plant and equipment and mining rights . . . . . . . . . . . . . . . . . . . . . . . . . . . . . . . . . . . . . . . (1,987)Book value of other assets acquired and liabilities assumed, net . . . . . . . . . . . . . . . . . . . . . . . . . . . . . . . . . . . . . . . (395)Adjustment to fair value of property, plant and equipment and mining rights . . . . . . . . . . . . . . . . . . . . . . . . . . . . . . . (5,146)Adjustment to fair value of inventories . . . . . . . . . . . . . . . . . . . . . . . . . . . . . . . . . . . . . . . . . . . . . . . . . . . . . (98)Deferred taxes on the above adjustments . . . . . . . . . . . . . . . . . . . . . . . . . . . . . . . . . . . . . . . . . . . . . . . . . . . . 1,783
Goodwill . . . . . . . . . . . . . . . . . . . . . . . . . . . . . . . . . . . . . . . . . . . . . . . . . . . . . . . . . . . . . . . . . . . . . . . 719
c) Acquisition of NESA
In 2011, we acquired 9% of Norte Energia S.A. (NESA) from Gaia Energia e Participacoes S.A.(Gaia) for US$ 70. NESA was established with the sole purpose of implementing, operating and exploring theBelo Monte hydroelectric plant, which is still in the early development stage. Vale estimated an investment ofR$ 2,300 billion (Equivalent to US$ 1.2 billion) of future capital contributions arising from the acquired stake,until December 31, 2011 the total capital contribution was US$ 84.
6 Income taxes
Income taxes in Brazil comprise federal income tax and social contribution, which is an additionalfederal tax. The statutory composite enacted tax rate applicable in the periods presented is 34%. In othercountries where we have operations, we are subject to various taxes rates depending on the jurisdiction.
We analyze the potential tax impact associated with undistributed earnings by each of our subsidiaries.For those subsidiaries in which the undistributed earnings would be taxable when remitted to the parentcompany, no deferred tax is recognized, based on generally accepted accounting principles.
F-20

14NOV201111161635Notes to the Consolidated Financial Statements (Continued)
Expressed in millions of United States dollars, unless otherwise stated
6 Income taxes (Continued)
The amount reported as income tax expense in our consolidated financial statements is reconciled tothe statutory rates as follows:
Year ended as of
December 31, 2011 December 31, 2010 December 31, 2009
Brazil Foreign Total Brazil Foreign Total Brazil Foreign Total
Income before discontinued operations,income taxes, equity results andnoncontrolling interests . . . . . . . . . . . . 21,267 5,532 26,799 16,586 3,728 20,314 10,024 (2,901) 7,123
Exchange variation (not taxable) or notdeductible . . . . . . . . . . . . . . . . . . . . – 26 26 – 265 265 – 5,162 5,162
21,267 5,558 26,825 16,586 3,993 20,579 10,024 2,261 12,285
Tax at Brazilian composite rate . . . . . . . . . (7,231) (1,890) (9,121) (5,639) (1,358) (6,997) (3,408) (769) (4,177)Tax benefit on interest attributed to
stockholders . . . . . . . . . . . . . . . . . . . 1,655 – 1,655 995 – 995 502 – 502Difference on tax rates of foreign income . . . – 1,415 1,415 – 1,673 1,673 – 1,079 1,079Tax incentives . . . . . . . . . . . . . . . . . . . 704 – 704 642 – 642 148 – 148Social contribution contingency payment . . . . 506 – 506 – – – – – –Reversal/Constitution of provisions for loss of
tax loss carryforwards . . . . . . . . . . . . . 129 (426) (297) – – – – – –Other non-taxable, income/non deductible
expenses . . . . . . . . . . . . . . . . . . . . . 48 (192) (144) 13 (31) (18) 100 248 348
Income tax per consolidated statements ofincome . . . . . . . . . . . . . . . . . . . . . . (4,189) (1,093) (5,282) (3,989) 284 (3,705) (2,658) 558 (2,100)
Vale and some subsidiaries in Brazil were granted with tax incentives that provide for a partialreduction of the income tax due related to certain regional operations of iron ore, railroad, manganese,copper, bauxite, alumina, aluminum, kaolin and potash. The tax benefit is calculated based on taxable profitadjusted by the tax incentive (so-called ‘‘exploration profit’’) taking into consideration the operational profitof the projects that benefit from the tax incentive during a fixed period. In general such tax incentives last for10 years. The Company’s tax incentives will expire in 2020. The tax savings must be registered in a specialcapital (profit) reserve in the Stockholders’ equity of the entity that benefits from the tax incentive and cannotbe distributed as dividends to the stockholders.
We are also allowed to reinvest part of the tax savings in the acquisition of new equipment to be usedin the operations that have the tax benefit subject to subsequent approval from the Brazilian regulatoryagencies Superintendencia de Desenvolvimento da Amazonia—SUDAM and Superintendencia deDesenvolvimento do Nordeste—SUDENE. When the reinvestment is approved, the corresponding tax benefitmust also be accounted for in a special profit reserve and is also subject to the same restrictions with respectto future dividend distributions to the stockholders.
We also have income tax incentives related to our Goro project under development in New Caledonia(‘‘The Goro Project’’). These incentives include an income tax holiday during the construction phase of theproject and throughout a 15-year period commencing in the first year in which commercial production, asdefined by the applicable legislation, is achieved followed by a five-year, 50 per cent income tax holiday. TheGoro Project also qualifies for certain exemptions from indirect taxes such as import duties during the
F-21

14NOV201111161635Notes to the Consolidated Financial Statements (Continued)
Expressed in millions of United States dollars, unless otherwise stated
6 Income taxes (Continued)
construction phase and throughout the commercial life of the project. Certain of these tax benefits, includingthe income tax holiday, are subject to an earlier phase out, should the project achieves a specified cumulativerate of return. We are subject to a branch profit tax commencing in the first year in which commercialproduction is achieved, as defined by the applicable legislation. To date, we have not recorded any taxableincome for New Caledonian tax purposes. The benefits of this legislation are expected to apply with respectto taxes payable once the Goro Project is in operation. We obtained tax incentives for our projects inMozambique, Oman and Malaysia, that will take effects when those projects start their commercial operation.
We are subject to an examination by the tax authorities for up to five years regarding our operationsin Brazil, up to ten years for Indonesia, and up to seven years for Canada for income taxes.
Tax loss carry forwards in Brazil and in most of the jurisdictions where we have tax loss carry forwardshave no expiration date, though in Brazil, offset is restricted to 30% of annual taxable income.
The Company adopts the provision accounting for Uncertainty in Income Taxes.
The reconciliation of the beginning and ending amounts is as follows: (see note 20(b)) tax—relatedactions)
Year ended as of December 31,
2011 2010 2009
Beginning of the period . . . . . . . . . . . . . . . . . . . . . . . . . . . . . . . . . . . . . . . . . . 2,555 396 657
Increase resulting from tax positions taken . . . . . . . . . . . . . . . . . . . . . . . . . . . . . . . 1,076 2,130 47Decrease resulting from tax positions taken(a) . . . . . . . . . . . . . . . . . . . . . . . . . . . . (3,409) (24) (474)Cumulative translation adjustments . . . . . . . . . . . . . . . . . . . . . . . . . . . . . . . . . . . 41 53 166
End of the period . . . . . . . . . . . . . . . . . . . . . . . . . . . . . . . . . . . . . . . . . . . . . 263 2,555 396
(a) In July 2011, we made a payment as a consequence of a Brazilian court decision in a case related to the exemption of the SocialContribution (Contribuicao Social sobre o Lucro Lıquido).
F-22

14NOV201111161635Notes to the Consolidated Financial Statements (Continued)
Expressed in millions of United States dollars, unless otherwise stated
6 Income taxes (Continued)
December 31, December 31,2011 2010
Current deferred tax assetsAccrued expenses deductible only when disbursed . . . . . . . . . . . . . . . . . . . . . . . . . . . . . . . 203 386
AssetsRelated to provision for losses and write-downs of investmentsEmployee postretirement benefits provision . . . . . . . . . . . . . . . . . . . . . . . . . . . . . . . . . . . 640 665Tax loss carryforwards . . . . . . . . . . . . . . . . . . . . . . . . . . . . . . . . . . . . . . . . . . . . . . . . 916 732Fair value of financial instruments . . . . . . . . . . . . . . . . . . . . . . . . . . . . . . . . . . . . . . . . 610 379Asset retirement obligation . . . . . . . . . . . . . . . . . . . . . . . . . . . . . . . . . . . . . . . . . . . . 389 322Other temporary differences (mainly contingencies provisions) . . . . . . . . . . . . . . . . . . . . . . . . 794 855
3,349 2,953
LiabilitiesPrepaid retirement benefit . . . . . . . . . . . . . . . . . . . . . . . . . . . . . . . . . . . . . . . . . . . . . (509) (617)Fair value adjustments in business combinations . . . . . . . . . . . . . . . . . . . . . . . . . . . . . . . . (7,311) (7,745)Social contribution . . . . . . . . . . . . . . . . . . . . . . . . . . . . . . . . . . . . . . . . . . . . . . . . . – (2,145)Other temporary differences . . . . . . . . . . . . . . . . . . . . . . . . . . . . . . . . . . . . . . . . . . . . (463) (421)
(8,283) (10,928)
Valuation allowanceBeginning balance . . . . . . . . . . . . . . . . . . . . . . . . . . . . . . . . . . . . . . . . . . . . . . . . . . (110) (106)Change in allowance . . . . . . . . . . . . . . . . . . . . . . . . . . . . . . . . . . . . . . . . . . . . . . . . (16) (4)
Ending balance . . . . . . . . . . . . . . . . . . . . . . . . . . . . . . . . . . . . . . . . . . . . . . . . . . . (126) (110)
Net long-term deferred tax liabilities . . . . . . . . . . . . . . . . . . . . . . . . . . . . . . . . . . . . . . . (5,060) (8,085)
Asset . . . . . . . . . . . . . . . . . . . . . . . . . . . . . . . . . . . . . . . . . . . . . . . . . . . . . . . . . 594 –Liabilities . . . . . . . . . . . . . . . . . . . . . . . . . . . . . . . . . . . . . . . . . . . . . . . . . . . . . . . (5,654) (8,085)
Total . . . . . . . . . . . . . . . . . . . . . . . . . . . . . . . . . . . . . . . . . . . . . . . . . . . . . . . . . (5,060) (8,085)
7 Cash and cash equivalents
As of December 31,
2011 2010
Cash . . . . . . . . . . . . . . . . . . . . . . . . . . . . . . . . . . . . . . . . . . . . . . . . . . . . . . . . . . . . . . . 945 560Cash equivalents . . . . . . . . . . . . . . . . . . . . . . . . . . . . . . . . . . . . . . . . . . . . . . . . . . . . . . . . 2,586 7,024
3,531 7,584
All the above mentioned short-term investments are made through the use of low risk fixed incomesecurities, in a way that those denominated in Brazilian Reais are concentrated in investments indexed to theCDI, and those denominated in US dollars are mainly time deposits, with the original due date less thanthree months.
F-23

14NOV201111161635Notes to the Consolidated Financial Statements (Continued)
Expressed in millions of United States dollars, unless otherwise stated
8 Short-term investments
As of December 31,
2011 2010
Time deposit . . . . . . . . . . . . . . . . . . . . . . . . . . . . . . . . . . . . . . . . . . . . . . . . . . . . . . . . . . – 1,793
Represent low risk investments with original due date over three months.
9 Accounts receivable
Accounts receivable from customers in the steel industry represent 70.36% of receivables atDecember 31, 2011.
No single customer accounted for more than 10% of total revenues.
Additional allowances for doubtful accounts charged to the statement of income as expenses in 2011,2010 and 2009 totaled US$2, US$23 and US$48, respectively. We wrote-off US$1 in 2011, US$37 in 2010 andUS$8 in 2009.
As of December 31,
2011 2010
CustomersDenominated in Brazilian Reais . . . . . . . . . . . . . . . . . . . . . . . . . . . . . . . . . . . . . . . . . . . . . . . 1,228 1,227Denominated in other currencies, mainly US dollars . . . . . . . . . . . . . . . . . . . . . . . . . . . . . . . . . . . 7,382 7,102
8,610 8,329Allowance for doubtful accounts . . . . . . . . . . . . . . . . . . . . . . . . . . . . . . . . . . . . . . . . . . . . . . (105) (118)
Total . . . . . . . . . . . . . . . . . . . . . . . . . . . . . . . . . . . . . . . . . . . . . . . . . . . . . . . . . . . . . . 8,505 8,211
10 Inventories
As of December 31,
2011 2010
ProductsNickel (co-products and by-products) . . . . . . . . . . . . . . . . . . . . . . . . . . . . . . . . . . . . . . . . . . . . 1,771 1,310Iron ore and pellets . . . . . . . . . . . . . . . . . . . . . . . . . . . . . . . . . . . . . . . . . . . . . . . . . . . . . . 1,137 825Manganese and ferroalloys . . . . . . . . . . . . . . . . . . . . . . . . . . . . . . . . . . . . . . . . . . . . . . . . . . 240 203Fertilizer . . . . . . . . . . . . . . . . . . . . . . . . . . . . . . . . . . . . . . . . . . . . . . . . . . . . . . . . . . . . 387 171Copper concentrate . . . . . . . . . . . . . . . . . . . . . . . . . . . . . . . . . . . . . . . . . . . . . . . . . . . . . . 72 28Coal . . . . . . . . . . . . . . . . . . . . . . . . . . . . . . . . . . . . . . . . . . . . . . . . . . . . . . . . . . . . . . . 277 74Others . . . . . . . . . . . . . . . . . . . . . . . . . . . . . . . . . . . . . . . . . . . . . . . . . . . . . . . . . . . . . 91 143Spare parts and maintenance supplies . . . . . . . . . . . . . . . . . . . . . . . . . . . . . . . . . . . . . . . . . . . 1,276 1,544
5,251 4,298
On December 31, 2011, the inventory includes provision for adjustment to market value for theproducts nickel and manganese in the amount of US$ 14 and US$ 9, respectively, there were no adjustmentsat December 31, 2010.
F-24
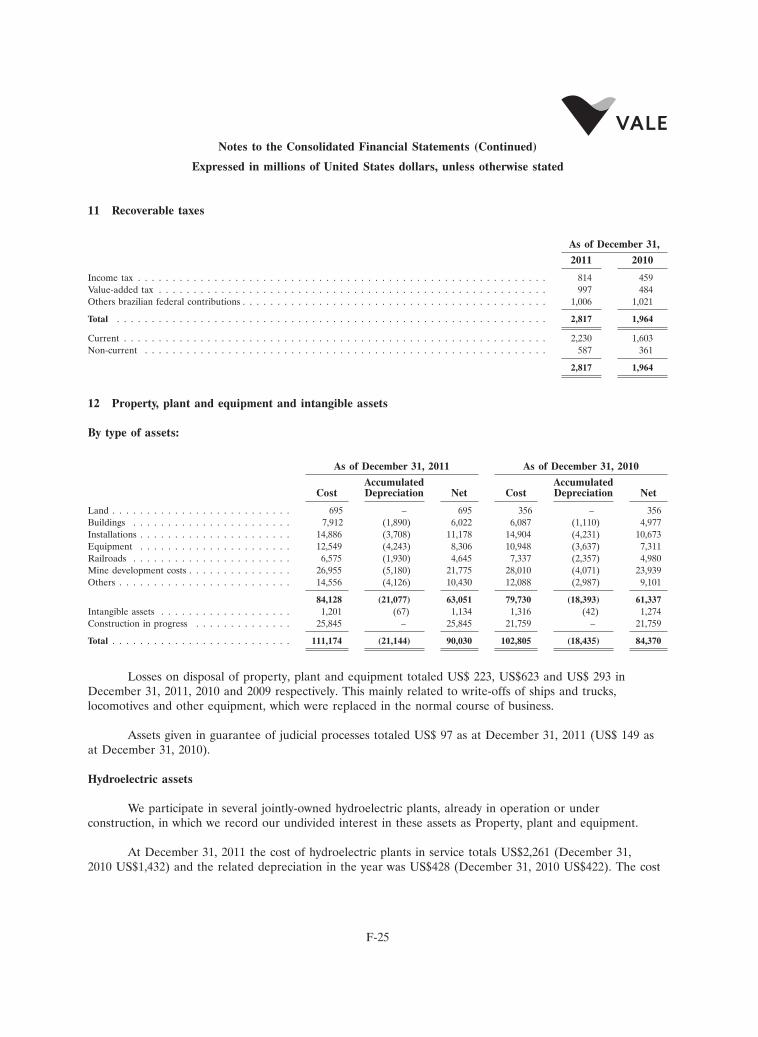
14NOV201111161635Notes to the Consolidated Financial Statements (Continued)
Expressed in millions of United States dollars, unless otherwise stated
11 Recoverable taxes
As of December 31,
2011 2010
Income tax . . . . . . . . . . . . . . . . . . . . . . . . . . . . . . . . . . . . . . . . . . . . . . . . . . . . . . . . . . . 814 459Value-added tax . . . . . . . . . . . . . . . . . . . . . . . . . . . . . . . . . . . . . . . . . . . . . . . . . . . . . . . . 997 484Others brazilian federal contributions . . . . . . . . . . . . . . . . . . . . . . . . . . . . . . . . . . . . . . . . . . . . 1,006 1,021
Total . . . . . . . . . . . . . . . . . . . . . . . . . . . . . . . . . . . . . . . . . . . . . . . . . . . . . . . . . . . . . . 2,817 1,964
Current . . . . . . . . . . . . . . . . . . . . . . . . . . . . . . . . . . . . . . . . . . . . . . . . . . . . . . . . . . . . . 2,230 1,603Non-current . . . . . . . . . . . . . . . . . . . . . . . . . . . . . . . . . . . . . . . . . . . . . . . . . . . . . . . . . . 587 361
2,817 1,964
12 Property, plant and equipment and intangible assets
By type of assets:
As of December 31, 2011 As of December 31, 2010
Accumulated AccumulatedCost Depreciation Net Cost Depreciation Net
Land . . . . . . . . . . . . . . . . . . . . . . . . . . 695 – 695 356 – 356Buildings . . . . . . . . . . . . . . . . . . . . . . . 7,912 (1,890) 6,022 6,087 (1,110) 4,977Installations . . . . . . . . . . . . . . . . . . . . . . 14,886 (3,708) 11,178 14,904 (4,231) 10,673Equipment . . . . . . . . . . . . . . . . . . . . . . 12,549 (4,243) 8,306 10,948 (3,637) 7,311Railroads . . . . . . . . . . . . . . . . . . . . . . . 6,575 (1,930) 4,645 7,337 (2,357) 4,980Mine development costs . . . . . . . . . . . . . . . 26,955 (5,180) 21,775 28,010 (4,071) 23,939Others . . . . . . . . . . . . . . . . . . . . . . . . . 14,556 (4,126) 10,430 12,088 (2,987) 9,101
84,128 (21,077) 63,051 79,730 (18,393) 61,337Intangible assets . . . . . . . . . . . . . . . . . . . 1,201 (67) 1,134 1,316 (42) 1,274Construction in progress . . . . . . . . . . . . . . 25,845 – 25,845 21,759 – 21,759
Total . . . . . . . . . . . . . . . . . . . . . . . . . . 111,174 (21,144) 90,030 102,805 (18,435) 84,370
Losses on disposal of property, plant and equipment totaled US$ 223, US$623 and US$ 293 inDecember 31, 2011, 2010 and 2009 respectively. This mainly related to write-offs of ships and trucks,locomotives and other equipment, which were replaced in the normal course of business.
Assets given in guarantee of judicial processes totaled US$ 97 as at December 31, 2011 (US$ 149 asat December 31, 2010).
Hydroelectric assets
We participate in several jointly-owned hydroelectric plants, already in operation or underconstruction, in which we record our undivided interest in these assets as Property, plant and equipment.
At December 31, 2011 the cost of hydroelectric plants in service totals US$2,261 (December 31,2010 US$1,432) and the related depreciation in the year was US$428 (December 31, 2010 US$422). The cost
F-25

14NOV201111161635Notes to the Consolidated Financial Statements (Continued)
Expressed in millions of United States dollars, unless otherwise stated
12 Property, plant and equipment and intangible assets (Continued)
of hydroelectric plant under construction totaled at December 31, 2011 totals US$59 (December 31,2010 US$804). Income and operating expenses for such plants are not material.
Intangibles
All of the intangible assets recognized in our financial statements were acquired from third parties,either directly or through a business combination and have definite useful lives from 6 to 30 years.
At December 31, 2011 the intangibles amount to US$ 1,135 (December 31, 2010—US$1,274), and arecomprised of rights granted by the government—Ferrovia Norte Sul of US$ 896 and off take-agreements ofUS$ 239.
13 Impairment of goodwill and long-lived assets
As described in note 3(h), we test goodwill and long-lived assets for impairment when events orchanges in circumstances indicate that they might be impaired. For impairment test purposes, goodwill isallocated to reporting units and are tested at least annually.
No impairment charges were recognized in 2011 and 2010, as a result of the annual goodwillimpairment tests performed.
Management determined cash flows based on approved financial budgets. Gross margin projectionswere based on past performance and management’s expectations of market developments. Information aboutsales prices are consistent with the forecasts included in industry reports, considering quoted prices whenavailable and when appropriate. The discount rates used, reflect specific risks relating to the relevant assets ineach reporting unit, depending on their composition and location.
Recognition of additional goodwill impairment charges in the future would depend on severalestimates including market conditions, recent actual results and management’s forecasts. This informationshall be obtained at the time when our assessment is to be updated. It is not possible at this time todetermine if any such future impairment charge would result or, if it does, whether such charge would bematerial.
F-26

14NOV201111161635
F-27
Notes to the Consolidated Financial Statements (Continued)
Expressed in millions of United States dollars, unless otherwise stated
14 Investments in affiliated companies and joint venturesEquity in earnings (losses) Dividends
December 31, 2011 Investments of investee adjustments Received
Net incomeParticipation Net (loss)in capital (%) equity of the period 2011 2010 2011 2010 2009 2011 2010 2009
Voting TotalBulk Material
Iron ore and pelletsCompanhia Nipo-Brasileira de Pelotizacao—
NIBRASCO(1) . . . . . . . . . . . . . . . . . . 51.11 51.00 341 89 173 171 45 48 (12) 22 3 20Companhia Hispano-Brasileira de Pelotizacao—
HISPANOBRAS(1) . . . . . . . . . . . . . . . . 51.00 50.89 225 36 115 128 19 40 (12) 20 – –Companhia Coreano-Brasileira de Pelotizacao—
KOBRASCO(1) . . . . . . . . . . . . . . . . . . 50.00 50.00 155 65 78 87 32 43 (17) 32 11 –Companhia Italo-Brasileira de Pelotizacao—
ITABRASCO(1) . . . . . . . . . . . . . . . . . . 51.00 50.90 158 93 80 86 47 18 12 38 25 –Minas da Serra Geral SA—MSG . . . . . . . . . 50.00 50.00 57 7 29 36 3 6 2 – – –SAMARCO Mineracao SA—SAMARCO(2) . . . 50.00 50.00 941 1,754 528 561 878 798 299 812 950 190Baovale Mineracao SA—BAOVALE . . . . . . . 50.00 50.00 69 16 35 31 8 4 (3) – – –Zhuhai YPM Pellet e Co,Ltd—ZHUHAI . . . . 25.00 25.00 90 1 23 25 – 9 3 – – –Tecnored Desenvolvimento Tecnologico SA . . . 43.04 43.04 107 (13) 48 40 (7) (10) – – – –
1,109 1,165 1,025 956 272 924 989 210Coal
Henan Longyu Resources Co Ltd . . . . . . . . . 25.00 25.00 1,128 336 282 250 85 76 74 – 83 –Shandong Yankuang International Company Ltd 25.00 25.00 (170) (58) (43) (27) (15) (19) (18) – – –
239 223 70 57 56 – 83 –Base Metals
BauxiteMineracao Rio do Norte SA—MRN . . . . . . . 40.00 40.00 357 19 144 152 8 (2) (10) – 10 42
144 152 8 (2) (10) – 10 42Copper
Teal Minerals Incorporated . . . . . . . . . . . . . 50.00 50.00 469 (12) 234 90 (6) (10) (18) –
234 90 (6) (10) (18) – – –Nickel
Heron Resources Inc(3) . . . . . . . . . . . . . . – – – – 6 7 – – – – – –Korea Nickel Corp . . . . . . . . . . . . . . . . . 25.00 25.00 16 – 4 11 – 2 – – – –Others(3) . . . . . . . . . . . . . . . . . . . . . . . – – – – 1 5 – – – – – –
11 23 – 2 – – – –
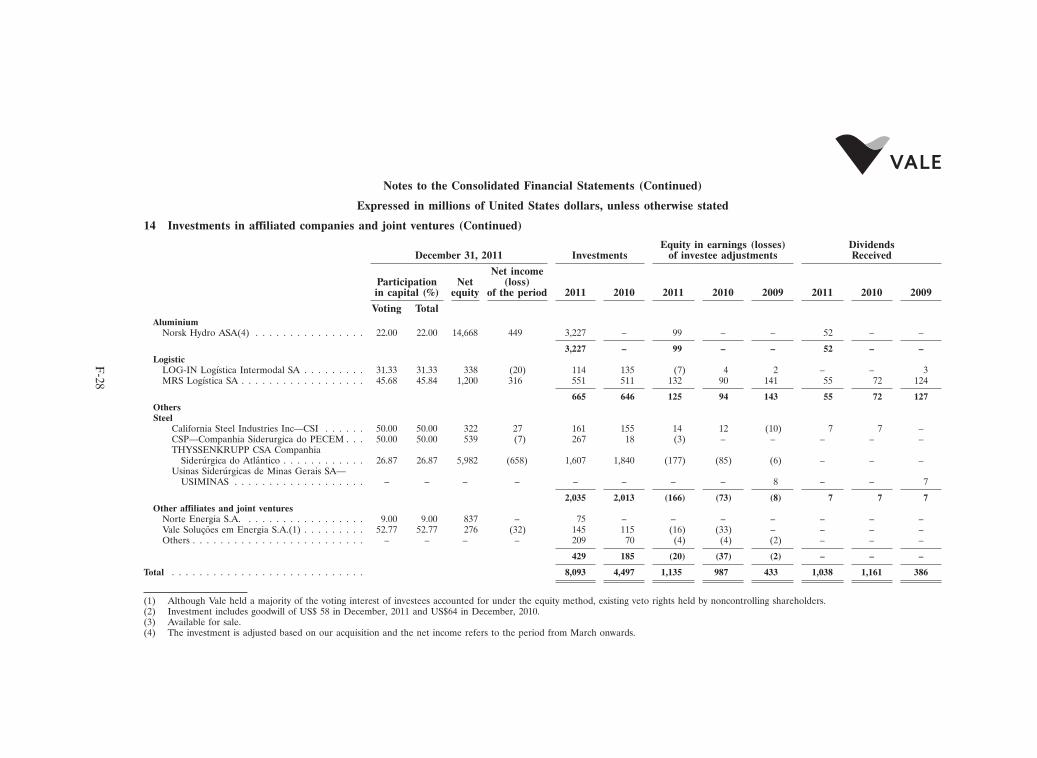
14NOV201111161635
F-28
Notes to the Consolidated Financial Statements (Continued)
Expressed in millions of United States dollars, unless otherwise stated
14 Investments in affiliated companies and joint ventures (Continued)
Equity in earnings (losses) DividendsDecember 31, 2011 Investments of investee adjustments Received
Net incomeParticipation Net (loss)in capital (%) equity of the period 2011 2010 2011 2010 2009 2011 2010 2009
Voting TotalAluminium
Norsk Hydro ASA(4) . . . . . . . . . . . . . . . . 22.00 22.00 14,668 449 3,227 – 99 – – 52 – –
3,227 – 99 – – 52 – –Logistic
LOG-IN Logıstica Intermodal SA . . . . . . . . . 31.33 31.33 338 (20) 114 135 (7) 4 2 – – 3MRS Logıstica SA . . . . . . . . . . . . . . . . . . 45.68 45.84 1,200 316 551 511 132 90 141 55 72 124
665 646 125 94 143 55 72 127OthersSteel
California Steel Industries Inc—CSI . . . . . . 50.00 50.00 322 27 161 155 14 12 (10) 7 7 –CSP—Companhia Siderurgica do PECEM . . . 50.00 50.00 539 (7) 267 18 (3) – – – – –THYSSENKRUPP CSA Companhia
Siderurgica do Atlantico . . . . . . . . . . . . 26.87 26.87 5,982 (658) 1,607 1,840 (177) (85) (6) – – –Usinas Siderurgicas de Minas Gerais SA—
USIMINAS . . . . . . . . . . . . . . . . . . . – – – – – – – – 8 – – 7
2,035 2,013 (166) (73) (8) 7 7 7Other affiliates and joint ventures
Norte Energia S.A. . . . . . . . . . . . . . . . . . 9.00 9.00 837 – 75 – – – – – – –Vale Solucoes em Energia S.A.(1) . . . . . . . . . 52.77 52.77 276 (32) 145 115 (16) (33) – – – –Others . . . . . . . . . . . . . . . . . . . . . . . . . – – – – 209 70 (4) (4) (2) – – –
429 185 (20) (37) (2) – – –
Total . . . . . . . . . . . . . . . . . . . . . . . . . . . . 8,093 4,497 1,135 987 433 1,038 1,161 386
(1) Although Vale held a majority of the voting interest of investees accounted for under the equity method, existing veto rights held by noncontrolling shareholders.(2) Investment includes goodwill of US$ 58 in December, 2011 and US$64 in December, 2010.(3) Available for sale.(4) The investment is adjusted based on our acquisition and the net income refers to the period from March onwards.

14NOV201111161635Notes to the Consolidated Financial Statements (Continued)
Expressed in millions of United States dollars, unless otherwise stated
15 Short-term debt
Short-term borrowings outstanding on December 31, 2011 are from commercial banks for importfinancing denominated in US dollars with average annual interest rates of 1.81%.
16 Long-term debt
Current liabilities Non-current liabilities
2011 2010 2011 2010
Foreign debtLoans and financing denominated in the following currencies:
US dollars . . . . . . . . . . . . . . . . . . . . . . . . . . . . . . . . . . . . . . 496 2,384 2,693 2,530Others . . . . . . . . . . . . . . . . . . . . . . . . . . . . . . . . . . . . . . . . 9 18 52 217
Fixed Rate NotesUS dollars . . . . . . . . . . . . . . . . . . . . . . . . . . . . . . . . . . . . . . 410 – 10,073 10,242EUR . . . . . . . . . . . . . . . . . . . . . . . . . . . . . . . . . . . . . . . . . – 970 1,003
Perpetual notes . . . . . . . . . . . . . . . . . . . . . . . . . . . . . . . . . . . . . – – – 78Accrued charges . . . . . . . . . . . . . . . . . . . . . . . . . . . . . . . . . . . . 221 233 – –
1,136 2,635 13,788 14,070
Brazilian debtBrazilian Reais indexed to Long-Term Interest Rate—TJLP/CDI and General
Price Index-Market (IGP-M) . . . . . . . . . . . . . . . . . . . . . . . . . . . . 246 76 5,245 3,891Basket of currencies . . . . . . . . . . . . . . . . . . . . . . . . . . . . . . . . . . 1 1 – 125Non-convertible debentures . . . . . . . . . . . . . . . . . . . . . . . . . . . . . . – – 2,505 2,767US dollars denominated . . . . . . . . . . . . . . . . . . . . . . . . . . . . . . . – 1 – 738Accrued charges . . . . . . . . . . . . . . . . . . . . . . . . . . . . . . . . . . . . 112 110 – –
359 188 7,750 7,521
Total . . . . . . . . . . . . . . . . . . . . . . . . . . . . . . . . . . . . . . . . . . . . 1,495 2,823 21,538 21,591
The long-term portion at December 31, 2011 was as follows:
2013 . . . . . . . . . . . . . . . . . . . . . . . . . . . . . . . . . . . . . . . . . . . . . . . . . . . . . . . . . . . . . . . . . . . . . . . . . 3,1842014 . . . . . . . . . . . . . . . . . . . . . . . . . . . . . . . . . . . . . . . . . . . . . . . . . . . . . . . . . . . . . . . . . . . . . . . . . 1,2312015 . . . . . . . . . . . . . . . . . . . . . . . . . . . . . . . . . . . . . . . . . . . . . . . . . . . . . . . . . . . . . . . . . . . . . . . . . 9522016 . . . . . . . . . . . . . . . . . . . . . . . . . . . . . . . . . . . . . . . . . . . . . . . . . . . . . . . . . . . . . . . . . . . . . . . . . 1,6072017 and after . . . . . . . . . . . . . . . . . . . . . . . . . . . . . . . . . . . . . . . . . . . . . . . . . . . . . . . . . . . . . . . . . . . 14,200No due date . . . . . . . . . . . . . . . . . . . . . . . . . . . . . . . . . . . . . . . . . . . . . . . . . . . . . . . . . . . . . . . . . . . . 364
21,538
F-29

14NOV201111161635Notes to the Consolidated Financial Statements (Continued)
Expressed in millions of United States dollars, unless otherwise stated
16 Long-term debt (Continued)
At December 31, 2011 annual interest rates on long-term debt were as follows:
Up to 3% . . . . . . . . . . . . . . . . . . . . . . . . . . . . . . . . . . . . . . . . . . . . . . . . . . . . . . . . . . . . . . . . . . . . . . 4,7383.1% to 5%(*) . . . . . . . . . . . . . . . . . . . . . . . . . . . . . . . . . . . . . . . . . . . . . . . . . . . . . . . . . . . . . . . . . . . 2,3015.1% to 7% . . . . . . . . . . . . . . . . . . . . . . . . . . . . . . . . . . . . . . . . . . . . . . . . . . . . . . . . . . . . . . . . . . . . . 8,8027.1% to 9%(**) . . . . . . . . . . . . . . . . . . . . . . . . . . . . . . . . . . . . . . . . . . . . . . . . . . . . . . . . . . . . . . . . . . 2,7939.1% to 11%(**) . . . . . . . . . . . . . . . . . . . . . . . . . . . . . . . . . . . . . . . . . . . . . . . . . . . . . . . . . . . . . . . . . . 2,365Over 11%(**) . . . . . . . . . . . . . . . . . . . . . . . . . . . . . . . . . . . . . . . . . . . . . . . . . . . . . . . . . . . . . . . . . . . 2,033Variable . . . . . . . . . . . . . . . . . . . . . . . . . . . . . . . . . . . . . . . . . . . . . . . . . . . . . . . . . . . . . . . . . . . . . . . 1
23,033
(*) Includes Eurobonds. For this operation we have entered into derivative transactions at a cost of 4.71% per year in US dollars.
(**) Includes non-convertible debentures and other Brazilian Real denominated debt that bear interest at the Brazilian Interbank Certificateof Deposit (CDI) and Brazilian Government Long-term Interest Rates (TJLP) plus a spread. For these operations, we have enteredinto derivative transactions to mitigate our exposure to the floating rate debt denominated in Brazilian Real, totaling US$ 6,005 ofwhich US$ 5,041 has an original interest rate above 7% per year. The average cost after taking into account the derivative transactionsis 2.98% per year in US dollars.
The average cost of all derivative transactions is 3.22% per year in US dollars.
Vale has non-convertible debentures in Brazilian Real denominated as follows:
Quantity as of December 31, 2011 Balance
Non Convertible Debentures Issued Outstanding Maturity Interest December 31, 2011 December 31, 2010
2nd Series . . . . . . . . . . . 400,000 400,000 November 20, 2013 100% CDI + 0.25% 2,167 2,429Tranche ‘‘B’’ . . . . . . . . . 5 5 No date 6.5% p.a + IGP-DI 364 367
2,531 2,796
Long-term portion . . . . . . 2,505 2,767Accrued charges . . . . . . . 26 29
2,531 2,796
The indexation indices/rates applied to our debt were as follows (unaudited):
Year ended as of December 31,
2011 2010
TJLP—Long-Term Interest Rate (effective rate) . . . . . . . . . . . . . . . . . . . . . . . . . . . . . . . . . . . . . – 6.0IGP-M—General Price Index-Market . . . . . . . . . . . . . . . . . . . . . . . . . . . . . . . . . . . . . . . . . . 4.1 10.9Appreciation (devaluation) of Real against US dollar . . . . . . . . . . . . . . . . . . . . . . . . . . . . . . . . . . 25.3 4.7
On January 4, 2012, (subsequent event) we issued US$1 billion notes due 2022 sold at a price of98.804% of the principal amount and will bear a coupon of 4.375% per year, payable semi-annually thoughour wholly-owned subsidiary Vale Overseas Limited.
F-30

14NOV201111161635Notes to the Consolidated Financial Statements (Continued)
Expressed in millions of United States dollars, unless otherwise stated
16 Long-term debt (Continued)
Credit Lines
Vale has available revolving credit lines that can be disbursed and paid at any time, during itsavailability period. On December 31, 2011, the total amount available under the revolving credit lines wasUS$4.1 billion, of which US$3 billion can be drawn by Vale S.A., Vale Canada Limited and ValeInternational, US$350 can be drawn by Vale International and the balance by Vale Canada Limited. As ofDecember 31, 2011, none of the borrowers had drawn any amounts under these facilities, but letters of credittotaling US$107 had been issued and remained outstanding pursuant Vale Canada Limited’s facility.
In August 2011, we entered into an agreement with a syndicate of financial institutions to finance theacquisition of five large ore carriers and two capesize bulkers at two Korean shipyards. The agreementprovides a credit line of up to US$530. As of December 31, 2011, Vale had drawn US$178 under the facility.
In October 2010, we signed an agreement with Export Development Canada (EDC) to finance itsinvestment program. Under the agreement, EDC will provide a credit line of up to US$1 billion. As ofDecember 31, 2011, Vale disbursed US$ 500. In September 2010, Vale entered into agreements with TheExport-Import Bank of China and the Bank of China Limited for the financing to build 12 very large orecarriers comprising a facility for an amount of up to US$1,229. The financing has a 13-year total term to berepaid, and the funds will be disbursed during 3 years according to the construction schedule. As ofDecember 31, 2011, we had drawn US$467 under this facility.
In June 2010, Vale established certain facilities with Banco Nacional de Desenvolvimento EconomicoSocial—BNDES for a total amount of R$774, (US$430), to finance the acquisition of domestic equipments.On March 31, 2011, Vale increased this facility through a new agreement with BNDES for R$ 103 (US$ 62).As of December 31, 2011, we had drawn the equivalent of US$329 under these facilities.
In May 2008, the Company has signed agreements with Japanese long term financing credit agenciesin the amount of US$ 5 billion, being US$ 3 billion with Japan Bank for International Cooperation (JIBC)and US$ 2 billion with Nippon Export and Investment Insurance (NEXI), to finance mining projects, logisticsand energy generation. Until December 31, 2011, Vale through its subsidiary PT International NickelIndonesia Tbk (PTI) withdrew US$300, under the credit facility from NEXI to finance the construction of thehydroelectric plant of Karebbe, Indonesia.
In April 2008, Vale has signed a credit line in the amount of R$ 7.3 billion (US$ 4 billion) with BancoNacional de Desenvolvimento Economico e Social—BNDES to finance its investment program. UntilDecember 31, 2011, Vale withdrew R$ 2,795 (US$1,496) in this line.
Guarantee
On December 31, 2011, US$ 648 of the total aggregate outstanding debt was secured by fixed assets.
Covenants
Our principal covenants require us to maintain certain ratios, such as debt to EBITDA and interestcoverage. We have not identified any events of noncompliance as of December 31, 2011.
F-31
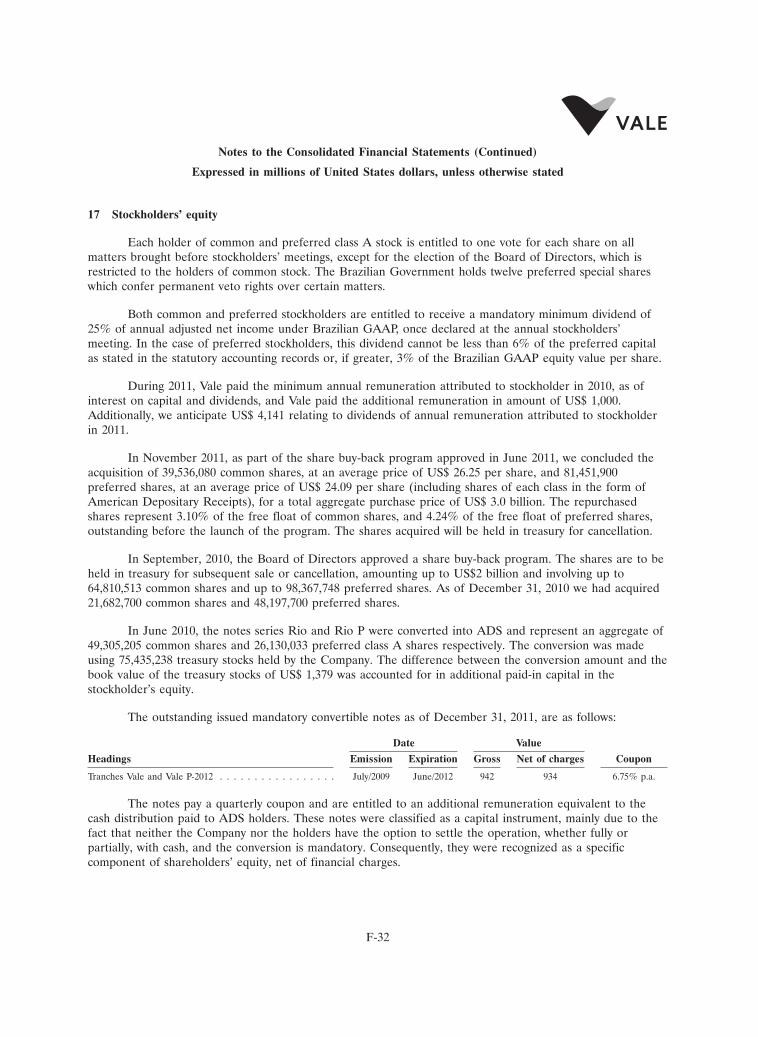
14NOV201111161635Notes to the Consolidated Financial Statements (Continued)
Expressed in millions of United States dollars, unless otherwise stated
17 Stockholders’ equity
Each holder of common and preferred class A stock is entitled to one vote for each share on allmatters brought before stockholders’ meetings, except for the election of the Board of Directors, which isrestricted to the holders of common stock. The Brazilian Government holds twelve preferred special shareswhich confer permanent veto rights over certain matters.
Both common and preferred stockholders are entitled to receive a mandatory minimum dividend of25% of annual adjusted net income under Brazilian GAAP, once declared at the annual stockholders’meeting. In the case of preferred stockholders, this dividend cannot be less than 6% of the preferred capitalas stated in the statutory accounting records or, if greater, 3% of the Brazilian GAAP equity value per share.
During 2011, Vale paid the minimum annual remuneration attributed to stockholder in 2010, as ofinterest on capital and dividends, and Vale paid the additional remuneration in amount of US$ 1,000.Additionally, we anticipate US$ 4,141 relating to dividends of annual remuneration attributed to stockholderin 2011.
In November 2011, as part of the share buy-back program approved in June 2011, we concluded theacquisition of 39,536,080 common shares, at an average price of US$ 26.25 per share, and 81,451,900preferred shares, at an average price of US$ 24.09 per share (including shares of each class in the form ofAmerican Depositary Receipts), for a total aggregate purchase price of US$ 3.0 billion. The repurchasedshares represent 3.10% of the free float of common shares, and 4.24% of the free float of preferred shares,outstanding before the launch of the program. The shares acquired will be held in treasury for cancellation.
In September, 2010, the Board of Directors approved a share buy-back program. The shares are to beheld in treasury for subsequent sale or cancellation, amounting up to US$2 billion and involving up to64,810,513 common shares and up to 98,367,748 preferred shares. As of December 31, 2010 we had acquired21,682,700 common shares and 48,197,700 preferred shares.
In June 2010, the notes series Rio and Rio P were converted into ADS and represent an aggregate of49,305,205 common shares and 26,130,033 preferred class A shares respectively. The conversion was madeusing 75,435,238 treasury stocks held by the Company. The difference between the conversion amount and thebook value of the treasury stocks of US$ 1,379 was accounted for in additional paid-in capital in thestockholder’s equity.
The outstanding issued mandatory convertible notes as of December 31, 2011, are as follows:
Date Value
Headings Emission Expiration Gross Net of charges Coupon
Tranches Vale and Vale P-2012 . . . . . . . . . . . . . . . . . July/2009 June/2012 942 934 6.75% p.a.
The notes pay a quarterly coupon and are entitled to an additional remuneration equivalent to thecash distribution paid to ADS holders. These notes were classified as a capital instrument, mainly due to thefact that neither the Company nor the holders have the option to settle the operation, whether fully orpartially, with cash, and the conversion is mandatory. Consequently, they were recognized as a specificcomponent of shareholders’ equity, net of financial charges.
F-32

14NOV201111161635Notes to the Consolidated Financial Statements (Continued)
Expressed in millions of United States dollars, unless otherwise stated
17 Stockholders’ equity (Continued)
The funds linked to future mandatory conversion, net of charges are equivalent to the maximum ofcommon shares and preferred shares, are as follows. All the shares are currently held in treasury.
Maximum amount of action Value
Headings Common Preferred Common Preferred
Tranches Vale and Vale P-2012 . . . . . . . . . . . . . . . . . . . . . . . . . 18,415,859 47,284,800 293 649
In November 2011, Vale paid additional remuneration to holders of mandatorily convertible notes,series VALE-2012 and VALE P-2012, in the amount of US$ 1.657454 and US$ 1.917027 per note,respectively.
In September 2011, Vale paid additional remuneration to holders of mandatorily convertible notes,series VALE-2012 and VALE P-2012, in the amount of US$ 1.806046 and US$ 2.088890 per note,respectively.
In April 2011, Vale paid additional remuneration to holders of mandatorily convertible notes, seriesVALE-2012 and VALE P-2012, in the amount of US$ 0.985344 and US$ 1.139659 per note, respectively.
In January 2011, Vale paid additional remuneration to holders of mandatorily convertible notes, seriesVALE-2012 and VALE P-2012, US$ 0.462708 and US$ 0.535173 per note, respectively.
Brazilian law permits the payment of cash dividends only from retained earnings as stated in the BRGAAP statutory records and such payments are made in Brazilian reais. Pursuant to the Company’s statutorybooks, undistributed retained earnings at December 31, 2011, total US$36,145, comprising of the unrealizedincome and expansion reserves, which could be freely transferred to retained earnings and paid as dividends,if approved by the stockholders, after deducting of the minimum annual mandatory dividend, which is 25% ofnet income of the parent Company.
No withholding tax is payable on distribution of profits earned, except for distributions in the form ofinterest attributed to stockholders’ equity (Note 3 (q)).
Brazilian laws and our By-laws require that certain appropriations be made from retained earnings toreserve accounts on an annual basis, all determined in accordance with amounts stated in the statutoryaccounting records.
The purpose and basis of appropriation to such reserves is described below:
Unrealized income reserve—this represents principally our share of the earnings of affiliates and jointventures, not yet received in the form of cash dividends.
Expansion reserve—this is a general reserve for expansion of our activities.
Legal reserve—this reserve is a requirement for all Brazilian corporations and represents theappropriation of 5% of annual net income up to a limit of 20% of capital stock all determined underBrazilian GAAP.
Fiscal incentive investment reserve—this reserve results from an option to designate a portion ofincome tax otherwise payable, for investment in government approved projects and is recorded in the yearfollowing that in which the taxable income was earned. As from 2000, this reserve basically contemplatesincome tax incentives (Note 6).
F-33
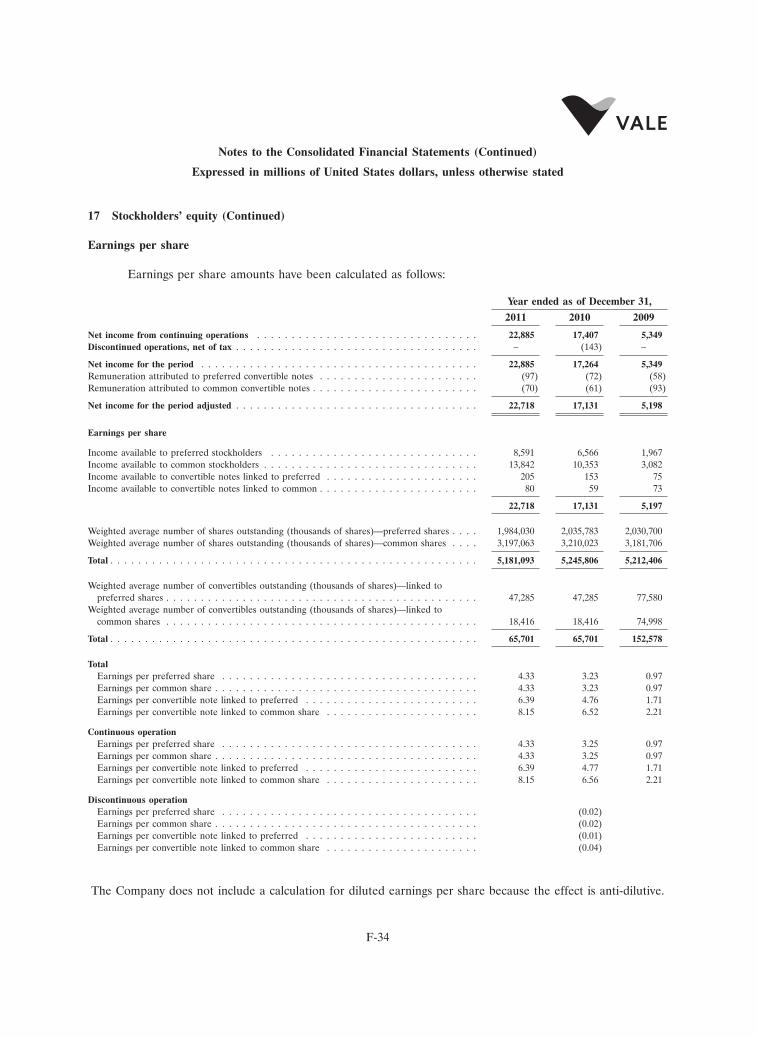
14NOV201111161635Notes to the Consolidated Financial Statements (Continued)
Expressed in millions of United States dollars, unless otherwise stated
17 Stockholders’ equity (Continued)
Earnings per share
Earnings per share amounts have been calculated as follows:
Year ended as of December 31,
2011 2010 2009
Net income from continuing operations . . . . . . . . . . . . . . . . . . . . . . . . . . . . . . . . 22,885 17,407 5,349Discontinued operations, net of tax . . . . . . . . . . . . . . . . . . . . . . . . . . . . . . . . . . . – (143) –
Net income for the period . . . . . . . . . . . . . . . . . . . . . . . . . . . . . . . . . . . . . . . . 22,885 17,264 5,349Remuneration attributed to preferred convertible notes . . . . . . . . . . . . . . . . . . . . . . . (97) (72) (58)Remuneration attributed to common convertible notes . . . . . . . . . . . . . . . . . . . . . . . . (70) (61) (93)
Net income for the period adjusted . . . . . . . . . . . . . . . . . . . . . . . . . . . . . . . . . . . 22,718 17,131 5,198
Earnings per share
Income available to preferred stockholders . . . . . . . . . . . . . . . . . . . . . . . . . . . . . . 8,591 6,566 1,967Income available to common stockholders . . . . . . . . . . . . . . . . . . . . . . . . . . . . . . . 13,842 10,353 3,082Income available to convertible notes linked to preferred . . . . . . . . . . . . . . . . . . . . . . 205 153 75Income available to convertible notes linked to common . . . . . . . . . . . . . . . . . . . . . . . 80 59 73
22,718 17,131 5,197
Weighted average number of shares outstanding (thousands of shares)—preferred shares . . . . 1,984,030 2,035,783 2,030,700Weighted average number of shares outstanding (thousands of shares)—common shares . . . . 3,197,063 3,210,023 3,181,706
Total . . . . . . . . . . . . . . . . . . . . . . . . . . . . . . . . . . . . . . . . . . . . . . . . . . . . . 5,181,093 5,245,806 5,212,406
Weighted average number of convertibles outstanding (thousands of shares)—linked topreferred shares . . . . . . . . . . . . . . . . . . . . . . . . . . . . . . . . . . . . . . . . . . . . . 47,285 47,285 77,580
Weighted average number of convertibles outstanding (thousands of shares)—linked tocommon shares . . . . . . . . . . . . . . . . . . . . . . . . . . . . . . . . . . . . . . . . . . . . . 18,416 18,416 74,998
Total . . . . . . . . . . . . . . . . . . . . . . . . . . . . . . . . . . . . . . . . . . . . . . . . . . . . . 65,701 65,701 152,578
TotalEarnings per preferred share . . . . . . . . . . . . . . . . . . . . . . . . . . . . . . . . . . . . . 4.33 3.23 0.97Earnings per common share . . . . . . . . . . . . . . . . . . . . . . . . . . . . . . . . . . . . . . 4.33 3.23 0.97Earnings per convertible note linked to preferred . . . . . . . . . . . . . . . . . . . . . . . . . 6.39 4.76 1.71Earnings per convertible note linked to common share . . . . . . . . . . . . . . . . . . . . . . 8.15 6.52 2.21
Continuous operationEarnings per preferred share . . . . . . . . . . . . . . . . . . . . . . . . . . . . . . . . . . . . . 4.33 3.25 0.97Earnings per common share . . . . . . . . . . . . . . . . . . . . . . . . . . . . . . . . . . . . . . 4.33 3.25 0.97Earnings per convertible note linked to preferred . . . . . . . . . . . . . . . . . . . . . . . . . 6.39 4.77 1.71Earnings per convertible note linked to common share . . . . . . . . . . . . . . . . . . . . . . 8.15 6.56 2.21
Discontinuous operationEarnings per preferred share . . . . . . . . . . . . . . . . . . . . . . . . . . . . . . . . . . . . . (0.02)Earnings per common share . . . . . . . . . . . . . . . . . . . . . . . . . . . . . . . . . . . . . . (0.02)Earnings per convertible note linked to preferred . . . . . . . . . . . . . . . . . . . . . . . . . (0.01)Earnings per convertible note linked to common share . . . . . . . . . . . . . . . . . . . . . . (0.04)
The Company does not include a calculation for diluted earnings per share because the effect is anti-dilutive.
F-34

14NOV201111161635Notes to the Consolidated Financial Statements (Continued)
Expressed in millions of United States dollars, unless otherwise stated
18 Pension plans
The Company is the sponsor of pension plans mixed with characteristics of benefit and definedcontribution (such as benefit plan Vale Mais), which includes retirement income and the risk benefits (deathpension, retirement for disability and sickness benefit). These plans are calculated based on length of service,age, salary base and supplement to Social Security benefits. These plans are administered by Fundacao Valedo Rio Doce de Seguridade Social—VALIA.
The Company also sponsors a pension plan with defined benefit characteristics. This plan was fundedby monthly contributions made by the sponsor and employees, calculated on the basis of periodic actuarialestimates. With the creation of the plan Vale Mais in May 2000, more than 98% of active employees opted totransfer. The defined benefit is still there, covering almost exclusively retired participants and theirbeneficiaries. This plan is also administered by VALIA.
Additionally, a specific group of former employees are entitled to additional payments to the normalbenefits of VALIA through Complementation Bonus plus a post-retirement benefit that covers medical, dentaland pharmaceutical assistance to that specific group.
Vale Fertilizantes and its wholly owned subsidiaries pay to employees who are eligible to the FGTS’fine according to union agreement and provide certain health benefits for retired employees who are eligible.
The Company also has defined benefit plans and other post-employment benefits administered byother foundations and social security entities which, together, benefiting all employees.
The following information details the status of the defined benefit elements of all plans in accordancewith employers disclosure about pensions and other post retirement benefits, as well as costs related to them.
We use a measurement date December 31 for our pension and post retirement benefit plans.
F-35

14NOV201111161635Notes to the Consolidated Financial Statements (Continued)
Expressed in millions of United States dollars, unless otherwise stated
18 Pension plans (Continued)
a) Change in benefit obligation
As of December 31, 2011 As of December 31, 2010
Overfunded Underfunded Underfunded Overfunded Underfunded Underfundedpension plans pension plans other benefits pension plans pension plans other benefits
Benefit obligation atbeginning of year . . 3,623 5,667 1,601 3,661 3,923 1,431
Benefit initialrecognizedconsolidation . . . . . – – – 385 12 58
Transfers . . . . . . . . . 1,132 (1,132) – (936) 936 –Service cost . . . . . . . 18 79 32 2 59 26Interest cost . . . . . . . 517 272 102 329 360 102Plan amendment . . . . – 2 (23) (28) 10 (2)Assumptions changes . 141 39 10 87 65 6Benefits paid/ Actual
distribution . . . . . . (345) (363) (82) (237) (364) (78)Plan settlements . . . . – (26) (8) – – –Effect of exchange rate
changes . . . . . . . . (539) (138) (67) 126 241 71Actuarial loss . . . . . . 64 162 129 234 425 (13)
Benefit obligation atend of year . . . . . . 4,611 4,562 1,694 3,623 5,667 1,601
b) Change in plan assets
As of December 31, 2011 As of December 31, 2010
Overfunded Underfunded Underfunded Overfunded Underfunded Underfundedpension plans pension plans other benefits pension plans pension plans other benefits
Fair value of planassets at beginning ofyear . . . . . . . . . . 5,585 4,645 13 4,996 3,229 11
Fair value initialrecognizedconsolidation . . . . . – – – 451 10 –
Transfers . . . . . . . . . 1,105 (1,105) – (866) 866 –Actual return on plan
assets . . . . . . . . . 573 125 – 1,094 541 1Employer contributions 65 512 82 2 169 80Benefits paid/ Actual
distribution . . . . . . (345) (363) (82) (265) (364) (80)Plan settlements . . . . – (26) (11) – – –Effect of exchange rate
changes . . . . . . . . (706) (126) (1) 173 194 1
Fair value of planassets at end of year 6,277 3,662 1 5,585 4,645 13
F-36

14NOV201111161635Notes to the Consolidated Financial Statements (Continued)
Expressed in millions of United States dollars, unless otherwise stated
18 Pension plans (Continued)
A special contribution was made to the Vale Canada Limited defined underfunded benefit plans ofUS$342 during the period. The contribution was made to bring the adequate ratios which provide ValeCanada with more certain funding requirements for 2011-2013.
Plan assets managed by Valia on December 31, 2011, December 31, 2010 and January 1, 2010 includeinvestments in portfolio of our own stock of US$340, US$519 and US$587, investments in debentures worthUS$63, US$64 and US$69 and equity investments from related parties amounting to US$84, US$81 andUS$164, respectively. They also include on December 31, 2011, 31 December 2010 and January 1, 2010,US$3,552, US$4,150 and US$3,261 of securities of the Federal Government. The assets of the pension plansof Vale Canada Limited in securities of the Government of Canada on December 31, 2011, 2010 andJanuary 1, 2010, amounted to US$653, US$436 and US$391, respectively. The assets of Vale Fertilizantes andUltrafertil on December 31, 2011 and December 31, 2010 in securities of the Federal Government were worthUS$149 and US$158, respectively.
c) Funded Status and Financial Position
As of December 31, 2011 As of December 31, 2010
Overfunded Underfunded Underfunded Overfunded Underfunded Underfundedpension plans pension plans other benefits pension plans pension plans other benefits
Noncurrent assets . . . 1,666 – – 1,962 – –Current liabilities . . . . – (69) (78) – (35) (133)Non-current liabilities . – (831) (1,615) – (987) (1,455)
Funded status . . . . . . 1,666 (900) (1,693) 1,962 (1,022) (1,588)
d) Assumptions used (nominal terms)
All calculations involve future actuarial projections for some parameters, such as salaries, interest,inflation, the behavior of INSS benefits, mortality, disability, etc. No actuarial results can be analyzed withoutprior knowledge of the scenario of assumptions used in the assessment.
The economic actuarial assumptions adopted were formulated considering the long life of the planand should therefore be examined in that light. So, in the short term, they may not necessarily be realized.
F-37
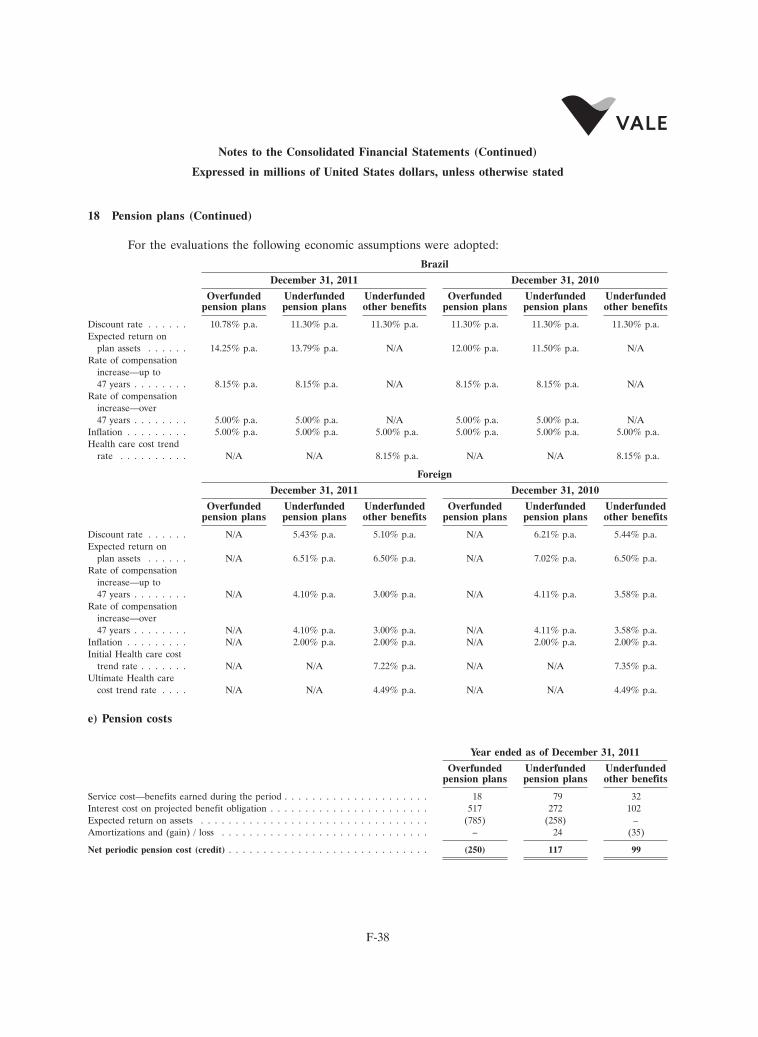
14NOV201111161635Notes to the Consolidated Financial Statements (Continued)
Expressed in millions of United States dollars, unless otherwise stated
18 Pension plans (Continued)
For the evaluations the following economic assumptions were adopted:
Brazil
December 31, 2011 December 31, 2010
Overfunded Underfunded Underfunded Overfunded Underfunded Underfundedpension plans pension plans other benefits pension plans pension plans other benefits
Discount rate . . . . . . 10.78% p.a. 11.30% p.a. 11.30% p.a. 11.30% p.a. 11.30% p.a. 11.30% p.a.Expected return on
plan assets . . . . . . 14.25% p.a. 13.79% p.a. N/A 12.00% p.a. 11.50% p.a. N/ARate of compensation
increase—up to47 years . . . . . . . . 8.15% p.a. 8.15% p.a. N/A 8.15% p.a. 8.15% p.a. N/A
Rate of compensationincrease—over47 years . . . . . . . . 5.00% p.a. 5.00% p.a. N/A 5.00% p.a. 5.00% p.a. N/A
Inflation . . . . . . . . . 5.00% p.a. 5.00% p.a. 5.00% p.a. 5.00% p.a. 5.00% p.a. 5.00% p.a.Health care cost trend
rate . . . . . . . . . . N/A N/A 8.15% p.a. N/A N/A 8.15% p.a.
Foreign
December 31, 2011 December 31, 2010
Overfunded Underfunded Underfunded Overfunded Underfunded Underfundedpension plans pension plans other benefits pension plans pension plans other benefits
Discount rate . . . . . . N/A 5.43% p.a. 5.10% p.a. N/A 6.21% p.a. 5.44% p.a.Expected return on
plan assets . . . . . . N/A 6.51% p.a. 6.50% p.a. N/A 7.02% p.a. 6.50% p.a.Rate of compensation
increase—up to47 years . . . . . . . . N/A 4.10% p.a. 3.00% p.a. N/A 4.11% p.a. 3.58% p.a.
Rate of compensationincrease—over47 years . . . . . . . . N/A 4.10% p.a. 3.00% p.a. N/A 4.11% p.a. 3.58% p.a.
Inflation . . . . . . . . . N/A 2.00% p.a. 2.00% p.a. N/A 2.00% p.a. 2.00% p.a.Initial Health care cost
trend rate . . . . . . . N/A N/A 7.22% p.a. N/A N/A 7.35% p.a.Ultimate Health care
cost trend rate . . . . N/A N/A 4.49% p.a. N/A N/A 4.49% p.a.
e) Pension costs
Year ended as of December 31, 2011
Overfunded Underfunded Underfundedpension plans pension plans other benefits
Service cost—benefits earned during the period . . . . . . . . . . . . . . . . . . . . . 18 79 32Interest cost on projected benefit obligation . . . . . . . . . . . . . . . . . . . . . . . 517 272 102Expected return on assets . . . . . . . . . . . . . . . . . . . . . . . . . . . . . . . . . (785) (258) –Amortizations and (gain) / loss . . . . . . . . . . . . . . . . . . . . . . . . . . . . . . – 24 (35)
Net periodic pension cost (credit) . . . . . . . . . . . . . . . . . . . . . . . . . . . . . (250) 117 99
F-38
14NOV201111161635Notes to the Consolidated Financial Statements (Continued)
Expressed in millions of United States dollars, unless otherwise stated
18 Pension plans (Continued)
Year ended as of December 31, 2010
Overfunded Underfunded Underfundedpension plans pension plans other benefits
Service cost—benefits earned during the period . . . . . . . . . . . . . . . . . . . . . 2 59 27Interest cost on projected benefit obligation . . . . . . . . . . . . . . . . . . . . . . . 329 361 97Expected return on assets . . . . . . . . . . . . . . . . . . . . . . . . . . . . . . . . . (531) (321) –Amortizations and (gain) / loss . . . . . . . . . . . . . . . . . . . . . . . . . . . . . . – 18 (14)Net deferral . . . . . . . . . . . . . . . . . . . . . . . . . . . . . . . . . . . . . . . . . (1) – –
Net periodic pension cost (credit) . . . . . . . . . . . . . . . . . . . . . . . . . . . . . (201) 117 110
Year ended as of December 31, 2009
Overfunded Underfunded Underfundedpension plans pension plans other benefits
Service cost—benefits earned during the period . . . . . . . . . . . . . . . . . . . . . 11 43 17Interest cost on projected benefit obligation . . . . . . . . . . . . . . . . . . . . . . . 313 255 88Expected return on assets . . . . . . . . . . . . . . . . . . . . . . . . . . . . . . . . . (431) (202) (1)Amortizations and (gain)/loss . . . . . . . . . . . . . . . . . . . . . . . . . . . . . . . 14 3 (19)Net deferral . . . . . . . . . . . . . . . . . . . . . . . . . . . . . . . . . . . . . . . . . – 14 (14)
Net periodic pension cost (credit) . . . . . . . . . . . . . . . . . . . . . . . . . . . . . (93) 113 71
f) Accumulated benefit obligation
December 31, 2011 December 31, 2010
Overfunded Underfunded Underfunded Overfunded Underfunded Underfundedpension plans pension plans other benefits pension plans pension plans other benefits
Accumulated benefit obligation . . 4,610 4,404 1,694 3,612 5,540 1,601Projected benefit obligation . . . . . 4,611 4,562 1,694 3,623 5,667 1,601Fair value of plan assets . . . . . . . (6,277) (3,662) (1) (5,585) 4,645 (13)
g) Impact of 1% variation in assumed health care cost trend rate
1% increase 1% decrease
2011 2010 2011 2010
Accumulated postretirement benefit obligation (APBO) . . . . . . . . . . . . . . . . . . . . 258 213 (206) (172)Interest and service costs . . . . . . . . . . . . . . . . . . . . . . . . . . . . . . . . . . . . . . 22 12 (18) (17)
F-39
14NOV201111161635Notes to the Consolidated Financial Statements (Continued)
Expressed in millions of United States dollars, unless otherwise stated
18 Pension plans (Continued)
h) Other Cumulative Comprehensive Income (Deficit)
As of December 31, 2011 As of December 31, 2010
Overfunded Underfunded Underfunded Overfunded Underfunded Underfundedpension plans pension plans other benefits pension plans pension plans other benefits
Net prior service (cost)/credit . . . . – (15) – – (15) –Net actuarial (loss)/gain . . . . . . . (181) (885) 292 243 (628) 335Effect of exchange rate changes . . (24) 3 – (1) – (1)Deferred income tax . . . . . . . . . 70 249 (76) (82) 201 (111)
Amounts recognized in othercumulative comprehensiveincome (deficit) . . . . . . . . . . (135) (648) 216 160 (442) 223
i) Change in Other Cumulative Comprehensive Income (Deficit)
As of December 31, 2011 As of December 31, 2010
Overfunded Underfunded Underfunded Overfunded Underfunded Underfundedpension plans pension plans other benefits pension plans pension plans other benefits
Net prior service (cost)/credit notyet recognized in NPPC atbeginning of period . . . . . . . . – (14) – – – –
Net actuarial (loss)/gain not yetrecognized in NPPC at beginningof period . . . . . . . . . . . . . . 242 (629) 334 (18) (337) 297
Transfers . . . . . . . . . . . . . . . – – – 8 (8) –Deferred income tax at beginning
of period . . . . . . . . . . . . . . (82) 201 (111) 3 111 (94)
Effect of initial recognition ofcumulative comprehensiveincome (deficit) . . . . . . . . . . 160 (442) 223 (7) (234) 203
ReclassificationsAmortization of net transition
(obligation)/asset . . . . . . . . . – (5) – – – –Amortization of net prior service
(cost)/credited . . . . . . . . . . . – 5 – – – –Amortization of net actuarial
(loss)/gain . . . . . . . . . . . . . – 19 2 – (1) 9Total net actuarial (loss)/gain
arising during period . . . . . . . (423) (290) (48) 261 (277) 11Transfers . . . . . . . . . . . . . . . – – – (8) 8 –Effect of exchange rate changes . . (24) 17 4 (1) (28) 17Deferred income tax . . . . . . . . . 152 48 35 (85) 90 (17)
Total recognized in othercumulative comprehensiveincome (deficit) . . . . . . . . . . (135) (648) 216 160 (442) 223
F-40
14NOV201111161635Notes to the Consolidated Financial Statements (Continued)
Expressed in millions of United States dollars, unless otherwise stated
18 Pension plans (Continued)
j) Plan assets
Brazilian Plans
The Investment Policy Statements of pension plans sponsored for Brazilian employees are based on along term macroeconomic scenario and expected returns. An Investment Policy Statement was established foreach obligation by following results of a strategic asset allocation study.
Plan asset allocations comply with pension funds local regulation issued by CMN—ConselhoMonetario Nacional (Resolucao CMN 3792/09). We are allowed to invest in six different asset classes, definedas Segments by the law, as follows: Fixed Income, Equity, Structured Investments (Alternative Investmentsand Infra-Structure Projects), International Investments, Real Estate and Loans to Participants.
The Investment Policy Statements are approved by the Board, the Executive Directors and twoInvestments Committees. The internal and external portfolio managers are allowed to exercise investmentdiscretion under the limitations imposed by the Board and the Investment Committees.
The pension fund has a risk management process with established policies that intend to identifymeasure and control all kind of risks faced by our plans, such as: market, liquidity, credit, operational,systemic and legal.
Foreign plans
The strategy for each of the pension plans sponsored by Vale Canada is based upon a combination oflocal practices and the specific characteristics of the pension plans in each country, including the structure ofthe liabilities, the risk versus reward trade-off between different asset classes and the liquidity required tomeet benefit payments.
Overfunded pension plans
Brazilian Plans
The Defined Benefit Plan (the ‘‘Old Plan’’) has the most part of its assets allocated in fixed income,mainly in Brazilian government bonds (such as TIPS) and corporate long term inflation linked corporatebonds with the objective of reducing the asset-liability volatility. The target is 55% of the total assets. ThisLDI (Liability Driven Investments) strategy, when considered together with the Loans to Participantssegment, aims to hedge the plan’s liabilities against inflation risk and volatility. The target allocation for eachinvestment segment or asset class is as follows:
December 31, 2011 December 31, 2010
Fixed income . . . . . . . . . . . . . . . . . . . . . . . . . . . . . . . . . . . . . . . . . . . . . 57% 52%Equity . . . . . . . . . . . . . . . . . . . . . . . . . . . . . . . . . . . . . . . . . . . . . . . . . 24% 28%Structured investments . . . . . . . . . . . . . . . . . . . . . . . . . . . . . . . . . . . . . . . . 6% 6%International investments . . . . . . . . . . . . . . . . . . . . . . . . . . . . . . . . . . . . . . 1% 2%Real estate . . . . . . . . . . . . . . . . . . . . . . . . . . . . . . . . . . . . . . . . . . . . . . . 8% 7%Loans to participants . . . . . . . . . . . . . . . . . . . . . . . . . . . . . . . . . . . . . . . . . 4% 5%
F-41

14NOV201111161635Notes to the Consolidated Financial Statements (Continued)
Expressed in millions of United States dollars, unless otherwise stated
18 Pension plans (Continued)
The Investment Policy has the objective of achieving the adequate diversification, current income andlong term capital growth through the combination of all asset classes described above to fulfill its obligationswith the adequate level of risk. This plan has an average nominal return of 20% p.a. in dollars terms in thelast 11 years.
The Vale Mais Plan (the ‘‘New Plan’’) has obligations with both characteristics of defined benefit andvariable contribution, as mentioned. The most part of its investments is in fixed income. It also implementeda LDI (Liability Driven Investments) strategy to reduce asset-liability volatility of the defined benefits plan’scomponent by using inflation linked bonds (like TIPS). The target allocation for this strategy is 55% of totalassets of this sub-plan. The target allocation for each investment segment or asset class is as follows:
December 31, 2011 December 31, 2010
Fixed income . . . . . . . . . . . . . . . . . . . . . . . . . . . . . . . . . . . . . . . . . . . . . 56% 59%Equity . . . . . . . . . . . . . . . . . . . . . . . . . . . . . . . . . . . . . . . . . . . . . . . . . 24% 24%Structured investments . . . . . . . . . . . . . . . . . . . . . . . . . . . . . . . . . . . . . . . . 3.5% 2%International investments . . . . . . . . . . . . . . . . . . . . . . . . . . . . . . . . . . . . . . 0.5% 1%Real estate . . . . . . . . . . . . . . . . . . . . . . . . . . . . . . . . . . . . . . . . . . . . . . . 6% 4%Loans to participants . . . . . . . . . . . . . . . . . . . . . . . . . . . . . . . . . . . . . . . . . 10% 10%
The Defined Contribution Vale Mais component offers three options of asset classes mix that can bechosen by participants. The options are: Fixed Income—100%; 80% Fixed Income and 20% Equities and 65%Fixed Income and 35% Equities. Loan to participants is included in the fixed income options. Equitiesmanagement is done through investment fund that targets Ibovespa index.
The Investment Policy has the objective of achieving the adequate diversification, current income andlong term capital growth through the combination of all asset classes described above to fulfill its obligationswith the adequate level of risk. This plan has an average nominal return of 16% p.a. in dollars terms in thelast 11 years.
—Fair value measurements by category—Overfunded Plans
As of December 31, 2011 As of December 31, 2010
Total Level 1 Level 2 Level 3 Total Level 1 Level 2 Level 3
Asset by categoryCash and cash equivalents . . . . . . . . 2 2 – – 6 6 – –Accounts Receivable . . . . . . . . . . . 15 15 – – 81 81 – –Equity securities—liquid . . . . . . . . . 1,508 1,425 83 – 1,396 1,321 75 –Debt securities—Corporate bonds . . . 560 – 560 – 420 – 420 –Debt securities—Government bonds . . 2,134 2,134 – – 2,114 2,114 – –Investment funds—Fixed Income . . . . 2,292 2,292 – – 1,610 1,610 – –Investment funds—Equity . . . . . . . . 539 539 – – 513 513 – –International investments . . . . . . . . 13 13 – – 23 23 – –Structured investments—Private Equity
funds . . . . . . . . . . . . . . . . . . 194 – – 194 128 – – 128Structured investments—Real estate
funds . . . . . . . . . . . . . . . . . . 21 – – 21 19 – – 19Real estate . . . . . . . . . . . . . . . . 482 – – 482 288 – – 288Loans to Participants . . . . . . . . . . . 345 – – 345 182 – – 182
Total . . . . . . . . . . . . . . . . . . . . 8,105 6,420 643 1,042 6,780 5,668 495 617
Funds not related to risk plans . . . . . (1,828) (1,195)Fair value of plan assets at end of year 6,277 5,585
F-42

14NOV201111161635Notes to the Consolidated Financial Statements (Continued)
Expressed in millions of United States dollars, unless otherwise stated
18 Pension plans (Continued)
—Fair value measurements using significant unobservable inputs—Level 3 (Overfunded)
As of December 31, 2011 As of December 31, 2010
Private Real State Loans to Private Real State Loans toEquity Funds Funds Real State Participants Total Equity Funds Funds Real State Participants Total
Beginning ofthe year . . . 128 19 288 182 617 97 – 249 282 628
Actual returnon planassets . . . . (8) – 79 49 120 (3) 1 49 25 72
Initialrecognizedconsolidationof Fosfertil . – – – – – – – 22 5 27
Assets soldduring theperiod . . . . (1) – (22) (117) (140) (3) (1) (24) (75) (103)
Assetspurchases,sales andsettlements . 37 – 135 116 288 43 – 25 62 130
Cumulativetranslationadjustment . (16) (2) (35) (36) (89) 4 1 9 7 21
Transfers inand/or out ofLevel 3 . . . 54 4 37 151 246 (10) 18 (42) (124) (158)
End of the year 194 21 482 345 1,042 128 19 288 182 617
The target return for private equity assets in 2012 is 11.94% p.a. for the Old Plan and 11.51% p.a.forthe New Plan. The target allocation is 6% for the Old Plan and 5.3% for the New Plan, ranging between 2%and 10% for the Old Plan and ranging between 1% and 10% for the New Plan. These investments have alonger investment horizon and low liquidity that aim to profit from economic growth, especially in theinfrastructure sector of the Brazilian economy. The fair value of usually non-liquid assets is close toacquisition cost or book value. Some private equity funds, alternatively, apply the following methodologies:discounted cash flows analysis or analysis based on multiples.
The target return for loans to participants in 2012 is 16% p.a. The fair value pricing of these assetsincludes provisions for non-paid loans, according to the local pension fund regulation.
The target return for real estate assets in 2012 is 12.80% p.a. Fair value for these assets is close tobook value. The pension fund hires companies specialized in real estate valuation that do not act in themarket as brokers. All valuation techniques follow the local regulation.
F-43

14NOV201111161635Notes to the Consolidated Financial Statements (Continued)
Expressed in millions of United States dollars, unless otherwise stated
18 Pension plans (Continued)
Underfunded pension plans
Brazilian Obligation
The obligation has an exclusive allocation in fixed income. A LDI (Liability Driven Investments) wasalso used strategy for this plan. Most of the resources were invested in long term Brazilian government bonds(similar to TIPS) and inflation linked corporate bonds with the objective of minimizing asset-liability volatilityand reduce inflation risk.
The Investment Policy Statement has the objective of achieving the adequate diversification, currentincome and long term capital growth to fulfill its obligations with the adequate level of risk. This obligationhas an average nominal return of 16% p.a. in local currency in the last 6 years.
Foreign plans
All pension plans except PT Inco, have resulted in a target asset allocation of 60% in equityinvestments and 40% in fixed income investments, with all securities being traded in the public markets. Fixedincome investments are in domestic bonds for each plan’s market and involve a mixture of government andcorporate bonds. Equity investments are primarily global in nature and involve a mixture of large, mid andsmall capitalization companies with a modest explicit investment in domestic equities for each plan. TheCanadian plans also use a currency hedging strategy (each developed currency’s exposure is 50% hedged) dueto the large exposure to foreign securities. For PT Inco, the target allocation is 20% equity investment andthe remainder in fixed income, with the vast majority of these investments being made within the domesticmarket.
—Fair value measurements by category—Underfunded Pension Plans
As of December 31, 2011 As of December 31, 2010
Total Level 1 Level 2 Level 3 Total Level 1 Level 2 Level 3
Asset by categoryCash and cash equivalents . . . . . . . . . 41 17 24 – 52 22 30 –Accounts Receivable . . . . . . . . . . . . 11 11 – – 20 20 – –Equity securities . . . . . . . . . . . . . . 1,232 1,231 1 – 1,628 1,623 5 –Debt securities . . . . . . . . . . . . . . . 259 – 259 – 175 – 175 –Debt securities—Government bonds . . . 660 33 627 – 786 370 416 –Investment funds—Fixed Income . . . . . 1,007 439 568 – 1,799 1,079 720 –Investment funds—Equity . . . . . . . . . 450 74 376 – 437 91 346 –International investments . . . . . . . . . 2 – 2 – 6 3 3 –Investment funds—Private Equity . . . . . – – – – 216 216 – –Structured investments—Private Equity
funds . . . . . . . . . . . . . . . . . . . – – – – 15 – – 15Structured investments—Real estate funds – – – – 1 – – 1Real estate . . . . . . . . . . . . . . . . . – – – – 37 – – 37Loans to Participants . . . . . . . . . . . . – – – – 151 – – 151
Total . . . . . . . . . . . . . . . . . . . . . 3,662 1,805 1,857 – 5,323 3,424 1,695 204
Funds not related to risk plans . . . . . . – (678)
Fair value of plan assets at end of year . . 3,662 4,645
F-44

14NOV201111161635Notes to the Consolidated Financial Statements (Continued)
Expressed in millions of United States dollars, unless otherwise stated
18 Pension plans (Continued)
—Fair value measurements using significant unobservable inputs—Level 3 (Underfunded)
As of December 31, 2011 As of December 31, 2010
Private Real State Loans to Private Real State Loans toEquity Funds Funds Real State Participants Total Equity Funds Funds Real State Participants Total
Beginning of the year 15 1 37 151 204 – – – – –Actual return on plan
assets . . . . . . . . – – – – – (2) – 4 20 22Assets sold during
the period . . . . . – – – – – 7 – (2) (57) (52)Assets purchases,
sales andsettlements . . . . . – – – – – – – 10 58 68
Cumulativetranslationadjustment . . . . . – – – – – – – 1 6 7
Transfers in and/orout of Level 3 . . . (15) (1) (37) (151) (204) 10 1 24 124 159
End of the year . . . – – – – – 15 1 37 151 204
Underfunded other benefits
—Fair value measurements by category—Other Benefits
As of December 31, 2011 As of December 31, 2010
Total Level 1 Total Level 1
Asset by categoryCash . . . . . . . . . . . . . . . . . . . . . . . . . . . . . . . . . . . . . . 1 1 13 13
Total . . . . . . . . . . . . . . . . . . . . . . . . . . . . . . . . . . . . . . 1 1 13 13
k) Cash flow contributions
Employer contributions expected for 2012 are US$262.
l) Estimated future benefit payments
The benefit payments, which reflect future service, are expected to be made as follows:
As of December 31, 2011
Overfunded Underfunded Underfundedpension plans pension plans other benefits
2012 . . . . . . . . . . . . . . . . . . . . . . . . . . . . . . . . . . . . . . . . . 282 403 892013 . . . . . . . . . . . . . . . . . . . . . . . . . . . . . . . . . . . . . . . . . 279 393 932014 . . . . . . . . . . . . . . . . . . . . . . . . . . . . . . . . . . . . . . . . . 279 387 962015 . . . . . . . . . . . . . . . . . . . . . . . . . . . . . . . . . . . . . . . . . 272 387 992016 . . . . . . . . . . . . . . . . . . . . . . . . . . . . . . . . . . . . . . . . . 269 383 1012017 and thereafter . . . . . . . . . . . . . . . . . . . . . . . . . . . . . . . . . 1,269 1,917 494
F-45

14NOV201111161635Notes to the Consolidated Financial Statements (Continued)
Expressed in millions of United States dollars, unless otherwise stated
18 Pension plans (Continued)
m) Summary of participant data
As of December 31, 2011 As of December 31, 2010
Overfunded Underfunded Underfunded Overfunded Underfunded Underfundedpension plans pension plans other benefits pension plans pension plans other benefits
Active participantsNumber . . . . . . . . . . . . 202 67,951 74,729 245 59,923 67,990Average age—years . . . . . 50.0 36 35.9 49.8 36 36.4Average service—years . . . . 27.2 7 7.7 27.1 8 8.5
Terminated vested participantsNumber . . . . . . . . . . . . – 5,815 – – 4,876 –Average age—years . . . . . – 39 – – 40 –
Retirees and beneficiariesNumber . . . . . . . . . . . . 18,380 18,189 32,633 18,496 18,078 32,765Average age—years . . . . . 66.3 71 63.7 65.6 71 62.5
19 Long-term incentive compensation plan
Under the terms of the long-term incentive compensation plan, the participants, restricted to certainexecutives, may elect to allocate part of their annual bonus to the plan. The allocation is applied to purchasepreferred shares of Vale, through a predefined financial institution, at market conditions and with no benefitprovided by Vale.
The shares purchased by each executive are unrestricted and may, at the participant’s discretion, besold at any time. However, the shares must be held for a three-year period and the executive must becontinually employed by Vale during that period. The participant then becomes entitled to receive from Valea cash payment equivalent to the total amount of shares held, based on the market rates. The total shareslinked to the plan at December 31, 2011 and December 31, 2010, are 3,012,538 and 2,458,627, respectively.
Additionally, as a long-term incentive certain eligible executives have the opportunity to receive at theend of the triennial cycle, a certain number of shares at market rates, based on an evaluation of their careerand performance factors measured as an indicator of total return to stockholders.
We account for the compensation cost provided to our executives under this long-term incentivecompensation plan, following the requirements for Accounting for Stock-Based Compensation. Liabilities aremeasured at each reporting date at fair value, based on market rates. Compensation costs incurred arerecognized, over the defined three-year vesting period. At December 31, 2011, December 31, 2010 andDecember 31, 2009, we recognized a liability of US$109, US$120 and US$72, respectively, through theStatement of Income.
20 Commitments and contingencies
a) In connection with the Girardin Act tax—advantaged lease financing arrangement sponsored by theFrench government, we provided guarantees to BNP Paribas for the benefit of the tax investors regardingcertain payments due from VNC, associated with the Girardin Act lease financing. We also committed that
F-46

14NOV201111161635Notes to the Consolidated Financial Statements (Continued)
Expressed in millions of United States dollars, unless otherwise stated
20 Commitments and contingencies (Continued)
assets associated with the Girardin Act lease financing would be substantially complete by December 31, 2011.In light of the delay in the start-up of the VNC processing facilities, we have proposed an extension to thepreviously agreed substantial completion date of December 31, 2011 to December 31, 2012. The FrenchGovernment and tax investors have been briefed on this request and a formal request for extension has beensubmitted to them. We believe the likelihood of the guarantee being called upon to be remote.
Sumic Nickel Netherlands B.V. (‘‘Sumic’’), a 21% stockholder of VNC, has a put option to sell to us25%, 50%, or 100% of the shares they own of VNC if the defined cost of the initial nickel cobaltdevelopment project, as measured by funding provided to VNC, in natural currencies and converted to U.S.dollars at specified rates of exchange, in the form of Girardin Act lease financing, shareholder loans andequity contributions by shareholders to VNC, exceeded US$4.6 billion and an agreement cannot be reachedon how to proceed with the project. On May 27, 2010 the threshold was reached. The put option discussionand decision period was stayed to January 1, 2012. We are currently in discussions with Sumic on theircontinued participation in VNC, and expect to reach a resolution during the second or third quarter of 2012following a prescribed process which occurs over a five month period.
In addition, in the course of our operations we have provided letters of credit and guarantees in theamount of US$465 million that are associated with items such as environment reclamation, asset retirementobligation commitments, insurance, electricity commitments, community service commitments and import andexport duties.
b) We and our subsidiaries are defendants in numerous legal actions in the normal course of business.Based on the advice of our legal counsel, management believes that the amounts recognized are sufficient tocover probable losses in connection with such actions.
The provision for contingencies and the related judicial deposits is as follows:
As of December 31,
2011 2010
Provision for Provision forcontingencies Judicial deposits contingencies Judicial deposits
Labor and social security claims . . . . . . . . . . . . 751 895 748 874Civil claims . . . . . . . . . . . . . . . . . . . . . . . . 248 151 510 410Tax—related actions . . . . . . . . . . . . . . . . . . . 654 413 746 442Others . . . . . . . . . . . . . . . . . . . . . . . . . . . 33 5 39 5
1,686 1,464 2,043 1,731
Labor and social security related actions principally comprise of claims by Brazilian current andformer employees for (i) payment of time spent travelling from their residences to the work-place,(ii) additional health and safety related payments and (iii) various other matters, often in connection withdisputes about the amount of indemnities paid upon dismissal and the one-third extra holiday pay.
Civil actions principally relate to claims made against us by contractors in Brazil in connection withlosses alleged to have been incurred by them as a result of various past Government economic plans, during
F-47

14NOV201111161635Notes to the Consolidated Financial Statements (Continued)
Expressed in millions of United States dollars, unless otherwise stated
20 Commitments and contingencies (Continued)
which full inflation indexation of contracts was not permitted, as well as for accidents and land appropriationdisputes.
Tax related actions principally comprise of challenges initiated by us, on certain taxes on revenues anduncertain tax positions. We continue to vigorously pursue our interests in all these actions but recognize thatwe probably will incur some losses in the final instance, for which we have made provisions.
Judicial deposits are made by us following court requirements in order to be entitled to either initiateor continue a legal action. These amounts are released to us upon receipt of a final favorable outcome fromthe legal action, and in the case of an unfavorable outcome, the deposits are transferred to the prevailingparty.
Contingencies settled during the year ended December 31, 2011, December 31, 2010 andDecember 31, 2009, totaled US$658, US$352 and US$236, respectively. Provisions recognized in the yearended December 31, 2011, December 31, 2010 and December 31, 2009, totaled US$526, US$112 and US$294,respectively, classified as other operating expenses.
In addition to the contingencies for which we have made provisions, we are defendants in claimswhere in our opinion, and based on the advice of our legal counsel, the likelihood of loss is reasonablypossible but not probable, in the total amount of US$ 22,449 at December 31, 2011, and for which noprovision has been made (December 31, 2010—US$4,787). The increase in the values of reasonably possibletax contingencies refers mainly to tax assessments against us for regarding the payment of Income Tax andSocial Contribution calculated based on the equity method in foreign subsidiaries.
c) At the time of our privatization in 1997, the Company issued debentures to its then-existingstockholders, including the Brazilian Government. The terms of these debentures were set to ensure that thepre-privatization stockholders, including the Brazilian Government, would participate in possible futurefinancial benefits that could be obtained from exploiting certain mineral resources.
A total of 388,559,056 Debentures were issued at a par value of R$ 0.01 (one cent), whose value willbe restated in accordance with the variation in the General Market Price Index (IGP-M), as set forth in theIssue Deed. In December 31, 2011 the total amount of these debentures was US$ 1,336 (US$ 1,284 inDecember 31, 2010).
The debenture holders have the right to receive premiums, paid semiannually, equivalent to apercentage of net revenues from specific mine resources as set forth in the indenture.
During 2011 we paid remuneration on these debentures of US$ 14.
d) Description of Leasing Arrangements
Part of our railroad operations include leased facilities. The 30-year lease is renewable for a further30 years and expires in August, 2026 and is classified as an operating lease. At the end of the lease term, weare required to return the concession and the leased assets. In most cases, management expects that in thenormal course of business, leases will be renewed.
F-48
14NOV201111161635Notes to the Consolidated Financial Statements (Continued)
Expressed in millions of United States dollars, unless otherwise stated
20 Commitments and contingencies (Continued)
The following is a schedule by year of future minimum rental payments required under the railroadoperating leases that have initial or remaining non-cancelable lease terms in excess of one year as ofDecember 31, 2011.
2012 . . . . . . . . . . . . . . . . . . . . . . . . . . . . . . . . . . . . . . . . . . . . . . . . . . . . . . . . . . . . . . . . . . . . . . 872013 . . . . . . . . . . . . . . . . . . . . . . . . . . . . . . . . . . . . . . . . . . . . . . . . . . . . . . . . . . . . . . . . . . . . . . 872014 . . . . . . . . . . . . . . . . . . . . . . . . . . . . . . . . . . . . . . . . . . . . . . . . . . . . . . . . . . . . . . . . . . . . . . 872015 . . . . . . . . . . . . . . . . . . . . . . . . . . . . . . . . . . . . . . . . . . . . . . . . . . . . . . . . . . . . . . . . . . . . . . 872016 thereafter . . . . . . . . . . . . . . . . . . . . . . . . . . . . . . . . . . . . . . . . . . . . . . . . . . . . . . . . . . . . . . . . 955
Total minimum payments required . . . . . . . . . . . . . . . . . . . . . . . . . . . . . . . . . . . . . . . . . . . . . . . . . . . . . 1,303
The total expenses of operating leases for the years ended December 31, 2011, 2010 and 2009 wereUS$87, US$90 and US$80, respectively.
During 2008, we entered into operating lease agreements with our joint ventures Nibrasco, Itabrascoand Kobrasco, under which we leased four pellet plants. The lease terms are from 5 to 30 years.
The following is a schedule by year of future minimum rental payments required under the pelletplants operating leases that have initial or remaining non-cancelable lease terms in excess of one year as ofDecember 31, 2011:
2012 . . . . . . . . . . . . . . . . . . . . . . . . . . . . . . . . . . . . . . . . . . . . . . . . . . . . . . . . . . . . . . . . . . . . . . . . . 662013 . . . . . . . . . . . . . . . . . . . . . . . . . . . . . . . . . . . . . . . . . . . . . . . . . . . . . . . . . . . . . . . . . . . . . . . . . 582014 . . . . . . . . . . . . . . . . . . . . . . . . . . . . . . . . . . . . . . . . . . . . . . . . . . . . . . . . . . . . . . . . . . . . . . . . . 232015 . . . . . . . . . . . . . . . . . . . . . . . . . . . . . . . . . . . . . . . . . . . . . . . . . . . . . . . . . . . . . . . . . . . . . . . . . 232016 thereafter . . . . . . . . . . . . . . . . . . . . . . . . . . . . . . . . . . . . . . . . . . . . . . . . . . . . . . . . . . . . . . . . . . . 64
Total minimum payments required . . . . . . . . . . . . . . . . . . . . . . . . . . . . . . . . . . . . . . . . . . . . . . . . . . . . . . . . 234
The total expenses of operating leases for the years ended December 31, 2011, 2010 and 2009 wereUS$66, US$107 and US$114, respectively.
e) Asset retirement obligations
We use various judgments and assumptions when measuring our asset retirement obligations.
Changes in circumstances, law or technology may affect our cash flow estimates and we periodicallyreview the amounts accrued and adjust them as necessary. Our accruals do not reflect unasserted claimsbecause we are currently not aware of any such issues. Also the amounts provided are not reduced by anypotential recoveries under cost sharing, insurance or indemnification arrangements because such recoveriesare considered uncertain.
F-49
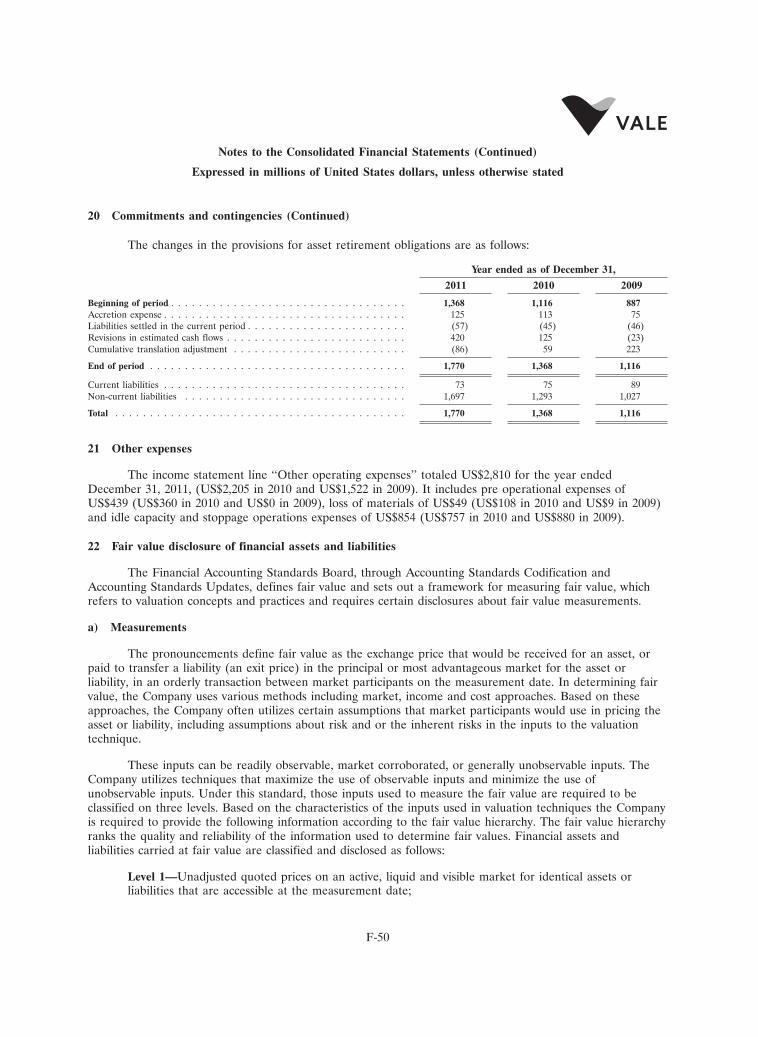
14NOV201111161635Notes to the Consolidated Financial Statements (Continued)
Expressed in millions of United States dollars, unless otherwise stated
20 Commitments and contingencies (Continued)
The changes in the provisions for asset retirement obligations are as follows:
Year ended as of December 31,
2011 2010 2009
Beginning of period . . . . . . . . . . . . . . . . . . . . . . . . . . . . . . . . . . 1,368 1,116 887Accretion expense . . . . . . . . . . . . . . . . . . . . . . . . . . . . . . . . . . . 125 113 75Liabilities settled in the current period . . . . . . . . . . . . . . . . . . . . . . . (57) (45) (46)Revisions in estimated cash flows . . . . . . . . . . . . . . . . . . . . . . . . . . 420 125 (23)Cumulative translation adjustment . . . . . . . . . . . . . . . . . . . . . . . . . (86) 59 223
End of period . . . . . . . . . . . . . . . . . . . . . . . . . . . . . . . . . . . . . 1,770 1,368 1,116
Current liabilities . . . . . . . . . . . . . . . . . . . . . . . . . . . . . . . . . . . 73 75 89Non-current liabilities . . . . . . . . . . . . . . . . . . . . . . . . . . . . . . . . 1,697 1,293 1,027
Total . . . . . . . . . . . . . . . . . . . . . . . . . . . . . . . . . . . . . . . . . . 1,770 1,368 1,116
21 Other expenses
The income statement line ‘‘Other operating expenses’’ totaled US$2,810 for the year endedDecember 31, 2011, (US$2,205 in 2010 and US$1,522 in 2009). It includes pre operational expenses ofUS$439 (US$360 in 2010 and US$0 in 2009), loss of materials of US$49 (US$108 in 2010 and US$9 in 2009)and idle capacity and stoppage operations expenses of US$854 (US$757 in 2010 and US$880 in 2009).
22 Fair value disclosure of financial assets and liabilities
The Financial Accounting Standards Board, through Accounting Standards Codification andAccounting Standards Updates, defines fair value and sets out a framework for measuring fair value, whichrefers to valuation concepts and practices and requires certain disclosures about fair value measurements.
a) Measurements
The pronouncements define fair value as the exchange price that would be received for an asset, orpaid to transfer a liability (an exit price) in the principal or most advantageous market for the asset orliability, in an orderly transaction between market participants on the measurement date. In determining fairvalue, the Company uses various methods including market, income and cost approaches. Based on theseapproaches, the Company often utilizes certain assumptions that market participants would use in pricing theasset or liability, including assumptions about risk and or the inherent risks in the inputs to the valuationtechnique.
These inputs can be readily observable, market corroborated, or generally unobservable inputs. TheCompany utilizes techniques that maximize the use of observable inputs and minimize the use ofunobservable inputs. Under this standard, those inputs used to measure the fair value are required to beclassified on three levels. Based on the characteristics of the inputs used in valuation techniques the Companyis required to provide the following information according to the fair value hierarchy. The fair value hierarchyranks the quality and reliability of the information used to determine fair values. Financial assets andliabilities carried at fair value are classified and disclosed as follows:
Level 1—Unadjusted quoted prices on an active, liquid and visible market for identical assets orliabilities that are accessible at the measurement date;
F-50

14NOV201111161635Notes to the Consolidated Financial Statements (Continued)
Expressed in millions of United States dollars, unless otherwise stated
22 Fair value disclosure of financial assets and liabilities (Continued)
Level 2—Quoted prices for identical or similar assets or liabilities on active markets, inputs other thanquoted prices that are observable, either directly or indirectly, for the term of the asset or liability;
Level 3—Assets and liabilities, for which quoted prices do not exist, or those prices or valuationtechniques are supported by little or no market activity, unobservable or illiquid. At this point, fairmarket valuation becomes highly subjective.
b) Measurements on a recurring basis
The description of the valuation methodologies used for recurring assets and liabilities measured atfair value in the Company’s Consolidated Balance Sheet at December 31, 2011 and December 31, 2010 aresummarized below:
� Available-for-sale securities
They are securities that are not classified either as held-for-trading or as held-to-maturity for strategicreasons and have readily available market prices. We evaluate the carrying value of some of our investmentsin relation to publicly quoted market prices when available. When there is no market value, we use inputsother than quoted prices.
� Derivatives
The market approach is used to estimate the fair value of the swaps discounting their cash flows usingthe interest rate of the currency they are denominated it is also used for the commodities contracts, since thefair value is computed by using forward curves for each commodity.
� Debentures
The fair value is measured by the market approach method, and the reference price is available onthe secondary market.
The tables below presents the balances of assets and liabilities measured at fair value on a recurringbasis as follows:
December 31, 2011
Carrying amount Fair value Level 1 Level 2
Available-for-sale securities . . . . . . . . . . 7 7 7 –Unrealized losses on derivatives . . . . . . . (81) (81) – (81)Debentures . . . . . . . . . . . . . . . . . . . (1,336) (1,336) – (1,336)
December 31, 2010
Carrying amount Fair value Level 1 Level 2
Available-for-sale securities . . . . . . . . . . 12 12 12 –Unrealized losses on derivatives . . . . . . . 257 257 1 256Debentures . . . . . . . . . . . . . . . . . . . (1,284) (1,284) – (1,284)
F-51

14NOV201111161635Notes to the Consolidated Financial Statements (Continued)
Expressed in millions of United States dollars, unless otherwise stated
22 Fair value disclosure of financial assets and liabilities (Continued)
c) Measurements on a non-recurring basis
The Company also has assets under certain conditions that are subject to measurement at fair valueon a non-recurring basis. These assets include goodwill and assets acquired and liabilities assumed in businesscombinations. During the year ended December 31, 2011, we have not recognized any impairment for thoseitems.
d) Financial Instruments
Long-term debt
The valuation method used to estimate the fair value of our debt is the market approach for thecontracts that are quoted on the secondary market, such as bonds and debentures. The fair value of bothfixed and floating rate debt is determined by discounting future cash flows of Libor and Vale’s bonds curves(income approach).
Time deposits
The method used is the income approach, through the prices available on the active market. The fairvalue is close to the carrying amount due to the short-term maturities of the instruments.
Our long-term debt is reported at amortized cost, and the income of time deposits is accrued monthlyaccording to the contract rate. The estimated fair value measurement is disclosed as follows:
December 31, 2011
Carrying amount Fair value Level 1 Level 2
Long-term debt (less interests)(*) . . . . . . (22,700) (24,312) (18,181) (6,131)Perpetual Notes(**) . . . . . . . . . . . . . . (80) (80) – (80)
December 31, 2010
Carrying amount Fair value Level 1 Level 2
Time deposits . . . . . . . . . . . . . . . . . . 1,793 1,793 – 1,793Long-term debt (less interests)(*) . . . . . . (24,071) (25,264) (19,730) (5,534)
(*) Less accrued charges of US$333 and US$343 as of December 31, 2011 and December 31, 2010, respectively.(**) Classified on ‘‘LT Loans and related parties’’.
F-52
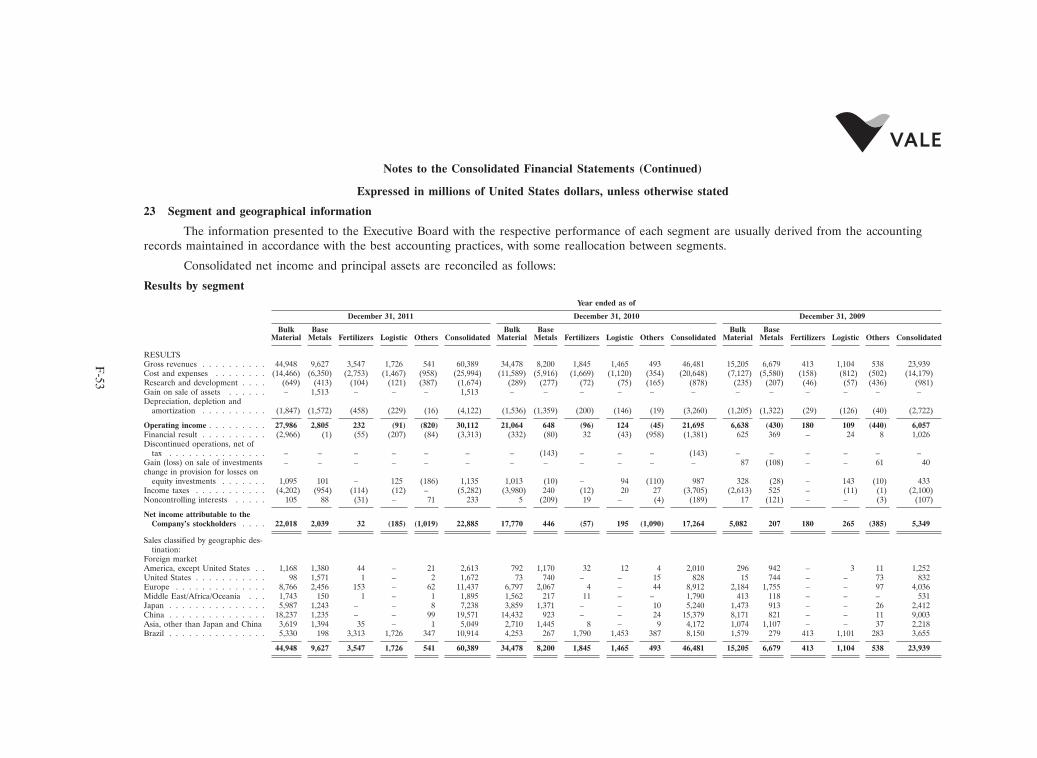
14NOV201111161635
F-53
Notes to the Consolidated Financial Statements (Continued)
Expressed in millions of United States dollars, unless otherwise stated
23 Segment and geographical information
The information presented to the Executive Board with the respective performance of each segment are usually derived from the accountingrecords maintained in accordance with the best accounting practices, with some reallocation between segments.
Consolidated net income and principal assets are reconciled as follows:
Results by segmentYear ended as of
December 31, 2011 December 31, 2010 December 31, 2009
Bulk Base Bulk Base Bulk BaseMaterial Metals Fertilizers Logistic Others Consolidated Material Metals Fertilizers Logistic Others Consolidated Material Metals Fertilizers Logistic Others Consolidated
RESULTSGross revenues . . . . . . . . . . 44,948 9,627 3,547 1,726 541 60,389 34,478 8,200 1,845 1,465 493 46,481 15,205 6,679 413 1,104 538 23,939Cost and expenses . . . . . . . . (14,466) (6,350) (2,753) (1,467) (958) (25,994) (11,589) (5,916) (1,669) (1,120) (354) (20,648) (7,127) (5,580) (158) (812) (502) (14,179)Research and development . . . . (649) (413) (104) (121) (387) (1,674) (289) (277) (72) (75) (165) (878) (235) (207) (46) (57) (436) (981)Gain on sale of assets . . . . . . – 1,513 – – – 1,513 – – – – – – – – – – – –Depreciation, depletion and
amortization . . . . . . . . . . (1,847) (1,572) (458) (229) (16) (4,122) (1,536) (1,359) (200) (146) (19) (3,260) (1,205) (1,322) (29) (126) (40) (2,722)
Operating income . . . . . . . . . 27,986 2,805 232 (91) (820) 30,112 21,064 648 (96) 124 (45) 21,695 6,638 (430) 180 109 (440) 6,057Financial result . . . . . . . . . . (2,966) (1) (55) (207) (84) (3,313) (332) (80) 32 (43) (958) (1,381) 625 369 – 24 8 1,026Discontinued operations, net of
tax . . . . . . . . . . . . . . . – – – – – – – (143) – – – (143) – – – – – –Gain (loss) on sale of investments – – – – – – – – – – – – 87 (108) – – 61 40change in provision for losses on
equity investments . . . . . . . 1,095 101 – 125 (186) 1,135 1,013 (10) – 94 (110) 987 328 (28) – 143 (10) 433Income taxes . . . . . . . . . . . (4,202) (954) (114) (12) – (5,282) (3,980) 240 (12) 20 27 (3,705) (2,613) 525 – (11) (1) (2,100)Noncontrolling interests . . . . . 105 88 (31) – 71 233 5 (209) 19 – (4) (189) 17 (121) – – (3) (107)
Net income attributable to theCompany’s stockholders . . . . 22,018 2,039 32 (185) (1,019) 22,885 17,770 446 (57) 195 (1,090) 17,264 5,082 207 180 265 (385) 5,349
Sales classified by geographic des-tination:
Foreign marketAmerica, except United States . . 1,168 1,380 44 – 21 2,613 792 1,170 32 12 4 2,010 296 942 – 3 11 1,252United States . . . . . . . . . . . 98 1,571 1 – 2 1,672 73 740 – – 15 828 15 744 – – 73 832Europe . . . . . . . . . . . . . . 8,766 2,456 153 – 62 11,437 6,797 2,067 4 – 44 8,912 2,184 1,755 – – 97 4,036Middle East/Africa/Oceania . . . 1,743 150 1 – 1 1,895 1,562 217 11 – – 1,790 413 118 – – – 531Japan . . . . . . . . . . . . . . . 5,987 1,243 – – 8 7,238 3,859 1,371 – – 10 5,240 1,473 913 – – 26 2,412China . . . . . . . . . . . . . . . 18,237 1,235 – – 99 19,571 14,432 923 – – 24 15,379 8,171 821 – – 11 9,003Asia, other than Japan and China 3,619 1,394 35 – 1 5,049 2,710 1,445 8 – 9 4,172 1,074 1,107 – – 37 2,218Brazil . . . . . . . . . . . . . . . 5,330 198 3,313 1,726 347 10,914 4,253 267 1,790 1,453 387 8,150 1,579 279 413 1,101 283 3,655
44,948 9,627 3,547 1,726 541 60,389 34,478 8,200 1,845 1,465 493 46,481 15,205 6,679 413 1,104 538 23,939

14NOV201111161635
F-54
Notes to the Consolidated Financial Statements (Continued)
Expressed in millions of United States dollars, unless otherwise stated
23 Segment and geographical information (Continued)
Results by segment
Year ended as of December 31, 2011
Depreciation, Additions toValue Net Cost and Operating depletion and Operating Property, plant property, plant
Revenue added tax revenues expenses profit amortization income and equipment and equipment Investments
Bulk MaterialIron ore . . . . . . . . . . . . . . . . . . . . . . 35,008 (494) 34,514 (9,066) 25,448 (1,418) 24,030 32,944 7,409 112Pellets . . . . . . . . . . . . . . . . . . . . . . . 8,150 (266) 7,884 (3,261) 4,623 (196) 4,427 2,074 624 997Manganese . . . . . . . . . . . . . . . . . . . . . 171 (8) 163 (187) (24) (15) (39) 81 137 —Ferroalloys . . . . . . . . . . . . . . . . . . . . . 561 (48) 513 (407) 106 (54) 52 252 40 —Coal . . . . . . . . . . . . . . . . . . . . . . . . 1,058 — 1,058 (1,378) (320) (164) (484) 4,081 1,141 239
44,948 (816) 44,132 (14,299) 29,833 (1,847) 27,986 39,432 9,351 1,348
Base MetalsNickel and other products (*) . . . . . . . . . . 8,118 — 8,118 (5,558) 2,560 (1,487) 1,073 29,097 2,637 11Copper (**) . . . . . . . . . . . . . . . . . . . . 1,126 (23) 1,103 (873) 230 (84) 146 4,178 1,226 234Aluminum products . . . . . . . . . . . . . . . 383 (5) 378 (304) 74 (1) 73 — 16 3,371
9,627 (28) 9,599 (6,735) 2,864 (1,572) 1,292 33,275 3,879 3,616
FertilizersPotash . . . . . . . . . . . . . . . . . . . . . . . 287 (14) 273 (315) (42) (45) (87) 2,137 532 —Phosphates . . . . . . . . . . . . . . . . . . . . . 2,395 (95) 2,300 (1,760) 540 (297) 243 6,430 316 —Nitrogen . . . . . . . . . . . . . . . . . . . . . . 782 (103) 679 (557) 122 (116) 6 896 180 —Others fertilizers products . . . . . . . . . . . . 83 (13) 70 — 70 — 70 364 — —
3,547 (225) 3,322 (2,632) 690 (458) 232 9,827 1,028 —
LogisticsRailroads . . . . . . . . . . . . . . . . . . . . . . 1,265 (222) 1,043 (1,003) 40 (179) (139) 1,307 213 551Ports . . . . . . . . . . . . . . . . . . . . . . . . 461 (48) 413 (315) 98 (50) 48 576 347 —Ships . . . . . . . . . . . . . . . . . . . . . . . . — — — — — — — 2,485 308 114
1,726 (270) 1,456 (1,318) 138 (229) (91) 4,368 868 665Others . . . . . . . . . . . . . . . . . . . . . . . . 541 (60) 481 (1,285) (804) (16) (820) 1,993 949 2,464Gain on sale of assets . . . . . . . . . . . . . . . — — — 1,513 1,513 — 1,513 — — —
60,389 (1,399) 58,990 (24,756) 34,234 (4,122) 30,112 88,895 16,075 8,093
(*) Includes nickel co-products and by-products (copper, precious metals, cobalt and others).(**) Includes copper concentrate.

14NOV201111161635
F-55
Notes to the Consolidated Financial Statements (Continued)
Expressed in millions of United States dollars, unless otherwise stated
23 Segment and geographical information (Continued)
Results by segment
Year ended as of December 31, 2010
Cost Depreciation, Additions toValue Net and Operating depletion and Operating Property, plant property, plant
Revenue added tax revenues expenses profit amortization income and equipment and equipment Investments
Bulk MaterialIron ore . . . . . . . . . . . . . . . . . . . . . . 26,384 (366) 26,018 (7,364) 18,654 (1,307) 17,347 30,412 4,015 107Pellets . . . . . . . . . . . . . . . . . . . . . . . 6,402 (266) 6,136 (2,515) 3,621 (110) 3,511 1,445 353 1,058Manganese . . . . . . . . . . . . . . . . . . . . . 258 (7) 251 (136) 115 (10) 105 24 2 —Ferroalloys . . . . . . . . . . . . . . . . . . . . . 664 (62) 602 (306) 296 (26) 270 292 26 —Coal . . . . . . . . . . . . . . . . . . . . . . . . 770 — 770 (856) (86) (83) (169) 3,020 499 223
34,478 (701) 33,777 (11,177) 22,600 (1,536) 21,064 35,193 4,895 1,388
Base MetalsNickel and other products (*) . . . . . . . . . . 4,712 — 4,712 (3,402) 1,310 (1,145) 165 28,623 1,880 23Copper (**) . . . . . . . . . . . . . . . . . . . . 934 (29) 905 (621) 284 (87) 197 3,579 1,072 90Aluminum products . . . . . . . . . . . . . . . 2,554 (32) 2,522 (2,109) 413 (127) 286 395 342 152
8,200 (61) 8,139 (6,132) 2,007 (1,359) 648 32,597 3,294 265
FertilizersPotash . . . . . . . . . . . . . . . . . . . . . . . 280 (11) 269 (269) — (29) (29) 474 355 —Phosphates . . . . . . . . . . . . . . . . . . . . . 1,211 (47) 1,164 (1,070) 94 (121) (27) 7,560 438 —Nitrogen . . . . . . . . . . . . . . . . . . . . . . 337 (43) 294 (285) 9 (50) (41) 809 47 —Others fertilizers products . . . . . . . . . . . . 17 (5) 12 (11) 1 — 1 146 3 —
1,845 (106) 1,739 (1,635) 104 (200) (96) 8,989 843 —
LogisticsRailroads . . . . . . . . . . . . . . . . . . . . . . 1,107 (183) 924 (716) 208 (123) 85 1,278 160 511Ports . . . . . . . . . . . . . . . . . . . . . . . . 353 (47) 306 (236) 70 (23) 47 297 36 —Ships . . . . . . . . . . . . . . . . . . . . . . . . 5 — 5 (13) (8) — (8) 747 747 135
1,465 (230) 1,235 (965) 270 (146) 124 2,322 943 646Others . . . . . . . . . . . . . . . . . . . . . . . . 493 (90) 403 (429) (26) (19) (45) 3,995 2,672 2,198
46,481 (1,188) 45,293 (20,338) 24,955 (3,260) 21,695 83,096 12,647 4,497
(*) Includes nickel co-products and by-products (copper, precious metals, cobalt and others).
(**) Includes copper concentrate.

14NOV201111161635
F-56
Notes to the Consolidated Financial Statements (Continued)
Expressed in millions of United States dollars, unless otherwise stated
23 Segment and geographical information (Continued)
Results by segment
Year ended as of December 31, 2009
Depreciation, Additions toValue Net Cost and Operating depletion and Operating Property, plant property, plant
Revenue added tax revenues expenses profit amortization income and equipment and equipment Investments
Bulk MaterialIron ore . . . . . . . . . . . . . . . . . . . . . . 12,831 (172) 12,659 (4,956) 7,703 (1,044) 6,659 21,736 3,361 107Pellets . . . . . . . . . . . . . . . . . . . . . . . 1,352 (92) 1,260 (1,165) 95 (76) 19 947 84 1,050Manganese . . . . . . . . . . . . . . . . . . . . . 145 (2) 143 (103) 40 (9) 31 25 4 —Ferroalloys . . . . . . . . . . . . . . . . . . . . . 372 (45) 327 (278) 49 (15) 34 261 112 —Coal . . . . . . . . . . . . . . . . . . . . . . . . 505 — 505 (549) (44) (61) (105) 1,723 362 243
15,205 (311) 14,894 (7,051) 7,843 (1,205) 6,638 24,692 3,923 1,400
Base MetalsNickel and other products (*) . . . . . . . . . . 3,947 — 3,947 (3,292) 655 (1,016) (361) 23,967 1,464 30Copper (**) . . . . . . . . . . . . . . . . . . . . 682 (19) 663 (470) 193 (71) 122 4,127 558 80Aluminum products . . . . . . . . . . . . . . . 2,050 (37) 2,013 (1,969) 44 (235) (191) 4,663 143 143
6,679 (56) 6,623 (5,731) 892 (1,322) (430) 32,757 2,165 253
FertilizersPotash . . . . . . . . . . . . . . . . . . . . . . . 413 (17) 396 (187) 209 (29) 180 159 — —
413 (17) 396 (187) 209 (29) 180 159 — —
LogisticsRailroads . . . . . . . . . . . . . . . . . . . . . . 838 (137) 701 (524) 177 (97) 80 1,045 96 468Ports . . . . . . . . . . . . . . . . . . . . . . . . 264 (38) 226 (161) 65 (29) 36 1,441 106 —Ships . . . . . . . . . . . . . . . . . . . . . . . . 2 — 2 (9) (7) — (7) 1,104 738 125
1,104 (175) 929 (694) 235 (126) 109 3,590 940 593Others . . . . . . . . . . . . . . . . . . . . . . . . 538 (69) 469 (869) (400) (40) (440) 6,439 1,068 2,339
23,939 (628) 23,311 (14,532) 8,779 (2,722) 6,057 67,637 8,096 4,585

14NOV201111161635Notes to the Consolidated Financial Statements (Continued)
Expressed in millions of United States dollars, unless otherwise stated
24 Related party transactions
Balances from transactions with major related parties are as follows:
December 31, 2011 December 31, 2010
Assets Liabilities Assets Liabilities
Affiliated Companies and Joint VenturesCompanhia Hispano-Brasileira de Pelotizacao—HISPANOBRAS . . . . . . . . . . . . . 177 162 264 300Companhia Italo-Brasileira de Pelotizacao—ITABRASCO . . . . . . . . . . . . . . . . . — — — 10Companhia Nipo-Brasileira de Pelotizacao—NIBRASCO . . . . . . . . . . . . . . . . . 1 13 — 23Companhia Coreano-Brasileira de Pelotizacao—KOBRASCO . . . . . . . . . . . . . . . — 5 — 4Baovale Mineracao SA . . . . . . . . . . . . . . . . . . . . . . . . . . . . . . . . . . . . . 8 20 3 30Minas da Serra Geral SA—MSG . . . . . . . . . . . . . . . . . . . . . . . . . . . . . . . — 9 — 9MRS Logıstica SA . . . . . . . . . . . . . . . . . . . . . . . . . . . . . . . . . . . . . . . . 50 20 1 15Mineracao Rio Norte SA . . . . . . . . . . . . . . . . . . . . . . . . . . . . . . . . . . . . — — — 25Norsk Hydro ASA . . . . . . . . . . . . . . . . . . . . . . . . . . . . . . . . . . . . . . . . 489 80 2 —Samarco Mineracao SA . . . . . . . . . . . . . . . . . . . . . . . . . . . . . . . . . . . . . 47 — 61 —Mitsui & CO, LTD . . . . . . . . . . . . . . . . . . . . . . . . . . . . . . . . . . . . . . . — 37 — 61Others . . . . . . . . . . . . . . . . . . . . . . . . . . . . . . . . . . . . . . . . . . . . . . . 107 49 229 84
879 395 560 561
Current . . . . . . . . . . . . . . . . . . . . . . . . . . . . . . . . . . . . . . . . . . . . . . 370 304 531 559Long-term . . . . . . . . . . . . . . . . . . . . . . . . . . . . . . . . . . . . . . . . . . . . 509 91 29 2
Total . . . . . . . . . . . . . . . . . . . . . . . . . . . . . . . . . . . . . . . . . . . . . . . . 879 395 560 561
These balances are included in the following balance sheet classifications:
December 31, 2011 December 31, 2010
Assets Liabilities Assets Liabilities
Current assetsAccounts receivable . . . . . . . . . . . . . . . . . . . . . . . . . . . . . . . . . . . . . . 288 — 435 —Loans and advances to related parties . . . . . . . . . . . . . . . . . . . . . . . . . . . 82 — 96 —
Non-current assetsLoans and advances to related parties . . . . . . . . . . . . . . . . . . . . . . . . . . . 509 — 29 —
Current liabilitiesSuppliers . . . . . . . . . . . . . . . . . . . . . . . . . . . . . . . . . . . . . . . . . . . . — 280 — 538Loans from related parties . . . . . . . . . . . . . . . . . . . . . . . . . . . . . . . . . . — 24 — 21
Non-current liabilitiesLong-term debt . . . . . . . . . . . . . . . . . . . . . . . . . . . . . . . . . . . . . . . . — 91 — 2
879 395 560 561
F-57

14NOV201111161635Notes to the Consolidated Financial Statements (Continued)
Expressed in millions of United States dollars, unless otherwise stated
24 Related party transactions (Continued)
Income and expenses from the principal transactions and financial operations carried out with majorrelated parties are as follows:
December 31, 2011 December 31, 2010 December 31, 2009
Income Expense Income Expense Income Expense
Affiliated Companies and Joint VenturesCompanhia Nipo-Brasileira de Pelotizacao—NIBRASCO . — 151 — 149 29 47Samarco Mineracao SA . . . . . . . . . . . . . . . . . . . . . 511 — 448 — 97 —Companhia Italo-Brasileira de Pelotizacao—ITABRASCO . — 150 — 50 — 18Companhia Hispano-Brasileira de Pelotizacao—
HISPANOBRAS . . . . . . . . . . . . . . . . . . . . . . . . 729 521 462 513 85 75Companhia Coreano-Brasileira de Pelotizacao—
KOBRASCO . . . . . . . . . . . . . . . . . . . . . . . . . . — 98 — 117 — 29Usinas Siderurgicas de Minas Gerais SA—USIMINAS(*) . — — — — 46 —Mineracao Rio Norte SA . . . . . . . . . . . . . . . . . . . . — — — 156 — 210MRS Logıstica SA . . . . . . . . . . . . . . . . . . . . . . . . 16 759 16 561 12 484Others . . . . . . . . . . . . . . . . . . . . . . . . . . . . . . . 103 53 17 18 19 29
1,359 1,732 943 1,564 288 892
(*) Sold in April 2009.
These amounts are included in the following statement of income line items:
December 31, 2011 December 31, 2010 December 31, 2009
Income Expense Income Expense Income Expense
Sales/Cost of iron ore and pellets . . . . . . . . . . . . . . . . . 1,337 952 910 785 233 193Revenues/expense from logistic services . . . . . . . . . . . . . 16 759 23 603 26 457Sales/Cost of aluminum products . . . . . . . . . . . . . . . . . — 18 — 156 — 210Financial income/expenses . . . . . . . . . . . . . . . . . . . . . 6 3 10 20 29 32
1,359 1,732 943 1,564 288 892
Additionally we have loans payable to Banco Nacional de Desenvolvimento Social and BNDESParticipacoes S.A in the amounts of US$ 2,954 and US$ 902 respectively, accruing interest at market rates,which fall due through 2029. These operations generated interest expenses of US$ 138 and US$ 57. We alsomaintain cash equivalent balances with Banco Bradesco S.A. in the amount of US$ 16 in December 31, 2011.The effect of these operations in results was US$ 73.
25 Derivative financial instruments
Risk management policy
Vale considers that the effective management of risk is a key objective to support its growth strategy,strategic planning and financial flexibility. Therefore Vale has developed its risk management strategy in orderto provide an integrated approach of the risks the Company is exposed to. To do that, Vale evaluates not onlythe impact of market risk factors in the business results (market risk), but also the risk arising from thirdparty obligations with Vale (credit risk), those inherent to inadequate or failed internal processes, people,systems or external events (operational risk), those arising from liquidity risk, among others.
F-58

14NOV201111161635Notes to the Consolidated Financial Statements (Continued)
Expressed in millions of United States dollars, unless otherwise stated
25 Derivative financial instruments (Continued)
The Board of Directors established the corporate risk management policy in order to support thegrowth strategy, strategic planning and business continuity of the Company, strengthening its capital structureand asset management, ensure flexibility and consistency on the financial management and strengthencorporate governance practices.
The corporate risk management policy determines that Vale measures and monitors its corporate riskon a consolidated approach in order to guarantee that the overall risk level of the Company remains alignedwith the guidelines defined by the Board of Directors and the Executive Board.
The Executive Risk Management Committee, created by the Board of Directors, is responsible forsupporting the Executive Board in the risk analysis and for issuing opinion regarding the Company’s riskmanagement. It is also responsible for the supervision and revision of the principles and instruments ofcorporate risk management.
The Executive Board is responsible for the approval of the policy deployment into norms, rules andresponsibilities and for reporting to the Board of Directors about such procedures.
The risk management norms and instructions complement the corporate risk management policy anddefine practices, processes, controls, roles and responsibilities in the Company regarding risk management.
The Company may, when necessary, allocate specific risk limits to management activities that needthem, including but not limited to, market risk limit and corporate and sovereign credit limit, in accordancewith the acceptable corporate risk limit.
Market Risk Management
Vale is exposed to the behavior of various market risk factors that can impact its cash flow. Theassessment of this potential impact arising from the volatility of risk factors and their correlations isperformed periodically to support the decision making process and the growth strategy of the Company,ensure its financial flexibility and monitor the volatility of future cash flows.
When necessary, market risk mitigation strategies are evaluated and implemented in line with theseobjectives. Some of these strategies may incorporate financial instruments, including derivatives. Theportfolios of the financial instruments are monitored on a monthly basis, enabling surveillance of financialresults and then impact on cash flow, and ensuring adherence to the objectives of the strategies proposed.
Considering the nature of Vale’s business and operations, the main market risk factors which theCompany is exposed to are:
• Interest rates;
• Foreign exchange;
• Product prices and input costs
F-59

14NOV201111161635Notes to the Consolidated Financial Statements (Continued)
Expressed in millions of United States dollars, unless otherwise stated
25 Derivative financial instruments (Continued)
Foreign exchange rate and interest rate risk
Vale’s cash flows are exposed to volatility of several currencies. While most of the product prices areindexed to US dollars, most of the costs, disbursements and investments are indexed to currencies other thanthe US dollar, namely the Brazilian Real and the Canadian dollar.
Derivative instruments may be used to reduce Vale’s potential cash flow volatility arising from itscurrency mismatch.
For hedges of revenue, costs, expenses and investment cash flows, the main risk mitigation strategiesused are currency forward transactions and swaps.
The swap transactions used to convert debt linked to Brazilian Real into US dollar have similar—orsometimes shorter—settlement dates than the final maturity of the debt instruments. Their notional amountsare similar to the principal and interest payments, subject to liquidity market conditions.
The swaps with shorter settlement dates are renegotiated through time so that their final maturitymatches—or becomes closer—to the debts‘ final maturity. At each settlement date, the results of the swaptransactions partially offset the impact of the foreign exchange rate in Vale’s obligations, contributing tostabilize the cash disbursements in US dollar.
In the event of an appreciation (depreciation) of the Brazilian Real against the US dollar, thenegative (positive) impact on Brazilian Real denominated debt obligations (interest and/or principal payment)measured in US dollars will be partially offset by a positive (negative) effect from a swap transaction,regardless of the US dollar/Brazilian Real exchange rate in the payment date. The same rationale applies todebt denominated in other currencies and their respective swaps.
Vale is also exposed to interest rate risks on loans and financings. Its floating rate debt consists mainlyof loans including export pre-payments, commercial banks and multilateral organizations loans. In general, theUS dollar floating rate debt is subject to changes in the LIBOR (London Interbank Offer Rate in US dollar).To mitigate the impact of the interest rate volatility on its cash flows, Vale considers the natural hedgesresulting from the correlation of commodities prices and US dollar floating rates. If such natural hedges arenot present, Vale may search for the same effect by using financial instruments.
Product price and Input Cost risk
Vale is also exposed to several market risks associated with commodities price volatilities. In line withthe risk management policy, risk mitigation strategies involving commodities can also be used to adjust its riskprofile and reduce the volatility of cash flow. In these cases, the mitigation strategies used are primarilyforward transactions, futures contracts or zero-cost collars.
Embedded derivatives
The cash flow of the Company is also exposed to various market risks associated with contracts thatcontain embedded derivatives or behave as derivatives. The derivatives may be embedded in, but are notlimited to, commercial contracts, purchase agreements, leases, bonds, insurance policies and loans.
F-60

14NOV201111161635Notes to the Consolidated Financial Statements (Continued)
Expressed in millions of United States dollars, unless otherwise stated
25 Derivative financial instruments (Continued)
Vale’s wholly-owned subsidiary Vale Canada Ltd has nickel concentrate and raw materials purchaseagreements, in which there are provisions based on the movement of nickel and copper prices. Theseprovisions are considered embedded derivatives.
Hedge Accounting
Under the Standard Accounting for Derivative Financial Instruments and Hedging Activities, allderivatives, whether designated in hedging relationships or not, are required to be recorded in the balancesheet at fair value and the gain or loss in fair value is included in the statement of income, unless if qualifiedas hedge accounting. A derivative must be designated in a hedging relationship in order to qualify for hedgeaccounting. These requirements include a determination of what portions of hedges are deemed to beeffective versus ineffective. In general, a hedging relationship is effective when a change in the fair value ofthe derivative is offset by an equal and opposite change in the fair value of the underlying hedged item. Inaccordance with these requirements, effectiveness tests are performed in order to assess effectiveness andquantify ineffectiveness for all designated hedges.
At December 31, 2011, Vale has outstanding positions designated as cash flow hedge. A cash flowhedge is a hedge of the exposure to variability in expected future cash flows that is attributable to a particularrisk, such as a forecasted purchase or sale. If a derivative is designated as cash flow hedge, the effectiveportion of the changes in the fair value of the derivative is recorded in other comprehensive income andrecognized in earnings when the hedged item affects earnings. However, the ineffective portion of changes inthe fair value of the derivatives designated as hedges is recognized in earnings. If a portion of a derivativecontract is excluded for purposes of effectiveness testing, the value of such excluded portion is included inearnings.
F-61

14NOV201111161635Notes to the Consolidated Financial Statements (Continued)
Expressed in millions of United States dollars, unless otherwise stated
25 Derivative financial instruments (Continued)
The assets and liabilities balances of derivatives measured at fair value and the effects of theirrecognition are shown in the following tables:
Assets Liabilities
December 31, 2011 December 31, 2010 December 31, 2011 December 31, 2010
Short-term Long-term Short-term Long-term Short-term Long-term Short-term Long-term
Derivatives not designatedas hedge
Foreign exchange andinterest rate risk
CDI & TJLP vs. USD fixedand floating rate swap . . . 410 60 – 300 49 590 – –
EURO floating rate vs.USD floating rate swap . . – – 1 – – – – –
USD floating rate vs. fixedUSD rate swap . . . . . . . – – – – – – 4 –
EuroBond Swap . . . . . . . – – – – 4 32 – 8Pre Dollar Swap . . . . . . . 19 – – 1 – 41 – –AUD floating rate vs. fixed
USD rate swap . . . . . . . – – 2 – – – – –Treasury future . . . . . . . . – – – – 5 – – –
429 60 3 301 58 663 4 8Commodities price riskNickelFixed price program . . . . . 1 – 13 – 1 – 12 –Purchase program . . . . . . – – – – – – 15 –Bunker Oil Hedge . . . . . . 4 – 16 – – – – –Coal . . . . . . . . . . . . . . – – – – – – 2 –Maritime Freight Hiring
Protection Program . . . . – – – – – – 2 –
5 – 29 – 1 – 31 –Embedded derivatives:Derivatives designated as
hedgeStrategic Nickel . . . . . . . . 161 – – – – – – 53Foreign exchange cash flow
hedge . . . . . . . . . . . . – – 20 – 14 – – –
161 – 20 – 14 – – 53
Total . . . . . . . . . . . . . . 595 60 52 301 73 663 35 61
F-62

14NOV201111161635Notes to the Consolidated Financial Statements (Continued)
Expressed in millions of United States dollars, unless otherwise stated
25 Derivative financial instruments (Continued)
Amount of gain or (loss)recognized as financial Financial settlement Amount of gain or (loss)
income (expense) (Inflows)/ Outflows recognized in OCI
Year ended as of Year ended as of Year ended as ofDecember 31, December 31, December 31,
2011 2010 2009 2011 2010 2009 2011 2010 2009
Derivatives not designated as hedgeForeign exchange and interest rate
riskCDI & TJLP vs. USD fixed and
floating rate swap . . . . . . . . . (92) 451 1,598 (337) (956) (243) – – –EURO floating rate vs. USD
floating rate swap . . . . . . . . . – (1) – – 1 (1) – – –USD floating rate vs. fixed USD
rate swap . . . . . . . . . . . . . . – (2) (2) 4 3 8 – – –EuroBond Swap . . . . . . . . . . . . (30) (5) – 1 (1) – – – –Pre Dollar Swap . . . . . . . . . . . . (23) 4 – (1) (2) – – – –Swap USD fixed rate vs. CDI . . . . 69 – – (68) – – – – –South African Rande Forward . . . . (8) – – 8 – – – – –AUD floating rate vs. fixed USD
rate swap . . . . . . . . . . . . . . – 3 14 (2) (9) (5) – – –Treasury Future . . . . . . . . . . . . (12) – – 6 – – – – –Swap Convertibles . . . . . . . . . . – 37 – – (37) – – – –
(96) 487 1,610 (389) (1,001) (241) – – –Commodities price riskNickel
Fixed price program . . . . . . . . 39 4 5 (41) (7) 79 – – –Strategic program . . . . . . . . . . . 15 (87) (95) – 105 73 – – –Copper . . . . . . . . . . . . . . . . . 1 – – – – – – – –Aluminum . . . . . . . . . . . . . . . – – – 7 16 – – – –Bunker Oil Hedge . . . . . . . . . . 37 4 50 (48) (34) (16) – – –Coal . . . . . . . . . . . . . . . . . . – (4) – 2 3 – – – –Maritime Freight Hiring Protection
Program . . . . . . . . . . . . . . . – (5) 66 2 (24) (37) – – –Natural gas . . . . . . . . . . . . . . . – – (4) – – 6 – – –
92 (88) 22 (78) 59 105 – – –Embedded derivatives:For nickel concentrate costumer
sales . . . . . . . . . . . . . . . . . – – (25) – – (14) – – –Customer raw material contracts . . – – (76) – – – – – –Energy—Aluminum options . . . . . (7) (51) – – – – – – –
(7) (51) (101) – – (14) – – –Derivatives designated as hedgeBunker Oil Hedge . . . . . . . . . . – – (16) – 47 4 – – –Aluminum . . . . . . . . . . . . . . . – – 13 – – – 4 31 (36)Strategic Nickel . . . . . . . . . . . . 49 (1) – (48) – – 211 (52) –Foreign exchange cash flow hedge . 37 284 – (50) (330) – (60) (5) 38
86 283 (3) (98) (283) 4 155 (26) 2
Total . . . . . . . . . . . . . . . . . . 75 631 1,528 (565) (1,225) (146) 155 (26) 2
F-63

14NOV201111161635Notes to the Consolidated Financial Statements (Continued)
Expressed in millions of United States dollars, unless otherwise stated
25 Derivative financial instruments (Continued)
Unrealized gains (losses) in the period are included in our income statement under the caption ofgains (losses) on derivatives, net.
Final maturity dates for the above instruments are as follows:
Interest rates/Currencies . . . . . . . . . . . . . . . . . . . . . . . . . . . . . . . . . . . . . . . . . . . . . . . . . . . December 2019
Bunker Oil . . . . . . . . . . . . . . . . . . . . . . . . . . . . . . . . . . . . . . . . . . . . . . . . . . . . . . . . . . . . December 2011
Nickel . . . . . . . . . . . . . . . . . . . . . . . . . . . . . . . . . . . . . . . . . . . . . . . . . . . . . . . . . . . . . . . December 2012
F-64