united states - s21.q4cdn.com · table of contents linkedin corporation form 10-q table of contents...
TRANSCRIPT

Table of Contents
UNITED STATES
SECURITIES AND EXCHANGE COMMISSIONWashington, D.C. 20549
FORM 10-Q (Mark One)
x QUARTERLY REPORT PURSUANT TO SECTION 13 OR 15(d) OF THE SECURITIES EXCHANGE ACT OF1934
For the quarterly period ended March 31, 2016
or
¨ TRANSITION REPORT PURSUANT TO SECTION 13 OR 15(d) OF THE SECURITIES EXCHANGE ACT OF1934
For the transition period from to
Commission File Number: 001-35168
LinkedIn Corporation(Exact name of registrant as specified in its charter)
Delaware 47-0912023(State or other jurisdiction ofincorporation or organization)
(I.R.S. EmployerIdentification No.)
2029 Stierlin CourtMountain View, CA 94043
(Address of principal executive offices and zip code)
(650) 687-3600(Registrant’s telephone number, including area code)
Indicate by checkmark whether the registrant (1) has filed all reports required to be filed by Section 13 or 15 (d) of the Securities Exchange Act
of 1934 during the preceding 12 months (or for such shorter period that the registrant was required to file such reports), and (2) has been subject tosuch filing requirements for the past 90 days. Yes T No ¨
Indicate by check mark whether the registrant has submitted electronically and posted on its corporate Website, if any, every Interactive DataFile required to be submitted and posted pursuant to Rule 405 of Regulation S-T (§232.405 of this chapter) during the preceding 12 months (or forsuch shorter period that the registrant was required to submit and post such files). Yes T No ¨
Indicate by check mark whether the registrant is a large accelerated filer, an accelerated filer, a non-accelerated filer, or a smaller reportingcompany. See definitions of “large accelerated filer,” “accelerated filer” and “smaller reporting company” in Rule 12b-2 of the Exchange Act.
Large accelerated filer T Accelerated filer ¨
Non-accelerated filer ¨ (Do not check if a smaller reporting company) Smaller reporting company ¨
Indicate by check mark whether the registrant is a shell company (as defined in Rule 12b-2 of the Exchange Act). Yes ¨ No x
As of April 21, 2016 , there were 117,984,839 shares of the Registrant’s Class A common stock outstanding and 15,559,383 shares of theRegistrant’s Class B common stock outstanding.

Table of Contents
LINKEDIN CORPORATIONFORM 10-Q
TABLE OF CONTENTS
Page No. PART I—FINANCIAL INFORMATION Item 1. Financial Statements (Unaudited) 3 Condensed Consolidated Balance Sheets as of March 31, 2016 and December 31, 2015 3
Condensed Consolidated Statements of Operations for the Three Months Ended March 31, 2016 andMarch 31, 2015 4
Condensed Consolidated Statements of Comprehensive Loss for the Three Months Ended March 31, 2016and March 31, 2015 5
Condensed Consolidated Statements of Cash Flows for the Three Months Ended March 31, 2016 andMarch 31, 2015 6
Notes to Condensed Consolidated Financial Statements 7Item 2. Management’s Discussion and Analysis of Financial Condition and Results of Operations 25Item 3. Quantitative and Qualitative Disclosures About Market Risk 40Item 4. Controls and Procedures 42 PART II—OTHER INFORMATION Item 1. Legal Proceedings 43Item 1A. Risk Factors 43Item 2. Unregistered Sales of Equity Securities and Use of Proceeds 64Item 6. Exhibits 64Signatures 65
2

Table of Contents
Part I. Financial Information
Item 1. Financial StatementsLINKEDIN CORPORATION
CONDENSED CONSOLIDATED BALANCE SHEETS(In thousands)
(Unaudited)
March 31,
2016 December 31,
2015ASSETS CURRENT ASSETS:
Cash and cash equivalents $ 759,451 $ 546,237Marketable securities 2,400,187 2,573,145Accounts receivable (net of allowance for doubtful accounts of $23,814 and $17,970 at March 31, 2016and December 31, 2015, respectively) 582,726 603,060Deferred commissions 80,783 87,706Prepaid expenses 76,414 62,992Other current assets 68,835 61,949
Total current assets 3,968,396 3,935,089Property and equipment, net 1,139,032 1,047,005Goodwill 1,597,268 1,507,093Intangible assets, net 334,048 373,087Other assets 170,623 148,925
TOTAL ASSETS $ 7,209,367 $ 7,011,199
LIABILITIES, REDEEMABLE NONCONTROLLING INTEREST, AND STOCKHOLDERS’ EQUITY CURRENT LIABILITIES:
Accounts payable $ 161,523 $ 162,176Accrued liabilities 257,371 316,792Deferred revenue 787,621 709,116
Total current liabilities 1,206,515 1,188,084CONVERTIBLE SENIOR NOTES, NET 1,138,264 1,126,534OTHER LONG-TERM LIABILITIES 225,023 201,128
Total liabilities 2,569,802 2,515,746COMMITMENTS AND CONTINGENCIES (Note 12) REDEEMABLE NONCONTROLLING INTEREST 27,321 26,810STOCKHOLDERS’ EQUITY (Note 13):
Class A and Class B common stock 13 13Additional paid-in capital 4,779,628 4,588,578Accumulated other comprehensive income 7,502 9,124Accumulated deficit (174,899) (129,072)
Total stockholders’ equity 4,612,244 4,468,643TOTAL LIABILITIES, REDEEMABLE NONCONTROLLING INTEREST, AND STOCKHOLDERS’ EQUITY $ 7,209,367 $ 7,011,199
See Notes to Condensed Consolidated Financial Statements
3

Table of Contents
LINKEDIN CORPORATIONCONDENSED CONSOLIDATED STATEMENTS OF OPERATIONS
(In thousands, except per share data)(Unaudited)
Three Months Ended March 31, 2016 2015Net revenue $ 860,650 $ 637,687Costs and expenses:
Cost of revenue (exclusive of depreciation and amortization shown separately below) 117,528 88,406Sales and marketing 301,786 229,636Product development 237,620 165,580General and administrative 127,650 97,313Depreciation and amortization 142,285 73,972
Total costs and expenses 926,869 654,907Loss from operations (66,219) (17,220)Other expense, net:
Interest income 4,973 1,985Interest expense (12,841) (12,597)Other, net (4,190) (4,035)
Other expense, net (12,058) (14,647)Loss before income taxes (78,277) (31,867)Provision (benefit) for income taxes (32,961) 10,572Net loss (45,316) (42,439)Accretion of redeemable noncontrolling interest (511) (109)Net loss attributable to common stockholders $ (45,827) $ (42,548)
Net loss per share attributable to common stockholders: Basic $ (0.35) $ (0.34)Diluted $ (0.35) $ (0.34)
Weighted-average shares used to compute net loss per share attributable to common stockholders: Basic 132,779 125,471
Diluted 132,779 125,471
See Notes to Condensed Consolidated Financial State ments
4

Table of Contents
LINKEDIN CORPORATIONCONDENSED CONSOLIDATED STATEMENTS OF COMPREHENSIVE LOSS
(In thousands)(Unaudited)
Three Months Ended March 31, 2016 2015Net loss $ (45,316) $ (42,439)Other comprehensive income (loss):
Change in unrealized net gain on investments, net of tax 4,432 403Change in unrealized gain (loss) on cash flow hedges, net of tax (5,989) 883Change in foreign currency translation adjustment (65) (3)
Total other comprehensive income (loss) (1,622) 1,283Comprehensive loss (46,938) (41,156)
Accretion of redeemable noncontrolling interest (511) (109)Comprehensive loss attributable to common stockholders $ (47,449) $ (41,265)
See Notes to Condensed Consolidated Financial Statements
5

Table of Contents
LINKEDIN CORPORATIONCONDENSED CONSOLIDATED STATEMENTS OF CASH FLOWS
(In thousands)(Unaudited)
Three Months Ended March 31,
2016 2015OPERATING ACTIVITIES:
Net loss $ (45,316) $ (42,439)Adjustments to reconcile net loss to net cash provided by operating activities:
Depreciation and amortization 142,285 73,972Provision for doubtful accounts and sales returns 7,746 1,795Amortization of investment premiums, net 4,160 5,514Amortization of debt discount and issuance costs 11,730 11,189Stock-based compensation 146,104 103,109Excess income tax benefit from stock-based compensation (1,698) (18,198)Changes in operating assets and liabilities, net of effects of acquisitions:
Accounts receivable 11,932 29,489Deferred commissions 8,844 7,067Prepaid expenses and other assets (29,495) (34,629)Accounts payable and other liabilities (45,086) (40,725)Income taxes, net (34,998) 5,629Deferred revenue 75,979 63,359
Net cash provided by operating activities 252,187 165,132
INVESTING ACTIVITIES: Purchases of property and equipment (177,480) (90,121)Purchases of investments (465,424) (454,281)Sales of investments 168,434 438,409Maturities of investments 470,456 482,840Payments for intangible assets and acquisitions, net of cash acquired (40,430) (4,161)Changes in deposits and restricted cash 3,025 (1,382)
Net cash provided by (used in) investing activities (41,419) 371,304
FINANCING ACTIVITIES: Proceeds from issuance of common stock from employee stock options 1,678 8,708Excess income tax benefit from stock-based compensation 1,698 18,198Repurchases of equity awards (3,251) —Other financing activities — (167)
Net cash provided by financing activities 125 26,739EFFECT OF EXCHANGE RATE CHANGES ON CASH AND CASH EQUIVALENTS 2,321 (6,775)CHANGE IN CASH AND CASH EQUIVALENTS 213,214 556,400CASH AND CASH EQUIVALENTS—Beginning of period 546,237 460,887
CASH AND CASH EQUIVALENTS—End of period $ 759,451 $ 1,017,287
SUPPLEMENTAL DISCLOSURES OF NONCASH INVESTING AND FINANCING ACTIVITIES: Purchases of property and equipment recorded in accounts payable and accrued liabilities $ 88,734 $ 24,880
Issuance of Class A common stock and equity awards for business combinations $ 56,517 $ —
See Notes to Condensed Consolidated Financial Statements
6
Table of Contents
LINKEDIN CORPORATION
NOTES TO CONDENSED CONSOLIDATED FINANCIAL STATEMENTS
(Unaudited) 1. Description of Business and Basis of Presentation
LinkedIn Corporation and its subsidiaries (the “Company”), a Delaware corporation, was incorporated on March 6, 2003 . The Companyoperates an online professional network on the Internet through which the Company’s members are able to create, manage and share theirprofessional identities, build and engage with their professional networks, access shared knowledge and insights, and find business opportunities,enabling them to be more productive and successful. The Company believes it is the most extensive, accurate, and accessible network focused onprofessionals. The Company also offers diverse products that can be used by customers to transform the way they hire, market, sell, and learn.
Basis of PresentationThe accompanying unaudited condensed consolidated financial statements have been prepared in accordance with generally accepted
accounting principles in the United States (“US GAAP”) and applicable rules and regulations of the Securities and Exchange Commission regardinginterim financial reporting. Certain information and note disclosures normally included in the financial statements prepared in accordance with USGAAP have been condensed or omitted pursuant to such rules and regulations. Therefore, these condensed consolidated financial statementsshould be read in conjunction with the consolidated financial statements and notes included in the Company’s Annual Report on Form 10-K for theyear ended December 31, 2015 , filed on February 12, 2016 .
The condensed consolidated balance sheet as of December 31, 2015 , included herein was derived from the audited financial statements as ofthat date, but does not include all disclosures including notes required by US GAAP on an annual reporting basis.
In the opinion of management, the accompanying unaudited condensed consolidated financial statements reflect all normal recurringadjustments necessary to present fairly the financial position, results of operations, comprehensive loss and cash flows for the interim periods, butare not necessarily indicative of the results of operations to be anticipated for the full year 2016 or any future period.
Principles of ConsolidationThe condensed consolidated financial statements include the Company, its wholly-owned subsidiaries, and variable interest entities in which
LinkedIn is the primary beneficiary in accordance with the consolidation accounting guidance. All intercompany balances and transactions havebeen eliminated.
Redeemable noncontrolling interest ("RNCI") is included in the condensed consolidated balance sheets. RNCI is considered to be temporaryequity and is therefore reported outside of permanent equity equal to its redemption value as of the balance sheet date.
Use of EstimatesThe preparation of the Company’s condensed consolidated financial statements in conformity with US GAAP requires management to make
estimates and assumptions that affect the reported amounts of assets and liabilities and disclosure of contingent assets and liabilities at the date ofthe condensed consolidated financial statements and the reported amounts of income and expenses during the reporting period. These estimatesare based on information available as of the date of the condensed consolidated financial statements; therefore, actual results could differ frommanagement’s estimates.
Recently Adopted Accounting GuidanceBusiness CombinationsIn September 2015, the Financial Accounting Standards Board ("FASB") issued new authoritative accounting guidance on simplifying the
accounting for measurement-period adjustments in business combinations, which requires that an acquirer recognize adjustments to provisionalamounts that are identified during the measurement period in the reporting period in which the adjustment amounts are determined. The effect onearnings for changes in depreciation or amortization, or other income effects (if any) as a result of the change to the provisional amounts,
7

Table of Contents
calculated as if the accounting had been completed as of the acquisition date, must be recorded in the reporting period in which the adjustmentamounts are determined rather than retrospectively. This standard became effective for the Company in the first quarter of 2016, and is applied on aprospective basis to adjustments to provisional amounts that occur after the effective date with no impact to its financial statements.
Recently Issued Accounting GuidanceStock CompensationIn March 2016, the FASB issued new authoritative accounting guidance on the accounting for certain aspects of share-based payments to
employees, including the accounting for income taxes, forfeitures, and statutory tax withholding requirements, as well as classification in thestatement of cash flows. The standard is effective for the Company in the first quarter of 2017 and will be applied using the modified retrospectiveapproach; however, early adoption is permitted. The Company is currently evaluating whether this standard will have a material impact on itsfinancial statements.
LeasesIn February 2016, the FASB issued new authoritative accounting guidance on leasing arrangements. The guidance outlines a comprehensive
model for entities to use in accounting for leases, and supersedes most current lease accounting guidance, including industry-specific guidance. Thecore principle of the new lease accounting model is that lessees are required, among other things, to recognize lease assets and lease liabilities onthe balance sheet for those leases classified as operating leases under previous authoritative guidance. The guidance also introduces newdisclosure requirements for leasing arrangements. The standard is effective for the Company in the first quarter of 2019; however, early adoption ispermitted. This standard is required to be applied using the modified retrospective approach. The Company is currently evaluating the impact of thisguidance on its financial statements and expects that most of its operating leases will be recognized in its condensed consolidated balance sheets.
Financial InstrumentsIn January 2016, the FASB issued new authoritative accounting guidance on the classification and measurement of financial instruments. The
requirement to disclose the methods and significant assumptions used to estimate fair value is removed. In addition, financial assets and financialliabilities are to be presented separately in the notes to the financial statements, grouped by measurement category and form of financial asset. Thisstandard will be effective for the Company in the first quarter of 2018; however, early adoption is permitted. The Company does not expect thisstandard to have a material impact on its financial statements.
Revenue RecognitionIn May 2014, the FASB issued new authoritative accounting guidance on revenue from contracts with customers. The guidance outlines a
single comprehensive model for entities to use in accounting for revenue arising from contracts with customers and supersedes most currentrevenue recognition guidance, including industry-specific guidance. The core principle of the revenue model is that "an entity recognizes revenue todepict the transfer of promised goods or services to customers in an amount that reflects the consideration to which the entity expects to be entitledin exchange for those goods or services." The guidance also requires significantly expanded disclosures about revenue recognition. In July 2015,the FASB voted to approve a one-year deferral of the effective date to December 15, 2017 for interim and annual reporting periods beginning afterthat date and permitted early adoption of the standard, but not before the original effective date of December 15, 2016. This standard will thereforebe effective for the Company in the first quarter of 2018 and will be applied using either the full or modified retrospective adoption methods. In March2016, the FASB issued implementation guidance that clarified the considerations in principal versus agent determination. The Company is currentlyevaluating whether this standard will have a material impact on its financial statements.
8

Table of Contents
2. Fair Value Measurements
The Company’s assets and liabilities that are measured at fair value on a recurring basis, by level, within the fair value hierarchy as of theperiods presented, are summarized as follows (in thousands):
Level 1 Level 2 Level 3 TotalMarch 31, 2016: Assets: Cash equivalents:
Money market funds $ 340,146 $ — $ — $ 340,146Commercial paper — 350 — 350US treasury securities 213,191 — — 213,191US agency securities — 35,900 — 35,900
Marketable securities: Commercial paper — 34,351 — 34,351US treasury securities 677,247 — — 677,247US agency securities — 560,434 — 560,434Corporate debt securities — 1,119,505 — 1,119,505Municipal securities — 8,650 — 8,650
Other current assets: Foreign currency derivative contracts — 9,483 — 9,483
Total assets $ 1,230,584 $ 1,768,673 $ — $ 2,999,257
Liabilities: Accrued liabilities:
Foreign currency derivative contracts $ — $ 8,152 $ — $ 8,152Other long-term liabilities
Other derivative — — 13,900 13,900Total liabilities $ — $ 8,152 $ 13,900 $ 22,052
9

Table of Contents
Level 1 Level 2 Level 3 TotalDecember 31, 2015: Assets: Cash equivalents:
Money market funds $ 276,898 $ — $ — $ 276,898Commercial paper — 12,049 — 12,049US treasury securities 25,000 — — 25,000US agency securities — 51,500 — 51,500
Marketable securities: Commercial paper — 55,374 — 55,374US treasury securities 874,029 — — 874,029US agency securities — 606,202 — 606,202Corporate debt securities — 1,026,898 — 1,026,898Municipal securities — 10,642 — 10,642
Other current assets: Foreign currency derivative contracts — 14,508 — 14,508
Total assets $ 1,175,927 $ 1,777,173 $ — $ 2,953,100
Liabilities: Accrued liabilities:
Foreign currency derivative contracts $ — $ 1,847 $ — $ 1,847Other long-term liabilities:
Other derivative — — 11,600 11,600Total liabilities $ — $ 1,847 $ 11,600 $ 13,447
The fair value of the Company's Level 1 financial instruments, which are traded in active markets, is based on quoted market prices for
identical instruments. The fair value of the Company's Level 2 fixed income securities is obtained from an independent pricing service, which mayuse quoted market prices for identical or comparable instruments or model driven valuations using observable market data or inputs corroborated byobservable market data. The Company's procedures include controls to ensure that appropriate fair values are recorded, including comparing thefair values obtained from the Company's pricing service against fair values obtained from another independent source. The fair value of theCompany's Level 2 foreign currency derivative contracts is obtained from pricing models that use observable market inputs.
The Company's Level 3 other derivative is related to the embedded features in the preferred stock of the Company's joint venture, which isexpected to be settled in cash. The fair value of this other derivative is categorized as Level 3 in the fair value hierarchy due to the use of significantunobservable inputs in the Black-Scholes option pricing model ("OPM") used in the valuation. The key significant unobservable inputs in the OPMare the enterprise value of the Company's joint venture, volatility, and expected term of when the embedded features will be exercised . Theenterprise value of the joint venture is estimated quarterly using a combination of market and income approach methodologies. The volatility isbased on historic volatilities of companies who have recently had initial public offerings. The expected term of when the embedded conversionfeature will be exercised was assumed to be 4.2 years , which is the earliest date that the embedded features could be exercised.
The actual and projected performance of the joint venture as well as the term of when the embedded features are exercised may driveunpredictable changes in the valuation that could materially impact the Company's financial results.
The following is a reconciliation of the Company's Level 3 other derivative for the periods presented (in thousands):
Level 3 other derivative — December 31, 2014 $ 2,800Fair value adjustments (1) —
Level 3 other derivative — March 31, 2015 $ 2,800
10

Table of Contents
Level 3 other derivative — December 31, 2015 $ 11,600Fair value adjustments (1) 2,300
Level 3 other derivative — March 31, 2016 $ 13,900____________(1) Changes in the fair value are recorded in Other expense, net in the condensed consolidated statements of operations.
See Note 9, Convertible Senior Notes , for the carrying amount and estimated fair value of the Company's convertible senior notes, which arenot recorded at fair value as of March 31, 2016 .
3. AcquisitionConnectifierOn February 19, 2016 LinkedIn completed its acquisition of Connectifier, Inc. ("Connectifier") for a total purchase price of $105.5 million , which
consisted of $49.0 million in cash and 485,166 shares of LinkedIn Class A common stock. The Company also issued restricted stock and equityawards related to assumed Connectifier equity awards, of which the earned portion is included in the purchase price. The acquisition has beenaccounted for as a business combination under the acquisition method and, accordingly, the total purchase price is allocated to the tangible andintangible assets acquired and the liabilities assumed based on their respective fair values on the acquisition date. The results of operations of theacquisition have been included in the condensed consolidated financial statements from the acquisition date. The following table presents thepreliminary purchase price allocations recorded in the Company's condensed consolidated balance sheet as of the acquisition date (in thousands):
Net tangible assets $ 7,066Goodwill (1) 90,152Intangible assets (2) 8,300
Total purchase price (3) $ 105,518 _______________________(1) The goodwill represents the excess value of the purchase price over both tangible and intangible assets acquired. The goodwill in this
transaction is primarily attributable to expected operational synergies, the assembled workforce, and the future development initiatives ofthe assembled workforce. None of the goodwill is expected to be deductible for tax purposes.
(2) Identifiable definite-lived intangible assets were comprised of developed technology and customer relationships of $7.9 million and $0.4million , respectively, with an estimated useful life of 2.0 years and 1.0 year , respectively, which will be amortized on a straight-line basisover the estimated useful lives.
(3) Subject to adjustment based on (i) purchase price adjustment provisions contained in the acquisition agreements and (ii) indemnificationobligations of the acquired company stockholders.
11

4. Cash and InvestmentsThe following table presents cash, cash equivalents, and available-for-sale marketable securities for the periods presented (in thousands):
Amortized
Cost
GrossUnrealized
Gains
GrossUnrealized
Losses
EstimatedFair Market
ValueMarch 31, 2016:
Cash $ 169,864 $ — $ — $ 169,864Cash equivalents:
Money market funds 340,146 — — 340,146Commercial paper 350 — — 350US treasury securities 213,186 7 (2) 213,191US agency securities 35,900 — — 35,900
Marketable securities: Commercial paper 34,331 27 (7) 34,351US treasury securities 677,124 216 (93) 677,247US agency securities 560,358 155 (79) 560,434Corporate debt securities 1,116,990 2,894 (379) 1,119,505Municipal securities 8,636 14 — 8,650
Total cash, cash equivalents, and marketablesecurities $ 3,156,885 $ 3,313 $ (560) $ 3,159,638
December 31, 2015: Cash $ 180,790 $ — $ — $ 180,790Cash equivalents:
Money market funds 276,898 — — 276,898Commercial paper 12,048 1 — 12,049US treasury securities 24,999 1 — 25,000US agency securities 51,500 — — 51,500
Marketable securities: Commercial paper 55,350 47 (23) 55,374US treasury securities 874,968 20 (959) 874,029US agency securities 606,924 17 (739) 606,202Corporate debt securities 1,029,463 96 (2,661) 1,026,898Municipal securities 10,636 6 — 10,642
Total cash, cash equivalents, and marketablesecurities $ 3,123,576 $ 188 $ (4,382) $ 3,119,382
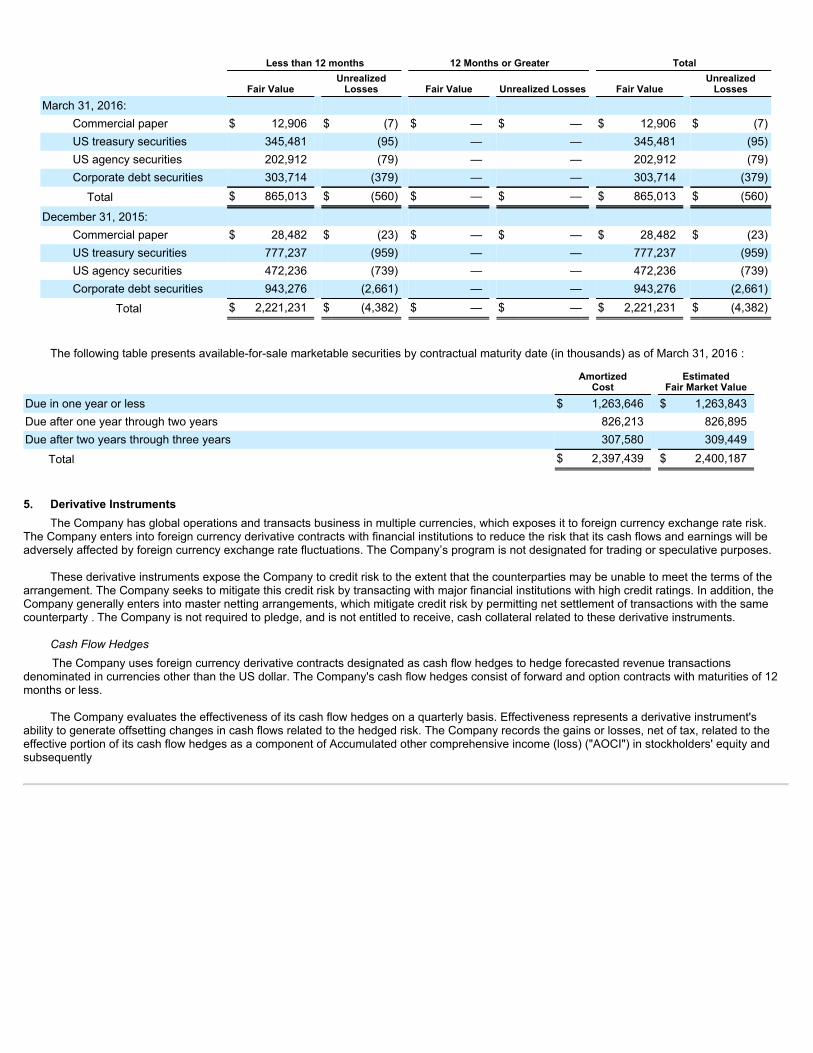
The following table presents unrealized losses on investments by investment category and length of time the investment has been in acontinuous unrealized loss position as of the periods presented (in thousands):
Less than 12 months 12 Months or Greater Total
Fair Value Unrealized
Losses Fair Value Unrealized Losses Fair Value Unrealized
LossesMarch 31, 2016:
Commercial paper $ 12,906 $ (7) $ — $ — $ 12,906 $ (7)US treasury securities 345,481 (95) — — 345,481 (95)US agency securities 202,912 (79) — — 202,912 (79)Corporate debt securities 303,714 (379) — — 303,714 (379)
Total $ 865,013 $ (560) $ — $ — $ 865,013 $ (560)
December 31, 2015: Commercial paper $ 28,482 $ (23) $ — $ — $ 28,482 $ (23)US treasury securities 777,237 (959) — — 777,237 (959)US agency securities 472,236 (739) — — 472,236 (739)Corporate debt securities 943,276 (2,661) — — 943,276 (2,661)
Total $ 2,221,231 $ (4,382) $ — $ — $ 2,221,231 $ (4,382)
The following table presents available-for-sale marketable securities by contractual maturity date (in thousands) as of March 31, 2016 :
Amortized
Cost Estimated
Fair Market ValueDue in one year or less $ 1,263,646 $ 1,263,843Due after one year through two years 826,213 826,895Due after two years through three years 307,580 309,449
Total $ 2,397,439 $ 2,400,187
5. Derivative InstrumentsThe Company has global operations and transacts business in multiple currencies, which exposes it to foreign currency exchange rate risk.
The Company enters into foreign currency derivative contracts with financial institutions to reduce the risk that its cash flows and earnings will beadversely affected by foreign currency exchange rate fluctuations. The Company’s program is not designated for trading or speculative purposes.
These derivative instruments expose the Company to credit risk to the extent that the counterparties may be unable to meet the terms of thearrangement. The Company seeks to mitigate this credit risk by transacting with major financial institutions with high credit ratings. In addition, theCompany generally enters into master netting arrangements, which mitigate credit risk by permitting net settlement of transactions with the samecounterparty . The Company is not required to pledge, and is not entitled to receive, cash collateral related to these derivative instruments.
Cash Flow HedgesThe Company uses foreign currency derivative contracts designated as cash flow hedges to hedge forecasted revenue transactions
denominated in currencies other than the US dollar. The Company's cash flow hedges consist of forward and option contracts with maturities of 12months or less.
The Company evaluates the effectiveness of its cash flow hedges on a quarterly basis. Effectiveness represents a derivative instrument'sability to generate offsetting changes in cash flows related to the hedged risk. The Company records the gains or losses, net of tax, related to theeffective portion of its cash flow hedges as a component of Accumulated other comprehensive income (loss) ("AOCI") in stockholders' equity andsubsequently

reclassifies the gains or losses into revenue when the underlying hedged revenue is recognized. The Company records the gains or losses relatedto the ineffective portion of the cash flow hedges, if any, immediately in Other income (expense), net. The change in time value related to theCompany's cash flow hedges is excluded from the assessment of hedge effectiveness and is recorded immediately in Other income (expense), net.If the hedged transaction becomes probable of not occurring, the corresponding amounts in AOCI would immediately be reclassified asineffectiveness to Other income (expense), net. Cash flows related to the Company's cash flow hedging program are recognized as cash flows fromoperating activities in its statements of cash flows.
As of March 31, 2016 and December 31, 2015 , the Company had outstanding cash flow hedges with a total notional amount of $361.8 millionand $321.5 million , respectively.
Balance Sheet HedgesThe Company uses foreign currency derivative contracts not designated as hedging instruments (“balance sheet hedges”) to reduce the
exchange rate risk associated with its foreign currency denominated monetary assets and liabilities. These balance sheet hedges are marked-to-market at the end of each reporting period and the related gains and losses are recognized in Other income (expense), net.
As of March 31, 2016 and December 31, 2015 , the Company had outstanding balance sheet hedges with a total notional amount of $329.9million and $239.9 million , respectively.
Other DerivativeThe Company's other derivative is related to the accounting for the embedded features on the preferred stock of the Company's joint venture,
which is expected to be settled in cash at a value equal to the fair value of the preferred stock, subject to a floor and a cap.
Fair Value of Derivative ContractsThe foreign currency derivative contracts that were not settled at the end of the period and other derivative contract are recorded at fair value,
on a gross basis, in the condensed consolidated balance sheets. The following table presents the fair value of the Company’s derivative contractsas of the periods presented (in thousands):
March 31,
2016 December 31,
2015Derivative assets: Cash flow hedges $ 9,046 $ 11,897Balance sheet hedges 437 2,611 Total derivative assets 9,483 14,508Derivative liabilities: Cash flow hedges 3,280 790Balance sheet hedges 4,872 1,057Other derivative 13,900 11,600 Total derivative liabilities 22,052 13,447
Total fair value of derivative instruments $ (12,569) $ 1,061
See Note 2, Fair Value Measurements , for additional information related to the fair value of the Company’s foreign currency and otherderivative contracts.
Financial Statement Effect of Derivative Contracts
The following table presents the activity of the Company’s cash flow hedges in AOCI in stockholders' equity for the periods presented (inthousands):

December 31,
2015
Amount of loss recognized inother comprehensive income
before tax effect (effectiveportion)
Amount of gain reclassifiedfrom AOCI before tax effect tonet revenue (effective portion)
March 31, 2016
Cash flow hedges $ 11,857 (1,446) (4,542) $ 5,869
December 31,
2014
Amount of gain recognized inother comprehensive income
before tax effect (effectiveportion)
Amount of gain reclassifiedfrom AOCI before tax effect tonet revenue (effective portion)
March 31, 2015
Cash flow hedges $ — 1,009 — $ 1,009
The amount recognized in earnings related to the ineffective portion of the Company's cash flow hedges was insignificant for the quarter.
As of March 31, 2016 , the Company estimates approximately $5.9 million of net derivative gains related to our cash flow hedges will bereclassified from AOCI into earnings within the next 12 months.
The following table presents the impact of the Company’s derivative contracts on the condensed consolidated statement of operations for theperiods presented (in thousands):
Three Months Ended March 31,
Location 2016 2015Cash flow hedges Net revenue $ 4,542 $ —Cash flow hedges Other expense, net (1) (2,291) —Balance sheet hedges Other expense, net (3,252) 11,210Other derivative Other expense, net (2,300) —
Total gain (loss) from derivative contracts $ (3,301) $ 11,210____________(1) Balances relate to changes in fair value that are excluded from the Company's assessment of hedge effectiveness.
6. Property and EquipmentThe following table presents the detail of property and equipment, net, for the periods presented (in thousands):
March 31,
2016 December 31,
2015Computer equipment $ 796,445 $ 736,176Leasehold improvements 390,850 330,436Capitalized website, internal-use software, and production costs 263,316 236,124Land 224,040 224,040Furniture and fixtures 110,154 87,221Software 58,014 55,935Building 49,500 39,351
Total 1,892,319 1,709,283Less accumulated depreciation and amortization (753,287) (662,278)Property and equipment, net $ 1,139,032 $ 1,047,005

Depreciation expense for the three months ended March 31, 2016 and 2015 was $95.0 million and $62.2 million , respectively.
7. Goodwill and Other Intangible Assets
GoodwillGoodwill is generally not deductible for tax purposes. The following table presents the goodwill activity for the periods presented (in thousands):
Goodwill—December 31, 2015 $ 1,507,093Acquisition 90,152Other 23
Goodwill—March 31, 2016 $ 1,597,268

Table of Contents
Other Intangible AssetsThe following table presents the detail of other intangible assets for the periods presented (dollars in thousands):
GrossCarryingAmount
AccumulatedAmortization
NetCarryingAmount
Weighted-Average
RemainingLife (1)
March 31, 2016: Customer and subscriber relationships $ 226,500 $ (63,933) $ 162,567 2.7 yearsDeveloped technology 173,087 (103,520) 69,567 1.2 yearsContent (2) 98,000 (42,875) 55,125 2.1 yearsPatents 56,878 (11,428) 45,450 9.3 yearsOther intangible assets 13,442 (12,103) 1,339 2.1 years
Total $ 567,907 $ (233,859) $ 334,048 3.1 yearsDecember 31, 2015:
Customer and subscriber relationships $ 226,100 $ (46,139) $ 179,961 2.9 yearsDeveloped technology 165,187 (88,361) 76,826 1.4 yearsContent (2) 98,000 (30,625) 67,375 2.4 yearsPatents 56,878 (10,120) 46,758 9.5 yearsOther intangible assets 13,434 (11,267) 2,167 1.4 years
Total $ 559,599 $ (186,512) $ 373,087 3.2 years __________________(1) The weighted-average remaining life of other intangible assets excludes the impact of $0.8 million in indefinite-lived intangible assets, which
consists of domain names, as of March 31, 2016 and December 31, 2015 .(2) The amortization method for the content intangible asset is 50% the first year, 30% the second year, and 20% in the third year. The
remaining definite-lived intangible assets are amortized using the straight-line method.Amortization expense for the three months ended March 31, 2016 and 2015 was $47.3 million and $11.8 million , respectively. Estimated
amortization expense of purchased intangible assets for future periods as of March 31, 2016 is as follows (in thousands):
Year Ending December 31, Amortization ExpenseRemainder of 2016 $ 125,7212017 106,6982018 54,3902019 20,5072020 5,052Thereafter 20,904
Total $ 333,272
17
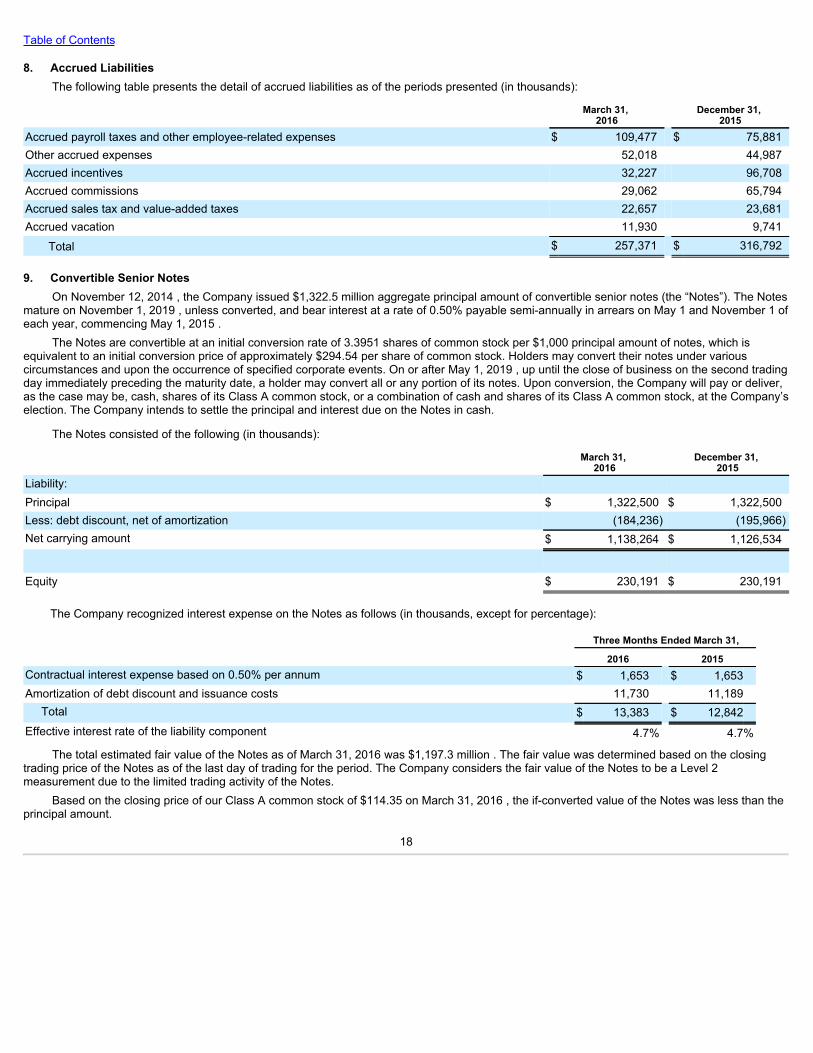
Table of Contents
8. Accrued LiabilitiesThe following table presents the detail of accrued liabilities as of the periods presented (in thousands):
March 31,
2016 December 31,
2015Accrued payroll taxes and other employee-related expenses $ 109,477 $ 75,881Other accrued expenses 52,018 44,987Accrued incentives 32,227 96,708Accrued commissions 29,062 65,794Accrued sales tax and value-added taxes 22,657 23,681Accrued vacation 11,930 9,741
Total $ 257,371 $ 316,792
9. Convertible Senior NotesOn November 12, 2014 , the Company issued $1,322.5 million aggregate principal amount of convertible senior notes (the “Notes”). The Notes
mature on November 1, 2019 , unless converted, and bear interest at a rate of 0.50% payable semi-annually in arrears on May 1 and November 1 ofeach year, commencing May 1, 2015 .
The Notes are convertible at an initial conversion rate of 3.3951 shares of common stock per $1,000 principal amount of notes, which isequivalent to an initial conversion price of approximately $294.54 per share of common stock. Holders may convert their notes under variouscircumstances and upon the occurrence of specified corporate events. On or after May 1, 2019 , up until the close of business on the second tradingday immediately preceding the maturity date, a holder may convert all or any portion of its notes. Upon conversion, the Company will pay or deliver,as the case may be, cash, shares of its Class A common stock, or a combination of cash and shares of its Class A common stock, at the Company’selection. The Company intends to settle the principal and interest due on the Notes in cash.
The Notes consisted of the following (in thousands):
March 31,
2016December 31,
2015Liability: Principal $ 1,322,500 $ 1,322,500Less: debt discount, net of amortization (184,236) (195,966)Net carrying amount $ 1,138,264 $ 1,126,534
Equity $ 230,191 $ 230,191
The Company recognized interest expense on the Notes as follows (in thousands, except for percentage):
Three Months Ended March 31, 2016 2015Contractual interest expense based on 0.50% per annum $ 1,653 $ 1,653Amortization of debt discount and issuance costs 11,730 11,189
Total $ 13,383 $ 12,842Effective interest rate of the liability component 4.7% 4.7%
The total estimated fair value of the Notes as of March 31, 2016 was $1,197.3 million . The fair value was determined based on the closingtrading price of the Notes as of the last day of trading for the period. The Company considers the fair value of the Notes to be a Level 2measurement due to the limited trading activity of the Notes.
Based on the closing price of our Class A common stock of $114.35 on March 31, 2016 , the if-converted value of the Notes was less than theprincipal amount.
18
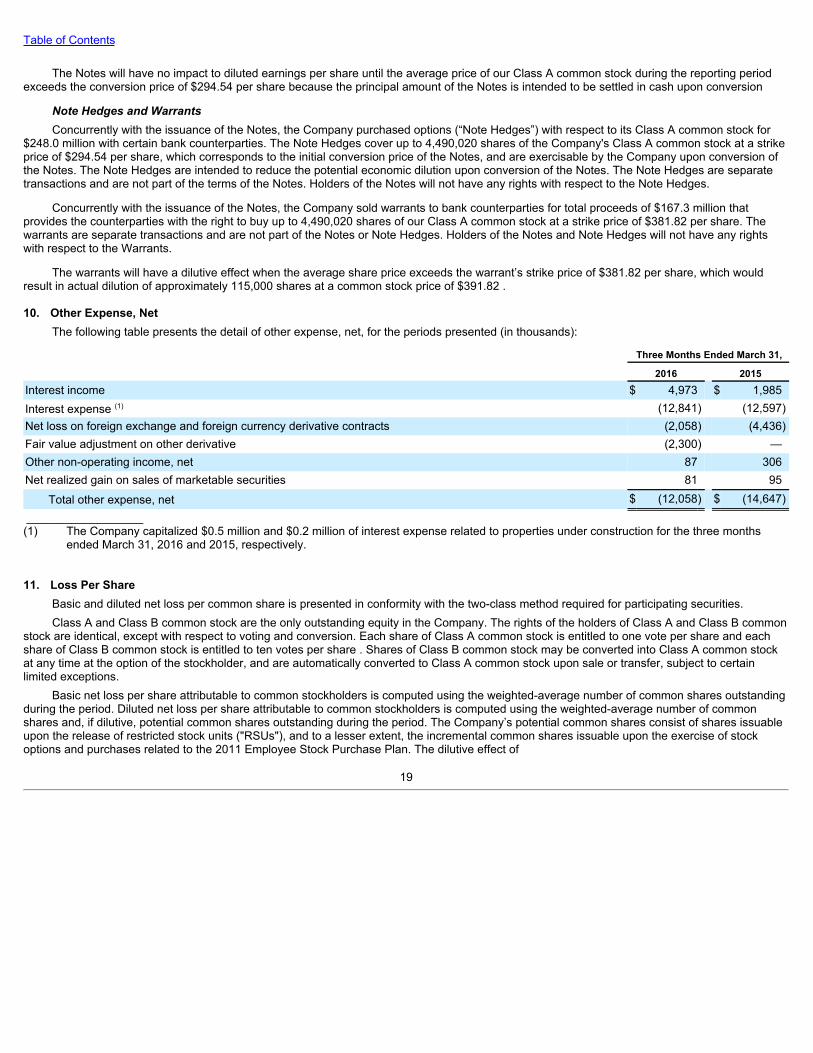
Table of Contents
The Notes will have no impact to diluted earnings per share until the average price of our Class A common stock during the reporting periodexceeds the conversion price of $294.54 per share because the principal amount of the Notes is intended to be settled in cash upon conversion
Note Hedges and WarrantsConcurrently with the issuance of the Notes, the Company purchased options (“Note Hedges”) with respect to its Class A common stock for
$248.0 million with certain bank counterparties. The Note Hedges cover up to 4,490,020 shares of the Company's Class A common stock at a strikeprice of $294.54 per share, which corresponds to the initial conversion price of the Notes, and are exercisable by the Company upon conversion ofthe Notes. The Note Hedges are intended to reduce the potential economic dilution upon conversion of the Notes. The Note Hedges are separatetransactions and are not part of the terms of the Notes. Holders of the Notes will not have any rights with respect to the Note Hedges.
Concurrently with the issuance of the Notes, the Company sold warrants to bank counterparties for total proceeds of $167.3 million thatprovides the counterparties with the right to buy up to 4,490,020 shares of our Class A common stock at a strike price of $381.82 per share. Thewarrants are separate transactions and are not part of the Notes or Note Hedges. Holders of the Notes and Note Hedges will not have any rightswith respect to the Warrants.
The warrants will have a dilutive effect when the average share price exceeds the warrant’s strike price of $381.82 per share, which wouldresult in actual dilution of approximately 115,000 shares at a common stock price of $391.82 .
10. Other Expense, NetThe following table presents the detail of other expense, net, for the periods presented (in thousands):
Three Months Ended March 31,
2016 2015Interest income $ 4,973 $ 1,985Interest expense (1) (12,841) (12,597)Net loss on foreign exchange and foreign currency derivative contracts (2,058) (4,436)Fair value adjustment on other derivative (2,300) —Other non-operating income, net 87 306Net realized gain on sales of marketable securities 81 95
Total other expense, net $ (12,058) $ (14,647) __________________(1) The Company capitalized $0.5 million and $0.2 million of interest expense related to properties under construction for the three months
ended March 31, 2016 and 2015, respectively.
11. Loss Per ShareBasic and diluted net loss per common share is presented in conformity with the two-class method required for participating securities.Class A and Class B common stock are the only outstanding equity in the Company. The rights of the holders of Class A and Class B common
stock are identical, except with respect to voting and conversion. Each share of Class A common stock is entitled to one vote per share and eachshare of Class B common stock is entitled to ten votes per share . Shares of Class B common stock may be converted into Class A common stockat any time at the option of the stockholder, and are automatically converted to Class A common stock upon sale or transfer, subject to certainlimited exceptions.
Basic net loss per share attributable to common stockholders is computed using the weighted-average number of common shares outstandingduring the period. Diluted net loss per share attributable to common stockholders is computed using the weighted-average number of commonshares and, if dilutive, potential common shares outstanding during the period. The Company’s potential common shares consist of shares issuableupon the release of restricted stock units ("RSUs"), and to a lesser extent, the incremental common shares issuable upon the exercise of stockoptions and purchases related to the 2011 Employee Stock Purchase Plan. The dilutive effect of
19
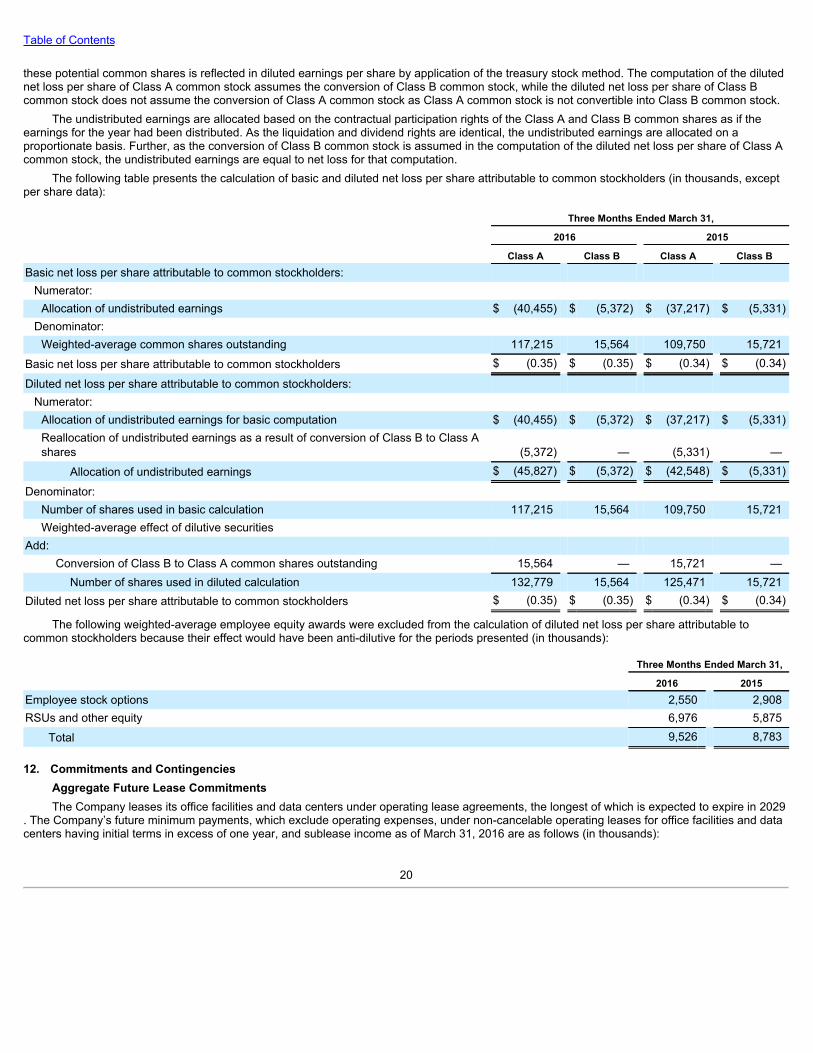
Table of Contents
these potential common shares is reflected in diluted earnings per share by application of the treasury stock method. The computation of the dilutednet loss per share of Class A common stock assumes the conversion of Class B common stock, while the diluted net loss per share of Class Bcommon stock does not assume the conversion of Class A common stock as Class A common stock is not convertible into Class B common stock.
The undistributed earnings are allocated based on the contractual participation rights of the Class A and Class B common shares as if theearnings for the year had been distributed. As the liquidation and dividend rights are identical, the undistributed earnings are allocated on aproportionate basis. Further, as the conversion of Class B common stock is assumed in the computation of the diluted net loss per share of Class Acommon stock, the undistributed earnings are equal to net loss for that computation.
The following table presents the calculation of basic and diluted net loss per share attributable to common stockholders (in thousands, exceptper share data):
Three Months Ended March 31, 2016 2015 Class A Class B Class A Class BBasic net loss per share attributable to common stockholders: Numerator: Allocation of undistributed earnings $ (40,455) $ (5,372) $ (37,217) $ (5,331)
Denominator: Weighted-average common shares outstanding 117,215 15,564 109,750 15,721
Basic net loss per share attributable to common stockholders $ (0.35) $ (0.35) $ (0.34) $ (0.34)
Diluted net loss per share attributable to common stockholders: Numerator: Allocation of undistributed earnings for basic computation $ (40,455) $ (5,372) $ (37,217) $ (5,331)Reallocation of undistributed earnings as a result of conversion of Class B to Class Ashares (5,372) — (5,331) —
Allocation of undistributed earnings $ (45,827) $ (5,372) $ (42,548) $ (5,331)
Denominator: Number of shares used in basic calculation 117,215 15,564 109,750 15,721Weighted-average effect of dilutive securities
Add: Conversion of Class B to Class A common shares outstanding 15,564 — 15,721 —
Number of shares used in diluted calculation 132,779 15,564 125,471 15,721Diluted net loss per share attributable to common stockholders $ (0.35) $ (0.35) $ (0.34) $ (0.34)
The following weighted-average employee equity awards were excluded from the calculation of diluted net loss per share attributable tocommon stockholders because their effect would have been anti-dilutive for the periods presented (in thousands):
Three Months Ended March 31, 2016 2015Employee stock options 2,550 2,908RSUs and other equity 6,976 5,875
Total 9,526 8,783
12. Commitments and ContingenciesAggregate Future Lease CommitmentsThe Company leases its office facilities and data centers under operating lease agreements, the longest of which is expected to expire in 2029
. The Company’s future minimum payments, which exclude operating expenses, under non-cancelable operating leases for office facilities and datacenters having initial terms in excess of one year, and sublease income as of March 31, 2016 are as follows (in thousands):
20

Table of Contents
Year Ending December 31,Gross Operating Lease
Commitments SubleaseIncome (1)
Net Operating LeaseCommitments
Remainder of 2016 $ 122,901 $ (13,593) $ 109,3082017 176,588 (18,045) 158,5432018 204,441 (18,208) 186,2332019 203,564 (18,726) 184,8382020 197,985 (19,241) 178,744Thereafter 1,127,337 (121,185) 1,006,152
Total minimum lease payments $ 2,032,816 $ (208,998) $ 1,823,818 __________________
(1) Primarily represents sublease income for several buildings the Company leases in Sunnyvale, California to be recognized over the next 10years .
Legal ProceedingsThe Company is subject to legal proceedings and litigation arising in the ordinary course of business, including, but not limited to, certain
pending patent and privacy matters, including class action lawsuits, as well as inquiries, investigations, audits and other regulatory proceedings.Although occasional adverse decisions or settlements may occur, the Company does not believe that the final disposition of any of these matters willhave a material adverse effect on the business. Certain of these matters include speculative claims for substantial or indeterminate amounts ofdamages, and include claims for injunctive relief. Additionally, the Company's litigation costs can be significant. Other regulatory matters could resultin fines and penalties being assessed against the Company, and it may become subject to periodic audits, which would likely increase its regulatorycompliance costs. Adverse results of litigation or regulatory matters could also result in the Company being required to change its businesspractices, which could negatively impact its membership and revenue growth.
The Company records a liability when it believes that it is both probable that a loss has been incurred and the amount can be reasonablyestimated. The Company periodically evaluates developments in its legal matters that could affect the amount of liability that it has previouslyaccrued, if any, and makes adjustments as appropriate. Significant judgment is required to determine both likelihood of there being, and theestimated amount of, a loss related to such matters, and the Company’s judgment may be incorrect. The outcome of any proceeding is notdeterminable in advance. Until the final resolution of any such matters that the Company may be required to accrue for, it may be exposed to loss inexcess of the amount accrued, and such amounts could be material.
IndemnificationsIn the ordinary course of business, the Company enters into contractual arrangements under which it agrees to provide indemnification of
varying scope and terms to business partners and other parties with respect to certain matters, including, but not limited to, losses arising out of theCompany’s breach of such agreements and out of intellectual property infringement claims made by third parties. In these circumstances, paymentmay be conditional on the other party making a claim pursuant to the procedures specified in the particular contract. Further, the Company’sobligations under these agreements may be limited in terms of time and/or amount, and in some instances, it may have recourse against thirdparties for certain payments. In addition, the Company has indemnification agreements with certain of its directors and executive officers that requireit, among other things, to indemnify them against certain liabilities that may arise by reason of their status or service as directors or officers with theCompany. The terms of such obligations may vary. 13. Stockholders’ Equity
Common StockAs of March 31, 2016 , the Company had 117,984,448 shares and 15,560,088 shares of Class A common stock and Class B common stock
outstanding, respectively. As of December 31, 2015 , the Company had 116,468,385 and 15,580,510 shares of Class A common stock and Class Bcommon stock outstanding, respectively.
21

Table of Contents
RSU ActivityA summary of RSU activity for the three months ended March 31, 2016 is as follows:
Number of
Shares
Weighted-Average
Grant DateFair Value
AggregateIntrinsic
Value(in thousands)
Unvested—December 31, 2015 6,136,702 $ 211.77 Assumed RSUs from acquisition 42,157 114.12 Granted 2,355,211 115.42 Released (606,631) 198.17 Forfeited (160,610) 207.29
Unvested—March 31, 2016 7,766,829 $ 183.18 $ 888,119
Expected to vest as of March 31, 2016 6,756,694 $ 772,628
The intrinsic value of RSUs released was approximately $64.3 million and $122.4 million in the three months ended March 31, 2016 and 2015 ,respectively. As of March 31, 2016 , the total unrecognized compensation cost, adjusted for estimated forfeitures, related to RSUs wasapproximately $1.2 billion , which is expected to be recognized over the next 3.0 years .
Stock Option ActivityA summary of stock option activity for the three months ended March 31, 2016 is as follows:
Options Outstanding
Weighted-AverageRemaining
Contractual Term
(in years)
AggregateIntrinsic
Value(in thousands)
Number of
Shares Weighted-Average
Exercise Price Outstanding—December 31, 2015 2,582,517 $ 102.64 Assumed options from acquisition 33,586 11.31 Granted 7,236 109.97 Exercised (84,574) 19.85 Forfeited or expired (3,941) 121.69
Outstanding—March 31, 2016 2,534,824 $ 104.19 5.79 $ 133,680Options vested and expected to vest as of March 31,2016 2,459,382 $ 101.40 5.71 $ 132,863
Options vested and exercisable as of March 31, 2016 1,796,352 $ 69.30 4.87 $ 125,697
Aggregate intrinsic value represents the difference between the Company's closing stock price of its Class A common stock and the exerciseprice of outstanding, in-the-money options. The Company’s closing stock price as reported on the New York Stock Exchange as of March 31, 2016was $114.35 . The total intrinsic value of options exercised was approximately $10.6 million and $88.3 million for the three months ended March 31,2016 and 2015 , respectively. As of March 31, 2016 , total unrecognized compensation cost, adjusted for estimated forfeitures, related to unvestedstock options was approximately $56.4 million , which is expected to be recognized over the next 2.3 years .
Restricted StockThe Company issued 394,094 shares of restricted Class A common stock during the three months ended March 31, 2016. A total of 728,218
shares of restricted stock were outstanding as of March 31, 2016, and the total unrecognized compensation cost was approximately $41.3 million ,which is expected to be recognized over the next 2.4 years .
22
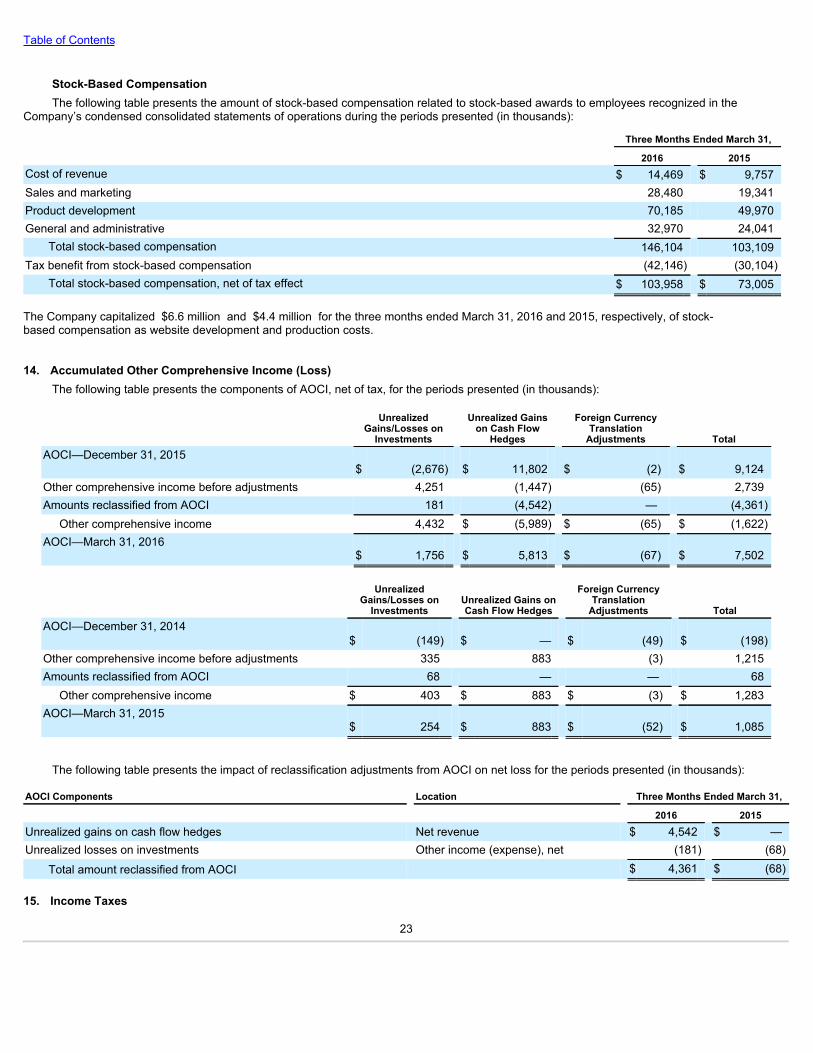
Table of Contents
Stock-Based CompensationThe following table presents the amount of stock-based compensation related to stock-based awards to employees recognized in the
Company’s condensed consolidated statements of operations during the periods presented (in thousands):
Three Months Ended March 31,
2016 2015Cost of revenue $ 14,469 $ 9,757Sales and marketing 28,480 19,341Product development 70,185 49,970General and administrative 32,970 24,041
Total stock-based compensation 146,104 103,109Tax benefit from stock-based compensation (42,146) (30,104)
Total stock-based compensation, net of tax effect $ 103,958 $ 73,005
The Company capitalized $6.6 million and $4.4 million for the three months ended March 31, 2016 and 2015, respectively, of stock-based compensation as website development and production costs.
14. Accumulated Other Comprehensive Income (Loss)The following table presents the components of AOCI, net of tax, for the periods presented (in thousands):
UnrealizedGains/Losses on
Investments
Unrealized Gainson Cash Flow
Hedges
Foreign CurrencyTranslation
Adjustments TotalAOCI—December 31, 2015
$ (2,676) $ 11,802 $ (2) $ 9,124Other comprehensive income before adjustments 4,251 (1,447) (65) 2,739Amounts reclassified from AOCI 181 (4,542) — (4,361) Other comprehensive income 4,432 $ (5,989) $ (65) $ (1,622)AOCI—March 31, 2016
$ 1,756 $ 5,813 $ (67) $ 7,502
UnrealizedGains/Losses on
Investments Unrealized Gains onCash Flow Hedges
Foreign CurrencyTranslation
Adjustments TotalAOCI—December 31, 2014
$ (149) $ — $ (49) $ (198)Other comprehensive income before adjustments 335 883 (3) 1,215Amounts reclassified from AOCI 68 — — 68 Other comprehensive income $ 403 $ 883 $ (3) $ 1,283AOCI—March 31, 2015
$ 254 $ 883 $ (52) $ 1,085
The following table presents the impact of reclassification adjustments from AOCI on net loss for the periods presented (in thousands):
AOCI Components Location Three Months Ended March 31, 2016 2015Unrealized gains on cash flow hedges Net revenue $ 4,542 $ —Unrealized losses on investments Other income (expense), net (181) (68)
Total amount reclassified from AOCI $ 4,361 $ (68)
15. Income Taxes
23

Table of Contents
The Company is subject to income tax in the United States as well as other tax jurisdictions in which it conducts business. Earnings fromactivities outside the United States are subject to local country income tax. The Company does not provide for federal income taxes on theundistributed earnings of its foreign subsidiaries because it is the Company’s intent to reinvest earnings indefinitely offshore. The determination ofthe interim period income tax provision utilizes the effective rate method, which requires the estimation of certain annualized components of thecomputation of the income tax provision, including the estimate of the annual effective tax rate by legal entity and by jurisdiction. The Company'sability to estimate the geographic mix of earnings is impacted by the relatively high-growth nature of the business, acquisitions, fluctuations ofbusiness operations by country, and implementation of tax planning strategies.
On December 18, 2015, the President signed into law The Protecting Americans from Tax Hikes Act of 2015 (the "2015 Act"). The 2015 actestablishes a permanent research tax credit for qualifying amounts paid or incurred after December 31, 2014. As a result of the enacted permanentcredit, the Company recognized a full tax benefit of $20.4 million in the fourth quarter for all qualifying amounts incurred in 2015.
The Company recorded income tax benefit of $33.0 million for the three months ended March 31, 2016 and income tax expense of $10.6million for the three months ended March 31, 2015 . The Company recognized a tax benefit in the three months ended March 31, 2016 compared tothe same period last year primarily due to US losses as compared to US income in the prior period.
On December 1, 2015, in Altera Corp. v. Commissioner , the US Tax Court formally entered its decision related to the treatment of stock-basedcompensation expense in an intercompany cost-sharing arrangement. At this time, the US Department of the Treasury has not withdrawn therequirement to include stock-based compensation from its regulations. Due to the uncertainty surrounding the status of the current regulations,questions related to the scope of potential benefits, and the risk of the Tax Court’s decision being overturned upon appeal, the Company has notrecorded any impact as of March 31, 2016. The Company will continue to monitor ongoing developments and potential impacts to our financialstatements.
16. Information About Revenue and Geographic AreasRevenue by geography is generally based on the shipping address of the customer. The following tables present the Company’s revenue by
product and geographic region for the periods presented (in thousands):
Three Months Ended March 31,
2016 2015Net revenue by product:
Talent Solutions Hiring $ 502,391 $ 396,375 Learning & Development 55,256 — Total Talent Solutions 557,647 396,375Marketing Solutions 154,147 119,192Premium Subscriptions 148,856 122,120
Total $ 860,650 $ 637,687
24

Table of Contents
Three Months Ended March 31,
2016 2015Net revenue by geographic region:
United States $ 526,416 $ 389,258Other Americas (1) 45,362 38,066
Total Americas 571,778 427,324EMEA (2) 217,601 156,563APAC (3) 71,271 53,800
Total $ 860,650 $ 637,687 __________________(1) Canada, Latin America and South America(2) Europe, the Middle East and Africa (“EMEA”)(3) Asia-Pacific (“APAC”)
No individual customer accounted for 10% or more of consolidated net revenue or accounts receivable for any of the periods presented. Item 2. Management’s Discussion and Analysis of Financial Condition and Results of Operations
This section and other parts of this Quarterly Report on Form 10-Q contain forward-looking statements that involve risks and uncertainties.Forward-looking statements can also be identified by words such as “anticipates,” “expects,” “believes,” “plans,” “predicts,” and similar terms.Forward-looking statements are not guarantees of future performance and the Company’s actual results may differ significantly from the resultsdiscussed in the forward-looking statements. Factors that might cause such differences include, but are not limited to, those discussed in thesubsection entitled “Risk Factors” above, which are incorporated herein by reference.
You should read the following discussion of our financial condition and results of operations in conjunction with the condensed consolidatedfinancial statements and the notes thereto included elsewhere in this Quarterly Report on Form 10-Q and our Annual Report on Form 10-K for theyear ended December 31, 2015 , filed on February 12, 2016 .
OverviewAs the world’s largest professional network on the Internet, we currently have over 425 million members in over 200 countries and territories.
LinkedIn's value proposition for our members and customers is simple: connect to opportunity . Members use our platform to stay connected andinformed and advance their careers, while customers are able to work smarter through our diverse product lines. Our focus is on delivering value tomembers in their professional lives. We believe creating value for our members strengthens the network effect of our platform, and in return,enables us to deliver products that create value for our customers. Ultimately, our vision is to create economic opportunity for every member of theglobal workforce by building the world's first economic graph, a digital representation of the global economy.
Our revenue comes from products that monetize the unique value and critical mass of our platform. We believe by creating value forour members we can transform the way our customers hire, market, sell, and learn on a global basis through our three product lines: TalentSolutions, Marketing Solutions, and Premium Subscriptions. Our Talent Solutions include Hiring and Learning and Development. Hiring providesproducts to recruiters that enable them to attract, recruit, and hire talent. Learning and Development, from our acquisition of Lynda.com, providessubscriptions to enterprises and individuals to online education courses. Our Marketing Solutions enable enterprises and individuals to advertise toour member base through relevant content. Our Premium Subscriptions (inclusive of Sales Solutions) enable professionals to manage theirprofessional identity, grow their network, and connect with talent, while Sales Navigator, our premium social selling solution, enables salesprofessionals to find leads and generate sales.
Our long-term financial focus is on sustainable, long-term growth; however, in the near term we expect US GAAP operating lossesas we continue to investment in our business. Our investments in 2016 will continue to focus on the following themes: driving growth in our coreproducts within Talent Solutions, Marketing Solutions, and Premium Subscriptions, creating reciprocal value for our members and customers,and increasing
25

Table of Contents
return on investment while also supporting our long-term financial objectives of sustainable revenue and earnings growth.
• Our Products. With respect to product development, we will continue to focus investment on our member and customer value proposition:connect to opportunity.
◦ Members . We plan to continue to invest in our global member experience focusing on our value propositions: helping membersstay connected and informed and advance their careers.
◦ Customers. We plan to invest in our core product development efforts to help customers work smarter by transforming the way theyhire, market, sell, and learn.
In addition, we expect to continue to invest in mobile across our product lines. Mobile is the fastest growing channel for memberengagement, growing at twice the rate of overall site traffic with mobile unique visiting members representing 58% of unique visitingmembers in the first quarter of 2016 .
• Our Talent. We expect to continue to expand our workforce in 2016. However, such expansion, specifically related to our sales and productdevelopment teams, will be at a slower rate than in 2015. We expect that the increased headcount will result in an increase in relatedexpenses, including stock-based compensation expense and capital expenditures related to facilities. As of March 31, 2016 , we had 9,732employees, which represented an increase of 27% compared to the same period last year.
• Our Technology. We expect to continue to make significant capital expenditures to upgrade our technology and network infrastructure toimprove the ability of our website to handle expected increases in usage, to enable the release of new features and solutions, and to scalefor future growth. These investments are particularly focused on expanding our footprint of data centers.
As a result of our long-term investment philosophy, we expect to be in an operating loss on a consolidated basis under generally acceptedaccounting principles in the United States of America ("US GAAP") in fiscal 2016.
We are driving significant revenue growth and continuing to invest for the long term, resulting in current operating losses. Our netrevenue was $860.7 million for the three months ended March 31, 2016 , which represents an increase of 35% compared to the same period in2015 . Our net revenue benefited from increased sales of our core products, specifically Recruiter, Jobs, Sponsored Content, and Sales Solutionsas well as revenue from our recent acquisition of Lynda.com. We had an operating loss of $66.2 million driven by increases in headcount-relatedexpenses of $154.9 million as we hired additional employees to support the growth in our business. We also had an increase of $68.3 million indepreciation and amortization related to intangible assets from our acquisition of Lynda.com in 2015, build out of our data centers, leaseholdimprovements as we lease additional facilities to accommodate our headcount growth, and capitalized website and internal-use software.
We expect our growth rate to continue to decrease over time. As our net revenue increases, we expect that our growth rate related to netrevenue will continue to decrease over time. Also, given the large scale and critical mass of our network, we believe member and engagementgrowth, as measured by our key metrics, will decelerate over time and that this may impact the growth of certain portions of our business. Our futuregrowth will depend, in part, on our ability to continue to increase member growth and engagement by creating value for members as well asstrengthening our core offerings on mobile and desktop devices and expanding our global presence, which we believe will result in increased salesof our Talent Solutions, Marketing Solutions, and Premium Subscriptions.
Key MetricsWe regularly review a number of metrics, including the following key metrics, to evaluate our business, measure our performance, identify
trends affecting our business, formulate financial projections, and make strategic decisions. In addition, we regularly review our key metrics toassess whether they are the best metrics available to us as the business environment we operate in changes. For example, as mobile trafficcontinues to represent a larger portion of member engagement on our site, the relevance of member page views as a metric decreases because awell-designed mobile application may reduce the number of clicks and pages a member touches. In the future, we may consider alternative metricsto member page views such as a metric that tracks the frequency of engagement a member has with our site.
26

Table of Contents
• Number of Registered Members. We define the number of registered members in our network as the number of individual users who havecreated a member profile on LinkedIn.com as of the date of measurement. We believe the number of registered members is an indicator ofthe growth of our network and our ability to receive the benefits of the network effects resulting from such growth. Growth in our member basedepends, in part, on our ability to successfully develop and market our solutions to professionals who have not yet become members of ournetwork. Member growth will also be contingent on our ability to translate our offerings into additional languages, create more localizedproducts in certain key markets, and more broadly expand our member base internationally. We believe that a higher number of registeredmembers will result in increased sales of our Talent Solutions, Marketing Solutions, and Premium Subscriptions, as customers will haveaccess to a larger pool of professional talent. However, a higher number of registered members will not immediately increase sales, nor will ahigher number of registered members in a given region immediately increase sales in that region, as growth of sales and marketing activitiesgenerally takes more time to develop than membership growth .The following table presents the number of registered members as of the periods presented by geographic region:
March 31, 2016 2015 % Change
(in thousands) Members by geographic region:
United States 128,433 30% 115,628 32% 11%Other Americas (1) 73,222 17% 62,581 17% 17%
Total Americas 201,655 47% 178,209 49% 13%EMEA (2) 138,435 32% 116,745 32% 19%APAC (3) 92,663 21% 68,975 19% 34%
Total number of registered members (4) 432,753 100% 363,929 100% 19% ______________________(1) Canada, Latin America and South America(2) Europe, the Middle East and Africa (“EMEA”)(3) Asia-Pacific (“APAC”)(4) The number of registered members is higher than the number of actual members due to various factors. For more information, see “Risk
Factors— The number of our registered members is higher than the number of actual members and a substantial majority of our traffic isgenerated by a minority of our members . Our business may be adversely impacted if we are unable to attract and retain additionalmembers who actively use our services. ”
• Unique Visiting Members . We define unique visiting members as the total number of members who have visited LinkedIn.com on desktopor have visited selected mobile applications offered by LinkedIn.com on their mobile devices at least once during a month. We view uniquevisiting members as a key indicator of whether we are delivering value to members by continuing to improve our product offerings as well asgrowth in our brand awareness among members. Higher levels of member traffic contribute to building a larger pool of professional talent anda richer data ecosystem, which is our key monetizable asset. We leverage these assets, both directly and indirectly, to grow sales withinTalent Solutions, Marketing Solutions, and Premium Subscriptions. Continued growth in unique visiting members will be driven by growth inthe number of registered members, improvements to features and products that drive traffic to our website, and mobile applications, andglobal expansion. This growth may be impacted by business decisions aligned with our long-term strategy in order to create a better memberexperience. For example, our decision to reduce the number of emails sent to members may adversely impact the amount of member trafficto our site.
27
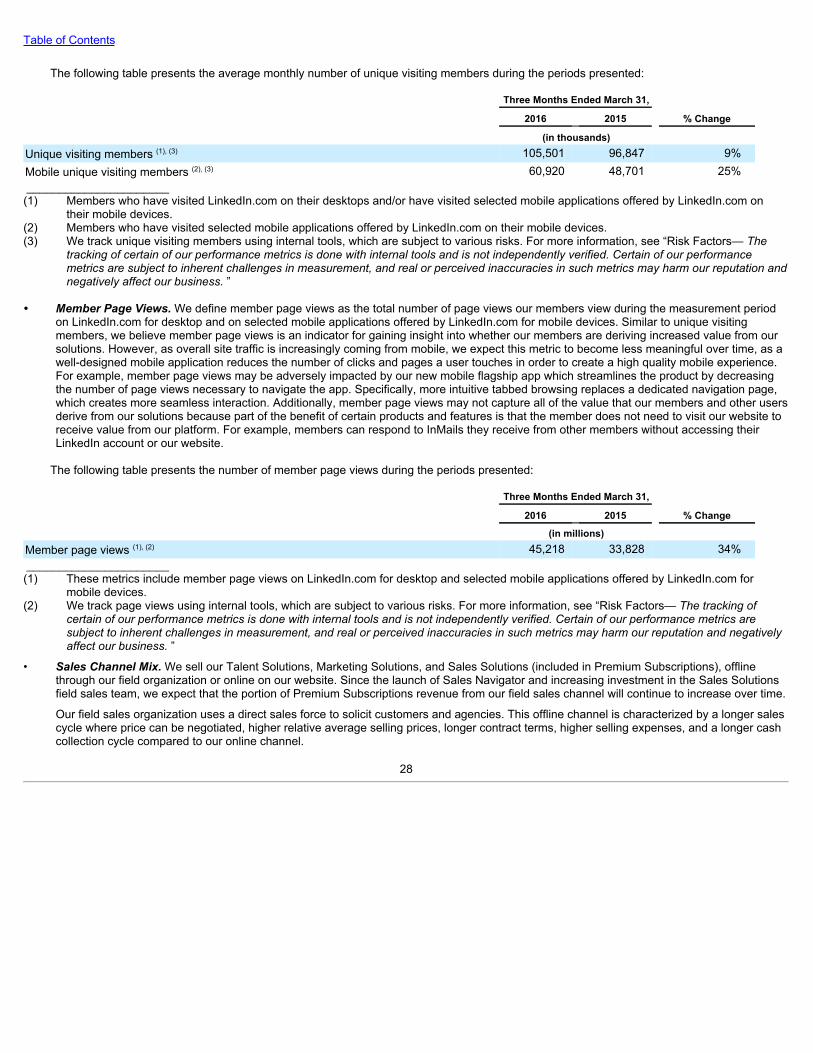
Table of Contents
The following table presents the average monthly number of unique visiting members during the periods presented:
Three Months Ended March 31, 2016 2015 % Change (in thousands) Unique visiting members (1), (3) 105,501 96,847 9%Mobile unique visiting members (2), (3) 60,920 48,701 25% ______________________(1) Members who have visited LinkedIn.com on their desktops and/or have visited selected mobile applications offered by LinkedIn.com on
their mobile devices.(2) Members who have visited selected mobile applications offered by LinkedIn.com on their mobile devices.(3) We track unique visiting members using internal tools, which are subject to various risks. For more information, see “Risk Factors— The
tracking of certain of our performance metrics is done with internal tools and is not independently verified. Certain of our performancemetrics are subject to inherent challenges in measurement, and real or perceived inaccuracies in such metrics may harm our reputation andnegatively affect our business. ”
• Member Page Views. We define member page views as the total number of page views our members view during the measurement periodon LinkedIn.com for desktop and on selected mobile applications offered by LinkedIn.com for mobile devices. Similar to unique visitingmembers, we believe member page views is an indicator for gaining insight into whether our members are deriving increased value from oursolutions. However, as overall site traffic is increasingly coming from mobile, we expect this metric to become less meaningful over time, as awell-designed mobile application reduces the number of clicks and pages a user touches in order to create a high quality mobile experience.For example, member page views may be adversely impacted by our new mobile flagship app which streamlines the product by decreasingthe number of page views necessary to navigate the app. Specifically, more intuitive tabbed browsing replaces a dedicated navigation page,which creates more seamless interaction. Additionally, member page views may not capture all of the value that our members and other usersderive from our solutions because part of the benefit of certain products and features is that the member does not need to visit our website toreceive value from our platform. For example, members can respond to InMails they receive from other members without accessing theirLinkedIn account or our website.
The following table presents the number of member page views during the periods presented:
Three Months Ended March 31,
2016 2015 % Change
(in millions) Member page views (1), (2) 45,218 33,828 34% ______________________(1) These metrics include member page views on LinkedIn.com for desktop and selected mobile applications offered by LinkedIn.com for
mobile devices.(2) We track page views using internal tools, which are subject to various risks. For more information, see “Risk Factors— The tracking of
certain of our performance metrics is done with internal tools and is not independently verified. Certain of our performance metrics aresubject to inherent challenges in measurement, and real or perceived inaccuracies in such metrics may harm our reputation and negativelyaffect our business. ”
• Sales Channel Mix. We sell our Talent Solutions, Marketing Solutions, and Sales Solutions (included in Premium Subscriptions), offlinethrough our field organization or online on our website. Since the launch of Sales Navigator and increasing investment in the Sales Solutionsfield sales team, we expect that the portion of Premium Subscriptions revenue from our field sales channel will continue to increase over time.
Our field sales organization uses a direct sales force to solicit customers and agencies. This offline channel is characterized by a longer salescycle where price can be negotiated, higher relative average selling prices, longer contract terms, higher selling expenses, and a longer cashcollection cycle compared to our online channel.
28
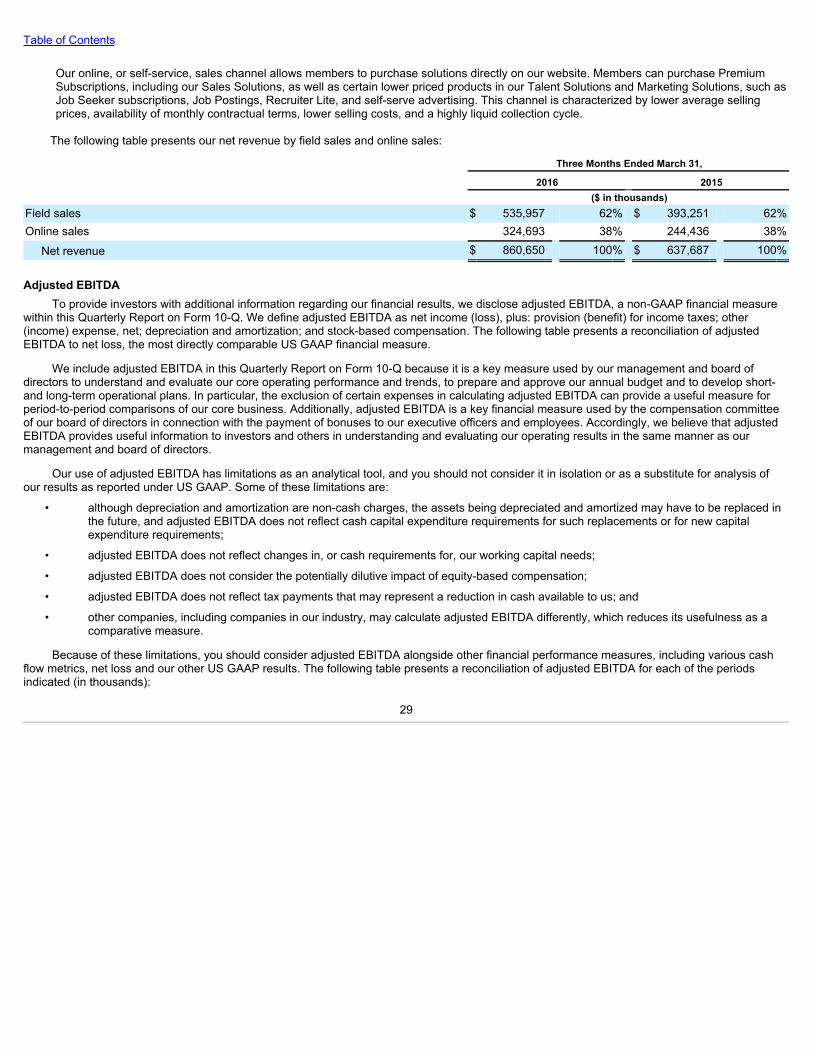
Table of Contents
Our online, or self-service, sales channel allows members to purchase solutions directly on our website. Members can purchase PremiumSubscriptions, including our Sales Solutions, as well as certain lower priced products in our Talent Solutions and Marketing Solutions, such asJob Seeker subscriptions, Job Postings, Recruiter Lite, and self-serve advertising. This channel is characterized by lower average sellingprices, availability of monthly contractual terms, lower selling costs, and a highly liquid collection cycle.
The following table presents our net revenue by field sales and online sales:
Three Months Ended March 31,
2016 2015 ($ in thousands)Field sales $ 535,957 62% $ 393,251 62%Online sales 324,693 38% 244,436 38% Net revenue $ 860,650 100% $ 637,687 100%
Adjusted EBITDATo provide investors with additional information regarding our financial results, we disclose adjusted EBITDA, a non-GAAP financial measure
within this Quarterly Report on Form 10-Q. We define adjusted EBITDA as net income (loss), plus: provision (benefit) for income taxes; other(income) expense, net; depreciation and amortization; and stock-based compensation. The following table presents a reconciliation of adjustedEBITDA to net loss, the most directly comparable US GAAP financial measure.
We include adjusted EBITDA in this Quarterly Report on Form 10-Q because it is a key measure used by our management and board ofdirectors to understand and evaluate our core operating performance and trends, to prepare and approve our annual budget and to develop short-and long-term operational plans. In particular, the exclusion of certain expenses in calculating adjusted EBITDA can provide a useful measure forperiod-to-period comparisons of our core business. Additionally, adjusted EBITDA is a key financial measure used by the compensation committeeof our board of directors in connection with the payment of bonuses to our executive officers and employees. Accordingly, we believe that adjustedEBITDA provides useful information to investors and others in understanding and evaluating our operating results in the same manner as ourmanagement and board of directors.
Our use of adjusted EBITDA has limitations as an analytical tool, and you should not consider it in isolation or as a substitute for analysis ofour results as reported under US GAAP. Some of these limitations are:
• although depreciation and amortization are non-cash charges, the assets being depreciated and amortized may have to be replaced inthe future, and adjusted EBITDA does not reflect cash capital expenditure requirements for such replacements or for new capitalexpenditure requirements;
• adjusted EBITDA does not reflect changes in, or cash requirements for, our working capital needs;
• adjusted EBITDA does not consider the potentially dilutive impact of equity-based compensation;
• adjusted EBITDA does not reflect tax payments that may represent a reduction in cash available to us; and
• other companies, including companies in our industry, may calculate adjusted EBITDA differently, which reduces its usefulness as acomparative measure.
Because of these limitations, you should consider adjusted EBITDA alongside other financial performance measures, including various cashflow metrics, net loss and our other US GAAP results. The following table presents a reconciliation of adjusted EBITDA for each of the periodsindicated (in thousands):
29

Table of Contents
Three Months Ended March 31,
2016 2015 (in thousands)Reconciliation of Adjusted EBITDA: Net loss $ (45,316) $ (42,439) Provision (benefit) for income taxes (32,961) 10,572 Other expense, net 12,058 14,647 Depreciation and amortization 142,285 73,972 Stock-based compensation 146,104 103,109
Adjusted EBITDA $ 222,170 $ 159,861
Results of OperationsThe following table sets forth our results of operations for the periods presented as a percentage of net revenue for those periods. The period-
to-period comparison of financial results is not necessarily indicative of future results.
Three Months Ended March 31,
2016 2015 (as a percentage of net revenue)Condensed Consolidated Statements of Operations Data: (1) Net revenue 100 % 100 %Costs and expenses:
Cost of revenue (exclusive of depreciation and amortization shown separately below) 14 14Sales and marketing 35 36Product development 28 26General and administrative 15 15Depreciation and amortization 17 12
Total costs and expenses 108 103Loss from operations (8) (3)Other expense, net:
Interest income 1 —Interest expense (1) (2)Other, net — (1)
Other expense, net (1) (2)Loss before income taxes (9) (5)Provision (benefit) for income taxes (4) 2Net loss (5) (7)Accretion of redeemable noncontrolling interest — —Net loss attributable to common stockholders (5)% (7)% ______________________(1) Certain items may not total due to rounding.
Net RevenueWe generate revenue from Talent Solutions, Marketing Solutions, and Premium Subscriptions.
30
Table of Contents
Talent Solutions. Talent Solutions revenue is comprised of Hiring and Learning and Development products. Hiring products primarily consist ofLinkedIn Recruiter, Job Slots, Career Pages, Job Postings, Job Seeker and Recruiter Lite. The Company provides access to its professionaldatabase of both active and passive job candidates with LinkedIn Recruiter, which allows corporate recruiting teams to identify candidates based onindustry, job function, geography, experience/education, and other specifications. Revenue from the LinkedIn Recruiter product is recognized ratablyover the subscription period, which consists primarily of annual subscriptions that are billed monthly, quarterly, or annually. The Company also earnsrevenue from Job Slots, which enable an enterprise or professional organization to post jobs on its website, and allows the job that is posted to bechanged, updated, or modified over the life of the contract. Revenue from Job Slots is recognized ratably over the contract, typically 12 months.Career Pages give enterprises and professional organizations the ability to customize the career section of their Company Profiles and content onCareer Pages to allow potential candidates to learn more about what it is like to work at their company. Revenue from Career Pages is recognizedratably over the contractual period, which is typically 12 months. The Company also earns revenue from the placement of Job Postings on itswebsite, which generally run for 30 days. Independent recruiters can pay to post job openings that are accessible through job searches or targetedjob matches. Revenue from Job Postings is recognized as the posting is displayed or at the expiration of the contract period, if not utilized. JobSeeker subscriptions give access to premium features on our website to help individuals find job opportunities. Revenue from Job Seeker andRecruiter Lite subscriptions is recognized ratably over the contractual period, which consists of monthly and annual subscriptions. Learning andDevelopment products consist of individual and enterprise subscriptions to the Lynda.com learning platform. Revenue from these subscriptions isrecognized ratably over the subscription period, which consists of monthly and annual subscriptions for individuals and annual and multi-yearsubscriptions for enterprises.
Marketing Solutions. Marketing Solutions revenue is earned from advertisements (consisting of content-based, graphic display, and text link)shown primarily on LinkedIn.com and its mobile applications based on either a cost per click or cost per advertisement model. Revenue fromInternet advertising is generally recognized on a gross basis, with the exception of transactions with advertising agencies, which are recognized netof agency discounts.
Premium Subscriptions. Premium Subscriptions revenue is derived primarily from selling various subscriptions that allow members to havefurther access to premium services on LinkedIn.com. The Company offers its members monthly or annual subscriptions. Revenue from PremiumSubscription services is recognized ratably over the contractual period, which is generally from one to 12 months. Premium Subscriptions alsoincludes revenue from its Sales Solutions products, which includes annual subscription solutions sold through its field sales and online channels.Revenue from Sales Solution subscriptions is also recognized ratably over the contractual period, which is generally from one to 12 months.
31

Table of Contents
Three Months Ended March 31, 2016 2015 % Change
($ in thousands) Net revenue by product:
Talent Solutions Hiring $ 502,391 $ 396,375 27% Learning & Development 55,256 — n/a
Total Talent Solutions 557,647 396,375 41%Marketing Solutions 154,147 119,192 29%Premium Subscriptions 148,856 122,120 22%
Total $ 860,650 $ 637,687 35%
Percentage of net revenue by product: (1) Talent Solutions
Hiring 58% 62% Learning & Development 6% —%
Total Talent Solutions 65% 62% Marketing Solutions 18% 19% Premium Subscriptions 17% 19%
Total 100% 100% ______________________(1) Certain items may not total due to rounding.
Total net revenue increased $223.0 million in the three months ended March 31, 2016 compared to the same period last year.
Net revenue from our Talent Solutions increased $161.3 million in the three months ended March 31, 2016 compared to the same period lastyear. The increase in Hiring revenue was driven by increased spending by existing customers as well as additional business from new customers.Learning and Development consists of revenue from our acquisition of Lynda.com.
Net revenue from our Marketing Solutions increased $35.0 million in the three months ended March 31, 2016 compared to the same periodlast year. The increase was primarily due to Sponsored Updates from our field sales and self-service channels, partially offset by weakness indemand for our display advertising products. Sponsored content represented approximately 56% of Marketing Solutions revenue in the threemonths ended March 31, 2016 , and we expect it to continue to represent a larger percentage of Marketing Solutions revenue as we continue to shiftto content marketing and experience less demand for display advertising products. In addition, in 2016, Bizo-related product revenue will decline aswe discontinue the standalone products and work to migrate the functionality from the Bizo-related products into our Sponsored Content platform,making the technology accessible to any Marketing Solutions customer.
Net revenue from our Premium Subscriptions increased $26.7 million in the three months ended March 31, 2016 compared to the same periodlast year primarily due to the increase in revenue from our Sales Solutions products, which include Sales Navigator. Our Sales Solutions productscontinue to grow at a higher rate than our other Premium Subscription products as well as continue to represent a larger percentage of totalPremium Subscriptions revenue. Sales Navigator represented approximately 40% of Premium Subscriptions revenue in the three months endedMarch 31, 2016 .
32
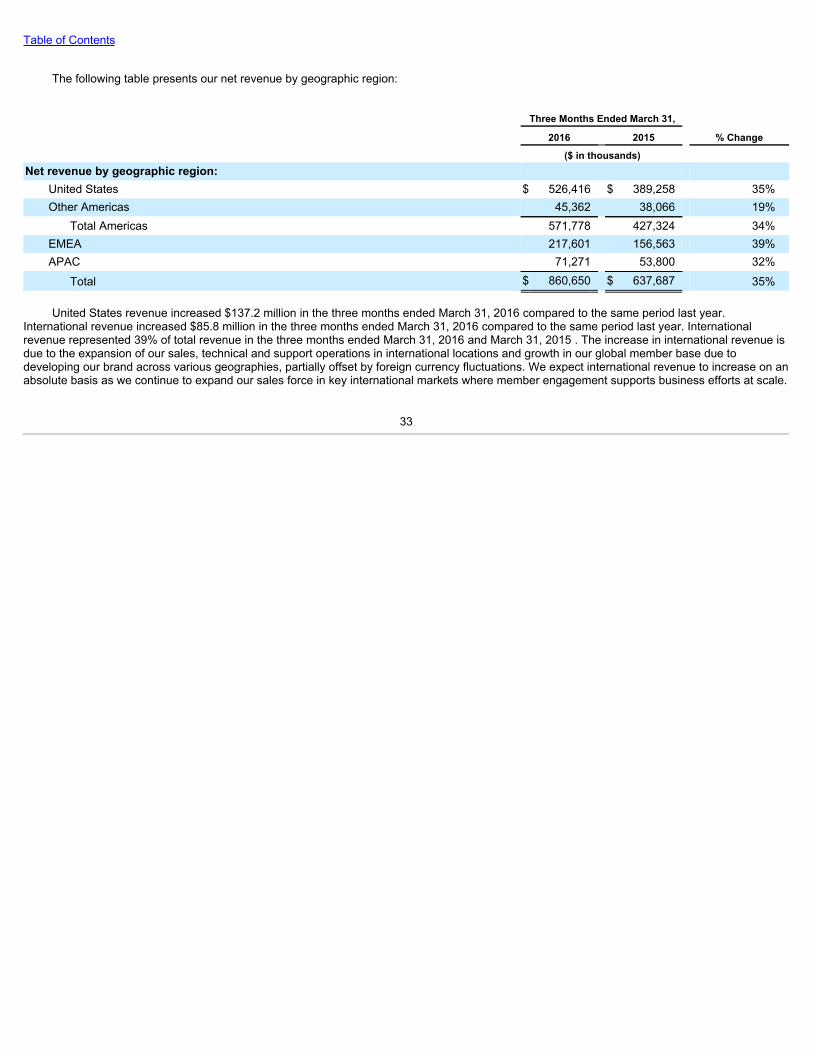
Table of Contents
The following table presents our net revenue by geographic region:
Three Months Ended March 31, 2016 2015 % Change
($ in thousands) Net revenue by geographic region:
United States $ 526,416 $ 389,258 35%Other Americas 45,362 38,066 19%
Total Americas 571,778 427,324 34%EMEA 217,601 156,563 39%APAC 71,271 53,800 32%
Total $ 860,650 $ 637,687 35%
United States revenue increased $137.2 million in the three months ended March 31, 2016 compared to the same period last year.International revenue increased $85.8 million in the three months ended March 31, 2016 compared to the same period last year. Internationalrevenue represented 39% of total revenue in the three months ended March 31, 2016 and March 31, 2015 . The increase in international revenue isdue to the expansion of our sales, technical and support operations in international locations and growth in our global member base due todeveloping our brand across various geographies, partially offset by foreign currency fluctuations. We expect international revenue to increase on anabsolute basis as we continue to expand our sales force in key international markets where member engagement supports business efforts at scale.
33
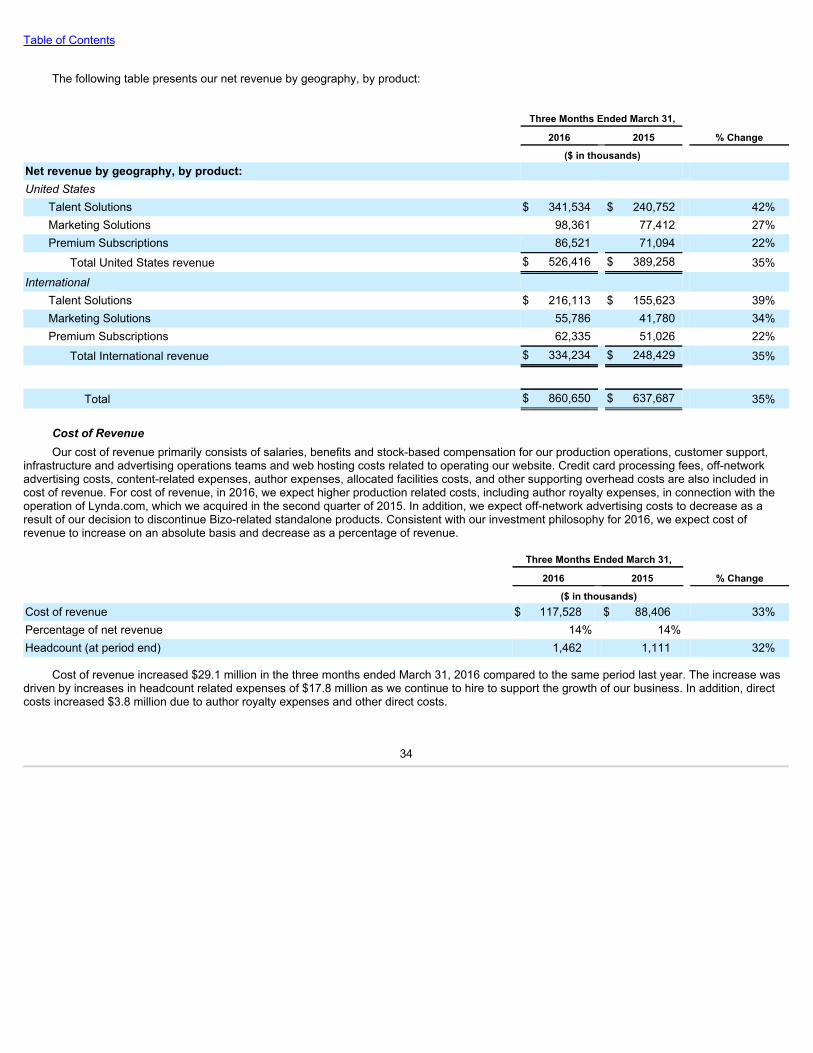
Table of Contents
The following table presents our net revenue by geography, by product:
Three Months Ended March 31, 2016 2015 % Change
($ in thousands) Net revenue by geography, by product: United States
Talent Solutions $ 341,534 $ 240,752 42%Marketing Solutions 98,361 77,412 27%Premium Subscriptions 86,521 71,094 22%
Total United States revenue $ 526,416 $ 389,258 35%International
Talent Solutions $ 216,113 $ 155,623 39%Marketing Solutions 55,786 41,780 34%Premium Subscriptions 62,335 51,026 22%
Total International revenue $ 334,234 $ 248,429 35%
Total $ 860,650 $ 637,687 35%
Cost of RevenueOur cost of revenue primarily consists of salaries, benefits and stock-based compensation for our production operations, customer support,
infrastructure and advertising operations teams and web hosting costs related to operating our website. Credit card processing fees, off-networkadvertising costs, content-related expenses, author expenses, allocated facilities costs, and other supporting overhead costs are also included incost of revenue. For cost of revenue, in 2016, we expect higher production related costs, including author royalty expenses, in connection with theoperation of Lynda.com, which we acquired in the second quarter of 2015. In addition, we expect off-network advertising costs to decrease as aresult of our decision to discontinue Bizo-related standalone products. Consistent with our investment philosophy for 2016, we expect cost ofrevenue to increase on an absolute basis and decrease as a percentage of revenue.
Three Months Ended March 31, 2016 2015 % Change
($ in thousands) Cost of revenue $ 117,528 $ 88,406 33%Percentage of net revenue 14% 14% Headcount (at period end) 1,462 1,111 32%
Cost of revenue increased $29.1 million in the three months ended March 31, 2016 compared to the same period last year. The increase wasdriven by increases in headcount related expenses of $17.8 million as we continue to hire to support the growth of our business. In addition, directcosts increased $3.8 million due to author royalty expenses and other direct costs.
34

Table of Contents
Sales and MarketingOur sales and marketing expenses primarily consist of salaries, benefits, stock-based compensation, travel expense and incentive
compensation for our sales and marketing employees. In addition, sales and marketing expenses include customer acquisition marketing, branding,advertising, public relations costs, and commissions paid to agencies, as well as allocated facilities and other supporting overhead costs. We plan tocontinue to invest heavily in sales and marketing to expand our global footprint, grow our current customer accounts and continue building brandawareness. Consistent with our investment philosophy for 2016 , we expect sales and marketing expenses to increase on an absolute basis andremain flat as a percentage of revenue.
Three Months Ended March 31, 2016 2015 % Change
($ in thousands) Sales and marketing $ 301,786 $ 229,636 31%Percentage of net revenue 35% 36% Headcount (at period end) 4,396 3,492 26%
Sales and marketing expenses increased $72.2 million in the three months ended March 31, 2016 compared to the same period last year. Theincrease was driven by an increase in headcount related expenses of $56.6 million as we continue to expand our field sales organization globally.We also experienced an increase of $8.7 million in marketing related expenses, primarily related to online marketing for our Learning andDevelopment subscriptions.
Product DevelopmentOur product development expenses primarily consist of salaries, benefits and stock-based compensation for our engineers, product managers
and developers. In addition, product development expenses include outside services and consulting, as well as allocated facilities, and othersupporting overhead costs. We believe that continued investment in features, software development tools, and code modification is important toachieving our strategic objectives. Consistent with our investment philosophy for 2016 , we expect to continue to invest heavily in productdevelopment. Accordingly, we expect product development expense to increase on an absolute basis and remain flat as a percentage of revenue.
Three Months Ended March 31, 2016 2015 % Change
($ in thousands) Product development $ 237,620 $ 165,580 44%Percentage of net revenue 28% 26% Headcount (at period end) 2,581 1,949 32%
Product development expenses increased $72.0 million in the three months ended March 31, 2016 compared to the same period last year.The increase was driven by an increase in headcount related expenses of $60.4 million as a result of our focus on developing new features andproducts that create value for our members.
35

Table of Contents
General and AdministrativeOur general and administrative expenses primarily consist of salaries, benefits and stock-based compensation for our executive, finance, legal,
information technology, human resources and other administrative employees. In addition, general and administrative expenses include outsideconsulting, legal and accounting services, and facilities and other supporting overhead costs not allocated to other departments. Consistent with ourinvestment philosophy for 2016 , we expect general and administrative expenses to increase on an absolute basis and decrease as a percentage ofrevenue.
Three Months Ended March 31, 2016 2015 % Change
($ in thousands) General and administrative $ 127,650 $ 97,313 31%Percentage of net revenue 15% 15% Headcount (at period end) 1,293 1,081 20%
General and administrative expenses increased $30.3 million in the three months ended March 31, 2016 compared to the same period lastyear. The increase was driven by an increase in headcount related expenses of $20.2 million to support our overall growth. In addition, weexperienced an increase in bad debt and other expenses of $6.3 million.
Depreciation and AmortizationDepreciation and amortization expenses primarily consist of depreciation on computer equipment, software, leasehold improvements,
capitalized software development costs, and amortization of purchased intangibles. We expect that depreciation and amortization expenses willincrease on an absolute basis, and increase as a percentage of revenue as we continue to expand our technology and facilities infrastructure.
Three Months Ended March 31, 2016 2015 % Change
($ in thousands) Depreciation and amortization $ 142,285 $ 73,972 92%Percentage of net revenue 17% 12%
Depreciation and amortization expenses increased $68.3 million in the three months ended March 31, 2016 compared to the same period lastyear. The increase in depreciation expense of $32.8 million in the three months ended March 31, 2016 compared to the same period last year wasthe result of the build out of our data centers, increases in leasehold improvements as we lease additional facilities to accommodate our headcountgrowth, and increases in capitalized website and internal-use software. The increase in amortization expense of $35.5 million in the three monthsended March 31, 2016 compared to the same period last year was primarily the result of amortization of customer relationships and content from ouracquisition of Lynda.com in 2015.
Other Expense, NetOther expense, net consists primarily of the interest expense from our convertible senior notes, income earned on our investments, fair value
adjustments on our other derivative, and foreign exchange gains and losses. Hedging strategies that we have implemented or may implement tomitigate foreign exchange risk may not eliminate our exposure to foreign exchange fluctuations.
36
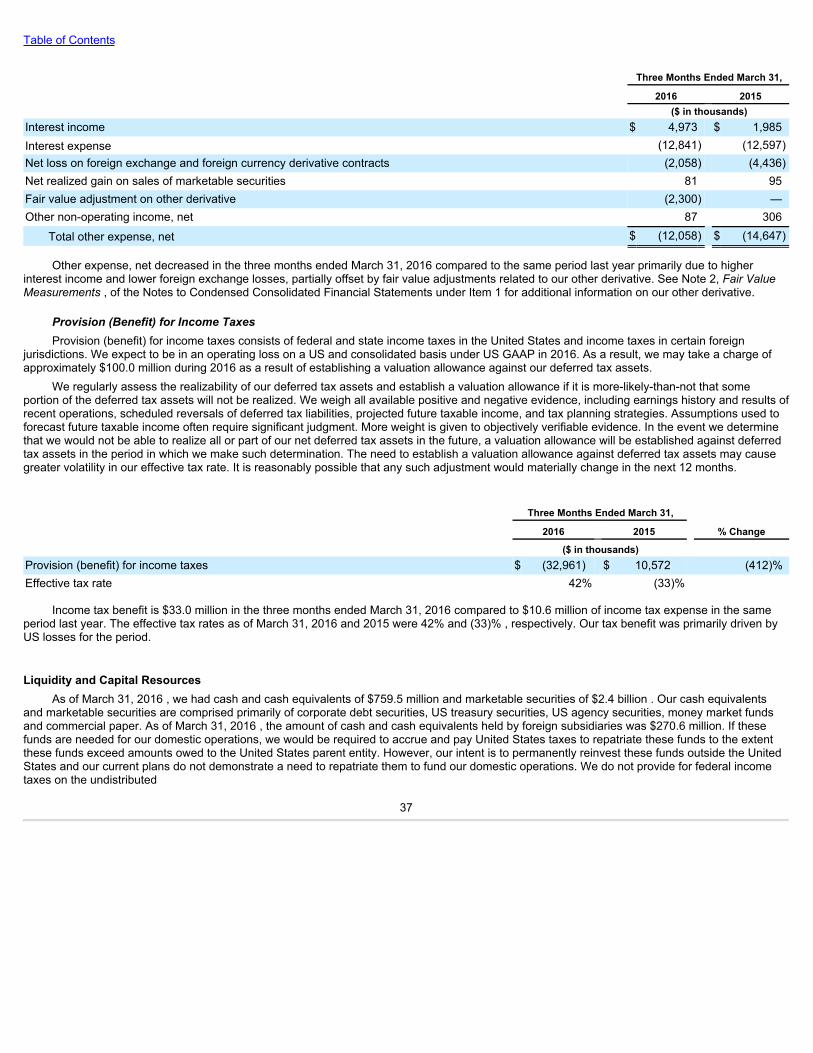
Table of Contents
Three Months Ended March 31,
2016 2015 ($ in thousands)Interest income $ 4,973 $ 1,985Interest expense (12,841) (12,597)Net loss on foreign exchange and foreign currency derivative contracts (2,058) (4,436)Net realized gain on sales of marketable securities 81 95Fair value adjustment on other derivative (2,300) —Other non-operating income, net 87 306
Total other expense, net $ (12,058) $ (14,647)
Other expense, net decreased in the three months ended March 31, 2016 compared to the same period last year primarily due to higherinterest income and lower foreign exchange losses, partially offset by fair value adjustments related to our other derivative. See Note 2, Fair ValueMeasurements , of the Notes to Condensed Consolidated Financial Statements under Item 1 for additional information on our other derivative.
Provision (Benefit) for Income TaxesProvision (benefit) for income taxes consists of federal and state income taxes in the United States and income taxes in certain foreign
jurisdictions. We expect to be in an operating loss on a US and consolidated basis under US GAAP in 2016. As a result, we may take a charge ofapproximately $100.0 million during 2016 as a result of establishing a valuation allowance against our deferred tax assets.
We regularly assess the realizability of our deferred tax assets and establish a valuation allowance if it is more-likely-than-not that someportion of the deferred tax assets will not be realized. We weigh all available positive and negative evidence, including earnings history and results ofrecent operations, scheduled reversals of deferred tax liabilities, projected future taxable income, and tax planning strategies. Assumptions used toforecast future taxable income often require significant judgment. More weight is given to objectively verifiable evidence. In the event we determinethat we would not be able to realize all or part of our net deferred tax assets in the future, a valuation allowance will be established against deferredtax assets in the period in which we make such determination. The need to establish a valuation allowance against deferred tax assets may causegreater volatility in our effective tax rate. It is reasonably possible that any such adjustment would materially change in the next 12 months.
Three Months Ended March 31, 2016 2015 % Change
($ in thousands) Provision (benefit) for income taxes $ (32,961) $ 10,572 (412)%Effective tax rate 42% (33)%
Income tax benefit is $33.0 million in the three months ended March 31, 2016 compared to $10.6 million of income tax expense in the sameperiod last year. The effective tax rates as of March 31, 2016 and 2015 were 42% and (33)% , respectively. Our tax benefit was primarily driven byUS losses for the period.
Liquidity and Capital ResourcesAs of March 31, 2016 , we had cash and cash equivalents of $759.5 million and marketable securities of $2.4 billion . Our cash equivalents
and marketable securities are comprised primarily of corporate debt securities, US treasury securities, US agency securities, money market fundsand commercial paper. As of March 31, 2016 , the amount of cash and cash equivalents held by foreign subsidiaries was $270.6 million. If thesefunds are needed for our domestic operations, we would be required to accrue and pay United States taxes to repatriate these funds to the extentthese funds exceed amounts owed to the United States parent entity. However, our intent is to permanently reinvest these funds outside the UnitedStates and our current plans do not demonstrate a need to repatriate them to fund our domestic operations. We do not provide for federal incometaxes on the undistributed
37

Table of Contents
earnings of our foreign subsidiaries. However, we believe the income tax liability would be insignificant if these earnings were to be repatriated.
On February 19, 2016, we acquired Connectifier, an industry leader in machine learning-based searching and matching technology. The totalpurchase price for all of the outstanding equity interests of Connectifier was approximately $105.5 million , subject to adjustment, in combination ofapproximately 46% cash and approximately 54% in our Class A common stock and equity awards.
We believe that our existing cash and cash equivalents and marketable securities balances, together with cash generated from operations, willbe sufficient to meet our working capital expenditure requirements for at least the next 12 months.
March 31,
2016 December 31,
2015 (in thousands)Consolidated Balance Sheet Data:
Cash and cash equivalents $ 759,451 $ 546,237Marketable securities $ 2,400,187 $ 2,573,145Convertible senior notes, net $ 1,138,264 $ 1,126,534
Three Months Ended March 31,
2016 2015 (in thousands)Consolidated Statements of Cash Flows Data:
Cash flows provided by operating activities $ 252,187 $ 165,132Cash flows provided by (used in) investing activities (41,419) 371,304Cash flows provided by financing activities 125 26,739Effect of exchange rate changes on cash and cash equivalents 2,321 (6,775)
Change in cash and cash equivalents $ 213,214 $ 556,400
Free Cash Flow
To provide investors with additional information regarding our financial results, we disclose free cash flow, a non-GAAP financial measure. Thefollowing table presents a reconciliation of free cash flows to cash flows provided by operating activities, the most directly comparable US GAAPfinancial measure.
We define free cash flow as cash provided by operating activities less cash flows from purchases of property and equipment. We believe freecash flow is an important liquidity metric because it measures, during a given period, the amount of cash generated that is available for operationalexpenses and for long-term investments, including payments for acquisitions and intangible assets. Free cash flow is considered a non-GAAPfinancial measure, and, because of its limitations, you should consider free cash flow alongside other financial performance measures, including netloss attributable to common stockholders, operating loss, cash flow provided by operating activities, or any other measure of financial performanceor liquidity presented in accordance with US GAAP.
38

Table of Contents
Three Months Ended March 31,
2016 2015 (in thousands)Reconciliation of Free Cash Flow:
Cash flows provided by operating activities $ 252,187 $ 165,132Purchases of property and equipment (177,480) (90,121)
Free cash flow $ 74,707 $ 75,011
Operating ActivitiesOperating activities provided $252.2 million of cash in the three months ended March 31, 2016 . The cash flow from operating activities
consisted primarily of the changes in our operating assets and liabilities, with an increase in deferred revenue of $76.0 million and a decrease inaccounts receivable of $11.9 million , partially offset by a decrease in accounts payable and other liabilities of $45.1 million , an increase in prepaidexpenses and other assets of $29.5 million and a decrease in income taxes, net of $35.0 million . The increase in our deferred revenue wasprimarily due to increases in transaction volumes in the three months ended March 31, 2016 . We had a net loss in the three months endedMarch 31, 2016 of $45.3 million , which included non-cash stock-based compensation of $146.1 million and non-cash depreciation and amortizationof $142.3 million .
Operating activities provided $165.1 million of cash in the three months ended March 31, 2015. The cash flow from operating activitiesconsisted primarily of the changes in our operating assets and liabilities, with an increase in deferred revenue of $63.4 million and a decrease inaccounts receivable of $29.5 million, partially offset by a decrease in accounts payable and other liabilities of $40.7 million, an increase in prepaidexpenses and other assets of $34.6 million, and excess tax benefit from stock-based compensation of $18.2 million, which is reclassified as afinancing activity. The increase in our deferred revenue was primarily due to increases in transaction amounts in the three months ended March 31,2015. We had a net loss in the three months ended March 31, 2015 of $42.4 million, which included non-cash stock-based compensation of $103.1million and non-cash depreciation and amortization of $74.0 million.
Investing ActivitiesOur primary investing activities consisted of purchases of marketable securities, purchases of property and equipment, as well as payments for
acquisitions and intangible assets. We continued to invest in technology hardware to support our growth, software to support website functionalitydevelopment, website operations and our corporate infrastructure. Purchases of property and equipment may vary from period to period due to thetiming of the expansion of our operations. We expect our planned purchases of property and equipment for 2016 to increase in absolute dollars, butbe consistent as a percentage of revenue compared to last year, and these may be impacted by the timing and extent of data center and facilityexpansions.
In the three months ended March 31, 2016 , we had purchases of property and equipment of $177.5 million and payments for intangible assetsand acquisitions, net of cash acquired of $40.4 million , offset by net purchases, sales, and maturities of investments of $173.5 million . Inthe three months ended March 31, 2015, we had net sales and maturities of investments of $467.0 million and purchases of property and equipmentof $90.1 million.
Financing ActivitiesIn the three months ended March 31, 2016 , and 2015 , our financing activities consisted primarily of net proceeds from the issuance of
common stock from employee stock option exercises, as well as the excess tax benefit from stock-based compensation. Additionally, in the threemonths ended March 31, 2016 , we had repurchases of equity awards of $3.3 million .
Off Balance Sheet Arrangements
In the ordinary course of business, we provide standby letters of credit or other guarantee instruments to third parties primarily for facilityleases. As of March 31, 2016 , we had financial guarantees of $52.7 million that were not recorded on our condensed consolidated balance sheetthat consisted of standby letters of credit and surety bonds. We had no other off balance sheet arrangements as defined in Item (303)(a)(4) ofRegulation S-K.
39
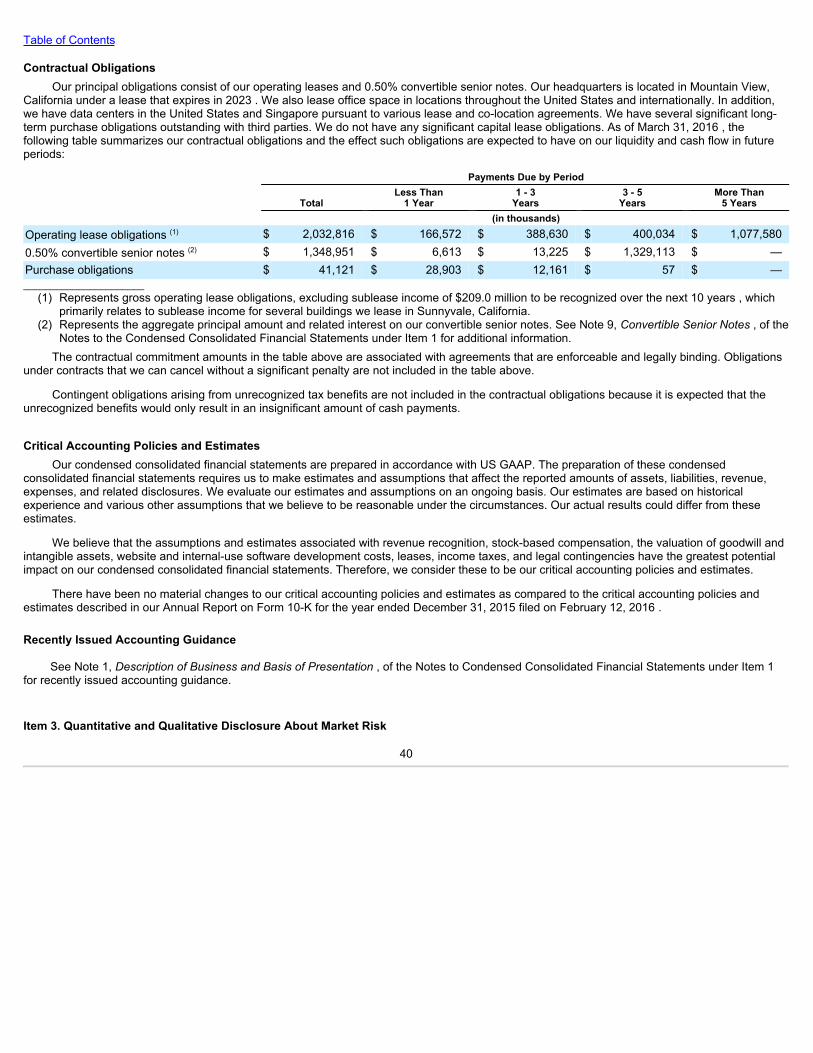
Table of Contents
Contractual ObligationsOur principal obligations consist of our operating leases and 0.50% convertible senior notes. Our headquarters is located in Mountain View,
California under a lease that expires in 2023 . We also lease office space in locations throughout the United States and internationally. In addition,we have data centers in the United States and Singapore pursuant to various lease and co-location agreements. We have several significant long-term purchase obligations outstanding with third parties. We do not have any significant capital lease obligations. As of March 31, 2016 , thefollowing table summarizes our contractual obligations and the effect such obligations are expected to have on our liquidity and cash flow in futureperiods:
Payments Due by Period
Total Less Than
1 Year 1 - 3
Years 3 - 5
Years More Than
5 Years (in thousands)Operating lease obligations (1) $ 2,032,816 $ 166,572 $ 388,630 $ 400,034 $ 1,077,5800.50% convertible senior notes (2) $ 1,348,951 $ 6,613 $ 13,225 $ 1,329,113 $ —Purchase obligations $ 41,121 $ 28,903 $ 12,161 $ 57 $ —______________________
(1) Represents gross operating lease obligations, excluding sublease income of $209.0 million to be recognized over the next 10 years , whichprimarily relates to sublease income for several buildings we lease in Sunnyvale, California.
(2) Represents the aggregate principal amount and related interest on our convertible senior notes. See Note 9, Convertible Senior Notes , of theNotes to the Condensed Consolidated Financial Statements under Item 1 for additional information.
The contractual commitment amounts in the table above are associated with agreements that are enforceable and legally binding. Obligationsunder contracts that we can cancel without a significant penalty are not included in the table above.
Contingent obligations arising from unrecognized tax benefits are not included in the contractual obligations because it is expected that theunrecognized benefits would only result in an insignificant amount of cash payments.
Critical Accounting Policies and EstimatesOur condensed consolidated financial statements are prepared in accordance with US GAAP. The preparation of these condensed
consolidated financial statements requires us to make estimates and assumptions that affect the reported amounts of assets, liabilities, revenue,expenses, and related disclosures. We evaluate our estimates and assumptions on an ongoing basis. Our estimates are based on historicalexperience and various other assumptions that we believe to be reasonable under the circumstances. Our actual results could differ from theseestimates.
We believe that the assumptions and estimates associated with revenue recognition, stock-based compensation, the valuation of goodwill andintangible assets, website and internal-use software development costs, leases, income taxes, and legal contingencies have the greatest potentialimpact on our condensed consolidated financial statements. Therefore, we consider these to be our critical accounting policies and estimates.
There have been no material changes to our critical accounting policies and estimates as compared to the critical accounting policies andestimates described in our Annual Report on Form 10-K for the year ended December 31, 2015 filed on February 12, 2016 .
Recently Issued Accounting Guidance
See Note 1, Description of Business and Basis of Presentation , of the Notes to Condensed Consolidated Financial Statements under Item 1for recently issued accounting guidance.
Item 3. Quantitative and Qualitative Disclosure About Market Risk
40

Table of Contents
We have operations both within the United States and internationally, and we are exposed to market risks in the ordinary course of ourbusiness. These risks include primarily interest rate, foreign exchange risks and inflation.
Interest Rate Fluctuation RiskWe had cash, cash equivalents, and marketable securities of $3,159.6 million and $3,119.4 million as of March 31, 2016 and December 31,
2015 , respectively. This amount was invested primarily in money market funds and highly liquid investment grade fixed income securities. Thecash, cash equivalents, and marketable securities are held for working capital purposes. Our investment policy and strategy is focused on thepreservation of capital and supporting our liquidity requirements. We do not enter into investments for trading or speculative purposes. At March 31,2016 , the weighted-average duration of our investment portfolio was less than one year.
Our fixed-income portfolio is subject to fluctuations in interest rates, which could affect our results of operations. Based on our investmentportfolio balance as of March 31, 2016 , a hypothetical increase in interest rates of 1% (100 basis points) would have resulted in a decrease in thefair value of our portfolio of approximately $18.3 million, and a hypothetical increase in interest rates of 0.5% (50 basis points) would have resulted ina decrease in the fair value of our portfolio of approximately $9.1 million.
Foreign Currency Exchange RisksWe have foreign currency exchange risks related to our revenue and operating expenses denominated in currencies other than the United
States dollar, principally the Euro, the British Pound Sterling, the Australian dollar, and the Canadian dollar. The volatility of exchange rates dependson many factors that we cannot forecast with reliable accuracy. We have experienced and will continue to experience fluctuations in foreignexchange gains (losses) related to changes in foreign currency exchange rates. In the event our foreign currency denominated assets, liabilities,sales or expenses increase, our operating results may be more greatly affected by fluctuations in the exchange rates of the currencies in which wedo business.
We enter into foreign currency derivative contracts to reduce the risk that our cash flows and earnings will be adversely affected by foreigncurrency exchange rate fluctuations.
Cash Flow Hedges
We use foreign currency derivative contracts designated as cash flow hedges to hedge forecasted revenue transactions denominated incurrencies other than the US dollar. Our cash flow hedges are carried at fair value with gains or losses initially recorded as a component ofAccumulated other comprehensive loss in stockholders’ equity and subsequently reclassified into revenue when the underlying hedged revenue isrecognized.
Balance Sheet Hedges
We use other foreign currency derivative contracts not designated as hedging instruments (“balance sheet hedges”) to reduce exchange raterisk associated with our foreign currency denominated monetary assets and liabilities. These balance sheet hedges are carried at fair value withchanges in the fair value recorded to other income (expense), net in our condensed consolidated statements of operations. These contracts do notsubject us to material financial statement risk due to exchange rate movements because gains and losses on these derivatives are intended tooffset gains and losses on the hedged foreign currency denominated assets and liabilities.
As of March 31, 2016 , we had total outstanding foreign currency derivative contracts with a total notional amount of $691.7 million . If overallforeign currency exchange rates appreciated uniformly by 5% against the US Dollar, our foreign currency derivative contracts outstanding as ofMarch 31, 2016 would experience a loss of approximately $16.5 million.
Market Risk and Market Interest RiskOn November 12, 2014, we issued $1,322.5 million aggregate principal amount of 0.50% convertible senior notes (the “Notes”). Holders may
convert their notes prior to maturity under certain circumstances. Upon conversion, we will pay or deliver, as the case may be, cash, shares of ourClass A common stock, or a combination of cash and shares of our Class A common stock, at our election. We intend to settle the principal andinterest due on the Notes in cash. Concurrent with the issuance of the Notes, we purchased options (“Note Hedges”) and sold warrants, in order toreduce the potential economic dilution upon conversion of the Notes.
41

Table of Contents
We do not have economic interest rate exposure related to the Notes, as they have a fixed annual interest rate of 0.50%. We do, however,have interest rate risk because the fair value of our Notes will generally increase when interest rates fall and decrease when interest rates rise.Additionally, the fair value of our Notes may be impacted by the price of our Class A common stock. As of March 31, 2016 , the estimated fair valueof our Notes was $1,197.3 million based on the closing trading price of the Notes as of the last day of trading for the period. See Note 9, ConvertibleSenior Notes , of the Notes of the Condensed Consolidated Financial Statements under Item 1 for additional information on the Notes, including thecarrying value of the Notes.
The embedded features on the preferred stock of our joint venture are accounted for as a derivative instrument, which is measured at fairvalue each reporting period. Management is required to make significant estimates to determine the fair value, and those estimates can be affectedby market volatility. The financial impact to future periods will depend on changes in fair value of the derivative instruments, which is correlated withthe performance and value of the Company's joint venture, and will be recorded in Other income (expense), net. Over the life of the derivative, thecumulative fair value adjustments in the condensed consolidated statement of operations could be up to $155.0 million.
Inflation RiskWe do not believe that inflation has had a material effect on our business, financial condition or results of operations. If our costs were to
become subject to significant inflationary pressures, we may not be able to fully offset such higher costs through price increases. Our inability orfailure to do so could harm our business, financial condition and results of operations.
Item 4. Controls and ProceduresEvaluation of Disclosure Controls and Procedures
Our management, with the participation of our principal executive officer and principal financial officer, has evaluated the effectiveness of ourdisclosure controls and procedures (as defined in Rules 13a-15(e) and 15d-15(e) under the Securities Exchange Act of 1934, as amended (the“Exchange Act”)), as of the end of the period covered by this Quarterly Report on Form 10-Q. Based on such evaluation, our Principal ExecutiveOfficer and Principal Financial Officer have concluded that as of such date, our disclosure controls and procedures were effective.
Changes in Internal ControlThere were no changes in our internal control over financial reporting identified in management’s evaluation pursuant to Rules 13a-15(d) or
15d-15(d) of the Exchange Act during the period covered by this Quarterly Report on Form 10-Q that materially affected, or are reasonably likely tomaterially affect, our internal control over financial reporting.
42

Table of Contents
Part II. Other Information
Item 1. Legal Proceedings
We are subject to legal proceedings and litigation arising in the ordinary course of business, including, but not limited to, certain pendingpatent and privacy matters, including class action lawsuits, as well as inquiries, investigations, audits and other regulatory proceedings. Althoughoccasional adverse decisions or settlements may occur, we do not believe that the final disposition of any of these matters will have a materialadverse effect on our business. Certain of these matters include speculative claims for substantial or indeterminate amounts of damages, andinclude claims for injunctive relief. Additionally, our litigation costs can be significant. Other regulatory matters could result in fines and penaltiesbeing assessed against us, and we may become subject to periodic audits, which would likely increase our regulatory compliance costs. Adverseresults of litigation or regulatory matters could also result in us being required to change our business practices, which could negatively impact ourmembership and revenue growth.
We record a liability when we believe that it is both probable that a loss has been incurred and the amount can be reasonably estimated.Periodically, we evaluate developments in our legal matters that could affect the amounts that have been previously accrued, if any, and makeadjustments as appropriate. Significant judgment is required to determine both likelihood of there being, and the estimated amount of, a loss relatedto such matters, and our judgment may be incorrect. The outcome of any proceeding is not determinable in advance. Until the final resolution of anysuch matters that we may be required to accrue for, we may be exposed to loss in excess of the amount accrued, and such amounts could bematerial.
Item 1A. Risk Factors
RISK FACTORS
Investing in our Class A common stock involves a high degree of risk. You should carefully consider the risks and uncertainties describedbelow, together with all of the other information in this Quarterly Report on Form 10-Q, including our condensed consolidated financial statementsand related notes, before deciding whether to purchase shares of our Class A common stock. If any of the following risks are realized, our business,operating results and prospects could be materially and adversely affected. In that event, the price of our Class A common stock could decline, andyou could lose part or all of your investment.
Risks Related to Our Business
Our core value of putting our members first may conflict with the short-term interests of our business.
One of our core values is to make decisions based on the best long-term interests of our members, which we believe is essential to oursuccess in increasing our member growth rate and engagement, creating value for our members and in serving the best, long-term interests of thecompany and our stockholders. Therefore, in the past, we have forgone, and may in the future forgo, certain expansion or short-term revenueopportunities that we do not believe are in the best interests of our members, even if our decision negatively impacts our operating results in theshort term. In addition, our philosophy of putting our members first may cause disagreements, or negatively impact our relationships, with ourexisting or prospective customers. This could result in enterprises and professional organizations blocking access to our services or refusing topurchase our Talent Solutions (including Learning and Development products), Marketing Solutions or Premium Subscriptions (including SalesSolutions). Our decisions may not result in the long-term benefits that we expect, in which case our member engagement, business and operatingresults could be harmed.
We may not timely and effectively scale and adapt our existing technology and network infrastructure to ensure that our services andsolutions are accessible within an acceptable load time. Additionally, natural disasters or other catastrophic occurrences beyond ourcontrol could interfere with access to our services.
A key element to our continued growth is the ability of our members, users (whom we define as anyone who visits one of our websites througha computer or application on a mobile device, regardless of whether or not they are a member), enterprises and professional organizations in allgeographies to access our websites, services and solutions within acceptable load times. We call this website performance. We have experienced,and may in the future experience, service disruptions, outages and other performance problems due to a variety of factors,
43

Table of Contents
including infrastructure changes, human or software errors, capacity constraints due to an overwhelming number of users accessing our servicessimultaneously, and denial of service or fraud or security attacks. In some instances, we may not be able to identify the cause or causes of thesewebsite performance problems within an acceptable period of time. We expect it will become increasingly difficult to maintain and improve ourwebsite performance, especially during peak usage times and as our solutions become more complex and our total user traffic increases. If ourservices are unavailable when users attempt to access them or they do not load as quickly as users expect, users may seek other websites orservices to obtain the information for which they are looking, and may not return to our website or use our services as often in the future, or at all.This would negatively impact our ability to attract members, enterprises and professional organizations and increase engagement of our membersand users. We expect to continue to make significant investments to maintain and improve website performance and to enable rapid releases ofnew features and products. To the extent that we do not effectively address capacity constraints, upgrade our systems as needed and continuallydevelop our technology and network architecture to accommodate actual and anticipated changes in technology, our business and operating resultsmay be harmed.
We have implemented a disaster recovery program, which allows us to move production traffic to a backup data center in the event of acatastrophe. For the majority of our services, we serve traffic out of multiple data centers in parallel. This allows us the ability to move trafficimmediately and, in the event of a problem, the ability to recover in a short period of time. However, some of our services have not yet migrated tothis model and still operate solely in a primary data center. In the event of a disaster, these services would remain shut down during the transition toa backup data center. To the extent our disaster recovery program does not effectively support the movement of traffic in a timely or completemanner in the event of a catastrophe, our business and operating results may be harmed.
Our systems are also vulnerable to damage or interruption from catastrophic occurrences such as earthquakes, floods, fires, power loss,telecommunication failures, terrorist attacks and similar events. Our US corporate offices and certain of the facilities we lease to house our computerand telecommunications equipment are located in the San Francisco Bay Area and Southern California, both regions known for seismic activity.Despite any precautions we may take, the occurrence of a natural disaster or other unanticipated problems at our hosting facilities could result inlengthy interruptions in our services.
We do not carry business interruption insurance sufficient to compensate us for the potentially significant losses, including the potential harmto the growth of our business that may result from interruptions in our service as a result of system failures.
If our security measures are compromised, or if our websites are subject to attacks that degrade or deny the ability of members orcustomers to access our solutions, or if our member data is compromised, members and customers may curtail or stop use of oursolutions.
Our solutions involve the collection, processing, storage, sharing, disclosure and usage of members’ and customers’ information andcommunications, some of which may be private. We also work with third party vendors to process credit card payments by our customers and aresubject to payment card association operating rules. We are vulnerable to software bugs, computer viruses, break-ins, phishing attacks, employeeerrors or malfeasance, attempts to overload our servers with denial-of-service or other attacks and similar disruptions from unauthorized use of ourcomputer systems, any of which could lead to interruptions, delays, or website shutdowns, causing loss of critical data or the unauthorizeddisclosure or use of personally identifiable or confidential information. For example, in June 2012, approximately 6.5 million of our members’encrypted passwords were stolen and published on an unauthorized website. If we experience compromises to our security that result in websiteperformance or availability problems, the complete shutdown of our websites, or the actual or perceived loss or unauthorized disclosure or use ofconfidential information, such as credit card information, our members or customers may be harmed or lose trust and confidence in us, anddecrease the use of our website, mobile applications and services or stop using our services in their entirety, and we would suffer reputational andfinancial harm.
In addition, we may be subject to regulatory investigations or litigation in connection with a security breach or related issue, and we could alsobe liable to third parties for these types of breaches. Such litigation, regulatory investigations and our technical activities intended to prevent futuresecurity breaches are likely to require additional management resources and expenditures. If our security measures fail to protect this informationadequately or we fail to comply with the applicable credit card association operating rules, we could be liable to both our customers for their losses,as well as the vendors under our agreements with them, we could be subject to fines and higher transaction fees, we could face regulatory action,and our customers and vendors could end their relationships with us, any of which could harm our business and financial results.
44
Table of Contents
If our members' profiles are out-of-date, inaccurate or lack the information that users and customers want to see, we may not be able torealize the full potential of our network, which could adversely impact our business.
If our members do not update their information or provide accurate and complete information when they join LinkedIn, or do not establishsufficient connections, the value of our network may be negatively impacted because our value proposition as a professional network and as asource of accurate and comprehensive data will be weakened. For example, customers of our Talent Solutions may not find members that meettheir qualifications or may misidentify a candidate as having such qualifications, which could result in mismatches that erode customer confidence inour solutions, or our learning and development solutions may not suit our customers’ needs. Similarly, incomplete or outdated member informationwould diminish the ability of our Marketing or Sales Solutions customers to reach their target audiences and our ability to provide our customers withvaluable insights. Therefore, we must provide features and products that demonstrate the value of our network to our members and motivate themto contribute additional, timely and accurate information to their profile and our network. If we fail to successfully motivate our members to do so, ourbusiness and operating results could be adversely affected.
If we are unable to effectively operate on mobile devices, our business could be adversely affected.
The number of people who access online services through mobile devices, such as smart phones, handheld tablets and mobile telephones, asopposed to personal computers, has increased dramatically in the past few years and is projected to continue to increase. If the mobile solutions wehave developed do not meet the needs of prospective members, current members or customers, they may not sign up or reduce their usage of ourplatform and our business could suffer. Additionally, we are dependent on the interoperability of LinkedIn with popular mobile operating systems,networks and standards that we do not control, such as Android and iOS operating systems, and any changes in such systems and terms of servicethat degrade our solutions’ functionality, give preferential treatment to competitive products or prevent our ability to promote advertising couldadversely affect traffic and monetization on mobile devices. We may not be successful in maintaining and developing relationships with keyparticipants in the mobile industry or in developing products that operate effectively with these technologies, systems, networks, or standards. Eachmanufacturer or distributor may establish unique technical standards for its devices, and our products and services may not work, or be easilyaccessible or viewable on these devices as a result. Some manufacturers may also elect not to include our products on their devices, or we mayhave difficulty preparing or loading our applications in app stores. As new devices and platforms are continually being released, it is difficult topredict the challenges we may encounter in developing versions of our solutions for use on these alternative devices, and we are devotingsignificant resources to the support and maintenance of such devices.
Growth in access to LinkedIn’s services through mobile devices as a substitute for access on personal computers may negatively affectour revenue and financial results.
Our members are increasingly accessing LinkedIn on mobile devices. While many of our members who use our online services on mobiledevices also access LinkedIn through personal computers, we have seen substantial growth in mobile usage. We are devoting valuable resourcesto solutions related to monetization of mobile usage, and cannot assure you that these solutions will be successful. Our members are increasinglyusing mobile devices as a substitute for access to our online services as opposed to personal computers, and if we are unable to successfullyimplement monetization strategies for our solutions on mobile devices, or these strategies are not as successful as our offerings for personalcomputers, or if we incur excessive expenses in this effort, our financial performance and ability to grow revenue would be negatively affected.
The tracking of certain of our performance metrics is done with internal tools and is not independently verified. Certain of ourperformance metrics are subject to inherent challenges in measurement, and real or perceived inaccuracies in such metrics may harmour reputation and negatively affect our business.
We track certain performance metrics, including number of registered members, unique visiting members and member page views, withinternal tools, which are not independently verified by any third party. Our internal tools have a number of limitations and our methodologies fortracking these metrics may change over time, which could result in unexpected changes to our metrics, including the metrics we report. If theinternal tools we use to track these metrics undercount or overcount performance or contain algorithm or other technical errors, the data we reportmay not be accurate. In addition, limitations or errors with respect to how we measure data (or the data that we measure) may affect ourunderstanding of certain details of our business, which could affect our longer term strategies. If our performance metrics are not accuraterepresentations of our business, member base or traffic levels; if we discover material inaccuracies in our metrics; or if the metrics we rely on totrack our performance do
45
Table of Contents
not provide an accurate measurement of our business, our reputation may be harmed and our operating and financial results could be adverselyaffected, causing our stock price to decline.
The number of our registered members is higher than the number of actual members and a substantial majority of our traffic is generatedby a minority of our members. Our business may be adversely impacted if we are unable to attract and retain additional members whoactively use our services.
The number of registered members in our network is higher than the number of actual members because some members have multipleregistrations, other members have died or become incapacitated, and others may have registered under fictitious names or created fraudulentaccounts. While the number of registered members represents what we believe to be reasonable estimates of our member base, there are inherentchallenges in ensuring that the number of registered members presents an accurate reflection of our member network. For example, we do not havea reliable system for identifying and counting duplicate or fraudulent accounts, or deceased, incapacitated or other non-members and so we rely onestimates and assumptions, which may not be accurate. In addition, our methodology for measuring our membership numbers, and specifically formaking estimates regarding non-members who should not be included as registered members, has changed over time and may continue to changefrom time to time. While we are using what we believe to be reasonable and appropriate methods of measuring the number of registered members,there are no methodologies available that would provide us with an exact number of non-actual member types of accounts. Therefore, we cannotassure you that our current or future methodologies are accurate, and we will need to continue to adjust them in the future from time to time, whichcould result in the number of registered members being lower or higher than expected. Further, a substantial majority of our members do not visitour websites on a monthly basis, and a substantial majority of our desktop and mobile traffic is generated by a minority of our members. If thenumber of our actual members does not meet our expectations, if the rate at which we add new members slows or declines or if we are unable toincrease the breadth and frequency of our visiting members, then our business may not grow as fast as we expect.
Our solutions and internal systems rely on software that is highly technical, and if it contains undetected errors, our business could beadversely affected.
Our solutions and internal systems rely on software that is highly technical and complex. In addition, our solutions and internal systems dependon the ability of our software to store, retrieve, process, and manage immense amounts of data. Our software has contained, and may now or in thefuture contain, undetected errors, bugs, or vulnerabilities. Some errors in our software may only be discovered after the code has been released forexternal or internal use. Errors or other design defects within our software may result in a negative experience for members or customers, delayproduct introductions or enhancements, or result in measurement or other errors. We also rely on third party software that may contain errors orbugs. Any errors, bugs, or defects discovered in our software or third party software we use could result in damage to our reputation, loss ofmembers, loss of revenue, or liability for damages, any of which could adversely affect our business and financial results.
We collect, process, store, share, disclose and use personal information and other data, which subjects us to governmental regulationsand other legal obligations related to privacy and security, and our actual or perceived failure to comply with such obligations could harmour business.
We collect, process, store, share, disclose and use information from and about our members, customers and users, including personalinformation and other data, and we enable our members to passively and proactively share their personal information with each other and with thirdparties and to communicate and share news and other information into and across our platform. There are numerous laws around the worldregarding privacy and security, including laws regarding the collection, processing, storage, sharing, disclosure, use and security of personalinformation and other data from and about our members and users. The scope of these laws is changing, subject to differing interpretations, may becostly to comply with, and may be inconsistent among countries and jurisdictions or conflict with other rules.
We strive to comply with applicable laws, policies, and legal obligations and certain applicable industry codes of conduct (such as the DigitalAdvertising Alliance’s self-regulatory principles for online behavioral advertising) relating to privacy and data protection and are subject to the termsof our privacy policies and privacy-related obligations to third parties. However, these obligations may be interpreted and applied in new ways and/orin a manner that is inconsistent from one jurisdiction to another and may conflict with other rules or our practices. Data privacy and security areactive areas and new laws and regulations are likely to be enacted.
Any failure or perceived failure by us to comply with our privacy policies, our privacy-related obligations to members, customers or other thirdparties, our data disclosure and consent obligations, or our privacy or security-
46

Table of Contents
related legal obligations, or any compromise of security that results in the unauthorized disclosure, transfer or use of personal or other information,which may include personally identifiable information or other member data, may result in governmental enforcement actions, litigation or publicstatements critical of us by consumer advocacy groups or others and could cause our members and customers to lose trust in us, which could havean adverse effect on our business. Additionally, if third parties we work with, such as customers, vendors or developers, violate applicable laws, ourpolicies or other privacy or security-related obligations, such violations may also put our members’ information at risk and could in turn have anadverse effect on our business. Governmental agencies may also request or take member or customer data for national security or informationalpurposes, and also can make data requests in connection with criminal or civil investigations or other matters, which could harm our reputation andour business.
In addition, the EU-US Safe Harbor program (“Safe Harbor”), which provided a valid legal basis for transfers of personal data from Europe tothe United States, has been held to be invalid, which has a significant impact on the transfer of data from the European Union to US companies,including us. While we have other legally recognized mechanisms in place that we believe allow for the transfer of EU member and customer andemployee information to the United States, it is possible that these mechanisms may also be challenged or evolve to include new legal requirementsthat could have an impact on how we move data from the European Union to LinkedIn entities outside the European Union. There is uncertainty asto whether or not the Privacy Shield, the expected replacement for the Safe Harbor, will be adopted and withstand legal and political challenges. Therequirements for the legal transfer of personal data between the US and the EU could impact our business and result in substantial expense toimplement, and it is unclear that it will be appropriate for us. For example, we may have to require some of our vendors who process personal datato take on additional privacy and security obligations, and some may refuse, causing us to incur potential disruption and expense related to ourbusiness processes. If our policies and practices, or those of our vendors, are, or are perceived to be, insufficient or if our members and customershave concerns regarding the transfer of data from the European Union to the United States, we could be subject to enforcement actions orinvestigations by individual EU Data Protection Authorities or lawsuits by private parties, member engagement could decline and our business couldbe negatively impacted.
Public scrutiny of Internet privacy and security issues may result in increased regulation and different industry standards, which coulddeter or prevent us from providing our current products and solutions to our members and customers, thereby harming our business.
The regulatory framework for privacy and security issues worldwide is evolving and is likely to remain in flux for the foreseeable future. Variousgovernment and consumer agencies have also called for new regulation and changes in industry practices. Practices regarding the registration,collection, processing, storage, sharing, disclosure, use and security of personal and other information by companies offering online services haverecently come under increased public scrutiny.
For example, the European Union recently enacted a new General Data Protection Regulation, which will become effective in mid-2018. TheGeneral Data Protection Regulation will likely result in greater compliance efforts for companies with users and operations in the European Unionand provides for fines of up to 4% of global annual revenues for noncompliance. The European Union is also considering an update to the EU’sPrivacy and Electronic Communications (e-Privacy) Directive to, among other things, amend the current directive’s rules on the use of cookies.
In the United States, the federal government, including the White House, the Federal Trade Commission, the Department of Commerce andCongress, and many state governments are reviewing the need for greater regulation of the collection, processing, storage, sharing, disclosure, useand security of information concerning consumer behavior with respect to online services, including regulations aimed at restricting certain targetedadvertising practices and collection and use of data from mobile devices. This review may result in new laws or the promulgation of new regulationsor guidelines. For example, the State of California and other states have passed laws relating to disclosure of companies’ practices with regard toDo-Not-Track signals from Internet browsers, the ability to delete information of minors, and new data breach notification requirements. Californiahas also adopted privacy guidelines with respect to mobile applications. Outside the European Union and the United States, a number of countrieshave adopted or are considering privacy laws and regulations that may result in greater compliance efforts .
In addition, government agencies and regulators have reviewed, are reviewing and will continue to review, the personal data practices ofonline media companies including our privacy and security policies and practices. The FTC in particular has approved consent decrees resolvingcomplaints and their resulting investigations into the
47
Table of Contents
privacy and security practices of a number of online social media companies. These reviews can and have resulted in changes to our products andpolicies, and could result in additional changes in the future. If we are unable to comply with any such reviews or decrees that result inrecommendations or binding changes, or if the recommended changes result in degradation of our products, our business could be harmed.
Our business, including our ability to operate and expand internationally or on new technology platforms, could be adversely affected iflegislation or regulations are adopted, interpreted or implemented in a manner that is inconsistent with our current business practices and thatrequire changes to these practices, the design of our websites, mobile applications, products, features or our privacy policy. In particular, thesuccess of our business has been, and we expect will continue to be, driven by our ability to responsibly gather and use data about our members.Therefore, our business could be harmed by any significant change to applicable laws, regulations or industry standards or practices regarding thestorage, use or disclosure of data our members choose to share with us, or regarding the manner in which the express or implied consent ofconsumers for such gathering, use and disclosure is obtained. Such changes may require us to modify our products and features, possibly in amaterial manner, and may limit our ability to develop new products and features that make use of the data that we collect about our members.
Our business is subject to a variety of US and foreign laws, many of which are unsettled and still developing and which could subject usto claims or otherwise harm our business.
We are subject to a variety of laws in the United States and abroad, including laws regarding privacy, data protection, data security, dataretention and consumer protection, accessibility, sending electronic messages, human resource services and the provision of online paymentservices, including credit card processing, which are continuously evolving and developing. In addition, some of our members are subject to lawsand/or licensing or certification obligations that may restrict their ability to engage with LinkedIn’s online services. The scope and interpretation of thelaws and other obligations that are or may be applicable to us or certain groups of our members are often uncertain and may be conflicting,particularly laws and other obligations outside the United States. For example, laws related to the online collection and dissemination of content ofothers and laws related to sending messages over online service are continuing to evolve and are being tested through legal actions based on,among other legal theories, invasion of privacy, defamation, spam, and other torts, unfair competition, copyright and trademark infringement, andcredit reporting.
In addition, regulatory authorities around the world are considering a number of legislative and regulatory proposals concerning privacy, spam,data storage, data protection, content regulation, cybersecurity, government access to personal information and other matters that may beapplicable to our business. Compliance with these laws may require substantial investment or may provide technical challenges for our business. Itis also likely that as our business grows, evolves, and an increasing portion of our business shifts to mobile, and our solutions are used in a greaternumber of countries and additional groups, we will become subject to laws and regulations in additional jurisdictions. Further, as our services andsolutions expand to include more content (including from third parties), additional laws and regulations may become applicable to our products andofferings including laws requiring us to restrict the showing of such content in certain jurisdictions or to certain groups of members, such asunderage users. In some cases, laws and legal obligations of various jurisdictions may be ambiguous or conflict as to LinkedIn’s right to gather,display and distribute certain content as part of its online services. Users of our site and our solutions could also abuse or misuse our products inways that violate laws or cause damage to our business. It is difficult to predict how existing laws will be applied to our business and whether we willbecome subject to new laws or legal obligations that will impact our business.
If we are not able to comply with these laws or other legal obligations or if we (or our members) become liable under these laws or legalobligations, or if our services are suspended or blocked, we could be directly harmed, and we may be forced to implement new measures to reduceexposure to this liability. This may require us to expend substantial resources or to discontinue certain solutions, which would negatively affect ourbusiness, financial condition and results of operations. In addition, the increased attention focused upon liability issues as a result of lawsuits andlegislative proposals could harm our reputation or otherwise impact the growth of our business. Any costs incurred as a result of this potential liabilitycould harm our business and operating results.
We face competition in the market for online professional networks from social networking sites and Internet search companies, amongothers, as well as continued competition for customers.
We face significant competition in all aspects of our business, and we expect such competition to increase, particularly in the market for onlineprofessional networks and engagement of professionals.
48

Table of Contents
Our industry is evolving rapidly and is becoming increasingly competitive. Larger and more established companies may focus on our marketand could directly compete with us. Smaller companies, including application developers, could also launch new products and services that competewith us and that could gain market acceptance quickly. We may also face competition if we shift our focus of development to new or differentproducts or separate areas of our business.
We expect our existing competitors in the markets for Talent Solutions (including Learning and Development), Marketing Solutions andPremium Subscriptions (including Sales Solutions) to continue to focus on these areas. A number of these companies may have greater resourcesthan us, which may enable them to compete more effectively. Specifically, we are investing significantly in our Marketing Solutions products withrespect to content and mobile solutions, and we may not be as successful as our competitors in generating revenue through new forms of contentmarketing or mobile advertising. Additionally, users of social networks may choose to use, or increase their use of, those networks for professionalpurposes, which may result in those users decreasing or eliminating their use of LinkedIn. Companies that currently focus on social networkingcould also expand their focus to professionals. We and other companies have historically established alliances and relationships with some of thesecompanies to allow broader exposure to users and access to data on the Internet. We may also, in the future, establish alliances or relationshipswith other competitors or potential competitors. To the extent companies terminate such relationships and establish alliances and relationships withothers, our business could be harmed. Additionally, other companies that provide content for professionals could develop more compelling offeringsthan ours. This could impact the engagement of our members, and could also compete with our Premium Subscriptions and adversely impact ourability to sell and renew subscriptions to our members. Specifically, we compete for members, enterprises and professional organizations asdiscussed below.
Members-professional networks . The space for online professional networks is rapidly evolving. Other companies such as Facebook, Google,Microsoft and Twitter are developing or could develop solutions that compete with ours. Further, some of these companies are partnering with thirdparties to offer products and services that could compete with ours. Additionally, we face competition from a number of companies outside theUnited States that provide online professional networking solutions . We also compete against smaller companies that focus on groups ofprofessionals within a specific industry or vertical. Our competitors may announce new products, services or enhancements that better addresschanging industry standards or the needs of members and customers, such as mobile access or different market focus. Any such increasedcompetition could cause pricing pressure, loss of business or decreased member activity, any of which could adversely affect our business andoperating results. Internet search engines could also change their methodologies in ways that adversely affect our ability to optimize our pagerankings within their search results.
Enterprises and professional organizations-Talent Solutions (including Learning and Development) . With respect to our Talent Solutions, wecompete with online recruiting companies, talent management companies and larger companies that are focusing on talent management andhuman resource services, job boards, traditional recruiting firms, and companies that provide learning and development products and services.Additionally, other companies, including newcomers to the recruiting or learning and development industries, may partner with Internet companies,including social networking companies, to provide services that compete with our solutions, either on their own or as third party applications. If theefficiency and usefulness of our products to enterprises and professional organizations do not exceed those provided by competitors, we will not beable to compete successfully.
Enterprises and professional organizations-Marketing Solutions . With respect to our Marketing Solutions, we compete with online and offlineoutlets that generate revenue from advertisers and marketers. To the extent competitors are better able to provide customers with cost-effectiveaccess to attractive demographics, either through new business models or increased user volume, we may not be successful in retaining ourexisting advertisers or attracting new advertisers, and our business would be harmed.
Enterprises and professional organizations-Premium Subscriptions/Sales Solutions. With respect to our Premium Subscriptions and SalesSolutions, we compete with online and offline companies for customers with lead generation and customer intelligence and insights. Our SalesSolutions product is in the early stages, and we may not be able to compete effectively in this area.
If we do not continue to attract new customers, or if existing customers do not renew their subscriptions, renew on less favorable terms,or fail to purchase additional solutions, we may not achieve our revenue projections, and our operating results would be harmed.
49

Table of Contents
In order to grow our business, we must continually attract new customers, sell additional solutions to existing customers and reduce the levelof non-renewals in our business. Our ability to do so depends in large part on the success of our sales and marketing efforts. We do not typicallyenter into long-term contracts with our customers, and even when we do, they can generally terminate their relationship with us. We may notaccurately predict future trends with respect to rates of customer renewals, upgrades and expansions. Furthermore, the nature of our products andsolutions is such that customers may decide to terminate or not renew their agreements with us without causing significant disruptions to their ownbusinesses.
We must demonstrate that our Talent Solutions are important recruiting and learning and development tools for enterprises, professionalorganizations, and individuals and that our Marketing and Sales Solutions provide them with access to an audience of one of the most influential,affluent and highly educated audiences on the Internet. However, potential customers may not be familiar with our solutions or may prefer other ormore traditional products and services for their talent, advertising and marketing needs.
Our customer base and our customers’ renewal rates may decline or fluctuate because of several factors, including the prices of our solutions,the prices of products and services offered by our competitors, reduced hiring by our customers or reductions in their talent or marketing spendinglevels due to macroeconomic or other factors and the efficacy and cost-effectiveness of our solutions. If we do not attract new customers or if ourcustomers do not renew their agreements for our solutions, renew on less favorable terms, or do not purchase additional functionality or offerings,our revenue may grow more slowly than expected or decline.
Ultimately, attracting new customers and retaining existing customers requires that we continue to provide high quality solutions that ourcustomers value. In particular, our Talent Solutions customers will discontinue their purchases of our solutions if we fail to effectively connect themwith the talent they seek or provide learning and development opportunities that they are looking for, and our premium subscribers will discontinuetheir subscriptions if they do not find the networking and business opportunities that they value. Similarly, customers of our Marketing Solutions willnot continue to do business with us if their advertisements do not reach their intended audiences. Therefore we must continue to demonstrate to ourcustomers that using our Marketing Solutions is the most effective and cost-efficient way to maximize their results. Even if our Marketing Solutionsare providing value to our customers, advertisers are sensitive to general economic downturns and reductions in consumer spending, among otherevents and trends, which generally results in reduced advertising expenditures and could adversely affect sales of our Marketing Solutions. Inaddition, Marketing Solutions products include off-network advertising, which complements current offerings primarily sold on our wholly ownedproperties. We may not be successful with these products, or our customers or members may not be receptive to them. Finally, for our SalesSolutions products, we may not be able to retain existing customers or attract new customers if we fail to provide high quality solutions, if customersare unable to realize the value of our solutions, or if we are not able to measure and demonstrate the value that our solutions provide.
We expect our operating results to fluctuate on a quarterly and annual basis, which may result in a decline in our stock price if suchfluctuations result in a failure to meet the expectations of securities analysts or investors.
Our revenue and operating results have in the past and could in the future vary significantly from quarter-to-quarter and year-to-year and mayfail to match our past performance, our projections or the expectations of securities analysts because of a variety of factors, many of which areoutside of our control. Any of these events could cause the market price of our Class A common stock to fluctuate. Factors that may contribute tothe variability of our operating results include:
• our ability to create value for our members as well as increase the size of our member base;
• engagement of our members and customers;
• our commitment to putting our members first even if it means forgoing short-term revenue opportunities;
• shifts in the way members and users access our websites and services from personal computers to mobile devices;
• disruptions or outages in the availability of our websites or services, actual or perceived breaches of privacy, and compromises of ourmember data;
• changes in our pricing policies or those of our competitors;
50

Table of Contents
• our ability to increase sales of our products and solutions to new customers and expand sales of additional products and solutions toour existing customers;
• the size and seasonal variability of our customers’ recruiting, marketing and sales budgets;
• the extent to which existing customers renew their agreements with us and the timing and terms of those renewals;
• general industry and macroeconomic conditions, in particular, deterioration in labor markets, which would adversely impact sales of ourTalent Solutions, or economic growth that does not lead to job growth, for instance increases in productivity;
• the cost of investing in our technology infrastructure, product initiatives, facilities and international expansion may be greater than weanticipate;
• our needs related to facilities may change over time and vary from our original forecasts, and the value of the property that we lease orown may fluctuate;
• expenses related to hiring, incentivizing and retaining employees;
• the timing and costs of expanding our field sales organization and delays or inability in achieving expected productivity;
• the timing of certain expenditures, including hiring of employees and capital expenditures;
• the entrance of new competitors in our market whether by established companies or the entrance of new companies;
• currency exchange rate fluctuations;
• our ability to integrate acquisitions and realize the expected benefit of such acquisitions in a timely manner or at all; and
• changing tax laws and regulations.
Our historical operating results may not be indicative of our future operating results. We believe our rapid growth has masked the cyclicalityand seasonality of our business. As our revenue growth rate has slowed, the cyclicality and seasonality in our business has become morepronounced, and we expect that to continue. This has, and will, cause our operating results to fluctuate. In addition, global economic concernscontinue to create uncertainty and unpredictability and add risk to our future outlook. Sovereign debt issues and economic uncertainty in the UnitedStates, Europe and around the world raise concerns in markets important to our business. An economic downturn in any particular region in whichwe do business or globally could result in reductions in sales of our products, decreased renewals of existing arrangements and other adverseeffects that could harm our operating results.
We expect our revenue growth rate to decline, and, as our costs increase, we may not be able to generate sufficient revenue to sustainprofitability over the long term.
From 2010 to 2015, our annual net revenue grew from $243.1 million to $2,990.9 million, which represents a compounded annual growth rateof approximately 65.2%. As our net revenue has increased, our revenue growth rate has slowed, and we expect that it will continue to decline overtime. We also expect that the growth rates of each of our primary product lines will fluctuate and that these product lines may not grow at the samerate. In recent years, and continuing in 2016, our philosophy has been to invest for future growth. We expect to continue to expend substantialfinancial and other resources on:
• our technology infrastructure, including architecture, development tools scalability, availability, performance and security, as well as disasterrecovery measures;
• product development, including investments in our product development team and the development of new features for both members andcustomers;
• sales and marketing, including a significant expansion of our field sales organization;
• international expansion in an effort to increase our member base, member activity and sales;
51
Table of Contents
• general administration, including legal and accounting expenses related to our expanding global presence and the integration of newlyacquired businesses; and
• capital expenditures, including facilities and build-out of our data centers.
These investments may not result in increased revenue or business growth, or increased network growth or member value, and will increaseour expenses. Even if our revenue continues to increase, we expect that due to increased expenses, in particular, stock-based compensation,depreciation and amortization and provision for income taxes, we may incur a US GAAP loss during future periods. If we fail to continue to grow ourrevenue and overall business, our operating results and business would be harmed.
If we fail to effectively manage our growth, our business and operating results could be harmed.
We continue to experience rapid growth in our headcount and operations, which will continue to place significant demands on ourmanagement and our operational and financial infrastructure. As of March 31, 2016 , approximately 33% of our employees had been with us for lessthan one year and approximately 60% for less than two years. As we continue to grow, we must effectively integrate, develop and motivate a largenumber of new employees in various countries around the world, and we must maintain the beneficial aspects of our corporate culture. We intend tocontinue to make substantial investments to expand our engineering, research and development, field sales, and general and administrativeorganizations, and our international operations. To attract top talent, we have had to offer, and believe we will need to continue to offer, highlycompetitive compensation packages before we can validate the productivity of those employees. In addition, fluctuations in the price of our Class Acommon stock may make it more difficult or costly to use equity compensation to motivate, incentivize and retain our employees. We face significantcompetition for talent from other Internet and high-growth companies, which include both publicly traded and privately-held companies. The risks ofover-hiring (especially given overall macroeconomic risks) or over-compensating employees and the challenges of integrating a rapidly growingemployee base into our corporate culture are exacerbated by our international expansion. Additionally, because of our growth, we have significantlyexpanded our operating lease and purchase commitments, which have increased our expenses. We may not be able to hire new employees quicklyenough to meet our needs. If we fail to effectively manage our hiring needs and successfully integrate our new hires, our efficiency and ability tomeet our forecasts and our employee morale, productivity and retention could suffer, and our business and operating results could be adverselyaffected.
Additionally, if we do not effectively manage the growth of our business and operations, the quality of our solutions could suffer, which couldnegatively affect our brand, operating results and overall business. Further, we have made changes in the past, and will make changes in the future,to our features, products and services that our members or customers may not like, find useful or agree with. We may also decide to discontinuecertain features, products or services, or charge for certain features, products or services that are currently free or increase fees for any of ourfeatures, products or services. If members or customers are unhappy with these changes, they may decrease their engagement on our site, or stopusing features, products or services or the site generally. In addition, they may choose to take other types of action against us such as organizingpetitions or boycotts focused on our company, our website or any of our services, filing claims with the government or other regulatory bodies, orfiling lawsuits against us. Any of these actions could negatively impact our member growth and engagement and our brand, which would harm ourbusiness. To effectively manage this growth, we will need to continue to improve our operational, financial and management controls, and ourreporting systems and procedures by, among other things:
• improving our information technology infrastructure to maintain the effectiveness of our solutions;
• enhancing information and communication systems to ensure that our employees and offices around the world are well-coordinated andcan effectively communicate with each other and our growing base of members, enterprises and professional organizations;
• enhancing our internal controls to ensure timely and accurate reporting of all of our operations; and
• appropriately documenting our information technology systems and our business processes.
These systems enhancements and improvements will require significant capital expenditures and allocation of valuable management andemployee resources. If we fail to implement these improvements effectively, our ability to manage our expected growth and comply with the rulesand regulations that are applicable to publicly reporting companies will be impaired.
52
Table of Contents
We depend on world class talent to grow and operate our business, and if we are unable to hire, retain and motivate our personnel, wemay not be able to grow effectively.
Our future success will depend upon our continued ability to identify, hire, develop, motivate and retain world class talent. Our ability to executeefficiently is dependent upon contributions from all of our employees, in particular our senior management team. Key institutional knowledgeremains with a small group of long-term employees whom we may not be able to retain. We may not be able to retain the services of any of ourlong-term employees or other members of senior management in the future. We do not have employment agreements other than offer letters withany of our key employees, and we do not maintain key person life insurance for any employee. In addition, from time to time, there may be changesin our senior management team that may be disruptive to our business. If our senior management team, including any new hires that we may make,fails to work together effectively and to execute our plans and strategies on a timely basis, our business could be harmed.
Our growth strategy also depends on our ability to expand and retain our organization with world class talent. Identifying, recruiting, trainingand integrating qualified individuals will require significant time, expense and attention. In addition to hiring new employees, we must continue tofocus on retaining our best talent. Competition for these resources, particularly for engineers, is intense, and competition for the facilities to houseour employees is also intense, specifically in the San Francisco Bay Area, where our headquarters is located. We may need to invest significantamounts of cash and equity for new and existing employees and we may never realize returns on these investments, and we also are investingheavily in our facilities. If we are not able to effectively increase and retain our talent, our ability to achieve our strategic objectives will be adverselyimpacted, and our business will be harmed.
Our international operations account for a significant portion of our revenue and are subject to increased challenges and risks.
We have offices around the world and our websites and mobile applications are available in numerous languages. For the three months endedMarch 31, 2016 , international revenue represented 39% of our total revenue. We expect to continue to expand our international operations in thefuture by opening offices in different countries and expanding our offerings in new languages or otherwise making them more relevant for differentinternational audiences. Our ability to manage our business and conduct our operations internationally, including in emerging markets, requiresconsiderable management attention and resources and is subject to the particular challenges of supporting a rapidly growing business in anenvironment of multiple languages, cultures, customs, legal systems, alternative dispute resolution systems, regulatory systems and commercialinfrastructures. International expansion has required and will continue to require us to invest significant funds and other resources. Operatinginternationally subjects us to new risks and may increase risks that we currently face, including risks associated with:
• recruiting and retaining talented and capable employees in foreign countries, and maintaining our company culture across all of ouroffices;
• providing solutions across a significant distance, in different languages, in competitive market environments and among differentcultures, including modifying, or in some cases building entirely new services, solutions and features to ensure that they are culturallyrelevant in different countries and conforming to local laws and regulations, which may include modifying or blocking content in certainjurisdictions if it is deemed objectionable or unlawful;
• increased competition from local websites and services that provide online professional networking solutions, online recruitmentservices and learning and development products, which may benefit from first-mover advantages. These competitors have expandedand may continue to expand their geographic footprint;
• differing and potentially lower levels of member growth and activity in new and nascent geographies;
• compliance with applicable foreign laws and regulations, which may change or conflict with each other, require us to take on additionalcompliance obligations and practices as well as the potential risk of penalties to individual members of management if our practices aredeemed to be out of compliance;
• longer payment cycles in some countries;
• credit risk and higher levels of payment fraud;
• stringent local labor laws and regulations;
53

Table of Contents
• laws and regulations that favor local competitors or prohibit or limit foreign ownership of businesses;
• legal regimes where the application of laws and regulations is subject to greater uncertainty, as well as higher risk of corruption, fraudand unethical business practices, and compliance with anti-bribery laws;
• implementing and maintaining effective internal processes and controls;
• compliance with various economic and trade sanctions regulations which restrict certain conduct of business;
• currency exchange rate fluctuations and controls;
• political or social unrest, or, economic instability in some countries;
• laws and proposed legislation relating to data localization in various countries, which may result in increased costs to comply and/orrestrict our ability to do business in new and existing markets;
• double taxation of our non-US earnings and potentially adverse tax consequences due to changes in the tax laws of the United Statesor the foreign jurisdictions in which we operate; and
• higher costs of doing business internationally.
If our revenue from our international operations, and particularly from our operations in the countries and regions on which we have focusedour spending, do not exceed the expense of establishing and maintaining these operations, our business and operating results will suffer. Inaddition, as our member base expands internationally, members in certain geographies may have lower levels of activity with our websites andservices.
Finally, in late 2013, we established a joint venture to expand our operations in the People’s Republic of China ("PRC"), which is in its earlystages. Although we believe this joint venture and our activities in the PRC comply with existing laws, they involve unique risks, and the PRC isactively considering changes in its foreign investment rules that could impact this structure and our activities. There are substantial uncertaintiesregarding the interpretation of PRC laws and regulations, and it is possible that the government will ultimately take a view contrary to ours. We maybe unable to continue to operate in the PRC if we or our affiliates are unable to access sufficient funding or enforce contractual relationships withrespect to management and control of such business. In addition, the PRC’s laws and regulations, as they apply to our business operations inMainland China, have resulted in modifications to our products and services in Mainland China. For example, the PRC government has laws andregulations that govern the dissemination of content over the Internet, the storage and access to certain personal information and the provision ofcertain services that require government licenses that are either difficult to obtain or not available. The PRC may enact additional laws or regulationsin the future related to content, privacy, security and government access to personal information in a way that may materially impact our ability toconduct operations in the PRC. Failure to comply with these requirements may mean that we will not obtain or retain necessary licenses to operateall or some of our services in Mainland China, or result in the blocking of our services in Mainland China. In addition, our compliance with these rulescould harm our business, reputation and brand outside of China. We will need to allocate significant resources to developing our presence in China,and we may not be successful in doing so.
Our business depends on a strong and trusted brand, and any failure to maintain, protect and enhance our brand would hurt our ability toretain or expand our base of members, enterprises and professional organizations, our ability to increase their level of engagement andour ability to attract and retain high level employees.
We have developed a strong and trusted brand that we believe has contributed significantly to the success of our member network andbusiness. Our brand is predicated on the idea that individual professionals will trust us and find immense value in building and maintaining theirprofessional identities and reputations on our platform, as well as investing in their professional learning and knowledge. Maintaining, protecting andenhancing the “LinkedIn” brand and our other key brands is critical to expanding our base of members, enterprises, advertisers, corporatecustomers and other partners, and increasing their engagement with our services, and will depend largely on our ability to maintain member trust, bea technology leader and continue to provide valuable and high-quality solutions, which we may not do successfully. Despite our efforts to protect ourbrands and prevent misuse, if others misuse our brands or pass themselves off as being endorsed or affiliated with us, it could harm our reputationand our business could suffer. If our members or potential members determine that they can use other platforms, such as social networks, for thesame purposes as or as a replacement for our network, or if they choose to blend their professional and social networking activities, our brand andour business could be harmed. Our members or customers could find that new products or features that we introduce are difficult to use or may feelthat they
54

Table of Contents
degrade their experience with online service offered by LinkedIn, which could harm our reputation for delivering high-quality products. Our brand isalso important in attracting and maintaining high performing employees. If we do not successfully maintain a strong and trusted brand, our businesscould be harmed.
We may not be able to halt the operations of entities that copy our intellectual property or that aggregate our data as well as data fromother companies, including social networks, or copycat online services that have misappropriated our data in the past or maymisappropriate our data in the future. These activities could harm our brand and our business.
From time to time, third parties have accessed content or data from our networks through scraping, robots or other means and used thiscontent and data or combined this content and data with other content and data as part of their services. In addition, “copycat” online services havemisappropriated data on our network and attempted to imitate our brand or the functionality of our services, including our learning and developmentcontent and these services or others could use similar tactics to develop products that compete with ours. These activities could degrade our brand,negatively impact our website performance and harm our business. When we have become aware of such online services, in many instances wehave employed contractual, technological or legal measures in an attempt to halt unauthorized activities, but these measures may not be successful.In addition, if our customers do not comply with our terms of service, they also may be able to abuse our products and services and provide accessto our solutions and content to unauthorized users. However, we may not be able to detect any or all of these types of activities in a timely mannerand, even if we could, technological and legal measures may be insufficient to stop these actions. In some cases, particularly in the case of onlineservices operating from outside of the United States, our available legal remedies may not be adequate to protect our business against suchactivities. Regardless of whether we can successfully enforce our rights against these parties, any measures that we may take could require us toexpend significant financial or other resources.
Failure to protect or enforce our intellectual property rights could harm our business and operating results.
We regard the protection of our trade secrets, copyrights, trademarks, trade dress, databases, domain names and patents as critical to oursuccess. We strive to protect our intellectual property rights by relying on federal, state and common law rights and other rights provided underforeign laws. These laws are subject to change at any time and could further restrict our ability to protect our intellectual property rights. In addition,the existing laws of certain foreign countries in which we operate may not protect our intellectual property rights to the same extent as do the laws ofthe United States. We also have a practice of entering into confidentiality and invention assignment agreements with our employees andcontractors, and often enter into confidentiality agreements with parties with whom we conduct business in order to limit access to, and disclosureand use of, our proprietary information. In addition, from time to time we make our intellectual property rights available to others under licenseagreements, including open source licenses. However, these contractual arrangements and the other steps we have taken to protect our intellectualproperty rights may not prevent the misappropriation of our proprietary information, infringement of our intellectual property rights or deterindependent development of similar or competing technologies by others and may not provide an adequate remedy in the event of suchmisappropriation or infringement.
Obtaining and maintaining effective intellectual property rights is expensive, including the costs of defending our rights. We are seeking toprotect our copyrights, trademarks and patents, and other intellectual property rights in a number of jurisdictions, a process that is expensive andmay not be successful in all jurisdictions for every such right. Even where we have such rights, they may later be found to be unenforceable or havea limited scope of enforceability. In addition, we may not seek to pursue such protection in every location. In particular, we believe it is important tomaintain, protect and enhance our brands. Accordingly, we pursue the registration of domain names and our trademarks and service marks in theUnited States and in many locations outside the United States. We have already and may, over time, increase our investment in protectinginnovations through investments in patents and similar rights, and this process is expensive and time-consuming.
Litigation may be necessary to enforce our intellectual property rights, protect our proprietary rights or determine the validity and scope ofproprietary rights claimed by others. Any litigation of this nature, regardless of outcome or merit, could result in substantial costs and diversion ofmanagement and technical resources, any of which could adversely affect our business and operating results. We may also incur significant costs inenforcing our trademarks against those who attempt to imitate our “LinkedIn” brand and other valuable trademarks and service marks.
55

Table of Contents
In addition, we have chosen to make certain of our technology available under open source licenses that allow others to use the technologywithout payment to us. While we hope to benefit from these activities by having access to others’ useful technology under open source licenses,there is no assurance that we will receive the business benefits we expect.
If we fail to maintain, protect and enhance our intellectual property rights, our business and operating results may be harmed, and the marketprice of our Class A common stock could decline.
We are, and expect in the future to be, subject to legal proceedings and litigation, including intellectual property and privacy disputes,which are costly to defend and could materially harm our business and operating results.
We are party to lawsuits and legal proceedings in the normal course of business. These matters are often expensive and disruptive to normalbusiness operations. We are currently facing, or may face in the future, allegations, lawsuits and regulatory inquiries, audits and investigationsregarding data privacy, security, labor and employment, consumer protection, the Fair Credit Reporting Act and intellectual property infringement,including claims related to privacy, patents, publicity, trademarks, copyrights and other rights. We may also face allegations or litigation related toour acquisitions, securities issuances or our business practices, including public disclosures about our business. Litigation and regulatoryproceedings, and particularly the patent infringement and class action matters we are facing or may face, may be protracted and expensive, and theresults are difficult to predict. Certain of these matters include speculative claims for substantial or indeterminate amounts of damages, and includeclaims for injunctive relief. Additionally, our litigation costs can be significant. Adverse outcomes with respect to litigation or any of these legalproceedings may result in significant settlement costs or judgments, penalties and fines, or require us to modify our products and features or requireus to stop offering certain features, all of which could negatively impact our membership and revenue growth. Additionally, we may become subjectto periodic audits, which would likely increase our regulatory compliance costs, and may require us to change our business practices, which couldnegatively impact our revenue growth. Managing legal proceedings, litigation and audits, even if we achieve favorable outcomes, is time-consumingand diverts management’s attention from our business.
In addition, we contribute to and use open source software in our solutions and plan to continue to use open source software in the future. Theterms of many open source licenses have not been interpreted by United States or other courts, and these licenses could be construed in a mannerthat imposes unanticipated conditions or restrictions on our ability to commercialize our products. We may face claims from others claimingownership of open source software or patents related to that software, rights to our intellectual property or breach of open source license terms,including a demand for release of material portions of our source code or otherwise seeking to enforce the terms of the applicable open sourcelicense. These claims could also result in litigation, which could be costly to defend, require us to purchase a costly license, require us to establishadditional specific open source compliance procedures, or require us to devote additional research and development resources to remove opensource elements from or otherwise change our solutions, any of which would have a negative effect on our business and operating results. Inaddition, if we were to combine our own software with open source software in a certain manner, we could, under certain open source licenses, berequired to release the source code of some software that would be valuable to keep as a trade secret and/or not make available for use by otherswhich would have a material adverse effect on our business, results of operations or financial condition.
The results of regulatory proceedings, litigation, claims and audits cannot be predicted with certainty, and determining reserves for pendinglitigation and other legal, regulatory and audit matters requires significant judgment. There can be no assurance that our expectations will provecorrect, and even if these matters are not resolved in our favor or without significant cash settlements, these matters, and the time and resourcesnecessary to litigate or, resolve them, could harm our business, our operating results, our reputation or the market price of our Class A commonstock.
Because we recognize most of the revenue from our Talent Solutions and our Premium Subscriptions over the term of the agreement, asignificant downturn in these businesses may not be immediately reflected in our operating results.
We recognize most of the revenue from sales of our Talent Solutions (which include Learning and Development) and Premium Subscriptions(which include Sales Solutions) over the terms of the agreements, which are generally one to 12 months. As a result, a significant portion of therevenue we report in each quarter is generated from agreements entered into during previous quarters. Consequently, a decline in new or renewedagreements in any one quarter may not significantly impact our revenue in that quarter but will negatively affect our
56

Table of Contents
revenue in future quarters. In addition, we may be unable to adjust our fixed costs in response to reduced revenue. Accordingly, the effect ofsignificant declines in the sales of these offerings may not be reflected in our short-term results of operations.
Our Marketing Solutions products may be negatively impacted by the decline in the use of display advertising and ad blockingtechnologies, and depend in part on our relationships with advertising serving technology companies.
The use of display advertising is declining and we face challenges coping with ad blocking technologies that have been developed and arelikely to continue to be developed. We also rely, in part, on advertising serving technology companies to deliver our Marketing Solutions product. Wemay not be successful in entering into agreements on advantageous terms, our existing agreements with these companies may not be extended orrenewed after their respective expirations, or we may not be able to extend or renew our agreements on terms and conditions favorable to us. Ifthese agreements are terminated, we may not be able to enter into agreements with alternative companies on acceptable terms or on a timely basisor both, which could negatively impact revenue from our Marketing Solutions.
Enterprises or professional organizations, including governmental agencies, may restrict access to our services, which could lead to theloss or slowing of growth in our member base or the level of member engagement.
Our solutions depend on the ability of our members to access the Internet and our services. Enterprises or professional organizations, includinggovernmental agencies, could block or restrict access to our online services, website or the Internet generally for a number of reasons such assecurity or confidentiality concerns or regulatory reasons, or they may adopt policies that prohibit listing the employers’ names on the employees’LinkedIn profiles in order to minimize the risk that employees will be contacted and hired by other employers.
In some cases, certain governments may seek to restrict the Internet or our service providers’ websites, services and solutions and theperformance of our websites, services and solutions could be suspended, blocked (in whole or part) or otherwise adversely impacted in thesejurisdictions. For example, the government of the People’s Republic of China has blocked access to many social networking and other sites(including ours for a brief period), and certain self-regulatory organizations have policies that could result in access to our content, services orfeatures being blocked. Any restrictions on the use of our services by our members and users could lead to the loss or slowing of growth in ourmember base or the level of member engagement.
If Internet search engines’ methodologies are modified or our search result page rankings decline for other reasons, our member andnon-member engagement could decline.
We depend in part on various Internet search engines to direct a significant amount of traffic to our website. Similarly, we depend on providersof mobile application “store fronts” to allow users to locate and download our mobile applications that enable our service. Our ability to maintain thenumber of visitors directed to our website and users of our online services is not entirely within our control. Our competitors’ search engineoptimization, or SEO, efforts may result in their websites receiving a higher search result page ranking than ours, or Internet search engines couldrevise their methodologies in an attempt to improve their search results, which could adversely affect the placement of our search result pageranking. If search engine companies modify their search algorithms in ways that are detrimental to our new user growth or in ways that make itharder for our members to use our website, or if our competitors’ SEO efforts are more successful than ours, overall growth in our member basecould slow, member and non-member engagement could decrease, and we could lose existing members. These modifications may be prompted bysearch engine companies entering the online professional networking market or aligning with competitors. Our website has experienced fluctuationsin search result rankings in the past, and we anticipate similar fluctuations in the future. Any reduction in the number of users directed to ourwebsites would harm our business and operating results.
57

Table of Contents
Our business depends on continued and unimpeded access to the Internet and mobile networks by us and our members on personalcomputers and mobile devices. If government regulations relating to the Internet or mobile networks or other areas of our businesschange, if Internet access providers are able to block, degrade, or charge for access to certain of our products and services, or if thirdparties disrupt access to the Internet, we could incur additional expenses and the loss of members and customers.
Our products and services depend on the ability of our members and customers to access our online services through their personalcomputers and mobile devices. Currently, this access is provided by companies that have significant market power in the broadband and Internetaccess marketplace, including incumbent telephone companies, cable companies, mobile communications companies, and government-ownedservice providers, any of whom could take actions that degrade, disrupt, or increase the cost of user access to our products or solutions, whichwould, in turn, negatively impact our business. In addition, Internet or network access could be disrupted by other third parties. Further, the adoptionof any laws or regulations that adversely affect the growth, popularity or use of the Internet and mobile networks, including laws limiting Internetneutrality, could decrease the demand for our subscription service or the usage of our services and increase our cost of doing business.
Our growth depends in part on the success of our strategic relationships with third parties.
We anticipate that we will continue to depend on relationships with various third parties, including access to platforms and content providersand distributors to grow our business, authors who provide content (including learning and development material), and channel partners. Identifying,negotiating and maintaining relationships with third parties require significant time and resources, as does integrating third-party content andtechnology. Our agreements with technology and content providers and similar third parties are typically non-exclusive and do not prohibit them fromworking with our competitors or from offering competing services. In some cases, in particular, with respect to content providers, these relationshipsare undocumented, or, if there are agreements in place, they may be easily terminable. Our competitors may be effective in providing incentives tothese parties to favor their solutions or may prevent us from developing strategic relationships with these parties. These third parties may decidethat working with LinkedIn is not in their interest. In addition, these third parties may not perform as expected under our agreements with them, andwe have had, and may in the future have, disagreements or disputes with these parties, which could negatively affect our brand and reputation. It ispossible that these third parties may not be able to devote the resources we expect to the relationship or they may terminate their relationships withus. Further, as users increasingly access our services through mobile devices, we are becoming more dependent on the distribution of our mobileapplications through third parties, and we may not be able to access their application program interfaces or be able to distribute our applications orprovide ease of integration, and this may also impact our ability to monetize our mobile products. If we are unsuccessful in establishing ormaintaining our relationships with third parties, our ability to compete in the marketplace or to grow our business could be impaired, and ouroperating results would suffer. Even if we are successful, these relationships may not result in improved operating results.
If currency exchange rates fluctuate substantially in the future, the results of our operations, which are reported in US dollars, could beadversely affected.
As we continue to expand our international operations, we become more exposed to the effects of fluctuations in currency exchange rates. Weincur expenses for employee compensation and other operating expenses at our non-US locations in the local currency, and accept payment fromcustomers in currencies other than the US dollar. Since we conduct business in currencies other than US dollars but report our financial results inUS dollars, we face exposure to fluctuations in currency exchange rates. Consequently, exchange rate fluctuations between the US dollar and othercurrencies could have a material impact on our profitability, and because we recognize revenue over time, exchange rate fluctuations at one point intime may have a negative impact in future quarters. Although we hedge a portion of our foreign currency exposure, significant fluctuations inexchange rates between the US dollar and foreign currencies may adversely affect our net income (loss). Additionally, hedging programs rely on ourability to forecast accurately and could expose us to additional risks that could adversely affect our financial condition and results of operations.
The intended tax efficiency of our corporate structure and intercompany arrangements depend on the interpretation and application ofthe tax laws of various jurisdictions and on how we operate our business, and changes to our effective tax rate could adversely impactour results.
Our corporate structure and intercompany arrangements, including the manner in which we develop and use our intellectual property and thetransfer pricing of our intercompany transactions, are intended to optimize business
58
Table of Contents
efficiency as well as reduce our worldwide effective tax rate. The application of the tax laws of various jurisdictions, including the United States andthe other jurisdictions in which we operate, to our international business activities is subject to interpretation and depends on our ability to operateour business in a manner consistent with our corporate structure and intercompany arrangements. The taxing authorities of the jurisdictions in whichwe operate may challenge our methodologies for valuing developed technology or for transfer pricing on intercompany arrangements, or they maymake a determination that the manner in which we operate results in our business not achieving the intended tax consequences. This couldincrease our worldwide effective tax rate and harm our financial position and results of operations. Our effective tax rate could be adversely affectedby several other factors, many of which are outside of our control, such as: increases in expenses that are not deductible for tax purposes, the taxeffects of restructuring charges or purchase accounting for acquisitions, increases in withholding taxes, changes related to our ability to ultimatelyrealize future benefits attributed to our deferred tax assets, including those related to other-than-temporary impairment, and a change in our decisionto indefinitely reinvest foreign earnings. Further, we are currently undergoing review and audit by both domestic and foreign tax authorities andexpect such actions to continue in the future. Any adverse outcome of such a review or audit could have a negative effect on our operating resultsand financial condition.
The enactment of legislation implementing changes in the US taxation of international business activities, the adoption of other taxreform policies or changes in tax legislation or policies in jurisdictions outside the United States could materially impact our financialposition and results of operations.
Possible future changes to US tax laws, including limitations on the ability of taxpayers to claim and utilize foreign tax credits and the deferralof certain tax deductions until earnings outside of the United States are repatriated to the United States, as well as changes to US tax laws that maybe enacted in the future, could impact the tax treatment of our foreign earnings and adversely impact our effective tax rate. Due to the large andexpanding scale of our international business activities, any changes in the US or international taxation of such activities may increase ourworldwide effective tax rate and harm our financial position and results of operations.
The tax authorities in Ireland have announced changes to the treatment of non-resident Irish entities, commonly used in a “double Irish”structure. The changes will impact newly created Irish entities immediately but are not expected to impact existing non-resident Irish entities, suchas ours, until after December 31, 2020. These changes may adversely impact our effective tax rate and harm our financial position and results ofoperations. The United Kingdom has enacted new tax legislation, and Australia has also recently enacted new tax legislation, on diverted profitswhich may ultimately impact our foreign tax liability and negatively impact our effective tax rate and results of operations.
Additionally, the Organisation for Economic Co-Operation and Development recently released final guidance covering various topics, includingaddressing the “tax challenges of the digital economy,” country-by-country reporting, and definitional changes to permanent establishment, whichcould ultimately impact our tax liabilities to foreign jurisdictions and treatment of our foreign earnings from a US perspective which may adverselyimpact our effective tax rate and harm our financial position and results of operations.
We may require additional capital to support business growth, and this capital might not be available on acceptable terms, if at all.
We intend to continue to make investments to support our business growth and may require additional funds to respond to businesschallenges, including the need to develop new features and products or enhance our existing solutions, improve our operating infrastructure oracquire complementary businesses and technologies. Accordingly, we have engaged and may continue to engage in equity or debt financings tosecure additional funds. If we raise additional funds through future issuances of equity or convertible debt securities, our existing stockholders couldsuffer significant dilution, and any new equity securities we issue could have rights, preferences and privileges superior to those of holders of ourClass A common stock. Any debt financing we secure in the future could involve restrictive covenants relating to our capital raising activities andother financial and operational matters, which may make it more difficult for us to obtain additional capital and to pursue business opportunities,including potential acquisitions. We may not be able to obtain additional financing on terms favorable to us, if at all. If we are unable to obtainadequate financing or financing on terms satisfactory to us when we require it, our ability to continue to support our business growth and to respondto business challenges could be significantly impaired, and our business may be harmed.
Acquisitions and investments could result in operating difficulties, dilution, and other harmful consequences that may adversely impactour business and results of operations.
59
Table of Contents
We have made and will continue to make acquisitions to add employees, complementary companies, products, technologies or revenue.These transactions could be material to our financial condition and results of operations. We also expect to continue to evaluate and enter intodiscussions regarding a wide array of potential strategic transactions. The identification of suitable acquisition candidates can be difficult, time-consuming and costly, and we may not be able to complete acquisitions on favorable terms, if at all. The process of integrating an acquiredcompany, business, or technology has created, and will continue to create, unforeseen operating difficulties and expenditures. The areas where weface risks include:
• loss of key employees of the acquired company and other challenges associated with integrating new employees into our culture, aswell as reputational harm if integration is not successful;
• diversion of management time and focus from operating our business to acquisition integration challenges;
• implementation or remediation of controls, procedures, and policies at the acquired company;
• integration of the acquired company’s accounting, human resource, and other administrative systems, and coordination of product,engineering, and sales and marketing function;
• assumption of contractual obligations that contain terms that are not beneficial to us, require us to license or waive intellectual propertyrights or increase our risk for liability;
• failure to successfully further develop the acquired technology;
• difficulty of transitioning the acquired technology onto our existing platforms and maintaining the security standards for such technologyconsistent with our other services;
• failure to successfully onboard customers or maintain brand quality of acquired companies;
• liability for activities of the acquired company before the acquisition, including patent and trademark infringement claims, violations oflaws, commercial disputes, tax liabilities, and other known and unknown liabilities;
• failure to generate the expected financial results related to an acquisition on a timely manner or at all; and• failure to accurately forecast the impact of an acquisition transaction.
These risks or other problems encountered in connection with our acquisitions and investments could cause us to fail to realize the anticipatedbenefits of such acquisitions or investments, incur unanticipated liabilities, and adversely affect our business generally.
Future acquisitions could also result in dilutive issuances of our equity securities, the incurrence of debt, contingent liabilities, amortizationexpenses, or write-offs of goodwill, any of which could harm our financial condition. In addition, any acquisitions we announce could be viewednegatively by users, marketers, developers or investors.
Risks Related to Our Class A Common StockThe dual class structure of our common stock as contained in our charter documents has the effect of concentrating voting control withthose stockholders who held our stock prior to our initial public offering, including our founders and our executive officers, employeesand directors and their affiliates, and limiting our other stockholders’ ability to influence corporate matters.
Our Class B common stock has 10 votes per share, and our Class A common stock has one vote per share. Stockholders who hold shares ofour Class B common stock, including our founders, and our executive officers, employees and directors and their affiliates, together heldapproximately 56.9% of the voting power of our outstanding capital stock as of March 31, 2016 . Our co-founder and Chair, Reid Hoffman, heldapproximately 10.9% of the outstanding shares of our Class A and Class B common stock, representing approximately 53.0% of the voting power ofour outstanding capital stock as of March 31, 2016 . Mr. Hoffman has significant influence over the management and affairs of the company andover all matters requiring stockholder approval, including election of directors and significant corporate transactions, such as a merger or other saleof our company or its assets. Mr. Hoffman will continue to have significant influence over these matters in the future.
In addition, the holders of our Class B common stock collectively will continue to be able to control all matters submitted to our stockholders forapproval even though their stock holdings represent less than 50% of the
60

Table of Contents
outstanding shares of our common stock. Because of the 10-to-1 voting ratio between our Class B and Class A common stock, the holders of ourClass B common stock collectively will continue to control a majority of the combined voting power of our common stock even when the shares ofClass B common stock represent as little as 10% of the combined voting power of all outstanding shares of our Class A and Class B common stock.This concentrated control will limit the ability of our Class A stockholders to influence corporate matters for the foreseeable future, and, as a result,the market price of our Class A common stock could be adversely affected.
If Mr. Hoffman continues to retain a significant portion of his holdings of Class B common stock for an extended period of time, he couldcontinue to control a majority of the combined voting power of our Class A and Class B common stock. As a board member, Mr. Hoffman owes afiduciary duty to our stockholders and must act in good faith in a manner he reasonably believes to be in the best interests of our stockholders. As astockholder, even a controlling stockholder, Mr. Hoffman is entitled to vote his shares in his own interests, which may not always be in the interestsof our stockholders generally.
Our stock price has been volatile in the past and may be subject to volatility in the future.
The trading price of our Class A common stock has been volatile historically, and could be subject to wide fluctuations in response to variousfactors, some of which are beyond our control. Between January 1, 2016 and April 27, 2016, the closing price of our Class A common stock hasranged from $100.98 to $229.00. Fluctuations in the valuation of companies perceived by investors to be comparable to us or in valuation metrics,such as our price to earnings ratio, could impact our stock price. Additionally, the stock markets have at times experienced extreme price andvolume fluctuations that have affected and might in the future affect the market prices of equity securities of many companies. These fluctuationshave, in some cases, been unrelated or disproportionate to the operating performance of these companies. Further, the trading prices of publiclytraded shares of companies in our industry have been particularly volatile and may be very volatile in the future. These broad market and industryfluctuations, as well as general economic, political and market conditions such as recessions, interest rate changes, international currencyfluctuations or political unrest, may negatively impact the market price of our Class A common stock. In addition, our stock price may fluctuate basedon whether our performance or guidance as to our future performance meets the expectations of our investors or securities analysts. Volatility in ourstock price also impacts the value of our equity compensation, which affects our ability to recruit and retain employees. We may incur additionalcash expense in connection with recruiting and retention costs, and we may also experience increased dilution because of the need to provide moreequity as part of our overall compensation packages. Such volatility could also impact the value of equity we use in acquisition transactions. Finally,some companies that have experienced volatility in the market price of their stock have also been subject to securities class action litigation. Wemay be the target of this type of litigation in the future. Securities litigation against us could result in substantial costs and divert our management’sattention from other business concerns, which could harm our business.
Anti-takeover provisions in our charter documents and under Delaware law could make an acquisition of us more difficult, limit attemptsby our stockholders to replace or remove our current management and limit the market price of our Class A common stock.
Provisions in our amended and restated certificate of incorporation and amended and restated bylaws, may have the effect of delaying orpreventing a change of control or changes in our management. Our certificate of incorporation and bylaws include provisions that:
• authorize our board of directors to issue, without further action by the stockholders, up to 100,000,000 shares of undesignated preferredstock;
• require that any action to be taken by our stockholders be effected at a duly called annual or special meeting and not by writtenconsent;
• specify that special meetings of our stockholders can be called only by our board of directors, the Chair of our board of directors, or ourChief Executive Officer;
• establish an advance notice procedure for stockholder proposals to be brought before an annual meeting, including proposednominations of persons for election to our board of directors;
• establish that our board of directors is divided into three classes, Class I, Class II and Class III, with each class serving three-yearstaggered terms;
• prohibit cumulative voting in the election of directors;
• provide that our directors may be removed only for cause;
61
Table of Contents
• provide that vacancies on our board of directors may be filled only by a majority of directors then in office, even though less than aquorum;
• require the approval of our board of directors or the holders of a supermajority of our outstanding shares of capital stock to amend ourbylaws and certain provisions of our certificate of incorporation; and
• reflect two classes of common stock, as discussed above.
These provisions may frustrate or prevent any attempts by our stockholders to replace or remove our current management by making it moredifficult for stockholders to replace members of our board of directors, which is responsible for appointing the members of our management.Provisions in the indenture related to our convertible debt may also deter or prevent a business combination. In addition, institutional shareholderrepresentative groups, shareholder activists and others may disagree with our corporate governance provisions or other practices, including our dualclass structure and the other anti-takeover provisions, such as those listed above. We generally will consider recommendations of institutionalshareholder representative groups, but we will make decisions based on what our board and management believe to be in the best long terminterests of our company and stockholders. Our dual class structure concentrates the voting power of our stock in a small group of stockholders whowould have the ability to control the outcome of a stockholder vote. Additionally, these groups could make recommendations to our stockholdersagainst our practices or our board members if they disagree with our positions. Finally, because we are incorporated in Delaware, we are governedby the provisions of Section 203 of the Delaware General Corporation Law, which generally prohibits a Delaware corporation from engaging in anyof a broad range of business combinations with any “interested” stockholder for a period of three years following the date on which the stockholderbecame an “interested” stockholder.
If securities or industry analysts publish reports that are interpreted negatively by the investment community or publish negativeresearch reports about our business, our share price and trading volume could decline.
The trading market for our Class A common stock depends, to some extent, on the research and reports that securities or industry analystspublish about us or our business. We do not have any control over these analysts or the information contained in their reports. If one or moreanalysts publish research reports that are interpreted negatively by the investment community, or have a negative tone regarding our business,financial or operating performance, industry or end-markets, our share price could decline. In addition, if a majority of these analysts cease coverageof our company or fail to regularly publish reports on us, we could lose visibility in the financial markets, which could cause our share price or tradingvolume to decline.
We do not intend to pay dividends for the foreseeable future.
We have never declared or paid any cash dividends on our common stock and do not intend to pay any cash dividends in the foreseeablefuture. We anticipate that we will retain all of our future earnings for use in the development of our business and for general corporate purposes. Anydetermination to pay dividends in the future will be at the discretion of our board of directors. Accordingly, investors must rely on sales of theirClass A common stock after price appreciation, which may never occur, as the only way to realize any future gains on their investments.
Risks Related to our Convertible Notes
Servicing our convertible notes may require a significant amount of cash, and we may not have sufficient cash flow or the ability to raisethe funds necessary to satisfy our obligations under the convertible notes, and our future debt may contain limitations on our ability topay cash upon conversion or repurchase of the convertible notes.
In November 2014, we issued approximately $1.3 billion aggregate principal amount of 0.50% convertible senior notes due 2019 (the "Notes").As of March 31, 2016 , we had a total par value of approximately $1.3 billion of outstanding Notes. Holders of the Notes will have the right to requireus to repurchase all or a portion of their notes upon the occurrence of a fundamental change before the relevant maturity date, in each case at arepurchase price equal to 100% of the principal amount of the Notes, plus accrued and unpaid interest, if any, to the fundamental changerepurchase date. In addition, upon conversion of the Notes, unless we elect to deliver solely shares of our common stock to settle such conversion(other than paying cash in lieu of delivering any fractional shares), we will
62

Table of Contents
be required to make cash payments in respect of the Notes being converted. Moreover, we will be required to repay the Notes in cash at theirmaturity, unless earlier converted or repurchased.
Our ability to make cash payments in connection with conversions of the Notes or repurchase the Notes in the event of a fundamental changewill depend on market conditions and our future performance, which is subject to economic, financial, competitive and other factors beyond ourcontrol. We also may not use the cash raised through the issuance of the Notes in an optimally productive and profitable manner. At the time we arerequired to make repurchases of the Notes being surrendered or converted at their maturity, we may not have enough available cash or be able toobtain financing to refinance the Notes on commercially reasonable terms or at all. Our level of indebtedness could adversely affect our futureoperations by increasing our vulnerability to adverse changes in general economic and industry conditions by limiting or prohibiting our ability toobtain additional financing for future capital expenditures, acquisitions and general corporate and other purposes. If we are unable to make cashpayments upon conversion of the Notes we would be required to issue significant amounts of our Class A common stock, which would be dilutive toexisting stockholders. In addition, if we do not have sufficient cash to repurchase the Notes following a fundamental change, we would be in defaultunder the terms of the Notes, which could seriously harm our business. The terms of the Notes do not limit the amount of future indebtedness wemay incur and if we incur significantly more debt, this could intensify the risks described above.
The conditional conversion feature of the Notes, if triggered, may adversely affect our financial condition and operating results.
In the event the conditional conversion feature of the Notes is triggered, holders of notes will be entitled to convert the notes at any time duringspecified periods at their option. If one or more holders elect to convert their Notes, unless we elect to satisfy our conversion obligation by deliveringsolely shares of our common stock (other than paying cash in lieu of delivering any fractional share), we would be required to settle a portion or all ofour conversion obligation through the payment of cash, which could adversely affect our liquidity. In addition, even if holders do not elect to converttheir Notes, we could be required under applicable accounting rules to reclassify all or a portion of the outstanding principal of the Notes as a currentrather than long-term liability, which would result in a material reduction of our net working capital.
Note hedge and warrant transactions we have entered into may affect the value of the Notes and our common stock.
Concurrently with the issuance of the Notes, we entered into note hedge transactions with certain financial institutions, which we refer to as the“option counterparties.” The note hedge transactions are expected to reduce the potential dilution upon any conversion of the Notes and/or offsetany cash payments we are required to make in excess of the principal amount of converted Notes, as the case may be. We also entered intowarrant transactions with the option counterparties. However, the warrant transactions could separately have a dilutive effect to the extent that themarket price per share of our common stock exceeds $381.82.
In connection with establishing their initial hedge of the note hedge and warrant transactions, the option counterparties or their respectiveaffiliates have purchased shares of our common stock and/or entered into various derivative transactions with respect to our common stockfollowing the pricing of the Notes. In addition, the option counterparties or their respective affiliates may modify their hedge positions by entering intoor unwinding various derivatives contracts with respect to our common stock and/or purchasing or selling our common stock or other securities ofours in secondary market transactions prior to the maturity of the Notes (and are likely to do so during any observation period related to aconversion of Notes or following any repurchase of Notes by us on any fundamental change repurchase date or otherwise). This activity could causeor avoid an increase or a decrease in the market price of our common stock or the Notes.
In addition, if any such convertible note hedge and warrant transactions fail to become effective, the option counterparties or their respectiveaffiliates may unwind their hedge positions with respect to our common stock, which could adversely affect the value of our common stock and thevalue of the Notes.
We are subject to counterparty risk with respect to the note hedge transactions.
The option counterparties are financial institutions or affiliates of financial institutions, and we will be subject to the risk that these optioncounterparties may default under the note hedge transactions. Our exposure to the credit risk of the option counterparties will not be secured by anycollateral. If one or more of the option counterparties to one or more of our note hedge transactions becomes subject to insolvency proceedings, wewill become an unsecured creditor in those proceedings with a claim equal to our exposure at the time under those transactions.
63

Table of Contents
Our exposure will depend on many factors but, generally, the increase in our exposure will be correlated to the increase in the market price of ourcommon stock and in the volatility of the market price of our common stock. In addition, upon a default by one of the option counterparties, we maysuffer adverse tax consequences and dilution with respect to our common stock. We can provide no assurances as to the financial stability orviability of any of the option counterparties.
Item 2. Unregistered Sales of Equity Securities
In connection with an acquisition agreement entered into on February 1, 2016, the Company agreed to issue up to an aggregate of 780,272shares of its Class A common stock to the stockholders of Connectifier, Inc. (“Connectifier”) as a portion of the consideration for all of theoutstanding equity of Connectifier. The acquisition closed on February 19, 2016. The final number of shares of the Company’s Class A commonstock to be issued in connection with the acquisition is subject to adjustment based on (i) purchase price adjustment provisions, (ii) continuingservice obligations to the Company of certain stockholders of Connectifier, and (iii) indemnification obligations of Connecitifier stockholders after theclosing of the acquisition.
The issuance of shares of the Company’s Class A common stock to stockholders of Connectifier in accordance with the terms and subject tothe conditions set forth in the acquisition agreement was made in reliance on the private offering exemption of Section 4(2) of the Securities Actand/or the private offering safe harbor provision of Rule 506 of Regulation D promulgated thereunder based on the following factors: (i) the numberof offerees or purchasers, as applicable, (ii) the absence of general solicitation, (iii) investment representations obtained from the stockholders ofConnectifier, including with respect to their status as accredited investors, (iv) the provision of appropriate disclosure, and (v) the placement ofrestrictive legends on the certificates reflecting the securities.
Item 6. Exhibits
ExhibitNumber Exhibit Description31.1
Certification of Principal Executive Officer Required Under Rule 13a-14(a) and 15d-14(a) of the Securities Exchange Act of 1934,as amended.
31.2
Certification of Principal Financial Officer Required Under Rule 13a-14(a) and 15d-14(a) of the Securities Exchange Act of 1934,as amended.
32.1
Certification of Principal Executive Officer and Principal Financial Officer Required Under Rule 13a-14(b) of the SecuritiesExchange Act of 1934, as amended, and 18 U.S.C. §1350.
101.INS XBRL Instance Document 101.SCH XBRL Taxonomy Schema Linkbase Document 101.CAL XBRL Taxonomy Calculation Linkbase Document 101.DEF XBRL Taxonomy Definition Linkbase Document 101.LAB XBRL Taxonomy Labels Linkbase Document 101.PRE XBRL Taxonomy Presentation Linkbase Document
64
Table of Contents
Signatures
Pursuant to the requirements of the Securities Exchange Act of 1934, the registrant has duly caused this report to be signed on its behalf bythe undersigned, thereunto duly authorized.
LINKEDIN CORPORATION Dated: April 28, 2016 By: /s/ Jeffrey Weiner Jeffrey Weiner
Chief Executive Officer and Director(Principal Executive Officer)
Dated: April 28, 2016 By: /s/ Steven Sordello Steven Sordello
Senior Vice President and Chief Financial Officer(Principal Financial Officer)
65
Table of Contents
Exhibit Index
ExhibitNumber Exhibit Description
31.1 Certification of Principal Executive Officer Required Under Rule 13a-14(a) and 15d-14(a) of the Securities Exchange Act of 1934,as amended.
31.2 Certification of Principal Financial Officer Required Under Rule 13a-14(a) and 15d-14(a) of the Securities Exchange Act of 1934,as amended.
32.1 Certification of Principal Executive Officer and Principal Financial Officer Required Under Rule 13a-14(b) of the SecuritiesExchange Act of 1934, as amended, and 18 U.S.C. §1350.
101.INS XBRL Instance Document 101.SCH XBRL Taxonomy Schema Linkbase Document 101.CAL XBRL Taxonomy Calculation Linkbase Document 101.DEF XBRL Taxonomy Definition Linkbase Document 101.LAB XBRL Taxonomy Labels Linkbase Document 101.PRE XBRL Taxonomy Presentation Linkbase Document

Exhibit 31.1
CERTIFICATION OF CHIEF EXECUTIVE OFFICERPURSUANT TO EXCHANGE ACT RULES 13a-14(a) AND 15d-14(a),
AS ADOPTED PURSUANT TOSECTION 302 OF THE SARBANES-OXLEY ACT OF 2002
I, Jeffrey Weiner, certify that:
1. I have reviewed this Quarterly Report on Form 10-Q of LinkedIn Corporation;
2. Based on my knowledge, this report does not contain any untrue statement of a material fact or omit to state a material fact necessary to make the statementsmade, in light of the circumstances under which such statements were made, not misleading with respect to the period covered by this report;
3. Based on my knowledge, the financial statements, and other financial information included in this report, fairly present in all material respects the financialcondition, results of operations and cash flows of the registrant as of, and for, the periods presented in this report;
4. The registrant's other certifying officer(s) and I are responsible for establishing and maintaining disclosure controls and procedures (as defined in ExchangeAct Rules 13a-15(e) and 15d-15(e)) and internal control over financial reporting (as defined in Exchange Act Rules 13a-15(f) and 15d-15(f)) for the registrantand have:
(a) Designed such disclosure controls and procedures, or caused such disclosure controls and procedures to be designed under our supervision, to ensurethat material information relating to the registrant, including its consolidated subsidiaries, is made known to us by others within those entities, particularlyduring the period in which this report is being prepared;
(b) Designed such internal control over financial reporting, or caused such internal control over financial reporting to be designed under our supervision, toprovide reasonable assurance regarding the reliability of financial reporting and the preparation of financial statements for external purposes in accordancewith generally accepted accounting principles;
(c) Evaluated the effectiveness of the registrant's disclosure controls and procedures and presented in this report our conclusions about the effectiveness ofthe disclosure controls and procedures, as of the end of the period covered by this report based on such evaluation; and
(d) Disclosed in this report any change in the registrant's internal control over financial reporting that occurred during the registrant's most recent fiscalquarter (the registrant's fourth fiscal quarter in the case of an annual report) that has materially affected, or is reasonably likely to materially affect, theregistrant's internal control over financial reporting; and
5. The registrant's other certifying officer(s) and I have disclosed, based on our most recent evaluation of internal control over financial reporting, to theregistrant's auditors and the audit committee of the registrant's board of directors (or persons performing the equivalent functions):
(a) All significant deficiencies and material weaknesses in the design or operation of internal control over financial reporting which are reasonably likely toadversely affect the registrant's ability to record, process, summarize and report financial information; and
(b) Any fraud, whether or not material, that involves management or other employees who have a significant role in the registrant's internal control overfinancial reporting.
Date: April 28, 2016
/s/ Jeffrey Weiner Jeffrey Weiner Chief Executive Officer

Exhibit 31.2
CERTIFICATION OF CHIEF FINANCIAL OFFICERPURSUANT TO EXCHANGE ACT RULES 13a-14(a) AND 15d-14(a),
AS ADOPTED PURSUANT TOSECTION 302 OF THE SARBANES-OXLEY ACT OF 2002
I, Steven Sordello, certify that:
1. I have reviewed this Quarterly Report on Form 10-Q of LinkedIn Corporation;
2. Based on my knowledge, this report does not contain any untrue statement of a material fact or omit to state a material fact necessary to make the statementsmade, in light of the circumstances under which such statements were made, not misleading with respect to the period covered by this report;
3. Based on my knowledge, the financial statements, and other financial information included in this report, fairly present in all material respects the financialcondition, results of operations and cash flows of the registrant as of, and for, the periods presented in this report;
4. The registrant's other certifying officer(s) and I are responsible for establishing and maintaining disclosure controls and procedures (as defined in ExchangeAct Rules 13a-15(e) and 15d-15(e)) and internal control over financial reporting (as defined in Exchange Act Rules 13a-15(f) and 15d-15(f)) for the registrantand have:
(a) Designed such disclosure controls and procedures, or caused such disclosure controls and procedures to be designed under our supervision, to ensurethat material information relating to the registrant, including its consolidated subsidiaries, is made known to us by others within those entities, particularlyduring the period in which this report is being prepared;
(b) Designed such internal control over financial reporting, or caused such internal control over financial reporting to be designed under our supervision, toprovide reasonable assurance regarding the reliability of financial reporting and the preparation of financial statements for external purposes in accordancewith generally accepted accounting principles;
(c) Evaluated the effectiveness of the registrant's disclosure controls and procedures and presented in this report our conclusions about the effectiveness ofthe disclosure controls and procedures, as of the end of the period covered by this report based on such evaluation; and
(d) Disclosed in this report any change in the registrant's internal control over financial reporting that occurred during the registrant's most recent fiscalquarter (the registrant's fourth fiscal quarter in the case of an annual report) that has materially affected, or is reasonably likely to materially affect, theregistrant's internal control over financial reporting; and
5. The registrant's other certifying officer(s) and I have disclosed, based on our most recent evaluation of internal control over financial reporting, to theregistrant's auditors and the audit committee of the registrant's board of directors (or persons performing the equivalent functions):
(a) All significant deficiencies and material weaknesses in the design or operation of internal control over financial reporting which are reasonably likely toadversely affect the registrant's ability to record, process, summarize and report financial information; and
(b) Any fraud, whether or not material, that involves management or other employees who have a significant role in the registrant's internal control overfinancial reporting.
Date: April 28, 2016
/s/ Steven Sordello Steven Sordello Senior Vice President and Chief Financial Officer

Exhibit 32.1
CERTIFICATION OF CHIEF EXECUTIVE OFFICER AND CHIEF FINANCIAL OFFICERPURSUANT TO
18 U.S.C. SECTION 1350,AS ADOPTED PURSUANT TO
SECTION 906 OF THE SARBANES-OXLEY ACT OF 2002
I, Jeffrey Weiner, certify, pursuant to 18 U.S.C. Section 1350, as adopted pursuant to Section 906 of the Sarbanes-Oxley Act of 2002, that the Quarterly Reportof LinkedIn Corporation on Form 10-Q for the fiscal quarter ended March 31, 2016 fully complies with the requirements of Section 13(a) or 15(d) of theSecurities Exchange Act of 1934 and that information contained in such Quarterly Report on Form 10-Q fairly presents, in all material respects, the financialcondition and results of operations of LinkedIn Corporation.
Date: April 28, 2016
By: /s/ Jeffrey Weiner Name: Jeffrey Weiner Title: Chief Executive Officer
I, Steven Sordello, certify, pursuant to 18 U.S.C. Section 1350, as adopted pursuant to Section 906 of the Sarbanes-Oxley Act of 2002, that the Quarterly Reportof LinkedIn Corporation on Form 10-Q for the fiscal quarter ended March 31, 2016 fully complies with the requirements of Section 13(a) or 15(d) of theSecurities Exchange Act of 1934 and that information contained in such Quarterly Report on Form 10-Q fairly presents, in all material respects, the financialcondition and results of operations of LinkedIn Corporation.
Date: April 28, 2016
By: /s/ Steven Sordello Name: Steven Sordello Title: Senior Vice President and Chief Financial Officer