united states pediatric vaccines market, doses, immunization (vaccinated), cases & forecast
TRANSCRIPT

© Renub Research Page 2 of 16
United States Pediatric Vaccines Market Analysis
Pediatric Vaccines market for United States is a multi-billion dollar industry. The value of
United States pediatric vaccines market alone is expected to reach more than US$ 18 Billion
by 2020. The United States Pediatric vaccines market is driven by favorable demographics,
growing public acceptance and product innovation. Varicella and Pneumococcal vaccines
(PCV) control the highest and second highest market share in United States respectively.
Together both of these vaccines control more than 50% market share.
In number of cases Polio, MMR, Diphtheria and Tetanus cases have diminished significantly
from the year 2001 till 2013. In United States, DTP are the highly penetrated vaccines in
pediatric vaccines market which contributed more than 100 Million doses in 2014. Polio and
MMR are also mostly used vaccines together they consumed more than 150 Million doses in
2014. It is predicted that these three vaccines will bolster the usable pattern in the United
States.
The United States pediatric vaccines are expected to remain highly active in the future,
fueled by the encouragement and financing from Governments and other health
organizations.
This is 8th edition report on Vaccines Market & 3rd edition on Pediatric Vaccines Market by
Renub Research. Report titled " United States Pediatric Vaccines Market, Doses,
Immunization (Vaccinated), Cases & Forecast” talks about the pediatric vaccines. The
report provides information on all the Ten (10) Pediatric Vaccines Market, Doses, Number of
Children Being Vaccinated and Number of Cases in United States. This report covers in detail
all aspects of past, present and future scenario. The report also entails major factors driving
the Pediatric vaccines market and challenges of Pediatric vaccines market.
Ten (10) Pediatric Vaccines Covered in this Report are as follows:
1. Measles, Mumps & Rubella (MMR) Vaccines
2. Haemophilus Influenzae Type B (HIB) Vaccines
3. Polio Vaccines
4. Diphtheria Tetanus & Pertussis (DTaP) Vaccines

© Renub Research Page 3 of 16
5. Pneumococcal Vaccines
6. Rotavirus Vaccines
7. Hepatitis B Pediatric Vaccines
8. Hepatitis A Pediatric Vaccines
9. Varicella / Chicken Pox Vaccines
10. Influenza Pediatric Vaccines
All the Pediatric Vaccines in this Report have been studied from Four View Points:
1. Number of Cases
2. Number of Doses
3. Number of Children Being Vaccinated
4. Market Size for all 10 Pediatric Vaccines
Key Topics Covered in the Report
United States – Pediatric Vaccines Market & Forecast
United States – Pediatric Vaccines Market Share & Forecast
United States - Pediatric Disease Cases
Pediatric Vaccines Doses and Forecast
Number of Children Being Vaccinated
Market Size for all 10 Pediatric Vaccines
Growth Drivers of Pediatric Vaccines Market
Challenges of Pediatric Vaccines Market

© Renub Research Page 4 of 16
Data Sources
This report is built using data and information sourced from proprietary databases, primary
and secondary research and in-house analysis by Renub Research team of industry experts.
Primary sources include industry surveys and telephone interviews with industry experts.
Secondary sources information and data has been collected from various printable and non-
printable sources like search engines, News websites, Government Websites, Trade Journals,
White papers, Government Agencies, Magazines, Newspapers, Trade associations, Books,
Industry Portals, Industry Associations and access to more than 500 paid databases.

© Renub Research Page 5 of 16
About Us
RReennuubb RReesseeaarrcchh is a leading Market Research and Information Analysis Company with
centers at Noida India and Roswell USA. We have long-term experience especially in
international Business-to-Business Researches, Surveys, Business and Consulting. Throughout
the years we have acquired expertise in most market sectors, including Information
Technology (IT), Telecoms, Life Sciences, Medical & Pharmaceuticals, Financial Services
(Banking, Insurance, Reinsurance, M&A, etc.), Energy, Chemicals, Automotive, Retail, FMCG,
Consumer Goods, Logistics, Governmental, Social, and Others.
Our core team is comprised of an experienced people holding graduate, post graduate and
Ph.D. degrees in Finance, Marketing, Human Resource, Bio-Technology, Medicine, Information
Technology, Environmental Science and many more. Our research help make the business
decisions: on strategy, organization, operations, technology, mergers & acquisitions etc. We
support many blue chip companies by providing them findings and perspectives across a wide
range of markets. Our research reports offer a blend of information insight, analysis and
forecasting that is essential in today’s ultra-competitive markets.
For more information on us or to view any of our sample work you can
mail us at [email protected]

© Renub Research Page 6 of 16
Published
By
RReennuubb RReesseeaarrcchh
1st Floor
C – 86, Sector – 10
Noida – 201301
Phone: +91–120–421–9822, 254–5750 (India)
+1–678–302–0700 (USA)
Fax : +91–120–424–9780
Email: [email protected]
www.renub.com
© United States Pediatric Vaccines Market, Doses, Immunization (Vaccinated), Cases &
Forecast
Renub Research, 2015
Edition 3.0
All rights reserved. This publication is protected
by copyright. No part of it may be reproduced, stored
in a retrieval system or transmitted, in any form or by
any means, electronic mechanical, photocopying,
recording or otherwise without the prior written
permission of the publishers

© Renub Research Page 7 of 16
Table of Contents
1. Executive Summary
2. United States – Pediatric Vaccines Market & Forecast
3. United States – Pediatric Vaccines Market Share & Forecast
4. United States – Pediatric Vaccines Cases, Doses, Immunization Coverage, Market & Forecast
4.1 United States – Measles, Mumps & Rubella (MMR) Vaccines & Forecast
4.1.1 Number of Measles, Mumps & Rubella (MMR) Cases
4.1.2 Number of Measles, Mumps & Rubella (MMR) Vaccines Doses
4.1.3 Measles, Mumps & Rubella (MMR) – Number of Children Being Vaccinated
4.1.4 Market Size of Measles, Mumps & Rubella (MMR) Vaccines
4.2 United States – Haemophilus Influenzae Type B (HIB) Vaccines & Forecast
4.2.1 Number of Haemophilus Influenzae Type B (HIB) Vaccines Doses
4.2.2 Haemophilus Influenzae Type B (HIB) – Number of Children Being Vaccinated
4.2.3 Market Size of Haemophilus Influenzae Type B (HIB) Vaccines
4.3 United States – Polio Vaccines & Forecast
4.3.1 Number of Polio Cases
4.3.2 Number of Polio Vaccines Doses
4.3.3 Polio Vaccines – Number of Children Being Vaccinated
4.3.4 Market Size of Polio Vaccines
4.4 United States – Diphtheria, Tetanus & Pertussis (DTap) Vaccines & Forecast
4.4.1 Number of Diphtheria, Tetanus & Pertussis (DTaP) Cases
4.4.2 Number of Diphtheria, Tetanus & Pertussis (DTaP) Vaccines Doses
4.4.3 Diphtheria, Tetanus & Pertusis (DTaP) – Number of Children Being Vaccinated
4.4.4 Market Size of Diphtheria, Tetanus & Pertussis (DTaP) Vaccines
4.5 United States – Pneumococcal Vaccines & Forecast
4.5.1 Number of Pneumococcal Vaccines Doses
4.5.2 Pneumococcal – Number of Children Being Vaccinated
4.5.3 Market Size of Pneumococcal Vaccines
4.6 United States – Rotavirus Vaccines & Forecast
4.6.1 Number of Rotavirus Vaccines Doses
4.6.2 Rotavirus – Number of Children Being Vaccinated
4.6.3 Market Size of Rotavirus Vaccine

© Renub Research Page 8 of 16
4.7 United States – Hepatitis B Pediatric Vaccines & Forecast
4.7.1 Number of Hepatitis B Pediatric Vaccines Doses
4.7.2 Hepatitis B Pediatric – Number of Children Being Vaccinated
4.7.3 Market Size of Hepatitis B Pediatric Vaccines
4.8 United States – Hepatitis A Pediatric Vaccines & Forecast
4.8.1 Number of Hepatitis A Pediatric Vaccines Doses
4.8.2 Hepatitis A Pediatric – Number of Children Being Vaccinated & Forecast
4.8.3 Market Size of Hepatitis A Pediatric Vaccines
4.9 United States – Varicella / Chicken Pox Vaccines & Forecast
4.9.1 Number of Varicella / Chicken Pox Vaccines Doses
4.9.2 Varicella/Chicken Pox – Number of Children Being Vaccinated
4.9.3 Market Size of Varicella/Chicken Pox Vaccines
4.10 United States – Influenza Pediatric Vaccines & Forecast
4.10.1 Number of Influenza Pediatric Vaccines Doses
4.10.2 Influenza Pediatric Vaccines – Number of Children Being Vaccinated
4.10.3 Market Size of Influenza Pediatric Vaccines
5. Growth Drivers of United States Pediatric Vaccines Market
5.1 Increase Immunization Rates & Reduce Preventable Infectious Diseases
5.2 Increasing Vaccine Availability in United States
5.3 The Vaccine Safety Data link Project
5.4 The Vaccine Injury Compensation Program
5.5 Transforming of Vaccine Technologies
5.6 Continuous Focus on Effective Communication Strategies
6. Challenges of United States Pediatric Vaccines Market
6.1 Impediment in Pediatric Vaccine Research & Development
6.2 Barriers to New Entrants in the Pediatric Vaccines Market
6.3 Hurdles to Optimal use of Licensed Vaccines
6.3.1 Technical Obstacles
6.3.2 Economic obstacles
6.3.3 Cultural Obstacles
6.4 Complexity of Vaccine Development & Approval System Thwarts Product Development
6.4.1 Legal Obstacles

© Renub Research Page 9 of 16
6.4.2 General Technical Barriers
6.4.3 Economic Barriers
6.4.4 Regulatory Barriers
6.5 Shortening the Timeline for Vaccine Development
6.6 Refusal / Resistance to Vaccination
6.6.1 Vaccine Adverse Event Reporting System
6.7 Vaccine Shortages and Delays
6.8 Emerging Issues in Immunization and Infectious Diseases in United States

© Renub Research Page 10 of 16
List of Figures
Figure 2-1: United States – Pediatric Vaccines Market (Million US$), 2010 – 2014
Figure 2-2: United States – Forecast for Pediatric Vaccines Market (Million US$), 2015 – 2020
Figure 3-1: United States – Pediatric Vaccines Market Share (Percent), 2010 – 2014
Figure 3-2: United States – Forecast for Pediatric Vaccines Market Share (Percent), 2015 – 2020
Figure 4-1: United States – Number of MMR Vaccines Doses (Million Doses), 2010 – 2014
Figure 4-2: United States – Forecast for Number of MMR Vaccines Doses (Million Doses), 2015 – 2020.
Figure 4-3: United States – Number of Children Being Vaccinated with MMR Vaccines (Million), 2010 –
2014
Figure 4-4: United States – Forecast for Number of Children Being Vaccinated with MMR Vaccines
(Million), 2015 – 2020
Figure 4-5: United States – Measles, Mumps & Rubella Vaccines Market (Million US$), 2010 – 2014
Figure 4-6: United States – Forecast for Measles, Mumps & Rubella Vaccines Market (Million US$), 2015
– 2020
Figure 4-7: United States – Number of Doses of Haemophilus Influenzae Type B Vaccines (Million
Doses), 2010 – 2014
Figure 4-8: United States – Forecast for Number of Doses of Haemophilus Influenzae Type B Vaccines
(Million Doses), 2015 – 2020
Figure 4-9: United States – Number of Children Being Vaccinated with Haemophilus Influenzae Type B
Vaccines (Million), 2010 – 2014
Figure 4-10: United States – Number of Children Being Vaccinated with Haemophilus Influenzae Type B
Vaccines (Million), 2015 – 2020
Figure 4-11: United States – Haemophilus Influenzae Type B (HIB) Vaccines Market (Million US$), 2010
– 2014
Figure 4-12: United States – Forecast for Haemophilus Influenzae Type B (HIB) Vaccines Market (Million
US$), 2015 – 2020
Figure 4-14: United States – Number of Doses of Polio Vaccines (Million Doses), 2010 – 2014
Figure 4-15: United States – Forecast for Number of Doses of Polio Vaccines (Million Doses), 2015 –
2020
Figure 4-16: United States – Number of Children Being Vaccinated with Polio Vaccines (Million), 2010 –
2014
Figure 4-17: United States – Forecast for Number of Children Being Vaccinated with Polio Vaccines
(Million), 2015 – 2020
Figure 4-18: United States – Polio Vaccines Market (Million US$), 2010 – 2014
Figure 4-19: United States – Forecast for Polio Vaccines Market (Million US$), 2015 – 2020
Figure 4-20: United States – Number of Doses of DTaP Vaccines (Million Doses), 2010 – 2014
© Renub Research Page 11 of 16
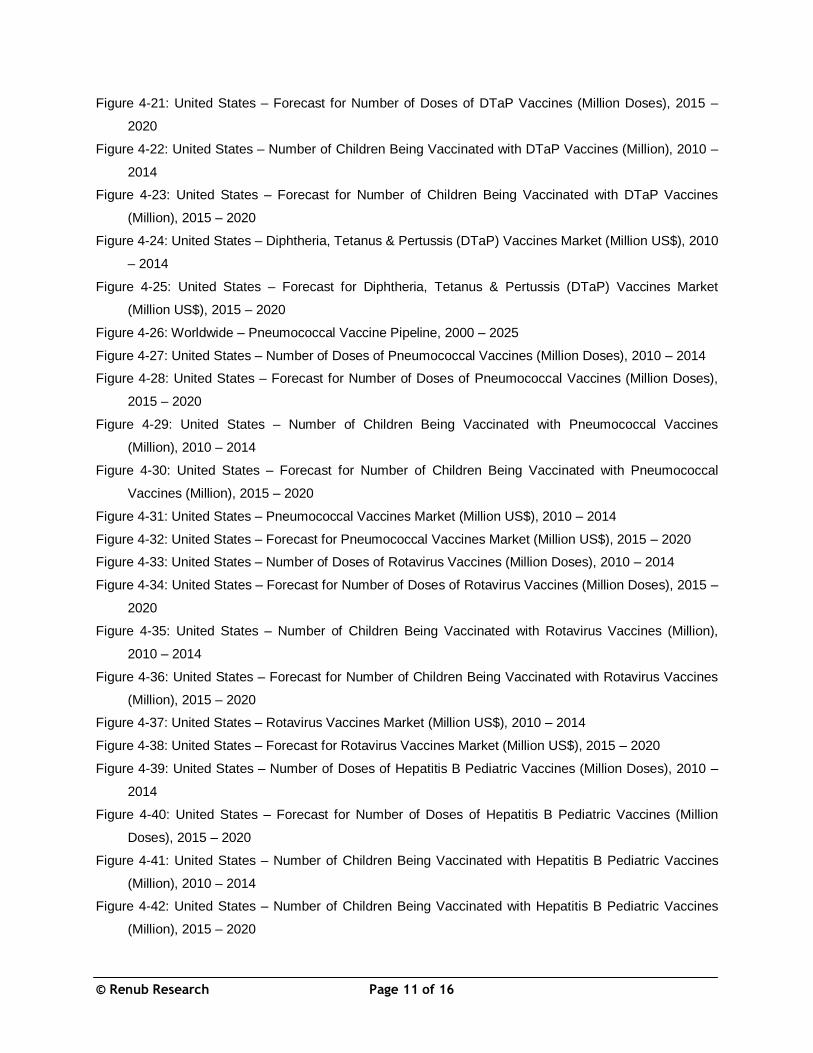
Figure 4-21: United States – Forecast for Number of Doses of DTaP Vaccines (Million Doses), 2015 –
2020
Figure 4-22: United States – Number of Children Being Vaccinated with DTaP Vaccines (Million), 2010 –
2014
Figure 4-23: United States – Forecast for Number of Children Being Vaccinated with DTaP Vaccines
(Million), 2015 – 2020
Figure 4-24: United States – Diphtheria, Tetanus & Pertussis (DTaP) Vaccines Market (Million US$), 2010
– 2014
Figure 4-25: United States – Forecast for Diphtheria, Tetanus & Pertussis (DTaP) Vaccines Market
(Million US$), 2015 – 2020
Figure 4-26: Worldwide – Pneumococcal Vaccine Pipeline, 2000 – 2025
Figure 4-27: United States – Number of Doses of Pneumococcal Vaccines (Million Doses), 2010 – 2014
Figure 4-28: United States – Forecast for Number of Doses of Pneumococcal Vaccines (Million Doses),
2015 – 2020
Figure 4-29: United States – Number of Children Being Vaccinated with Pneumococcal Vaccines
(Million), 2010 – 2014
Figure 4-30: United States – Forecast for Number of Children Being Vaccinated with Pneumococcal
Vaccines (Million), 2015 – 2020
Figure 4-31: United States – Pneumococcal Vaccines Market (Million US$), 2010 – 2014
Figure 4-32: United States – Forecast for Pneumococcal Vaccines Market (Million US$), 2015 – 2020
Figure 4-33: United States – Number of Doses of Rotavirus Vaccines (Million Doses), 2010 – 2014
Figure 4-34: United States – Forecast for Number of Doses of Rotavirus Vaccines (Million Doses), 2015 –
2020
Figure 4-35: United States – Number of Children Being Vaccinated with Rotavirus Vaccines (Million),
2010 – 2014
Figure 4-36: United States – Forecast for Number of Children Being Vaccinated with Rotavirus Vaccines
(Million), 2015 – 2020
Figure 4-37: United States – Rotavirus Vaccines Market (Million US$), 2010 – 2014
Figure 4-38: United States – Forecast for Rotavirus Vaccines Market (Million US$), 2015 – 2020
Figure 4-39: United States – Number of Doses of Hepatitis B Pediatric Vaccines (Million Doses), 2010 –
2014
Figure 4-40: United States – Forecast for Number of Doses of Hepatitis B Pediatric Vaccines (Million
Doses), 2015 – 2020
Figure 4-41: United States – Number of Children Being Vaccinated with Hepatitis B Pediatric Vaccines
(Million), 2010 – 2014
Figure 4-42: United States – Number of Children Being Vaccinated with Hepatitis B Pediatric Vaccines
(Million), 2015 – 2020

© Renub Research Page 12 of 16
Figure 4-43: United States – Hepatitis B Pediatric Vaccines Market (Million US$), 2010 – 2014
Figure 4-44: United States – Forecast for Hepatitis B Pediatric Vaccines Market (Million US$), 2015 –
2020
Figure 4-45: United States – Number of Doses of Hepatitis A Pediatric Vaccines (Million Doses), 2010 –
2014
Figure 4-46: United States – Forecast for Number of Doses of Hepatitis A Pediatric Vaccines (Million
Doses), 2015 – 2020
Figure 4-47: United States – Number of Children Being Vaccinated with Hepatitis A Pediatric Vaccines
(Million), 2010 – 2014
Figure 4-48: United States – Forecast for Number of Children Being Vaccinated with Hepatitis A Pediatric
Vaccines (Million), 2015 – 2020
Figure 4-49: United States – Hepatitis A Pediatric Vaccines Market (Million US$), 2010 – 2014
Figure 4-50: United States – Forecast for Hepatitis A Pediatric Vaccines Market (Million US$), 2015 –
2020
Figure 4-51: United States – Number of Doses of Varicella Vaccines (Million Doses), 2010 – 2014
Figure 4-52: United States – Forecast for Number of Doses of Varicella Vaccines (Million Doses), 2015 –
2020
Figure 4-53: United States – Number of Children Being Vaccinated with Varicella Vaccines (Million), 2010
– 2014
Figure 4-54: United States – Forecast for Number of Children Being Vaccinated with Varicella Vaccines
(Million), 2015 – 2020
Figure 4-55: United States – Varicella Vaccines Market (Million US$), 2010 – 2014
Figure 4-56: United States – Forecast for Varicella Vaccines Market (Million US$), 2015 – 2020
Figure 4-57: United States – Number of Influenza Pediatric Vaccines Doses (Million Doses), 2010 – 2014
Figure 4-58: United States – Forecast for Number of Influenza Pediatric Vaccines Doses (Million Doses),
2015 – 2020
Figure 4-59: United States – Number of Children Being Vaccinated with Influenza Pediatric Vaccines
(Million), 2010 – 2014
Figure 4-60: United States – Forecast for Number of Children Being Vaccinated with Influenza Pediatric
Vaccines (Million), 2015 – 2020
Figure 4-61: United States – Influenza Pediatric Vaccines Market (Million US$), 2010 – 2014
Figure 4-62: United States – Forecast for Influenza Pediatric Vaccines Market (Million US$), 2015 – 2020
Figure 5-1: United States – Number of Retail Clinics offering Vaccination (Number), 2007 – 2012

© Renub Research Page 13 of 16
List of Tables
Table 4-1: United States – Number of Measles Cases (Number), 1999 – 2013
Table 4-2: United States – Number of Mumps Cases (Number), 1999 – 2013
Table 4-3: United States – Number of Rubella Cases (Number), 1999 – 2013
Table 4-4: United States – Number of Polio Cases (Number), 2001 – 2013
Table 4-5: United States – Number of Diphtheria Cases (Number), 1999 – 2013
Table 4-6: United States – Number of nTetanus Cases (Number), 1999 – 2013
Table 4-7: United States – Number of tTetanus Cases (Number), 1999 – 2013
Table 4-8: United States – Number of Pertussis Cases (Number), 1999 – 2013
Table 5-1: Improvement Strategies or Requirements – the Joint Commission and the Project’s
Collaborating Organizations

© Renub Research Page 14 of 16
Order Form
Scan and e-mail this page to [email protected], alternatively one can also write the Contact
Information in an e-mail and mail it. Else you can also fax this form to +91-120-424-9780
Questions? Please call +91-120-421-9822 (India), +1-678-302-0700 (USA) or mail to
Format
Report Title: United States Pediatric Vaccines Market, Doses, Immunization (Vaccinated),
Cases & Forecast
Single User (Email from Publisher)
Hard Copy (Mail Delivery)
CD – Rom (Mail Delivery)
Global Site License (Multiple User License)
US$ 1,100 US$ 1,200 US$ 1,200 US$ 1,900
For ordering this report: Three easy ways to place your order:
1) Order online by Credit Card (Visa, MasterCard, etc.):
http://www.renub.com/report/united-states-pediatric-vaccines-market-doses-immunization-
vaccinated-cases-forecast-165
2) Order by Wire Transfer:
http://www.renub.com/report/wiretransfer.aspx?id=165&pid=1633
To pay by Wire Transfer, please, fill in your contact details in the form below:
© Renub Research Page 15 of 16
Bank Details
Account Name: Renub Research
A/C No.: 109102000023296
Name of Bank: IDBI Bank Ltd.
Swift Code: IBKLINBB010
Bank Address: 4th Floor
Indian Red Cross Building
1 Red Cross Road
Opposite Parliament Street
New Delhi – 110001
India
Contact Information
First Name: Last Name:
Email:
Job Title:
Company:
Address:
City:
Postal/Zip Code:
Country:
Phone:
Mobile:
Fax:
Report Format:
Your message:
© Renub Research Page 16 of 16
3) Order by Check
Please post the check accompanied by this form, to:
Company Address: Renub Research
1st Floor
C-86, Sector -10
Noida - 201301
Uttar Pradesh
India
Phone: +91-120-421-9822, 424-9780
For free Sample copy report or to view any of our sample work please contact us at
[email protected] or call +91-120-421-9822 (India), +1-678-302-0700 (USA)
Follow Us
Facebook: http://www.facebook.com/pages/Renub-Research/233380966701090
LinkedIn: http://www.linkedin.com/company/renub-research
Twitter: http://twitter.com/RenubResearch