unit5 research project
TRANSCRIPT

Unit 5 Research Project
Worthing College Sports ScienceCatriona Phillips
2015

Assessment Criteria Pages 3-17 & 27-38
• P2: carry out sport science or exercise science-based research
• P3: collect and record data from the research project conducted
• M2: correctly analyse collected data, describing techniques used
• D1: correctly analyse data, explaining techniques used
• P4: produce a full research report using a standard scientific structure

Research into the reasons for female drop out of sport and
physical activity post 16.
P2: Carry out / P4: Produce
Abstract
The aim of this research was to identify the main reasons for the post 16 female drop out from physical activity. This research will then aid schools/colleges or other organisations that are providers of female sport.The data was collected through primary research- a survey that I created. The information I used to create this survey was secondary research by using existing research for the reasons that I used in the survey. I selected 20 of the most commonly occurring reasons in the research.My research found that the top three reasons for a drop out were; not enough time, body image and “I’m not good at sports”.My findings show that there is a higher percentage of girls who don’t take part in as much exercise as they did at GCSE level.
P2: Carry out / P4: Produce

Contents: General3- tittle page4- abstract5- general contents page6- appendices contents page7- figures and tables contents page8- acknowledgements9- introduction 10-literature review11- hypotheses12-method13- data collection14-data analysis15-results16- discussion17- conclusion19-21- review22-26-further recommendationsP2: Carry out / P4: Produce

Contents: Appendices
27- Sport England research.28- daughters of Islam article.
P2: Carry out / P4: Produce

Contents: Figures and Tables
31- Age pie chart32- Ethnicity33- participation rates34- reasons35- still participating amounts of exercise.
P2: Carry out / P4: Produce

Acknowledgements
I would like to thank Paul Cox for the help he has given me during this project. I would also like to thank all the people who took the time to complete the survey for me.
P2: Carry out / P4: Produce

Introduction
Here you need to introduce your project. What is the aim? By the end of my research project I aIm to have identified the main reasons for female drop out from sport and physical education.Why did you choose the aim? I chose my aim because it is something that interests me. I am interested in this because I think its an issue that a lot of girls encounter when taking part in sport and physical activity at many levels from school PE to high level sport. There are far higher amount of girls that drop out from sport and physical activity than boys so I wanted to find out the reasons for this.What was the project timescale? Mid-January for preliminary research- march 27th final report.
P2: Carry out / P4: Produce

Literature Review and References
https://worthingsportscience.wordpress.com/2015/02/27/unit-5-literary-review-catriona-phillips/
P2: Carry out / P4: Produce

Project Hypothesis
What is your project hypothesis (or hypotheses)?
If I research the reasons for drop out from sport I predict that the reasons that will come up most are other commitments and body image.
P2: Carry out / P4: Produce

MethodYour method should include detailed instructions. What you are going to do, how are you going to do it, who is going to do it and when key actions will be completed.In order to collect my information I need to produce a online and offline survey. This needs to be clear and easy to follow for the participants. I will use survey monkey online and then use a screenshot of this survey as the hard copy. The survey will ask the participant to select the three most relevant reasons for their decline in participation if they had in fact reduced the amount of exercise they had taken part in at GCSE level. The data I will collect will be mostly quantitative data so I will be able to create easily readable charts and tables using numbers. I will be able to draw conclusions also from the qualitative data that some people will give in response.I will need to get a large sample size so will be using social media to spread the survey. I will be emailing schools also to get as many participants as possible. I will also be handing out the paper surveys around college. For this I will attempt to be wearing normal clothes instead of sports kit so that my attire doesn’t affect the responses I am given.P3: Collect and record / M2: Correctly analyse & describe techniques / D1: Correctly analyse & explain techniques
Data Collection
To collect my data I will use a survey I have designed on survey monkey as well as a paper version of the same survey. The data is quantitative with some of the questions having the option of including qualitative data if there answer isn’t there. The paper surveys will be handed out around college for this I need to make sure that I am wearing neutral clothing so that it doesn’t have an impact on the answers given. I also need to say the same thing before giving the questionnaires out so that it is the same set up for each participant so that what I say doesn’t influence the results. The online survey will collect data from other places and colleges. This means the data is more reliable as it comes from a wider area.
P3: Collect and record / M2: Correctly analyse & describe techniques / D1: Correctly analyse & explain techniques

Data Analysis
I will be using bar graphs to present the data so that it is easy to read and draw conclusions from. I’m predicting there will be two or three reasons with much higher responses than the others a bar graph will be able to make this obvious. I will write the qualitative data up and include the most frequently occurring. I will also write these into my results as things that hadn’t come up as the most frequent things in the previous research(see appendix 1&2) that I used as the basis of mine.
P3: Collect and record / M2: Correctly analyse & describe techniques / D1: Correctly analyse & explain techniques

ResultsThe responses to my research came mostly from 17 and 18 year olds with a small percentages from the other two groups. (see tables and figures 1). The responses came from a variety of places but mostly from Worthing College (my current college) and Maiden Erlegh (my previous school). The most common ethnicity to answer was white (see tables and figures 2). This may have an effect on the result however the respondents of the other ethnic groups followed the same the pattern. The responses were 41.30% yes and 58.70% no for a reduction in participation in sport (see tables and figures 3). From the no responses the most common response was “body image” followed by “not enough time” (see tables and figures 4) this was slightly different to what I predicted in my hypothesis. However not completely unpredicted and not unrelated to my hypothesis. The results also showed that from the group who responded yes to participating as much as before still participated in at least the minimum amount of exercise recommended by the government.
P3: Collect and record / M2: Correctly analyse & describe techniques / D1: Correctly analyse & explain techniques

DiscussionI found that body image, not enough time and “I’m not good at sport” where the most common reasons given for a reduction in participation rates in exercise. In my hypothesis I stated that I predicted that body image and other commitments would be the most common answers given. This means my hypothesis was half correct. Not enough time coming up as a common answer isn't unexpected as it links to having other commitments. “I’m not good at sport” as a reason was more surprising. The research was looking into physical activity so this includes things like going to the gym. This is why it is surprising that this has come up as a main reason for people not taking part in any form of exercise. This is something that campaigns such as This Girl Can address and aim to change.
P2: Carry out / P4: Produce

Conclusion
To identify the main reasons that cause a post 16 drop out from physical activity among girls.The trends that appeared most often within the prior research I conducted were body image and other commitments being the reasons for the drop out. I based my hypothesis on this. However I also found that “I’m not good at sport” appeared higher than other commitments. This was interesting as the research was looking at physical activity not specifically sport. So it appearing as a reason for not taking part in physical activity could be an interesting follow up set of interviews to identify why this has become a preventative issue for many girls.
P2: Carry out / P4: Produce

Assessment Criteria Pages 19-26
• P5: carry out a review of the research project conducted, describing strengths, areas for improvement and future recommendations.
• M3: carry out a review of the research project, explaining strengths, areas for improvement and future recommendations.
• D2: carry out a review of the research project, justifying future recommendations for further research.

Review (1/3)
How well did project conclusions meet project aims? The conclusion met my aims as it identified the main reasons. It also gave possible further research in the form of interviews. These reasons may enable schools, colleges and sports clubs to target their advertising appropriately.
P5: Describe / M3: Explain / D2: Justify

Review (2/3)
What were the strengths of the research project? The large number of responses (93). This meant the research and the results were more valid as they showed a wider population. The use of social media to spread the survey also lead to the survey being answered from many different parts of the country- I had responses from Aberdeen and Bath well as from the Worthing Area.
P5: Describe / M3: Explain / D2: Justify
Review (3/3)
What were the areas for improvement of the research project? I would have had a longer time frame in order to collect more data. I would also have used a different online survey website that gives access to more responses and more analysis features for free.
P5: Describe / M3: Explain / D2: Justify

Future Recommendations (1/5)
If the project was to be completed again what would you change and why? I would have used a different website to collect the data so that I can access all the features, the free version of survey monkey limits the data analysis you can do and also limits the number of responses to 100. I collected fewer responses than 100 however if I had received more than this I wouldn’t have been able to analyse the data in one group.
P4: Produce / P5: Describe / M3: Explain / D2: Justify

Future Recommendations (2/5)
What would be the benefits of the proposed changes stated on the previous page? If I was able to collect and analyse a higher number of responses I would be able to have a more detailed, wider and more accurate set of results. The results would have been more accurate and showed a wider section of the sample.
P4: Produce / P5: Describe / M3: Explain / D2: Justify

Future Recommendations (3/5)
State a proposal for further research (in total three proposals are needed and this is number one of three) For further research I would ask participants to rate the reasons for their drop out from one to three so I can see which comes up as most relevant.
P4: Produce / P5: Describe / M3: Explain / D2: Justify

Future Recommendations (4/5)
State a proposal for further research (in total three proposals are needed and this is number two of three)I would conduct interviews after they had indicated a reduction in activity. This would mean I would have more qualitative data to work with when writing things up. I would be looking specifically at the group who answered “I’m not good at sports” as this was the unexpected response that came out very highly. But also as it would be interesting to see why this has affected their participation in any form of exercising.
P4: Produce / P5: Describe / M3: Explain / D2: Justify

Future Recommendations (5/5)
State a proposal for further research (in total three proposals are needed and this is number three of three)I would have done the research over a longer period of time so that I could have collected more data.
P4: Produce / P5: Describe / M3: Explain / D2: Justify

Research Project Appendices
Appendix 1
https://www.sportengland.org/media/39365/understanding-participation-among-15-19-year-old-girls-summary-report.pdf

Appendix 2
http://irs.sagepub.com/content/41/3-4/357.short

Research Project Figures and Tables
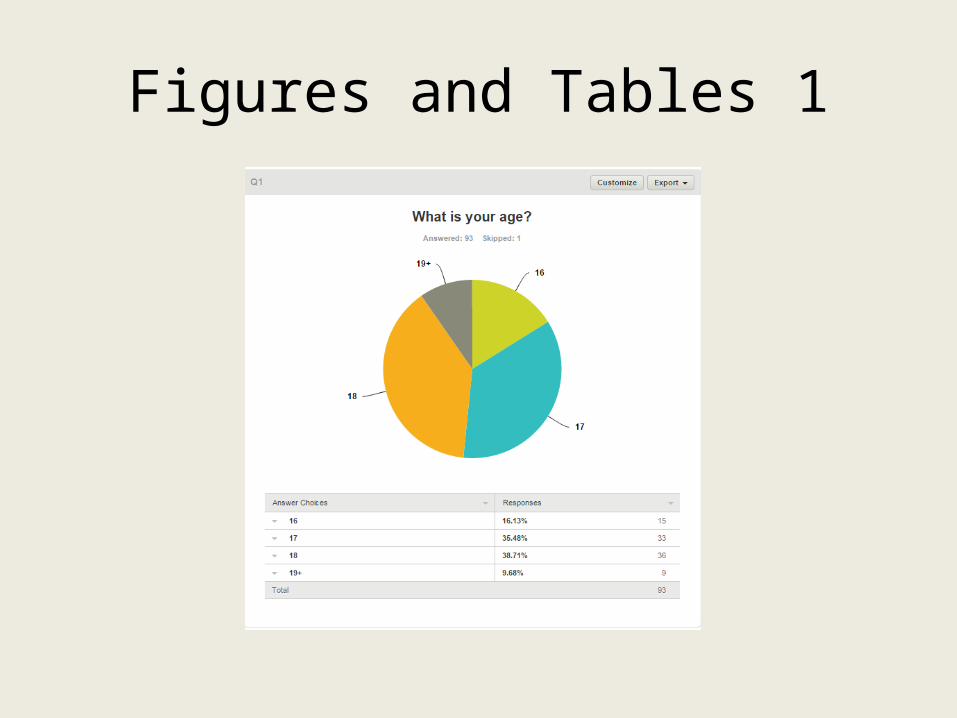
Figures and Tables 1
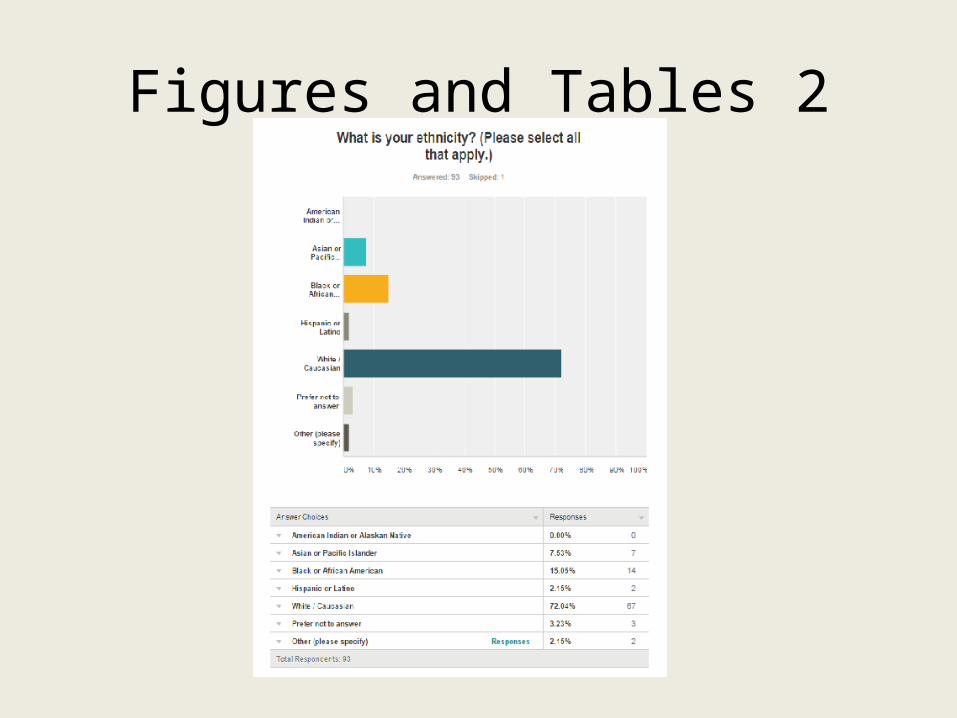
Figures and Tables 2

Figures and Tables 3

Figures and Tables 4

Figures and Tables 5