unit 6: formulas and patterns - · pdf file09.06.2015 · unit 6: formulas and...
TRANSCRIPT
Unit 6: Formulas and Patterns
Section 6.1: Connect the Dots?
Section 6.2: Equations and Graphs
Section 6.3: Graphing Equations by Plotting Points
Section 6.4: Intercepts
Section 6.5: Horizontal and Vertical Lines
Section 6.6: Looking for Patterns
KEY TERMS AND CONCEPTS
Look for the following terms and concepts as you work through the Media Lesson. In the
space below, explain the meaning of each of these concepts and terms in your own words.
Provide examples that are not identical to those in the Media Lesson.
Continuous Graph
Discrete Graph
The Graph of an Equation
Horizontal Intercept

Finding the Horizontal
Intercept given an
equation
Vertical Intercept
Finding the Vertical
Intercept given an
equation
Horizontal Line
Vertical Line

Unit 6: Media Lesson
Section 6.1: Connect the Dots?
General Notes
If you are given a table of data, you can only plot those specific values (without
connecting them), unless the context defines a pattern or rate of change that can be
used to accurately define values in between the given data values.
In the media, graphs are often presented as a solid line in order so show a general trend
or to make the graph look more appealing. However, not all of the points on the line
may make sense in the given situation.
Example 1: Match the stories with the graphs below, and label the axes accordingly.
Story A: Andy is selling snow cones for $3 each. This graph shows the revenue earned
from selling the snow cones.
Story B: Andrea is saving money for a trip to Disneyland. Every payday, she sets aside
$100 for the trip. She gets paid every two weeks. This graph shows the amount of
money saved over time.
Story C: Andrew is walking to school. There are no streets to cross, so he is able to walk
at a constant rate. This graph shows Andrew’s distance from home over time.

Unit 6: Formulas and Patterns Media Lesson
Example 2: Consider the graph below. Do all of the points on the graph make sense in the
given situation?
Section 6.1 – You Try
Match the stories with the graphs below, and label the axes accordingly.
Story A. Water is being drained from a tub. This graph shows the amount of water
remaining in the tub (in gallons) after m minutes.
Story B. Each ride at a carnival costs $2. This graph shows the amount of money Henry
has left over after riding x rides.
Story C. An electronics store is offering payment plans with 0% interest. Isabel purchases a
laptop and pays $250 on the first of every month to pay it off. This graph represents the
remaining balance after m months.

Unit 6: Formulas and Patterns Media Lesson
Section 6.2: Equations and Graphs
Definition
The graph of an equation is the set of all points for which the equation is true.
Example 1: Verify that the ordered pairs below satisfy the equation y = 2x + 3.
(–2, –1) (0, 3) (1, 5)
Unit 6: Formulas and Patterns Media Lesson
Example 2: Verify that the ordered pairs below satisfy the equation 3x + 2y = 6.
(–2, 6) (0, 3) (2, 0)
Section 6.2 – You Try
Verify that the ordered pairs below satisfy the equation y = x2 + 2x – 5. Show all steps as in
the media examples.
(–3, –2) (4, 19) (0, –5)

Unit 6: Formulas and Patterns Media Lesson
Section 6.3: Graphing Equations by Plotting Points
Example 1: Use the equation 𝑦 =1
2𝑥 − 2 to complete the table below. Graph your results.
x y Ordered Pair
-6
-4
-2
0
2
4
6
Example 2: Use the equation y = –x2 + 5 to complete the table below. Graph your results.
x y Ordered Pair
-3
-2
-1
0
1
2
3
Unit 6: Formulas and Patterns Media Lesson
Example 3: Use the equation y = 2x to complete the table below. Graph your results.
x y Ordered Pair
-2
-1
0
1
2
3
4
Section 6.3 – You Try
Use the equation y = |x – 2| to complete the table below. Graph your results.
x y Ordered Pair
-6
-4
-2
0
2
4
6
Unit 6: Formulas and Patterns Media Lesson
Section 6.4: Intercepts
Vertical and Horizontal Intercepts
The vertical intercept is the point at which the graph crosses the vertical axis.
The input value of the vertical intercept is always____________
The coordinates of the vertical intercept will be _____________
To determine the vertical intercept:
The horizontal intercept is the point at which the graph crosses the horizontal axis.
The output value of the horizontal intercept is always_________
The coordinates of the horizontal intercept will be ___________
To determine the horizontal intercept:
Example 1: Determine the vertical and horizontal intercepts for y = 3x – 2.
x y Ordered Pair
Unit 6: Formulas and Patterns Media Lesson
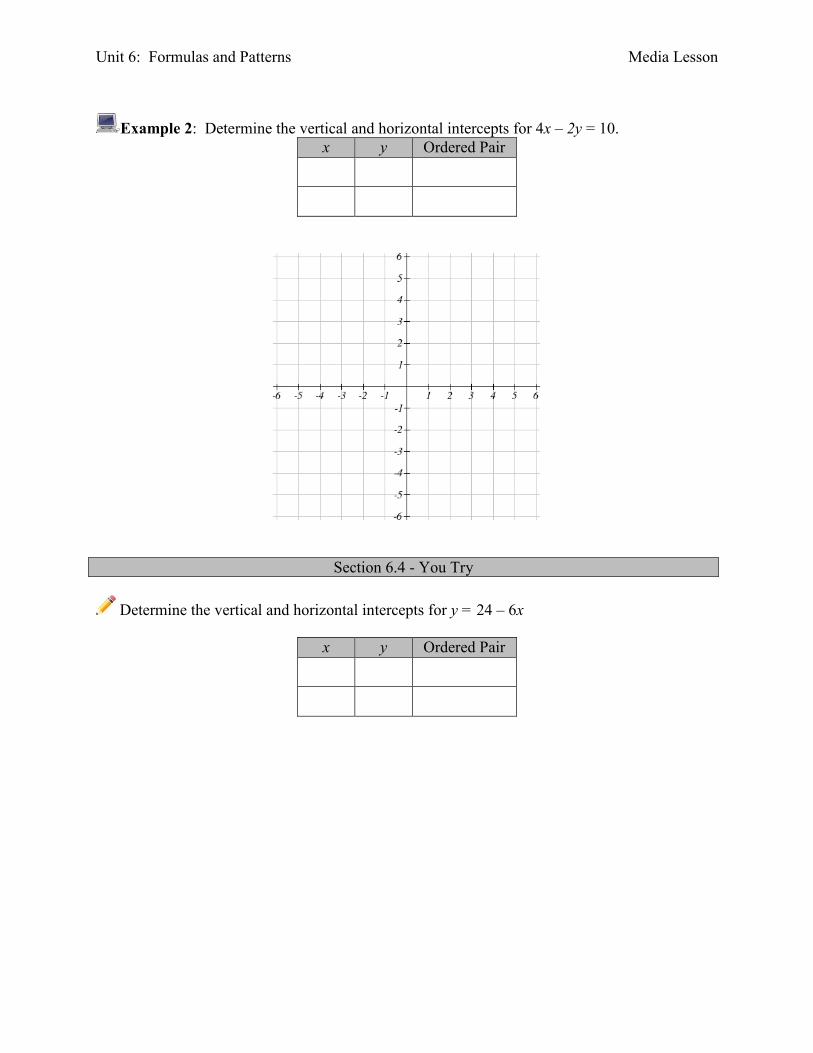
Example 2: Determine the vertical and horizontal intercepts for 4x – 2y = 10.
x y Ordered Pair
Section 6.4 - You Try
Determine the vertical and horizontal intercepts for y = 24 – 6x
x y Ordered Pair
Unit 6: Formulas and Patterns Media Lesson
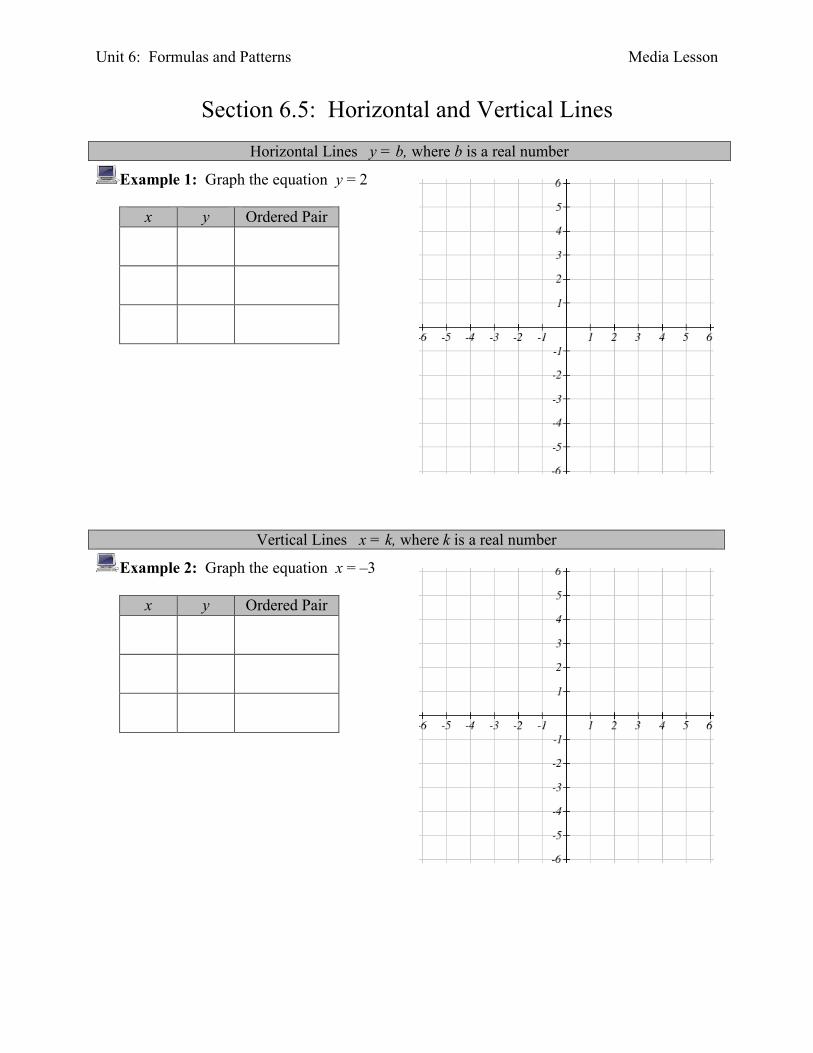
Section 6.5: Horizontal and Vertical Lines
Horizontal Lines y = b, where b is a real number
Example 1: Graph the equation y = 2
x y Ordered Pair
Vertical Lines x = k, where k is a real number
Example 2: Graph the equation x = –3
x y Ordered Pair
Unit 6: Formulas and Patterns Media Lesson
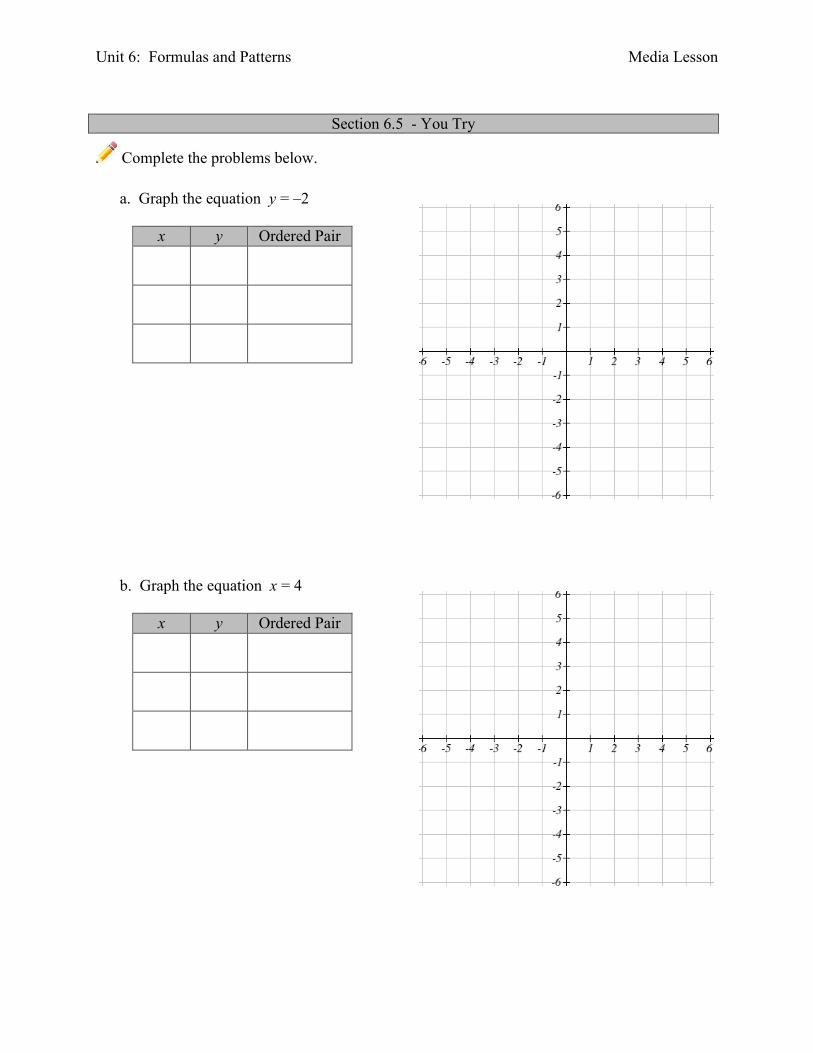
Section 6.5 - You Try
Complete the problems below.
a. Graph the equation y = –2
x y Ordered Pair
b. Graph the equation x = 4
x y Ordered Pair
Unit 6: Formulas and Patterns Media Lesson
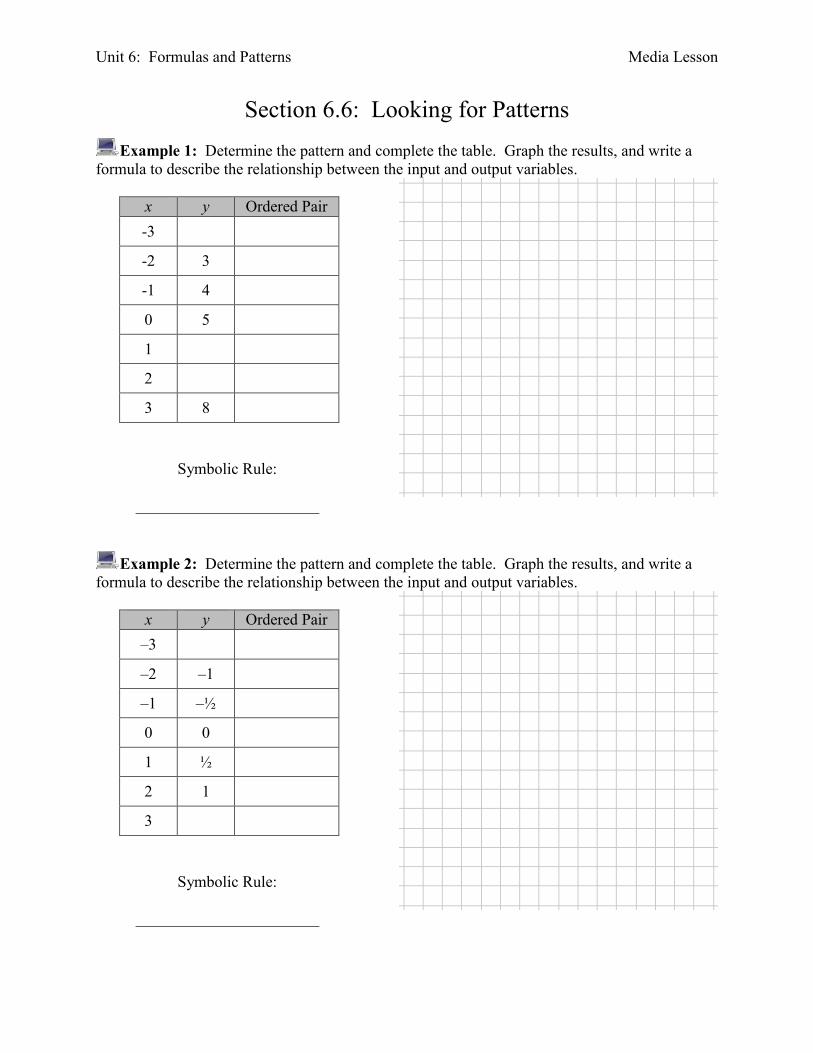
Section 6.6: Looking for Patterns
Example 1: Determine the pattern and complete the table. Graph the results, and write a
formula to describe the relationship between the input and output variables.
x y Ordered Pair
-3
-2 3
-1 4
0 5
1
2
3 8
Symbolic Rule:
_______________________
Example 2: Determine the pattern and complete the table. Graph the results, and write a
formula to describe the relationship between the input and output variables.
x y Ordered Pair
–3
–2 –1
–1 –½
0 0
1 ½
2 1
3
Symbolic Rule:
_______________________
Unit 6: Formulas and Patterns Media Lesson
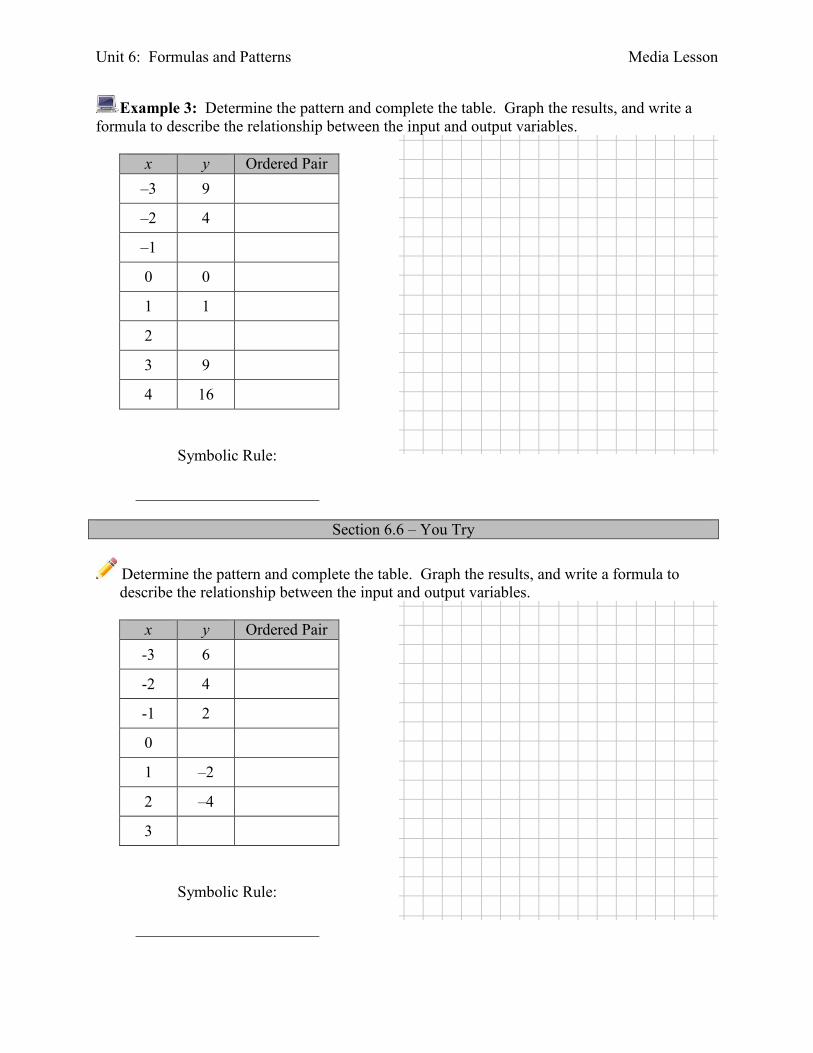
Example 3: Determine the pattern and complete the table. Graph the results, and write a
formula to describe the relationship between the input and output variables.
x y Ordered Pair
–3 9
–2 4
–1
0 0
1 1
2
3 9
4 16
Symbolic Rule:
_______________________
Section 6.6 – You Try
Determine the pattern and complete the table. Graph the results, and write a formula to
describe the relationship between the input and output variables.
x y Ordered Pair
-3 6
-2 4
-1 2
0
1 –2
2 –4
3
Symbolic Rule:
_______________________
Name: ________________________________ Date: _____________
Unit 6: Practice Problems
Skills Practice
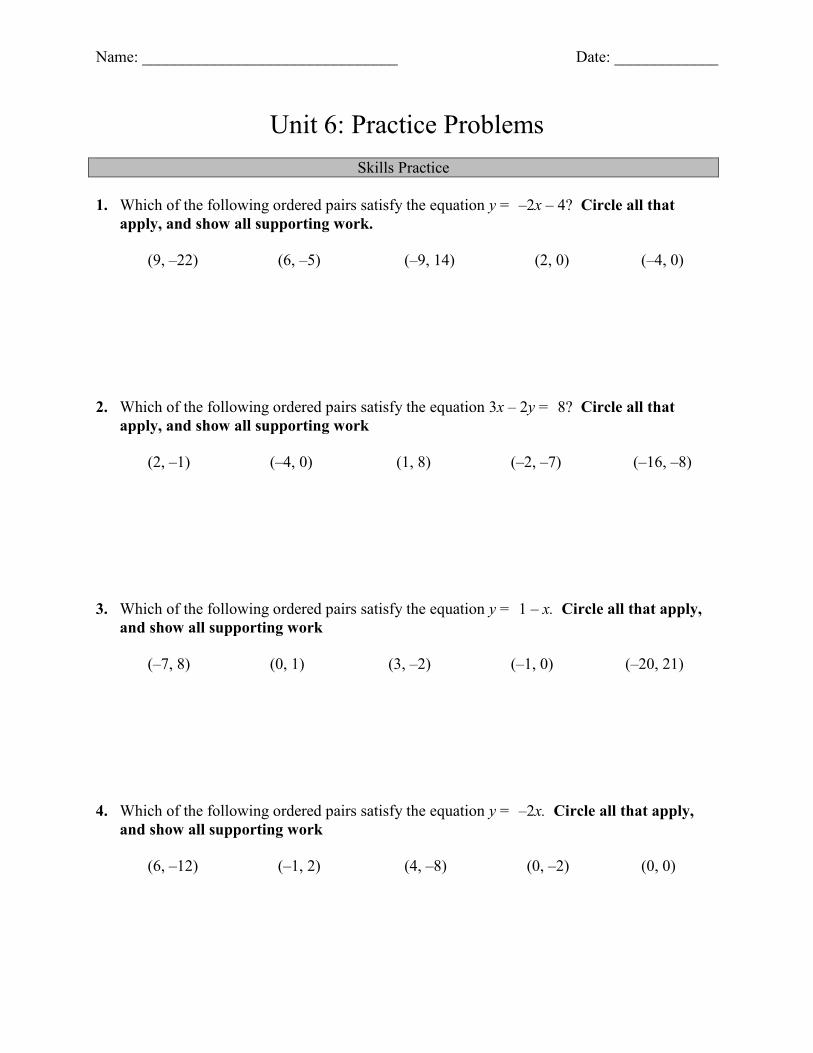
1. Which of the following ordered pairs satisfy the equation y = –2x – 4? Circle all that
apply, and show all supporting work.
(9, –22) (6, –5) (–9, 14) (2, 0) (–4, 0)
2. Which of the following ordered pairs satisfy the equation 3x – 2y = 8? Circle all that
apply, and show all supporting work
(2, –1) (–4, 0) (1, 8) (–2, –7) (–16, –8)
3. Which of the following ordered pairs satisfy the equation y = 1 – x. Circle all that apply,
and show all supporting work
(–7, 8) (0, 1) (3, –2) (–1, 0) (–20, 21)
4. Which of the following ordered pairs satisfy the equation y = –2x. Circle all that apply,
and show all supporting work
(6, –12) (–1, 2) (4, –8) (0, –2) (0, 0)
Unit 6: Formulas and Patterns Practice Problems
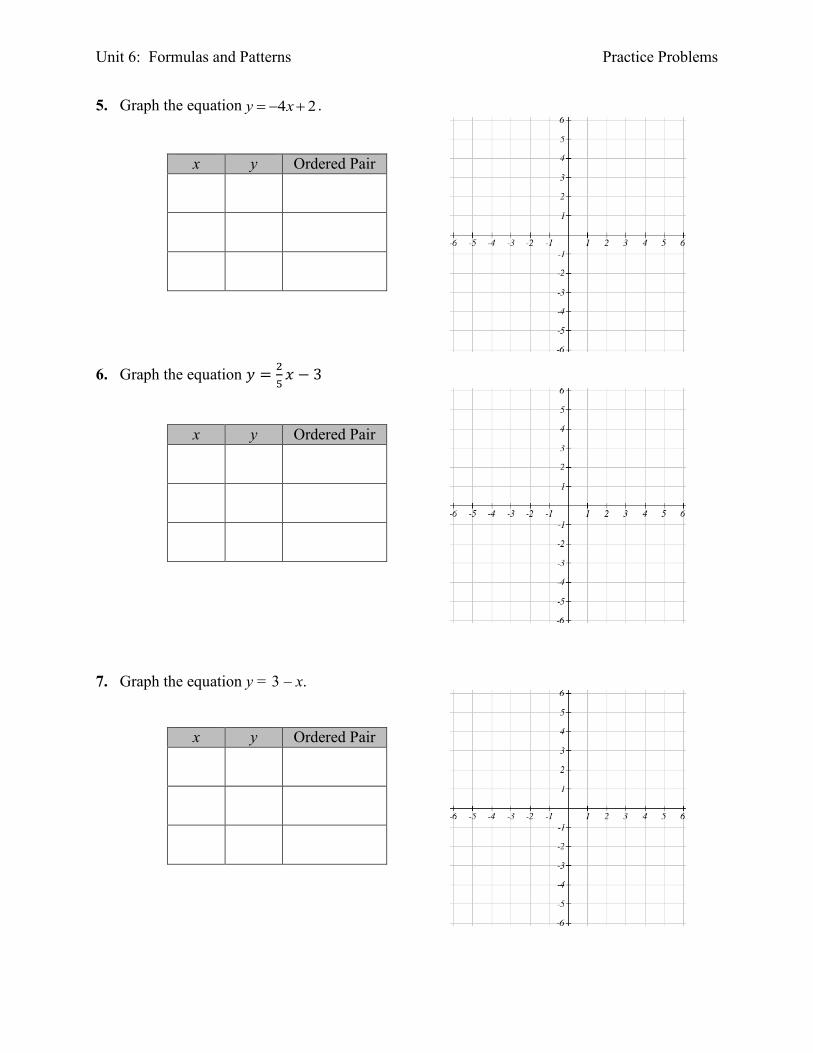
5. Graph the equation 4 2y x .
x y Ordered Pair
6. Graph the equation 𝑦 =2
5𝑥 − 3
x y Ordered Pair
7. Graph the equation y = 3 – x.
x y Ordered Pair

Unit 6: Formulas and Patterns Practice Problems
8. Graph the equation 4x – 2y = 12.
x y Ordered Pair
9. Graph the equation x – y = 4.
x y Ordered Pair
10. Graph the equation y = x.
x y Ordered Pair
Unit 6: Formulas and Patterns Practice Problems
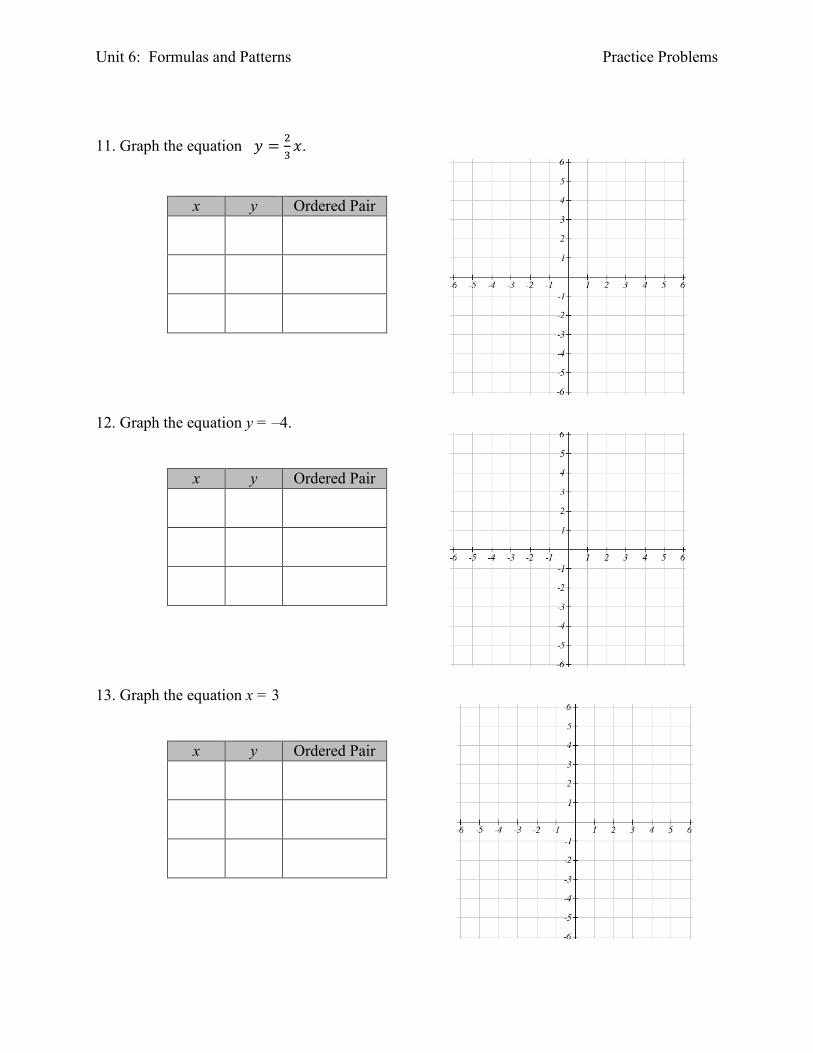
11. Graph the equation 𝑦 =2
3𝑥.
x y Ordered Pair
12. Graph the equation y = –4.
x y Ordered Pair
13. Graph the equation x = 3
x y Ordered Pair
Unit 6: Formulas and Patterns Practice Problems
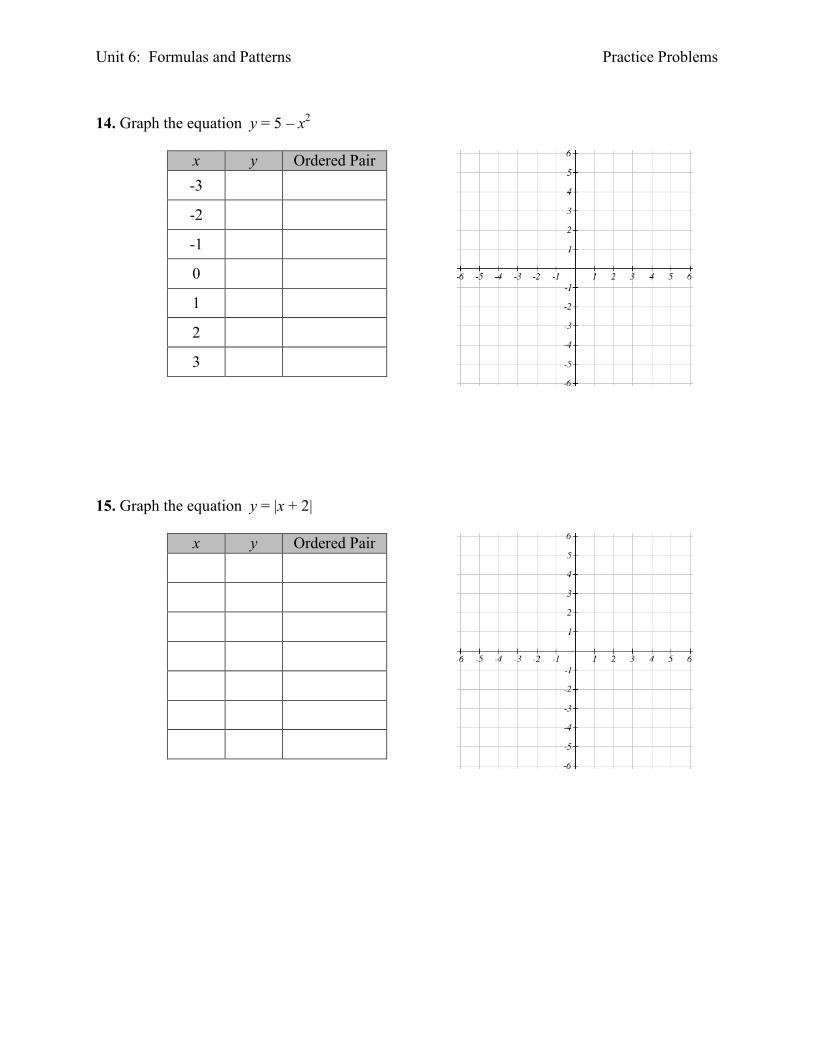
14. Graph the equation y = 5 – x2
x y Ordered Pair
-3
-2
-1
0
1
2
3
15. Graph the equation y = |x + 2|
x y Ordered Pair

Unit 6: Formulas and Patterns Practice Problems
16. Complete the table below. Write the intercepts as ordered pairs.
Equation Vertical Intercept Horizontal Intercept
y = 5x – 3
y = 4 – x
y = 4x
y = 3
5x + 6y = 12
3x – 4y = 24
x – 2y = 8
x = 5
Unit 6: Formulas and Patterns Practice Problems
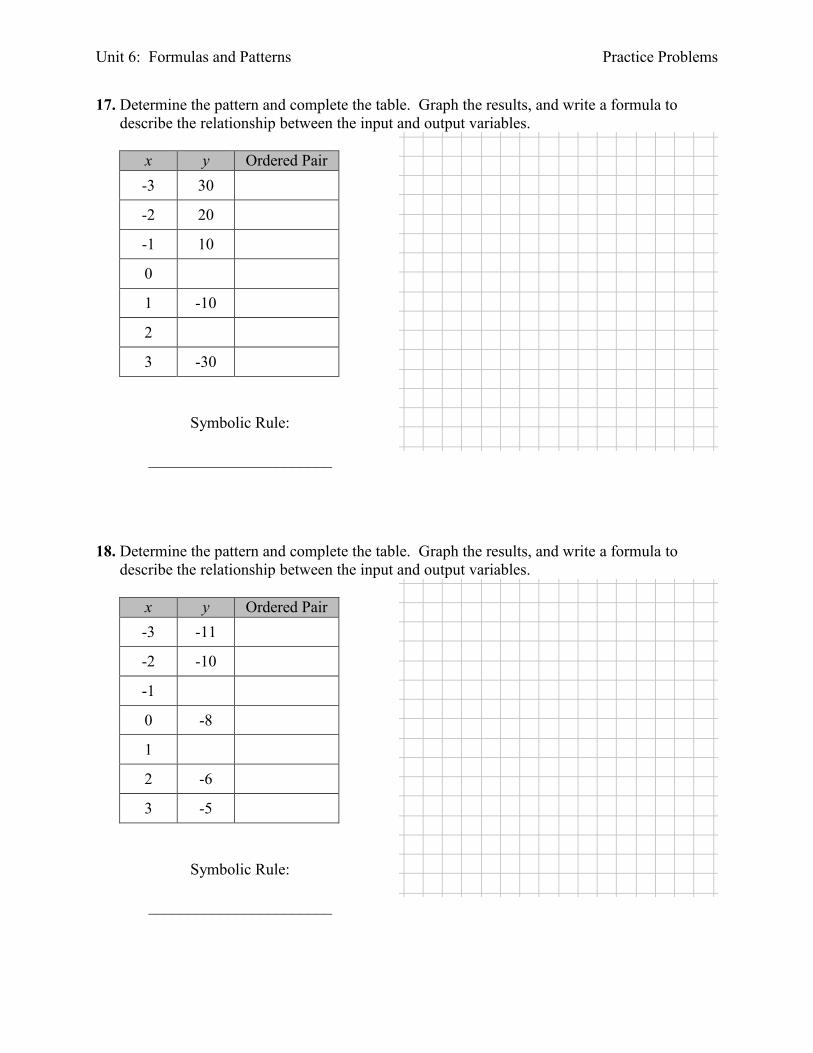
17. Determine the pattern and complete the table. Graph the results, and write a formula to
describe the relationship between the input and output variables.
x y Ordered Pair
-3 30
-2 20
-1 10
0
1 -10
2
3 -30
Symbolic Rule:
_______________________
18. Determine the pattern and complete the table. Graph the results, and write a formula to
describe the relationship between the input and output variables.
x y Ordered Pair
-3 -11
-2 -10
-1
0 -8
1
2 -6
3 -5
Symbolic Rule:
_______________________
Unit 6: Formulas and Patterns Practice Problems
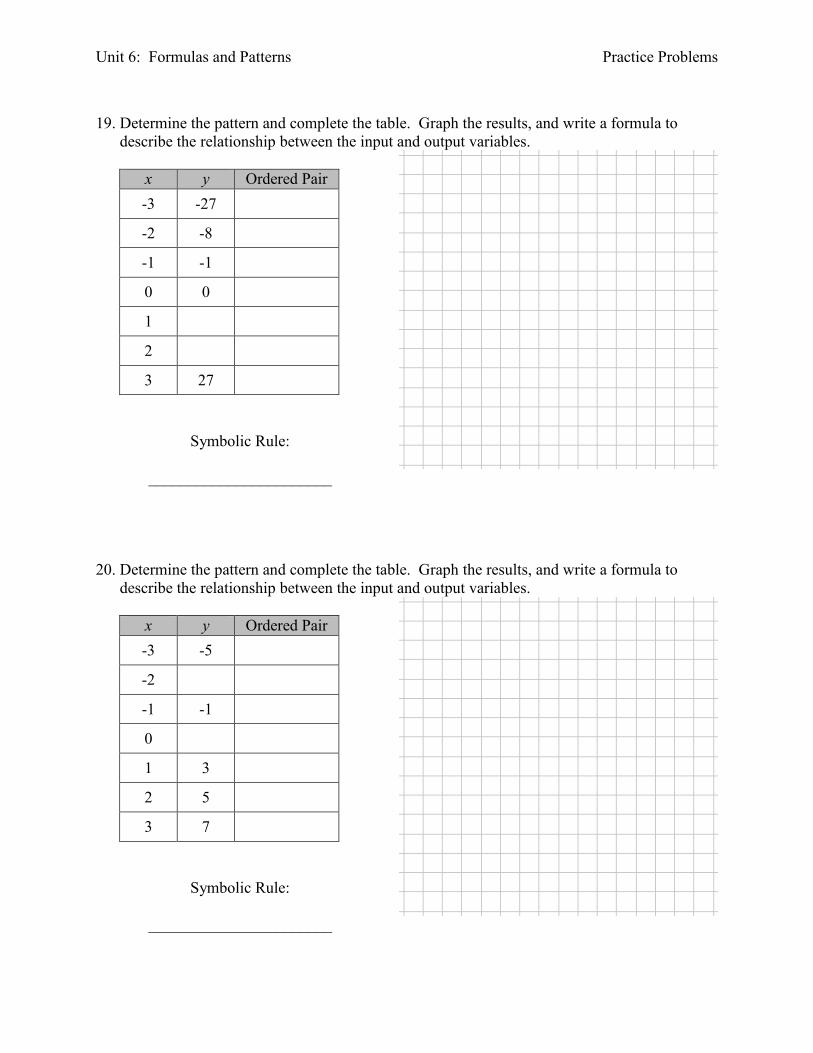
19. Determine the pattern and complete the table. Graph the results, and write a formula to
describe the relationship between the input and output variables.
x y Ordered Pair
-3 -27
-2 -8
-1 -1
0 0
1
2
3 27
Symbolic Rule:
_______________________
20. Determine the pattern and complete the table. Graph the results, and write a formula to
describe the relationship between the input and output variables.
x y Ordered Pair
-3 -5
-2
-1 -1
0
1 3
2 5
3 7
Symbolic Rule:
_______________________

Unit 6: Formulas and Patterns Practice Problems
Applications
21. Jordan is saving money for emergencies (or a trip to Europe). She has $420 under her
mattress, and is adding $60 to it each week.
a. Let A represent the total amount of money under her mattress, and w represent the
number of weeks. Write an algebraic equation to represent this situation.
b. Use the equation in part a. to complete the table below.
w 0 8 37
A 1800 2220 3000
c. Interpret the meaning of the ordered pair (18, 1500).
d. Identify the vertical intercept in this situation. Write it as an ordered pair and interpret its
meaning in a complete sentence.
e. How much money will Jill have saved after 3 weeks?
f. Calculate the horizontal intercept for the equation you found in part a. and write it as an
ordered pair. Does this point make sense in the given situation? Why or why not?
Unit 6: Formulas and Patterns Practice Problems
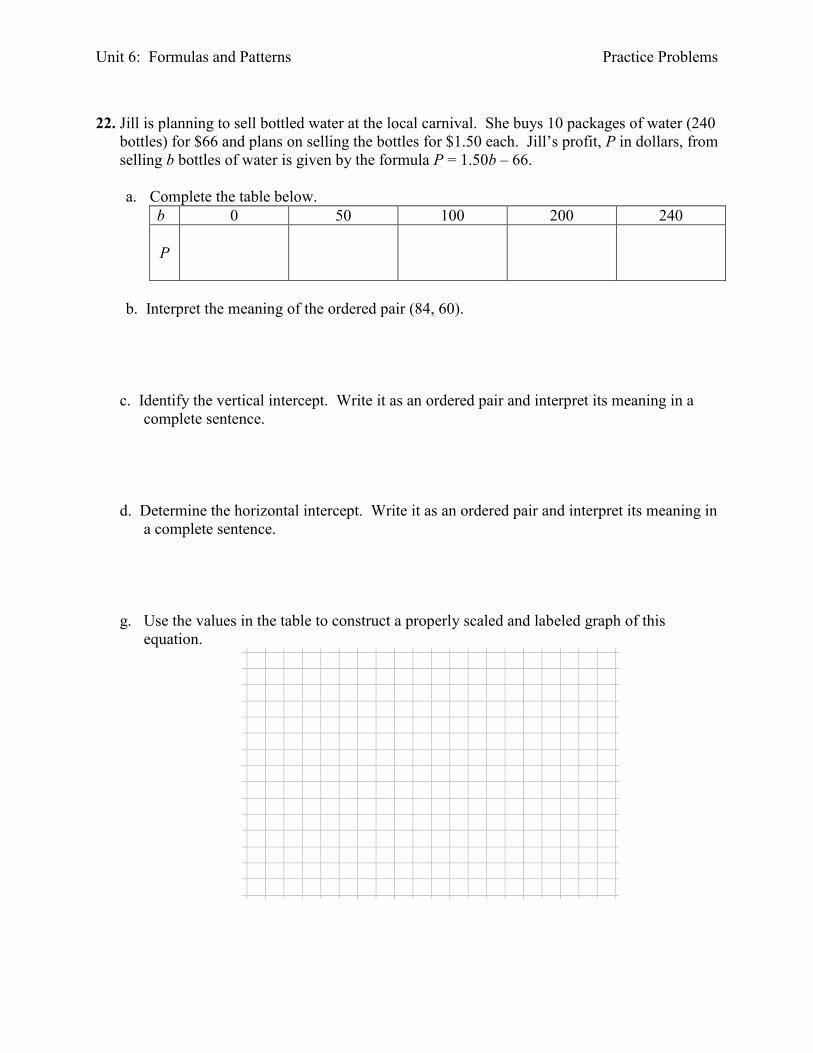
22. Jill is planning to sell bottled water at the local carnival. She buys 10 packages of water (240
bottles) for $66 and plans on selling the bottles for $1.50 each. Jill’s profit, P in dollars, from
selling b bottles of water is given by the formula P = 1.50b – 66.
a. Complete the table below.
b 0 50 100 200 240
P
b. Interpret the meaning of the ordered pair (84, 60).
c. Identify the vertical intercept. Write it as an ordered pair and interpret its meaning in a
complete sentence.
d. Determine the horizontal intercept. Write it as an ordered pair and interpret its meaning in
a complete sentence.
g. Use the values in the table to construct a properly scaled and labeled graph of this
equation.
Unit 6: Formulas and Patterns Practice Problems
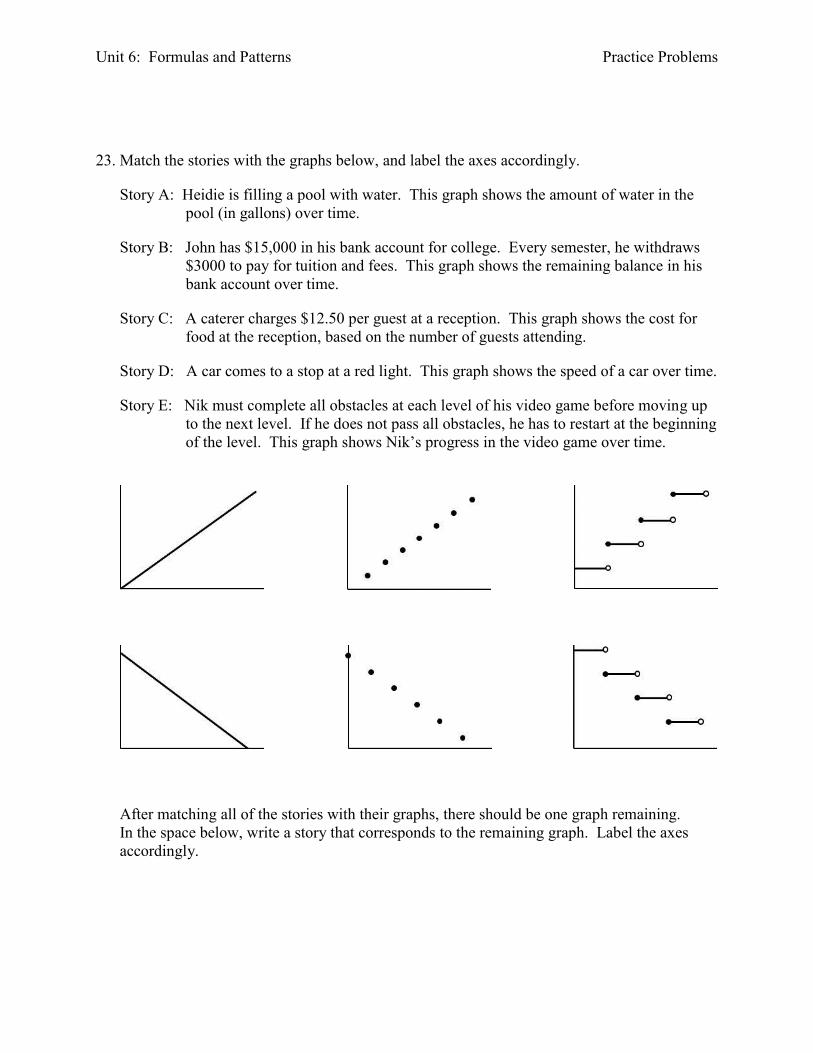
23. Match the stories with the graphs below, and label the axes accordingly.
Story A: Heidie is filling a pool with water. This graph shows the amount of water in the
pool (in gallons) over time.
Story B: John has $15,000 in his bank account for college. Every semester, he withdraws
$3000 to pay for tuition and fees. This graph shows the remaining balance in his
bank account over time.
Story C: A caterer charges $12.50 per guest at a reception. This graph shows the cost for
food at the reception, based on the number of guests attending.
Story D: A car comes to a stop at a red light. This graph shows the speed of a car over time.
Story E: Nik must complete all obstacles at each level of his video game before moving up
to the next level. If he does not pass all obstacles, he has to restart at the beginning
of the level. This graph shows Nik’s progress in the video game over time.
After matching all of the stories with their graphs, there should be one graph remaining.
In the space below, write a story that corresponds to the remaining graph. Label the axes
accordingly.

Unit 6: Formulas and Patterns Practice Problems
Extension
24. Which of the following ordered pairs satisfy the inequality y < 2x – 4? Select all that apply
and plot the selected points on the graph below.
(–5, 2) (4, 1) (3, –6) (0, 0) (6, 4)
(7, 0) (1, –8) (–5, 6) (2, 0) (7, –5)
Unit 6: Formulas and Patterns Practice Problems
25. In your own words, describe the distinction between a continuous graph and a discrete graph.
26. In your own words, describe the distinction between continuous data and discrete data.
27. In your own words, describe the distinction between a continuous variable and a discrete
variable.
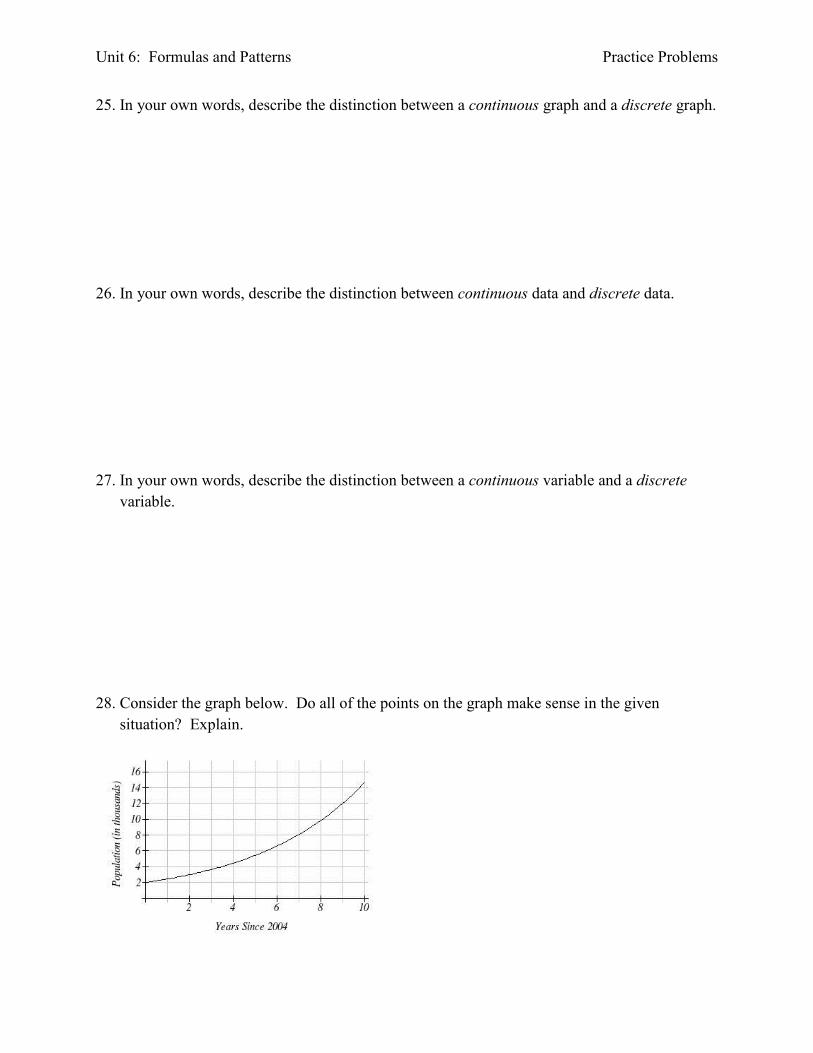
28. Consider the graph below. Do all of the points on the graph make sense in the given
situation? Explain.

Unit 6: Formulas and Patterns Practice Problems
29. Use the equation y = 3x to complete the table below. Graph your results.
x y Ordered Pair
-2
-1
0
1
2
3
4
Name: ________________________________ Date: _____________
Unit 6: Review
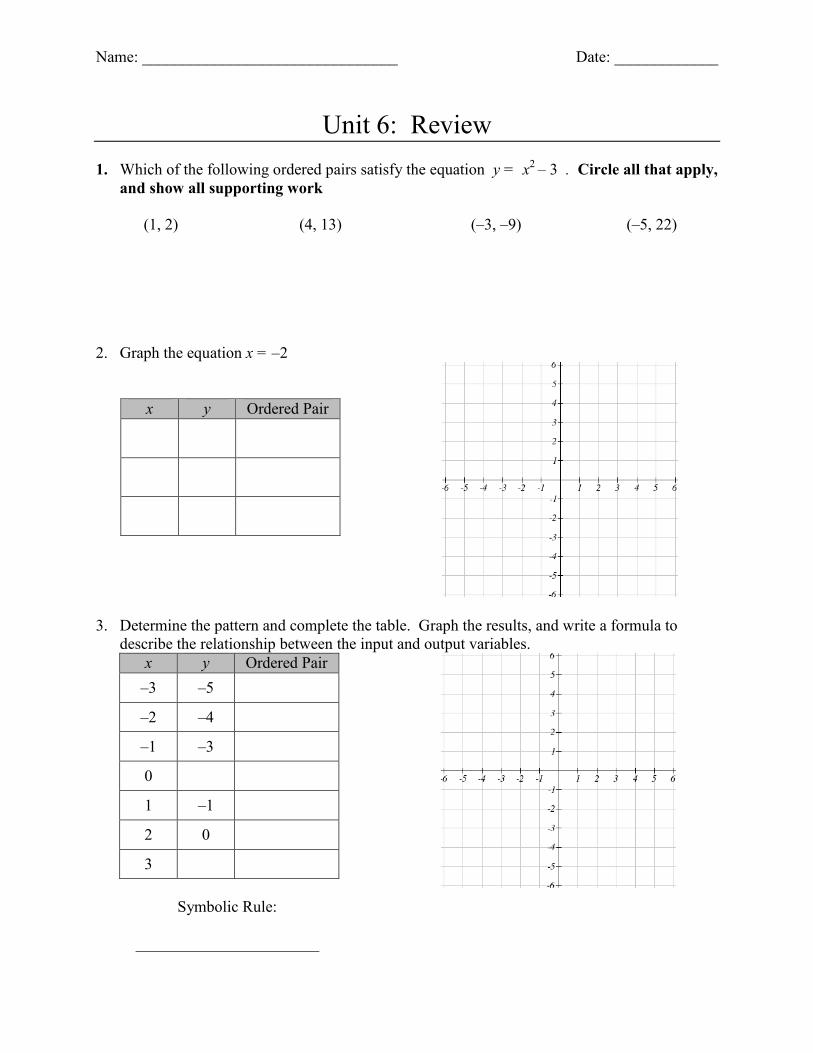
1. Which of the following ordered pairs satisfy the equation y = x2 – 3 . Circle all that apply,
and show all supporting work
(1, 2) (4, 13) (–3, –9) (–5, 22)
2. Graph the equation x = –2
x y Ordered Pair
3. Determine the pattern and complete the table. Graph the results, and write a formula to
describe the relationship between the input and output variables.
x y Ordered Pair
–3 –5
–2 –4
–1 –3
0
1 –1
2 0
3
Symbolic Rule:
_______________________

Unit 6: Formulas and Patterns Review
4. The maximum heart rate is the highest heart rate achieved during maximal exercise. In
general, you get the most benefits and reduce the risks when you exercise near your target
heart rate. Usually this is when your exercise heart rate (pulse) is about 80% percent of your
maximum heart rate. For adults 19 years of age and older, the formula T = 176 – 0.8a, gives
the target heart rate, T, in beats per minute, for a person who is a years of age.
a. Complete the table below.
Age (years) 20 25 38 70
Target Heart
Rate (bpm) 160 156 145.6 132
b. In a complete sentence, interpret the meaning of the ordered pair (25, 156).
c. Use the values in the table to construct a properly scaled and labeled graph of this
equation.