unit 4: statistics measures of central tendency & measures ... · 2 measures of central...
TRANSCRIPT

1
Unit 4: Statistics
Measures of Central Tendency &
Measures of Dispersion
2
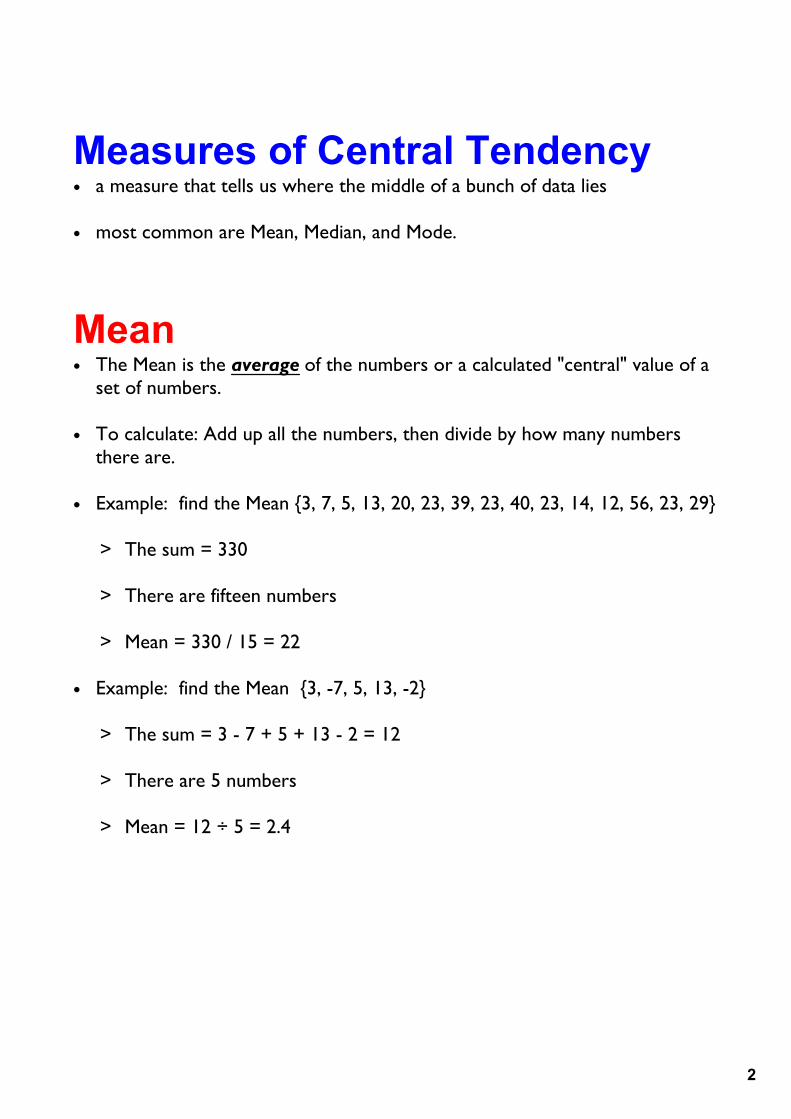
Measures of Central Tendency • a measure that tells us where the middle of a bunch of data lies
• most common are Mean, Median, and Mode.
Mean• The Mean is the average of the numbers or a calculated "central" value of a
set of numbers.
• To calculate: Add up all the numbers, then divide by how many numbers there are.
• Example: find the Mean {3, 7, 5, 13, 20, 23, 39, 23, 40, 23, 14, 12, 56, 23, 29}
> The sum = 330
> There are fifteen numbers
> Mean = 330 / 15 = 22
• Example: find the Mean {3, -7, 5, 13, -2}
> The sum = 3 - 7 + 5 + 13 - 2 = 12
> There are 5 numbers
> Mean = 12 ÷ 5 = 2.4

3
Median• The middle number (in a sorted list of numbers).
• To find: place the numbers you are given in numerical order and find the middle number.> Example: find the Median of {13, 23, 11, 16, 15, 10, 26}.
– First, order the numbers, least to greatest– Next, identify the middle number
What if there isn't only ONE middle number?• If there are an odd number of items in the list, there will be ONE definite
Median or middle number
• If there are an even number of items in the list, there will be TWO middle number. > You will add those two numbers and divide by two to determine the
median in this case.> Example:
– find the Median {3, 13, 7, 5, 21, 23, 23, 40, 23, 14, 12, 56, 23, 29}– First, order the numbers, least to greatest
{3, 5, 7, 12, 13, 14, 21, 23, 23, 23, 23, 29, 40, 56}
– Next, identify the middle numbers
There are now fourteen numbers and so we don't have just one middle number, we have a pair of middle numbers:
3 5 7 12 13 14 21 23 23 23 23 29 40 56
– Finally, average the two numbers
Add them together and divide by 2:
21 + 23 = 4444 ÷ 2 = 22
Median in this example is 22

4
Mode• The number which appears most often in a set of numbers.
> Example: in {6, 3, 9, 6, 6, 5, 9, 3} the Mode is 6 (it occurs most often).
What if there is more than one mode?• You CAN have more than one mode.
> Example: {1, 3, 3, 3, 4, 4, 6, 6, 6, 9} – 3 appears three times, as does 6.– So there are two modes: at 3 and 6
> Having two modes is called "bimodal".
> Having more than two modes is called "multimodal".
What if there is NO mode?• You CAN have a set without a mode.
> Example: {1, 3, 5, 7, 9} – No number appears more than once.– So there is NO mode.

5
Try the following:Find the Mean, Median, and Mode for the following:
1) {2, 3, 5, 6, 13, 5, 1}
2) {201, 199, 201, 200, 199}
3) {8, 7, 5, 19}
4) {3, 7, 21, 23, 63, 27, 29, 95, 23}

6
Measures of Dispersion• Tell you how widely spread out the values are
• Most common are Range, Standard Deviation, and Variance
Range• The range of a data set is the difference between the maximum and
minimum values in the set
• Example: > In {4, 6, 9, 3, 7} the lowest value is 3, and the highest is 9.
Example: In {4, 6, 9, 3, 7} the lowest value is 3, and the highest is 9.Example: In {4, 6, 9, 3, 7} the lowest value is 3, and the highest is 9.Example: In {4, 6, 9, 3, 7} the lowest value is 3, and the highest is 9.Example: In {4, 6, 9, 3, 7} the lowest value is 3, and the highest is 9.
So the range is 93 = 6.
The Range Can Be Misleading
The range can sometimes be misleading when there are extremely high or low values.
Example: In {8, 11, 5, 9, 7, 6, 3616}:
> the lowest value is 5,
> and the highest is 3616,
> Range = 3616-5 = 3611.
> The single value of 3616 makes the range large, but most values are around 10.

7
Try the following:Find the Range for the following:
1) {2, 3, 5, 6, 13, 5, 1}
2) {201, 199, 201, 200, 199}
3) {8, 7, 5, 19}
4) {3, 7, 21, 23, 63, 27, 29, 95, 23}

8
Variance• The average of the squared differences from the Mean (symbol is σ2)
• To calculate the variance follow these steps:> find the Mean (average of the numbers)> then for each number: subtract the Mean and square the result (the
squared difference)> then work out the average of those squared differences
• Example: find the variance {600, 470, 170, 430, 300}> Step 1: Find the Mean
– 600 + 470 + 170 + 430 + 300
> Step 2: Subtract the Mean from each number in the set and square it– 600 - 394 = 206 2062 = 42,436– 470 - 394 = 76 762 = 5,776– 170 - 394 = -224 (-224)2 = 50,176– 430 - 394 = 36 362 = 1,296– 300 - 394 = -94 (-94)2 = 8,836
> Step 3: Average those numbers (find the Mean)– 42,436 + 5,776 + 50,176 + 1,296 + 8,836
> The variance, σ2 = 21,704
5 51970 = 394=
5 5108,520
= 21,704=

9
Standard Deviation• The Standard Deviation is a measure of how spread out numbers are (what
is the standard difference between values in the set?)
• Its symbol is σ (the greek letter sigma)
• The formula > the square root of the Variance
• From our last example:> The variance, σ2 = 21,704> The standard deviation, σ = √21,704 = 147.3227749 ≈ 147.3228

10
Variance/Standard Deviation:
small data tends to be close to the mean
big data is more spread out

11
Variance seems like ALOT of work!
GOOD NEWS...It can ALL be done in your calculator!
Here's how: (I'm using example 4 from Try This)> Go to STAT (enter to pull up lists)
– enter the values in L1 « order doesn't matter
> Once values are entered, 2nd Mode to go back to home screen.> Go to STAT> Arrow over to CALC> Choose 1: 1-Var-Stats
– hit enter 3 or 4 times to get the screen on the right
> Scroll down and there's more!> All of your stats are here!

12
What do they mean??Mean
Standard Deviation
this is the number of values in your set/list
Median
Range (subtract minX from maxX)
Variance: Take standard deviation (σx) and square it!
Mode: You still have to find that one on your own!
What's missing??

13
TRY IT AlL TOGETHER NOW...• Find the following for the set X={2, 5, 8, 21, 45, 26, 5, 10}
> Mean:
> Median:
> Mode:
> Range:
> Variance:
> Standard Deviation:

14