unit 1 the earthsim.edu.in/wp-content/uploads/2019/10/cg-material.pdf · 2019-10-06 ·...
TRANSCRIPT

Sanjeev Degree College Commercial Geography
S K V S L Narasimha Raju Page 1
Unit – 1
The Earth
Q. Explain the internal structure of Earth and its sources to know the earth’s interior?
Ans. Our knowledge about interior of the earth is very limited because we do not have direct
Access to Conditions prevailing in the earth. The earths internal structure compressors of more
or less concentric layers laying one above the other.
The outermost layer is known as crust average thickness is about 33 km. It is the solid
layer of the Earth which is compressor of different types of rocks, below The crust is the Mantle
which extends up to a depth of 2,900 km. In between the Crust and the Mantle there is a
Mohorocivic discontinuity. Mantle is divided into two broad layers namely, the upper Mantle
and lower Mantle. Upper Mantle depth of 400 km is known as atmosphere transitional zone.
Below mental i.e., beyond the depth of 2,900 km there is a core of Earth. At the depth of 2,900
km there is another discontinuity which is known as Guthenburg discontinued. The core is
divided into outer Core and inner core
These two layers of the core separated from each other by transition zone which extends
from death of 4,600 to 5,151 km.
Sources to know the earth's interior
Efforts have been made to collect information about Earth's interior on the basis of the
indirect resources are
1. Density
2. Temperature
3. Pressure
4. Earthquake waves

Sanjeev Degree College Commercial Geography
S K V S L Narasimha Raju Page 2
1. Density
According to Newton's Law Of Gravity its density as a whole is 5.5 the sedimentary
rocks on the surface of the earth have an average density of 2.7. Below the sedimentary rocks
there are igneous rocks with average density of 3.0 to 3.5 means density inside the earth must be
method that the core of the earth has a density of 11 to 12. It may rise to 13 to 14 at the centre of
earth.
According to first opinion the increase in density with the increase in depth is due to
pressure of upper layers. According to second opinion the core itself is made up of like Nickel
and iron which have high density.
2. Temperature
Digging of mines revealed that there is a great temperature with the increase in depth
inside the earth. According to the latest estimates the rate of increase of temperature is 12℃ per
km at a depth of 100 km. It is 2℃ per km in the next 300 km and 1℃ per kilometre below it. By
this calculation the temperature should be nearly 2900℃ at the core of the earth.
3. Pressure
Like density and temperature pressure also increases with the increase in depth inside the
earth. This may be due to the overlaying layers or the presence of heavier metals at the core of
the earth.
4. Earthquake waves
The science of ethics is known as seismology evidences based on earthquake waves are
known as seismological evidences. Mohorovic used earthquake waves for the first time in 1909
to know about earth's interior.

Sanjeev Degree College Commercial Geography
S K V S L Narasimha Raju Page 3
Three Types of earthquake waves
Following three types of earthquake waves are normally recorded by a seismograph
1. P-Waves: These also known as primary waves. Their average velocity is 8 km per second
which is higher than any other waves. P-Waves can travel through all the mediums including
solids, liquids and gases.
2. S-Waves: These are known as secondary waves the average velocity is 4 km per
second. They can travel through solids only and disappears in liquids.
3. L-Waves: These are also known as Long waves. They travel along the surface of the earth
and are also referred as surface waves. L waves can affect only the surface of the earth. The
average velocity is just 3 km per second.
Behaviour of the earthquake waves
There is a change in course and velocity of the Waves on crossing the boundaries of
different zones inside the earth. Is the ground through which the Waves travel is a solid, they
behave in one way. If it is liquid, waves behave in different way. Their velocities in both cases
differ.
All the three P, S and L waves are recorded near the focus of the earthquake. They
follow a curved path in the interior of the earth which proves that density increases inside the
earth. P and S waves are recorded along the surface up to a distance of 11,000 km from the focus
of the earthquake. Velocity also increases with the increase in depth. But this process continuous
only up to a depth of 2,900 km. Beyond this death, S waves disappear and waves travel with
reduced velocity. this processor shows that the core of the earth behaves like solids while mantle

Sanjeev Degree College Commercial Geography
S K V S L Narasimha Raju Page 4
up to a depth of 2,900 km behaves like liquids on reaching the core s waves disappear and p
waves are refracted as a which there are no waves for a distance of 5,000 km beyond the 11,000
km mark. This area is known as shadow zone. Normally, shadow zone is found between and
143° degrees angle focus of the earthquake.
Q. What are latitudes and longitudes? Explain the relationship between longitude and
time?
Ans. Latitudes and longitudes
These are imaginary lines rather circles drawn on a globe or a map to know the exact
location of a specific point on the Earth's surface.
Latitude
The earth is supposed to be around an imaginary line running through its centre. This
imaginary line is called the axis of the earth. The north end of the axis is called the North Pole its
southern and is known as South Pole. From these two poles runs the central latitude known as
the equator. It divides the earth into equal parts known as hemispheres. Which lies to the north
of the equator is called the northern hemisphere. And that hemisphere to the south of the equator
is known as Southern hemisphere. This equator is the initial line indicating 0° latitude.
If a place located in the Northern hemisphere and marks an angle of 30° with equator as
measured from the centre of the Earth then the place will have a latitude of 30° north. The length
of the parallels goes on decreasing as we move from towards the poles still it is reduced to zero
at the two poles.

Sanjeev Degree College Commercial Geography
S K V S L Narasimha Raju Page 5
Some Important parallels
The earth axis is at an angle of 23.5°.Thus 23.5° of North and South latitudes have
special significance. The parallel of 23.5° North latitude is known as of cancer and 23.5° south
latitude is called the Tropic of Capricorn. All places between the Tropic of Cancer and Tropic of
Capricorn experience vertical rays of the sun twice a year. The Arctic and Antarctic circles are at
66.5° North and South latitudes respectively. These circles Polar Regions where there is
continuous day or night for more than 24 hours.
Meridians and longitude
Meridians also called as longitudes longitudes are drawn as semi circles on the globe
longitude passing through Royal battery at Greenwich near London Can be mentioned Prime
longitude for Greenwich Meridian and represents 0°. The exactly opposite to the Greenwich
Meridian is longitude of 180° and is known as International Date Line. The Prime Meridian
divides the earth into Eastern Western hemisphere slaying in the east of the Prime Meridian are
said to be the east longitude while those in the west of the Prime Meridian have West longitudes
Prime Meridian and international date line are common and or not east or West longitude.
Longitude
The longitude of a place is its angular distance measured in degrees east or West from the
Prime Meridian when we say that the longitude of Allahabad is 82 1/2° east, this means that
Allahabad is located in the east of Prime Meridian and makes an angle of 82 1/2° with the axis of
the earth with reference to the prime meridian.
Graticule
Graticule is the network of parallels and meridians drawn on a globe. These networks
help us in locating different places with reference to given latitude and longitudes.

Sanjeev Degree College Commercial Geography
S K V S L Narasimha Raju Page 6
Longitude and time
Hidden times are very closely related to each other this relationship is based on the
Earth's rotation on its axis. The earth completes one rotation on its axis in 24 hours process it
sleeps our 360° longitude. Thus for moving 1° longitude the Earth takes 4 minutes and in one
hour 15° of longitude get rotated. It implies that time difference of places located 15° longitude
apart will be one hour. When it is noon at Greenwich meridian it will be 6 p.m. at 90° East
longitude, and midnight at 180° longitude.
Local time
When the sun's altitude is highest at a place, the time is considered to be 12 noon at the
concerned place. The places located at a particular meridian i.e., north and south of each other, is
the same. However places located on different longitudes i.e., places located in the east and west
of each other have different local time. East and West of each other varies at the rate 4 minutes
per degree every 15° longitude.
Standard Time
The use of local time leads to utter confusion with respect to railway, and telegram, radio,
television air service etc. Because each longitude has its won time which is different from the
time of other longitudes. In order to solve this problem, each country uses some important
longitude as its standard longitude. The local time of the selected longitude is treated as standard
time for the entire country. The standard time of India is taken from 82 1/2° East attitude which
passes through Allahabad at the confluence of Ganga and Yamuna two most sacred rivers of the
country. Allahabad is treated as the state the entire country and is known as Indian standard time
IST this is 5 1/2 hours ahead of Greenwich Mean Time GMT.
World time zones
System of time zones was established by the Prime Meridian conference held at
Washington DC in 1884. After a long discussion, the Meridian running through Greenwich in
England was declared as the Prime Meridian and was taken as the reference Meridian for the

Sanjeev Degree College Commercial Geography
S K V S L Narasimha Raju Page 7
time zones of world. The Standard Meridians of time zones with their fix 15° longitude apart
from Greenwich, thereby differing from one another by amounts. In this way the whole world
was divided into 24 time zones.
Some countries or islands lie about Midway between 15° meridians. Under such
circumstances a Meridian lying halfway between the two meridians is chosen. Such meridians
are 71/2° longitude apart and represent a difference of half an hour. For example, India's standard
time is based on 821/2° longitude which is 75° + 71/2° east. Large countries have more than one
time zone. The continuous states of the USA have 5 time zones. The Russia had 11 standard time
zones. Australia has three time zones.
The International Date Line
International Date Line is that line of longitude which the of date when we cross
it. There is a difference of one day on either side of this line because the Greenwich Mean Time
180° longitudes differ by 24 hours. When we start moving eastward from Greenwich, we gain
time at the rate one hour for every 15°longitude and at 180° East Meridian the time is exactly 12
hours of the Greenwich time. On the other hand, moving westward from Greenwich time and at
180° West Meridian the time difference is 12 hours and this time is to behind. In Other words
different dates are found on either side of 180° meridian. Therefore, the calendar date is changed
by one day is crossed from the east to west and vice versa.

Sanjeev Degree College Commercial Geography
S K V S L Narasimha Raju Page 8
Q. Mention the three realms of earth?
Ans. Realms of the Earth
The earth has three called
1. Lithosphere
2. Hydrosphere
3. Atmosphere
Lithosphere
The term Lithosphere refers to the solid layer of the earth which consists of rocks of
various types. On the top of the mantle and contains sial and sima. All the continents on the
globe are parts of lithosphere. They contain all sorts of land forms including mountains and
planes. The northern hemisphere has more land area than the southern hemisphere. The main
continents are Asia, Europe, North America, South America, Africa, and Australia. The
Antarctic continent surrounds South Pole. Hence it is totally covered by permanent snow and ice
is almost entirely uninhabited. The total area of lithosphere is about 149.45 million square
kilometres.
Hydrosphere
Hydrosphere consists of the water components of the Earth which includes oceans, Seas,
Rivers and underground water. It is estimated that 71% of the total surface area of the Earth is
covered by water and the land area accounts only 29% of the total surface area earth. Earth is
often called a water planet or blue planet. A look at the world map indicates that about 71% of
the earth's surface is covered by oceans the main oceans of the world in decreasing order of area
and volume are Pacific Ocean, Atlantic Ocean, Indian ocean, Southern ocean and Arctic Ocean.
Atmosphere
Atmosphere is the vast expanse of air which and has become an integral part of the earth
due to earth's gravitational force. We cannot feel presence of the air unless it blows as wind.
About 99% of the total mass of the atmosphere is within the height of 32 km from the Earth's
surface. There are differences in opinion regarding the thickness of the atmosphere. Previously it
was considered to be only 800 kilometres but latest discoveries hint at 32,000 kilometres thick
atmosphere surrounding the earth. It is no clear cut upper limit and it is gradually merges with
the outer space.
Composition of the atmosphere
The atmosphere is a mixture of many gases. Which nitrogen constitutes the major portion
is accounts for 78.03% of the total volume of the atmosphere. Next is Oxygen which is 20.99%
of the atmospheric volume. Thus nitrogen and oxygen together make up over 99% of the
atmospheric air by volume.
Sanjeev Degree College Commercial Geography
S K V S L Narasimha Raju Page 9
Q. Describe the evolution of earth and big bang theory?
Ans. Evolution of the earth
Nobody exactly knows as to how our earth has evolved. The origin of the earth
is mystery under no complete and comprehensive theory about the earth's origin has been
propounded till now. Majority of the theories believe that the earth got separated from the sun as
a hot gaseous mass which on cooling with the passage of time turned into a liquid and then into
solid sphere.
Some important theories
A large number of theories have been put forward to explain the origin of the earth. Some
of the outstanding hypotheses are briefly described here.
Gaseous hypothesis
Professor Imanuel Kant was German scholar who put forward his hypothesis in 1755.
According to him primordial matter was evenly distributed in the shape of small and cold
particles from which our earth and other planets of solar system where formed. Since this
hypothesis is based on gas, it is popularly known as gaseous hypothesis.
Nebular hypothesis
Laplace was a French mathematician who put forward the hypothesis of which of the
earth in 1796. According to Laplace, the primordial matter existed in the form of intensely hot
and rotating gaseous mass in the beginning. This hot and slowly rotating gaseous mass was
called nebula after which is called the nebular hypothesis. As the time passed, the gaseous mass
cooled, its volume decrease the and its speed of rotation increased. The increase in quotation
resulted in increase in centrifugal force. When the centrifugal force exceeded the gravitational
force, a ring moved away from the nebula and broke into many smaller rings. These rings, on
cooling become planets and satellites. The remaining central part of nebula is the present sun.
Planesimal hypothesis
In the year 1900, Chamberlain and Moulten put forward their Planesimal
Hypothesis according to which the wandering star approached the sun and accepted its
gravitational pull on the sun. As a result, a cigar shaped extension of material was separated from
the solid surface pandering star moved away from the sun the material separated from the solar
surface. As the wandering star moved away from the star, the material separated from the solar
surface started revolving around the sun and condensed into planets at a large stage.
Tidal hypothesis
Sir James Jeans, a British scientist, propounded tidal hypothesis in 1919 and another
British scientist, Harold Jeffreys suggested some modifications in this hypothesis in 1929.
According to the hypothesis, the sun was a gaseous mass in the beginning. Another

Sanjeev Degree College Commercial Geography
S K V S L Narasimha Raju Page 10
star,several times larger than the sun, accidentally came close to eat and pulled the gaseous
material away from the sun due to its gravitational pull. Giant tongues of matter came the planets
were formed.
Revised Nebular hypothesis
In 1915, Otto Schmidt of Russia and Carl Weizascar of Germany somewhat revised the
nebular hypothesis in their own different ways. Otto Schmidt in his hypothesis talked about large
quantities of gases and dust particles scattered in the universe while Carl Weizascar emphasizes
on the existence of cosmic dust surrounding the sun. The friction and collision of the dust
particles led to the formation of disc shaped cloud and the planets were formed through the
process of accretion.
Big Bang Theory
Also known as expanding Universe hypothesis, it can be credited to Edwin Hubble who
provided evidence of expanding universe in 1920. This theory was postulated in 1950 and 1960s
and validated in 1972. According to this theory, everything in the universe emerged from a point
known as singularity.
The galaxies moved apart as the space between them expanded. Obviously the universe
was much smaller in the beginning. As the universe expanded, the heart radiation in the original
firewall also expanded and cooled down. Misty clouds of matter already existed. All these clouds
collapsed upon themselves, they were pulled together by their own gravity and formed clusters
of galaxies, with the galaxies themselves breaking up into stars like those of the Milky Way. The
stars might have broken up to form their planets like those of our solar system.
Q. Define Environmental Pollution and discuss major air pollutants?
Ans. Environmental pollution
We have to understand some of the basic concepts regarding environment, pollution and
pollutants before we take about environmental pollution.
Environment
The word environment has been derived from the French word Environ which means to
surround. Thus environment refers to the sum total of conditions which surround man at a given
point of space and the time. In other words, environment is the totality of all physical, social and
biological factors as well as collectively that comprises the natural and manmade surroundings.
Environment may dividend into two broad types physical environment and biotic
environment. Physical environment is one solid to liquid three broad categories (i) solid, (ii)
liquid and (iii) gas. The biotic component of environment consists of plants and animals
including man as an important factor.

Sanjeev Degree College Commercial Geography
S K V S L Narasimha Raju Page 11
Pollution
The word pollution has been taken from the Latin word pollutionem, later on Oxford
English dictionary used the word pollute in 19 century. In the twentieth century the word
pollution was used with reference to contamination of water, soil and air.
R F Dushman in 1975 has defined pollution as "the accumulation of substances or forms
of energy, in the environment in the quantities, or at rates of flow, which exceed capacity of
ecosystems to either neutralize or disperse them to harm less level".
Pollutant
According to sir Frederick Warner, "A substance is normally considered to be a pollutant
if it is adversely alter the environment by changing the growth rate of species, interfaces with
the food chain, comfort, property values of the people". Pollutants maybe solids, liquids as well
as gases. The solid particulate pollutants industrial waste such as lead, Mercury etc. The liquid
pollutants are dissolved solids, Ammonia, urea, chlorides, carbonates, pesticides all in dissolved
form, oil and greases etc. The major gaseous pollutants are carbon dioxide, sulphur dioxide,
nitrogen oxide etc.
Types of environmental pollution
As mentioned earlier, our earth has three main components like air,water and land. All
the three components are badly polluted in the present day due to large scale industrialisation and
urbanisation all over the world.
Air pollution
Air is the most essential for all types of life in the biosphere because it helps in breathing.
Man can live without food for a few weeks, without water for a few days but he cannot
live without even for a few minutes.
The atmospheric air is recognised as cleaned when there is no drastic variations in its
natural composition.
World Health Organisation (WHO) has defined air pollution as limited to situation
in which the outdoor ambient atmosphere contains materials in concentration which are harmful
to man and his surrounding environment. In simple words air-pollution refers to the injection
atmosphere of gases, liquids and solid particles detrimental to human health. Air pollution knows
no political boundaries, it's a global phenomenon.
Air pollutants
Air pollutants are classified as primary or secondary based on their characteristics. The
pollutants emitted into the atmospheric directly from the identifiable sources that remain
scattered in the atmosphere in the same chemical form also known as primary pollutants. The

Sanjeev Degree College Commercial Geography
S K V S L Narasimha Raju Page 12
pollutants which undergo chemical changes in the atmosphere as a result of reactions among two
or more pollutants are called secondary pollutants.
Normally speaking, urban areas more pollutant than rural air. The routine pollutants in
urban area include sulphur dioxide, nitrogen oxides and suspended particulate matter. Besides
there is a severe threat from a range of other toxins such as carbon monoxide, small particulate
emissions, lead, Benzene, polycyclic aromatic hydrocarbons and ozone. A brief description of
various air pollutants commonly found in the urban atmosphere is given below:
1) Sulphur dioxide is (SO2) critical pollutant
Sulphur dioxide is generated from the natural resources such as bacterial decomposition
of sulphurs in the soil. It has been estimated that about one third of the Sulphur dioxide
emissions in the atmosphere arise from the activities of man. Significant qualities of sulphur
dioxide are emitted by oil refineries, automobiles, acid plants etc.
2) Nitrogen oxides and (NO2) killer gas
Generally recognised as sum of nitric oxide and Nitrogen dioxide, it is a reddish brown
corrosive gas. The automobile exhaust is one of the largest sources of NO2 emission in the
ambient air. The significant concentration of Nitrogen oxides in gaseous emissions occurs from
the industrial emissions where nitric acid is produced or is used in chemical reactions. The
residence time of an NO2 in the atmosphere is about a few days and is scavenged from the
atmosphere.
3) Particulate matter
The particulate matter refers to the solid or liquid particles in its form of dust fumes, mist
or smoke and originated either by dispersion of particles from breakdown of solid bulk
material. The particle size is one of the most important physical characteristics of a air borne
particulate matter because it controls the residence time of particles in the ambient air. The size
of the particles may vary from 0.002 πm (micron) to 500 Micron. Particles larger than 50
Micron can be seen with naked eye. Following two types of particulates are recognised
depending upon their size.
i) Suspended Particle Matter(SPM)
Particles with size less than 100 micron are very small particles and tend to remain
suspended in the atmosphere for a long period of time. Hence, they are known as suspended
particulate matter. The main contributors of SPM in ambient air are dust from different sources
like action activities, open fields, stone crushers etc. And from industrial sources such as thermal
power plants.

Sanjeev Degree College Commercial Geography
S K V S L Narasimha Raju Page 13
ii) Respirable Suspended Particulate Matter(RSPM)
Respirable Suspended Particulate Matter are the particulates having diameter less than 10
mm. The sources of RSPM include road test, wind blow dust and the dust from agriculture,
construction.
The air quality and the air pollution level vary with the level of concentration of
particulate matter in the air. The Environment Pollution (Preventive and control) Authority -
EPCA and the Central Pollution Control Board (CPCB) have categorised the air pollution
depending on the concentration of particulate matter.
Delhi with PM 10 concentration of 268 microns is the most polluted city according to a
survey 168 Indian cities conducted by Greenpeace India in March, 2015.
4. Carbon Monoxide (CO)
Incomplete combustion of carbon results in the production of carbon monoxide. The
sources of carbon monoxide are motor vehicles, fuel oil combustion, industrial processes, solid
waste disposal and refuse burning. Carbon Monoxide emissions are increased due to the presence
of oxygen. In urban areas, carbon monoxide concentration follow depends on the traffic volume
and speed. Generally CO concentrations reach to a maximum in the early morning hours due to
peak early morning traffic and then fall to elevated level during the day. A second peak of CO
concentration observed corresponding to the late afternoon traffic period and decrease to low
levels during the night.
5. Photochemical Oxidants
These are mainly the result of secondary reactions in the atmosphere and are not directly
attributed to nature. Ozone is the main photochemical oxidant and its formation is normally
attributed to nitrogen dioxide photolytic cycle. The presence of reactive hydrocarbon allows
Ozone to accumulate at higher than steady levels.
6. Organic in Ambient Air
Hydrocarbons and polynuclear aromatic Hydrocarbons, benzene and volatile organic
compounds are the chief organics in ambient air.
(i) Hydrocarbons and Polynuclear - aromatic hydrocarbons (PAH)
The major sources of Hydrocarbons are partially burned gasoline from vehicular sources
and interior emissions. Gasoline evaporation and solvent evaporation also accounts for admission
of hydrocarbons. Industrial sources of hydrocarbons include chemical manufacturing
facilities, petroleum refineries.
Polynuclear aromatic hydrocarbons (PAH) are homologs of benzene. The sources of
PAH’s heat generation using coal, motor cycle, industries such as steel and coke manufacturing.

Sanjeev Degree College Commercial Geography
S K V S L Narasimha Raju Page 14
ii)Benzene
Benzene is produced during the distillation of crude petroleum and forms a significant
component of gasoline. Transport vehicles comprise the major source of benzene emissions. The
urban areas have higher concentration of benzene.
iii) Volatile Organic Compounds (VOC)
The organic compounds which evaporate easily are recognised together as volatile
organic compounds. The volatile organic compounds are admitted to the atmosphere from
transport use of Industrial solvents and for domestic purposes. These compounds are scavengers
with along with water vapours. Some outstanding examples of organic are organic acids, alcohol
etc.
Q. What are the effects of air pollution on human health? Explain with examples?
Ans. Health effects associated with air pollutants
Air pollutants have serious effect on human health. People living in urban and industrial
areas face various types of diseases due to air pollution.
1. Health effects of Sulphur dioxide(SO2)
Human beings chronically exposed to SO2 have higher cough, shortness of breath, and
colds of long duration. Increased prevalence of cough in children with intermittent exposure to
SO2 levels of 1.0 PPM is observed.
2. Health effects of Nitrogen Dioxide(NO2)
The oxides of nitrogen are toxic gases which enter the human body during breathing. This
exposure can cause decrement in lung functions. Continuous exposure NO2 makes lung
dispensability and permanent changes in the lungs.
3. Health effects of Particulate Matter
The particles may influence the human body on setting and cause external effects such as
effects on skin. The effect of irritant particles depends upon the size of the particles. Fine
particles may cause irritation. As the presence of final particle size increases, percentage of
particles deposited in upper part of respiratory tract decreases. The symptoms are often recorded
into upper respiratory symptoms such as stuffy or running nose head cold a red eyes. The lower
respiratory symptoms include dry cough, shortness of breath, chest discomfort and pain. The
cough is the most frequently symptom due to continuous exposure in high particulate ambient
air.

Sanjeev Degree College Commercial Geography
S K V S L Narasimha Raju Page 15
4. Health effects of Carbon Monoxide(CO)
Carbon monoxide is absorbed from the lung tissue in blood stream. High dose exposure of
CO may affect lung tissue and acute decrement in lung functions. Increased concentration of
carbon monoxide also leads to stroke, head injury, hypertension etc. High CO concentration has
special effect on children and infants. There are strong evidences of reduction in birth weight,
behavioural development and sometimes even infant death syndrome. The influence of CO
include effects on lever, kidney, bone and immunity capacity.
5. Health effects of Ozone
Variations in a ozone levels in urban environment are the main causes of concern. Higher
elevation of ozone causes major problem of human health which includes eye, nose and throat
irritation, headache and airways lining of lungs. Acute exposure of ozone may cause lung
inflammation within few hours. Acute exposure to low ozone levels decrease activity pattern
may affect immune system leading to potential health risk.
6. Health effects of Benzene
Benzene is a hazardous air pollutant which accelerates human health risk from ambient air.
International Agency for Research on Cancer (IARC) has classified benzene as main pollutant to
increase the frequency of cancer in human. Exposures to higher level of benzene cause cancer in
kidney, stomach, lung, and bladder. The other effects of benzene are disorder of blood, effect on
bone marrow, reduced ability of blood danger to clot, danger to immune system and
reproductive. It has been found that benzene is more respectable to women than men.
7. Health effects of Volatile Organic Compounds(VOC)
These compounds react with oxides of nitrogen in the presence of sun light and give rise to
photochemical smog. This smog is a dense haze which restricts visibility. Hazy fumes cause
irritation to eyes and lungs and damage plant life.
8. Health Effects of Lead
Lead particles from the ambient air can be inhaled; can settle down as dust in neighbouring
area, on vegetation and water bodies. Lead is pervasive environmental poison which effects
system in the body. It can damage the kidneys, the nervous system, the reproductive system and
cause high blood pressure. Children are more prone to lead pollution because they absorb lead
more rapidly than adults. It affects the development of brain of young children. Children exposed
to lead show lack of Intelligence, behavioural problems and decreased ability to concentrate.
Lead especially harmful to pregnant women and infants. Not to speak of ladies, infants and
children’s, even adult males are not spared by lead pollution in the air. Hypertension, headache,
confusion, irritability are problems faced by pollution caused by lead.

Sanjeev Degree College Commercial Geography
S K V S L Narasimha Raju Page 16
Q. Describe the sources of air pollution and suggest measures to control air pollution in
India?
Ans. Vehicular Pollution
Vehicular pollution has grown at an alarming rate due to growing urbanization in India.
The air pollution from vehicles in the urban areas, particularly in big cities has become a serious
problem. The pollution from vehicles has begun to symptoms like cough, headache, irritation of
eyes and divisibility problems.
The main pollutants emitted from the automobiles are hydrocarbons, benzene, carbon
monoxide, sulphur dioxide, Nitrogen dioxide and particulate matter. The main cause of vehicular
pollution is the rapidly growing number of vehicles. The other factors of vehicle pollution in the
urban areas are 2 stroke engines, poor road conditions, old vehicles, inadequate maintenance,
poor road condition and old automotive technologies and traffic management system. In India,
the number of vehicles increased from 0.3 million in 1951 to 58.3 million in 2001 and
2002. About half the vehicles are concentration concentrated in 39 metropolitan cities. The two
wheelers are the major contributors of vehicular air pollution followed by four wheelers.
Delhi is a typical example of air pollution by vehicles. Delhi's vehicular pollution
increased from an significant of 2.17 lakh in 1971 to 90 lakh in 2016. Over 1,400 vehicles are
registered each day in Delhi. Delhi has more vehicles than Mumbai, Kolkata and Chennai put
together. Unfortunately, number of vehicles in Delhi outpaces the road length.
Share of vehicular pollution in Delhi has increased from 23 % in 1970-71 to 71% in
2013-14. In contract share of industrial pollution decreased from 56 % in 1970-71 to less than
20% in 2013-14.
Much of the vehicular air-pollution can be avoided by maintaining proper speed of the
vehicles. Vehicles standing on the road crossing for in traffic jams cause more pollution.
Industrial pollution
There has been phenomenal growth of industries in India, particularly after independence
Industries emit all sorts of pollutants in the air and result in the air pollution to great extent. The
major industrial air pollutants are suspended particulates, carbon monoxide, sulphur dioxide,
nitrogen oxides and many more.
In Delhi, besides big units there are 70,000 and uncontrolled small scale industries,
discharging into atmosphere gases, liquids and solid wastes producing health hazards. In
Mumbai belt between Chembur and Trombay is highly industrialized and has 3 to 6 times more
pollution than the remaining parts of the city.
The major pollutants are suspended particulates (560 tonnes), carbon monoxide (450
tonnes) Sulphur Dioxide (125 tonnes) hydrocarbons (102 tonnes) and nitrogen oxides(70 tonnes).
Surat is another example of air pollution. This industrial city has a very high average of

Sanjeev Degree College Commercial Geography
S K V S L Narasimha Raju Page 17
suspended particulate matter (SPM) amounting to about 267 microgram per cubic metre of area
per day. Ahmedabad has a large number of textile mills as well as other industries which are
contributing to air pollution.
The Bhopal Gas Tragedy
Air pollution is also caused by sudden gas leakage in industries. The Bhopal Gas
Tragedy, which occurred on the night of December 2-3 1984 from the Union Carbide Factory, is
a living example of one of the deadliest disasters caused by the human negligence. This is
considered to be the biggest tragedy so far in the industrial history of the world. According to the
official sources 2,500 human lives lost due to leakage of deadly Methyl Iso Vunte (MIC) gas but
the non-governmental sources put the death toll at 5,000 persons. More than 3,000 people fell
seriously ill. About 200 women deliver dead babies and about 400 babies died within a few
hours of their birth. Those who could survive, developed blue spots in their levers, suffered from
coughs and asthma and most of them lost their eye sight. About 47% of the pregnant women
suffered from instant abortion, where as some pregnant women opted for voluntary abortion.
According to the official figures 10,000 people have been rendered permanent disabled and
another 30,000 partially handicapped. About 1.5 Lakh persons have minor disability. It is,
therefore righty said that various whereas Industries, bring up economic prosperity, they cause
ill health and death also.
Thermal Power Plants
Thermal power plants comprise the second most dangerous source of air pollution. Next
only to vehicles. Most of the thermal power plants used large quantities of coal which produce
huge amount of smoke, ash and other pollutants. The coal used in thermal power in India is
really of good quality. The ash content of the inferior grade coal is 38% and in future may rise to
42%. As a result, emissions of SPM, SO2 and fly ash are of very high order. It has been reported
that more than half of the thermal power plants in the country are not complying with the
standards and are delivering out as much as 40 million tonnes of fly ash every year.
In Delhi, more than 40% of the suspended particulate matter is contributed by three
thermal plants at Rajghat, Indraprastha Badarpur. These three thermal power plants account for
about 15% of the total air pollution in Delhi.
Supply of the beneficiated coal- coal washed to lower ash content has emerged as a
serious policy issue in the last decade. Pollution control equipment can also function more
efficiently if ash load is reduced by using washroom coal.
Initiatives for control of air pollution
Various measures have been taken to control air pollution from vehicles and industries.
These measures are described as under:
Measures taken for control of air pollution from vehicles

Sanjeev Degree College Commercial Geography
S K V S L Narasimha Raju Page 18
1. Vehicular emission norms
Strict emission norms, particularly in metropolitan cities like Delhi, Mumbai, Kolkata,
Chennai etc have been introduced and enforced from time to time so that air pollution level is
controlled to the tolerable limits. Different phases of Euro and Bharat are worth mentioning in
this context. However, rapidly increasing number of vehicles in our cities and towns has more or
less multiplied the impact of vehicular emission norms with respect to air pollution.
Barely 20 Indian cities follows Euro IV emission standards for new vehicles, most follow
Euro III. Euro IV is seven years behind. European standards and Euro III is behind by12 years.
2. Fuel quality specifications
Diesel and Gasoline fuel quality with respect to environment related parameters had been
notified under Environment (Protection) Act during April 1996. The specifications include
low leaded gasoline, unleaded gasoline and low sulphur diesel.
(i) Unleaded Gasoline
With the progressive reduction of lead content in petrol, introduction of unleaded petrol for
new passenger cars from April 1995 and supply of only unleaded petrol for all vehicles from
September 1998. The lead content in the atmosphere near traffic and sections of Delhi has
reduced by more than 60% with the introduction of unleaded petrol.
(ii) Benzene reduction
The fear of increased emission of benzene and reduced performance of engines by the use of
unleaded petrol has also been falsified. The oil refineries were told to combine the benzene
content in the unleaded petrol up to 5% in 1996 and 3% from the year 2000. In addition to
phasing out of lead, it is considered necessary to reduce the benzene to 1% or lower and
aromatics in petrol not only for Delhi but also for other parts of the country.
(iii) Sulphur in diesel
Sulphur content in diesel supplied in Delhi was reduced to 0.5% in 1996 and it was further
reduced to 0.25% from April 1996 onward. The diesel with 0.25% sulphur has been made
available throughout the country by September 1999. Considering the fact that several countries
have introduced diesel with much lower sulphur content it is necessary to have low sulphur
diesel for meeting the emission norms.
3. Quality lubricants
A specification of 2T oil for engines with respect to smoke emission has been notified under
EPA (Environment Pollution Act) during September 1998 for implementation from 1.4.1999
throughout the country. Pre mix 2T oil dispenser has been installed at all petrol filling stations in

Sanjeev Degree College Commercial Geography
S K V S L Narasimha Raju Page 19
big cities so that excessive oil is not being used by the vehicle owners. Sale of loose 2T oil has
been banned from December 1998 in Delhi.
4. Alternative fuels
A very important factor in reducing vehicle pollution is the introduction of alternative fuels
such as CNG and LPG.
(i)Bio fuels mainly Ethanol and Biodiesel are the prospective options.
(ii)CNG (Compressed Natural Gas)
CNG is a better and clean fuel providing limited emissions of various toxic gases. All
Government vehicles were required to compulsorily fit CNG kit. CNG kits has been exempted
from customs duty for promotion of installation of CNG kits in vehicles. The total CNG vehicles
in the country touched 3.54 lakhs in 2012.
(iii)LPG
The uses of LPG as an alternative fuel in automobiles have been made automobile fuel.
Three wheelers have been ordered to switch over to LPG made from September, 2005.
(iv)Battery driven vehicles
Battery driven vehicles have been introduced in few corridors and in Delhi and in some
other big cities.
5. Phase out of Grossly Polluting Vehicles
(i)Registration of new auto rickshaw with conventional engine has been banned from may 1996
and registration of defence service under government auctioned vehicles have been banned from
1998 in Delhi.
(ii)Commercial vehicles more than 10 years old have been prohibited from major cities of the
country.
(iii) Registration on alteration of vehicles by replacing petrol engine with diesel has been banned.
6. Promotion of Comprehensive inspection and Certification
It has been possible to reduce 30 to 40% pollution loads generated by vehicles through
proper periodical inspection and maintenance of vehicles. Such inspection and maintenance of
vehicles is being carried on by State Pollution Boards, Pollution Control Committee and
Transport Directorates in different parts of the country.

Sanjeev Degree College Commercial Geography
S K V S L Narasimha Raju Page 20
7. Traffic management
(i)Restriction has been imposed on goods vehicles during daytime in several big cities.
(ii)Time clock has been installed in important red lights to enable the drivers to switch off their
vehicles depending on the time left in the time clocks.
(iii)More fly-over’s and subways have been constructed and T-Junctions have been closed for
better traffic floor.
(iv)Almost all big cities are busy with traffic jams on important roads. Standing vehicles cause
much air pollution steps should be taken to avoid traffic jams as far as possible.
8. Public Transport System
(i)Public transport system is monitored from time to time in various urban cities of the country.
The number of buses has been increased in big cities.
(ii)Private sector has been allowed to operate public transport buses to increase mobility.
(iii)Metro Rail Transport System is making Rapid progress in large number of cities and is likely
to reduce pressure on transport system of these cities.
9. Technology
(i)Two wheeler scooters with 4 stroke engines have been introduced in the market.
(ii)Registration of only rear engine auto rickshaw is being allowed.
(iii)Only four stock two wheelers are being registered.
10. Information Dissemination/ Mass Awareness
(i)Messages related to vehicular emissions are disseminated through newspapers, magazines,
television, radio, and internet and through workshops etc.
(ii)Display of ambient air quality data through Electronic Display System as well as
dissemination through newspapers, daily news and internet.
(iii)Publishing reports related to vehicle pollution control and dissemination to various
organisation.
(iv)Regular publication of air quality statistics regarding ambient air quality status in the country.
(v)Non-Government organisations (NGO's) working in the area of vehicular pollution control in
different parts of the country are being encouraged for creating mass awareness.

Sanjeev Degree College Commercial Geography
S K V S L Narasimha Raju Page 21
Measures taken for controlling air pollution from industries.
1. Emission standards have been notified under the Environment Protection Act 1986 to check
pollution.
2. Industries are been directed to install necessary pollution control equipment in a time bound
manner and legal action has been initiated against the defaulting units.
3. Critically polluted areas have been identified. Action plans have been formulated for
restoration of environmental quality in these areas.
4. Environmental guidelines have evolved for sitting industries.
5. Environmental clearance has been made compulsory for 29 categories of development projects
including public hearing NGO participation as an important component.
6. The process of environment auditing has been initiated in highly polluting
industries. Submission of environmental statement has been made mandatory.
7. Minimal National Standards have been presented for highly polluting Industries under The Air
(Prevention and Control of Pollution) Act, 1981 and Environment (protection) Act 1986.
8. Coal based Power plants located beyond 1,000 kilometres from the pithead are required to use
low ash content coal. Power plants located in the sensitive areas are required to use low ash coal
in irrespective of their distance from the pit head.
9. It is estimated that about 40 million tonnes of fly ash is generated per annum from thermal
power plants.
10. Use of cleaner technologies is a new dimension for cleaner production and to increase
production efficiency.
Q. What do you mean by water pollution? What are the main causes of water pollution?
Ans. Water Pollution
Water is the most important element in the biosphere. The purity and quality of water is
of basic concern to mankind. Nature has given as plenty of water and even then we are feeling
the shortage of water for drinking, washing, irrigation and industrial purposes because we have
misused and polluted our water resources to a great extent. Water pollution may be defined as
alteration in the physical chemical and biological characteristics of water which may cause
harmful effects on human and aquatic life. Water pollution is now a day’s considered not only in
terms of public health but also natural beauty and resources.
Water resources are divided into two categories surface water and ground water. Surface
water is found in form of rivers, canals, lakes and ponds etc Rain water in the rocks under the

Sanjeev Degree College Commercial Geography
S K V S L Narasimha Raju Page 22
surface and is available as underground water. This is used through hand pumps, wells, tube
wells and springs.
Surface Water Pollution
According to a report 70% of the available water in India is polluted. Most of the rivers
that are carrying polluted water. We have been dumping all sorts of waste matter into the rivers.
These wastes are both solids as well as in dissolved form. Apart from polluting the river, they
decrease the depth of the river and raise the level of the river beds. Thus the river becomes a
garbage can, without depth and flow.
Main Causes of Water Quality Degradation
There are several causes of water pollution in India. The main causes are briefly
described as under:
1. Urbanisation
Rapid urbanisation in India during the recent decades has given rise to a number of
environmental problems such as water supply, wastewater generation and its collection,
treatment and disposal. Many towns and cities which come up on the banks of the rivers have not
given a proper thought to problem of waste water, sewage etc. In urban areas, water is tapped for
domestic and industrial use from rivers, streams, lakes, ponds, wells etc. Nearly 80% of the water
supplied for domestic use passes out as waste water. In most cases, this waste water is let out
untreated and causes large scale pollution of the surface water. A part of it percolates into the
ground and contaminates the groundwater. About 70% of the population of class I cities is
provided with sewerage facility. The Ganga river basin contributes about one third of the total
waste water of India.
As per the latest estimate, only 30% is treated before letting out, the rest is disposed
off untreated. The level of treatment available in cities with existing treatment plant varies from
2.5% to 89% of the sewage generated.
Municipal water treatment facilities in India, at present, do not remove traces of heavy
metals. Given the fact that heavily polluted waters are the major sources of municipal water for
most towns and cities along with courses, it is believed that every consumer has been, over the
years, exposed to unknown quantities of pollutants in water they have consumed. To add to this,
Indian towns and cities have grown in an unplanned manner due to rapid population growth.
Facilities for running water have been provided in many towns and even in some villages
during the last couple of decades. Resulted in the use of flush latrines and much larger use of
water in home for bathing, washing of clothes, and utensils etc generating large quantities of
waste water. According to estimates estimates made but the Central pollution board, only 22% of
the waste water from class 1 cities and 14% from class 2 cities is being collected through
severage.

Sanjeev Degree College Commercial Geography
S K V S L Narasimha Raju Page 23
Situation in big cities is worsened by migration of poor people from the surrounding rural
areas. These people migrate to the cities in search of livelihood. According to an estimate CPCB,
only about 40 to 50% of the pollution of the major cities like Delhi, Mumbai, Kolkata, Chennai
and Bangalore are served by sewer systems. Even where the sewers exist, they often storm water
or other surface drains or percolate into the soil to reach groundwater. Very often uncollected
and untreated severage water reaches the streams thereby polluting their water.
2. Industries
Most Indian rivers and other sources of fresh water are polluted by industrial wastes. All
these Industries wastes are toxic to life forms that consume this water. Total wastewater
generated from all major industrial sources is 83,048 Mld includes 66,700 Mld of cooling water
generated from thermal power plants. Out of remaining 16,348 Mld of wastewater thermal power
plants generate another 7,275 Mld as boiler blow down water and power flow from ash ponds.
Engineering industries comprise the second largest generator of waste water in terms of volume.
Under this category the major polluting industries are electroplating units. Other significant
contributors of wastewater are paper mills, steel plants, and textile and sugar industries. The
major contributors of pollution in terms of organic load are digitalieries followed by paper mills.
Both large scale industries and small scale industries contribute their share of water pollution.
While many large scale industries claimed to have installed costly treatment and disposal
equipments, these are often not in proper working order.
Small scale and cottage industries cause no less water pollution then the large scale
industries. There are about 3 million small scale and cottage industrial units in India. These units
neither have, nor can they afford, appropriate sanitation and/or pollutant disposal systems, and
yet have not hesitated in adopting highly polluting production technologies such as chrome,
tanning of leather, and use of other refractory and toxic Chemicals etc.
3. Agricultural runoff and improper agricultural practices
Traces of fertilizers and pesticides are wasted into the nearest water bodies at the onset of
Monsoons. As the point of entry of such agriculture inputs is diffused throughout the river basin,
they are termed as non-point sources of pollution. Although irrigation has increased considerably
in the country, precious little has been done to tackle the problem of the high salinity return
water. According to the findings of CPCB, some of the seepage into the drain contain over
15,000 mg per litre of chlorides. Intensive and ever increasing use of chemical fertilizers,
pesticides, and other chemicals is adding a new dimension to such pollution.
Floodplain cultivation is another significant contributor to water pollution. Fertilizers and
pesticides used in these traits of land are bound to be washed into the rivers during the
monsoons.
Sanjeev Degree College Commercial Geography
S K V S L Narasimha Raju Page 24
4. Withdrawal of Water
Indian rivers, particularly the Himalayan Rivers, have plenty of water in their upper courses.
They are, however, starved of water they enter the plain area. Irrigation canals whisk away clean
water soon after the rivers reach the plains.
The Yamuna has almost no water at Tajewala in Haryana where the Eastern Yamuna canal
and western Yamuna Canal abstract all the water for irrigation. Similarly, the upper Ganga canal
and the lower Ganga Canal have left the Ganga downstream almost dry. When the Yamuna and
the Ganga flow past Delhi and Kanpur respectively, they are turned into stinking sewers.
Therefore, it is essential that a minimum level of flow of water must be maintained in the river.
This is known as minimum flow of rivers. Minimum flow in the recipient river will be required
to maintain the desired water quantity. Further, the study has expressed the view that it is not
possible to fix the minimum flow of water in the entire course of the river because it depends on
the pollution discharged at the different points on the river. For example the existing minimum
flow in the Ganga at Kanpur in May is hardly 50 cubic metres per second where as the required
minimum in the same month is 350 cubic metres per second. In view of the increased demand of
water for irrigation, the minimum flow is likely to fall further in future.
The maintenance of minimum flow, to sustain river ecology through its course as well as its
confluences, is a recent awakening which requires a serious thought. This policy must be pursued
vigorously so that river pollution is kept at certain permissible limit.
5. Regional and social practices
Regional faith and social practices also add to pollution of our river waters. Waste of cattle and
other animals are disposed in the rivers. Dead bodies are cremated on the river banks. Partially
burnt bodies are also flung into the river. All this is done as a matter of religious faith and in
keeping with ancient rituals. These practices pollute the river water and adversely affect the
water quality. Mass bathing in river during religious festivals is another environmentally harmful
practice. Religious practices also demand that offerings from a pooja be emerged In a river.
Plastic bags are very dangerous and further add to the pollution load of the river.
Q. Explain the effects of water pollution on human health?
Ans. Effects Of water pollution
Water pollution adversely affects the health and life of man, animal and plants alike.
Polluted water is also harmful for agriculture as it is adversely affects the crops and the soil
fertility. Pollution of sea water damages the oceanic life.
1. Health effects of water quality
Consumption of polluted water is a major cause of ill health in India. Polluted water causes
some of the deadly diseases like cholera, diarrhoea, tuberculosis etc. About 80% of stomach
diseases in India are caused by polluted water. Water borne diseases are the single most

Sanjeev Degree College Commercial Geography
S K V S L Narasimha Raju Page 25
important factor responsible for nearly 80% of human morality in India. Children are most
affected, especially in rural areas and urban slums.
2. Effects of organic pollution on water quality
All organic materials can be broken down or decomposed by microbial and other biological
activity. Organic and some of the inorganic compounds exhibit a biochemical oxygen demand
because oxygen is used in the degradation process. Oxygen is a basic requirement of almost all
aquatic life. Typically sources of organic pollution are sewage from domestic and animal
sources, Industrial waste from food processing, paper mills, sugar and other agro based
industries.
3. Effects of nutrients on water quality
Water supports aquatic life because of the presence of nutrients in it. Here the primary
focus is on fertilizing chemicals such as nitrates and phosphates. Although these are
important of a plant growth, too much of nutrients enchorage the over-abundance of plant life
and can result in environmental damage.
4. Effects of high dissolved solids(HDS) in water quality
Water is the best solvent and can dissolve a large variety of substances which come in its
contact. The amount of dissolved solid is a very important consideration in determining its
suitability of drinking, irrigation and industrial uses. In general, waters with the total dissolved
solids of less than 500 mg/litre are most suitable for drinking purposes. Higher amount of
dissolved solids may lead to impairment of physiological processes in human body. Dissolved
solids are harmful for industrial also because they form scales, cause forming in boilers,
accelerate corrosion and interfere with the colour and taste of many finished products.
5. Effects of toxic pollutants on water quality
Toxic pollutants mainly consist of heavy metals, pesticides and other individual xenobiotic
pollutants. The ability of a water body to support aquatic life, as well as its suitability for other
uses depends on many trace elements. Some metals present in trace quantities are important for
life as they help and regulate many physiological functions of the body.
6. Effects of thermal discharge on water quality
The discharge of cooling water from industrial and commercial operations generally heats up
the aquatic environment. Organisms may become physiological stressed or may even be killed
when exposed to heated water. If water heating is supplemented by the summer heat, the impact
on aquatic environment can be disastrous. Thermal Pollution may increase their toxicity to the
aquatic life. Bioavailability of many pollutants may also increase due to thermal pollution, which
may ultimately adversely affect the aquatic life.

Sanjeev Degree College Commercial Geography
S K V S L Narasimha Raju Page 26
Groundwater quality
The term 'groundwater' is defined as the water that occurs below the surface of the earth.
In a country of monsoon climate like India, where rainfall is seasonal and undependable and
variable and where the surface water is always in short supply, ground water plays a vital role in
everyday life of the people. Most of the drought prone areas largely depend on groundwater.
Sources and types of groundwater contaminants
Groundwater contamination leads to several problems like taste, colour, hardness and
forming. Once polluted groundwater may remain unusable or even in hazardous condition for
decades or even centuries. It is often difficult to identify the nature and sources of groundwater
pollutants and water quality problems. Normally speaking, the quality of groundwater is affected
by waste disposal and land use. The disposal of fluids through wells and sinkholes directly into
aquifers’ also results in contamination of the groundwater. Infiltration of contaminated water
also causes groundwater contamination.
Q. Explain about Soil or Land pollution and its prevention and control?
Ans. Soil or land pollution
Soil is a very important environmental attribute because it supports all sorts of plant life
found on land. The main factors of soil pollution are the high state of soil erosion, excessive use
of chemical fertilizers, bio seeds, polluted liquids and solids from urban and industrial areas,
water-logging and droughts etc. Some of the micro-organisms and unwanted plants enter the soil
and result is soil pollution. Some of the air-borne pollutants from the industries are deposited on
the land surface and pollute the soil. Soil particles from mining areas pollute the neighbouring
land to a great extent rendering it unsuitable for agriculture. Soils near copper smelting units are
so polluted that no plant growth is possible there. Main sources of land pollution are briefly
described as under:
1. Chemical fertilizers and biocides
The accelerated use of chemical fertilizers and biocides in agriculture is the major cause of
soil pollution. They are used to increase the yields and to save the crops from insects, pests and
unwanted plant growth. When these are used in excess, their remnants are absorbed by soil
particles and contaminate crops grown in such soils. They are further transferred into
carnivorous through herbivorous and finally enter the human bodies in course of food chains.
They are responsible for several incurable diseases even cause death.
The use of biocides gained momentum in India with the commencement of Green Revolution
in 1966-67. The introduction of high yielding varieties (HYV) of seeds gave birth to heavy
doses of chemical fertilizers and biocides. The overall per hectare consumption of fertilisers rose
from a mere 0.55 kg in 1950-51 to 67 kg in 1992-93 and to 144. 33 kg in 2011-12.

Sanjeev Degree College Commercial Geography
S K V S L Narasimha Raju Page 27
2. Municipal solid waste
Municipal solid waste (MSW) is a heterogeneous mixture of various constituents. According
to Scavenging and Cleaning Act, Municipal solid waste includes:
• Dust, ashes, refuse and rubbish.
• Trade refuse.
• Carcasses of death animals and other matter.
• Sweeping, sandstones, leaves and other dead vegetarian.
• Wastes from shops and market areas including paper, straw and cardboard packing,
decaying fruits and vegetables and other described items.
• Other solid wastes generated from such as hospitals, schools, offices and small cottage
industries.
Depending upon the Municipal solid waste can be classified into two categories 'garbage' and
'rubbish'. the garbage is defined as a fraction of waste associated with preparation and
consumption of food. All other waste not classified as 'garbage' are designated as rubbish.
Municipal solid waste generation status in class-I cities
The quantity of municipal solid waste generated by a city depends upon a number of
factors of which size of pollution, standard of living, food habits, scale of commercial and
industrial activities etc are of primary importance. As such the per capita generation of solid
waste differs greatly from one city to another. It varies from 200 to 500 gram/person/day with an
average of 376 gram/person/day. Disposal of such large quantities of garbage is a difficult job.
The dumping grounds of such garbage are invariably polluted. It is estimated that about 25
human diseases are associated with solid wastes. Rats are carriers of insects and other bio
organisms and are responsible for spreading deadly diseases like cholera etc. Studies reveal that
an approximate of 70,000 flies can be produced one day cubic foot of garbage.
Management of municipal solid waste(MSW)
In India, recently solid waste management systems are assuming larger dimensions in
keeping Municipal Solid Wastes (Management & Handling) Rules 2000. Many of the
municipalities are taking appropriate action to improve various like collection of solid waste
from generation areas its transportation to processing and disposal site utilising the recycling
potential of solid waste and ultimately disposing of by land filling.
The urban solid waste management is an essential municipal service for protection of
environment and health of citizens. All the citizens, industries, hospitals and NGOs should co-
operate with the municipal authorities to ensure safe management of urban solid waste. Solid
waste should be collected from each house on a daily basis and transport to the disposal site.
Direct transfer of garbage from primary collection carts to covered transportation vehicles should
be encouraged.

Sanjeev Degree College Commercial Geography
S K V S L Narasimha Raju Page 28
Refuse from vegetable and fruit markets should be collected and transported to the
composting facilities. Large restaurants, hotels should be encouraged to develop their own site
treatment facilities.
According to the latest figures (2013) Delhi is generating about 9,500 metric tonnes of
garbage every day and is fast running out of landfill sites. It appears that garbage will soon
become the single most important issue for Delhi which requires immediate solution. It is felt
that unless a new technology is adopted, there will be no space left for garbage in the next few
years.
Hazardous Waste Generation
The term 'hazardous waste' is generally used for wastes, which are highly toxic and
hazardous in nature. According to hazardous waste rules notified in 1989, 'hazardous substance'
means any substance or preparation of which, by reason of its chemical or physicochemical
properties, or handling, is like to cause harm to human beings, other living creatures, plants,
micro-organisms, property or environment.
Prevention and control of soil pollution
Maximum soil pollution is done by use of bio seeds and chemical fertilizers. Farmers
should be properly educated to make judicious use of these chemicals. At the same time, efforts
should be made to develop less harmful and more useful chemicals for use in agriculture.
Urban and industrial clients can be used for irrigation after proper treatment.
Compostable organic substances such as vegetables, plant leaves and human wastes should be
properly composted, so that there is a proper disposal of the solid waste and it can also produce
organic manure. Today plastics are proving to be a big environmental hazard because they are
particularly indestructible. It takes hundreds of years for plastic to disintegrate, adding to soil
waste build-up, especially in urban and industrial areas. There is an urgent need to restrict the use
of plastics and to find out ways and means of recycling them.
Q. Explain noise pollution with its effects? And suggest ways to control noise pollution?
Noise pollution
Noise is unwanted sound and covers all sounds which can result in hearing impairment or
are harmful to health. According to K.E.Maxwell, "Noise is any sound that is not wanted. It is
one of the more common forms of atmospheric pollution". Now it become a major
environmental pollutant especially in urban areas. In 1972, the UN Environment Council at
Stockholm, noise pollution has been accepted as a problem, which needs proper control.
Measurement sound or noise and its intensity
The most popular measure of noise level is decibel measured by an instrument known as
decibel metre. A sound between 0 and 1 decibel is about the weakest that the average human can

Sanjeev Degree College Commercial Geography
S K V S L Narasimha Raju Page 29
hear. For testing purposes, 0 decibel is considered to be the threshold of hearing. A wishper is
about 20 decibel and an average speaking voice is about 60 decibels. The loudest that a person
can stand without discomfort is about 80 decibels. Automobile horns may reach 90 decibels and
a jet plane may have an intensity of about 140 decibels.
Actually, loudness alone is not the sole cause of noise problem, although this is the most
apparent characteristic of noise that creates environmental problems. The degree of noise is an
enclosed space or indoors is different from the level of outdoor noise.
Noise pollution in India
Noise pollution in India has increased considerably with the increase in urbanization and
industrialization. In most of the Indian cities, early morning tranquility is shattered by
automobiles, factory machines and loudspeakers from religious places. Television and radio sets
played at very high pitch, marriages and other festivals, cultural programs and a host of other
sources of noise add to the problem of noise pollution. Most of the big cities in India have noise
pollution much higher than the limit of 60-70 DB. Delhi 89 DB, Mumbai 85 DB , Chennai 82
dB, Madurai 75 DB and Nagpur 75 DB are some of the examples of cities suffering from noise
pollution.
Effects of noise pollution
Continuous and prolonged exposure to noise pollution leads to many disorders and
ailments. The most immediate and acute is the impairment of hearing. It also results in mental
tension, blood pressure, heart diseases and stomach trouble. Noise pollution also causes
annoyance, irritation and fatigue which results in low efficiency and high rate of errors. High and
sudden noise may lead to abortion in early stages of pregnancy. According to Kudesia, "It is
possible that due to disco dance and rock 'n' roll music we are raising a nation of teenagers who
will be hard of hearing before they reach age of 35 years. Those who listen songs from radio on
loud pitch fall in the same line". A study to measure the Noise Induced Hearing Loss (NIHL)
among the factory workers in the textile, automobile, fertilizers and chemical industries in
Chennai, Coimbatore, Madurai, Kochi and Thiruvananthapuram revealed that about 25% of the

Sanjeev Degree College Commercial Geography
S K V S L Narasimha Raju Page 30
factory workers and 10% people such as traffic constables and pavement vendors suffer from
Noise Induced Hearing Loss (NIHL).
Prevention and control of noise pollution
(i)Noise producing industries should be located away from residential areas.
(ii)The automobile horn should be designed in such a way that the noise it produces may not be
harmful.
(iii)Use of horn should be minimum and pressure horn should be banned as has been done in
many countries.
(iv)The noise created by railways can be checked by construction of ballast less rail tracks.
(v)Special arrangements be done to check noise air bases. Control of aircraft noise requires
several changes, which should be done.
(vi)The noise created by musical instruments, and other indoor equipments can be checked by
individuals in their own interest.
(vii)Effect of noise on the ear can be reduced by 40 to 50 dB by putting ear-plugs.
Q. What is meant by green house effect? Name the main green house gases?
Ans. Greenhouse effect
Literally speaking, greenhouse is the name given to a glass house which is used for
protecting delicate and rare plants that required warmth. The glass panels of the greenhouse
allow short wave heat radiations from the sun to pass through them into the greenhouse but
obstruct the long wave terrestrial radiations reflected from the earth's surface. This process
makes the house warmer and protects the plants from cold conditions. This phenomenon which
helps to grow even in cold conditions is known as greenhouse effect.
In this respect the atmosphere acts somewhat like the glass in a greenhouse or
automobile, letting through much of the incoming solar radiation but absorbing most of the
outgoing long wave radiation. This is called greenhouse effect.
Greenhouse effect can be used to grow summer vegetables in winter. This effect has been
gainfully used to grow vegetables in cold region at high altitude in Ladakh where normal
atmospheric temperature is exceptionally low.
The effect of greenhouse is that more heat enters the atmosphere then the amount of heat
which leaves it. Without natural "greenhouse effect" the earth would be as cool as the moon and
no life could be possible on the earth. The greenhouse gases present in the atmosphere act as a
Sanjeev Degree College Commercial Geography
S K V S L Narasimha Raju Page 31
blanket and if these gases are taken out of the atmosphere, the earth's climate would have been
33℃ cooler than what it is today.
Greenhouse gases
Carbon dioxide
Of all the greenhouse gases, the largest concentration is that of carbon dioxide. With
rapid industrialization and urbanization, the fossil fuels like coal, petroleum and natural gas are
used at an accelerated rate. Under the pre-industrial conditions of recent centuries i.e., 1780 the
atmosphere content of carbon dioxide was maintained at a reasonable low level. In 1880-1890
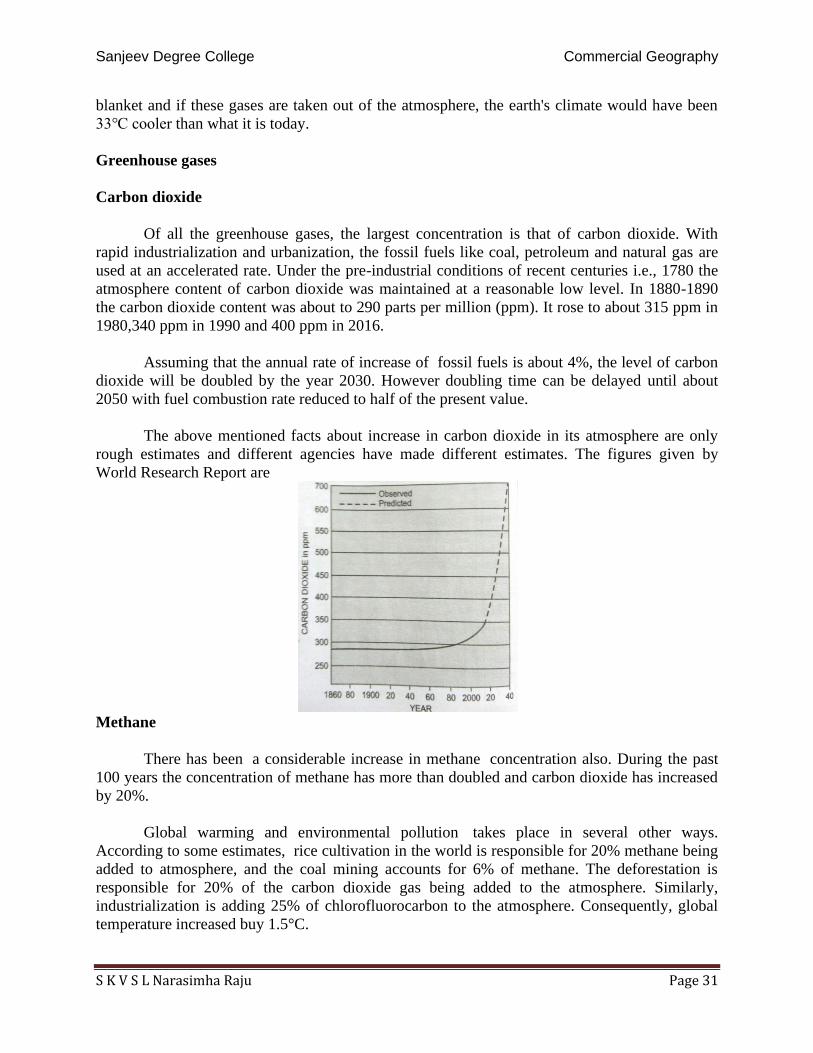
the carbon dioxide content was about to 290 parts per million (ppm). It rose to about 315 ppm in
1980,340 ppm in 1990 and 400 ppm in 2016.
Assuming that the annual rate of increase of fossil fuels is about 4%, the level of carbon
dioxide will be doubled by the year 2030. However doubling time can be delayed until about
2050 with fuel combustion rate reduced to half of the present value.
The above mentioned facts about increase in carbon dioxide in its atmosphere are only
rough estimates and different agencies have made different estimates. The figures given by
World Research Report are
Methane
There has been a considerable increase in methane concentration also. During the past
100 years the concentration of methane has more than doubled and carbon dioxide has increased
by 20%.
Global warming and environmental pollution takes place in several other ways.
According to some estimates, rice cultivation in the world is responsible for 20% methane being
added to atmosphere, and the coal mining accounts for 6% of methane. The deforestation is
responsible for 20% of the carbon dioxide gas being added to the atmosphere. Similarly,
industrialization is adding 25% of chlorofluorocarbon to the atmosphere. Consequently, global
temperature increased buy 1.5°C.

Sanjeev Degree College Commercial Geography
S K V S L Narasimha Raju Page 32
Chlorofluorocarbons
Chlorofluorocarbons(CFCs) are products of human activity. Ozone occurs in the
stratosphere where ultraviolet rays convert oxygen into ozone. Thus, ultra- violet rays do not
reach the earth's surface. The CFCs which drift into the stratosphere destroy the ozone. Large
depletion of ozone occurs over Antarctica. The depletion of ozone concentration in the
stratosphere is called the ozone hole. This allows the ultra-violet rays to pass through the
troposphere.
The overall rise in the atmospheric temperature is called global warming. In 1979, a
group of scientists convened by the National Academy of Sciences came to the conclusion that a
doubling of atmospheric carbon dioxide will cause an average global warming of about 3℃ by
the middle of 21st century. The greatest warning of the 20th century was duri g the two periods,
1901-44 and 1977-99 these two periods, global temperatures rose by about 0.4℃. In between
there was a slight cooling, which was more marked in the northern hemisphere.
If the raising tend in the increase of temperature continues, it will have far reaching
effects on the global environment. Several glaciers will melt and rivers will be flooded. The
water of the snow melt will reach the sea and there will be rise in sea level up to 15 to 20 metres.
Most of the low lying coastal areas will be drowned and almost all the major ports of the world
would perish. Besides it will change the rainfall patterns, create new plant diseases and pose
problems and enlarge ozone hole.
Q. Explain Climate changes and Global warning with evidences of climate change, and
causes of this phenomenon?
Ans. Climate change and global warming
Climate changes
Climate changes have been occurring throughout the geological history of the earth.
Some of the natural causes responsible for such changes has been variation in solar irradiation,
sun spots, earth's changing relations with sun. Changing position of the continents, changes in
the composition of the atmosphere and changes in volcanic activity. But human induced changes
are more pronounce if we look at the recent changes in climate. Early man lived in jungles and
sustained on hunting and gathering. Man started altering the environment since he controlled
fire, domesticated animals and started agriculture. Agriculture revolution about 8,000-10,000
years ago resulted in deforestation. Industrial revolution in the late 18th century lead to large

Sanjeev Degree College Commercial Geography
S K V S L Narasimha Raju Page 33
scale industrialisation and urbanisation and men's quest for natural resources led to
environmental degradation. The proportion of unwanted gases like carbon dioxide, methane,
nitrous oxide etc has increased which is the main cause of climate change.
Global Warming
Global warming farming is this slow increase in world temperature caused by the
greenhouse effect. Global warming is taking place due to the presence of greenhouse gases
(GHGs) in the atmosphere. The main greenhouse gases that cause global warming are carbon
dioxide (CO2), chlorofluorocarbons (CFCs), methane (CH4), nitrous oxide (N2O) and ozone
(O3). Some other gases such as nitric oxide (NO) and carbon monoxide (CO) easily react with
GHGs and affect their concentration in the atmosphere.
Evidence for climate change
Following evidences are enough to prove that climate changed over the years.
• Temperature is rising.
• Mountain glaciers are melting.
• Antarctica's ice sheets are breaking.
• Sea Level is rising.
• Temperature of the ocean water is rising.
• Snow lines in the tropical and Sub-tropical Mountains are shifting upwards.
• Tawing of permafrost in the northern hemisphere.
• Arctic pack ice is thinning and retreating.
• Tree line in mountain ranges is moving upward.
• Limit of arable land in Eurasia and North America is shifting northward.
• Many tropical diseases are spreading toward the poles and to higher elevations in the
tropics.
• There is shifting in seasonal weather phenomena and change in precipitation patterns.
• Grass has appeared on some slopes of Antarctica.

Sanjeev Degree College Commercial Geography
S K V S L Narasimha Raju Page 34
Consequences of climate change
Although it is difficult to exactly assess the consequences of climate change, experts feel that
climate change can have far reaching consequences. The following consequences are worth
mentioning.
• Melting of earth's ice and shrinking of ice sheets.
• Floods and droughts.
• Sea level change.
• Atmospheric circulation and changes in the duration of ocean current.
• Spread of tropical diseases.
• Changes in animal life.
• Northward movement of Inter-Tropical Convergence Zone (ITCZ).
• Increase in tropical cyclones, cloud cover and storms.
• Northern hemisphere melting of permafrost.
• Change in patterns of precipitation.
• Change in natural vegetation and soil belts.
• Changing in cropping patterns and crop yields.
• Reduction in soil moisture.
• Expansion of desserts and more desertification.
• Effect of food supply.
• Effect on tourism.
• Effect on national parks and natural reserves.
• Impact on international trade.
• Climate change and geopolitics.
• Ozone depletion.

Sanjeev Degree College Commercial Geography
S K V S L Narasimha Raju Page 35
Unit - 2
India - Agriculture
Land use
As in all other countries, land in India is put to various uses. The utilisation of land
depends upon physical factors like topography, soil and climate as well as upon human factors
such as the density of population, duration of occupation of the area, land tenure and technical
levels of the people. India has total geographical area of about 328.73 million hectares but
statistics pertaining to land utilisation were available for about 305.94 hectares.
1.Net Sown Area
Cropped area in the year under consideration is called net sown area. This area has a
special significance in an agricultural country like India because agricultural production largely
depends upon this type of land. There is an urgent need to increase the net area sown for meeting
the food and other requirements of rapidly increasing population in India, However, it is
heartening to note that net area sown has increased from 118.7 million hectares in 1950-51 to
140.74 million hectares in 2012-13. The percentage of net sown area increased from 42 in 1950-
51 to 46.05 in 2012-13. Net sown area accounts for about 46% of the total reporting area of India
against the world average of about 32%. This is much higher than 40% in the USA, 25% in
Russia, 16% in Brazil and only 6% in Canada. But the per capita cultivated land gone down
drastically from 0.53 hectares in 1951 to 0.11 hectares in 2012-13. This is a serious trend and can
be checked only by population control.
2.Area sown more than once
As the name indicates, this area is used to grow more than one crop in a year. This
accounts over 34.78 percent of the net sown area and 15.99 percent of the total reporting area of
the country. This type of area comprises of land with rich fertile soils and regular water supply.
This type of land is of special significance. Since almost all the arable land has already been
brought under plough, the only course left to increase the agricultural production is to increase
the density of cropping which can be done in increasing the area sown more than once. Large
tracts of the Indo-Ganga plain in Punjab, Haryana, Uttar Pradesh and Bihar and in coastal
regions have large Percentage of area sown more than once.

Sanjeev Degree College Commercial Geography
S K V S L Narasimha Raju Page 36
3.Forests
Forest area has increased considerably from 40.4 5 million hectares in 1950-51 to 70.01
million hectares in 2012-13. However, 22.88% of forest land to the total reporting area is not
sufficient for a tropical country like India where about 33% of the total land should be under
forests. This will require massive tree plantations and vigorous restrictions on the reckless felling
of trees. According to the expert committee recommendations, much of the area reclaimed from
the forest for agriculture should be retired from cultivation and brought back under forests to
save the land from the adverse effects of deforestation.
4.Land not available for cultivation.
This class consists of types of land viz. (i) land put to non agriculture uses and (ii) barren
and uncultivable waste. The area put to non-agricultural uses includes land occupied by villages,
towns, roads, railways or under water i.e. rivers, lakes, canals, tanks, ponds etc. The barren land
covers all barren and uncultivated land in mountains and hills soo, deserts and rocky areas. Land
not available for cultivation accounted for 14.3 percent of the total reported area present 2012-
13. The largest amount of land in this category is in Andhra Pradesh followed by Rajasthan,
Madhya Pradesh, Gujarat, Uttar Pradesh and Bihar.
5.Permanent pastures and other grazing lands
A total area of 10.24 million hectares is devoted to permanent pastures and other grazing
lands. This amounts to about 3.35 % of the total reporting area of the country. Grazing takes
place mostly in forest and other uncultivated land wherever pasturage is available. About one
third of the reporting area in Himachal Pradesh is under pastures. The proportion varies from 4 to
10% in Madhya Pradesh, Karnataka, Gujarat, Rajasthan, Maharashtra and Orissa. It is less than
4% in the remaining parts of the country.
6.Land under miscellaneous tree crops and groves
Land under miscellaneous tree crops and groves includes all cultivable land which is not
included under net area sown, but is put to some agriculture use. Land under casuarina trees,
thatching grass, bamboo, bushes, other groves for fuel etc. which are classed under this category.
Land under this category declined sharply from 19.8 million hectares in 1950-51 to 3.16 million
hectares in 2012-13. Odisha has the largest area of 7.74 lakh hectares in this category followed
by Uttar Pradesh, Bihar, Karnataka, Andhra Pradesh, Assam and Tamilnadu.
Sanjeev Degree College Commercial Geography
S K V S L Narasimha Raju Page 37
7.Cultivable waste
The "wasteland survey and reclamation committee" defines "cultivable waste" as the land
available for cultivation but not used for cultivation for one reason or the other. This land was
used in the past but has been abandoned for some reason. It is not being used at present due to
such constraints as lack of water, salinity, soil erosion or human neglect. The land under this
category has declined considerably from about 22.9 million hectares in 1950-51 to 12.58 million
hectare in 2012-13. The cultivable waste, if brought under cultivation can be an important factor
in augmenting the country's agriculture production. However, in the interest of long-term
conservation and maintenance of ecobalance, this land should be put under afforestation and not
under crop farming. National Remote Sensing Agency (NRSA) Hyderabad is making a valuable
contribution in mapping the waste land in India through satellite images.
8.Fallow lands
This category includes all that land which was used for cultivation is temporarily out of
cultivation. Fallow land is of two types viz., current fallow land and fallow other than current
fallow. Fallow of one year is called 'current fallow' while that is of 2 to 5 years is classified as
'fallow other than current fallow'. Fallow land is left uncultivated from 1 to 5 years to help soil
recoup its facility in the natural in upon the nature of the soil and the nature of farming. The
distribution of the current fallow on the other hand presents a slightly different picture. There is a
need to reduce the extent and frequency of fallow land in order to increase agricultural
production. This can be done by proper dose of fertilizers, providing irrigation facilities, crop
rotation and combination and several other similar form techniques.
Soils
Definition of soil
Soil is a layer of unconsolidated material at the surface of the earth which has been
derived from rocks and organic matter through agencies of decay and disintegration.
The soil formation is a slow process and soil has evolved over thousands of years.
Various agents of weathering and denudation have acted upon the parent rock material to
produce a thin layer of soil.
Importance of soil
Soil is very important natural resources of India because agricultural production is
basically dependent on the fertility of soil. The rich deep fertile soils of the Ganga plain,

Sanjeev Degree College Commercial Geography
S K V S L Narasimha Raju Page 38
especially its delta, and coastal plain of Kerala support high density of population through
agricultural prosperity. On the other hand, the shallow and soils of Telangana and Rajasthan
support only small population because the soils do not provide a base for prosperous agriculture.
Classifications of soils
On the basis of genesis, colour, composition and location, the soils of India have been
classified into
1.Alluvial soils
2.Black soils
3.Red and yellow soils
4.Laterite soils
5.Arid soils
6.Saline soils
7.Peaty soils
8.Forest soils
1.Alluvial soils
Alluvial soils are formed by the depositional work of rivers in the river valley,
floodPlains and deltas. The Sutlej-Ganga plain has the largest of Alluvial soils. These are very
fertile soils and this plain is considered to be one of the world's most fertile areas. The deltas of
the Mahanandi, the Godavari, Krishna and Cauvery also abound in alluvial soils. About 40%
area is covered by alluvial soils.
The physical properties of alluvial soils are determined by climate and vegetation. These
soils vary in nature from Sandy loam to clay. They are generally rich in potash but poor in
Phosphorus. In the upper and Middle Ganga plain, two different types of alluvial soils have
developed, viz. Khadar and Bhangar. Khadar is the new alluvium and is deposited by floods
annually, which enriches the soil by depositing fine silts. Bhangar represents a system of older
alluvium, deposited away from the flood plains.
Alluvial soils are very useful for growing a variety of crops especially cereals and pulses.
Besides some commercial crops like cotton, sugarcane and jute are also grown. As such these
soils are most intensively cultivated.
Sanjeev Degree College Commercial Geography
S K V S L Narasimha Raju Page 39
2.Black soils
These soils are also known as Regur soils or cotton soils as cotton is abundantly grown in
these soils. The black soils have been formed by the solidification of lava spread over large
areas during volcanic activities in Deccan plateau over thousands of years ago. At present, these
soils are found over an area of 5 lakh square kilometres including parts of Maharashtra. Western
Madhya Pradesh, Karnataka, Gujarat, Telangana, Andhra Pradesh and Tamilnadu. In the lower
reaches of the Godavari and Krishna and the northern part of the Deccan Plateau, the black soil is
quite deep. Black soils cover about 30% of the total area of the country.
These are very fertile soils but they have lower fertility on the uplands as compared to the
lowlands. The black soils are very rich in mineral contents because they have seen formed due to
volcanic activities. Their chemical composition consists of lime, iron, magnesia and alumina.
They also contain Potash. But they lack in Phosphorus, nitrogen and organic matter.
3.Red And yellow soils
These soils are reddish in colour due to wide diffusion of iron. Red soils are mainly found
in tropical and comparatively dry areas of the Peninsula India. These soils cover almost the
whole of Tamilnadu, Karnataka, Telangana, Andhra Pradesh, South Eastern Maharashtra,
Eastern parts of Madhya Pradesh. Such soils lack in nitro genius, organic and phosphoric acid
contents and are less fertile.
This is soil looks yellow when it occurs in hydrated form. The find grained red and
yellow soils are normally fertile, soils found in dry upland areas are poor in fertility.
4.Laterite soil
Laterite soils are formed as a result of leaching away of siliceous matter of the rocks due
to dry and wet conditions which take place in typical monsoon climate. Generally speaking, the
soils of higher attitudes are more acidic than those of lower attitudes. With rain lime and silica
are leached away, and soils rich in iron oxide and aluminium components are left behind. These
soils are poor in organic matter, nitrogen, phosphate and calcium, while iron oxide and potash
are in excess. Laterite soils are not much suitable for agriculture but grass, bushes and shrubs
grow abundantly in them. It becomes hard like a brick when it dries up.Thus, it is not useful for
agriculture but provides very good building material. Red laterite soils in Tamilnadu, Telangana,
Andhra Pradesh and Kerala are more suitable for tree crops like cashew nut.

Sanjeev Degree College Commercial Geography
S K V S L Narasimha Raju Page 40
5.Arid soils
As the name indicates, arid soils are found in the arid areas of Rajasthan and adjoining
areas of Southwest Punjab and Southwest Haryana. The colour of these soils range from red to
brown. Most of the arid soils are sandy and saline. In some areas, the salt content is so high that
is obtained by evaporating the saline water. Accelerated evaporation in hot and dry climate leads
to lack of moisture and humus. Although phosphate content is normal, there is a deficiency of
nitrogen. Lower horizons of the soil are occupied by 'kankar' layers because of the increasing
calcium content downwards. The 'Kankar' layer formation in the bottom horizons restricts the
infiltration of water, and as much when irrigation is made available, the soil moisture is readily
available for sustainable plant growth.
6.Saline soils
Saline soils contain a higher proportion of sodium, potassium and magnesium. As such
these soils are infertile and have scarce vegetation. They contain more salt due to dry climate and
poor drainage. They are mostly sandy and loamy and lack in nitrogen and calcium. Saline soils
are mainly found in western Gujarat, deltas of Eastern Coast and in the Sundarban areas. In the
Rann of Kuch, the Southwest monsoon brings salt particles and deposits there as a crust. Sea
water intrusions in the deltas promote the occurrence of saline soils. Excessive irrigation with
dry climatic conditions promotes capillary action, which results in the deposition of salt on the
top layer of the soil. In such areas, especially in Punjab and Haryana, adequate dose of gypsum
can solve the problem of salinity in the soil.
7. Peaty soils
Peaty soils are found in areas of heavy rainfall and humidity and occur largely in Bihar,
Uttarakhand and coastal areas West Bengal, Orissa and Tamil Nadu. They have good growth of
vegetarian and are rich in humus and organic content. Organic matter may account for as much
as 40 to 50% in these soils. Peaty soils are normally heavy and brown in colour but at several
places they are alkaline also.
8. Forest soils
These soils are found in forest areas where sufficient rainfall occurs and there is thick
forest growth. Most of the forest soils occur in the Himalayan region where the structure and
texture of the soils varies depending on the mountain environment. They are loamy and silty on
valley sides and coarse grained in the upper slopes. In the snow bound areas of the Himalayas,
they experience denudation, and are acidic with low humus content. The soils found in the lower
valleys are fertile.

Sanjeev Degree College Commercial Geography
S K V S L Narasimha Raju Page 41
Soil degradation
Definition
Soil degradation is defined as the decline in soil fertility, when the nutritional status
declines and depth of the soil goes down due to erosion and misuse. Soil degradation is the main
factor leading to the depleting soil resource base in India.
Soil Erosion
Soil erosion is the removal of soil by the forces of nature, particularly wind and water,
more rapidly than the various soil forming processes can replace it. Water and wind are the most
important factors which are simultaneously engaged in soil formation and soil erosion. Under
normal circumstances, there is a balance between solid forming and soil erosion processes. This
means that the rate of deposition of particles to soil layer is almost the same as the rate of erosion
and the soil remains intact. Soil erosion mainly takes place due to man's ill judged activities such
as deforestation, overgrazing and faulty methods of cultivation. With the increase in human
population, demand for land is increasing at a rapid pace and forest and other natural vegetation
is removed, exposing the soil to the forces of erosion.
Agents of soil erosion
Wind and water are the two main agents of soil erosion because of their ability to remove
and transport soil. Erosion by water is more significant in areas of heavy rainfall and step slope.
Soil erosion by water takes place in the form of sheet and fully erosion. Sheet erosion takes place
on level lands after a heavy shower and the soil removal is not easily noticeable. But it is harmful
since it removes the finer and more fertile topsoil. Gully erosion is common in steep slopes.
Gullies depend with rainfall, cut the agricultural land into small fragments and make them unfit
for cultivation.
Impact of soil erosion
It is estimated that over 80,000 hectares of cultivated land of India have already been lost
and a much larger area is rendered lesser productivity by soil erosion every year. Soil erosion is a
national problem for the Indian agriculture and its bad effects are seen in other spheres also.
Eroded materials are carried down to the rivers and they lower down their carrying capacity, and
cause frequent floods and damage to agricultural lands.

Sanjeev Degree College Commercial Geography
S K V S L Narasimha Raju Page 42
Causes of soil pollution
Large parts of soil are blown away by strong winds in dry sandy areas of Rajasthan and
adjoining areas. As a result of this, the top layer of the soil is eroded. This is an example of sheet
erosion. Floods caused extensive damage to our soils.
Another major cause of soil erosion is deforestation. Plants keep soils bound in locks of
roots and save soil from erosion. Leaves and twigs shed by the plants get mixed in soil and add
humus to the soil. Large scale soil erosion has been noticed in areas where forests have been
destroyed. Large structures of fertile land are affected by soil erosion due to over irrigation. Use
of chemical and fertilizers is also harmful to the soils. It is estimated that about half of the total
land of India is under some degree of degradation.
Soil conservation
Soil erosion has become a very serious and challenging problem in India. Under such
circumstances, soil conservation becomes very important. Following methods can be adopted to
check soil erosion and to conserve this valuable natural resource.
1. Afforestation
The best way to check soil erosion is afforestation. New trees are to be planted in areas of
soil erosion and old ones are to be protected. Deforestation is to be checked at all costs. Rows of
trees act as barriers to the passage of wind and reduce the velocity of the winds which erode the
soil cover.
2. Erecting dams and barriers
Many rivers cause heavy erosion to soil in rainy season due to swift flow of the water
current. This can be checked by erecting dams and barriers across the rivers.
3. Check on over grazing
Another effective method to check soil erosion is to avoid overgrazing. Seperate grazing
grounds should be earmarked and fodder crops should be grown. Animals move freely in the
fields for grazing and spoil the soil with their hoofs which leads to soil erosion.

Sanjeev Degree College Commercial Geography
S K V S L Narasimha Raju Page 43
4. Changes in agriculture practices.
We can check soil erosion to a great extent by bringing about some basic changes in our
agriculture practices. This includes crop rotation, terraced cultivation etc. Contour ploughing is a
very effective method of checking soil erosion. By contour ploughing method, the surface runoff
of rain and irrigation water is checked and soil is prevented from being washed away. Only those
crops should be grown for which the soil is best suited.
Gully erosion must be checked at all costs. Finger gullies and bigger gullies can be
reduced by terracing and constructing check dams. Integrated land use planning is the best
technique for soil conservation. Co-operation of the farmers is very essential for the success of
this plan.
Major crops
With varied types of relief, soils, climate and with plenty of sunshine and long growing
season, India is capable of growing almost each and every crop. Crops requiring tropical, sub-
tropical and temperate climate can easily be grown in one or the other part of India. Indian crops
can be divided into following categories.
1. Food crops
Rice, Wheat, Maize, Millets - Jowar, Ragi, Pulses - Gram,Tur.
2. Cash crops
Cotton, Jute, Tobacco, Oil seeds, Groundnut, Castorseed, Rapeseed, Mustard etc.
3. Platinum crops
Tea, Coffee, Spices, Cardamom, Chillies, Ginger, Turmeric, Coconut, Arecanut and
Rubber.
4. Horticulture
Fruits-Apple, Peach, Pear, Aprecot, Almond, Strawberry, Walnut, Mango, Banana, Citrus
fruits, Vegetables.

Sanjeev Degree College Commercial Geography
S K V S L Narasimha Raju Page 44
Food crops
Agriculture forms the backbone of Indian economy and food crops are the backbone of
the Indian agriculture. Food crops cover about three fourth of total cropped area in the country
and contribute to about half of the total value of agricultural production. No part of the country is
without food crops. They are grown in all parts of the country.
Rice
Rice is the most important food crop of India covering about one fourth of the area and
providing food to about half of the Indian population. This is the staple food of the people living
in the eastern and the parts of the country, particularly in the areas having over 150 cm rainfall.
There are about 10,000 varieties of rice in the world out of which about 4,000 are grown in India.
Conditions of growth
Rice is a tropical plant and requires high heat and high humidity for its successful growth.
The temperature should be fairly high at mean monthly of 24℃. It should 20°-22 °C at the time
of sowing, 23°-25 °C during growth and 25°-30 °C at the harvesting time. The fields must be
flooded under 10-12 cm deep water at the time of sowing and during early stages of growth.
Therefore, the fields must be level and have low mud walls to retain water. Rice grown in well
watered lowland plains areas is called wet or lowland rice. In hilly areas, the hill slopes are cut
into terraces for the cultivation of rice. Such cultivation is called terraced cultivation.
Rice can be grown on a variety of soils including silts, loams and gravels and can tolerate
acidic as well as alkaline soils. Such soil requirements make it dominantly a crop of river valleys,
floodplains, deltas and coastal plains and a dominant crop there.
Rice culture is not much suited to mechanisation and is called 'hoe-culture'. Most of the
work in preparing the seed bed, in broadcasting seeds, or in plantation of plants from nurseries to
the fields, harvesting is made by human hand. Thus it is a labour intensive cultivation and
requires a large supply of cheap labour for its successful cultivation.
Methods of rice cultivation
Following methods of the rice cultivation practised in India
1. Broadcasting method
Seeds are sown on broadcast by hand. This method is practised in those areas which are
comparatively dry and less fertile and do not have much labour to work in the fields. It is the
easiest method requiring minimum input but its yields are also minimum.

Sanjeev Degree College Commercial Geography
S K V S L Narasimha Raju Page 45
2. Drilling method
Ploughing of land and sowing of seeds is done by two persons. This method is mostly
confined to peninsular India.
3. Transplantation method
This method is practised in areas of fertile soil, abundant rainfall and plentiful supply of
labour. To begin with, seeds are sown in nursery and seedlings are prepared. After 4-5 weeks the
seedlings are uprooted and planted in the field which has already been prepared for the purpose.
The entire process is done by hand. It is, therefore, a very difficult method and requires heavy
inputs. But at the same time it gives some of the highest yields.
4. Japanese method
This method includes the use of high yielding varieties of seeds, sowing the seeds in a
raised nursery bed and transplanting the seedlings in rows so as to make weeding and fertilizing
easy. It also involves the use of a heavy dose of fertilizers so that very high yields are obtained.
The Japanese method of rice cultivation has been successfully adopted in the main rice
producing regions of India.
Rice cropping seasons
Rice is grown almost throughout the year in hot and humid regions of eastern and
southern parts of India were two to three crops in a year are not uncommon. But in the northern
and hilly parts of the country, the winters are too cold for rice cultivation and only one crop is
grown in those areas.
Production
India is the second largest producer and consumer of rice in the world after China and
accounts for 17.95% of the world’s total rice production.
In a span of about six and a half decades from 1950-51 to 2014-15, the area, production
and yield have increased. It is interesting to note that the rate of increase in production is much
higher than the rate of increase in area under rice cultivation. This is due to the increase in yields
as a result of better inputs and farm practices.

Sanjeev Degree College Commercial Geography
S K V S L Narasimha Raju Page 46
In spite of the spectacular progress, our yield of 2,390 kg per hectare (2014-15) is much
lower compared to 6,548 kg in China, 7,537 kg in USA, 6,511 kg in Japan and 6878 kg in
Republic of Korea. This means that there is still vast scope for increasing production.
Distribution
Rice is grown in varying degrees in almost all parts of the country excepting higher parts
of the Himalayan ranges 2,500 metres in altitude, due to various geographical constraints. The
premier rice producing areas include the lower and the middle Ganga plains, the east and the
west coastal Plains, the Brahmaputra valley and parts of Peninsular plateau.
It is clear that about half of the rice production in India is contributed by four states
namely West Bengal, Uttar Pradesh, Andhra Pradesh and Punjab.
Wheat
Next to rice, wheat is the second most important food grain of India and is the staple food
of millions of Indians, particularly in the Northern and north western parts of the country. It is
rich in proteins, vitamins and carbohydrates and provides balanced food. India is the fourth
largest producer of wheat in the world after Russia, USA and China and accounts for 8.7 % of
the world's total production of wheat.
Conditions of growth
Conditions of growth for wheat are more flexible than those of rice. Wheat is primarily a
crop of mid latitude grasslands and requires a cool climate with moderate rainfall. The
temperature should be low at the time of sowing but as the harvesting time approaches higher
temperatures are required. But the sudden rise in temperature at the time of maturity is harmful.
Wheat thrives well in receiving an annual rainfall of about 75 cm. Annual rainfall of 100
cm is the highest limit of wheat cultivation. In fact, wheat can be grown in areas with as little as
20-25 cm annual rainfall provided proper irrigation facilities are available.
Although wheat can be grown in a variety of soils, well drained fertile, loams are the best
suited soils for wheat cultivation. It also grows well in the black soil of the Deccan Plateau.
Wheat cultivation is the extensive type of farming which is highly mechanised and requires
comparatively less labour. It is mainly grown in the flat alluvial plains of north India.

Sanjeev Degree College Commercial Geography
S K V S L Narasimha Raju Page 47
Production
Wheat is grown on 13% of the cropped area of India. All the three aspects of the crop i.e.
production, area and yield have recorded a rapid growth particularly after the introduction of the
Green Revolution Strategy in 1967. The production had more than doubled from 109.97 lakh
tonnes in 1960-61 to 238.32 lakh tonnes in 1970-71. During the same period the area under
wheat had increased by over 41% and yield had increased by 53.6%. The development of new
varieties of seeds has brought about a real revolution in wheat production. Our yield of 2,872 kg
per hectare (2014-15) is still very low as compared to that of some other wheat producing
countries like Russia, USA, Australia and Canada. It is estimated that yield can be raised up to
4,000 kg/hectare in irrigated areas and up to 2,000 kg/hectare in un irrigated areas by using
appropriate location specific technology including better quality seeds, proper fertilizers and
control of weeds, pests and diseases. This can be done by timely harvest of the kharif crops and
by reducing the extent of fallow land. West Bengal has already started growing wheat in
sufficient quantity. By adopting these and some other positive measures, we can hope to increase
the production of wheat to a great extent.
Distribution
Wheat production is mainly confined to North West parts of the country. Uttar Pradesh,
Punjab, Madhya Pradesh and Haryana are the four prominent wheat producing states. These
States account for about 70% of the wheat area and produce about three fourth of the total wheat
production in India. In fact. Punjab, Haryana and the contiguous western parts of UP have earned
the distinction of being called the 'Granary of India'. The other major wheat producing states are
Rajasthan, Bihar, Gujarat and Maharashtra.
Maize
Maize is an inferior grain which is used both as food and fodder. Its grain provides food
and is used for obtaining starch and glucose. It stalk is fed to cattle.
Conditions of growth
Maize can be grown under varied climatic and soil conditions. Maize is mainly a rain fed
crop which is sown just before the onset of monsoon and is harvested after retreat of the
monsoon. It requires 50-100 cm of rainfall and it cannot be grown in areas more than 100 cm
rainfall. Long dry spell during the rainy season is harmful for maize. Sunshine after shower is
very useful for maize. Cool and dry weather helps in growing of the ripening of the grain. Frost
is injurious to maize and this crop is grown only in those areas where there are about four and a
half frost free months in a year. Fertile well drained alluvial or red loams free from coarse

Sanjeev Degree College Commercial Geography
S K V S L Narasimha Raju Page 48
materials are rich in nitrogen are the best soils for its successful growth. well drained plains are
best suited for its cultivation. The cultivation of maize in India is character by inter-culture i.e.
along with and in pulses, vegetables and oil seeds.
Production
Maize is an important cereal of India and is grown over 4% of the net area sown of the
country. There have been large variations in the production of maize in India since
Independence. It was only 1.7 million tonnes in 1950-51 which rose to 23.67 million tonnes in
2014-15. Andhra Pradesh including Telangana(17.89%), Karnataka (16.53%) and Maharashtra
(9.31%) are the main producers.
Bajra
Bajra serves as food for poor people and fodder for animals. It requires 25℃ to 30℃
temperature and 40 to 50 cm of annual rainfall for successful growth. It is generally grown on
poor light sandy soil. India produces 9.05 million tonnes of bajra in 2014-15 from 7.1 to million
hectares. The main producers of this crop are Rajasthan (49.64%), Uttar Pradesh (19.97%),
Gujarat (8.09%) and Haryana (7.4%).
Jowar
Jowar is both a kharif as well as a rabi crop in India. It requires temperature varying from
25℃ to 30℃ and annual rainfall of 45 cm for its successful growth. It can be grown in a variety
of soils including red, yellow, loamy and alluvial soils but black clayey loams of the peninsular
plateau are the best for its cultivation.
Jowar provides 10% of India's food. About 75% of India's Jowar is grown in the plateau
region of South India. India produced 5.65 million tonnes of Jowar from 5.3 million hectares of
land in 2014-15. Maharashtra is the largest producer accounting over 32% of India’s jowar.
Pulses
Pulses are the major source of protein in the diet of predominantly vegetarian population
of India. About 90% of the area under pulses is rain fed. These are grown in kharif as well as rabi
seasons. Arhar, moong, urad etc. are the kharif crops while gram, masur and urad are the rani
crops. The total area devoted to pulses was 23.10 million hectares and the total production of
pulses was 17.19 million tonnes. Madhya Pradesh was the largest producer attributing 27.36% of
the total production. Rajasthan (11.39%), Maharashtra (10.10%), Karnataka (8.66%), Uttar
Pradesh (8.42%), Andhra Pradesh including Telangana (6.72%) are other major producers.

Sanjeev Degree College Commercial Geography
S K V S L Narasimha Raju Page 49
Gram
Gram is the principal pulse crop in the country. India produced 7.17 million tonnes of
gram from 8.19 million hectares of land. The major gram producer is Madhya Pradesh accounts
for about 41.34 percent of total production. Rajasthan (12.69%), Maharashtra (11.56%),
Karnataka(10.73%), Andhra Pradesh including Telangana (6.43%) and Uttar Pradesh(5.31%) are
the other producers.
Oil seeds
Oilseeds constitute a very important group of commercial crops in India. The oils
extracted from oilseeds form an important item for our diet and are used as raw materials for
manufacturing a large number of items. The total production of oilseeds such as groundnut,
rapeseed, sunflower, and soybean and castor seed was 26.67 million tonnes in 2014-15. Madhya
Pradesh (28.96%), Rajasthan (19.94%), Gujarat (14.93%) and Maharashtra (10.62%) are main
producers. India does not produce oilseeds in sufficient quantities and has to import oil seeds in
large quantities to meet requirements.
Groundnut
India is the second largest producer of groundnut in the world and producers of about
17% of the world's groundnut. The total production of groundnut in 2014-15 was 65.6 million
tonnes. Gujarat(33.9%) is the largest producer. This is followed by Tamil Nadu(13.79%),
Andhra Pradesh (12.09%). Production of groundnut always falls short of consumption and
deficiency is meant by imports.
Rapeseed and mustard
Rapeseed and mustard comprise several oilseeds such as rai, saraina, toria and taramira.
The total production of rapeseed and mustard in 2014-15 was 6.31 million tonnes. Rajasthan
(45.89%), Madhya Pradesh (11.66%) and Haryana (11.08%) are three top producers.
Cotton
It is the tropical plant which grows well in areas having temperature ranging from 20℃ to
30℃ and rainfall varying from 65 to 85 cm. The 'black cotton soil' of the Deccan Plateau and
alluvial soil of the northern plain are best suited for cotton. A lot of human labour is required at
the time of picking.

Sanjeev Degree College Commercial Geography
S K V S L Narasimha Raju Page 50
Types of cotton
1. Long staple cotton
It has the longest fibre whose length varies from 24 to 27 mm. The fibre is long, fine and
shining. It is used for making fine and superior quality cloth. Obviously, it fetches the best price.
About half of the total cotton produced in India is long staple. It is largely grown in Punjab,
Haryana, Maharashtra, Tamil Nadu, Madhya Pradesh, Gujarat and Andhra Pradesh.
2. Medium Staple cotton
The length of its fibre is between 20 mm and 24 mm. About 44% of the total cotton
production in India is of medium staple. Rajasthan, Punjab, Tamil Nadu, Madhya Pradesh, Uttar
Pradesh, Karnataka and Maharashtra its main producers.
3. Short staple cotton
This is inferior cotton with less than 20 mm long. It is used for manufacturing inferior
cloth and features less price. About 6% of the total production is of short staple cotton. Andhra
Pradesh, Rajasthan, Haryana and Punjab are its main producers.
India is the fourth largest producer of cotton in World after China, USA and Pakistan and
produces about 8.3 % of the world's cotton. Haryana and Punjab are main producers in North
Western part of the country. In India, Madhya Pradesh is a main producer of cotton.
India exports inferior quality cotton and imports superior quality cotton for producing
better quality clothes.
Jute
Jute is the second important fibre crop after cotton. This crop provides cheap and strong
fibre which is used as a raw material by Jute industry.
Jute requires hot and humid climate with temperature between 24℃ and 35℃ and rainfall
over 150cms. The relative humidity should be nearly 90%. Well drained alluvial loamy soils,
which are frequently renewed by floods are best suited to the cultivation of jute.
India suffered a great setback in the production of jute as a result of the partition of the
country in 1947. Because about 75% of the jute producing areas went to Bangladesh.
Fortunately, most of the Jute mills remained in India. Many efforts were made to increase

Sanjeev Degree College Commercial Geography
S K V S L Narasimha Raju Page 51
production and area of jute, immediately after partition to feed our starving jute mills in the wake
of short supply of raw jute.
Over three fourth of jute is produced in West Bengal. The remaining jute is produced in
Bihar(13.10%), Assam(6.94%), Orissa(0.59%) and Andhra Pradesh(0.45%).
Sugar cane
India is claimed to be the homeland of sugarcane. It is the main source of sugar holds a
prominent position as a cash crop in India.
Sugarcane is the long duration crop maturing in 10 to 12 months. It requires hot and
humid climate with temperature ranging from 20℃ to 30℃ and rainfall ranging from 100 to
150cms. Dry weather is necessary at the harvesting season. It is a fertilizer intensive crop and
exhausts quickly. So, heavy dose of fertilizers is required.
India is the second largest sugarcane producing country of the world after Brazil. This
crop is grown both in tropical and sub-tropical regions of the country. The sugarcane area
extends right from Kanya kumari in the south to Punjab in the north. The main areas of tropical
sugarcane are located south of 15°N latitude and include Tamil Nadu, Karnataka, Andhra
Pradesh and Maharashtra. The subtropical regions growing sugarcane Uttar Pradesh, Bihar,
Haryana and Punjab.
Although climate conditions are more suitable for sugarcane in South India, it is not
common crop there due to following reasons.
(i)Coastal Plains of Kerala are climatically more suitable for sugarcane cultivation but land is
used for paddy and horticulture crops.
(ii)In the Godavari Krishna delta, irrigation and fertile alluvial soils are favourable to sugarcane,
cultivation, but frequent cyclones damage the crop.
(iii)Sugarcane is an irrigated crop, which is easier to grow and cheaper in northern plains than in
Peninsular India.
The total production of sugarcane was 359.33 million tonnes from 5.14 million hectares.
The main producing states are Uttar Pradesh (38.54%), Maharashtra (22.78%), Karnataka
(11.66%), Tamil Nadu (6.81%), Andhra Pradesh (3.66%).

Sanjeev Degree College Commercial Geography
S K V S L Narasimha Raju Page 52
Tea
Tea requires about 25℃ to 30℃ temperature and a well distributed rainfall of 200 to 250
cm. It grows well in the well drained deep friable loam or forest land rich in organic matter.
Stagnant water is harmful to the roots of the tea Bush and as such it is grown on Hill slopes it
requires plenty of cheap human labour at the time of women and children.
India is the world's largest producer of tea contributing about 28% of tea production of
the world Total production in 2011-12 was 1 million tonnes Assam 53% and West Bengal 22
are two largest producers about 16 percent India's tea is grown in Tamil Nadu mainly in Nilgiri
and anamalai Hills Kerala producers 8 percent of India's tea.
Coffee
Coffee is the second important beverage crop of India after tea. There are three varieties
of coffee i.e. arabica, robusta and liberica. Most of the coffee grown in India is of arabica variety.
Coffee plant requires hot and humid climate with 15° to 30℃ temperature and 150 to 200 cm
rainfall. Hill slopes 800-1600 metres above sea level, with rich well drained forests loams
provide ideal conditions for coffee growth. Coffee in India is highly localised in Karnataka,
Kerala and Tamil Nadu. Karnataka is the largest producer of coffee in India. This state accounts
part 58% of coffee area and 70% of coffee production of India. Kerala accounts for over 22% of
the coffee production in India.
Tobacco
It is a plant of tropical and sub tropical climates and can with stand a wide range of
temperatures varying from 16℃ to 35℃. It normally requires 100 cm of annual rainfall but it can
also be successfully grown in areas of 50 cm annually rainfall provided the rainfall is fairly
distributed.
Soil is more important than climate. Further it can be grown from low lying flat plains up
to a height of 1,800 metres. The production of tobacco increased from 28 lakh tonnes in 1950-51
to 73.5 lakh tonnes in 2013-14, Andhra Pradesh (37.55%), Gujarat (32.65%), Karnataka
(12.24%) and Uttar Pradesh (7.78%) are the chief producers.
Rubber
Rubber tree is a quick growing tall tree acquiring 20-30 metre height. It begins to yield
latex in 5-7 years after planting. It requires hot and humid climate with temperature of 25℃ to
36℃ and annual rainfall of over 200 cm. Daily rainfall followed by strong sun is very useful. Hill

Sanjeev Degree College Commercial Geography
S K V S L Narasimha Raju Page 53
slopes at 300 to 450 metres above sea level provide best conditions for its growth. Total
production in 2011-12 was 8 lakh tons. Kerala is the largest producer and accounts for about
92% of rubber production in India. Tamil Nadu is the second largest but produces only 4% of
Indian rubber.
Importance of agriculture in India
Agriculture is the most important economic activity. It forms the backbone of Indian
economy and has great cultural significance particularly among the rural masses. Following few
points highlight the importance of agriculture to the Indian masses.
1. Dependence of population
Over two thirds of Indian population lives in rural areas and is intimately associated with
agriculture, whether directly or indirectly. It is the principal source of livelihood for more than
55% of the population of the country. In addition, a large section of population gets indirect
employment through other activities associated with agriculture.
2. Contribution to gross domestic product (GDP)
For a pretty long term, agriculture has been the largest contributor of Gross National
Product. But the relative importance of agriculture as a major contributor of GDP has decreased
due to increase in secondary and tertiary activities like manufacturing, trade, transport commerce
and services. Currently, it provides about 14% of GDP.
4. Basic needs of man
Food, clothing and shelter are the basic needs of man and all the three necessities are met
by agricultural products to large extent. The food requirements of man are fulfilled by food
grains produced by farmers working in agricultural fields. Rice, Wheat, maize, Bajra etc are the
major food grains consumed by man. In addition, there are large varieties of fruits and vegetables
which serve as food items for man. Animals and birds which are rated as an important segment
of farming activity, provide milk, meat, eggs etc. which are important items of food for a number
of people. Cotton provides fibre for clothes,. Similarly, a large number of agricultural products
are used for building purposes, especially in rural areas.
4. Base for industries
Some of the industries depend on agricultural products and are known as agro based
industries. These Industries use agricultural products as their raw material. Cotton textile, jute

Sanjeev Degree College Commercial Geography
S K V S L Narasimha Raju Page 54
textile, sugar and vegetable oil are some of the examples of agro based industries. Concentration
of cotton textile industry in Maharashtra and Gujarat is due to cotton cultivation in these states
and that of jute industry in West Bengal is primarily due to availability of jute in the Ganga delta
region. Similarly, sugar industry has grown in sugarcane growing areas of North and South
India.
5. Contribution in foreign trade.
India is a net exporter of some of the agricultural products. The main items of export are
rice, spices, raw cotton, oil cakes, coffee, tea and mate, tobacco, meat and meat preparations,
fruit and vegetables etc. In the year 2014-15 India exported agricultural and allied products
worth 2,40,642 crore which was about 12.7% of the total Exports.
Problems of Indian agriculture
In spite of the phenomenal progress particularly since 1960s, Indian agriculture still
suffers from several serious problems. Although most of the problems are region specific, yet
some problems are common to all regions of the country and are briefly discuss below.
1. Dependence on erratic monsoon
Rainfall and temperature are the main environmental factors with reference to Indian
agriculture. Rainfall by Southwest monsoons is very erratic, both in time and space. Most parts
of India have sufficiently high temperature throughout the year. Under such circumstances, crops
can be grown all the year around if sufficient water is made available to crops on a regular basis.
Unfortunately, most parts of India receive in 3- 4 months of the rainy season and the rest of the
year is practically dry. More over there are wide seasonal and regional variations in the amount
of rainfall. Large parts of the country do not receive sufficient amount of rainfall and sub humid,
and arid climate. These areas suffer from frequent droughts. Several areas are flooded in rainy
season. Even dry lands of Maharashtra, Gujarat and Rajasthan have experienced flash floods in
the recent past. Droughts and floods continue to be twin menace in Indian agriculture.
2. Low productivity
Yields of almost all the crops in India are very low as compared to world yields. Yields
per hectare of major crops like rice, wheat, cotton and oilseed in India is much lower than USA,
Russia and Japan. High pressure of population results in low labour productivity. Rain fed areas
in dry lands mainly grow coarse crops and give very low yields.

Sanjeev Degree College Commercial Geography
S K V S L Narasimha Raju Page 55
3. Constraints of financial resources and indebtedness
Modern agriculture has become highly capital intensive and small and marginal farmers
find it difficult to manage financial resources to invest in agriculture. Many farmers take loan
from various Institutions and money lenders. Crop failures and low return from agriculture have
forced them to fall in the trap of indebtedness. A big package of rupees 60,000 crore loan waiver
for small and marginal farmers announced by the central government in 2008 temporally
improved the situation to some extent. However, it has not helped much in the long run.
4. Lack of Land Reforms
Indian peasantry had been exploited for a long time as there had been unusual distribution
of land. Among the three revenue systems operational during British period i.e. Mahalwari,
Ryotwari and Zamindari, the last one was most exploitative for the peasants. "Various reforms
have been initiated by the government but the lack of political will has been a great hindrance in
the proper implementation of reforms".
5. Small farm size and fragmentation of land Holdings
As the pressure of population on land increases, the land holdings are further subdivided
and fragmented. Small land holdings become uneconomical which is a major obstacle in the way
of modernization of agriculture. The number of marginal holdings and their percentage to total
number of holdings is constantly increasing. On the other hand, number of large holdings and
their percentage to total number of holdings is constantly decreasing. This is primarily due to
division of large holdings into small holdings.
Many serious efforts have not been made consolidate land holdings. There are some
states where consolidation of holdings has not been carried out even once. Even the states where
it has been carried out once, second consolidation is required as land holdings have fragmented
again in the process of division of land among the owners of next generations.
6. Lack of commercialization
A large part of Indian agriculture is still of subsistence type in which the farmers do not
have enough land and are unable to produce more than their own requirement. Foodgrains
produced by small and marginal farmers are just sufficient to meet the requirements of the family
members of the farmers and there is no surplus for sale. However, agriculture is commercialised
in irrigated areas.

Sanjeev Degree College Commercial Geography
S K V S L Narasimha Raju Page 56
7. Vast under employment
Agriculture is a seasonal process which provides employment only for a brief period and
seasonal unemployment prevails for 4 to 8 months in a year. People get employment mainly at
the time of sowing and harvesting. Under-employment is a more serious problem particularly in
un-irritated areas.
8. Degradation of cultivable land
Faulty agricultural practices and irrigation, particularly in canal irrigated areas, have
given rise to a number of serious problems such as degradation of land and depletion of soil
fertility.
Another serious problem is that of excessive use of insecticides and pesticides which are used to
save the crops from insects and pests. When used beyond a particular limit these chemicals lead
to higher concentration of toxic elements in the soil profile.
Leguminous crops are very useful to restore the fertility of soil when grown as part of
crop rotation. These crops are being replaced, particularly in irrigated areas. Soil erosion by wind
and water has occurred in rain fed areas primary due to unwanted activities of man.
Agricultural development in India
Agriculture is a very important sector of Indian economy. The importance of agricultural
sector in India can be gauged from the fact that about 46% of its land is devoted to crop
cultivation, whereas, in the world corresponding share is only about 12%. However, there is a
tremendous pressure on agricultural land due to rapid increase in population.
Strategy of development
Before independence, Indian agriculture was largely subsistence in nature in which the
farmers could grow crops only for their use and there was hardly any surplus for sale in the
market. This period frequently witnessed severe droughts and famines food shortage was a
common phenomenon. About one third of the irrigated area went to Pakistan as a part of
partition of the country. Immediately after independence the government took several steps to
increase the production of food grains. Following three strategies were adopted to achieve this
goal.
(i)Switching over from cash crops to food crops.

Sanjeev Degree College Commercial Geography
S K V S L Narasimha Raju Page 57
(ii)Intensification of cropping over already cultivated land.
(iii)Increasing cultivated area by bringing cultivable under fallow land under plough, initially,
this strategy helped in increasing food grains production.
However, Indian agriculture could not progress much and experienced stagnation during
late 1950s.
Indian agriculture experiences the beginning of technological changes in 1960s with the
introduction of modern inputs. High-yielding variety (HYV) of seeds, fertilizers, mechanization,
improved irrigation and credit, marketing facilities where some of the silent features of modern
technological changes. The Government of India introduced Intensive area development
programme (IADP) in 1960.Intensive agricultural area programme (IAAP) was also launched. It
aims at diffusing technical knowhow, credit and agricultural technology to set up agricultural
production. New high yielding varieties (HYV) of wheat and rice were brought to India. These
HYV seeds were developed in Mexico and Philippines respectively. Chemical fertilizers and
pesticides were introduced and irrigation facilities were expanded. All these inputs were the main
components of the what is known as Green Revolution.
Achievements of Green Revolution
The main achievements of Green revolution was the spectacular increase in the
production of food grains which increased from 72.35 million tonnes in 1965-66 to 252.68
million tonnes in 2014-15, Cereals and millets recorded the highest growth. However, pulses
could not keep pace with increasing trend. Thus, it is often said that from 1967 onwards the
Green Revolution aims at bringing about Grain Revolution. Even among cereals, wheat
registered more than eight fold increase (594%) in production, from 10.39 million tonnes in
1965-66 to 88.94 million tonnes in 2014-15. Rice, on the other hand, recorded about three and a
half fold increase (194%), from 30.59 million tonnes to 104.80 million tonnes. It is that wheat
has been the main beneficiary of the Green Revolution. As a result of increased home production
import of cereals and cereal preparations declined from 37.47 million tonnes in 1960-61 to 1.2
million tonnes in 2014-15. There was practically no import of food grains during the last few
years. On the contrary, India is in a position to export some of the food grains in the event of a
bumper crop.
Cost of Green Revolution
Although the Green Revolution has helped us in increasing the farm production and
solving the acute food problem in the country, we have achieved this goal at a heavy cost of
intensive use of irrigation, fertilizers, HYV seeds etc. The use of these inputs has created a large

Sanjeev Degree College Commercial Geography
S K V S L Narasimha Raju Page 58
number of problems such as soil Stalinisation, ground water pollution, nutrient imbalances,
emergence of new pests and diseases and environmental degradation.
In the beginning of 1980s the planning commission of India prepared plans to solve the
problems of agriculture in rain fed areas. In 1988 agro-climatic planning was initiated to reduce
regional imbalances. The commission also emphasised the need for diversification of agriculture
and harnessing of resources for development of dairy farming, poultry, horticulture, livestock
rearing and aquaculture.
Policy of liberalisation initiated in 1990s as well as free market economy have influenced
the Indian agriculture to a great extent.
Lack of development of rural infrastructure, withdrawal of subsidies and price support,
and impediments in availing of the rural credits may lead to inter-regional and inter-personal
disputes in rural areas.
Growth of agricultural output and Technology
Indian agriculture has witnessed a tremendous improvement in agricultural production
and associated technology during the last 50 years as is clear from the following points:
1. Production and yield of several crops such as rice, wheat, sugarcane, oil seeds, cotton etc. have
considerably. India ranks first in production of pulses, tea, jute, cattle and milk. It is the second
largest producer of rice, wheat, groundnut, sugarcane and vegetables.
2. Irrigation facilities have expanded to a great extent. This has helped in using modern
agricultural technology like high yielding varieties of seeds, chemical fertilizers, pesticides and
farm machinery. The net irrigated area in the country has increased from 20.85 to 66.10 million
hectares over the period 1950-51 to 2012-13. Over these years, area irrigated more than once in
an agricultural year has increased from 1.71 to 26.47 million hectares.
3. Modern agricultural technology has spread to different parts of the country at a rapid pace.
Consumption of chemical fertilizers increased from mere 292 thousand tonnes in 1960-61 to
25,576 thousand tonnes in 2014-15. The average consumption of chemical fertilizers increased
from 92.33 kg per hectare in 2001-02 to 128 kg/hectare in 2014-15. It is much higher in irrigated
areas of Punjab and Haryana. Along with fertilizers, consumption of pesticides has also
increased since 1960s because highly yielding varieties are highly susceptible to pests and
diseases.

Sanjeev Degree College Commercial Geography
S K V S L Narasimha Raju Page 59
Unit - 3
India - Forestry
Introduction and definition
The word forest is derived from latin 'fores' meaning outside, In general, a forest is
defined as an area set aside for the production of timber and other forest produce or maintained
under woody vegetation for certain benefits which it provides. Ecologically, a forest is a plant
community, predominantly of trees and other woody vegetation, usually with a closed canopy.
Types of forests
Varied geographical conditions in different parts of country have given birth to a large
variedly of forests in India. Depending on common features such as predominant vegetation type
and climatic regions, Indian forests can be divided into the following groups.
1. Tropical evergreen and semi evergreen forests
2. Tropical deciduous forests
3. Tropical thorn forest
4. Mountain forests
5. Littoral and swampy forests
1. Tropical evergreen and semi evergreen forest
These forests are found in hot and humid areas of India. The average annual rainfall in These
areas is above 200 cm and the relative humidity is more than 70%. The average temperature is in
the vicinity of 22℃. These areas are characterized by tall trees whose height varies from 45 to 60
meters and dense forest due to high heat and humidity. Different trees germinate, grow and
wither at different times enabling the entire vegetation look as evergreen forest. The important
trees of these forests are rubber, mahogany, ebony, coconut, canes, Palms , bamboos, lianes,
ferns, iron wood. Due to thick growth, the sun's rays do not reach the surface of the earth and
there is a darkness below the trees. under these circumstances ,the trees rise high competing with
one another for sunlight. These forests are spread over 4.6 million hectares in Andaman nicobar
islands.
The semi evergreen forests are found in the less rainy parts of these regions. Such forests
have a mixture of Evergreen and moist deciduous trees. The under growing climbers provide an
evergreen character to these forest. Main species are white cedar, hollock and kail.

Sanjeev Degree College Commercial Geography
S K V S L Narasimha Raju Page 60
2. Tropical deciduous forests
These are also called the monsoon forest. Tropical deciduous forests are found in areas
receiving 70 to 200 cm of annual rainfall. Monsoon forests grow over the Western Ghats the
North Eastern parts of the Peninsula, middle and lower Ganga valley, and along the foothills of
Himalayas.
Sandalwood, khair, etc. are important trees. Provide useful wood and are economically very
important. The shed their leaves in the beginning of summer season in the face of water
shortage and are called deciduous forests. They are 30 to 45 metres tall and cover about 20% of
our forest area.
On the basis of the availability of water, these forests are further divided into moist and dry
deciduous.
Moist deciduous forests
The moist deciduous forests grow well in areas receiving annual rainfall between 100-
200 cm. These forests dominate the foothills of the himalayas, eastern slopes and the Western
Ghats and Orissa. Taek, Amla, sandalwood, etc. are the main species of these forests.
Dry Deciduous forests
The dry deciduous forests are found in areas receiving rainfall between 70-100 cm.
These forests represent in a transition between wet deciduous forests on one hand and Thorn
forests on the other. The dry deciduous forests are mainly found in rainier areas of the Peninsula
and in the plains of Uttar Pradesh and Bihar. These forests have a parkland landscape with open
structures in which teak and other trees interspread with patches of grass are common. The trees
shed their leaves completely in dry season and the forest appears like a vast grassland with naked
trees all around.
3. Tropical Thorn Forests
These forests are found in areas receiving less than 50 cm of annual rainfall. Such ares
include Rajasthan and adjoining parts of Southwest Punjab, Southwest Haryana and some parts
of Gujarat. This vegetation includes small size Kikar, wild date Palm, neem, palas and some
thorny bushes and scrubs. They have small leaves, thick roots which enable them to face the dry
climatic conditions. Their wood is generally used as fuel.

Sanjeev Degree College Commercial Geography
S K V S L Narasimha Raju Page 61
4. Mountain forests
As their name indicates, these forests are found in the mountain ares of India.
Geographically, they can be divided into northern, i.e., Himalayan forest and Southern, i.e.,
Peninsular forest.
a) Northern Himalayan forests
These forests are found on the southern slopes of the Himalayan ranges. In their altitude, the
Himalayan ranges show a succession of vegetation from the tropical to the Alpine. The following
brief account justifies it.
i) At the foothills, are belts of deciduous types. The wet temperature type a belt of high and
dense forests to the east of 88°E longitudes between 1,000 metre and 2,000 metre attitude. The
cover mostly the hill ranges of north east India and the Himalayan parts of West Bengal, Bihar
and Uttarakhand. Pine forests are well developed between 1,500 metres and 1,750 metres.
Higher parts of this zone are covered with temperature grasslands in the main ranges as well as
in the Shillong (Meghalaya) plateau.
ii) Between 2,000 metres and 3,000 metres elevation, the southern slopes of the Himalayas are
covered with moist temperature forests. Under parts of this zone are covered with pines, silver
firs, and deodar. Deodar provides fine durable wood for construction and railway slippers.
iii) About 3,000 metres elevation, there is transition to Alpine forests and pastures. These fairly
dense forests are found between 3,000 to 4,000 metres altitude. But they get progressively
stunted and gnarled as they approach the snowline. Alpine pastures, with signed conifers below
and snow fields above, occur at an altitude of about 2,250 to 2,750m these covering the higher
slopes almost below the permanent snow cover in ranges like the Por Panjal. There is no
vegetation above the snowline.
b) Vegetation of Peninsular Hills
The vegetation of the Peninsula Hills is characterized by rolling down interspersed with
stand rainforests, shrubs, mosses and ferns. This type vegetation covers the Western Ghats, the
vindhyas and the Nilgiris and the Abu hills. The vegetation is tropical in lower regions and
temperature in higher regions.

Sanjeev Degree College Commercial Geography
S K V S L Narasimha Raju Page 62
c) Littoral swamp forest
India has a large variety of wetland habitats. The total area of wetlands is about 3.9 million
hectares of which 70% is under paddy cultivation.
India's wetlands have been grouped into 8 categories
i) The reservoirs of the Deccan Plateau in the south together with lagoons and other wetlands of
the with the Southern West Coast.
ii) The vast saline expanses of Rajasthan, Gujarat and Gulf of Kutch.
iii) Freshwater lakes and reservoirs from Gujarat eastwards towards Rajasthan and Madhya
Pradesh.
iv) The Delta wetlands and lagoons of India's east coast
v) The freshwater marshes of the Gangetic pictures.
vi) The flood plains of the Brahmaputra the marshes and swamps in the hills of northwest India
and the Himalayan foothills.
vii) The lakes and rivers of the mountain region of Kashmir and Ladakh.
viii) The mangrove forest and other wetlands of the island arcs of the Andaman and Nicobar
Islands. Mangrove forest grow along with salt marshes, tidak creeks and mud flats. That have a
large number of salt tolerant species of plants. These forests provide shelter to veried types of
birds
Mangrove forests of India cover an area of 6,740 sq km about 7% of the world's
mangrove forests. The main areas of mangrove forests are Andaman and Nicobar Islands and
Sunderbans of the Ganga delta in West Bengal. Other areas of significance of the Mahanandi,
the Krishna and Godavari deltas. These forest too, are being encroached upon, and hence, need
conservation.
Forest cover in India
According to official records, about to 22.88 % of total area of the country is treated as
forest area. However, it may be mentioned that forest area is different from the actual forest
cover. The forest area is the area notified and recorded as the forest land irrespective of the

Sanjeev Degree College Commercial Geography
S K V S L Narasimha Raju Page 63
existence of trees, while the actual forest cover is the area occupied by forests with canopy. The
former is based on the records of the State Revenue Department, while the latter based on aerial
photographs and satellite imageries. In 2001, the actual forest cover was only 20.55%. Of the
forest cover, the share of dense and open forests was 12.60% and 7.87% respectively.
There are large scale variations in the forest area as well as in forest cover at the state and
union territory level. Most of the states with less than 10% of the forest area lie in the
northwestern part of the country. The North Eastern states have more than 40% of the land under
forest. Hilly topography and heavy rainfall are good for the forest growth.
It is estimated that there are 9 States where the forest cover is more than one third of the
total area, which is standard requirement for maintaining ecological balance. There are 4 states
percentage is reasonably good, while in remaining states the condition is either unsatisfactory or
critical.
On the basis of the percentage of the actual forest cover the states have been grouped into
four regions.
(a) The region of high concentration.
(b) The region of medium concentration.
(c) The region of low concentration.
(d) The region of very low concentration.
(a) The region of high concentration
This region includes the states where percentage cover of the forest more than 40. All the
Eastern states except Assam come fall in this category. Favourable climate, specially rainfall
and temperature, is responsible for the high concentration of forests. There are, however,
variations in forest cover in the region. In the states of Mizoram, Nagaland and Arunachal
Pradesh and in the Union Territory of Andaman and Nicobar Islands forests occupy more than
80% of the geographical area. Manipur, Meghalaya, Tripura, Sikkim and Dadra and Nagar
Haveli have percentage of forest between 40 and 80.
(b) The region of moderate concentration
It includes the states of Madhya Pradesh, Orissa, Goa, Kerala, Assam and Himachal Pradesh.
Goa has the highest(33.79%) percentage of actual forest, followed by Odisha and Assam. Rest of
the states have less than 30% of their area under forest.

Sanjeev Degree College Commercial Geography
S K V S L Narasimha Raju Page 64
(c) The Region of low concentration
This region is also not contiguous. The states of Maharashtra, Karnataka, Andhra
Pradesh and Tamil Nadu form peninsula sub region while those of Uttar Pradesh and Bihar from
the northern sub region.
(d) The reason of very low concentration
The northwestern part of India falls in this category. The states included are Rajasthan,
Punjab, Haryana, Gujarat, Chandigarh and Delhi. West Bengal in the east also comes under this
region. Physical and human factors have been responsible for a very low concentration of forests
in these States.
Status of forests in Andhra Pradesh
The forest department of undivided Andhra Pradesh, in its state of forest report 2013 had
mentioned that the state had a forest cover of 63,814 sq km which was 23.2 % of the total
geographical area. However, the the forest department of successor Andhra Pradesh stated in
2014 that it had 22% of the total geographical area (36,914.69 sq km) under forest cover.
Forest conservation act, 1980
This is an act to provide conservation of forests. Amendment in made in 1988. It strictly
restricts and regulate the de-reservation of forests or use of forest under non forest purposes
without prior approval of the central government. This act lays down the pre-requisites for
diversion of forest land and non forest purposes. It Lays down guidelines for afforestation in lieu
of forest land diverted to some of the activities like mining, stategic defence purposes, for
creation of critical public utility infrastructure by government departments involving not more
than 5 hectares of forest land.
Compensatory afforestation fund bill 2015
It seeks to establish settings up of a National Compensatory aAforestation Fund and also
a State Compensatory Afforestation Fund. According to the bill, "wherever people's participation
is there, and wherever people's livelihood is connected to forest, they just don't allow illegal
destruction of forest". It is way to make for forest land that was diverted to non forest purposes.
Compensatory Afforestation Fund Management Authority was constituted by a direction of the
Supreme Court dated October 30, 2002, asking the government to create a fund where all the
payments received towards compensatory afforestation, additional compensatory afforestation,
panel compensatory afforestation and net present value of the diverted forest land will be
Sanjeev Degree College Commercial Geography
S K V S L Narasimha Raju Page 65
deposited. The net present value is the amount that someone has to pay for directing forest land
to non forest purposes. The amount will be determined by an expect committee appointed by the
centre. The bill further states that all money received from "additional compensatory
afforestation" and "catchment area treatment plan" may be used for site specific scheme
submitted by the state.
Following are some of the difficulties with regard to the bill:
(i) The Comptroller and Auditor General(CAG) found tbat only 61% of the fund released by the
ad-hoc CAMPA has been utilised.
(ii) There is a lack of efforts by the government in promoting compensatory afforestation and the
rampant unauthorised useage of land for mining purposes instead of afforestation.
(iii) The ministry of environment and forests was unable to monitor and unauthorised activities
and there were hardly any penalties imposed by it.
(iv) Parliamentary standing committee, in its 277th report, had stated that there might be a
situation where not enough land may be available for afforestation purposes. To address this
contingency, it was recommended a specific provision in the "for increasing densification and
revitalization of available forest closest to areas where deforestation is considered unavoidable
on account of critically important national projects".
CAMPA largestly comprises members of forest departments and there is not adequate
representation of the tribal people, environmentalists, subject experts and academics.
(v) The bill does not consider the provisions of the Scheduled Tribes and other Traditional forest
Dwellers (Recognition of Forest Rights) Act, 2006.
Key issues and analysis
The bill establishes the funds for compensatory afforestation and forest conservation.
However, there are several factors which affect compensatory afforestation and forest
conservation. These factors are mentioned below:
A 2013 CAG report noted that state forest departments lack the planning and
implementation capacity to carry out compensatory afforestation and forest conservation. With
share of finds transferred to states increasing from 10 % to 90%, effective utilisation of these
funds will depend on capacity state forest departments.
Sanjeev Degree College Commercial Geography
S K V S L Narasimha Raju Page 66
Procuring land for compensatory afforestation is difficult as land is a limited resource and
is required for multiple purposes such as agriculture, industry etc
A high level committee on environment laws observed that quality of forest cover has
declined between 1951 and 2014 with poor quality of compensatory afforestation plantations
being one of the reasons behind the decline.
Forest Rights Act, 2006
The scheduled tribes and other traditional forest dwellers(Recognition of forest rights)
Act 2006 is a result of protracted struggle by the marginal and tribal communities of our country
to assert their rights over the forest land over which they were traditionally dependent. The act
passed on 18th February 2006 is also known as tribal rights act, the tribal bill, tribal land act.
This act is crucial to rights of millions of tribals and other forest dwellers in different parts of our
country as it provides for restruction of deprived forest rights across India, including both
individual rights to cultivate land in forest land and community rights over common property
resources. Millions of people live in the near India's forest lands, but have no legal rights to their
homes, lands and livelihoods. A few government officials have all power over forest dwellers.
The result is that both forest and people die. The act recognizers forest dwellers rights and makes
conservation more accountable. The act basically does following two things:
(a) Grants Legal recognition to the rights of traditional forest dwelling communities, partially
correcting the injustice caused by the forest laws.
(b) Make a beginning towards giving communities and public a voice in forest and wildlife
conservation.
The Law recognises three types of rights:
1. Land rights
No one gets rights to any land that they have not been cultivating prior to December 3, 2005 and
that they are not cultivating now. Those who are cultivating land but don't have document can
claim up to four hectares, as long as they are cultivating land themselves for a livelihood. Those
who have a patta or a government lease, but whose land has been illegally taken by the forest
department, or whose land is subject to a dispute between forest and Revenue Department, can
climb those lands

Sanjeev Degree College Commercial Geography
S K V S L Narasimha Raju Page 67
2. Use rates
The law secondly provides for rights to use and collect the following:
a) Minor forest produced things like Herbs, medical plants, etc that has been traditionally
collected. This does not include timber.
b) Grazing grounds and water bodies.
c) Traditional areas of use by nomadic pastoral communities i.e communities that move
with their herbs.
3. Right to protect and conserve
Through the forest is supposed to belong to all of us, till date no one accept the forest
department had a right to protect it. If the forest department should decide to destroy it or to hand
it over to someone who would, stopping them was a criminal offence.
Opposition
The Law has been opposed on the following grounds:
i) Some people see the law as a land distribution scheme that will lead to handing over
of some land to tribes and forest dwellers.
ii) People concerned with wildlife conservation fear that the law will make it impossible
to create "invoilate species" or areas free of human presence for the purpose of
wildlife conservation. Tiger conservation in particular the object of concern.
Need for protection of forestry (forest conservation)
Forests comprise a unique gift of nature to man and constitute one of the priced assets of
a nation. They play a significant role in the national economy of a primary agriculture and a
developing country like India. The agriculture and industrial progress of the country is not only
stabilized but accelerated by a proper conservation and utilisation of forest resource. The use of
forests, both direct and indirect, are so large that they are aptly termed as an index of prosperity
of a nation. Keeping in view the benefits which we derive from the forests, it is of utmost
importance that strong steps should be taken to conserve forests.

Sanjeev Degree College Commercial Geography
S K V S L Narasimha Raju Page 68
Forest conservation does not mean the denial of use, but rather the proper use without
causing any adverse effect on our economy or environment. But any scheme of conservation of
forests on a piecemeal basis will not solve the problem. Conservation of forests is a national
problem and should be tackled as such. There should be perfect coordination between the forest
department and other departments for an effective conservation of forests. People's participation
in any forest conservation is of vital importance. Van Mahotsav was launched in 1950 to make
people aware of the importance of planting trees. Chipko movement is a living example of
general public awareness about forests.
Chipko Movement was started by Sh Sunderlal Bahuguna in Theri Garhwal district of
Uttarakhand in 1973 against ruthless feeling of trees and destruction of forest by contractors. The
name 'Chipko movement' comes from the word embrace as villagers hugged the trees and
prevented contactors from felling them.
Forest have to be developed and worked for obtaining various raw materials and for
providing and effective means of flood control, soil erosion, for regulating the flow of water in
streams and for conserving moisture in the soil. Therefore, a carefully coordinated scientific
policy for conservation of forest should be the first step in any scheme of national planning of
the country.
While contribution of forests to the nation's economy, apart from their vital role in
environment, can never be underestimated, the investment in forestry sector has been rather low.
At present the total investment in Forestry is about 800 crore against the required investment of
about 3000 crore. This is too small and investment and unless it is increased, it will not be
possible to ensure sustainable supply of goods and services for the huge sector of population
dependent on forests.
We have failed to realise the fact that destruction of forests is an irreversible process. The
rate of afforestation has been barely crawled to the 2 million hectarr mark, falling short to the
target set by the National Wasteland Development Board of at least 3.5 million hectare mark
every year till 2010.
The forest (conservation) act 1980 enacted to check i discriminate deforestation or
diversion of forest lands was amended in 1988 to make it more stringent by proscribing
punishment for violations. Guidelines have been prepared for working plans. Some silent
features are
i) Working plans should be up to date and stress conservation.
ii) Preliminary working plan should be multi disciplinary approach.

Sanjeev Degree College Commercial Geography
S K V S L Narasimha Raju Page 69
iii) Tribal rights and concessions should be highlighted along with control mechanism.
iv) Grazing should be studied in detail and specific prescriptions should cover fodder
propagation.
v) Shifting cultivation and encroachments need to be controlled.
vi) Clear feeling with artificial regeneration should be avoided as far as possible and
clear feeling blocks should not exceed 10 hectares in hills and 25 actors areas in
planes.
vii) Banning all felling about 1000 metre altitude a few years should be considered to
allow those areas to recover.
The further welfare and prosperity of India would very much depend upon our ability, effort
and success in conserving, developing and proper utilisation of our forest resources. It is,
therefore, high time that the nation as a whole awakens to this burning problem for the sake of a
better future.
Steps to conserve forests
Based on the forest Conservation Policy the following steps were initiated
1. Social forestry
The term social forestry was used for the first time, by the national commission on
agriculture in 1976, to denote tree raising programmes to supply firewood, small timber and
minor forest produce to rural population.
2. Urban forestry
Urban forestry is concerned with the raising and management of trees on public and privately
owned lands in and around urban centres such as green belts, etc.
3. Rural forestry
Rural Forestry lays emphasis on promotion of agro forestry and community forestry.

Sanjeev Degree College Commercial Geography
S K V S L Narasimha Raju Page 70
4. Agro-forestry
Agro forestry is the raising of trees and agricultural crops on the same land of the waste
patches. It combined forestry with the agriculture, thus altering the simultaneous production of
food, fodder, fuel, Timber and fruit. This involves the raising of trees on public or community
land touches such as the village pasture and temple, roadside , canal bank, strips along railway
lines, and schools etc
5.Community Forestry program
It aims at providing benefits to the community as a whole. Community Forestry provides
a mean under which the people of landless classes can associate themselves in tree racing and
thus, get those benefits which otherwise are restricted for landowners.
5. Farm forestry
Under farm forestry farmers grow trees for commercial and non commercial purposes of
their farm lands.
Forest departments of various States distribute seedling of trees free of cost to small and
medium farmers. Several lands such as the margins of agricultural fields, grasslands and
pastures, land around homes and cow sheds may be used for raising trees under non commercial
farm forestry.

Sanjeev Degree College Commercial Geography
S K V S L Narasimha Raju Page 71
Unit - 4
India - Minerals and Mining
Mineral
A mineral is a natural substance of organic or inorganic origin with definite chemical and
physical properties.
The occurrence of minerals
The extraction of minerals from the ground is a complex and costly process. It involves a
great deal of technological knowledge and proper understanding of the nature and mode of
occurrence of various mineral areas. Coal is found in form of coal seams and while petroleum is
also available in the liquid state below the surface of the earth. Metallic minerals may occur in
native or almost pure form in veins, or may be mixed with other materials in which case the
metals as a whole is called an ore.
Minerals and mining
Minerals are closely associated with mining. Mining and quarrying covers underground
and surface mines, quarries and wells and includes extraction of minerals and also all
supplemental activities such as dressing and beneficiation of ores and other crude materials, like
crushing, screening, washing, cleaning, grading and several other preparations carried out at the
mine site, which are needed to render material marketable. Open cast mining and underground
mining are two chief mining methods of mining practiced in India.
1. Open cast mining
This is the easiest and the cheapest way of mining those minerals which occur close to the
surface. This simply involves the removal of the overburden, that is the earth or other rock bands
laying above the mineral bearing strata, and extraction of the ore in successive layers and until
the mineral content becomes too small or the pit becomes too deep for economic mining. The
overhead costs, such as safety, precautions and equipment are relatively low in this type of
mining and output is both large and rapid. It is also used for quarrying rocks such as limestone,
gravels, rocks and clay for bricks.
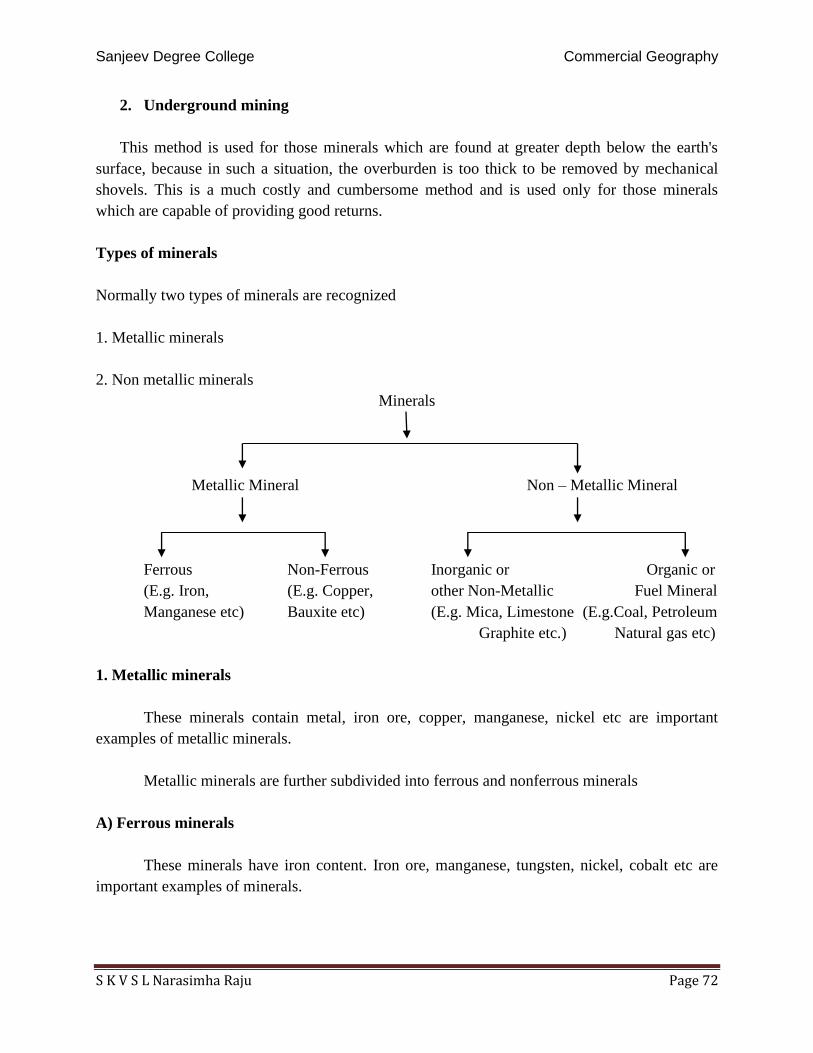
Sanjeev Degree College Commercial Geography
S K V S L Narasimha Raju Page 72
2. Underground mining
This method is used for those minerals which are found at greater depth below the earth's
surface, because in such a situation, the overburden is too thick to be removed by mechanical
shovels. This is a much costly and cumbersome method and is used only for those minerals
which are capable of providing good returns.
Types of minerals
Normally two types of minerals are recognized
1. Metallic minerals
2. Non metallic minerals
Minerals
Metallic Mineral Non – Metallic Mineral
Ferrous Non-Ferrous Inorganic or Organic or
(E.g. Iron, (E.g. Copper, other Non-Metallic Fuel Mineral
Manganese etc) Bauxite etc) (E.g. Mica, Limestone (E.g.Coal, Petroleum
Graphite etc.) Natural gas etc)
1. Metallic minerals
These minerals contain metal, iron ore, copper, manganese, nickel etc are important
examples of metallic minerals.
Metallic minerals are further subdivided into ferrous and nonferrous minerals
A) Ferrous minerals
These minerals have iron content. Iron ore, manganese, tungsten, nickel, cobalt etc are
important examples of minerals.

Sanjeev Degree College Commercial Geography
S K V S L Narasimha Raju Page 73
B) Non ferrous minerals
These minerals do not have iron content. gold, silver, copper, lead, bauxite, tin,
magnesium etc are important examples of non ferrous minerals.
2. Non metallic minerals
These minerals do not contain metal. These minerals can either be organic or inorganic.
A) Organic minerals
These minerals contain organic matter. Fossil fuels also known as mineral fuels are
derived from the buried animal and plant life such as coal and petroleum.
B) Inorganic minerals
They do not contain organic matter. Mica, limestone, graphite, gypsum etc are examples
of inorganic minerals.
Distinction between metallic and non-metallic minerals
Metallic minerals Non-Metallic minerals
i)The metallic minerals are those which
provide metals on melting, e.g., iron, Bauxite,
Tin, Manganese, Copper etc.
i)Non – metallic minerals are minerals which
do not contain metals
ii)They are usually hard and have shine ii)They have lustre of their own.
iii)They are generally found in igneous rocks. iii)They are mostly found in sedimentary
rocks.
iv)When hit, they do not break. iv)When hit, they get broken in to pieces.
v)They are ductile and malleable. v)They are not ductile and malleable.
Distinction between Ferrous and non-ferrous minerals
Ferrous Minerals Non - Ferrous Minerals
i)Minerals have iron contents and used in iron
and steel industry are called ferrous minerals.
i)Minerals having no iron content like gold,
copper, nickel, lead, etc., are called non-ferrous
minerals.
ii)They are greyish in colour and form basis of
machinery.
ii)They have different colours and are
important for economic growth.
iii)They are ductile and malleable. iii)They are found in all types of rocks.

Sanjeev Degree College Commercial Geography
S K V S L Narasimha Raju Page 74
Characteristics of minerals
Minerals have following three distinct characteristics
i) Minerals are unevenly distributed over space
ii) There is inverse relationship in quality and quantity of minerals minerals i.e. good quality
minerals are less in quantity as compared to low quality minerals.
iii) Minerals are exhaustible resources i.e. once used they are lost for ever. These take long time
to develop geologically and they cannot be replenished immediately at the time of need. Thus,
they have to be conserved and not misused as they do not have the second crop.
Mining a robbery industry
Unlike agriculture, forestry, fishing etc. where the natural resource are renewable can be
used again and again, mining is a robber industry, and they are lost forever and can never be
replenished. Man may apply the latest techniques of mining at greater depths and may extract
every bit of valuable ore, or may continually prospect new areas to find hitherto unexploited
minerals, but he can never increase or replace minerals that are mined. The process of mineral
formation is extremely slow and does not have much relevance to the speed of mineral
extraction. Thus, all the minerals are finite and are declining resources. A day may come when
the whole of mineral resources are exhausted and the entire mankind maybe deprived of any
mineral.
Mineral wealth of India
India is endowed with a rich variety of minerals. Large size and diverse geological
formations have flavored India in providing a wide variety of minerals. According to Meher D
N Wadia, "the mineral wealth of India, though by no means inexhaustible, is varied enough to
provide for second economic and industrial development of the country but has at the same time,
certain importance deficiencies. It has been estimated that nearly 100 minerals are known to be
produced or worked in India, of which nearly 30 may be considered more important including
several which although comparatively unimportant in quantity today are capable of material
development in future with expansion of industries. The country has fairly abundant reserves of
coal, iron and mica, adequate supplies of manganese ore, titanium and aluminium, raw materials
for refractories and limestone, but there is a deficiency inverse ores of copper, lead and zinc.
There are workable deposits on tin and nickel. "Indian earns a lot of foreign exchange by
exporting a large variety of minerals such as iron ore, titanium, manganese, bauxite, granite and
a host of other minerals. At the same time India has to depend upon imports to meet her

Sanjeev Degree College Commercial Geography
S K V S L Narasimha Raju Page 75
requirements of some another minerals such as copper, silver, nickel, cobalt, zinc, lead, tin,
mercury, limestone, platinum, granite and so many other minerals.
There are 3,108 mines in India, out of which 570 are fuel (coal and lignite) mines, 563
metallic mineral mines and 1,957 non-metallic mineral mines. The mineral sector employs over
eight lakh persons and accounts for 11.5% of country's industrial output and nearly three percent
of the gross domestic product (GDP). It is the mining sector that provides the muscle for the
industrial development of a country. Though mining and mineral extraction had been in vogue
for several centuries in India, the real development occurred after independence only. The
liberalisation policy of the government in 1991 gave importance to mining, along with other
economic activities. Then new national mineral policy, announced in 1993 has conceded the of
the demands of the private sector.
Distribution of minerals and mineral belts
The most striking feature of the Indian minerals is their uneven distribution. Some areas
are very rich in minerals where some others are completely divoid of this valuable asset. This has
resulted in the emergence of different mineral belts which are briefly described as under
1. The north eastern peninsular belt
This belt comprising of Chota Nagpur Plateau and Orissa plateau in the state of
Jharkhand, West Bengal and Orissa is the richest mineral belt of India. It contains large
quantities of coal, iron ore, manganese, mica, bauxite, copper, kyanite, chromite, apatite and
many more minerals. In fact for any major minerals of India and you will find it in this belt.
Thus, it is a mineral region par excellence. The chota Nagar plateau is known as the mineral
heartland of India. According to Kadia, this region processes India's 100% kyanite, 93% iron ore,
84% coal, 70% chromite, 70% of mica, 50% fireclay, 45% asbestos, 45% china clay, 20%
limestone and 10% manganese. However, many changes have taken place in the recent years.
2. Central belt
This belt encompassing parts of Chhattisgarh, Madhya Pradesh, Andhra Pradesh and
Maharashtra is the second largest mineral belt of India. Large deposits of manganese, bauxite,
limestone, marble, coal, gems, mica, iron ore, graphite etc are available here. A comprehensive
geological survey is still needed to know about the mineral wealth of this belt.

Sanjeev Degree College Commercial Geography
S K V S L Narasimha Raju Page 76
3. The southern belt
It covers mostly the Karnataka plateau but extends over the contiguous Tamilnadu
upland. It is more or less similar to the north eastern Peninsular belt, as far as deposits of ferrous
minerals and bauxite are concerned but it lacks coal deposits excepting lignite at Neyveli. It also
does not have mica and copper deposits. Therefore, its mineral diversity is not as pronounced as
that of the north eastern Peninsula belt.
4. The South Western belt
Southern Karnataka and Goa are included in the belt. It has deposits of iron ore, granite
and clay.
5. The North Western belt
The belt extends along the aravallis in Rajasthan and in adjoining parts of Gujarat. This
belt has developed recently and is gradually becoming a productive region, holding great
promise for mining of non ferrous metals(copper, lead, zinc), uranium, mica, stellite, beryllium
and precious stones(aquamarine and emerald). Gujarat is fast becoming an important producer of
petroleum, besides producing gypsum, manganese, salt,bauxite etc.
Other side the main belts described above, minerals in some other parts of the country are
scattered here and there, Assam has reserves of petroleum and lignite. The Himalayan region has
some deposits of coal, bauxite, copper, slate etc. Mumbai high and Godavari basin has reserves
of oil and natural gas.
With the advancement of technology, even the sea bed is being exploited for minerals.
These are great possibilities of obtaining large quantities of oil and natural gas, uranium,
manganese, copper, zinc, lead and so many other minerals from the sea bed.
Use of minerals
Man has been using minerals since Pre-historic times. In fact mining is one of the oldest
occupations of man. The importance of minerals in human civilization is reflected from the fact
that many stages in the history of economic development are named after minerals used in those
days. The first mineral used by man was stone to make tools and weapons. This is known as
'stone age'. Soon man learnt technique of smelting metals and the first mineral smelt was bronze.
This brought about 'bronze age' and 'copper age'. Then came to 'Iron Age'. This was followed by
coal, petroleum and nuclear age. These are major sources of energy in the present day world.

Sanjeev Degree College Commercial Geography
S K V S L Narasimha Raju Page 77
Use of minerals has increased considerably all over the world with the passage of time.
The industrial revolution which took place in England, mainly in years 1780 to 1820 , soon
spread all over the world and enhanced the utility of minerals. The technical advancement,
population explosion and man's increasing needs with rise in living standards have enabled man
to use minerals more extensively and effectively. It is estimated that the use of minerals
increased 13 times in the 20th century and the rate of increase in use of minerals has accelerated
in the 21st century.
Today, minerals from a valuable asset in the natural resources of any country. The
richness and standard of living of the people of the country is measured by the amount of
richness of its mineral resources and the style in which these minerals are utilised by the people.
Minerals form the backbone of industrial development of a country. Most of the industrially
developed countries have plenty of minerals resources and their disposal. Some of the countries
do not have enough minerals but they have advanced Industries. Japan is one such nation. This
country heavily depend on imports of large number of minerals to feed its Industries. Even
within a country like India, minerals have to be transported to factory site from the mines so that
industrial run smoothly. For example, Tata Iron and Steel company (TISCO) at Jamshedpur in
Jharkhand gets iron from Gurumahisani mines of Mayurbhanj in Orissa, coal from Jharia and
Raniganj, manganese from jode mines of Kendujhar district in odisha and dolomite, limestone
and fireclay from Sundargarh district of Odisha.
Not only Industries, other activities of man are also dependent on minerals. For example,
agricultural makes use of fertilizer and pesticides which depend on minerals like potassium,
nitrogen, phosphate etc. Most of the form implements are made of iron which is based on iron
ore and several other minerals.
Transport and communication also use a large variety of implements, most of which
depend on mineral based industries.
Main minerals of India
Nature has blessed India with a large variety of minerals, some of which are essential for
the economic growth of the country. Important minerals are briefly described below.
Iron ore
Iron ore is the backbone of modern civilization. It is the foundation of our basic industry.
Today, iron ore is used all over the world. The standard of living of the people of a country is
judged by the consumption of iron. Iron is taken out from the mines in the form of iron-ore

Sanjeev Degree College Commercial Geography
S K V S L Narasimha Raju Page 78
which contains varying percentage of iron. Accordingly, there are different varieties of iron ore.
Four major varieties of iron ore are briefly described below:
1. Magnetite
This is the best quality of ore and contains 72% pure iron. It possesses magnetic property
and it is called magnetite. It is found in Andhra Pradesh, Jharkhand, Goa, Kerala, Tamilnadu and
Karnataka.
2. Haematite
It contains 60% or 70% pure iron and is found in Andhra Pradesh, Jharkhand, Orissa,
Chhattisgarh Goa, Karnataka, Maharashtra and Rajasthan.
3. Limonate
It contains 40% to 60% pure iron. It is of yellow or light brown colour.
4. Siderite
It is inferior ore and contains many impurities. It has just 40 to 50% pure iron.
Production and distribution
The total recoverable reserves of hematite iron ore in India about 17,882 million tonnes
of haematite. Hematite Ore mainly occurs in Odisha 5,930 million tonnes (33%), Jharkand 4,597
million tonnes (26%), Chhattisgarh 3,292 million tonnes (18%),Karnataka 2,159 million
tonnes(12%) and Goa 927 million tonnes(5%). The balance resources of haematite are spread in
Andhra pradesh, Assam, Bihar, Maharashtra, Madhya Pradesh, Meghalaya, Rajasthan and Uttar
Pradesh.
Reserves of magnetite iron ore estimated at 10,644 million tonnes.India's 97% magnetite
reserves are located in four states Karnataka 7,802 million tonnes(73%), followed by Andhra
Pradesh 1464 million tonnes(14%), Rajasthan 527 million tonnes and Tamilnadu 507 million
tonnes (5% each). Assam, Bihar, Goa Jharkhand, Kerala, Maharashtra, Meghalaya and nagaland
together account for the remaining 3% resources.
India produced about 1,67,289 thousand tonnes of iron ore in 2015-16. Orissa is the
largest producer accounting for over 40% of the total production.

Sanjeev Degree College Commercial Geography
S K V S L Narasimha Raju Page 79
Manganese
It is an important mineral which is used for making iron and steel and it acts as a basic
raw material for manufacturing its alloy. Nearly 10 kilograms of manganese is required to
manufacturing one tonne of steel. It is also used for the manufacture of bleaching powder,
insecticides, paints, batteries and china clay.
The total resources of manganese ore are placed at 430 million tonnes. Statewise, Odisha
tops the total resources with 44% share followed by Karnataka 22%, Madhya Pradesh 13%,
Maharashtra 8%, Andhra Pradesh 4% and Jharkhand and Goa 3 % each. Rajasthan, Gujarat and
West Bengal together share the remaining about 3% resources.
Mica
Mica has been used in India since ancient times as a medical in Ayurveda and is known
as 'abhrak' . With the development of electrical industry, mica found new vistas of use. Its
insulating properties have made it is a valuable mineral in electrical and electronic industry. It
can withstand high voltage and has low power loss factor. The three major types of Mica found
in India are muscovite, phlogopite and biotite.
The total reserves of mica in India are estimated to be 5,32,237 tonnes Andhra Pradesh
leads with 41% share of country's total resources followed by Rajasthan 21%, Odisha 15%,
Bihar 2% and balance less than 1% in Jharkhand.
India has monopoly in the production of mica, producing about 60% of the world's Total
production. Earlier, there was no substitute for Mica. Now materials like plastics and synthetic
have been developed which can be used as substitute for mica.
Bauxite
Bauxite is the raw material for making aluminium. It is not a specific mineral but a rock
consisting mainly of hydrated aluminium oxides. It is clay like substance which is pinkish,
whitish or reddish in colour depending on the amount of iron content.
Total resources of bauxite are placed at 3,480 million tonnes. Odisha alone accounts for
52% of country's resources. This is followed by Andhra Pradesh 18%, Gujarat 7%, Chhattisgarh
and Maharashtra 5% each. Major bauxite resources are concentrated in the east coast bauxite
deposits in Orissa and Andhra Pradesh.

Sanjeev Degree College Commercial Geography
S K V S L Narasimha Raju Page 80
Power resources
Power or energy is the primary input in the production of goods and services. The Wheels
of progress move with the flow of energy. One of the critical elements in raising the standard of
living of a country's population is the provision of affordable and reliable energy services in
sufficient quantity. More regular and ample is the availability of energy, more even will be the
path to economic prosperity. The role of energy has significantly increased with the increase in
industrialization and urbanization in the present day society. From its early role, which was
confined to kitchen as a fuel for household cooking, energy is now a major input in sectors such
as industry, commerce, transport and telecommunications, besides the wide range of services
required in household sector.
Depending upon its source and utilisation, energy can be divided into two broad classes:
1. Non renewable energy
2. Renewable energy
1. Non renewable energy resources
Non renewable are those energy resources which once used cannot be easily replenished.
They are exhausted quickly and are also known as exhaustable energy sources. But their
formation takes place millions of years. Coal, Petroleum and natural gas are good examples of
non renewable energy resources.
2. Renewable energy resources
Renewable energy resources are those resources which can be renewed or replenished by
physical, mechanical or chemical processes. They are known as inexhaustable energy resources.
Solar energy, wind energy, wave energy, tidal energy, geothermal energy, hydroelectricity etc
are some of the outstanding examples of renewable energy resources.
Energy may also be classified as conventional and non-conventional depending upon its
nature. Coal, petroleum, natura gas and electricity are the main sources of conventional energy.
While solar, wind, tidal, , geothermal energy and biogas etc. are some of the outstanding
examples of non-conventional energy.
Sanjeev Degree College Commercial Geography
S K V S L Narasimha Raju Page 81
Conventional sources of energy
As mentioned Coal, Petroleum, natural gas and electricity are conventional sources of
energy. A brief description of their production, distribution and consumption is as below
Coal
Coal is an inflammable organic substance, composed mainly of hydrocarbons, found in
the form of sedimentary rocks and capable of being used as fuel to supply heat or light or both. It
also contains volatile matter, moisture and ash in varying proportions.Combustible matter in coal
consists of carbon and hydrogen.
Coal was, is and will continue to be the mainstay of power generation in india. It
constitutes about 60% of total commercial energy consumed in the country. The power sector
and industries account for 94% of total consumption. Manufacturing of iron and steel and a
variety of chemicals largely depend upon the availability of coal. Due to its high utility as a
source of energy and as a raw material for a large number of industries, it is often called 'black
gold'. A recent study conducted by energy experts shows that the world coal reserves are six
times the known reserves of oil and coal has been described as the bridge into the future.
Origin of coal
Coal has originated from the organic matter wood. Large tracts of forest lands were
buried under the sediment in the geological past i.e. carboniferous age. Wood was burnt and
decomposed due to the heat from below and brothers from above. During the process of
decomposition of wood, the hydrogen originates in the form of methane and water, the oxygen in
the form of carbon dioxide and water. During the process of change from wood to coal, the
amount of oxygen and nitrogen decreases and the proportion of carbon increases. The capacity of
coal to give energy depends upon the percentage of carbon contained in it. The percentage of
carbon in coal depends upon the duration and intensity of heat and pressure on wood.
Varieties of coal
Depending upon its grade from highest to lowest, following four varieties of coal are
generally recognized.
1. Anthracite coal
This is the best quality of coal and contains over 80% carbon. It is very hard, compact, Jet
black coal having semi metallic lustre. It lignites slowly and burns with a nice short blue flame.

Sanjeev Degree College Commercial Geography
S K V S L Narasimha Raju Page 82
It has the highest heating value and is the most prized among all the varieties of coal. In India, it
is found only in Jammu and Kashmir and that too in small quantity.
2. Bituminous coal
This is the most widely used coal and contains 60 to 80% carbon. It is dense, compact,
brittle and is usually of black colour. A good bituminous coal is composed of alternate dull and
bright bands. It does not have traces of original vegetable material from which it has been
formed. Its calorific value is very high due to high proportion of carbon and low moisture
content. By virtue of this quality, bituminous coal is used not only for steam raising and heating
purposes but also for production of coke and gas. Most of this bituminous coal is found in
Jharkhand, odisha, West Bengal, Chhattisgarh and Madhya Pradesh.
3. Lignite
Also known as brown coal, ligmite it is a lower grade coal and contains about 60%
carbon. It represents the intermediate stage in the alteration of woody matter into coal. It's colour
varies from dark to black brown. It is friable and pyritious and contains a good deal of moisture
and less of combustible matter. These qualities make it liable to disintegrate on exposure and
even to spontaneous combusion. It is found in Palna of Rajasthan, Neveli of Tamilnadu,
lakhimpur of Assam and Karewa of Jammu and Kashmir.
4. Peat
This is the first stage of transformation of wood into coal and contains 50 to 60% carbon.
It is a seldom sufficiently compact to make a good fuel without compressing into bricks. Left to
itself, it burns like wood gives less heat, emits more smoke and leaves a lot of ash after burning.
Occurrence of coal in India
The coal bearing strata of India are geologically classified into two main categories
Gondwana coal fields and Tertiary coal fields.
a) Gondwana coal
The Gondwana coal contributes overwhelming large proportion of both the reserves and
production of coal, accounting for 98% of the total reserves and 99% of the production of coal in
India. They are the store house of India metallurgical as well as superior quality of coal. The
Gondwana coal deposits occur down in the vallys of certain rivers the Damodar (Jharkhand-
West Bengal) ,the Mahanandi (Chhattisgar-Odisha) the Son(Madhya Pradesh-Bihar) the

Sanjeev Degree College Commercial Geography
S K V S L Narasimha Raju Page 83
Godavari and Wardha (Maharashtra-Andhra Pradesh) the indravati, the narmada, the panch and
many more.The Gondwana coal is said to be about 250 millions years ago.
b) Tertiary coal
The territory rock system bears coals of younger age from 15 to 60 million years and are
mainly confined to the extra Peninsula. This coal generally has low carbon and high percentage
of moisture and sulphur. Important areas of tertiary coal include parts of Assam, Meghalaya,
Arunachal Pradesh, Nagaland, Himalayan foot Hills of Darjeeling in West Bengal, Jammu and
Kashmir, Rajasthan, Kerala Tamilnadu and the union territory of Pondicherry.
Production and distribution
As a result of exploration carried out down to death of 1200 metres by the geological
survey of India and other agencies, a cumulative total of 301.56 billion tonnes of coal reserves
have been estimated in the country as on 1 April, 2014 out of which nearly one third are in and
one fourth are in Orissa infact Jharkhand and one fourth are in Orissa. In fact Jarigindi, Odisha,
West Bengal and Madhya Pradesh account for over 90% of India's coal reserves.
There are been considerable increase in the production of coal in India since
Independence. The total production of coal in 1950-51 was 350 lakh tonnes which increased to
63,025 lakh tonnes in 2015-16.
Chhattisgarh (21%), Jharkhand (20%), Orissa (19%), Madhya Pradesh (13%), Andhra
Pradesh and Telangana (10%), Maharashtra (7%), West Bengal (4%) and Uttar Pradesh (3%) are
the main producers.
Singareni coal mines
Singareni is a village located in Khammam district of Telangana. The area surrounding
this village has huge coal reserves and is known as Singareni Coal Mines. These coal mines have
the largest coal reserves in South India. These coal fields are shared by Telangana and Andhra
Pradesh because some parts of Singareni Coal Mines fall in Andhra Pradesh. Singareni
Collieries Co Limited. plans to invest 10,360 crores in 12th plan period(2012-17) to increase coal
production, open new mines and build a 1200 megawatt (MW) coal based power plant in
Telangana Adilabad district. The Singareni Colleries Company Limited was founded in 1920
with its headquarters at kothagudam in Telangana. One of the public sector undertakings, the
company is owned by the Telangana Government (51%) and the union government (49%). The
Singareni Coal Company which is involved in coal extraction in Telangana, in the Pranahita-
Godavari Valley region, which has significant coal reserves with proven geological reserves

Sanjeev Degree College Commercial Geography
S K V S L Narasimha Raju Page 84
estimated at 8,791 million tonnes. Ramagundam is one of the important operating areas of
Singareni collieries. Sigareni Collieries Company Limited (SCCL) achieved a total coal
production of 52.53 million tonnes in 2014-15 an increase of 4% over 2013-14 production.
Singareni supply coal to thermal power plants for supplying power to power starved state of
Telangana. The company will spend 5,276 crore to expand its coal mining business.
Barytes
Barytes is white or colourless mineral which is the main source barium. It is compound of
Barium Sulfate. The high specific gravity of barite makes it suitable for a wide range of
industrial, medical and manufacturing user. It often occurs as concretions and viod feelings
crystals in sediments and sedimentary rocks. It is especially common as concretions and vein
feeling in limestone and dolostone. Where these carbonate rock units have been heavily
weathered, large accumulations of barite are sometimes found at the soil bedrock contact. Barite
is also found as concretions in sand and sandstone. These concentration grow as barite
crystallizers within the interstitial spaces between sand grains. Sometimes crystals of barite
grow into interesting shapes within the sand. These structures are known as 'brite roses'.
Occasionally barite is also abundant in a sandstone that it serves as the 'cement' for the rock. It is
also common mineral in hydrothermal veins and is a gangue mineral associated with sulfide ore
veins. It is found in association with ores of antimony, cobalt, copper, lead manganese and silver.
In a few locations barite is deposited as a sinter at hot springs.
Use of barite
Barite is the main ore of the element barium. It is also important in manufacturing paper
and rubber. Barite is also used in Radiology in X rays of the digestive system. When crushed, it
is added to mud to form barium mud which is poured into oil wells during drilling. The oil and
gas industry is the primary user of barite worldwide. About 80% worldwide is used as a
weighing agent for the drilling fluids in oil and gas exploration. Other uses include electronics,
TV screens, rubber, glass, ceramics, paint industry, radiation shielding and medical applications.
Mangampet Barties
Mangampeta is a village in Cuddapah district of Andhra Pradesh. It is famous all over
India for its rich deposits of Barites. With about 74 million tonnes of deposits, it is considered to
be the largest deposit. It accounts for 98% of the known Indian reserves and 25% of the known
world reserves. Andhra Pradesh Mineral Development Corporation Limited (APMDC) is the
sole producer in public sector, which accounts for about 98% of the total production. The total
production of barytes was 1,739 thousand tonnes in 2012-13, most of which come from
Mangampeta Barytes. Very nominal production was reported from Rajasthan.

Sanjeev Degree College Commercial Geography
S K V S L Narasimha Raju Page 85
Unit - 5
India - Water Resources
Rivers of India
India is blessed with hundred of large and small rivers which drain the length and breadth
of the country. The rivers constitute and Important natural resource and from the lifelines of the
Indian masses. The drainage pattern of India is influenced by the relief of land.
The drainage systems of India
On the basis of origin, two broad drainage systems of India at generally recognised
1.The Himalayan rivers
2.The peninsular rivers
1. The Himalayan rivers
The rivers originating from the Himalayas consists of the following three system:
i)The Indus drainage system
ii)The Ganga drainage system
iii)The Brahmaputra drainage system
iv)Indus drainage system
This system comprises of the Indus river and its five main tributaries of the Jhelum, the
Chenab, the Ravi, the Beas and the Sutluj.
The Indus
The Indus river in Tibet at an altitude of 5,180 metres near Manasarowar lake. It flows
west and north-westwards and enters Indian territory in Jammu and Kashmir. The river forming
a speculator gorge is this reach pierces the Kailash range several times. It flows through Ladakh,
Baltistan and Gilgit to finally emerge out of the hills at Attock. The Indus flows south-westwards

Sanjeev Degree College Commercial Geography
S K V S L Narasimha Raju Page 86
across Pakistan to reach Arabian Sea East to Karachi. With a total length of 2,880 kilometres, the
Indus is considered as one of the largest rivers of the world. It has a catchment area of 11,65,000
square kilometres of which is as much as 3,21,290 square kilometres lies within India. India can,
however utilise only a total 4,195 million cubic metres (only 20%) out of its total discharge
under the regulations of the Indus water Treaty signed with Pakistan.
The Jhelum
It rises in a spring at Vrrinag situated in the South-eastern part of the valley of Kashmir.
It flows northwards from its source of Wular lake and further down South-west wards until it
enters a gorge cut by this river in the Pir Panjal range. It turns to the northwest below Uri and to
the south below Muzaffarabad and continues until Mangla is reached. Between Muzaffarabad
and Mangla, it runs roughly along the Indo-Pakistan border. It joins the Chenab near Jhang in
Pakistan.
The Chenab
The Chenab of Jammu and Kashmir state is known as Chandrabhaga in Himachal
Pradesh. Chandrabhaga flows north westwards and runs parallel to the Pir Panjal range for some
distance. Near Kishtwar, it cuts a deep gorge in the Pir Panjal range and turns Southwestwards
and flows in this direction for short distance. Further down, it turns to the west and enters the
plain area near Akhnur.
The Ravi
The sourse of this river lies near the Rohtang pass. It flows to the Northwest from its
place of origin and drains the area lying between the south eastern part of the Pir Panjal range
and the Dhaoladhar range. Some distance below Chamba, it turns to the Southwest cuts a gorge
in the Dhauladhar range and enters the Punjab plain near Madhopur. It brings a part of Indo
Pakistan boundry, the river has some strategic significance. It joins the Chenab near Multan in
Pakistan. It total length is 720 km.
The Beas
It originates from a place known as Beas Kund, near the Rohtang Pass. In its early stage,
it runs from north to south pass Manali and Kulu where it valley is popularly known as the Kulu
Valley. It crosses the Dhaoladhar range through a deep gorge. Further down, it turns to the west
and enters the Punjab plain near Talwara. After entering the plain, it turns to the south-west and
joins the Satluj near Harika after flowing for distance of 615km.

Sanjeev Degree College Commercial Geography
S K V S L Narasimha Raju Page 87
The Satluj
It originates from Rakas lake which is situated at an altitude of 4,630 metres in Tibet.
This lake is connected with Manasarowar Lake by a stream. It follows nouthwest wards and
enters Himachal Pradesh at the Shipki La Pass. Further down, it flows towards westwards. It cuts
deep gorged where it pierces the Himalayan ranges. Before entering the Punjab Plains, it cuts a
deep gorge where Bhakhra Dam has been constructed. Below Roopnagar, it takes to the west.
Beas, its right bank tributary, joins it at Batike. Its length 1,440 kms. During its onward journey
it receives the collective water of the Ravi, Chenab and Jhelum rivers and joins the Indus a few
kilometres above Mithankot in Pakistan.
ii)The Ganga drainage system
This river system includes the Ganga and its tributaries like the Yamuna, the Gomti, the
Ghaghara, the Gandak, the Ram Ganga, the Mahaganga and the Kosi etc. All these rivers
originate in the Himalayas.
The Ganga
The Ganga rises in Garhwal Himalayas in Uttarakhand at an altitude of 6,600 metres. The
river acquires its name after the head stramms-Alakananda and Bhagirathi unite at Devaprayag.
Flowing west south westwards the Ganga debouches from the hills near Haridwar. The total
length of the Ganga is 2,525 kms, out of 2,415 kms in India. Rest of the Ganga measuring 110
km is in Bangladesh. The total area of Ganga basin in India alone 8,61,404 square kilometres.
Beyond Farakka, it flows east south east ward into Bangladesh where it is known as
Padma. Before falling into Bay of Bengal, the Padma, receives the Brahmaputra which is known
as Jamuna and Maghna here.
The Yamuna
It is the right bank tributary of the Ganga and it takes its rise at the Yamunotri Glacier at
3,965 m. After cutting in deep gorge across the Lesser Himalaya, it flows towards the southwest
and enters the Ganga plain near Tajewala. It flows towards the south up to Agra and further
down in the south east direction till it joins the Ganga at Allahabad. The length of Yamuna from
its source to Allahabad is about 1,375 kms.

Sanjeev Degree College Commercial Geography
S K V S L Narasimha Raju Page 88
The Ghaghara
The Ghaghara's head water is the Karnali. It is of trans Himalayan origin and crosses the
western part of the Nepal Himalayas through deep and narrow gorges. It joins the Ganga near
Chhapra. It often shifts its courses.
The Gandak
It rises near Sino Nepal boundary and drains the central part of Nepal. After entering
Champaran district of Bihar, it turns to the south east and joints the left bank of the Ganga at
Sonpur. Like the Ghaghara it often changes its course and it notorious for its floods.
The Kosi
It drains eastern Nepal and enters Saharsa district of Bihar in numerous channels. The
river is notorious for shifting its courses, depositing silt and causing floods. It joins the left bank
of the Ganga at Karagola.
iii) The Brahmaputra drainage system
It originates from chemayungdung Glacier located about 100 kms Southeast of
Manasarovar Lake. It runs for about a distance of about 1,250 kilometres in the north of
Himalayas in a direction parallel to it. It is known as Tsang PO in Tibet. It takes a southward turn
near Namcha Barwa and enter Arunachal Pradesh as the Dihang river. It flows in a westerly
direction up to Dhubri. After this, it takes a southern turn and enters Bangladesh. There it joins
with Ganga and forms the world largest delta. Like the Indus, it is an example of antecedent
drainage. Its total length is 2,900 kms. Several tributaries join this river. Important right bank
tributaries are Sabansiri, Bharti, Manas and left hand tributaries are Dibang, Luhit, Buri Dihing
and Dhansiri. These tributaries bring a large quantity of water and the Brahmaputra channel
becomes 8 kilometre wide during rainy season. it causes frequent floods.
2.The peninsular rivers
The main rivers of the Peninsular plateau originate from the Western Ghats and flow in a
west east direction to join the Bay of Bengal. The important rivers are Mahanandi, the Godavari,
the Krishna and the Cauveri. The Narmada and thr Tapti are two exceptions which flow in rift
valleys in east west direction to join Gulf of Khambhat.

Sanjeev Degree College Commercial Geography
S K V S L Narasimha Raju Page 89
Rivers flowing in the Bay of Bengal
The Mahanandi
The Mahanandi has its source in the northern foothills of Dandakaranya near Sihawa in
Raipur district of Chhattisgarh and flows through Orissa to the Bay of Bengal. The drinage basin,
extending over 1,41,600 square kilometres is shared by Chhattisgarh, Madhya Pradesh, Orissa,
Bihar and Maharashtra. The total length of the river is 857 kilometres. The Seonath, Hasdo,
Mand, and the Ib join the Mahanandi on the left Bank of the Jonk, Ung and Tel join it on the
right bank.
The Godavari
The Godavari is the largest of the peninsular rivers. It rises in the Nashik district of
Maharashtra and joins the Bay of Bengal in Andhra Pradesh. Its total length is 1,465 kilometres.
The drainage basin extends over 3,12,812 square kilometres. About 50% of its drainage basin
lies in Maharashtra. The remaining basin of this river is shared by Madhya Pradesh, Karnataka
and Andhra Pradesh. The Godavari is often referred to as Vridha Ganga or Dakshina Ganga
because of its large size and extent. Its principal tributaries include the Pravara, Purna, Manjra ,
Penganga,Wainganga, Wardha, Pranahita, Indravati, Maner and Sabari. Among them, the
Manjra, Penganga and the Wainganga are the largest and together account for 1,15,832
kilometres of the drainage basin.
The Krishna
The Krishna rises from a spring near Mahabaleshwar. Its total length is 1,400
kilometres. This is shared by Maharashtra, Karnataka and Andhra Pradesh. Along with its main
tributaries, such as Koyana, Ghatapritha, Malapratha, Bhima, Tungabhadra, Musi and Muneru,
the Krishna drains an area of 2,58,948 square kilometres.
The Cauvery
Rising in the Brahmagir range of the Western Ghats, the Cauveri flows for 800
kilometres to join the Bay of Bengal near Kaveripatnam. It's drainage area of 87,900 square
kilometre is shared by Kerala, Karnataka and Tamil Nadu. The Cauvery river is distinctly
different from other peninsular rivers in the sense that it receives water throughout the year. In,
summer it receives water from the south-west monsoons from the Arabian sea and in winter, it
receives water from the retreating north-east monsoon. Thus it is perennial river. This river is
joined by the Lakshmanatirtha, Kabini, Suvarnavati, Bhawani and the Amaravati on the right
bank, and Herangi, Hemavathi, Shimsha and the Arkavati on the left bank.

Sanjeev Degree College Commercial Geography
S K V S L Narasimha Raju Page 90
The Subarnarekha and the Brahmani
The subarnarekha and the Brahmani, interposed between the Ganga and the Mahanadi
deltas, drain and area of 19,300 square kilometres and 39,033 square kilometres respectively.
The drainage basins of these streams are shared by Jharkhand, Orissa, West Bengal and
Chhattisgarh. The Brahmani is known as South Koel in its upper reaches in Jharkhand.
Rivers flowing in the Arabian Sea
The Narmada
It rises near Amarkantak in Madhya Pradesh, flows westwards for a distance of 1,300
kms to finally empty itself in Arabian Sea below Broach. The drainage basin extends over
98,796 kilometres and is confined mostly to Madhya Pradesh. Only one tenth of the basin area
lies in Gujarat. The picturesque gorge of the Narmada in the marble rocks near Jabalpur in
Madhya Pradesh is quite well known. Another feature of the Narmada basin is the lack of
development of tributary streams.
The Tapi
The Tapi, rising in the Betul of Madhya Pradesh, flows westwards for 724 kilometres in a
trough basin more or less parallel to the Narmada. It is however, much smaller both in terms of
channel length and the catchment area. The basin area of the Tapi extends over 65,145 square
kilometres in Madhya Pradesh, Maharashtra and Gujarat. The Tapi is joined by the Purna,
Veghar, Girna, Bori and the Panjhra on the left bank and by Aner on the right bank.
The Sabarmati and the Mahi
The north western flank of the plateau is drained by the Sabarmati and the Mahi. The
Sabarmati rises in the Aravali Hills and flows south south west wards for a distance of 300 km to
the Arabian Sea. The Sabarmati basin extends over an area of 21,674 square kilometres in
Rajasthan and Gujarat. The Mahi rises in the east of Udaipur and drains an area of 34,842 square
kilometres lying in Madhya Pradesh, Rajasthan and Gujarat. It flows south-west wards for a
distance of 533 km before it falls into the Gulf of Khambhat.
The Chambal, the Sind, the Betwa, the Ken and the Son
These rivers originate from the northern flank of the peninsular plateau and join the
Ganga river system in the northern plain.

Sanjeev Degree College Commercial Geography
S K V S L Narasimha Raju Page 91
The Chambal
Chambal rises near Mhow in the Vindhya range and flows towards the north generally in
a gorge upto Kota. Below Kota it turns to the north east direction and, after reaches Pinahat, it
turns to the east and runs nearly parallel to the Yamuna, before joining it in the southern part of
the Etawah district in Uttar Pradesh. The river flows much below its banks due to severe erosion
because of poor rainfall and numerous deep ravines have been formed in the Chambal valley
giving rise to badlands or badland topography. The term badland is applied to any such erosion
landscape, where a maze of ravines and valleys dissects plateau surfaces. It is 1,050 km long.
The Sind, the Betwa and the Ken flowing towards the north, have also cut deep gorges at
some places and like Chambal have carved out numerous ravines in the alluvial plain of the
Ganga.
The Son originates from Amarkantak plateau. After flowing for some distance to the
north, it meets the Kaimur range which turns its course towards the northeast. Almost all of its
tributaries join it on its right bank. It merges into the Ganga near Ramnagar. It is 780 kilometres
long.
Differences between the Himalayan and the Peninsular River Systems
The himalayan rivers are quite different from the rivers of the Peninsular India from the
point of view of the drainage features and hydrological characteristics. A brief account of the
differences between the Himalayan rivers and the Peninsular rivers is given below:
The Himalayan River Systems The Peninsular River Systems
1.Some of the longest rivers belong to the
Himalayan river system.
1.Peninsular rivers are not as long as the
Himalayan rivers.
2.The catchment areas and basins of the
Himalayan rivers are very large.
2.The catchment areas and basins of the
Peninsular rivers are of comparatively smaller
size.
3.Himalayan rivers are large in number. 3.Peninsular rivers are smaller in number.
4.The Himalayan rivers originate from the
snow covered areas and receive water from
rainfall as well from snow melt. Therefore
they are perennial.
4.The Peninsular rivers depend entirely upon
rain water and are seasonal.
5.The Himalayan rivers form deep gorges. 5.The Peninsular rivers flow in shallow
valleys.

Sanjeev Degree College Commercial Geography
S K V S L Narasimha Raju Page 92
6.The Himalayan rivers form river meanders
and often change their course.
6.The Peninsular rivers follow more or less
straight course and do not change their course.
7.These rivers are useful for irrigation and
navigation.
7.These rivers are not much suited for
irrigation and navigation.
8.These rivers flow across the young fold
mountains and are still in a youthful stage.
8.These rivers have been flowing in one of the
oldest plateaus of the world and have reached
maturity.
9.These rivers flow represent antecedent
drainage.
9.These rivers represent consequent drainage.
10.The Himalayan rivers form big delta's. The
Ganga-Brahmaputra delta is the largest in the
world.
10.The Peninsular rivers form comparatively
small delta's. Narmada and Tapi form
esturaries.
Water as an important natural resource
Water is an invaluable natural resource for us. It sustains life on the earth. There could be
no life had there been no water on the earth. In fact, earth is the only planet in the entire solar
system which supports life because it contains water. However, it is more useful. About 71
percent of the earth's surface is covered with oceanic water but fresh water constitutes only 3
percent of the total water. It is basic natural resource for human well being. We make use of
water for agriculture and industries. Water stored in reservoirs behind dams in supplied to
villages and cities. It is also used for irrigation and for production of hydroelectricity.
Navigation is another important use of water.
Demand for water is increasing rapidly with increase of population. As against this, the
supply of usable water is limited. Some areas have surplus water while other areas suffer from
shortage of water. The increasing shortage of water is creating tension and causing disputes
among nations, states, communities and regions, further, there are seasonal variations in the
availability of water. We receive plenty of water in the short rainy season and the remaining part
of the year particularly remains dry. Under such conditions, coordination between demand and
supply as well as between different sources of water resources is imperative.
Water resources of India
India occupies only 2.45 % of world's surface area is the home of about 17.5% of world's
population. As against this, India has only 4% of world's water resources. The total water
available from precipitation in the country in a year is about 4,000 cubic kilometres. The
availability from surface water and replenishable groundwater is 1,869 cubic kilometres. Out of

Sanjeev Degree College Commercial Geography
S K V S L Narasimha Raju Page 93
this, only 60% can be put two beneficial uses. Thus, the total utilisable water resource in the
country is only 1,122 cubic kilometres.
Surface water
Surface water is available to us in the form of rivers, lakes, tanks, ponds and other water
bodies. Rivers obtain water from rainfall or from snow melt. Rivers constitute the most
important source of surface water in India. Three major rivers of North India namely the Indus,
the Ganga and the Brahmaputra carry nearly 60% of the total surface water in India. It is worth
mentioning that the Brahmaputra and the Ganga are world's 8th and 10th largest rivers
respectively. The total flow of all rivers of India is about 6% of the discharge of all rivers in the
world.
The effective storage capacity built or under construction in India increased from an
insignificant 18 billion cubic metres at the time of independence to the current level of 147
billion cubic metres. It is 8.47 % of the total flow in this river basins.
Groundwater
As mentioned earlier, a part of rain water percolates in the ground through joints and
cracks in the rocks and is known as ground water. About 60% of the groundwater is confined to
the upper layers of the soil and is very useful for agriculture crops. The remaining water goes
deeper into the ground. This water is taken out by digging wells. The replenishable groundwater
potential in India is estimated at 433.9 billion cubic metres.
The distribution of groundwater is very uneven in India. It is affected by the structure of
rock, surface configuration and the amount of rainfall. The soft and permeable rocks of the
northern plain of India allow large quantities of water to percolate into the ground. Therefore,
this area is bestowed with vast groundwater resources. The entire land stretching from Punjab in
the west to the Brahmaputra valley in the east has large quantities of groundwater. The whole
plains so formed by depositional work of rivers originating in the Himalayan region and has soft
sediment and porous rocks. More than 42% of the potential is confined to states of the great
plains of North India. Uttar Pradesh alone accounts for 19 % of the estimated groundwater
potential.
The main use of groundwater is for irrigation which consumes about three fourths of the
total groundwater. The remaining one fourth is used for domestic, industrial related purposes.
There are large variations in development of groundwater at the state level mainly due to
climatic conditions. States and territories with less amount of rainfall and high rainfall

Sanjeev Degree College Commercial Geography
S K V S L Narasimha Raju Page 94
variability experiencing scarcity of surface water have developed their groundwater resources on
large scale.
Lagoons and backwaters
India has a very long coastline stretching over more than 6,000 kilometres. This coast is
very indented in some states like Kerala, Orissa and West Bengal where a large number of
lagoons and lakes have been formed. These lagoons and lakes provide vast surface water
resources. Although, water is generally brackish in these water bodies, it is used for fishing and
irrigating certain varieties of paddy, crops, coconut etc.
Water Demand and utilisation
India is basically an agricultural country where nearly two third of the total population
depends on agriculture. In order to increase agricultural production, we have to improve our
irrigation system. Therefore, high priority has been given to irrigation in Five Year Plans and
multipurpose river valley projects like the Bhakra-Nangal, Hirakud, Damodar Valley, Nagarjun
Sagar, Indira Gandhi Canal project etc has been taken up.
In 2002 the study shows that agriculture is the largest consumer of water. It accounts for
89% of the surface water and 92% of the groundwater utilisation. Domestic sector with 9%
utilisation in the second largest surface water while industrial sector with 5% utilisation is second
largest consumer of groundwater. However, share of agriculture in the total water consumption is
likely to reduce and that of domestic and industrial sector increase in future as the development
takes place.

Sanjeev Degree College Commercial Geography
S K V S L Narasimha Raju Page 95
Water scarcity
While water is a renewable resource, it is at the same time a finite resource. The total
quantity of water available on the globe is the same as it was thousands of years ago. It is
important to appreciate the fact that only 3% of world's water is fresh and roughly one third of it
is inassessible. The rest is very unevenly distributed and the available supplies are increasingly
contaminated with wastes and pollution from industry, agriculture and households.
Over the years, increasing population, growing industrialisation, expanding agriculture
and rising standards of living have pushed up the demand for water. Efforts have been made to
collect water by building dams and reservoirs and creating groundwater structures such as wells.
It is the human nature that we value things only when they are scare or in short supply.
As such we appreciate the value of water once the rivers, reservoirs , ponds wells etc run dry.
Our water resources have now entered an era of scarcity. It is estimated that 30 years from now,
approximately one third of our population will suffer from chronic water shortages.
The consequences of scarcity will be more drastic in the arid and semi-arid regions.
Water shortage will also be felt in rapidly growing coastal regions and in big cities. Several
cities are already, or will be, unable to cope with the demand of providing safe water and
sanitation facilities to their inhabitants.
Indicators of water stress and scarcity are generally used to reflect the overall water
availability in a country or a region. When the annual per capita of renewable fresh water in a
country or a region falls below 1,700 cubic metres, it is held to be situation of water stress. If the
availability is below 1,000 cubic metres, the situation is labelled as that of water scarcity. And
when the per capita availability falls below 500 cubic metres, it is said to be a situation of
absolute scarcity.
At the time of independence in 1947, the per capita availability of water in India was
6,008 cubic metres a year. It came down to 5,177 cubic metres in 1951 and to 1,820 cubic
metres in the year 2001. India has only 4% of world's water resources and it has to support 18%
of the worlds 10% of livestock. according to mid term appraisal after tenth plan availability of
water resources, and she has to support over 17% of world's population and over 15% of
livestock. According to mid term appraisal of the 10th plan, per capita availability of water is
likely to fall down to 1,340 cubic metres in 2025 and 1,140 cubic metres in 2050. The problem
of water storage is further complicated when we look at the areal distribution of water resources
with reference to population.

Sanjeev Degree College Commercial Geography
S K V S L Narasimha Raju Page 96
Interlinking the rivers
Although India has vast surface water resources, the same are very unevenly distributed
over time and space . While some river basins have vast catchment area and carry enormous
quantity of water, others are small and have comparatively small quantity of water. Most of the
Himalayan rivers are large and originate in the snow covered high altitude areas of the
Himalayan ranges. As such they carry sufficient water throughout the year and are called
perennial rivers. In contrast, the rivers of the peninsular India are seasonal. They carry no or
very little water in the dry summer season. During the rainy season, most of the rivers are
flooded and large part of water flows down the slope to the sea. Thus much of precious water is
wasted and is not available for use. Keeping these and many more problems in mind, the idea of
interlinking rivers through interbasin linkages or through national grid has been mooted. Some
of the important projects are briefly described as under.
The Ganga-Cauvery link canal
This project was prepared by the United Nations team at the request of Government of
India. It was proposed by the then irrigation minister Dr K.L Rao in 1950s. The project aimed at
reducing the impact of floods in the Ganga basin and supply water to central and eastern parts of
the country which suffer from chronic problem of water shortage. Water from Patna barrage will
be lifted by large pumps to a point near the boundary of the basins of Ganga and the Narmada
from where it will be distributed by gravity via dug up canals or through existing rivers to the
west or south. Flood waters of the Narmada and the Godavari could also be used. However , it
was pleaded that water from the Ganga for the inter-basin transfer could be drawn only during
four months of rainy season from July to October when the flow of water in the Ganga river
exceeds 2,850 cumecs.

Sanjeev Degree College Commercial Geography
S K V S L Narasimha Raju Page 97
The proposed Ganga-Cauveryi link Canal was to have been 2,640km long, withdrawing
60,000 cusecs. From the flood flows of the Ganga for about 150 days in the year, and would
have involved a list of a substantial part of water over 450 metres. It is also proposed to supply
about 300 cumecs of the Ganga water to different parts of Bihar, Uttar Pradesh, Jharkhand,
Chhattisgarh and Madhya Pradesh by pumping additional water during the lean season.
The scheme has been thoroughly examined and found impractical because of the huge
financial costs and very large energy requirements. Move over environmental issues put great
hindrances in the way of the project. However, the idea survives in the popular mind and comes
up whenever water scarcity is felt and conflicts begins acute.
The Brahmaputra-Ganga link canal
The Brahmaputra is a mighty river and carries a discharge of 3,500 to 5,000 cumecs even
during lean period of dry summer. This is because its catchment area receives heavy annual
rainfall. The amount of water flowing in this river is more than the requirements of the people
living in its basin area. In contrast the lower Ganga basin faces scarcity of water, particularly in
the summer season. This unbalanced distribution of water can be rectified by diverting the
surplus water of the Brahmaputra basin to the water scarcity areas of the lower Ganga basin.
The Brahmaputra-Ganga link canal project involves the construction of a diversion
barrage at Dhubri in Assam and a 320 kilometre long feeder Canal to link the Dhubri barrage
with the Farakka barrage. A part of the feeder canal will pass through Bangladesh territory for
which India will have to reach an agreement with that country. However, this will benefit
Bangladesh also because a part of water available in the feeder canal can be used for irrigation or
for augmenting the water flow Padma river. It is estimated that when completed, this project will
be able to divert about 1,150 cumecs of water from the Brahmaputra at Dhubri to the Ganga at
Farakka. It will require lifting of water by 10 to 15 metres at suitable intermediate sites.
Experts in various allied fields have grave misgivings regarding the feasibility of this
project in view of huge expenditure involved, resources crunch and lack of proper understanding
between the concerned neighbouring countries.
National water grid.
This is the largest ever thought of project of linking all major rivers of India with the help
of a network of canals. The idea of linking rivers across India to solve flood, drought, power and
other water related problems of the country is not new. It has been mooted in different forms for
the last few decades. Sir Arthur Cotton, who pioneered the development of water resources in
Southern India from 1839 onwards, had proposed a plan for interlinking of Indian rivers for

Sanjeev Degree College Commercial Geography
S K V S L Narasimha Raju Page 98
inland navigation. A small portion of the plan was implemented but was abandoned later in
favour of railways. In 1974, the famous engineer of Mumbai, captain Deen Shaw, presented his
scheme to link Indian rivers by constructing a chain of canals. In 2002, the hon'ble Supreme
Court of India ordered the central government to complete the project in 10 years. Keeping in
view the order of the supreme court, the Government of India constituted a committee in
December 2002 to prepare a detailed report of the project. The project envisages linking 26
major rivers of India by constructing 30 different link canals. The national perspective plan as
well as the NWDA studies have two components of the project.
1. Himalayan rivers development component
2. Peninsular rivers development component
These two can be linked on the Mahanandi
1. The Himalayan Rivers Development Component
The Himalayan Rivers Development Component envisages construction of storage
reservoirs on the principle tributaries of Ganga and Brahmaputra in India, Nepal and Bhutan
along with interlinking Canal systems to transfer surplus flows of the eastern tributaries of the
Ganga and the west, apart from linking of the main Brahmaputra and its tributaries with the
Ganga and the Ganga with the Mahanandi. The Himalayan Rivers Development Component
shall provide additional irrigation and generation of hydropower, besides providing substantial
flood control in the Ganga and Brahmaputra basin.
The Himalaya Component is based on multipurpose storage giving, benefits of
hydropower and flood control, besides diverting water to downstream links. NWDA have taken
up 11 Himalayan links for study. Under the Himalayan Component, NWDA has already
completed water balance studies at 19 diversion points, top of sheet studies of 16 storage sites
and 19 link alignments and prepared pre feasibility reports of 14 proposed water transfer links.
The feasibility report for these links have already been completed.
2. The Peninsular Rivers Development Component
This component has four major parts but major important are interlinking the Mahanadi-
Godavari-Krishna-Cauvery and the diversion of a few West flowing rivers towards the
peninsular basin across the Western Ghats. It will ease the water situation in the Peninsula. The
link from Mahanandi would require construction of Manibhadra Dam. The Mahanandi-Godavari
link would be 9,390 kilometres long and cut across east flowing drainages. It does not involve
any lifting of water. Even after meeting downstream basin requirements, the Godavari has

Sanjeev Degree College Commercial Geography
S K V S L Narasimha Raju Page 99
surplus water in this reach which can be stored in the available dam site of Inchampalli. After
irrigating about 11.5 lakh hectares of dry land between the Godavari and the Krishna, there will
still be about 3 kilometre cube water left which can be transferred to Cauvery basin and relieve it
from occasional shortages, It will also help to resolve the bitter dispute between Tamilnadu and
Karnataka over the water of Cauvery river.
Under the Peninsular Component, the agency has already completed data collection and
the balance studies of 137 basin/sub basins and at 52 identified diversion points, toposheet
studies of 58 identified storage and 18 toposheet studies of link alignments, and prepared pre-
feasibility reports of 17 water transfer links. Presently, the work of field surveys and
investigations for preparation of feasibility reports of link schemes in on hand. Feasibility
reports of these links have already been completed.
The implementation of the intebasin water transfer link schemes can be taken up in a
phased manner depending on the priorities of the Government and availability of funds.
If and when completed, this project will give following benefits:
i) Surplus water from the eastern rivers will be transferred to west deficit areas of central, south
and western parts of the country.
ii) Flood problem, particularly in Bihar and Assam will be solved to great extent.
iii) 34,000 megawatt hydroelectricity would be produced. This electricity will be used for
irrigation and other purposes.
iv)The implementation of the programme of interbasin water transfer is expected to provide
additional irrigation benefit of 35 Mha which will be over and above the ultimate irrigation
potential of about 140 Mha envisaged from major, medium and minor irrigation projects.
v) Chronically drought affected areas will get sufficient water for irrigation, drinking and other
purposes.
vi) As much as 1,275.74 billion cubic metre (BCM) water wastefully flowing in rivers
originating in the glaciers of the Himalayas will be properly used.
vii) The project will provide ample opportunities for inland navigation and thus reduce pressure
on rail and road transport.
viii) It will be of great help in resolving inter state water disputes.

Sanjeev Degree College Commercial Geography
S K V S L Narasimha Raju Page 100
ix) A minimum flow of water will be ensured in water deficit rivers.
However, the project has been criticized on several grounds and several experts have
questioned even the feasibility of such a gigantic project. Following are some of the objections
raised against this project.
i)The project will involve a huge cost ₹ 5,60,000 crore which amounts to a quarter of the
country's current GDP. A developing country like India can hardly afford such a huge
investment in just one project.
ii)The project will entail the construction of several major dams and lengthy canals cutting across
various river basins. This is not an easy task and will require engineering skills of high calibre.
iii)The project aims at transferring water from water surplus rivers to water deficit rivers. But
hydrologists believe that there are hardly any surplus waters anywhere in the country.
iv)The construction of big dams and long canals will destroy forested areas, fertile soils and
agriculture lands and disturb in psychological balance.
v)No provision worth the name, has been made to resettle the displaced people. An estimate of
over 30 million people have been displaced by development projects since independence.
vi)Some experts have expressed doubt about the capability of the project. For example, if water
available in the deficit Sabarmati basin is only 300 cubic metres per capita (CMPC), then it is
difficult to comprehend how a further 1,400 CMPC can be brought from a surplus base to solve
the problem.
vii)Alternative measures of managing and conserving water resources can be proved to be more
useful than the proposed project of interlinking the rivers. According to the Central Ground
Water Board(CGWB), 37 BCM of groundwater can be recharged locally at only ₹24,500 crore.
Then what is the validity of investing ₹5,60,000 crore in obtaining a mere 175 BCM for
interlinking of rivers.
ix)Neighbouring countries like Bangladesh and Nepal have not been consulted althrough these
countries along with China,would be affected by the project.
Ken-Betwa river interlinking
Interlinking of Ken with Betwa in Uttar Pradesh and Madhya Pradesh is aimed at
transferring surplus water from river Ken to Betwa river. It will ensure water to drought prone

Sanjeev Degree College Commercial Geography
S K V S L Narasimha Raju Page 101
areas of Uttar Pradesh and Madhya Pradesh. Besides it would provide annual irrigation to about
6 lakh hectares of land and drinking water facility to 13.42 lakh people of both the concerned
States. The project was initially mooted in early 1980s. The NITI Aayog ( National Institute of
Transforming India) has recommended that Madhya Pradesh contribute 40% of the project cost,
with centre contributing the remaining 60% cost. It will submerge about 10% of the Panna Tiger
Reserve in Madhya Pradesh. A total of 10 villages consisting of 1,585 families are likely to be
affected by the project.
Interlinking of rivers-experience in Andhra Pradesh
Andhra Pradesh has become the first state in India to achieve interlinking of rivers. The
first interlinking is that of Godavari and Krishna rivers through Pathiseema Lift Scheme. The
interlinking of the Godavari and the Krishna rivers become a reality with nearly 2,400 cusecs of
Godavari water reaching the Ferry on its way to Prakasam Barrage about 15 km away. The
water flow will reach 8,000 cusecs when more motors are switch on. Water into the Polavaram
Right Main Canal(RMC) is lifted at pathiseema. The water has to travel 174 km from
Pathiseema to reach Prakasam Barrage. Polavaram RMC is designed to hold upto 16,000 cusecs
of water flow. Thus Polavaram RMC is capable of bringing 16,000 cusecs of Godavari water
into the Krishna river near Vijayawada. It will be of great help to the farmers in the drought
prone Rayalaseema region and could serve 2,59,000 families at 150 litre per day for 365 days.
The Polavaram project will be completed by 2019. The development is seen as a boon for
farmers, mainly those in Krishna and Guntur districts.
The 800 km by Mahanadi-Godavari interlinking project would link River Sankosh.
Krishna-Pennar(Penna)-Cauvery link
This is aimed at reducing imbalance in water availability between different regions of
Andhra Pradesh. It forms a part of the scheme to transfer of surplus waters of Mahanadi and
Godavari rivers to deficit basins of Krishna, Pennear, Cauvery and Vaigai. The diversion of the
water is proposed by utilising the existing Krishna (Srisailam) reservoir, and Srisailam Right
Main Canal (SRMC). The total length of the link canal is about 204 km out of which 180 km is
through natural streams. Four mini hydel schemes are proposed enroute of the conveyance
system utilising the natural falls of streams Neppulavagu,Galeru and Kunder. The total installed
capacity of these hydel projects would be 17 MW. It is supposed to be one of the biggest river
linking projects in the country. The project comprises two stages. River Krishna will be
connected with Pennar and following it by kinking Pennar with Cauverh. The length of the canal
will be 587.17 km and its carrying capacity will be 230 cusecs. The total area irrigated will be
2,58,334 hectares. The project is estimated to cost about ₹ 6,600 crore.

Sanjeev Degree College Commercial Geography
S K V S L Narasimha Raju Page 102
Emerging water problems
There are several problems regarding the water resources. The main problems of water
resources are its availability, use, quality and management. If the present trend of water
requirement and its wastage continues, the day is not very far off when India will face crucial
shortage of water.
Deterioration of water quality
Water quality refers to purity of water, or water without unwanted foreign substances.
Water gets polluted by foreign matters such as micro-organisms, chemicals, industrial and other
wastes. Such matters deteriorate the quality of water and render it unfit for human use. Quality
of water suffers from its large scale population almost throughout the country. It has been
estimated that about three-fourths of the surface water in India is polluted. Most of the rivers are
carrying polluted water . We have been dumping all sorts of waste matter into our rivers
Industrial waste, municipal sewage, residues of chemical fertilizers etc. These wastes are both,
solids as well as in soluble form. Cities and towns generate a lot of sewage. Most of this sewage
is dumped into water courses without any treatment rendering the natural water course
downstream unfit for drinking and even for bathing. About 14 river basins have been affected by
untreated city sewage. Large scale pollution of rivers is turning them into septic drains posing
serious threat to the health of millions of people.
Industries are also responsible for water pollution. There are about 150 leather factories
in Kanpur which discharge more than 5.8 million litres of waste water in the Ganga river
everyday.
Indiscriminate use of chemical fertilizers, pesticides, insecticides etc to increase the form
production has further aggravated the problem of surface and groundwater pollution. The
residuals of fertilizers and other chemicals reach the waterbodies and contaminate them.
Conservation of water resources
Conservation of water resources has become very essential due to its short supply,
increasing demand, large scale pollution and its uneven distribution in time and space.
Following three steps are necessary for conservation of water resources.
i)Developing water saving technologies and methods.
ii)Preventing pollution of water.

Sanjeev Degree College Commercial Geography
S K V S L Narasimha Raju Page 103
iii) Encouraging watershed development, rainwater harvesting, water recycling and reuse and
conjunctive use of water for sustaining water supply in long run.
Prevention of water pollution
As mentioned earlier, both surface and groundwater are polluted in most parts of country.
The Central Pollution Control Board (CPCB) in collaboration with State Pollution Control
Boards has been monitoring water quality of national aquatic resources at 507 stations.
According to their investigations, organic and bacterial contamination are the major causes of
pollution of river waters. The Yamuna river is the most polluted river in the country between
Delhi and Etawah.
Similarly, groundwater is also polluted primary due to high concentration of heavy/toxic metals,
fluoride and nitrates at different parts of the country.
The government made several legislative provisions for preventing water pollution. Some
such provision are Water (Prevention and Control of Pollution) Act 1974, and Environment
Protection Act, 1986. Unfortunately these provisions have not been implemented effectively. In
view of all these failures it has become necessary to generate public awareness about importance
of water and the impact of its pollution.
Recycle and Reuse of water
Availability of fresh water can be improved by recycling and reusing water. Water of
inferior quality such as claimed waste water can be used in industries for cooling and fire
fighting. In urban areas water after bathing and washing utensils and vehicles can be used for
gardening. This helps in conserving water of better quality for drinking. The practice of
recycling and reusing water is at its initial stage but there are vast possibilities of replenishing
water through recycling.
Watershed Management
Watershed is geographical are that drains to a common point, which makes it an ideal
planning units for conservation of soil and water. It may comprise one or several villages,
contain both arable and non-arable lands, various categories of land holdings and farmers. The
watershed approach enables a holistic development of agricultural and allied activities, such as
horticulture, agro-forestry and silviculture(forests).

Sanjeev Degree College Commercial Geography
S K V S L Narasimha Raju Page 104
Watershed development is a very important device to conserve water resources, increase
agricultural production and stop ecological degradation. In this way it improves the living
conditions of the people.
The Central and State Governments as well some non government organisations are
working on watershed development programmes. One such programme is Haryali which is
sponsored by the Central Government. Its primary aim is to help the rural people in conserving
water for drinking, irrigation, fisheries and afforestation.
Neeru-Meeru (water and you) in Andhra Pradesh and Arvary Pani Sansad in Alwar
district of Rajasthan are two important programmes of water harvesting. Under these
programmes various steps have been taken to harvest water for the benefit of the common man.
Several structures like percolation tanks, check dams etc have been constructed for water
harvesting.
Tamil Nadu is one state which had made it mandatory to have water harvesting structures
in the houses. No buildings is allowed to be constructed without making provision for water
harvesting structures.
Water harvesting movement is still in the nascent stage and there is urgent need to
generate public awareness regarding it.
Rainwater Harvesting
Large scale depletion of groundwater is a very serious problem which must be tackled
urgently. Shortage of water is felt in rural areas for irrigation and or domestic as well as
industrial use in urban areas. One of the methods of solving the problem is rainwater harvesting.
It is technique of increasing the recharge of groundwater by capturing and storing rainwater
locally in subsurface water reservoirs to meet the household needs.
Objectives of the rainwater harvesting are to:
1.Meet the ever increasing demand for water,
2.Reduce the runoff which chocks drains,
3.Avoid the flooding of roads,
4.Augment the groundwater storage and raise the water table,

Sanjeev Degree College Commercial Geography
S K V S L Narasimha Raju Page 105
5.Reduce groundwater pollution,
6.Improve the quality of groundwater,
7.Reduce the soil erosion, and
8.Supplement domestic water requirement during summer and drought.
There are so many low cost techniques which can be used to recharge the groundwater
aquifers. Some of the important techniques are roof water harvesting, recharging of hand pumps,
recharge through abandoned dug well, recharge through trench and bands and stop dams on
small rivulets. Techniques or rainwater harvesting are not new to India. Rainwater has been
harvested in India since antiquity as is amply proved by the following evidences.
1.There are evidences of advanced water harvesting systems like canals, tanks, embankments
and wells.
2.In hills and mountains, rainwater harvesting from rooftops and springs were carried over long
distances with the help of bamboo pipe.
3.In arid and semi arid regions, structures like wells and step wells were built to tap groundwater
aquifers. Rain-water harvesting from rooftops used artificially created catchments, which
drained water into artificial 'kunds' or tanks in Rajasthan.
4.Construction of tanks throughout the country has been very popular measure of conserving
rainwater.