unit 1 measurements. objectives 1.11.1 convert between scientific notation and standard notation...
TRANSCRIPT
Unit 1 Measurements

Objectives1.1 Convert between scientific notation and standard
notation1.2 Define and identify significant digits including
being able to round and perform mathematical operations (add, subtract, multiply and divide)
1.3 Know and use the metric system including their prefixes and symbols
1.4 Use dimensional analysis to convert between units1.5 Use measuring devices with precision and accuracy1.6 Create and interpret graphs by calculating a line of
best fit and using the line to extrapolate and interpolate data
1.7 Define and calculate density

1.1 Convert between scientific notation and standard notation
Often in science, numbers are either very large or very small.
We are used to having numbers in standard notation.
However, scientific notation can be a easier way to represent these large or small numbers.
Scientific NotationA number in scientific notation uses a
mathematical computation to make a number easier to write.
Numbers in scientific notation will always have one number in front of the decimal point.
The remaining significant digits are listed after the decimal point.
To represent the magnitude of the number, the number is multiplied by ten to some power.
Converting a number from standard notation to scientific notation
Assume you wanted to convert 5600 to scientific notation.◦First, determine the sig. digits and put the
decimal point after the first sig. digit 5600 has two sig. digits so it should begin with 5.6
◦Second, determine how many times you had to move the decimal point. To get to 5.6, the decimal point was moved 3 times
to the left.
◦Third, multiple the number by ten to the number of times the decimal point was moved. 5600 in scientific notation would be 5.6 x 10³

1.2 Define and identify significant digits
Significant digits show precision of a number.
Each measurement device precise only to a certain extent.
Being able to accurately read measurement devices requires an understanding of which digits are significant.

Identify when zeros are considered significant
Determining what makes a digit significant can be decided by four guidelines.◦All numbers 1-9 are significant.◦Any zero in between two nonzero numbers
is significant.◦Any zero before a nonzero number is not
significant.◦Any zero at the end of a number is
significant if a decimal point is written in the number.Examples

Significant figure examples
1. 25 has two significant figures because both numbers are nonzeros.
2. 205 has three significant figures because the zero is in between nonzero numbers.
3. 0.0025 has two significant figures because all of the zeros come before the nonzero numbers
4. 2500 has two significant figures because there is no decimal point.
5. 250.0 has four significant figures because there is a decimal point.
Return

Round numerical values to correct significant digits
Rounding to a specific significant digit requires the identification of the first significant digits in a number.
Assume we wanted to round 25653 to two significant digits. We first must decide what the first two significant
digits would be. In this case, it would be the 2 and the 5.
We then look one more digit to the right. This will tell whether we round up or down. If the number is 0-4 round down. If the number is 5-9 round up.
Since our number is 6, we will round up. Therefore, the number to two significant digits would
be 26000
Practice

Rounding Significant figures practice
Round the following numbers to 3 significant figures:◦34689◦0.5059◦0.00426◦825089◦4.11206◦0.008253
34700
0.5060.00426825000
4.11
0.00800
Return

Calculate using correct significant digits
Mathematical calculations are often performed in science
The main four computations are adding, subtracting, multiplying, and dividing.
It is important to make sure your answer to these calculations represents the correct precision of the computation. ◦i.e.: If I add 10. ml of water from one
beaker to another beaker that holds 2500 ml.

Calculate using correct significant digits
Adding and subtracting.1. Determine the number of significant digits in
each of the original numbers.2. Looking at the original numbers, determine
which one its last significant digit furthest to the left.
3. Perform the mathematical computation. 4. Round your answer to the place that was
determined from step two.
Example

Adding and subtracting significant digits Example
Add 5.678 to 5.2◦Step 1: Determine the significant digits in each number.
5.678 has 4 sig. digits 5.2 has 2 sig. digits
◦ Step 2: Determine the place of the last significant digit 5.678: thousandth place 5.2: tenths place (round your answer to this
place)
◦ Step 3: Perform the mathematical computation
10.878
◦ Step 4: Round to the correct place 10.9 would be the final answer
Return

Calculate using correct significant digits
Multiplying and dividing1. Determine the number of significant
digits in each number.2. Decide which has fewer significant
digits.3. Perform the mathematical
computation4. Round your answer to the significant
digit determined in step two.Example

Multiplying and dividing significant digits example
Divide 5.02 by 3.557◦ Step 1: Determine sig. digits
5.02 has 3 sig. digits 3.557 has 4 sig. digits
◦ Step 2: Determine which one was fewer
5.02 has fewer
◦ Step 3: Perform the computation 5.02/3.557 = 1.411301659
◦ Step 4: Round to the correct digit 1.41 would be the correct answer.
Return

1.3 Know and use the metric systemTo give consistency to science
measurements, the scientific community has agreed to use the metric system.
The metric system is a base 10 system and uses a series a prefixes to distinguish the magnitude of each measurement.Prefixes

Metric PrefixesKilo 1000 kHecta 100 hDeka 10 DBase 1Deci 0.1 dCenti 0.01 cMilli 0.001 mMicro 0.000001 µNano 0.000000001n
Return

The base units of the metric system
Length meter Volume liter Mass kilogram
(1000 grams) Temperature Kelvin Time Seconds Amount mole

Converting metric unitsWhat makes the metric system
useful is that converting can be as simple as multiplying or dividing by a factor of 10.
Using the prefixes, you can determine the conversion factor and then use dimensional analysis to convert.Example

Metric Conversion ExampleSuppose you wanted to convert
4500 meters to kilometers.By looking at the prefix list, we
know that 1000 meters = 1 kilometer
1 km
1000 m= 4.5 km4500 m x
Because the conversion factor is set, we do not use these numbers to determine the number of significant digits in our answer.
Return

1.4 Use dimensional analysis to do conversions
Often when working with measurements, it is necessary to use different units. ◦For instance, if I want to measure a
book, I would probably use inches but if I wanted to measure a road, I would use miles.
At times, it will be necessary to convert between different units and the technique we use to do that is known as dimensional analysis.
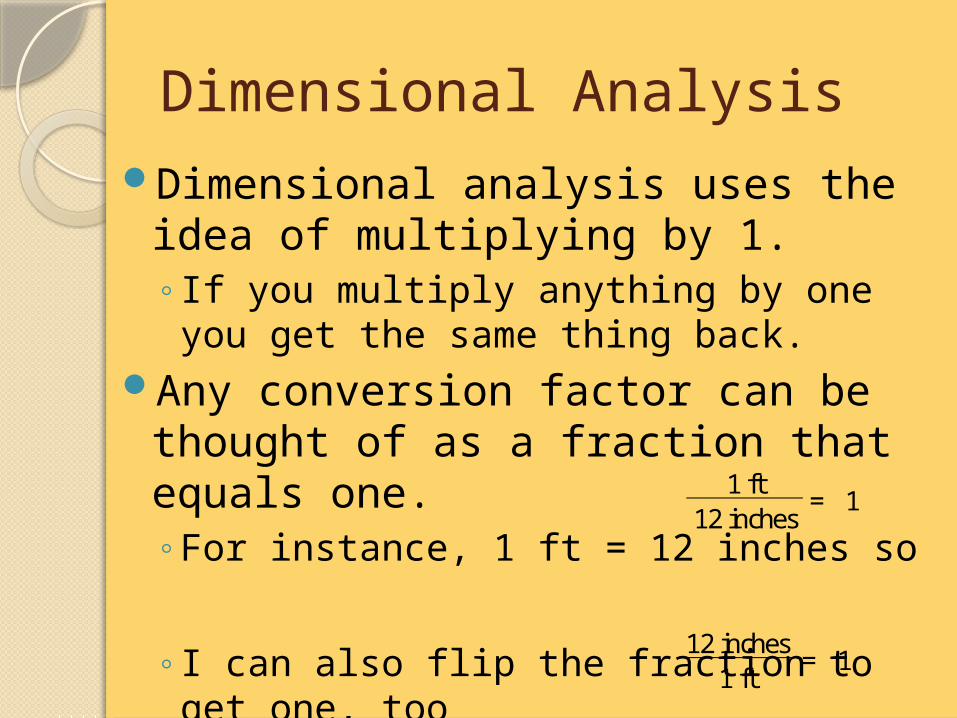
Dimensional AnalysisDimensional analysis uses the idea
of multiplying by 1. ◦If you multiply anything by one you get
the same thing back.Any conversion factor can be
thought of as a fraction that equals one.◦For instance, 1 ft = 12 inches so
◦I can also flip the fraction to get one, too
1 ft12 inches
1=
12 inches1 ft
1=
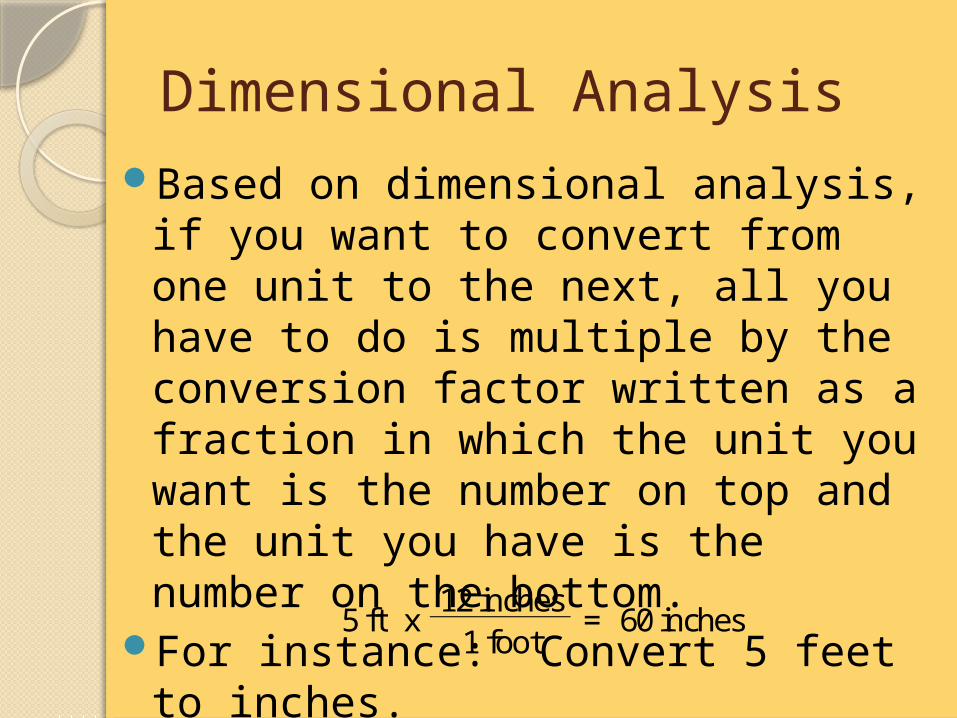
Dimensional AnalysisBased on dimensional analysis, if
you want to convert from one unit to the next, all you have to do is multiple by the conversion factor written as a fraction in which the unit you want is the number on top and the unit you have is the number on the bottom.
For instance: Convert 5 feet to inches.
12 inches1 foot
60 inches=5 ft x

1.5 Use measuring devices with precision and accuracy
Science uses several different measuring devices.
It is important to know how to read each to the correct precision and accuracy.

Use measuring devices with precision and accuracy
When reading a measuring device, there are two aspects that you should look for◦To what place can you read with 100%
certainty
◦To what place can you estimate This reading is one digit to the right of the
digit with 100% certainty.

Reading GlasswareLiquid in glassware will form
a curved surface.You want to read the bottom
of the curve (meniscus)Next, determine what digit
you can read with 100% accuracy.◦For this piece of glassware, the
increments are increasing by 1◦Therefore, I can say with 100%
certainty that I can read this piece of glassware to the one’s place.

Reading GlasswareThe estimated reading is
one digit to the right of the place with 100% certainty.◦For this piece, since the
one’s place is 100% certain, we can estimate to the tenth’s place.
Therefore, the reading on this piece would be 32.6 units of volume.

Reading GlasswareNot all glassware increases in
increments of 1, 10, 100, etc.The piece to the right increases by
25.Looking for100% certain reading
◦ In this case, it would be the 100s place.
◦ It is not possible to read the 10s place with certainty the way this piece is marked.
The estimated reading would be the 10s place.
The reading on this piece of glassware would be 30 units of volume.
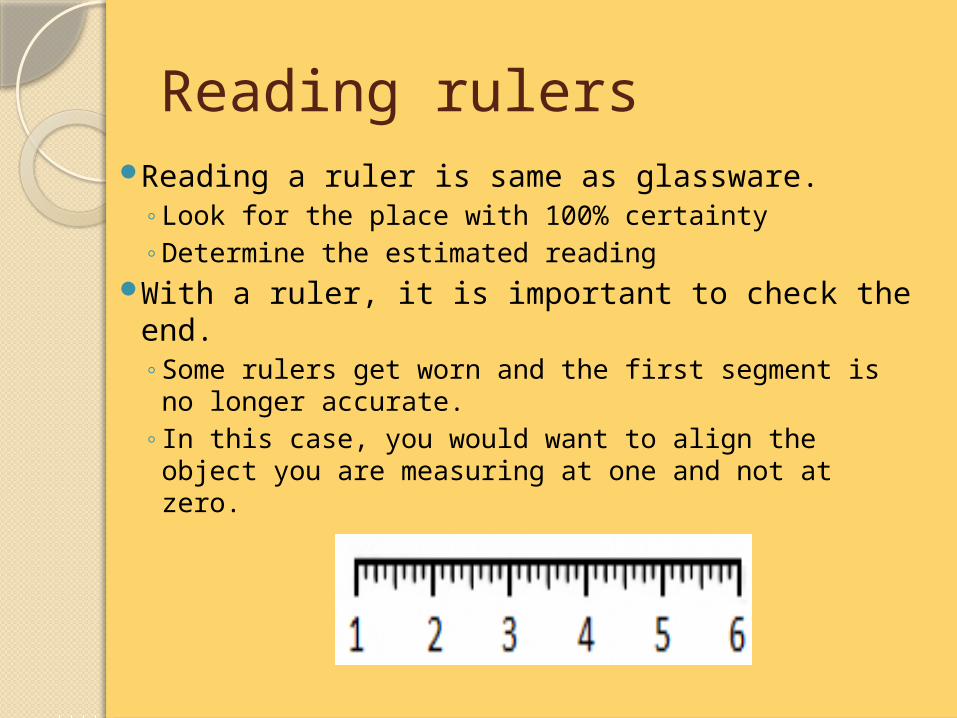
Reading rulersReading a ruler is same as glassware.
◦Look for the place with 100% certainty◦Determine the estimated reading
With a ruler, it is important to check the end. ◦Some rulers get worn and the first segment is no
longer accurate. ◦ In this case, you would want to align the object
you are measuring at one and not at zero.
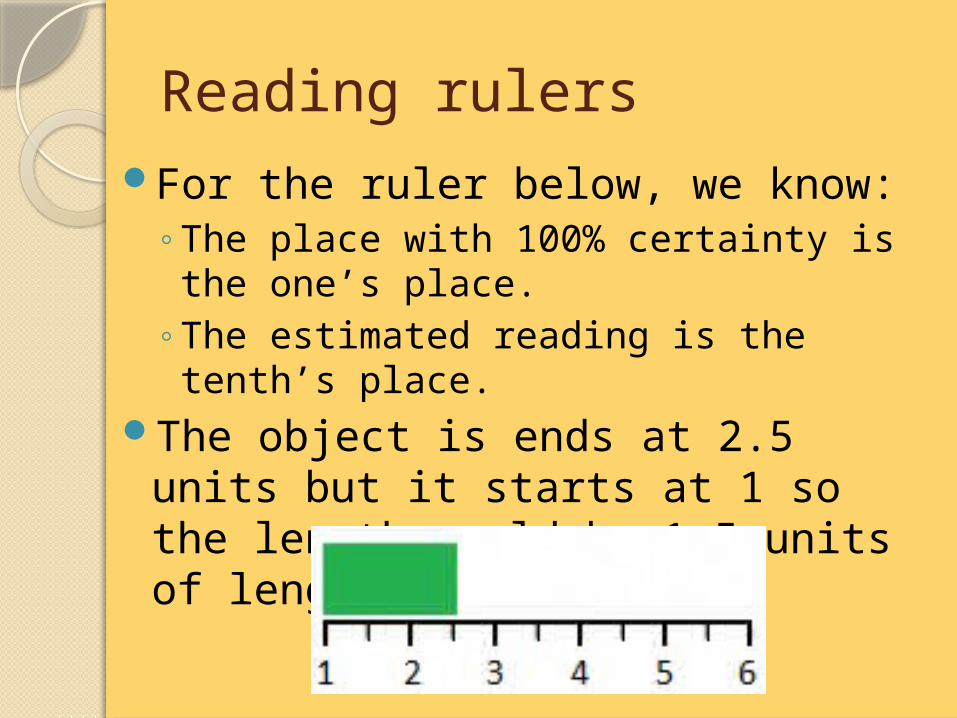
Reading rulersFor the ruler below, we know:
◦The place with 100% certainty is the one’s place.
◦The estimated reading is the tenth’s place.
The object is ends at 2.5 units but it starts at 1 so the length would be 1.5 units of length.
1.6 Create and interpret graphs
Often in science, data is collected and graphed.
When looking at these graphs, it is the trend that scientist are looking for.
To determine the trend, a line of best fit is aligned to the data, and the equation for this line is calculated.

Graphing data pointsSteps to creating a graph:
◦Title the graph◦Label the y-axis and x-axis◦Assign numerical values to each axis◦Plot each point.
Sample Concentration1 0.22 1.03 1.44 1.65 2.36 2.7
Concentration Graph
Sample
Conce
ntr
ati
on
1 2 3 4 5 6
0.4
1.2
2.0
2.8

Adding a line of best fitDrawing the line:
◦Draw a line to fits the trend.◦It can but does not have to touch any
data point.◦It must be straight.
Sample Concentration1 0.22 1.03 1.44 1.65 2.36 2.7
Concentration Graph
Sample
Conce
ntr
ati
on
1 2 3 4 5 6
0.4
1.2
2.0
2.8

Calculating the equationA line of best fit will follow the
equation y=mx+b.◦m represents the slope of the line.◦b represents the y-intercept of the line.
To calculate this equation, two data points are required. ◦These points should be directly on the
line.◦It is best to choose two brand new points.◦It is also a good idea to select your points
where two of the gridlines meet.
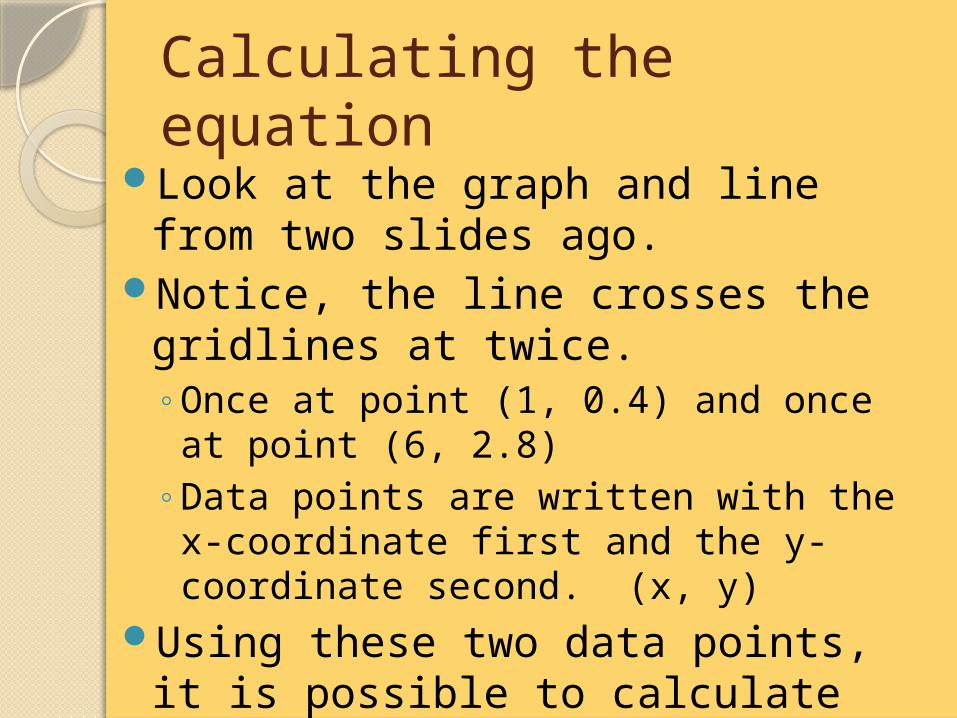
Calculating the equationLook at the graph and line from two
slides ago. Notice, the line crosses the
gridlines at twice.◦Once at point (1, 0.4) and once at point
(6, 2.8)◦Data points are written with the x-
coordinate first and the y-coordinate second. (x, y)
Using these two data points, it is possible to calculate the line of best fit.
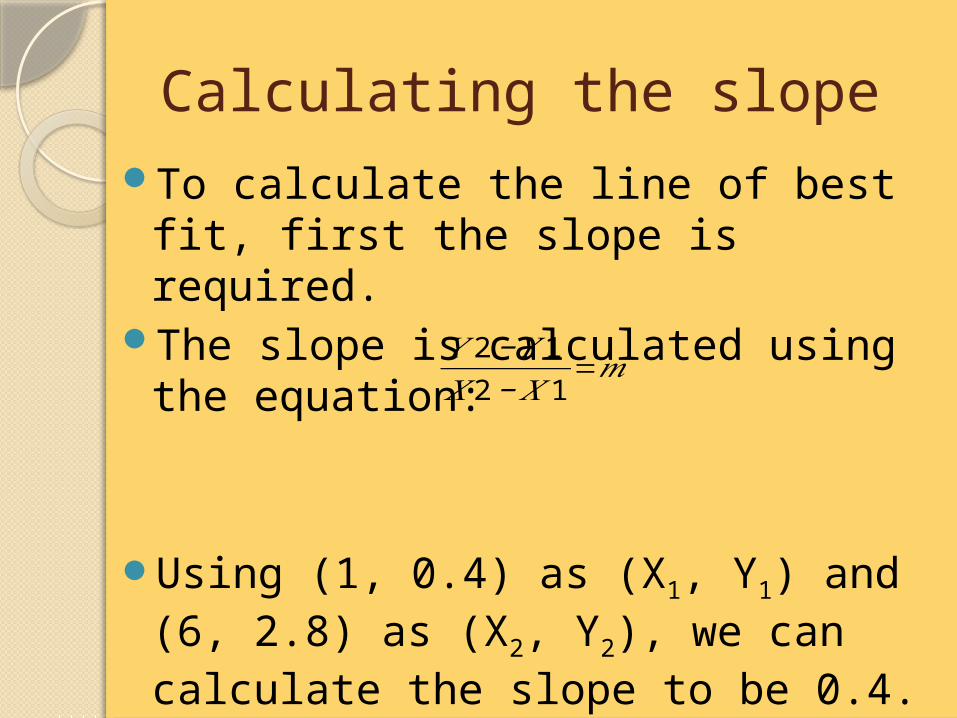
Calculating the slopeTo calculate the line of best fit, first
the slope is required. The slope is calculated using the
equation:
Using (1, 0.4) as (X1, Y1) and (6, 2.8) as (X2, Y2), we can calculate the slope to be 0.4.
Now that the slope is determined, we can put it into the equation to get y=0.4x+b.
𝑌 2−𝑌 1𝑋 2−𝑋 1
=𝑚

Calculating the y-interceptWith the equation y=0.4x+b, we can
now calculate the y-intercept. To do this, we will take one of the data
points we used to calculate the slope and substitute it for y and x.
For this example, we will choose (1, 0.4)We put the 0.4 in for y and 1 in for x so
our equation looks like:0.4 = 0.4(1)+b
This would be solved to so b=0 which means the y-intercept is zero.

The line of best fit.Now that we know what the slope
and y-intercept are equal to, we can write the equation for the line of best fit.
The equation should still contain the y and x variables and will look like:
y=0.4x + 0 or y=0.4xWith the line of best fit equation,
you can now use it to solve for unknown variables.

Using the line of best fitGenerally in science, the line of best fit
is created using a set of known standards.
The purpose is to calculate unknowns using the line.
Assume, a sample was analyzed and was determined to have a concentration of 1.5 and I wanted to know how close it was to a known sample.
We can use our line to determine the answer.

Using the line of best fitThe line of best fit gave the equation
y=0.4x.We know the concentration is 1.5
and that concentration is on the y-axis.
Therefore, we will put the 1.5 in for y:1.5=0.4x
Solve for x and we get 3.75 but with significant digits, it would be 4.
Therefore, a concentration of 1.5 is close to sample #4.

1.7 Define and calculate density
Density describes how much mass can be placed in a certain volume.
Density (D) compares the ratio of mass (m) to volume (V) using a mathematical calculation:

Define and calculate density
To get a better understanding of density, observe the two containers to the right.
Notice they have the same volume.
Notice how the top container holds 20 particles and the bottom only holds 10.
Because there are more particles in the same volume, the top container is more dense.

Define and calculate density
Still using the containers to the right, let’s assume:◦the height and width of the
box is 1.0 units (width not drawn),
◦the length is 1.4 units,◦each red circle is 1.0 grams.
We can calculate the density by determining the volume and mass of each container.

Define and calculate density
To determine the volume, we will take length x width x height:1.0 units x 1.0 units x 1.4 units
1.4 units3
The mass for the top would be 20. grams and the bottom would be 10. grams.
Since density is mass divided by volume, ◦ the top has a density of 14 g/units3
◦ the bottom has a density of 7.1 g/units3.

This concludes the tutorial on measurements.
To try some practice problems, click here.
To return to the objective page, click here.
To exit the tutorial, hit escape.

Definitions-Select the word to return to the tutorial
Accuracy◦The closeness of the measurement to
the correct valuePrecision
◦The number of significant figures a device can be reliably read to
◦The repeatability of a measurementStandard notation
◦The common way to write a number i.e.: 25