unit - 1 : introduction to cost accounting - · pdf file1 unit - 1 : introduction to cost...
TRANSCRIPT

1
Unit - 1 : Introduction to Cost Accounting
Structure of Unit:
1.0 Objectives1.1 Introduction1.2 Branches of Accounting1.3 Emergence of Cost Accounting1.4 Nature1.5 Advantages1.6 Importance1.7 Installation of Cost Accounting System1.8 Essential of a Good Cost Accounting System1.9 Methods1.10 Techniques1.11 Cost Accounting vs. Financial Accounting1.12 Limitations of Cost Accounting1.13 Summary1.14 Self Assessment Questions1.15 Reference Books
1.0 Objectives
After completing this unit, you will be able to:
To assertion and control cost. Determining selling price. Facilitating preparation of financial and other statements. To reduce cost. To provide base for operating policy.
1.1 Introduction
In the initial stages cost accounting was merely considered to be a technique for ascertainment of costof products or services on the basis of historical data. In course of time due to competitive nature ofthe market, it was realized that ascertainment of cost is not as important as controlling costs. Hence, costaccounting started to be considered more as a technique for cost control a s compared to cost ascertainment.Due to technological development in all fields, now cost reduction has also come within the ambit of costaccounting. Cost accounting is thus concerned with recording, classifying and summarizing costs fordetermination of costs of products or services, planning, controlling and reducing such costs and furnishingof information to management for decision making.
Meaning and Definitions of Cost Accounting
“Cost accounting is a quantitative method that accumulates, classifies, summarizes and interprets informationfor three major purposes: (in) Operational planning and control ;( ii) Special decision; and (iii) Productdecision.” -Charles T. Horngren

2
“Cost accounting is the process of accounting for costs from the point at which the expenditure is incurredof committed to the establishment of its ultimate relationship with cost units. In its widest sense, it embracesthe preparation of statistical data, the application of cost control methods and the ascertainment of theprofitability of the activities carried out or planned is defined as the application of accounting and costingprinciples, methods and techniques in the ascertainment of costs and the analysis of saving and/or excess ascompared with previous experience or with standards.” – Institute of Cost and ManagementAccountants of London
“Cost accounting is defined as the application of costing and cost accounting principles, methods andtechniques to the science, art and practice of cost control and the ascertainment of profitability. It includesthe presentation of information derived therefore for the purposes of managerial decision making. –Wheldon
Cost accounting thus provides information to the management for decision of all sorts. It serves multiplepurposes on account of which it is generally indistinguishable from management accounting or so-calledinternal accounting. Wilmot has summarized the nature of cost accounting as “the analysing, recording,standardizing, forecasting, comparing, reporting and recommending” and the role of a cost account as thatof “a historian, news agent and rophet”.
1.2 Branches of Accounting
There are seven branches of accounting:-
a) Financial Accounting: This is called original accounting, which is mainly confined to the preparationof financial statement for the various concern parties and financial institutions.
b) Cost Accounting: The process of accounting for cost which begins with the recording of incomeand expenditure or the bases on which they are calculated and ends with the preparation of periodicalsstatements and reports for ascertaining and controlling cost.
c) Management Accounting: Management accounting is a distinctive form of resource managementwhich facilitates management’s ‘decision making’ by producing information for managers withinorganization.
d) Inflation Accounting: This accounting system do not consider the cost constant at every timebecause the price of a commodity change with time to inflation and decline purchasing power ofmoney.
e) Social Accounting: This deals with the application of double entry system of book keeping tosocio-economic analysis at the preparation, estimation and interpretation of nation and internationalincome and balance sheet.
f) Value –Added Accounting: In this system income is measured by the value added by a firm in aparticular period. It is the difference between the value of the product and the cost of raw material,stores and any brought out component used for production.
g) Human Resource Accounting: Human Resource accounting is the measurement of the cost andvalue of people for the organization or it is the process of identifying and measuring data abouthuman resources and communicating this information to interested parties.
1.3 Emergence of Cost Accounting
The Institute of Cost and Works Accountants of India (ICWAI) was established as a company limited byguarantee for the development of cost accounting in India. The main purpose of this to develop the cost
3
accounting as a profession. The maintenance of cost accounting records became mandatory since 1965,after the addition of Sec.209 (1) (d) in the companies act 1956.
The Institute of Cost and Works Accountants of India has recently issued cost accounting standard (CAS)1 to 4 also to understand the subject in a better manner as follows :-
CAS 1 - Classification of costCAS 2 - Capacity determinationCAS 3 - Allocation and apportionment of overheadCAS 4 - Cost of production for captive consumption
1.4 Nature
Cost accounting is a practice of cost control which is as follows:-
(a) Cost accounting is a branch of systematic knowledge that is a discipline by itself. It consist its ownprinciples, concepts and conventions which may vary from industry to industry.
(b) Cost accounting is a science and arts both. It is science because it is a body of systematic knowledgerelating to a wide variety of subject and an art because without the efficiency and experience of costauditor it is not possible to use costing techniques efficiently.
1.5 Advantages
A good system of costing is the technique of controlling the expenditure and helps bringing economy inproduction, so it serves the needs of a large section of people in the following ways.
(a) Benefits to the Management: The information revealed by cost accounting aims at mainly assistingthe management in decision making and optimizing profits. Besides this there are certain advantagesof cost accounting to the management i.e. it helps in price fixation, in revealing profitable andunprofitable activities, idle capacity, in controlling cost and also helps in inventory control.
(b) Benefits to the Employees: Cost accounting introduces wage scheme, bonus to the efficient &sincere employees which in turn increasing productivity, profitability and lowering cost.
(c) Benefits to Creditors: The better management of finance through cost accounting leads to timelydebt servicing by company in the form of repayment of loan and payment of interest. To stay andgrow in competition and for judging soundness of present and perspective borrower and costreports give better picture of efficiency profit prospectus and capacity.
(d) Benefits to the Government: Cost accounting enables the Govt. to prepare plans for economicdevelopment of the country, to make policies regarding taxation, excise duty, export, price, ceiling,granting subsidy etc.
(e) Benefits to Consumers/Public: Cost accounting helps consumers in getting goods of betterquality at reasonable price.
1.6 Importance
Cost accounting gives information and reports to the management in the following ways:-
(a) Control of Material Cost –Cost of material is a major portion of the total cost of a product. It canbe controlled by regular supply of material and spares for production, maintaining optimum level offunds in stocks of materials and stores.

4
(b) Control of Labour Cost: If workers complete their work within the specified time cost of labourcan be controlled.
(c) Control of Overheads: By keeping a strict check over various overheads such as factory,administrative and selling & distribution, this can be controlled.
(d) Measuring Efficiency: Cost accounting provides information regarding standards and actualperformance of the concern activity for measuring efficiency.
(e) Budgeting: The preparation of the budget is the function of costing department and budgeting isdone to ensure that the practicable course of action can be chalked out and the actual performcorresponds with the estimated or budgeted performance.
(f) Price Determination: On behalf of cost accounting information, management is enable to fixremunerative selling price for various items of products and services in different circumstances.
(g) Expansion: The management may be able to formulate its approach to expansion on the basis ofestimates of production of various levels.
1.7 Installation of Cost Accounting System
It is essential to undertake a preliminary investigation installing a suitable system of cost accounting to knowthe feasibility of installing cost accounting system to such business.
(a) Essential Conditions: The following conditions are essential for successful functioning of the costingsystem:-(i.) Material control system should be very efficient.(ii.) The role of cost accounting must be clear.(iii.) The methods of wage payment must be sound and well designed.(iv.) The cost report should be printed forms to facilitate quick compilation.(v.) The cost and financial accounts must be integrated so as to facilitate reconciliation of profit.
(b) Essential Factors for Installing a Cost Accounting System: The following essential factors areto be considered before installing a cost accounting system :-(i) Nature of Industry –There is no technique or method of costing that can be applied universally.The nature of business should be considered while applying the costing techniques.(ii) Background of Business Unit –The back ground of business unit includes its existence,position, rate of growth, policy and philosophy of management. It serves as a basis for designing thecost accounts in respect of necessity, simplicity and investment involved in installing cost account.(iii) Selling & Distribution Method –The warehousing facility, external transport, market researchand other promotion measures, terms of sale and promotion of orders from customers are to beconsidered with regard to distribution process.
(iv) Flexibility and Uniformity – The cost accounting system to be install must be flexible anduniform in operation and must be capable of adoption to changing conditions and facilitates interfirm comparison among various firms belonging to the same industry.
(v) Product Range – Range of product must be analyzed in terms of size, models, fashions, areaof market and competitors to determine the method of costing to be selected.
(vi) Organizational Factors – Size and type of organization, levels of management, extent ofdelegation and responsibility, extent of departmentalization, availability of modem office equipments

5
and number of managerial and supervisory staff are to be considered while installing cost accounting.(vii) Area of Control-It must be given top most priority for exercising control over materials whenmaterial control occupies significant are of control.(viii) Reporting and Use of Electronic Data Processing- The reports of cost data must befrequent and promptitude, while installing cost accounting system. In modern ere use of electronicdata processing equipments and computers has become a common practice.
(c) Procedure for Installation(i.) Nature of Business: Nature of the business of organization like capacity of plant, nature ofmaterial and labour, and various processes etc. should be considered before installation of costingsystem.(ii.) Determination of Cost Centers: Nature and no. of cost centers required should be decidedto control cost.(iii.) Determination of Process: Suitable system or process should be adopted according to thesize of business and nature of product.(iv.) Nature and Quality of Product: Quality of product, time consumed, and process used etc.should be considered while installing a costing system.(v.) Determination of Extent and Way to Control: Extent and way to over material, labour andover head should be determination.(vi.) Arrangement for Flow of Cost Data: Proper arrangement should be made for the informationrelated to cost.(vii.) Forms: Standardized forms should be used by all foreman and workers.(viii.) Records to be Maintained: Complete and accurate records should be maintained to carefullywork out.
1.8 Essential of a Good Cost Accounting System
A good cost accounting should possess the following essential features:i) It should be simple, practical and capable of meeting the business concern requirements.ii) Accurate data should be used by cost accounting system; otherwise it may distort the output of the
system.
iii) To develop a good system of cost accounting necessary co-operation and participation of executivesfrom various departments of the business is needed.
iv) The cost of installing and operating the system should be result oriented.
v) It should not sacrifice the utility by introducing unnecessary details.
vi) For the introduction of the system a carefully phased programmed should be prepared by usingnetwork analysis.
vii) Management should have faith on costing system and works as a helping hand for its developmentand success.
1.9 Methods
Depending upon the nature of the business and the types of its products, numbers of methods of costascertainment are used in practice. The methods of costing are as follows:

6
a) Job Costing: In this system the cost of each job is ascertained separately which is suitable in allcases where work is undertaken on receiving a customer’s order. Like a printing press, motor workshop etc.
b) Batch Costing: It is considered as the extension of job costing. It represents a number of smallorders passed through the factory in batch. Each batch here is treated as a separate unit of cost.
c) Contract Costing: It is suitable for the firms which are engaged in the work of construction ofbridges, roads, buildings etc.
d) Single or Output Costing: It is used in the business where a standard production is turned out andit is desired to find the cost of a basic unit of production.
e) Process Costing: It is a method of costing used to ascertain the cost of a product which maypasses through various processes before completion.
f) Operating Costing: The cost of providing a service is known as operating cost and the methodsto ascertain the cost of such services is known as operating costing.
g) Multiple Costing: In multiple costing, a combination of two or more methods of costing is used inconjunction to determine the cost of final product. This method is used by the industries wheredifferent components are separately manufactured and subsequently assembled into the finishedproduct. For e.g.: Motor car, Television, Ships etc.
1.10 Techniques
For ascertaining cost, following techniques of costing are usually used:-
a) Uniform Costing: The practice in which common methods of costing for different undertakings inthe same industry are used is known as uniform costing.
b) Historical Costing: In this technique, ascertainment of cost is done after they have been incurredbut the utility of this technique is limited.
c) Direct Costing: The practice of charging all direct costs to operations, processes or productsleaving all indirect costs to be written off against profit’s in which they arise are called as directcosting.
d) Absorption Costing: In this all costs, both variable and fixed are charged to production, operationsor processes.
e) Marginal Costing: The method of ascertaining marginal cost by differentiating between fixed andvariable costs. This technique is used to ascertain effect of changes in volume or type of output overthe profits.
f) Standard Costing: The preparation of standard costs and applying them to measure the variationsfrom actual cost and analyzing the causes of variations with a view to maintain maximum efficiencyin production is known as standard costing.
g) Activity Based Costing: ABC is a system that focuses on activities as fundamental cost objectsand utilizes the cost of these activities as building blocks or compiling the costs of other cost objects.
7
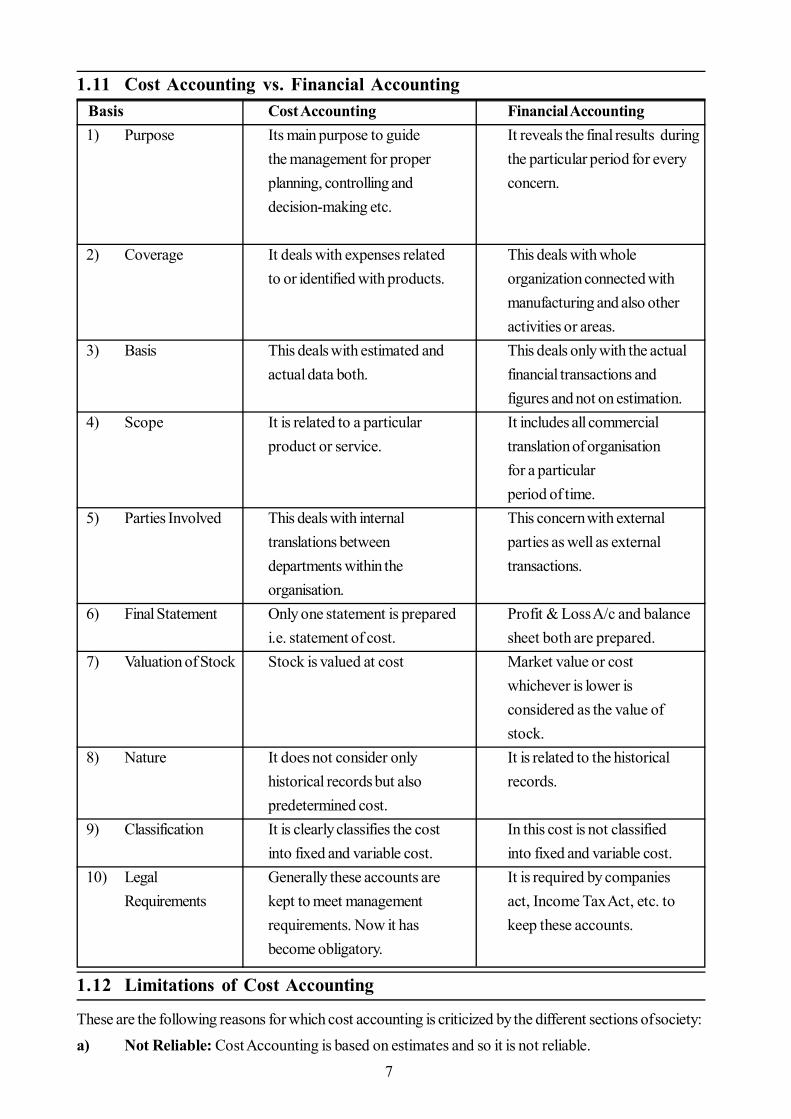
1.11 Cost Accounting vs. Financial Accounting Basis Cost Accounting Financial Accounting
1) Purpose Its main purpose to guide It reveals the final results duringthe management for proper the particular period for everyplanning, controlling and concern.decision-making etc.
2) Coverage It deals with expenses related This deals with wholeto or identified with products. organization connected with
manufacturing and also otheractivities or areas.
3) Basis This deals with estimated and This deals only with the actualactual data both. financial transactions and
figures and not on estimation.4) Scope It is related to a particular It includes all commercial
product or service. translation of organisationfor a particularperiod of time.
5) Parties Involved This deals with internal This concern with externaltranslations between parties as well as externaldepartments within the transactions.organisation.
6) Final Statement Only one statement is prepared Profit & Loss A/c and balancei.e. statement of cost. sheet both are prepared.
7) Valuation of Stock Stock is valued at cost Market value or costwhichever is lower isconsidered as the value ofstock.
8) Nature It does not consider only It is related to the historicalhistorical records but also records.predetermined cost.
9) Classification It is clearly classifies the cost In this cost is not classifiedinto fixed and variable cost. into fixed and variable cost.
10) Legal Generally these accounts are It is required by companiesRequirements kept to meet management act, Income Tax Act, etc. to
requirements. Now it has keep these accounts.become obligatory.
1.12 Limitations of Cost Accounting
These are the following reasons for which cost accounting is criticized by the different sections of society:a) Not Reliable: Cost Accounting is based on estimates and so it is not reliable.

8
b) Failure of the System: Cost Accounting system has failed to produce desired results in manyconcerns. Thus it could be said that this system is at fault.
c) Unnecessary: it is not necessary in Business concern as it involves duplication of work.
d) Inapplicability: Modern methods of cost accounting are not applicable to every type ofindustries.
e) Expenses: It is expensive because double set of account books has to be maintained and itsintroduction involves considerable amount of expenditure.
1.13 Summary
The techniques and process of accounting for cost begins with recording of Revenue and expenditureand the basis on which they are calculated and it also includes the presentation of information in theform of periodical statements and reports for the purpose of managerial decision – making. CostAccounts are key to economy in manufacturing and are indispensable to the intelligent and economicalmanagement of the factory. Thus it has come on essential tool of management.
1.14 Self Assessment Questions
1. “Cost Accounting System is neither unnecessary nor expensive, rather it is profitableinvestment”, Comment.
2. Discuss the characteristics of an ideal system of Cost Accounting and differentiate betweencost accounting and financial accounting.
3. Explain different ‘Methods’ and ‘Techniques’ of costing.
1.15 Reference Books
- Agrawal, Shah, Mendiratta, Agarwal, Sharma, Tailor — Cost and Management Accounting( Malik and Co.)
- Jain, Khandelwal, Pareek — Cost Accounting (Ajmera Book depot, Jaipur)
- Oswal, Maheshwari, Modi — Cost accounting. Cost Accounting ( RBD, Jaipur)
- Agrawal, Jain, Sharma, Shah, Mangal — Cost Accounting ( RBD, Jaipur)
9
Unit - 2 : Basic Cost Concepts
Structure of Unit:
2.0 Objectives2.1 Introduction2.2 Classification of Costs2.3 Cost Concepts2.4 Components of Total Cost2.5 Cost Sheet2.6 Summary2.7 Self Assessment Questions2.8 Reference Books
2.0 Objectives
After completing this unit, you will be able to:
Define the classification of cost and cost concepts. Differentiate between components of total cost and to make cost sheet.
2.1 Introduction
Element is an important area of a product. To estimate correct cost accounting, cost classification andanalysis is being done. This is also necessary to control the cost. In other words elements of cost meansexpenditure or cost incurred on resources which are helpful in produce an item, for example material, labourand expenses. To understand the cost one should know what is expenses and loss.
Cost:
Generally cost may be explained as the amount of expenditure, actual or notional, relating to a specific thingor activity such as product, job, service, process etc. It may also be expressed as a sacrifice which may bedefined in the terms of money means it is the amount of resources given up in exchange for some goods andservices. Cost and expenses are different but relative terms.
Where ‘costs’ includes the cost of material and labour in addition to expenses, the term expenses is widelyapplied in financial accounts for various types of historical cost. In cost accounting, it is used for costs otherthan cost of raw material and wages. To understand the meaning of cost, it is necessary to define themeaning of expenses.
Expenses:
Generally expenses are called expired costs means those costs which have been used up totally in generatingrevenue. They are not capitalised but only shown as expenses in income statement. There are so manyexamples of expenses such as costs of goods sold expenses, selling expenses and administrative expenses.For expenses, there is no need to be paid in cash immediately, even a promise to pay could be made for theprofits received. The manufacturing costs are capitalised in the form of finished goods inventory and whena sale is incurred, they expire becoming expenses. The cost of unsold stock which was an asset prior, nowconverts expenses of cost of goods sold as it has contributed to the generation of revenue.

10
Manufacturing expenses may be expressed as cost because this is included in the cost of fished goods stockwhich is an asset unless sale is made.
For example, depreciation of a factory machine increases the utility of goods manufactured which aretherefore included in work-in-progress and finished goods inventory.
Selling and administrative expenses, when not included in the cost of finished goods stock, are deemed onlyas expenses, not cost (asset) and are deducted from revenues whenever obtained. Similarly, depreciation ofa factory building is a cost but depreciation of an office building is an expense.
The term cost itself is without any significant meaning and therefore, it is always advisable to use it with anadjective or phrase that will convey the meaning intended such as prime, direct, indirect, fixed, variable,controllable, opportunity, imputed, sunk, differential, marginal, replacement and the like. Future costs arealso considered in cost accounting but not in financial accounting.
Loss:
To understand the concept of cost, the term ‘loss’ should be defined.
Loss is lost cost. It is applied to define two accounting events. In financial accounting, it is used to describea circumstance where expenses exceed revenues for an accounting period, that is, the reverse of net income(earnings) for the accounting period. On the other hand, a loss arises due to the cost of an asset being morethan the sale proceeds when the asset is sold. This unfavourable event does not arise from a normal businessactivity but from non-operating transactions or events. This meaning of loss is used to recognize the reverseof gain. That is, if no gain is achieved from the cost incurred or it becomes definite that no benefits accrue,the cost becomes a lost cost, i.e., loss on sale of fixed asset, loss of stock due to fire etc.
2.2 Classification of Costs
There are so many objectives of cost accounting such as planning, decision- making, stock valuation, profitmeasurement, control etc. For achieving these objectives, cost should be computed, classified and grouped.Cost classification may be known as the process of grouping costs according to their general characteristics.
The various cost classifications are as follows:
1 Natural Classification of Cost
(A) Direct Material Cost (B) Indirect Material Cost(C) Direct Labour Cost (D) Indirect Labour Cost(E) Direct Expenses Cost (F) Indirect Expenses Cost
2. According to Variation in Production Activity and Quantity
(A) Fixed Cost (B) Variable Cost
(C) Semi-variable/Fixed Cost (Mixed Cost)
3. Degree of changeability to the product
(A) Direct Cost (B) Indirect Cost
4. Degree of Relation with the Product
(A) Product Cost (B) Period Cost

11
5. Functional Classification of Cost
(A) Manufacturing Cost (B) Selling and Distribution Cost(c) Administrative Cost
6. Association with the Accounting Period
(A) Capital Cost (B) Revenue Cost
7. Costs for Decision-Making and Planning
(A) Opportunity Cost (B) Sunk Cost
(C) Relevant Cost (D) Differential Cost
(E) Imputed Cost/Notional Cost (F) Out-of-pocket Cost
(G) Fixed, Variable and Mixed Cost (H) Shut Down Cost
8. Costs for Control
(A) Controllable and Uncontrollable Cost (B) Standard Cost
(C) Fixed, Variable and Mixed Cost
9. Other Costs
(A) Joint Cost (B) Common Cost
1. Normal Classification of Cost
A) Direct Material cost: Material means those items which are applied for manufacturing of a productand direct material is directly related to production. For example, raw cotton in textiles, crude oil tomake diesel etc. There are so many names of direct materials such as process material, prime costmaterial, stores material and construction materials.
Main points for direct material can be summarized as follows:
(1) Direct material specially acquired for a particular Job, order, process or product.(2) It is integrated part of manufacturing unit.(3) Value of direct material is comparatively higher than that of other materials.(4) Material passing from one process to another process.(5) Primary packing materials e.g. wrapping, cardboard boxes, the glass bottle in production ofsyrup etc(6) It Increases in the same ratio as the increase in production
B) Indirect Material Cost: In the words of C.I.MA., London, “indirect material cost is the materialcost which cannot be allocated but which can be apportioned to or absorbed by cost centres orcost units’’.
Thus it may be said that indirect cost is the cost which cannot be directly identified to the unit ofoutput or to the segment of a business activity e.g. oil, grease, consumable stores etc.
C) Direct Labour Cost: Direct labour is known as the wage of those workers who are involved in theproduction process whose time can be efficiently and economically traceable to units of productse.g. wages paid to compositors in a printing press, labour of machine operators and assemblers. It

12
may also be defined as prime labour cost, process labour cost, operating labour cost, manufacturingwages, Direct wages and productive labour cost. In the words of C.I.MA., London, “direct wagesis that wages which can be allocated to cost centres or cost units.”
D) Indirect Labour Cost: Some workers does not engage directly in conversion of output but contributeindirectly. Labour is paid for the objective of carrying tasks incidental to goods or service provided.It cannot be practically traced to particular units of output e.g. wages of store-keepers, foremen,time-keepers, supervisors, Inspectors etc. In the words of C.I.M.A., London, “Wages whichcannot be allocated but which can be apportioned or absorbed by cost centres or cost units isindirect wages.’’
E) Direct Expenses Cost: It is also defined as chargeable expenses. These direct expenses areincurred directly on a particular product, Job or cost units and recognizable with the cost units.According to C.I.M.A., London, “Direct expenses means, expenses which can be allocated tocost centres or cost units.”
For example, -
(1) Hiring of a particular tool plant or equipment for job.(2) Cost of special moulds, designs and patterns.(3) Fees paid to architects, surveyors and consultants.(4) Insurance charges on special materials chargeable to a job.
F) Indirect Expenses Cost: Those expenses which cannot be directly, conveniently and fully chargedto cost units are known as indirect expenses In the words of C.I.M.A., London, “Indirect expensesare expenses which cannot be allocated but which can be apportioned to or absorbed by costcentres or cost unit” For example, insurance, power, lighting and heating, rent, rates and taxes,depreciation etc.
2. According to Variation in Production Activity and Quantity:
Costs can be divided into (i) fixed, (ii) variable, and (iii) mixed costs, in terms of their changes in costbehaviour in relation to variation in output, or activity or volume. Activity can be expressed in any form suchas units of output, hours worked, sales, etc.
A) Fixed Cost: Fixed cost is a cost which does not vary in total for a given time period in spite of widefluctuation in production or volume of activity. These costs are also termed as standby costs, capacitycosts or period costs. Few examples explaining the nature of fixed costs are rent, property taxes,supervising salaries, depreciation on office facilities, advertising, Insurance, etc. Fixed costs areincurred with the passage of time and not with the production of the product or the job.
Hence, fixed costs are defined in terms of time, such as per day, per month or per year and not interms of unit. It is totally illogical to say that remuneration of supervisor in the form of salary andperquisites are so much per unit but, it can be said that supervisor’s salary and perquisites are somuch per month.
Fixed costs can be further classified in the following categories
a. Committed costs: Those costs are unavoidable in short-term if the concern has to function. Suchcosts are basically incurred to maintain the company’s benefits and physical existence, and over which
13
management has little or no discretion. Few examples of committed costs are plant and equipmentdepreciation, taxes, insurance premium, rate and rent charges.
b. Managed costs: Managed costs are related to current activities which must continue to be incurredto ensure the operating existence of the company e.g., management and staff salaries.
c. Discretionary costs: They are also identified as programmed costs. Discretionary costs result fromspecial policy decisions, management programmes, new researches etc. Few examples of such costsare research and development costs, marketing programmes, new system development costs.
The difference between committed and discretionary costs is that it is hard to eliminate or neglectcommitted costs in times of low production or decline in business activity, whereas discretionary costssuch as research and development could be reduced to a desirable level.
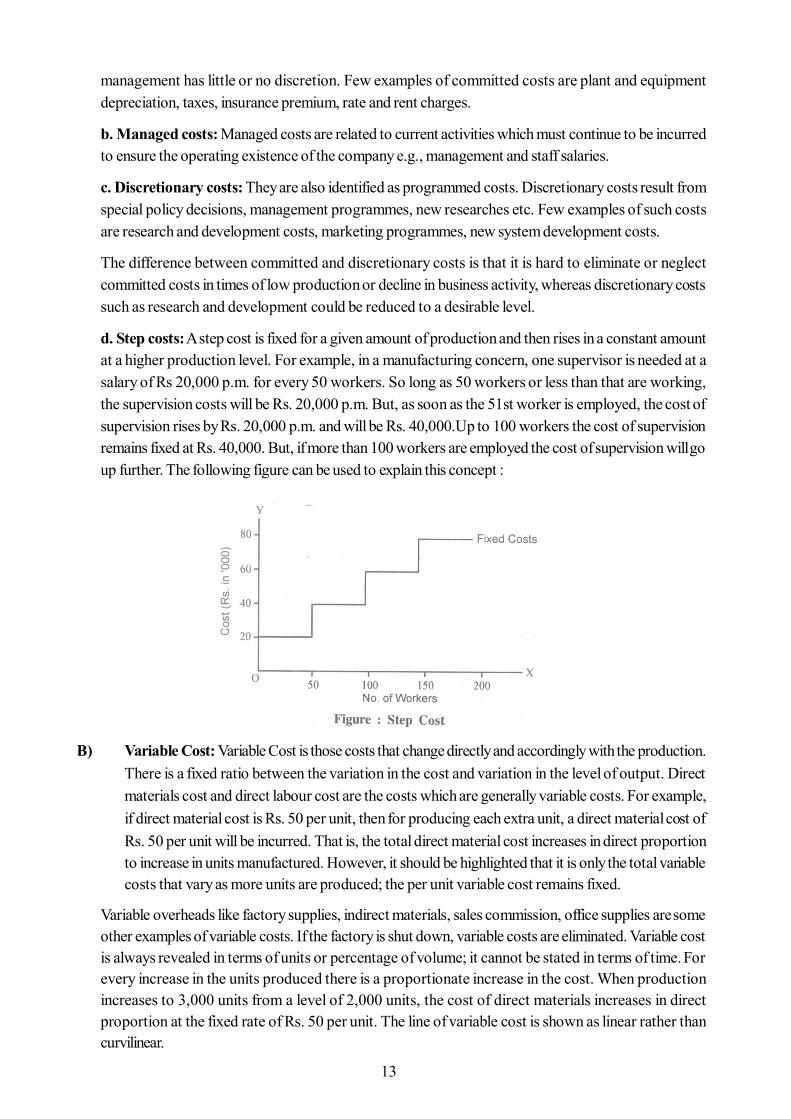
d. Step costs: A step cost is fixed for a given amount of production and then rises in a constant amountat a higher production level. For example, in a manufacturing concern, one supervisor is needed at asalary of Rs 20,000 p.m. for every 50 workers. So long as 50 workers or less than that are working,the supervision costs will be Rs. 20,000 p.m. But, as soon as the 51st worker is employed, the cost ofsupervision rises by Rs. 20,000 p.m. and will be Rs. 40,000.Up to 100 workers the cost of supervisionremains fixed at Rs. 40,000. But, if more than 100 workers are employed the cost of supervision will goup further. The following figure can be used to explain this concept :
B) Variable Cost: Variable Cost is those costs that change directly and accordingly with the production.There is a fixed ratio between the variation in the cost and variation in the level of output. Directmaterials cost and direct labour cost are the costs which are generally variable costs. For example,if direct material cost is Rs. 50 per unit, then for producing each extra unit, a direct material cost ofRs. 50 per unit will be incurred. That is, the total direct material cost increases in direct proportionto increase in units manufactured. However, it should be highlighted that it is only the total variablecosts that vary as more units are produced; the per unit variable cost remains fixed.
Variable overheads like factory supplies, indirect materials, sales commission, office supplies are someother examples of variable costs. If the factory is shut down, variable costs are eliminated. Variable costis always revealed in terms of units or percentage of volume; it cannot be stated in terms of time. Forevery increase in the units produced there is a proportionate increase in the cost. When productionincreases to 3,000 units from a level of 2,000 units, the cost of direct materials increases in directproportion at the fixed rate of Rs. 50 per unit. The line of variable cost is shown as linear rather thancurvilinear.

14
C) Semi-variable/Fixed Cost (Mixed Cost): Mixed costs are costs made up of fixed and variableitems. They are a combination of semi-variable costs and semi-fixed costs. Because of the variableelement, they vary with volume; because of the fixed element, they do not fluctuate in direct proportionto output. Semi-fixed costs are those costs which remain fixed up to a certain level of productionafter which they become variable.
3. Degree of Changeability to the Product
According to this basis, cost may be divided into direct and indirect cost.
A) Direct Cost: it may be defined as the term of direct materials, direct labour and direct overheads.That means it is a cost which can be directly identified to a unit of output or the segment of abusiness operation. It output units are the objects of costing, then direct cost represent cost andresources that can be traced to or identified with the finished product .
B) Indirect Cost: Indirect costs are those costs which cannot be associated with or chargeable to asingle product because they are incurred for more products. The examples of indirect costs are:indirect materials (lubricants and scrap materials), salary of factory supervisors (indirect labour),rent, rates and depreciation (indirect expenses). Indirect costs, often related to as overheads, haveto be apportioned to various products.
Costs also may be direct or indirect with respect to particular firm segments or divisions. That is some costwhich are indirect for a product, may be charged to a segment or department and thus, will be direct costsfor that department. A segment may mean any one of a number of things, viz. department, division, specificactivity, sales territory etc.
Before classifying the cost into direct and indirect, it is necessary to know whether it is being related with aproduct, sales area, department or some other activity. For example, if a salesman simultaneously handlesseveral products, his salary is an indirect cost for each product, but a direct cost to his sales area ordepartment.
4. Degree of Relation with the Product
Cost may be divided into product costs and period costs in terms of relation with the product.
A) Product Cost: Generally product costs are identified with the product and merged in inventoryvalues. In other words, product costs are those costs that are included in the cost of manufacturinga product. In a manufacturing firm, it is the combination of four elements: (i) direct materials, (ii)direct labour, (iii) direct expenses, and (iv) manufacturing overhead. Thus, product cost is a completefactory cost. Prior to sale, product costs are deferred as inventories and until the goods are sold,are shown on the balance sheet as assets. As finished inventory goods is sold, product costs aretransferred from the inventory accounts to the cost of goods sold account thus becoming expensesand part of the period costs at the time revenue is realised.
B) Period Cost: Period costs are those costs which are not identified with product or activity duringthe period in which they are evolved. They are not carried forward as a part of value of stock to thenext accounting period.
These costs are required to generate revenues but they cannot be directly related with units ofproduct. Difference of opinion exists regarding whether certain costs should be considered as productor period costs.
15
5. Functional Classification of Costs
Functional classification of costs defines how the cost was applied (manufacturing, administration or selling).A functional classification expresses that the business performs various functions for which costs are incurred.In measuring net income, expenses are usually classified by function and grouped under the headings ofmanufacture, selling and administrative costs. Manufacturing costs are all production cost incurred tomanufacture the products and to bring them to a saleable condition, including direct materials, direct labourand indirect manufacturing (or factory overhead) costs. Selling and administrative charges may be assumedas expenses when incurred or charged to prepaid expense accounts such as prepaid insurance. Functionalclassification is also important because it gives an opportunity to the management to calculate the efficiencyof departments performing various functions in the firm.
6. Association with Accounting Period
Costs can also be classified into two major classes on the basis of the accounting period to which theyrelate: (i) capital expenditures, and (ii) revenue expenditures.
A capital expenditure provides benefit to future periods and is classified as an asset; a revenue expenditureis treated to benefit the current period and is classified as an expense; a capital expenditure will flow into thecost stream as an expense when the asset is applied up or written off. The difference between capital andrevenue expenditures is vital to the accurate matching of costs and revenue and to the right measurement ofperiodic net income.
7. Costs for Decision-Making and Planning
A) Opportunity Cost: opportunity cost is the cost of opportunity lost. Opportunity cost is the cost ofchoosing one item of action in terms of the opportunities which are given up to carry out that courseof action. Opportunity cost is the profit lost by avoiding the best competing alternative to the onechosen. The benefit lost is normally the net earnings or profits that might have been earned from therejected alternative.
For example, assume that a manufacturer can sell a semi-finished product to a customer for Rs.5,00,000. He decides, however, to keep it and eliminate it. The opportunity cost of the semi-finished product is Rs. 5,00,000 because this is the amount of economic resources rejected by themanufacturer to complete the product. Simultaneously, capital which is invested in plant andinventories cannot now be invested in shares and debentures that will earn interest and dividends.
The loss of interest and dividend that would be earned is the opportunity cost. Other examples ofopportunity cost are when the owner of a business foregoes the opportunity to employ himselfelsewhere; or a machine used to make Product X is said to have an opportunity cost if the machinecan be sold or if it can also make Product Y.
Opportunity costs help in decision-making and selecting alternatives. Decision-making is selectingthe best alternative which is adopted with the help of opportunity costs. But opportunity costs arenot recorded in an accounting system as they relate to opportunities lost.
B) Sunk Cost: Sunk cost is past or historical cost which has already been incurred. It may be knownas unavoidable cost, it refers to all past costs since these amounts cannot be changed once the costis incurred. They are the costs which have been created by a decision in the past and cannot bealtered or neglected by any decision that is made in the future. Examples of sunk costs are the bookvalues of existing assets, such as plant and equipment, inventory, investment in securities, etc. Exceptthe possible benefits or losses on sales of any of such assets, the book value is not relevant fordecisions regarding whether to use them or dispose them off.

16
Some accountants make discussion and argument that the total cost of a fixed asset is not the sunkcost, but sunk cost is the difference between the purchase price of a fixed asset and the net amountthat could be realised from its sale. For example, if a plant has a book value of Rs 10,00,000 anda scrap value of Rs. 60,000 then the sunk cost is Rs. 9,40,000 (Rs 10,00,000 - 60,000) and notRs. 10,00,000 That is, the sunk cost is the difference between book value and scrap value.
C) Relevant Cost: Relevant costs are related to future, which differ between alternatives. Relevantcosts may also be termed as the costs which are influenced and changed by a decision. On the otherhand, irrelevant costs are not influenced by the decision, whatever alternative is selected. The featuresof relevant cost are as follows
(i) Relevant costs are basically future costs, i.e. those costs which are, expected to be charged infuture. Relevant costs therefore, are not past (sunk) costs which have already been incurred andcannot be altered by a decision.
(ii) Relevant costs are only incremental (additional) or avoidable costs. Incremental costs refer to anincrease in cost between two options. Avoidable costs are those which are not incurred from onealternative to another.
To take an example, assume a business firm purchased a plant for Rs. 20, 00,000 and has now abook value of Rs. 2,00,000. The plant had become obsolete and cannot be sold in its presentsituation. However, the plant can be sold for Rs. 1,60,000 if some modification is done on itwhich did cost Rs. 60,000.
In this example, Rs. 60,000 (modification cost) and Rs. 1,60,000 (sales value) both are relevantas they reflect future, incremental costs and future revenues a respectively. The firm will haveincremental benefit of Rs. 1,00,000 (Rs. 1,60,000 - Rs. 60,000) on sale of the plant.
Rs 20,00,000 has already been incurred and being a sunk cost is not relevant to the decision,i.e. whether modification should be done. Similarly, the book value of Rs. 2,00,000 which hasto be written off, whatever alternative future action is chosen is also not relevant because iscannot be altered by any future decision.
D) Differential Cost: Differential cost is the increase or decrease in total costs between any twoalternatives due to change in activity or a particular management decision.
Differential costs are similar to the additional variable expense charged in respect of the additionaloutput, plus the increase in fixed costs, if any. This cost day be evaluated by taking the total cost ofproduction without the additional contemplated outlay and comparing it with the total costs incurredif the additional output is under consideration.
Differential costs are also named as incremental costs, although technically an incremental costshould refer only to an increase in cost from one alternative to another; decrease in cost should bereferred to as decremental cost. Differential cost is a broader concept encompassing both costincreases (incremental costs) and cost decreases (decremental costs) between options.
For example, assume that a company has normal capacity to manufacture 50,000 units of a product;production beyond that point would require the installation of additional plant and equipment thatwould increase the amount of fixed costs. General utilisation of available capacity ranges between40,000 and 50,000 units. Fixed costs for the range of output and expanded capacity have beenestimated as follows:

17
Normal capacity Expanded capacity
Number of units 40,000 to 50,000 50,000 to 60,000Fixed costs Rs. 2,00,000 Rs. 2,50,000Now assume that the variable cost is Rs. 4 per unit. A statement comparing manufacturing costs atthree different production levels would be as follows:
Number of units
Particulars 40,000 50,000 60,000
Variable costs Rs. 1,60,000 Rs. 2,00,000 Rs. 2,40,000
Fixed costs Rs. 2,00,000 Rs. 2,00,000 Rs. 2,50,000
Total manufacturing cost Rs. 3,60,000 Rs. 4,00,000 Rs. 4,90,000
Average per unit Rs. 9.00 Rs. 8.00 Rs. 8.17
incremental costs - Rs. 40,000 Rs. 90,000
Additional output (units) - 10,000 10,000
Incremental cost per unit - Rs. 4.00 Rs. 9.00
The additional capacity which would be needed to expand actions to 60,000 units would enhance the fixedcosts by Rs. 50,000. The incremental cost of an additional 10,000 units would total Rs. 90,000 or Rs. 9.00per unit. The average cost of the 60,000 units would be Rs. 8.17 per unit.
The concept of differential costing is vital in planning and decision-making.
It is an important tool in calculating the profitability of alternative choice decisions and helpingmanagement in choosing the optimum alternative. The differential cost analysis can assist managementin knowing the additional profit that would be earned if idle or unused capacity is used for additionalproduction or if some extra investments are made by the organization.
E) Imputed Cost / Notional Costs: Imputed costs are those costs which do not involve actual cashoutlay. These costs are not actually incurred in some transaction but which are relevant to thedecision as they pertain to a particular situation. These costs do not enter into traditional accountingsystem or in financial records. Interests on internally generated funds, rental value of company-owned property and salaries of owners of a single proprietorship or partnership are some examplesof imputed costs.
Costs paid or charged are not imputed costs. For example, if Rs. 60,000 is paid for purchase ofraw materials, it is an outlay cost but not an imputed cost, because it would enter into ordinaryaccounting systems. When a company uses internally generated funds, no actual interest payment isneeded. But if the internally generated funds are invested in some projects, interest would havebeen earned.
The revenue forgone (loss of interest) reveals an opportunity cost, and thus, imputed costs areopportunity costs.
F) Out of Pocket Cost: Out of pocket cost involves the cash outflows due to a particular managementdecision activity. Non-cash costs such as depreciation are not involved in out-of-pocket costs. Thiscost concept is important for management in deciding whether or not a particular project will at

18
least return the cash expenditures related with the project choosen by management. Similarlyacceptance of a special order for production may necessitate the considerations of out-of-pocketcosts that need not to be charged if the special order proposal is not accepted. Depreciation onplant and equipment is not relevant in decision-making because no cash goes outside the concern.
G) Fixed, Variable and Mixed Costs: These costs have been defined in the previous classifications.
H) Shut Down Cost: Shut down costs are those costs which have to be arise under all conditions inthe case of stopping manufacture of a product or closing down a department or a division. Shutdown costs are always fixed costs. If the manufacture of a product is stopped, variable costs likedirect materials, direct labour, direct expenses, variable factory overhead will not be incurred.However, a part of fixed costs (if not total fixed costs) related with the product will be incurred suchas rent, watchman’s salary, property taxes etc. Such fixed costs are unavoidable. Some fixed costsassociated with the product become negligible and need not be incurred in case production isstopped such as supervisor’s salary, factory manager’s salary, lighting, etc. Shut down costs, thusrefer to minimum fixed costs which are incurred in the event of closing down of a department ordivision.
8. Costs for Control
A) Controllable and Uncontrollable Cost: Controllable cost is that cost which is subject to directcontrol at some level of managerial supervision.
The concept of controllable cost is very significant in cost accounting and contributes to theachievement of the goals of cost control and responsibility accounting The CIMA, London, explainscontrollable cost as ‘a cost which can be influenced by the action of a specified member of anundertaking’ and a non- controllable cost as ‘a cost which can be influenced by the action of aspecified member of an undertakings’. Basically, a controllable cost is the cost over which a managerhas direct and full decision authority. That is, controllable costs can be controlled (reduced) by amanager at a given organizational level. Some examples of controllable costs are indirect labour,lubricants, cutting tools, and power costs incurred in the machine department. Controllable costsdo not reveal that they are 100% controllable. Some costs are partly controllable by a responsibilitycentre manager. For example, the cost of raw materials is controlled by the production managers aswell as purchase managers. The production manager controls at quantity level, and the purchasemanager at the price level. Such costs are reported to both of them, but one responsible managershould be held accountable for those costs which he can control.
The term “controllable cost’’ is different with the terms “variable cost, direct cost’’. Variable costschange with the output but are not necessarily. For example, factory supplies used for servicingplant and equipment may vary with the output in the production department, but the productionmanager cannot control them.
It is influenced from the two factors: (i) the time period factor, and (ii) the decision-making authority,can make a cost controllable or uncontrollable. If the time period is long enough all costs can becontrollable and curtailed. Similarly, the decision-making authority affects the cost. If a responsibilitycenter manager has been delegated the authority to spend the cost, he can control it but all costs canbe said to be controllable by somebody in the concern. The managing director of a company isresponsible for all costs. But practically, the responsibility and authority of controlling costs is delegatedto various levels in the concern.

19
B) Standard Cost: Standard costs are those costs which are planned or pre-determined cost estimatesfor a unit of output in order to get a basis for comparison with actual costs. It is evaluated atassuming a particular level of efficiency in utilization of material, labour and indirect services. Standardcosts are used to prepare budgets. Standard cost is a unit concept and indicates standard cost perunit of output, per labour hour etc. On the other hand, the term budgeted Cost’ is a total conceptand implies total budgeted cost of an item at some activity level or output level such as budgetedcost of material is Rs 8,00,000 if 8000 units are produced.
C) Fixed, Variable and Mixed Costs: These costs have been explained earlier.
9. Other Costs
A) Joint Cost: Joint costs incur where the processing of a single raw material or production resourcesresults in two or more various joint products or by-products up to the point of separationsimultaneously. Joint costs relate to two or more products manufactured from a common productionprocess or element-material, labour, or overhead or any combination thereof, or so locked togetherthat one cannot be produced without producing the other(s).
Thus, joint cost is the cost of two or more products that are not identifiable as individual types ofproducts until a particular stage of production known as the split-off point (point of separation) isreached. For example, kerosene, fuel oil, gasoline and other oil products are derived from crudeoil. Joint costs are total costs incurred upto the point of separation. Joint costs can be apportionedto different products only by means of some suitable bases of apportionment.
B) Common Cost: Common costs are those which are incurred or charged for more than one product,job or any other certain costing object. These costs are not easily recognizable with individualproduct and therefore are normally apportioned.
Common costs are common to products, processes, functions, responsibilities, customers, salesterritories, costing units and period of time.
2.3 Cost Concepts
There are six basic cost concepts on which cost classification and various cost terms are based, which areas follows :
1. Concept of Objectivity: This concept helps to give direction to the operations referred to costfinding, cost analysing, cost recording and cost reporting. This concept requires goal congruencei.e. cost exercises have to be in harmony with the objectives. Objectives influence cost treatmentsand cost strategies which may include internal reporting for operational, external and specific non-repetitive decisions.
2. Concept of Materiality: This concept that forces exactness must be tempered by good judgement,if no misrepresentation of product cost is likely to result. For example, overhead may include fewitems of direct cost, which may not be as material as to justify tracing them to particular unit ofproduction. A specific decision may be helpful, but benefits may not be materially sufficient toimplement it. Materiality is determined with reference to nature of firm’s affairs, managerial policiesand competitors’ practices.
3. Concept of Time Span: All assumptions relating to various cost exercises remain valid only duringrelated specific time span. The fixed cost statement is relied upon a time span under consideration.No costs will remain fixed for the whole time. Time span choosed by a firm should be more enough

20
to permit the procedures to record the related cost, output, labour hours and other factors requiredin the interpretation or analysts. If time span is too less, leads and lags in recording the cost data maybe quite hassle. If cost associating to a specific time span activity is recorded to another time spanactivity, cost result may turn out to be quite wrong.
4. Concept of Relevant Range of Activity: Relevant range of activity reveals the span of volumeover which the cost behaviour is expected to remain valid. Various cost activities are relied upon onspecific assumptions relating to cost behaviour patterns, which are valid only within the relatedrange of cost exercise. A fixed cost is fixed only in relation to the relevant range of activity during thetime span.
5. Concept of Relevant Cost and Benefit: This concept is for decision-making objectives. Inappraising alternative courses of action, management should consider only relevant cost and relevantprofits relating to alternatives under consideration. Irrelevant cost and benefits are ignored. Theaffects of this concept on operating or cong range capacity decisions are as follows :
(a) Relevant Cost and Profit for Operating Decisions: In operating decisions concentration ison optimum application of existing capacity. Increment analysis based on differential cost anddifferential revenue is based directly on the concept of relevant cost and profit.
(b) Relevant Cost and Profit for Capacity Decisions: Relevant cost and profits to a capacitydecision are varied from the cost and profits relevant to an operating decision. In the long-term, theconcepts of fixed and variable cost are meaningless. In long-term decisions, cost and profits areevaluated in relation of their influence on cost. A long-term decision must consider time value ofmoney, the timing of the investment and recovery of cost. The terms out-of-pocket cost and sunkcost are also considered from this perspective.
6. Concept of Normal and Abnormal Cost: The term normal refers for cost or circumstanceswhich is in agreement with what is representative, usual or regular. The term abnormal refers forcost or circumstances which are varied from what is normal, expected or ordinary. Various costaccounting treatments and strategies are laid down for normal and abnormal cost and circumstances.
Generally these terms are used in reference to normal or abnormal working situations in cost accountingdiscussions.
2.4 Components of Total Cost
1. Prime Cost: It consists costs of direct material, direct labour and direct expenses. It is also knownas basic, first or flat cost.
2. Factory Cost: It comprises of prime cost and in addition, works or factory overheads whichinclude costs of indirect labour and indirect expenses. This cost is also known as works cost,production or manufacturing cost.
3. Office Cost: If office and administration overheads are added to factory cost office cost is arrivedat. This is also termed as administration cost or total cost of production.
4. Total Cost: Selling and distribution overheads are added to the total cost of production to get thecost of sales.
The various components of total cost can be depicted through the help following chart:

21
2.5 Cost Sheet
Cost sheet is an analytical statement of expenses relating to production of an article which informs regardingtotal cost, per unit cost and quantity of production.
According to Wheldon, “Cost sheets are prepared for the use of management and consequently, they mustinclude all the essential details which will assist the manager in checking the efficiency of production.”
In the words of C.I.M.A., London, “Cost sheet is a cost schedule or document which provides for theassembly of the estimated detailed cost in respect of a cost centre or cost unit”
When cost per unit of production is not necessary to calculate then a statement of cost is prepared toascertain total cost and profit or loss on production.
Cost Sheet or Statement of Cost
For the year ending………………Output……………units
Particulars Total Cost Cost Per Unit
Rs. Rs.
Direct Materials Consumed ----- ------
Direct Wages ----- ------
Direct Charges or Chargeable Expenses ----- ------
Prime Cost ----- ------
Works Overhead ----- ------
Works Cost ----- ------
Administrative or Office Overhead ----- ------
Cost of Production or Cost of Goods Sold ----- ------
Selling and Distribution Overhead ----- -----
Selling Cost or Total Cost ---- ----
Profit ….% on Cost or Selling Cost ---- ----
Sales ---- ----
Components of Total Cost Direct Material Direct Labour Prime Cost or Direct Cost or First Cost Direct Expenses Wo rks Cost Plus Office and Ad mn. Office Cost or Total Cost of Production Overheads Office Cost Plus Selling and Distribution Cost o f sales or Total Cost Overheads

22
Production Statement Output…………unitsParticulars Total Cost Cost Per Unit
Rs. Rs.Raw Materials Consumed ---- ----(op. stock of R.M.+Purchases + closing stock of R.M.)Direct Labour or Wages ---- ----Direct Expenses ---- ----
Prime Cost ---- ----Works Overhead ---- ----Add : Opening Work in Progress ---- ----Less : Closing Work in Progress ---- ----
Works Cost ---- ----Office Overhead ---- ----Total Cost of Production ---- ----Add : Opening Stock of finished goods ---- ----Less : Closing Stock of finished goods ---- ----
Cost of Production or Cost of Goods Sold ---- ----Selling and Distribution Overhead ---- ----
Cost of Sales ---- ----Profit ---- ----Selling Price ---- ----
Illustration : The following figures have been extracted from the records of a manufacturing company forthe year ending 31st December, 2008. You are required to prepare a statement of cost showing : (a) Cost ofraw materials consumed (b) Prime Cost (c) Factory Cost (d) Cost of production (e) Cost of goods sold (f)Total cost of goods sold and profit on sales.
Rs.Stock of Raw Materials (1-1-08) 3,000Stock of Raw Materials (31-12-08) 2,400Purchases of Raw materials 14,000Stock of work-in-progress (1-1-08) 1,000Stock of work-in-progress (31-12-08) 800Carriage inward 500Manufacturing wages 4,000Other direct expenses 200Indirect wages 1,000Experiment expenses 400Wastage of materials 50Factory overhead 7,000Establishment on costs 2,000Selling overhead 4,000Distribution overhead 1,000Stock of finished goods (1-1-08) 1,200Stock of finished goods (31-12-08) 3,000Sales 40,00

23
Solution:Statement of Cost
Particulars Rs. Rs.
Purchase of Raw Materials 14,000
Add: Opening Stock of Raw Materials 3,000
Carriage inward 500
17,500
Less: Closing Stock of Raw Materials 2,400
(a) Cost of Raw Materials Consumed 15,100
Add: Direct Wages 4,000
Other Direct Expenses 200
(b) Prime Cost 19,300
Add: Factory Overheads:
Indirect wages 1,000
Experiment Expenses 400
Wastage of Materials 50
Factory Overheads 7,000 8,450
27,750
Add: Opening Stock of WIP 1,000
28,750
Less: Closing Stock of WIP 800
Factory Cost 27,950
Add: Office Overheads:
Establishment on Costs 2,000
Cost of Production 29,950
Add: Opening Stock of Finished goods 1,200
31,150
Less: Clothing Stock of Finished Goods 3,000
Cost of Goods Sold 28,150
Add: Selling Overheads 4,000
Add: Distribution Overheads 1,000
Total Cost of Goods Sold 33,150
Sales 40,000
Net Profit 6,850
2.6 Summary
Cost is a measurement in monetary terms of the amount of resources used for the purpose. Thus the cost

24
can be regarded as the price paid for attaining the objects. The objects may be a product, a service or anyactivity. For proper planning, decision making, stock valuation, profit measurement and control in businesscost should be computed, classified and grouped according to their general characteristics.
2.7 Self Assessment Questions
1. Explain the various concepts of ‘Cost’.
2. Define Cost Sheet with Performa.
3. From the following particulars of a manufacturing firm, prepare a statement showing:
(a) Cost of materials consumed(b) Works cost(c) Cost of production(d) Percentage of works overhead to productive wages(e) Percentage of general overhead to works cost
Rs.Stock of materials on January 1, 2008 40,000Purchase of raw materials in January, 2008 11,00,000Stock of finished goods on 1-1-2008 50,000Productive wages 5,00,000Finished goods sold 24,00,000Works overhead charges 1,50,000Office and general expenses 1,00,000Stock of materials on 31-1-2008 1,40,000Stock of finished goods on 31-1-2008 60,000Ans.: (a) Rs. 10,00,000 (b) Rs. 16,50,000 (c) Rs. 17,50,000 (d) 30% (e) 6.6%
2.8 Reference Books
- Agrawal, Shah, Mendiratta, Agarwal, Sharma, Tailor — Cost and ManagementAccounting ( Malik and Co.)
- Agrawal & Agrawal — Management Accounting (RBD. Jaipur)
- Khan, Jain — Management Accounting (S. Chand & Sons.)
- I. M. Pandey — Management Accounting (S. Chand & Sons.)
- M.R. Agarwal — Managerial Accounting (Garima Publications)
- Jain, Khandelwal, Pareek — Cost Accounting (Ajmera Book depot, Jaipur)
- Oswal, Maheshwari, Modi — Cost accounting. Cost Accounting ( RBD, Jaipur)
- Agrawal, Jain, Sharma, Shah, Mangal — Cost Accounting ( RBD, Jaipur)

25
Unit - 3 : Material : Purchasing Organization and Control
Structure of Unit:3.0 Objectives3.1 Introduction3.2 Centralized Purchasing3.3 Decentralized Purchasing3.4 Purchase Procedure3.5 Purchase Policy3.6 Principles of Skillful Buying3.7 Summary3.8 Self Assessment Questions3.9 Reference Books
3.0 Objectives
After going through this unit, you will be able to understand:
How material constitutes an integral part of the cost of production Who purchase the material Centralized /decentralized purchasing Purchase cycle or purchase procedure Different purchase system What is purchase order, GRN , Schedule of Quotations, Debit note
3.1 Introduction
Successful operations of any of the business depend to a large extent on the availability of goods andservices of the right quality in the right quantity at the right time, from the right source at the right prices. Outof three elements of cost (material, labor, overheads), material cost account for nearly 50% of the cost ofproduction, it is therefore essential to establish suitable procedure for proper control of materials from thetime of placing order with suppliers and vendors until they have been consumed. Material control is asystem which ensures the provision of Five Rights as discussed above in the first two lines of this paragraph.
Now what is material. Material constitutes an important part of the cost of product. It means all thosesupplies and components which are supplied to the organization for the purpose of consumption likeRaw material, components, spare parts, consumables etc depending upon the nature of industry. ForMcDonalds potatoes, flour, cheese, butter, vegetables can be stock of raw material.
Who purchases the materialsThere are different groups of purchasers who buy materials for different purpose from different sources.Ist category Purchasers Who buys Ultimate consumptionIInd categoryMiddlemen Whole sellers, retailers, agentsIIIrd categoryManufacturers Rawmaterial, components, consumables, machine tools, fuelspacking materialIV categoryGovernmental agencies and institutions Public utility

26
Activity A:
1. Name any three industries where the material function is a board room activity?
Material department can contribute effectively to profits, as purchasing is a spending function and everyrupee saved in buying goes to the profit column. The basic objective of material management is to provideraw materials timely.
3.2 Centralized Purchasing
Purchase of Material
Purchasing is a specialized activity in a manufacturing concern because it has its bearing on every vitalfactor concerning the manufacture like quantity, quality, cost, efficiency, prompt delivery, and volume ofproduction. Quality of finished product ultimately depends upon quality of raw materials used in it. High skillwork can of course help in improving the quality of product but it cannot change the character of rawmaterial, which is base for the end product. A traditional housewife is a pace setter when demand, price,consumption, source, money, management comes into pictures. The purchases can be
Centralized Decentralized.
It means all the purchases are made at one central point or by one central department. In such a system allthe departments, which requires materials, machines, supplies, components, tools etc. send their purchaserequest to the centralized purchasing department and this department takes care of timely supply of requiredpurchases. This system is useful in multiproduct, multi unit organization where centralized purchase of keyraw materials, which may be common to all products or units, be a very economic proposition.
Benefits of centralized purchasing are as under:
It can reduce the price: As materials are purchased in bulk, which means economical price due tolower rate of materials, trade discount, economical transport etc.
Effective control: Central purchase avoids duplication, overlapping so it helps in exercising effectivecontrol on material function.
Favourable terms: When material is acquired in bulk there may be more favourable terms withvendors due to reduced cost and trade discount.
Specialized staff: The staff at central purchasing department becomes expert and specialized inpurchase function ,their expert knowledge and negotiation skills can help in reducing the cost ofpurchase to great extent.
Clear policy: Centralized purchasing helps in adopting uniform policies, practices which ultimatelyhelps in reduction of prices at various levels.
Where centralized purchasing practices can be adopted:
Largest central purchasing organisation is the directorate general of supply and disposal, which caters to theneeds of defence, railway and communication. BHEL, also makes centralized purchase of major items likecopper and electrical steel for its various units. 100% centralization can exist only in wishful thinking. It hasfollowing disadvantages: -
It increases the lead time: If there are too many people from the point supply to point ofconsumption, it can increase the lead-time.

27
Initial cost is too high: Centralized purchase needs a full-fledged department in place, which cancater to the needs of all the departments.
Supply of inferior quality: Sometimes inferior quality material is issued for consumption whenthere is non-availability of material demanded in the stores.
Centralized purchase, how it can be made more effective: It can be made highly effective if userdepartments will take care of the following: -
Incomplete Specification Frequent last minutes changes Rejecting good quality in case of surplus Accepting bad quality when urgently needed.
3.3 Decentralized Purchasing
Under decentralized purchasing various department units are authorized or made responsible to take decisionindependently and directly. In a way the power to procure material are delegated to the concerned departmentor lower levels
The advantages of this system are: -
Better knowledge - the department which buys the material better knows the requirements of hisdepartment.
Shorter time of communication-The local decision making system on the spot will shorter thetime of communication.
Better control-the department may have better liason and the and control on the local purchaseofficer.
It helps in reducing the lead-time due to speedy communication.
No single system can be helpful in achieving the results, so partial centralization for high consumption valueitems and leaving the remaining to unit level is desirable to be adopted for better results for the company.
Activity B:
1. Which method of purchase is more suitable for the following industry? Steel industry, confectioneryunit, Pizza hut
3.4 Purchase Procedure
The success of purchase executives depends a great deal on how well they are able to understand thepurchase function. If they have selected right quality, right quantity, right source which can prove to be theirstrength or weakness at any critical moment. So there should be production target or budget for the concernas a whole. This will help to simplify the work of purchase department. In general, the major functions of apurchase dept. may include:
1. Initiating the Purchase2. Purchase Requisition3. Deciding Important Factors4. Studying the Market and Sources of Supply5. Placing the Purchase Order6. Follow Up7. Receiving and Inspecting the Goods8. Passing Invoices for Payment

28
1. Initiating the Purchase
The people who can initiate the purchase of material can be Store keeper, who has to keep his stores inplace. Different department heads, who want to acquire such materials, which do not form part of the storelist such materials are not usually kept in the store rooms.
2. Purchase Requisition
A form known as purchase requisition is commonly used as a formal request to the Purchase department forprocuring goods and services. It enlists all those articles for which the stock balance has come down toordering points.
The Purchase Manager places orders for goods as per the requisition received from the storekeeper or theDepartment Head. Generally purchase requisition is prepared in triplicate, the original copy is sent to purchasedepartment, second to the store department and third copy is kept by department who is preparing thepurchase requisition.
3. Deciding Important FactorsIt includes deciding upon the following issues.
What to Purchase? When to Purchase? How much to Purchase?
Purchase Requisition Form Cost Centre------- Date------
Please Purchase for ------------------- Department
Item No. Code No. Description Quantity Required
Remarks
Required By Checked By Approved By
For use of Department Issuing this requisition
For use of Purchase Department
Item No. Quantity in Stock
Consumption per Day
Item No. Purchase Order No.
Supplier Delivery Date
Store Keeper Purchase Officer

29
4. Studying the Market and Sources of Supply
After deciding quality, quantity, and the next step is to invite inquiries, tenders or quotations from theprospective suppliers in prescribed form with all-necessary details
The tenders received are tabulated in a chart. They are compared on different grounds like quality, quantity.Regarding sources of supply, purchase department must have full information of various sources of supplyof material, plant and other needs, keeping needs of material requirement of the concern. Records of pricesand quotations should be kept in comparative statement called schedule of quotations. A Purchase Manageris also expected to keep pace with current and expected changes in Government import and industriallicensing policy, emergence of substitutes, He should also be able to predict trend of market and marketprices, make a bargain on purchases.
Activity: C
1 Being Purchase Manager of an emerging business school you have to purchase 150 laptops forstudents. Which steps you need to take to purchase the laptops?
5. Placing the Purchase Order/ Supply Order
Deciding on sources of supply, the purchase manager prepares a purchase order, which is request made bythe purchaser to the supplier to deliver certain goods of requisite quality and quantity at the terms andconditions agreed between them. A purchase order gives complete details about quantity, quality, specificationof goods, rates approved, place and date of delivery, mode of transport, terms of payment etc. Beforeplacing the purchase executives or purchase manager needs to check the vendor rating which helps todecide on a reliable source who will give uninterrupted supply of material.
What is Vendor Rating
A Reliable vendor is the greatest asset of any organization which is must for correct and cordial Buyer-Seller relations. It is necessary to identify potential and reliable vendors and to maintain up to date records
Schedule of Quotations
XYZ Co.Ltd.
Schedule of Quotations
Material Code ------ Date------------
Serial No. Name of Party
Quantity offered
Rate per Unit
Time of Delivery
Quality Other Terms
Initial of Purchase manager---------
Purchase Order No.-----------
Date--------

30
in order to assess their performance. It is essential to compare one vendor’s performance with others inorder to improve the overall reliability and profitability. In order to fulfill the objective of getting a qualityproduct at minimum cost, It is essential to assess the vendor performance on the basis of price, delivery,quality and service. The purchase section should maintain a book of vendors and enter all complaints orfaults of them in order to blacklist any supplier for repeated failure.
6. Follow UpFollow up of purchase order in essential to keep pace with schedule of supply by the specified date so thatproduction work should not be interrupted. The purchase manager needs to ensure that material should besupplied on agreed date.
7 . Receiving and Inspecting the GoodsGenerally in large works a separate department known as receiving department receives the supplies and in
Purchase Order XYZ Co. Ltd To, No.-----
Date ------- Our Ref.------- Please supply the following items in accordance with the terms and conditions mentioned herein. Item No. Description Quantity Price Per Unit Total
Value Remarks
Delivery at------- Special Instruction Discount-------- Receipt of this order may please be Excise Duty-------- acknowledged Sale Tax------------ For XYZ Co. Ltd. Freight---------- Terms of payment------------ (Signature) Other particulars---------- ( For Office use only )
Acknowledgement received on Date of Delivery Challan No: Date:

31
small under takings, it is done by storekeeper. The delivery note/ advice note sent by supplier is handedover to receiving officials for checking goods with the advice notes.
If any deficiencies are noted the matter is taken up with the supplier by purchase department. Excesssupplies are either retained or returned to the suppliers. Goods received note is prepared by the receivingclerk after receiving, inspecting the goods and verifying them with advice note.
Goods Received Note (GRN)
A GRN gives the following details Serial number and Date Supplier name and address Description, Code, Quantity of goods received Order No., Supplier advice note number Inspection report of goods received Bin number where this material is to be entered.
8. Passing Invoices for Payment
The invoices received from the suppliers are passed on to the stores accountant who checks the invoicewith the supplier’s quotations, copy of the purchase order and goods received note. The quantity, qualityand rates of materials are checked and verified. After approving the invoices, these are sent to pay /accountsdepartment for payment to avail cash discounts for prompt payments, if any.
Accounting of Purchases
When the invoices of goods are received by the purchasing department, the purchase order is marked withthe invoice number to process the passing of a invoice. If the invoice is in order the purchasing officer willsign and pass it to the accounts department, where it will be checked by a clerk as to its accuracy. Theinvoice is then entered in the purchase journal. The journal will be posted daily to the purchase ledger andtotal purchase for a month will be entered into purchase account. The cashier will draw a cheque to clear thecreditor’s account.
XYZ Co. Ltd. No GRN ---------------
Goods Received Note Date--------------------
From(Supplier)
Goods Quantity received
No. Of Packing
Order No.
Advice Note
Inspection
Description Code No.
Quantity rejected
Remarks

32
Debit Note
Please remember a debit note is issued when goods are not according to the standard or received in excessof the order and to be returned. A Credit note may be issued under reverse circumstances.
Activity D:
1. Compare Debit note and credit note
3.5 Purchase policy
There are different systems of purchasing available to the industrial buyers. The system depends on factorslike demand, supply, price, urgency of requirement, vender, type of material, organization culture, power ofdelegation, procedures seasonal commodities etc. The basic objective of purchase policy is to buy therequired material in the right quantity from right source at the right time and price to obtain the maximumvalue for each rupee spend on material cost.
Large organizations usually have a written purchase policy, which clearly gives guidelines and direction to allthose related.
XYZ Co. Ltd. Debit note
From ------ No.------- Date------ We are debiting your A/C with the value of under mentioned materials for the reasons stated. Meanwhile we await your instructions.
Description Specification Price Amount
Our Order No. Our GRN No. Your D/N No. Date received
Different Purchasing System
Cash Purchase Tender
System
SubContract
Stock LessPurchaseSub
Contracting
Hedging
TorwardBying

33
Cash Purchase
In this system payments are made across the counter. Each department head is given some imprest amountand is authorized to purchase subject to a ceiling value per item. The major reason of purchase of such itemsis that, such items are required urgently.
Tender System: This system is generally adopted by government sector organizations; the main purpose isto procure materials at the most competitive rates and to eliminate the chances of undue favour to anysupplier. Buying should be as impersonal as possible and should foster a spirit of competition. Private sectororganizations adopt this method of purchase for items whose values are very high. Major disadvantage ofthis system is longer time for placing an order compared to other systems. Tender are of three types: -
Open tender Limited tender Single tender
When an advertisement is given at least three or four leading national newspapers will be called for opentender system: Limited tender means when quotations are invited only from registered suppliers andothers known sources to the buying organization. The main advantage of this tender is lead time is reduced.When there is only a single source of material the value of quotation is not very high. There are mainly formonopoly items.
Sub Contracting
This is most commonly used method of procuring manufactured components for few properly chosen items,if the buying organization feels that manufacturing cost will be higher compared to subcontracting cost. Thedecision to sub contract is based on factors such as capacity utilization, cost of manufacture, and availabilityof technology. Generally the sub contractors are smaller establishments with specialists in the line. Mostimportant consideration is to ensure whether the subcontractor would be able to meet delivery schedulesand quality requirements. The buying organization must carry out make/buy analysis before deciding uponsubcontracting.
System Contract
In this, the seller becomes the material planner for the buyer. It is long-term contract between the buyers andprovides for the automatic replenishment. The system is designed to assist both the buyer and the seller.Regularly consumed low value items are system contracted. The buyer has to be careful in the choice of thecontractor, because the agreement is of long duration. By adopting this system, the buyer can concentrateon costlier items and items of shortage, leaving other items to system contractor.
Stockless Purchase
Zero stock buying is a system, which largely depends upon sound relations between buyer and seller. If theseller /vendor has clear idea about the requirements of the buyer he can hold the stock at a convenientlocation, from where the buyer can draw from the warehouse according to his needs. As seller has wholeresponsibility to hold the stock as per buyer needs, he can charge more for his services. But this increasedprice is automatically compensated by decreased carrying cost for the buyer.
Blanket Order
Blanket order is generally entered for row value (ABC) C-class items. It is useful for the purchase of thoseitems, whose annual requirements cannot be effectively forecasted. The price can be agreed upon or can bethe prevailing market prices at the time of supply. An example of blanket order can be to place an order for

34
the annual supply of stationery items. The buyer can get quantity discount, as he is placing order for a longerperiod. The seller will have to concentrate more on services than on trying to convince the buyers.
Forward Buying
In this, the buyers commit to buy at a future date a contracted quality at contracted price, whatever may bethe ruling market price then. The buyer does so with a speculative interest that the prices will rise in future.He wants to protect the organization from any future shortage or due increases in price. Forward buyinghelps buyers and sellers to ensure themselves against uncertainties arising from frequent changes in thesupply and demand.
Hedging
Hedging is totally different from forward buying .The buyer tries to protect himself in the future by enteringinto two transactions, a purchase and a sale in two markets, whose prices move up and down together. Butsuch perfect conditions do not exist in the market. So hedging is basically a tool for protecting against futurelosses due to difference in different markets.
Activity E:1 After going through different purchase system which system do you think is most suitable
for?a) Automobile Industryb) Infrastructure Industryc) Public sector undertakings
3.6 Principles of Skillful Buying
After going through the purchase cycle, different purchase systems we can say that skillful buying dependsupon skillful handling of five rights which are:
Right Quality
The existence of each organization depends upon its valuable customers and they want quality. For apurchase executive quality is the key parameter to decide on purchasing. Right quality of raw material is thebase for finished product. Now who decide about the quality of raw material being used, though theresponsibility is of design department but the purchase division being eyes and ears of the organization arein better position to suggest about sources and alternatives so that the minimum price is paid for maximumbenefit.
Right Quantity
Right quantity means the ideal size of material which should always be available in the stores, so that thereshould no interruption due to shortage of raw material and supplies. Excess material and shortage of materialboth the situation are bad for any manufacturing concern .excess stock means blockage of capital, warehousingcost ,insurance cost, maintenance cost and loss due to obsolescence and spoilage. In case of shortage ofmaterial means cost of men and machines rendered idle, interruption in production will result in delay oftimely supply of goods in the market. So it is very important to decide on right quantity to be ordered, it canbe done with the help of deciding inventory levels and with EOQ technique.

35
Right Prices
This is the most difficult parameter for any purchase executive to decide, because high price does notnecessarily means high quality and lowest price need not be the best price .actually right price means whichbrings the best ultimate value associated with other factors like quality, quantity, delivery and standards. Avendor need to adhere to quality ,quantity and time schedule if he is not keep these requirements, though hisprices may be the lower but actual cost to the organization will be more. If the vendor is not able to maintainthe quality, it will lead to rejections
Right Source
The success of purchase executive depends on how carefully he has selected his suppliers. If the materialdoes not reach on time or if it is of inferior quality, the organizations production cost will increase due toincreased idle time, increased rejections or high input cost. To decide about the right source the purchaseexecutive needs to be fully aware about the track record, rating, financial capability of the supplier, deliveryrecords, capability of handling emergency demands. Sources of material supply should be selected withextra care as these relations go a long way with the organization
Right Time
Right time means to identify when an order is to be placed. There is always a time gap between placing anorder, procuring them and supplying them to the point of production. This time gap is called lead time.there is a direct relationship between lead time and inventory longer the lead time more the need of workingcapital. Lead time and consumption rate can change any time without prior information a store has to takeof all these uncertain circumstances. The purchase should have right sources or supplier who have proventrack record of timely delivery of materials.
Activity F:
1 As purchase manager of a leading concern add few more skills which a person should have forskillful buying?
3.7 Summary
Material planning, buying, receiving, inspecting is scientific process which needs to have skills of differenttypes. An organization needs to decide which method of buying centralized or decentralized is to be followedfor what type of material. There are so many factors which decide the quality, quantity, price, source andtime of material to be purchased. Material planning is not necessarily a board room activity in different typesof organization it varies depending upon the size, needs, demand of the organization.
3.8 Self Assessment Questions
1 “The purchase department is a profit centre” discuss.
2 How efficient buying can contribute to savings for the organization?
3 Write short note on:
Stock less purchase Tender purchase Lead time System contract GRN Purchase order
36
4 What is centralization and decentralization in material management? Compare and contrast betweenthe two.
5 What are the different steps followed by purchase department to fulfill the purchase needs ofthe organization?
6 What do you understand by 5R‘s of buying? Discuss.
3.9 Reference Books
- Horngren.T.chareles, Datar.M.Srikant “Cost Accounting a Managerial Emphasis” Pearson
- Gopalakishanan.P., “Purchasing and Material Management”, Tata McGraw-Hill educationpvt Ltd.
- Bhar B.K., “Cost accounting”, Academic publications.
- Jain & Narang, “Cost Accounting”, Kalyani Publications, New Delhi

37
Unit - 4 : Material : Stores Organization and Control
Structure of Unit:
4.0 Objectives4.1 Introduction4.2 Material Issue Procedure4.3 Material Storage4.4 Store Record4.5 Inventory Control4.6 Techniques of Inventory Control4.7 Summary4.8 Self Assessment Questions4.9 Reference Books
4.0 Objectives
After completing this unit, you will be able to:
Describe the procedure involved in material storage. Understand the concept of inventory control and its need and importance. Understand the various inventory records. Understand the various inventory control techniques.
4.1 Introduction
Materials constitute a very significant proportion of total cost of finished product. More than fiftypercent of the total cost of the product or job is generally the cost of materials alone, in severalindustries. Therefore, a control of the cost of the materials is quite essential to meet the objectivesof cost control and cost reduction.
This control is exercised beginning from the point the orders are prepared for being placed withsuppliers, and ending at the point the materials are effectively utilized in production or are disposedoff otherwise. We have acquired a basic knowledge about the materials procurement procedure inprevious unit and in this unit we will be study about the material storage, inventory record,inventory control and its various techniques.
4.2 Material Issue Procedure
Issue of material must not be made except under properly authorized requisition slip; usually it is theforeman of a department who has the authority to draw materials from the store. Issue of materialmust be made on the basis of first in fist out, that is, out of the earliest lot on hand. If care is notexercised in this regard, qualify of earliest lot of material may deteriorate for having been kept for along period.
Material Requisition Note: It is the voucher of the authority as regards issue of materials for use in thefactory or in any of its departments. Where a ‘Materials List’ has been prepared, either the whole of thematerials would be withdrawn on its basis or separate materials requisitions would be prepared by theperson or department and the material drawn up to the limit specified in the list. The requisition notes are

38
made out in triplicate. The copies are distributed in the following manner:
To store-keeper To cost department To department requiring it
If no material list has been prepared, it is desirable that the task of the preparation of material requisitionnotes be left to the planning department. If there is no planning department,(or although in existence,is unable to undertake this task), the requisition notes should be prepared by the person or departmentthat requires the materials. Usually, a foreman’s authority is enough but, in the case of costly materials,it would be desirable to have such requisition duly approved by some higher authority, like theSuperintendent or Works Manager before these are presented to stores.
Performa of Material Requisition Note
Material Requisition Note
Work Order No………………… No………………………………
Department…………………………. Date……………………….
Item No. Particulars Quantity Rate Amount
Store keeper Workman receiving the material Foreman S.L. clerk
Bill of Material: It is also known as material specification list or simply material list. It is a schedule ofstandard quantities of materials required for any job or other unit of production. A comprehensive materialslist should rigidly lay down the exact description and specification of all material required for a job or otherunit of production and also required quantities so that if there is any deviation from the standard list, it caneasily be detected. The materials list is prepared by the engineering or planning department in a standardform. The number of copies prepared varies according to the requirement of each business, but four is theminimum number. A copy of it is usually sent to each of the following department:
· To store department· To cost account department· To production control department· To planning department
The advantages of using “bill of material”, by the above departments may be summed up as follows:-
Stores Department:1. A bill of material serves as an important basis of preparing material purchase requisitions by stores
department.2. It acts as an authorization for issuing total material requirement.3. The clerical activity is reduced as the stores clerk issues the entire/part or the material requirement
to the users if there details of material asked are present in the bill of materials.

39
Cost Accounts Department:1. Bill of material is used by Cost account department for preparing an estimate/budget of material
cost for the job/process/operation.2. It may be used as a device for controlling the excess cost material used. This is done after
determining material variances and ascertaining the reasons for their occurrence.
Production Control Department:1. Bill of material may be used by this department for controlling usage of materials.2. Its usage saves time which otherwise would have been wasted for preparing separate requisitions
of materials.
Engineering or Planning Department: As stated earlier this department prepares the materials list in astandard form. A copy of list is sent to stores, cost accounts and production control department.
Proforma of Bill of Materials
Bill of Materials
Job No………………………….. No…………………………
Department authorized………….. Date………………………..
SI. Code Description Qty. Date of Rate AmountNo. No. Issue & Qty. Rs. Rs. Issued Date Qty.
Authorized by…………............ Received by……………
Store keeper’s signature……..... Cheeked by……………..
Cost clerk………………
Difference between Bills of Material and Material Requisition Note
Bills of Material Material Requisition Note It is the document prepared by the drawing office.
It is prepared by the foreman of the consuming department.
It is complete schedule of component parts and raw materials required for a particular job of work order.
It is a document authorizing store-keeper to issue materials to the consuming department.
It often serves the purpose of a stores requisition as it shows the complete schedule or materials required for a particular job i.e. it can replace stores requisition.
It cannot replace a bill of materials.
It can be used for the purpose of quotations.
It is useful in arriving historical cost only.
It helps in keeping a quantitative control on materials drawn through stores requisition.
It shows the material actually drawn from stores.

40
Transfer of Material (Inter – departmental transfer of materials): The surplus material arising on ajob or other units of production may sometime be unsuitable for transfer to stores because of its bulk, heavyweight, brittleness or some such reason. It may, however, be possible to find some alternative use for suchmaterials by transferring it to some other job instead of returning it to the store Room.
It must be stressed that generally transfer of material from one job to another is irregular, if not improper, inso far it is not conducive to correct allocation and control of material cost of jobs or other units of production.It is only in the circumstances envisaged above that such direct transfer should be made, at the time ofmaterial transfer a material transfer note should be made in duplicate, the disposition of the copies of this notbeing are as follows :
To cost department
To department making transfer
No copy is required for the store as no entry in the stores records would be called for. The cost departmentwould use its copy for the purpose of making the necessary entries in the cost ledger accounts for the jobsaffected.
Proforma of the Material Transfer Note
Material transfer note
From Job No.. ………………… No. …………………………
To job No.…………………….. Date…………………………
Item no. Particulars Rate Amount
Transferred by Received by Job ledger clerk
Return of Material: Sometimes, it is not possible before end to make any precise estimate of the materialrequirements or units of production. Besides, at times due to some technical or other difficulty, it is notpracticable to measure exactly the quantity of material required by a department. In either case, materialmay have to be issued from stores in bulk, often in excess of the actual quantity required. Where such aconditions exists, it is of the utmost important from the point of view of materials control that any surplusmaterial left over on the completion of a job should be promptly hand over to the storekeeper for safe andproper custody.
Unless this is done, the surplus material may be misappropriated or misapplied to some purpose, other thanthat for which it was intended. The material cost of the job against which the excess material was originallydrawn in that case, would be overstated unless the job is given credit for the surplus arising there on.
The surplus material, when it is returned to the store room, should be accompanied by a document knowneither as a shop credit note of alternatively as a stores debit note. This document should be made out bythe department returning the surplus material and it should be in triplicate to be used as follows:
Store room Cost department Department returning it

41
Proforma of Shop Credit NoteShop Credit Note
Job No. …………………… No. ……………..Department………………. Date……………..
Item No. Particulars Quantity Rate Amount
Store –keeper S.L.clerk Foreman of returning department
Activity A:
1. After study of above material issue procedure you think that a systematic issue procedureenhance control over material. Why?
4.3 Material Storage
Proper Storing of materials is of primary importance. It is not enough only to purchase material of therequired quality. If the purchased material subsequently deteriorates in quality because of bad storage, theloss is even more than what might arise from purchase of bad quality materials. Apart from preservation ofquality, the store-keeper also must ensure safe custody of the material. It should be the function of store-keeper that the right quantity of materials always should be available in stock.
4.3.1 Duties of Store Keeper:
These can be briefly set out as follows:
1. To exercise general control over all activities in stores department2. To ensure safe keeping both as to quality and quantity of materials.3. To maintain proper records4. To initiate purchase requisition for the replacement of stock of all regular stores items wherever to
stock level of any item of store reaches the minimum limit fixed in respect thereof.5. To initiate action for stoppage of further purchasing when the stock level reaches the maximum limit.6. To check and receive purchased materials forwarded by the receiving department and to arrange
for the storage in appropriate places.7. To reserve a particular martial for a specific job when so required.8. To issue materials only in required quantities against authorized requisition notes/material lists.9. To check the book balances, with the actual physical stock at frequent intervals by way of internal
control over wrong issues, pilferage, etc.
4.3.2 Minimizing the Cost of Purchasing and Store-Keeping:
There are two types of costs which are involved in making a purchase and keeping the goods in the store:
For placing each order, a certain amount of labor is required and, therefore, it will involve a certain sum ofmoney as cost, it is called ordering cost. It should be noted that the cost of making a purchase not onlyincludes the cost incurred by the purchasing department but it also includes the cost of receiving and inspectingthe goods. These costs will naturally increase if the number of order is large; there can be saving if thenumber of orders is reduced.

42
The other type of cost is concerned with keeping the goods in stock it is called carrying cost or holdingcost. It comprised the money invested, the loss which is likely to take place if the goods are kept, theexpenses incurred on looking after the items etc. larger the stock, higher will be this type of cost. In order toreduce this cost, it is necessary to bring down level of the stock.
It may be noted that the number of orders can be cut down only, if the quantity of each order is increased,but if that is done, the average quantity of hand will increase and, therefore, interest and the cost of storekeeping will be higher. It is necessary, therefore to have balance between those two costs and to keep totalof the two at the minimum level. With this objective in view, the Economic Order Quantity is worked out.But different items for stock have to be treated differently. The name given to such classification is the‘ABC’ Analysis, or the Selective Inventory Control.
4.3.3 Different Classes of Stores:
Stores are classified in following three types
Central or Main Store
Sub-Store
Departmental Store
Central Store: The central stores are the most common of all and in practice, factories generally have onlya central store under the control of one store keeper. Such a store is centrally situated and is easily accessibleto all departments. If receipts and issues of different items of stores are not large, and the various departmentsare close to each other, one ventral store for all purposes is sufficient.
Sub-Store: In big organizations, particularly in the case of collieries, tea gardeners, etc., where the workspots are distributed over a large area, sub-stores are created. A sub-store is in fact a branch of the centralstore. It is generally created to facilitate easy accessibility to the various work spots or consumption centers.Only the essential items, as well as those required urgently, are kept in them. The issues to sub-stores arenot treated as consumption but only as a transfer, from one store (central) to another sub-store. The controlin the matter of ordering or receiving rests with the central stores and the sub-stores do not generally receiveany item directly.
Departmental Store: Departmental stores are created normally to minimize the time spent on drawingfrom stores. For example, a week’s supply may be drawn at one time and kept in a departmental store at aplace marked for the purpose. Such stores, however, are essential where one or more productiondepartments work in multiple shifts and the central store works for only one shift; also for the storage ofwork in progress and semi-finished components where these are large in number or in bulk. Unlike a substore in the departmental store, the control rests with the department in charge. The materials are generallyissued in bulk to the departmental store and it is the responsibility of the department-in-charge to keepproper accounts as regards issues and stock. If the bulk of material is required for only on department, it isusually stored near the department under the charge of the superintendent concerned.
4.3.4 Stores Location:
The location of store should be carefully planned. It should be near to the material receiving department sothat transportation charges are minimum. At the same time, it should be easily accessible to all otherdepartments of the factory, railway siding, roads etc. Planned location of the stores department avoidsdelay in the movement of materials to the departments in which they are needed.
43
4.3.5 Stores Layout:
The store should be adequately provided with necessary racks, drawers, and other suitable receptacles forstoring materials. Each place where materials are kept is called a bin. For example- drawer or rack or acorner. Each bin should be seriously and systematically numbered and for every item a bin allotted, forconvenience of access. The number of the bin should be entered in the store ledger concerned accounts.
Activity B:
1. Discuss briefly duties of store keeper.
2. Write five industries and classify their store type.
4.4 Store Record
The record of stores may be maintained in three forms:
Bin Cards Stock Control Cards Stores Ledger
The first two forms of accounts are records of quantities received, issued and those in balance, but the thirdone is an accounts of their cost also. Usually, the accounts are kept in two forms, the quantitative in the storeand quantitative-cum-financial in the cost department.
4.4.1 Bin Cards and Stock Control Cards
Both are essentially and mostly similar and contain quantitative records of stores. Stock cards containfurther information’s regarding stock on order. Bin cards are kept attached to the bins or receptacles orquite near there to so that these also assist in the identification of stock. The stock control cards, on otherhand, are kept in cabinets or trays of loose binders.
Advantages of Bin Cards:
1- There would be fewer chances of mistakes being made as entries will be made at the same time asgoods are received or issued by the person actually handling the materials.
2- Control over stock can be more effective, in as much as comparison of the actual quantity in handat any time with the book balance is possible.
3- Identification of the different items of material is facilitated by reference to the bin card the bin orstorage receptacle.
Disadvantages of Bin Cards:
1- Store records are dispersed over a wide area.
2- The cards are liable to be smeared with dirt and grease because of proximity of material and alsobecause of handling materials.
3- People handling materials are not ordinarily suitable for the clerical work involved in writing bincards.
Advantages of Stock Control Cards:1- Records are kept in a more compact manner so that reference to them is facilitated.2- Records can be kept in a neat and clean way by men solely engaged in clerical work so that a
division of labour between record keeping and actual material handling is possible.

44
3- As the records are at one place, it is possible to get an overall idea of the stock position without thenecessity of going round the stores.
Disadvantages of Stock Control Cards:
1- On the spot comparison of the physical stock of an item with its book balance is not facilitated.
2- Physical identification of materials in stock may not be as easy as in the case of bin cards, as thestock control cards are housed in cabinets or trays.
4.4.2 Stores Ledger
A modern stores ledger is a collection of cards or loose leaves specially ruled for maintain a record of bothquantity and cost of stores received. Issued and those in stock. It is a subsidiary ledger to the main costledger and maintained by the cost accounts department. It is posted from goods received notes and materialsrequisitions. The advantages of writing up stores ledger mechanically are:
1- It enables distribution of work among a number of clerks due to which receipts and issues areposted quickly and regularly.
2- It enables stock records to be centralized in case of an organization having a number of depots.3- The accuracy of posting can be mechanically tested more conveniently.4- The records are clean and neater. Also the recurring cost of maintaining them is much less than those
kept manually.5- If up-to-date records are available, the management will be able to exercise greater control over
quantities held in stock from time to time which may result in a great deal of saving in both theamount of investment in stock and their cost.
Now-a-days, mostly a duplicate record of issues and receipt of materials is kept one on bin cards in thestore and the second in the stores ledger in the costing department.
Difference between bin card & stores ledger
4.4.3 Treatment of Shortages in Stock Taking
At the time of stock taking generally discrepancies are found between physical stock shown in the bin cardand stores ledger. These discrepancies are arising due to shortages and losses. The reasons of thesediscrepancies may be classified as unavoidable or avoidable.
Bin Card Stores Ledger
It is maintained by the storekeeper in the store
It is maintained in costing department.
It contains only quantitative details of material received, issued and returned to stores.
It contains information both in quantity and cost.
Entries are made when transactions take place.
It is always posted after the transaction.
Each transaction is individually posted. Transactions may be summarized and then posted.
Inter-department transfers do not appear in Bin card.
Material transfers from one job to another job are recorded for costing purposes.

45
Losses arising from unavoidable causes should be taken care of by setting up a standard percentage of lossbased on the study of the past data. The issue prices may be inflated to cover the standard loss percentage.Alternatively, issues may be made at the purchases price but the cost of the loss or shortage may be treatedas overheads.
Actual losses should be compared with the standard and excess losses should be analyses to see whetherthey are due to normal or abnormal reasons. If they are attributable to normal causes, an additional chargeto overheads should be made on the basis of the value of materials consumed. If they arise from abnormalcauses, they should be charged to the costing profit and loss account.
Avoidable losses are generally treated as abnormal losses. These losses should be debited to the costingprofit and loss account.
Losses or surpluses arising from errors in documentation, posting etc., should be corrected through adjustmententries.
Activity C:
1. Discuss advantages and disadvantages of bin card and stock control cards.2. Discuss treatment of shortages in stock taking.
4.5 Inventory Control
4.5.1 Meaning of Inventory and Inventory Control
Inventory means “a schedule of items held at a particular point of time.” Inventory comprises ofstocks of materials, components, work-in-progress, and finished products and stores and spares. The mainobjective of inventory control is to achieve maximum efficiency in production and sales with the minimuminvestment in inventory. Inventory control refers supervision of supply, storage and accessibility of items ofinventory in order to ensure adequate supply without excessive oversupply. Material control is an importantmanagerial function which is directed to ensure that required quantity and quality of material is provided atthe proper time with the minimum amount of capital.
Inventory control is affected by coordination and control activities relating to planning, sourcing, purchasing,moving and storing of materials. Inventory control and material control are synonym.
4.5.2 Scope of Inventory Control
1. Production, Planning and Control:
(a) Preparation of detailed schedule of parts and materials required to be produced by purchase ormanufacture in order to realize an outlined production programmed or sales forecast approved bythe top management.
(b) Control of shop loading and other activities to be carried out concurrently to avoid hold- ups inproduction.
2. Storage Exercises:
(a) Control on physical handling of parts and materials.
(b) Exercising control on materials in stock to prevent physical deterioration and theft. Etc.
3. Inventory Planning and Control: Control of policies and procedures to regulate systematicallythe parts and materials kept in stock.

46
4. External Transport, Control for Efficient Usage of External Transport Activities: Theseactivities are concerned with the movement of materials from suppliers to the manufacturers andfrom the manufacturers to customers.
5. Internal Transport and Material Handling: Control over the efficient use of material transportand material handling instruments. The internal transport and material handling tools etc. are usedfor movement of material from one point to another within the factory.
4.5.3 Advantages of Material Control
(a) It eliminates wastages in use of raw materials and supplies in course of purchase , storage handlingand use.
(b) Reduces the risk of fraud and theft.
(c) Ensures uninterrupted flow of materials of the right quality for use in production.
(d) Facilities preparation of accurate monthly financial statements required for various managementinformation reports.
(e) Furnishes quickly and accurately the value of material and supplies used in various departments.
(f) Reduces to the minimum the capital locked up in inventories.
(g) Prevents production hold ups by supplying proper quantities at right time. And provides foraccountability on the part of those who are responsible for exercising material management.
Activity D:
1. Discuss about inventory control in reference of various five industries.
2. Discuss advantages of inventory control.
4.6 Techniques of Inventory Control
The techniques or the tools commonly applied to effect control over the inventory are following:
Techniques of inventory control:
1. Setting of Various Stock Levels.2. ABC Analysis.3. Two Bin System.4. Establishment of System of Budgets.5. Use of Perpetual Inventory Records and Continuous Stock Verification.6. Determination of Economic Order Quantity.7. Review of Slow and Non-moving Materials and Stock Items.8. Use of Control Ratios.
1. Setting of Various Stock Levels:
To avoid over-stocking and under-stocking each item of the inventory has the maximum levels, minimumlevels and an order point.
(a) Minimum Level:
The lowest figure of inventory balance, which must be maintained in hand at all times, so that there is nostoppage of production due to non-availability of inventory. It is also known as ‘Buffer stock’, ‘Safetystock’ ‘minimum limit’ or ‘Minimum stock’.

47
The main considerations for the fixation of minimum level of inventory are as follows:
1. Information about maximum consumption and maximum delivery period in respect of each item todetermine its re-order level.
2. Average rate of consumption for each inventory item.
3. Average delivery period for each item. This period can be calculated by averaging the maximumand minimum period.
The formula used for its calculation is as follows:
Minimum level of inventory = Re-order level – (average rate of consumption x average timeof inventory delivery)
(b) Maximum Level:
It indicates the maximum quantity of inventory quantity held in stock at any time. It is also known as‘Maximum limit’ or ‘Maximum stock’.
The important considerations which should govern the fixation of maximum level for various inventory itemsare as follows:
1. The fixation of maximum level of an inventory item requires information about its re-order level. There-order level itself depends upon its maximum rate of consumption and maximum delivery period.It in fact is the product of maximum consumption of inventory item and its maximum delivery period.
2. Knowledge about minimum consumption and minimum delivery period for each inventory itemshould also be known.
3. The determination of maximum level also requires the figure of economic order quantity.4. Availability of funds, storage space, nature of items and their price per unit are also important
for the fixation of maximum level.5. In the case of imported materials due to their irregular supply, the maximum level should be
high.
The formula used for its calculation is as follows:
Maximum level of inventory = Re-order-level + Re-order quantity - (Minimum Consumptionx Minimum re-order period)
(c) Re-Order Level:
It is also known as ‘Ordering level’, ‘Reorder point’. Order point is a point at which order for supply ofmaterials or goods is placed. This level lies between minimum and the maximum levels in such a way thatbefore the material orders is received into the stores, there is sufficient quantity on hand to cover bothnormal and abnormal consumption situations. In other words, it is the level at which fresh order should beplaced for replenishment of stock.
The formula used for its calculation is as follows:
Re-order level = Maximum re-order period x maximum Usage (or) = Minimum level + (averagerate of consumption x average time to obtain fresh supplies).
Average Inventory level:
This level of stock may be determined by using the following equal formula:
48
(d) Average inventory level = Minimum level + ½ Re-order quantity
Or
= Maximum level + Minimum level \ 2
(e) Danger Level:
It is the level at which normal issues of the raw material inventory are stopped and emergency issues areonly made. As and when the danger level is reached, the material has to be purchased at any price at whichavailable.
The formula used for its calculation is as follows:
Danger level = Average Consumption x Lead time for emergency purchases
Illustration: 1
Two Components, A and B are used as follows:
Normal usage 50 per week eachMaximum usage 75 per week eachMinimum usage 25 per week eachRe-order quantity A : 300; B : 500Re-Order period A : 4 to 6 Weeks
B: 2 to 4 weeks
Calculate for each component (a) Re-ordering level, (b) Minimum level,(C) Maximum level (d) AverageStock level.
Solution:
(a) Re-ordering level:
Maximum usage per week x Maximum delivery period.
Re-ordering level for component A = 75 units x 6 Weeks = 450 unitsRe-ordering level for component B = 75 units x 4 Weeks = 300 units
(b) Minimum level :
Re-order leave – (Normal usage x average period)Minimum level for component A = 450 units - 50 units x 5 weeks = 200 unitsMinimum level for component B = 300 units - 50 units x 3 weeks = 150 units
(c) Maximum level :
ROL + ROQ – (Min. Usage x Minimum period)Maximum level for component A = (450 units + 300 units) – (25 units x 4weeks) = 650 unitsMaximum level for component B = (300 units + 500 units) – (25 units x 2 weeks) = 750 units
(d) Average stock level :
½ (Minimum + maximum) Stock levelAverage stock level or component A = ½ (200 units + 650 units) = 425 units.Average stock level for component B = ½ (150 units + 750 units) = 450 units.

49
Activity E:
1. Discuss about various stock levels.
2. ABC Analysis:
This system exercises control over different items of stores classified on the basis of the investment involved.Usually the items are divided into three categories according to their importance, namely, their value andfrequency of replenishment during a period.
(i) ‘A’ Category of items consists of only a small percentage i.e. about 10% of the total itemshandled by the stores but require heavy investment about 70% of inventory value, becauseof their high prices or heavy requirement or both.
(ii) ‘B’ Category of items is relatively less important; they may be 20% of the total items ofmaterial handled by stores. The percentage of investment required is about 20% of thetotal investment in inventories.
(iii) ‘C’ Category of items does not require much investment; it may be about 10% of total inventoryvalue but they are nearly 70% of the total items handled by store.
‘A’ Category of items can be controlled effectively by using a regular system which ensures neitherover-stocking nor shortage of material for production. Such a system plans its total materialrequirements by making budgets. The stocks of materials are controlled by fixing certain levels likemaximum level, minimum level and re-order level.
A reduction in inventory management costs is achieved by determining economic order quantitiesafter taking into account ordering cost and carrying cost. To avoid shortage and to minimize heavyinvestment in inventories, the techniques of value analysis, variety reduction, standardization etc.,may be used.
In the case of ‘B’ category of items, as the sum involved in moderate, the same degree of control asapplied in ‘A’ category of items is not required the orders for the items, belonging to this categorymay be placed after reviewing their situation periodically.
For ‘C’ category of items, there is no need of exercising constant control. Orders for items in thisgroup may be placed either after six months or once in a year, after ascertaining consumptionrequirements. In this case the objective is to economies on ordering and handling costs.
Illustration - 2:
A factory uses 4,000 varieties on inventory. In terms of inventory holding and inventory usage, and followinginformation is compiled:
No. of varieties of % %value of inventory %of inventory usageinventory holding (average) (in end-product)
3,875 96.875 20 5
110 2.750 30 10
15 0.375 50 85
4,000 100 100 100
Classify the items of inventory as per ABC analysis with reasons.

50
Solution:
Classification of the items of inventory as per ABC analysis
1. 15 number of varieties of inventory items should be classified as ‘A’ category items because of thefollowing reasons:(i) Constitute 0.375% of total number of varieties of inventory handled by stores of factory,
which is minimum as per given classification in the table.(ii) 50% of total use value of inventory holding (average) which is maximum according to
the given table.(iii) Highest in consumption about 85% of inventory usage (in end-product).
2. 110 number of varieties of inventory items should be classified as ‘B’ category items becauseof the following reasons :(i) Constitute 2.750% of total number of varieties of inventory items handled by stores of
factory.(ii) Requires moderate investment of about 30% of total use value of inventory holding
(average).(iii) Moderate in consumption about 10% of inventory usage (in end-product).
3. 3,875 number of varieties of inventory items should be classified as ‘c’ category item becauseof the following reasons:(i) Constitute 96.875% of total varieties of inventory items handled by stores of factory(ii) Requires about 20% of total use value of inventory holding (average).(iii) Minimum inventory consumption i.e. about 5% of inventory usage (in end-product).
Advantages of ABC analysis: the advantages of ABC analysis are the following:
(i) Continuity in production: It ensures that, without there being any danger of interruption ofproduction for want of materials of stores, minimum investment will be made in inventories ofstocks of materials or stocks to be carried.
(ii) Lower cost: The cost of placing orders, receiving goods and maintaining stocks is minimizedspecially, if the system is coupled with the determination of proper economic order quantities.
(iii) Less attention required: management time is saved since attention need be paid only tosome of the items rather than all the items as would be the case if the ABC system was not inoperation.
(iv) Systematic working: With the introduction of the ABC system, much of the work connected withpurchases can be systematized on a routing basis to be handled by subordinate staff.
Activity F:
1. Discuss about ABC analysis and its application in various industries.
2 . Discuss advantages of ABC analysis.
3. Two Bin System:
Under this system each bin is divided into two parts – one, smaller part, should stock the quantity equal tothe minimum stock or ever the re-ordering level, and the other to keep the remaining quantity, issues aremade out of the large part; but as soon as it becomes necessary to use quantity out of the smaller part of the

51
bin, fresh order is placed. ‘Two Bin System’ is supplemental to the record of respective quantities on the bincard and the store ledger card.
4. Establishment of System of Budgets:
To control investment in the inventories, it is necessary to know in advance about the inventories requirementduring a specific period usually a year. The exact quantity of various type of inventories and the time whenthey would be require can be known by studying carefully production plans and production schedules.Based on this, inventories requirement budget can be prepared. Such a budget will discourage the unnecessaryinvestment in inventories.
5. Use of Perpetual Inventory Records and Continuous Stock Verification
According to terminology of cost accountancy “perpetual inventory is a system of records maintainedby the controlling department, which reflects the physical movement of stocks and their currentbalance.”
Perpetual inventory represents a system of records maintained by the stores department. The records usedfor perpetual inventory are:
(i) Bin card;(ii) stores ledger accounts;(iii) The forms and documents used for receipts, issue and transfer of materials.
Bin card maintains a quantitative record of receipts, issues and closing balances of each item ofstores. Separate bin cards are maintained for each item. Each card is filled up with the physicalmovement of goods i.e. on its receipt and issue.
Like bin cards, the store ledger are maintained to record all receipt and issue transactions in respect ofmaterials. It is filled up with the help of goods received note and material issue requisitions.
A perpetual inventory is usually checked by a programme of continuous stock taking. Continuous stocktaking mean the physical checking of those records (which are maintained under perpetual inventory) withactual stock. Perpetual inventory is essential for material control. It incidentally helps continuous stocktaking.
The success of perpetual inventory depends upon the following:
(a) The stores ledger-(showing quantities and amount of each item).(b) Stock control cards (or bin cards).(c) Reconciling the quantity balances shown by store ledger & stock control cards.(d) Checking the physical balances off number of items every day systematically and by rotation.(e) Explaining promptly the causes of discrepancies, if any, between physical balances and book figures.(f) Making corrective entries where called for after step analyzing discrepancies and(g) Removing the causes of the discrepancies.
Advantages – The main advantages of perpetual inventory are as follows:(1) Physical stocks can be counted and book balances adjusted as and when desired without waiting
for the entire stock – taking to be done.(2) Quick compilation of profit and loss account (for interim period) due to prompt availability of stock
figures.

52
(3) Discrepancies are easily located and thus corrective action can be promptly taken to avoid theirrecurrence.
(4) A systematic review to the perpetual inventory reveals the existence of surplus, inactive, obsoleteand slow-moving materials, so that corrective measures may be taken in time.
(5) Fixation of the various stock levels and checking of actual balances in hand with these levels assistthe store keeper in maintaining stocks within limits and in initiating purchase requisitions for correctquantity at the proper time.
Continuous Stock Verification – The checking of physical inventory is an essential feature of every soundsystem of material control. Such a checking may be periodical or continuous. Annual stock-taking, however,has certain inherent shortcomings which tend to detract from the usefulness of such physical verification. Forinstance, since all the items have to be covered in a given number of days. Either the production departmenthas to be shut down during those days to enable thorough checking of stock or else the verification must beof limited character.
Moreover, in the case of periodical checking there is the problem of finding an adequately trained contingent.It is likely to be drawn from different departments where stock-taking is not the normal work and they areabout to discharge such temporary duties somewhat perfunctorily. The element of surprise, that is essentialfor effective control is wholly absent in the system. Then if there are stock discrepancies, they remainundetected until the end of the period. Often, the discrepancies are not corrected.
The system of continuous stock-taking consists of counting and verifying the number of items daily throughoutthe year so that during the year all items of stores are converged three or four times. The stock verifiers areindependent of the stores, and the stores staff has no foreknowledge as to the particular items that would bechecked on any particular day. But it must be seen that each item is checked a number of times in a year.
Advantages – The advantages of continuous stock-taking are:1. Closure of normal functioning is not necessary.2. Stock discrepancies are likely to be brought to the notice and corrected much earlier than
under the annual stock-taking system.3. The system generally has a sobering influence on the stores staff because of the element of surprise
preset therein.4. The movement of stores items can be watched more closely by the stores auditors so that chances
of obsolescence buying are reduced.5. Final accounts can be ready quickly. Interim accounts are possible quite conveniently.
6. Determination of Economic Order Quantity (EOQ) –How much to purchase at one time:
Purchase department in manufacturing concerns is usually faced with the problem of deciding the ‘quantityof various items’ which they should purchase. The matter under consideration is not ‘how much to purchase’but ‘how much to purchase at one time.’ If purchases of material are made in bulk then inventory carryingcost will be high. On the other hand if order size is small each time, then the ordering cost will be high. Inorder to minimize ordering and carrying costs it is necessary to determine the order quantity which minimizesthese two costs.
Economic order quantity is an order size. The size of the order for which both ordering and carrying costare minimum, is known as economic order quantity.

53
Ordering Cost: The cost which is associated with the purchasing or ordering of material. It includes costsof staff posted for ordering for goods, expenses incurred on transportation of goods purchased, inspectioncost of incoming material etc.
Carrying Cost: The cost for holding the inventories. It includes the cost of capital invested in inventories.Cost of storage, insurance cost etc.
Assumptions underlying E.O.Q.: The calculation of economic order of materiel to be purchased is subjectto the following assumptions:
(i) Ordering cost per order and carrying cost per unit per annum are known and they are fixed.(ii) Anticipated usage of material in units is known.(iii) Cost per unit of the material is constant and is known as well.(iv) The quantity of material ordered is received immediately i.e. the lead time is zero.
The famous mathematician Wilson derived the formula which is used for determining the size of order foreach of purchases at minimum ordering and carrying costs.
The formula given by Wilson for calculating economic order quantity is as follows:
EOQ =
Where, A = Annual usage in unitsO = Ordering cost per orderC = Annual carrying cost of one unit, i.e., carrying cost per unit per ann (Carrying costpercentage x cost of one unit)
Activity G:
1. Discuss about EOQ and its utility.
Illustration - 3:
Calculate the Economic order Quantity from the following information. Also state the number of orders tobe placed in a year.Consumption of materials per annum : 10,000 kg.Order placing cost per order : Rs. 50Cost per kg. of raw material : Rs. 2Storage costs : 8% on average inventory
Solution:
2AOEOQ
C
A = Annual consumption in unitsO = Ordering cost per orderC = Inventory carrying cost per unit per annum
2x10,000x50 2x10,000x50x50EOQ 2x8 4100
2,500kg
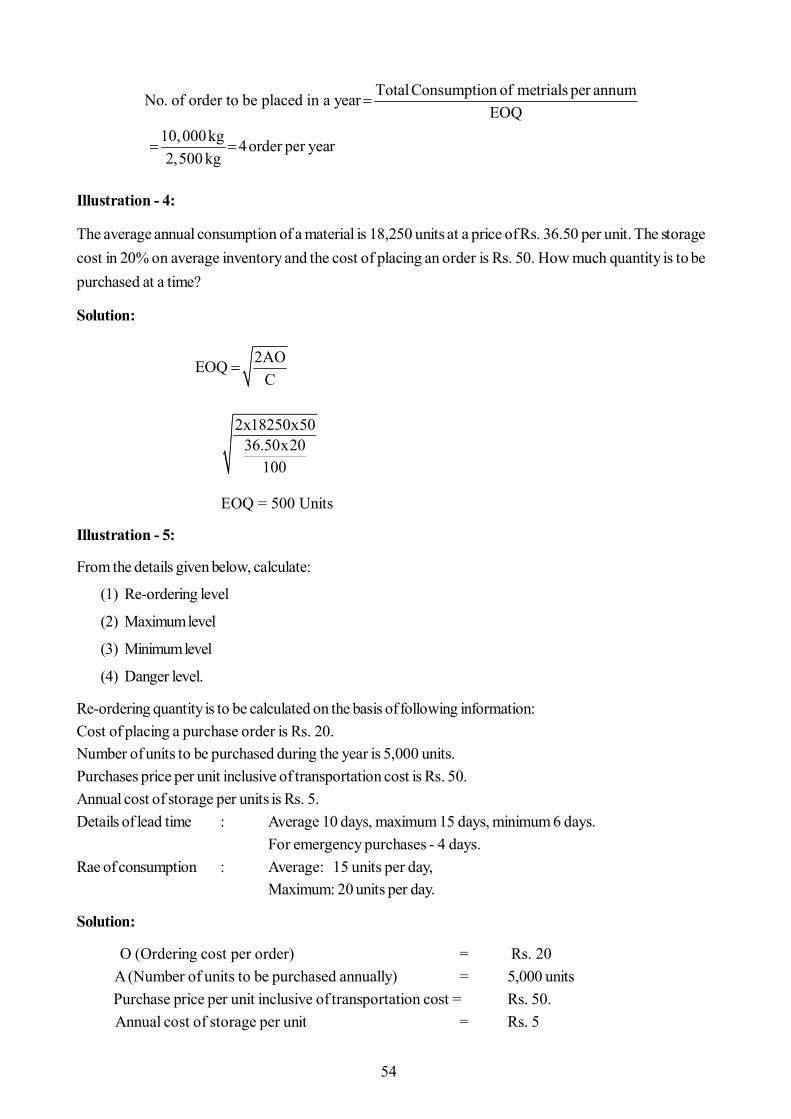
54
TotalConsumption of metrials per annumNo. of order to be placed in a yearEOQ
10,000kg 4order per year2,500 kg
Illustration - 4:
The average annual consumption of a material is 18,250 units at a price of Rs. 36.50 per unit. The storagecost in 20% on average inventory and the cost of placing an order is Rs. 50. How much quantity is to bepurchased at a time?
Solution:
2AOEOQ
C
2x18250x5036.50x20
100
EOQ = 500 Units
Illustration - 5:
From the details given below, calculate:
(1) Re-ordering level
(2) Maximum level
(3) Minimum level
(4) Danger level.
Re-ordering quantity is to be calculated on the basis of following information:Cost of placing a purchase order is Rs. 20.Number of units to be purchased during the year is 5,000 units.Purchases price per unit inclusive of transportation cost is Rs. 50.Annual cost of storage per units is Rs. 5.Details of lead time : Average 10 days, maximum 15 days, minimum 6 days.
For emergency purchases - 4 days.Rae of consumption : Average: 15 units per day,
Maximum: 20 units per day.
Solution:
O (Ordering cost per order) = Rs. 20 A (Number of units to be purchased annually) = 5,000 units Purchase price per unit inclusive of transportation cost = Rs. 50. Annual cost of storage per unit = Rs. 5

55
Computations:(1) Re-ordering level = Maximum Usage per period x maximum re-order period
(ROL) = 20 Units per day x 15 days = 300 units(2) Maximum level = ROL + ROQ – [ Min. rate of consumption x Min. re-order
Period] (Refer to working notes 1 and 2)= 300 units + 200 units – [10 units per days x 6 days]= 440 units
(3) Minimum level = ROL – Average rate of consumption x average re-order-period= 300 units – (15 units per days x 10 days)= 150 units
(4) Danger level = Average consumption x Lead time for emergency purchase= 15 units per day x 4 days = 600 units
Working Notes:
2AxQ1. EOQ(ROQ)C
2x 5000 x 20 200000EOQ5 5
Minimum rateof cusumption max imum rateof con sup tionAverage rate of Consumption2
X units \ day 20units per day15 units per day 2
10 Units per day
Illustration - 6:About 50 items are required every day for a machine. A fixed cost of Rs. 50 per order is incurred forplacing an order. The inventory carrying cost per item amounts to Rs. 0.02 per day. The lead periodis 32 days. Computer:
(I) Economic order quantity.(II) Re-Order level.
Solution:Annual consumption (A) = 50 items x 365 days = 18,250 itemsFixed cost per order (O) or Ordering cost = Rs. 50Inventory carrying cost per item per annum (C) = Rs. 0.02 x 365= Rs. 7.30
EOQ =
Re-order level = Maximum usage per day x Maximum lead time
= 50 items per day x 32 days
= 1,600 items

56
7. Ascertainment of Slow and Non- moving Materials and Stock Items:
Certain materials are slow moving. It means that their consumption rate is quite slow. Sometimes, due tohigh value of slow moving and non-moving raw materials, it appears that the concern has blocked huge sumof money unnecessarily in raw materials and storing costs continue to be incurred in such materials. Toovercome this problem, it is necessary to dispose-off as early as possible, the non-moving items or makearrangements for their puff out with the inventories required by the concern. Besides this no new requisitionshould be made for the purchase of slow moving items, till the existing stock is exhausted. Computation ofinventory turnover ratio may help in identifying slow moving items.
8. Use of Control Ratios:(a) Input Output Ratio: Inventory control can also be exercised by the use of input output ratio
analysis. Input-output ratio is the ratio of the quantity of input of material to production and thestandard material content of the actual output.This type of ration analysis enables comparison of actual consumption and standardconsumption, thus indicating whether the usage of material is favourable or adverse.
(b) Inventory Turnover Ratio: Computation of inventory turnover ratio for different items or materialand comparison of the turnover rates, provides a useful guidance for measuring inventory performance.High inventory turnover ratio indicates that the material in the question is a fast moving one. A lowturnover ratio indicates over–investment and blocking of the working capital in inventories. Inventoryturnover ratio may be calculated by using following formulae:-
Cost of materialsconsumed during the periodInventory turnover ratioCost of averagestock held during the period
Average stock = ½ (opening stock + closing stock)
By comparing the number of days in the case of two different materials, it is possible to known which is fastmoving and which is slow moving. On this basis, attempt should be made to reduce the amount of capitallocked up, and prevent over-stocking of the slow moving items.
Activity H:
1. List out various techniques of inventory control.
2. Analyze at least five industries about their inventory control techniques.
4.7 Summary
· Material Control: It is the systematic control over the procurement, storage and usage of materialsto maintain even flow of materials and avoiding at the same time excessive investment in inventories.
· Material Requisition Note: Document is prepared by the storekeeper to initiate the process ofpurchases.
· Material Transfer Note: This document is prepared when the material is transferred from onedepartment or job to another.
· Material Return Note: It is a document given with goods being returned from Factory back tothe stores.
· Bin Card: A prime entry record of the quantity of stocks, kept on in/out/balance, held in designated
storage areas.
· Stores Ledger : A ledger containing a separate account for each item of material.

57
· Techniques of Inventory Control: The techniques or the tools commonly applied to effectcontrol over the inventory are following:1. Setting of various stock levels.2. ABC analysis.3. Two bin system.4. Establishment of system of budgets.5. Use of perpetual inventory records and continuous stock verification.6. Determination of economic order quantity.7. Review of slow and non-moving items.8. Use of control ratios.
Important Formula1. Maximum Level = Reorder level + Reordering Quantity – (Minimum Consumption x Minimum Lead time)2. Minimum Level = Reorder Level – (Average Consumption x Average Lead time)3. Average Stock Lever = Maximum Level + Minimum Level / 2
Or Minimum Level + ½ reorder quantity4. Reorder Level = Maximum Consumption x maximum lead time5. Danger Level = Average Consumption x Emergency delivery time
6.
7. No. of orders per year = Annual consumption / EOQ
8. Time between two consecutive orders = 365 / No. of orders per year
9. Inventory Turnover ratio = Material Consumed / Average inventory
10. Inventory turnover period = 365 / inventory turnover ratio
11. Safety Stock = Annual Demand / 365 x Max. Lead time – Normal Lead time
12. Total inventory cost = ordering cost + carrying cost + purchase cost
13. Cost of material consumed = opening stock + purchase + direct expenses – closingStock
Note :-(1) For calculation of total inventory cost, average inventory should be taken as half of EOQ.Average inventory cost is normally given as a percentage of cost per unit.
(2) To decide whether discount on purchase of material should be availed or not. Comparetotal inventory cost before discount and after discount. Total inventory cost will include orderingcost, carrying cost and purchase cost.
4.8 Self Assessment Questions
1. What is a Bin-Card? Give a specimen and discuss its utility.
2. Write short notes on:
(a) Bill of materials, (b) Purchase Requisition, (c) Bin-Card.
EOQ = year one for inventory of unit one carrying ofCost
order cost per buyingxn Consumptio Annual x 2

58
3. What are the objects of material control? State briefly the various methods for pricing the issue ofmaterials. Also, discuss the merits, demerits and suitability of each method.
4. What do you mean by Inventory Control?
5. Discuss various techniques of inventory control.
6. What do you mean by EOQ? Write assumption of EOQ.
7. Discuss perpetual inventory system?
Practical Problems for Self Evaluation
Q.1 From the following particulars find out the Economic order quantity:
(i) Annual Demand 12000 units(ii) Ordering cost Rs. 90 per order(iii) Inventory carrying cost per annum Rs. 15Ans. 379 Units Approx
Q.2 A manufacturer buys certain equipment from outside suppliers at Rs. 30 per unit. Total annual needsare 800 units.
The following further data are availableAnnual return on investment 10%Rent, Taxes, Insurance per unit per year Rs. 1Cost of placing an order Rs. 100
Determine the economic order quantity.
Ans. 200 Units
Q.3 Priya Tube Ltd. Manufactures picture tubes for T.V. from the following details ascertain -(i) Economic order quantity (ii) Re- order level(iii) Maximum level of stock and (iv) Minimum level of stock
Ordering cost - Rs. 100 per order.Inventory carrying Cost - 20% p.a.Cost of Tube - Rs. 500 per tubeNormal Usage - 100 Tubes per weekMinimum Usage - 50 Tubes per weekMaximum Usage - 200 Tubes per weekLead time to supply - 6-8 weeks.
Q.4 G ltd. produces a product which has a monthly demand of 4000 units. The product requires acomponent X which is purchased at Rs 20. For every finished product one unit of component isrequired. The ordering cost is Rs. 120 per order and the holding cost is 10% p.a.
You are required to calculate:(i) Economic order quantity(ii) If the minimum lot size to be supplied is 4000 units, what is the extra cost the company
has to incur?(iii) What is the minimum carrying cost, the company has to incur ?
Ans. (I) 2400 Units (ii) Rs. 640 (iii) Rs. 2400
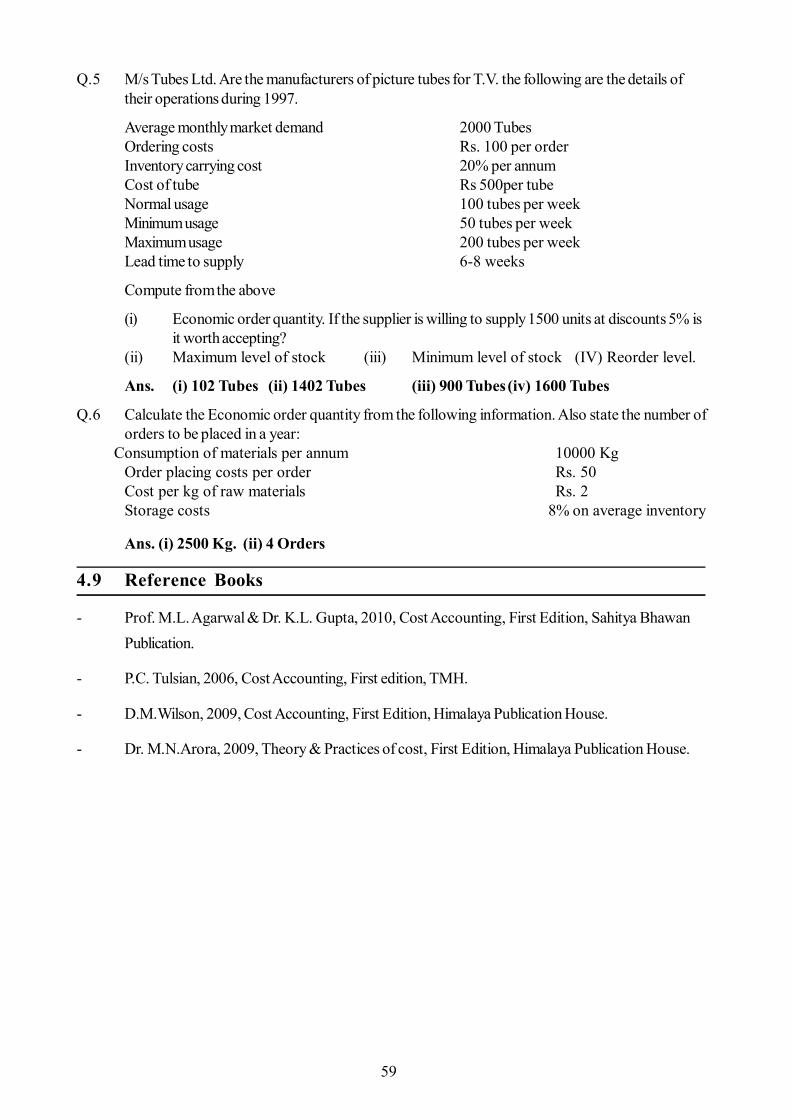
59
Q.5 M/s Tubes Ltd. Are the manufacturers of picture tubes for T.V. the following are the details oftheir operations during 1997.
Average monthly market demand 2000 TubesOrdering costs Rs. 100 per orderInventory carrying cost 20% per annumCost of tube Rs 500per tubeNormal usage 100 tubes per weekMinimum usage 50 tubes per weekMaximum usage 200 tubes per weekLead time to supply 6-8 weeks
Compute from the above
(i) Economic order quantity. If the supplier is willing to supply 1500 units at discounts 5% isit worth accepting?
(ii) Maximum level of stock (iii) Minimum level of stock (IV) Reorder level.
Ans. (i) 102 Tubes (ii) 1402 Tubes (iii) 900 Tubes(iv) 1600 Tubes
Q.6 Calculate the Economic order quantity from the following information. Also state the number oforders to be placed in a year:
Consumption of materials per annum 10000 KgOrder placing costs per order Rs. 50Cost per kg of raw materials Rs. 2Storage costs 8% on average inventory
Ans. (i) 2500 Kg. (ii) 4 Orders
4.9 Reference Books
- Prof. M.L. Agarwal & Dr. K.L. Gupta, 2010, Cost Accounting, First Edition, Sahitya BhawanPublication.
- P.C. Tulsian, 2006, Cost Accounting, First edition, TMH.
- D.M.Wilson, 2009, Cost Accounting, First Edition, Himalaya Publication House.
- Dr. M.N.Arora, 2009, Theory & Practices of cost, First Edition, Himalaya Publication House.

60
Unit - 5 : Material : Issue Control, Pricing and Accounting
Structure of Unit:
5.0 Objectives5.1 Introduction5.2 Pricing of Incoming Material5.3 Material Cost5.4 Pricing of Outgoing Material5.5 Material Losses5.6 Consumption of Materials5.7 Summary5.8 Self Assessment Questions5.9 Reference Books
5.0 Objectives
After completing this unit, you will be able to:
Understand the various methods of pricing material issues. Evaluate different methods of pricing material issues. Understand the procedure of pricing of incoming material. Understand the various types of material losses, their control techniques and treatments in cost
accounting. Understand the monitoring of consumption of materials.
5.1 Introduction
In previous unit, we have studied about material issue procedure, storage of material, inventory control andits techniques. But beyond this study there are many aspects which have equal importance in accounting formaterials. These aspects are pricing of incoming materials, pricing of outgoing materials, material losses andmonitoring of consumption of materials. Without knowledge of these aspects a cost accountant cannot fulfillobjectives of cost accounting. In this unit, we will discuss in detail all aforesaid contents of material costaccounting.
5.2 Pricing of Incoming Material
In order to determine the accurate value of material issued for various production activities or jobs, it isnecessary to determine the true actual cost of the material purchased. The invoice of material purchasedfrom the market sometime contain items such as trade discount, quantity discount, freight, duty, insurance,cost of containers, sales tax, excise duty, cash discount etc and determination process becomes moredifficult when various type of materials have been purchased from a common supplier and joint expenseswere to bring the material to store. Under such a situation, following points should be taken care off:
1) The general principle is that all costs incurred up to the point of procuring and storing materialsshould include in the cost of materials purchased.

61
2) The amount of trade discount, quantity discount and excise duty (under MODVAT credit scheme)are credit items hence deducted from the invoice of material purchased.
3) The transport charges (carriage and freight), sales tax, insurance, cost of containers, customs andexcise duty (without MODVAT credit) should be included in the invoice cost of materials.
4) The cash discount is considered as financial gain, so it is keep outside the area of material cost.
5) In case of containers are returnable, their resale value should also taken in the invoice price ofmaterial to ascertain the cost of material purchased correctly.
6) If common expenses incurred, these expenses should be divided either on the basis of purchaseprice of material, quantity of material or number of material.
7) The cost should also be inflated by an estimated percentage for wear and tear, scrap and damagesalso.
The cost of material purchased so determined, may be used for the entry of martial in the stores ledger.
Activity A:
1. Write items which are added in pricing of incoming materials.
2. Write items which are excluded from pricing of incoming materials.
Illustration - 1:
An invoice in respect of a consignment of chemicals A and B provides the following information:
Rs.
Chemical A: 10,000 lbs. at Rs. 10 per lb. 1,00,000Chemical B : 8,000 lbs. at Rs. 13 per ib. 1,04,000Sales tax @ 10% 20,400Railway freight 3,840
——————Total Cost 2,28,240
Shortages are noticed 500 lbs. in chemical A and 320 lbs. in chemical B, due to normal breakages. You arerequired to determine the rate per lb. of each chemical, assuming a provision of 2% for further deterioration.
Solution:
Statement of computation of effective quantity of each chemical available for use
Chemical A Chemical B
lbs. lbs.
Quantity purchased 10,000 8,000Less: shortage due to normal breakages 500 320
9500 7680Less: Provision for deterioration 2% 190 53.6 Quantity available 9310 7526.4

62
Statement showing the computation of rate per lb. of each chemical
Chemical A Chemical B
Rs. Rs.Purchase price 1,00,000 1,04,000Add: Sales tax (10% 10,000 10,400Railway freight (in the ratio ofQuantity purchased i.e. 5:4) 2133 1707Total Cost 1,12,133 1,16,107
Rate per lb. A:
Rate per lb. B:
Illustration - 2:
At what price, per unit would part no. B 32 will be entered in the stores ledger, if the following invoice wasreceived from a supplier:
Invoice Rs.200 units of Part No.B 32 @ Rs. 1000Less: 20 % discount 200
800Add: Excise duty @ 15 % 120
920Add: Packing charges (5 non-returnable Boxes) 50
970
Notes:
(1) A 2% discount will be given for payment in 30 days.
(2) Document substantiating payment of excise duty is enclosed for claiming MODVAT credit.
Solution:
200 units at cost after trade discount Rs. 800
Add: Packing charges Rs. 50
Total cost of 200 units Rs. 850
Cost per unit = = Rs. 4.25
5.3 Material Cost
“The material cost is the cost of commodities supplied to an undertaking” -I.C.M.A.
Material cost is following two types:
1) Direct Material Cost.
2) Indirect Material Cost.

63
1) Direct Material Cost:
Direct materials cost is the cost of those materials which enter into and form part of the product such astimber in furniture making; clay in brick making; cement, stones etc. in building and yarn for cloth producingetc. It includes the following:
a) Material specially purchased for requisitioned for a specific or a particular job, process, or workorder & used therein;
b) Material passing for one process or operation to the other, for instance, in the process costing thefinished product of a process becomes the direct materials for the next or the succeeding process;
c) The primary packing materials such as cartoons for the biscuit packing etc.
The materials cost the above is directly identified with jobs, products or cost units and is allocated to them.According to I.C.M.A. “Materials cost which can be identified with and allocated to cost centers or costunits”. Direct materials are also known as ‘process materials’, ‘prime cost materials’ or ‘productive materials’.
2) Indirect Materials Cost:
According to I.C.M.A indirect materials cost is “materials cost which can’t be allocated but which can beapportioned to or absorbed by, cost centers or cost units”.
Indirect materials cost is the cost of those materials which do not form part of the product but which helpthe production, for example:
a) Lubricating oil, fuel, cotton waste etc., required for operating and maintaining plant & machinery;b) Small tools;d) Stores use for repairs and maintenance;
Items for small values like threads, gum, nails etc, though forming part of the product and thus reckoned asdirect materials are treated as indirect materials for the reason that it is difficult to calculate the cost per unitof the material. The threads or gums in book binding, nails used in shoes etc. are the examples.
5.4 Pricing of Outgoing Material
5.4.1 Pricing of Issue of Materials
Material issued from stores should be priced at the value at which they are carried in stock but there can bea situation where the material may have been purchased at different times and at different prices with varyingdiscounts, taxes etc. Because of this the problem arises as to how the material issues to production are to bevalued. There are several methods for tackle this situation. The cost accountant should select the propermethod based on following factors:
1. The frequency of purchases, price fluctuations and its range.
2. The frequency of issue of materials, relative quantity etc.
3. Nature of cost accounting system.
4. The nature of business and type of production process.
5. Management policy relating to valuation of closing stock.
Several methods of pricing material issues have been evolved in an attempt to suitably answer the problem.These methods may be grouped and explained as follows:

64
1. Cost Price Methods:(a) Specific price method.(b) Fist – in first – out method.(c) Last in – first – out method.(d) Base stock method.
2. Average Price Methods:(e) Simple average price method.(f) Weighted average price method.(g) Periodic simple average price method.(h) Periodic weighted average price method.(i) Moving simple average price method.(j) Moving weighted average price method.
3. Market Price Methods:(k) Replacement price method.(l) Realizable price method.
4. Notional Price Methods:(m) Standard price method.
We may now briefly discuss all the above methods:
(a) Specific Price Method- This method is useful, specially when material are purchased for a specific jobor work order, and as such these material are issued subsequently to that specific job or work order at theprice at which they are purchased to use this method, It is necessary to store each lot of material separatelyand maintain its separate account. The advantages and disadvantage of this method are :
Advantages:
1- The cost of material issued for production purposes to specific job represent actual and correctcost.
2- This method is best suited for non-standard and specific products.
Disadvantage: This method is difficult to operate, specially when purchases and issues are numerous.
(b) First –in – First Out Method (FIFO): It is a method of pricing the issues of materials. Under thismethod, the materials first received in the store are the first issued. In other words, the order in which thematerials are received in the store are first issued at their cost price in the same order or the items longest instock are issued first. Thus each issue of material only recovers the purchase price which does not reflectthe current market price.
This method is considered suitable in times of failing price because the material cost charged to productionwill be high while the replacement cost of materials will be low. But in the case of rising prices, if this methodis adopted, the charge to production will be low as compared to the replacement cost of materials (as in thecurrent period) in future without having additional capital resources.
The advantages and disadvantages of the method may be stated as follows:
Advantages:
1. It is simple to understand and simple to operate.

65
2. Material cost charged to production represents actual cost with which the cost of production shouldhave been charged.
3. In the case of falling prices, the use of this method gives better results.
4. Closing stock of material will be represented very closely at current market price.
5. The old material is issued first. Thus, there remains no possibility of loss of material due to spoilageor obsolescence.
Disadvantages:
1. If the price fluctuates frequently, this method may lead to clerical error.
2. Since each issues of material to production is related to a specific purchase price, the cost chargedto the same job are likely to show a variation from period to period.
3. In the case of rising prices, the real profits of the concern being low, they may be inadequate to meetthe concern’s demand to purchase raw materials at the ruling price.
Illustration - 3:
Prepare store ledger account as per FIFO method from the following data: Receipt of Materials Rate Materials Issued Date Units per unit Date Units Rs.
April 1, 2008 opening balance 1,000 5 April 4,2008 3,000April 3, 2008 5,000 6 April 6,2008 2,000April12, 2008 3,000 5 April 15,2008 1,500The weekly stock taking on April 7, 2008 showed on shortage of 150 units.
Solution:
(c) Last – in – First Out Method (LIFO): It is a method of pricing the issues of materials. This method isbased on the assumption that the items of the last batch (lot) purchased are the first to be issued. Therefore,under this method the price of the last batch (lot) is used for pricing the issues, until it is exhausted, and soon. If however, the quantity of issue is more than the quantity of the latest lot than earlier (lot) and its pricewill also be taken into consideration.
Store Ledger Account
Date
Receipts Issues Balance + Units Rate Amount Units Rate Amount Units Rate Amount
2007 Apr.1 Apr.3 Apr.4 Apr.6 Apr.7 Apr.12 Apr.15
― 5,000
―
3,000
Rs. ―
6
―
5
Rs. ―
30,000
―
15,000
― ―
1,000 2,000 2,000 150 ―
850 650
Rs. ― ―
5 6 6 6
―
6 5
Rs. ― ―
17,000 12,000 900
―
8,350
1,000 1,000 5,000
3,000 1,000 850 850 3,000
2,350
Rs. 5 5 6
6 6 6 6 5
5
Rs. 5,000 35,000
18,000 6,000 5,100
20,100
11,750 Wastage is treated as abnormal.

66
During inflationary period or period of rising prices, the use of LIFO would help to ensure that the cost ofproduction determined on the above basis is approximately the current one. This method is also usefulspecially when there is a feeling that due to the use of FIFO or average methods, the profits shown and taxpaid are too high.
The advantages and disadvantages of LIFO method are as follows:
Advantages:
1- The cost of materials issued will be either nearer to and or will reflect the current market price.Thus, the cost of goods produced will be related to the trend of the market price of materials. Sucha trend in price of materials enables the matching of cost of production with current sales revenues.
2- The use of the method during the period of rising prices does not reflect undue high profit in theincome statement as it was under the FIFO or average method. In fact, the profit shown here isrelatively lower because the cost of production taken into account the rising trend of material prices.
3- In the case of falling prices profit tends to raise due to lower material cost, yet the finished productsappear to be more competitive and are at market price.
4- Over a period, the use of LIFO helps to level out the fluctuations in profits.
5- In the period of inflation LIFO will tend to show the correct profit and thus avoid paying unduetaxes to some extent.
Disadvantages:
1. Calculation under LIFO system becomes complicated and burdensome when frequent purchasesare made at highly fluctuating rates.
2. Costs of different similar batches of production carried on at the same time may differ a great deal.
3. In time of falling prices, there will be need for writing off stock value considerably to stick to theprinciple of stock valuation, i.e., the cost or the market price whichever is lower.
4. This method of valuation of material is not acceptable to the income tax authorities.
5. The closing stock is priced at a very old price which does not show the correct position of thebusiness.
Illustration - 4:
With the help of the following particulars, prepare stores account showing issue of materials on the basisof Last in, First out:
Purchases Issues
August 3,2008 750 kg @ Rs. 2.00 August 19,2008 850 kg
August 18,2008 350 kg @ Rs. 2.10 August 26,2008 450 kg
August 25,2008 600 kg @ Rs. 2.20 August 29,2008 510 kg
August 28,2008 500 kg @ Rs. 2.30 August 30,2008 150 kg

67
(d) Base Stock Method: A minimum quantity of stock under this method is always held at a fixed price asreserve in the stock, to meet a state of emergency, if it arises. This minimum stock is known as base stockand is valued at a price at which the first lot of materials is received and remains unaffected by subsequentprice fluctuations.
Thus, this is more a method of valuing inventory than a method of valuing issued because, with the base ofstock valued at the original cost some other method of valuing issues should be adopted. The quantity inexcess of the base stock may be valued either on the FIFO or LIFO basis. This method is not an independentmethod as it uses FIFO or LIFO. Its advantages and disadvantages therefore will depend upon the use ofthe other method viz., FIFO or LIFO.
(e) Simple Average Price Method: Under this method, materials issued are valued at average price,which is calculated by dividing the total of all units rate by the number of unit rate.
Total of unit prices of each purchaseMaterial issue priceTotal number of purchase
This method is useful under the following circumstances:1. When the materials are received in uniform lots of similar quantity, otherwise, it will give wrong
results.2. When purchase prices do not fluctuate considerably.
Advantage:1. It is simple to understand and easy to operate.2. The method is a mixed form of market price and cost price.3. Due to calculation of average of different purchase prices, the tendency of equality in different rates
is arrived at.
Solution:
Stores Ledger Account
Date
Receipts Issues Balance Kg Rate Amt. Kg Rate Amt. Kg Rate Amt.
2008 Aug.3 Aug.18 Aug.19 Aug.25 Aug.26 Aug.28 Aug.29 Aug.30
750 350
―
600
500
―
―
Rs. 2.00 2.10
―
2.20
2.30
―
―
Rs. 1,500 735
―
1,320
1,150
―
―
― ―
350 500 ―
450
―
500 10 140
10 0
Rs. ― ―
2.10 2.00
―
2.20
―
2.30 2.20 2.20 2.00
Rs. ― ―
735 1,000
―
990
―
1,150 22 308 20
750 750 350
250 250 600 250 150 250 150 500 250 140
240
Rs. 2.00 2.00 2.10
2.00 2.00 2.20 2.00 2.20 2.00 2.20 2.30 2.00 2.20
2.00
Rs. 1,500 1,500 735
500 500 1,320 500 330 500 330 1,150 500 308
480

68
Disadvantage:1. Materials issue cost does not represent actual cost price. Since the materials are issued at a price
obtained by averaging cost prices, a profit or loss may arise from such type of pricing.2. In case the prices of material fluctuate considerably, this method will give incorrect results.3. The prices of materials issues used are determined by averaging prices of purchases without giving
consideration to the quantity. Such a price determination is unscientific.4. It becomes difficult to calculate the average again and again.
Illustration - 5:
From the following information, write the stores ledger account based on ‘Simple Average Method’ ofpricing issues:
May 2008 Receipts May 2008 Issues 12 Purchased 400 unit @ Rs. 59 per unit 3 140 units 14 Refund of surplus from a work order 4 250 units 30 units @ Rs. 58 per unit 8 210 units 20 Purchased 480 units @ Rs. 62 per unit 16 350 units 25 Purchased 640 units @ Rs. 60 per unit 24 608 units 28 Refund of surplus from a work order 24 26 524 units Units (issued on 3 May) 31 Received from supplier 150 units @ Rs. 64 per unit
Opening balance on May 2008 1,100 units @ Rs. 60 per unit.
60 59 581. 593
60 59 58 622. 59.754
62 603. 612
(f) Weighted Average Price Method: This method gives due weights to quantities purchased and thepurchase price, while, determining the issue price. The average issue price here is calculated by dividing thetotal cost of materials in the stock by total quantity of materials prior to each issue.
Solution: Stores Ledger Account
Date
Receipts Issues Balance Qty. Rate Amount Qty. Rate Amount Qty. Amount
May2008 1 3 4 8 12 14 16 20 24 25 26 28 31
— — — — 400 30
(Refund) — 480 — 640 — 24 150
Rs. — — — —
59.00 58.00
—
62.00 —
60.00 — 60 64
Rs. — — — —
23,600 1,740
—
29,760 —
38,400 —
1,440 9,600
—
140 250 210 — —
350 — 608 — 524 — —
Rs. — 60 60 60 — —
591 —
59.752 —
61.003 — —
Rs. —
8,400 15,000 12,600 — —
20,650
— 36,328
— 31,964
— —
1,100 960 710 500 900 930
580 1,060 452 1,092 568 592 742
Rs. 66,000 57,600 42,600 30,000 53,600 55,340
34,690 64,450 28,122 66,522 34,558 35,998 45,598

69
Total of unit prices of each purchaseMaterial issue priceTotal quantity of purchase
The advantages and disadvantages of this method are:
Advantages:
1. It smoothens the price fluctuations if at all it is there due to material purchases.2. Issue prices need not be calculated for each issue unless new lot of materials is received.3. This method is scientific and argumentative because under this method, the total cost of the
material available in the bin is provided by the total quantity of material. In fact, after reachingthe bin, the new and old material mix up, i.e., there remains no separate existence in the bin, of thematerial separately purchased on the different dates.
4. As regards calculation work, this method is simple because the issue price once calculated continuestill the new material is purchased.
5. This method is a mixed form of market price and cost price.6. In this method, the balance of the closing stock is shown at appropriate price which can be
used in financial accounts also.
Disadvantage:1. Material cost does not represent actual cost price and therefore, a profit or loss will arise out
of such a pricing method.2. If the material is purchased again and again at short intervals, the calculation work increases.3. As the material is issued at average price, the production cost cannot be correctly estimated.
Illustration 6:
From the following particulars, prepare stores Ledger for the month January 2008 showing material issueprices on the Weighted Average Price Method:
Receipts of Materials Issues of Materials
Date Units Rate per unit (Rs.) Date UnitsJan.1, 2008 500 2 January 1, 2008 400Jan.10, 2008 200 3 January 15, 2008 100Jan.18, 2008 400 4 January 22, 2008 200Jan.28, 2008 300 5 January 31, 2008 300Jan.29, 2008 Returns 10 units (issued on 15th Jan.)2 units loss was revealed on January 28 during stock verification.
* Assumed as Normal wastage.
Solution:
Stores Ledger Account
Date
Receipts Issues Balance + Units Rate Amt. Units Rate Amt. Units Rate Amt.
2008 Jan. 1 Jan.10 Jan.15 Jan.18 Jan.22 Jan.27 Jan.28 Jan.29 Jan.31
500 200 — 400 ― 300 ― 10 ―
Rs. 2 3 ― 4 ― 5 ― 2.67 ―
Rs. 1,000 600 ― 1,600 ― 1,500 ― 26.70 ―
400 ― 100 ― 200 ― 2(loss)* ― 300
Rs. 2 ― 2.67 ― 3.555 ― ― ― 4.165
Rs. 800 ― 2.67 ― 711 ― ― ― 1249.5
100 300 200 600 400 700 698 708 408
Rs. 2 2.67 2.67 3.555 3.555 4.174 4.186 4.165 4.165
Rs. 200 800 533 2,133 1,422 2,922 2,922 2,948.70 1,699.20

70
(g) Periodic Simple Average Price Method: This method is similar to simple average price methodexcept that the average price is calculated at the end of the concerned period. In other words, the price paidduring the period for different lots of materials purchased are added up and the total is divided by thenumber purchases made during the period. The rate so computed is the used to price all the issues madeduring the period, and also for valuing the closing inventory of the period.
Advantages:
1. It is simple to operate, as it avoids calculation of issue price after every receipt.
2. This method can usefully be employed in costing continuous processes where each individual orderis absorbed into the general cost of producing large quantities of articles.
Disadvantages:
1. This method cannot be applied in jobbing industry where each individual job order is to be pricedat each stage of its completion.
2. This method is unscientific as it does not take into consideration the quantities purchased at differentprices.
3. This method also suffers from all those disadvantages of simple averages cost method.
(h) Periodic Weighted Average Price Method: This method is like weight average price method, exceptthat the calculations of issue prices are made periodically (say, a month). The rate so arrived is used for theissues made during that period and also for valuing the inventory at the end of the period.
Advantage:
1. This method is superior to the periodic simple average price method as it takes into account thequantities also.
2. It overcomes or events out the effect of fluctuations.
3. In addition to above, the method also possesses all the advantages of the simple weighted averageprice method.
Disadvantage:
This method is not suitable for job costing because each job is to be priced at each stage of completion.
(i) Moving Simple Average Price Method: Under this method, the rate for material issues is determinedby dividing the total of the periodic simple average prices of a given number of periods by the numbers ofperiods. For determining the moving simple average price, it is necessary to fix up first period to be takenfor determining the average.
Suppose a six monthly period is decided upon and moving average rate for the month of June is to becalculated. Under such a situation, we have to make a list of the simple average prices from January toJune, add them up, and divide the total by six. To calculate the moving average rate for July, we have to omitsimple average rate pertaining to January and add the rate relating to July and divided the total by six.
Advantage: This method evens out price fluctuations over a longer period, thus stabilizing the charges towork-in-progress. Thus the cost of production will be stable to a significant extent.
Disadvantage: A Profit or loss arises by the use of moving simple average cost.
(j) Moving Weighted Average Price Method: Under this method, the issue, rate is calculated by dividingthe total of the periodic weighted average price of a given number of periods by the number of periods.

71
(k) Replacement Price Method: Replacement price is defined as the price at which it is possible topurchase an item, identical to that which is being replaced or revalued. Under this method, materials issuedare valued at the replacement cost of the items.
This method pre-supposes the determination of the replacement cost of materials at the time of each issue;viz., the cost at which identical materials could be currently purchased. The product cost under this methodis at current market price, which is the main objective of the replacement price method.
This method is useful to determine true cost of production and to value material issues in periods of risingprices, because the cost of material considered in cost of production would be able to replace the materialsat the increased price.
Advantage: Product cost reflects the current market prices and it can be compared with the selling price.
Disadvantage: The use of the method requires the determination of market price of material before eachissued of material. Such a requirement creates problems.
(l) Realizable Price Method: Realizable price means a price at which the material to be issued can besold in the market. This price may be more or may be less than the cost price at which it was originallypurchased. Like replacement price method, the stores ledger would show profit or loss in this method too.
(m) Standard Price Method: Under this method, materials are priced at some predetermined rate orstandard price irrespective of the actual purchase cost of the materials. Standard cost is usually fixed aftertaking into consideration the following factors:
a. Current prices,b. Anticipated market trends, andc. Discount available and transport charges etc.
Standard prices are fixed for each material and the requisitions are priced at the standard price. Thismethod is useful for controlling material cost and determining the efficiency of purchase department. In thecase of highly fluctuating prices of materials, it is difficult to fix their standard cost on long-term basis.
Advantages:1. The use of the standard price method simplifies the task of valuing issues of materials.2. It facilitated the control of material cost and the task of judging the efficiency of purchase department.3. It reduced the clerical work.
Disadvantages:
1. The use of standard price does not reflect the market price and thus results in a profit or loss.2. The fixation of standard price becomes difficult when prices fluctuate frequently.
5.4.2 Valuation of Returns and Shortages
(a)Valuation of Materials Returned to the Vendor: Materials which do not meet quality, dimensionaland other specifications and are considered to be unfit for production are usually returned to thevendor. These materials can be returned to the vendor before they are sent to the stores. In casematerials reach store and are noticed to be below standard quality, then also they can be returnedto vendor.The price of the materials to be returned to vendor should include its invoice price plus freight,receiving and handling charges etc. Strictly speaking, the materials returned to vendor should bereturned at the stores ledger price and not at invoice price. But in practice invoice price is only

72
considered, the gap between the invoice price and ledger price is charged as overhead. In storesledger the defective or sub-standard materials are shown in the issue column at the rate shown in theledger, and the difference between issue price and invoice cost is debited to an inventory adjustmentaccounts.
(b) Valuation of Materials Returned to Stores: When materials requisitioned for a specific job orwork-in progress are found to be in excess of the requirement or are unsuitable for the purpose,they are returned to the stores. There are two ways of treating such returns.1. Such returns are entered in the receipt column at the price at which they were originallyissued, and the materials are kept in suspense, to be issued at the same price against the nextrequisition.2. Include the materials in stock as if they were fresh purchases at the original issue price.
(c) Valuation of Shortages during Physical Verification: Materials found short during physicalverification should be entered in the issue column and valued at the rate as per the methodadopted, i.e. FIFO or any other.
5.4.3 Selection of Pricing Methods
Several methods of charging price of materials issues have been discussed in detail. The question is as towhich out these methods is best one. It is a fact that no one method can be suitable for all business orindustry. No hard and fast rule or procedure has been laid down to select a method of pricing issues ofmaterial. However, the ultimate choice of a method of selection may be based on the following considerations.
(a) The method of costing used and the policy of management.(b)The frequency of purchases and issues.(c) The extend of price fluctuations(d)The extent of work involved in recording, issuing and pricing materials(e) Whether cost of materials used should reflect current or historical conditions.(f) Type of business or industry.
Activity B:
1. Which method of pricing of material do you think is the most suitable? Why?
5.4.4 Treatment of Normal and Abnormal Loss or Materials
Whichever method may be adopted for pricing materials, certain differences between the book balance andthe value of physical stock are bound to occur. These differences, which may be a gain or loss, should betransferred to inventory adjustment account pending investigation. If, after investigation, they are regardedas normal, they should be transferred to Overhead Control Account; if abnormal they should be written offto the Costing Profit and Loss account.
In the case normal losses, an alternative method is used to price per unit of material so as to cover thenormal loss. It can be understood with the help of the example considered. Suppose 1,000 meters of gunnycloth are purchased at Rs. 2 per meter. It is expected that 1% would be the normal loss due to issues beingmade in small lots. The inflated price would be Rs. 2.02 p. i.e., (Rs. 2,000 for 990 meters). The rate of Rs.2.02 per meter of gunny cloth covers the cost a normal loss as well.
5.5 Material Losses
There is various types of losses possible in subject of material such as waste, scrap, spoilage, and defectives.We are going to be discussing in detail their meaning, precautions and treatments.

73
5.5.1 Waste
“The portion of basic raw materials lost in processing having no recoverable value.” Waste may bevisible – bits and pieces of basic raw materials – or invisible; e.g., disappearance of basic raw materialsthrough evaporation, Smoke etc. Shrinkage of material due to natural causes may also be a form of amaterial wastage.
In case of normal Wastage -Normal waste is absorbed in the cost of net output.
In Case of Abnormal Wastage -The abnormal waste is transferred to the costing Profit and loss Accounts.
For effective control of waste, normal allowances for yield and waste should be made from past experience,technical factors and special features of the material process and product. Actual yield and waste should becompared with anticipated figures and appropriate actions should be taken where necessary. Responsibilityshould be fixed on purchasing, storage, maintenance, and production and inspection staff to maintain standards.A systematic procedure for feedback or achievement against laid down standards should be established
5.5.2 Scrap
“It has been defined as the incidental residue from certain types of manufacture, usually of smallamount and low value, recoverable without further processing.” Scrap may be treated in cost accountsin the following ways:-
(1) When the scrap value is negligible: It may be excluded from costs. In other words, the cost ofscrap is borne by good units and income scrap is treated as other income.
(2) When the scrap value is not identifiable to a particular process or job: The sales value ofscrap net of selling and distribution cost, is deducted from overhead to reduce the overhead rate. Avariation of this method is to deduct the net realizable value from material cost.
(3) When scrap is identifiable with a particular job or process and its value is significant: Thescrap account should be charged with full cost. The credit is given to the job or process concerned.The profit or loss in the scrap account, on realization, will be transferred to the costing profit andloss account.
Control of scrap really means the maximum effective utilization of raw material. Scrap control does not,therefore, start in the production department; it starts from the stage of product designing. Thus the mostsuitable type of materials, the right type of equipment and personnel would help in getting maximum quantityof finished product from a given raw material.
A standard allowance for scrap should be fixed and actual scrap should be collected, recorded and reportedindicating the cost centre responsible for it. A periodical scrap report would served the purpose where twoor more department or cost centers are responsible for a scrap; the reports should be routed through thedepartment concerned.
5.5.3 Spoilage
“It is the term used for materials which are badly damaged in manufacturing operations and theycannot be rectified economically and hence taken out of process to be disposed of in some mannerwithout further processing.” Spoilage may be either normal or abnormal
In case of normal spoilage:
Normal spoilage (i.e. which is inherent in the operation) costs are included in costs either charging the lossdue to spoilage to the production order or by charging it to production overhead so that it is spread over allproducts. Any value realized from spoilage is credited to production overhead account, as the case may be.

74
In case of abnormal spoilage
The cost of abnormal spoilage (i.e. arising out of causes not inherent in manufacturing process) is charged tothe costing profit and loss account. When spoiled work is the result of rigid specification, the cost of spoiledwork is absorbed by good production while the cost of disposal is charged to production overhead
To control spoilage, allowance for normal spoilage should be fixed and actual spoilage should be comparedwith standard set. A systematic procedure of reporting would help control over spoilage. Corrective actionsshould be taken by responsible department, if any.
5.5.4 Defectives
“It signifies those units or portions of production which can be rectified and turned out as goodunits by application of additional material, labour or other service.”
recovery of loss from defective units – In the case of articles that have been defected, it is necessary totake steps to reclaim as much of the loss as possible. For this purpose:
1. All defective units should be sent to a place fixed for the purpose;
2. These should be dismantled;
3. Goods and serviceable parts should be separated and taken into stock;
4. Parts which can be made serviceable by further work should be separated and sent to the workshopfor the purpose and taken into stock after the defects have been removed; and
5. Parts which cannot be made serviceable should be collected in one place for being melted or sold.
Control: When defectives are found, the inspector will make out the defective work Report, giving particularsfor the department, process or job, defective units, normal and abnormal defectives, cost of rectificationetc. On receipt of the defective work report, it may be decided to rectify the defective work; all cost ofrectification are collected against the rectification work order, precaution will be taken to see that number ofdefectives is within normal limits.
Defectives are generally treated in two ways: either they are brought up to the standard by incurring furthercosts on additional material and labour or where possible, they are sold as inferior products (seconds) atlower prices. The following illustration is given to explain the accounting procedure followed in either case.
Total expenses of manufacture Rs. 5,000
Out put Good: 450 units
Defective: 50 units
Cost of rectifying defectives Rs. 50
Cost per unit of production =
If the defectives are not rectified but sold as ‘second’s say, @ Rs. 8 each then cost of goods produced willbe ;
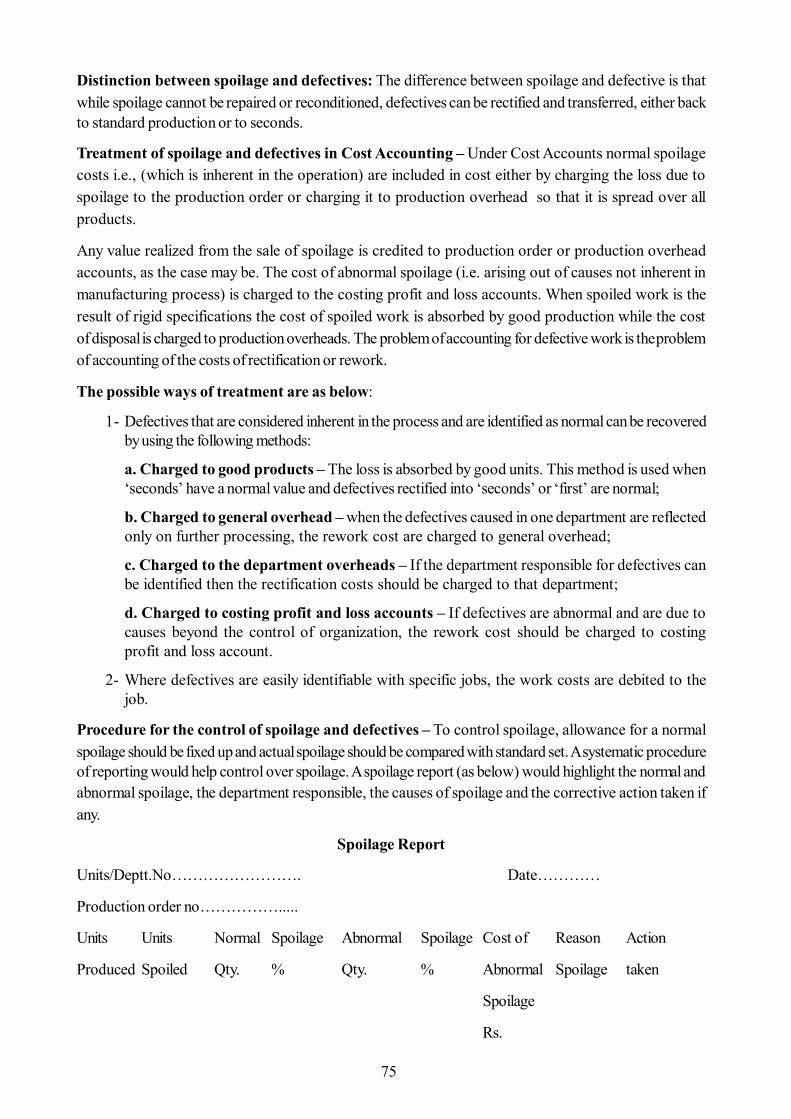
75
Distinction between spoilage and defectives: The difference between spoilage and defective is thatwhile spoilage cannot be repaired or reconditioned, defectives can be rectified and transferred, either backto standard production or to seconds.
Treatment of spoilage and defectives in Cost Accounting – Under Cost Accounts normal spoilagecosts i.e., (which is inherent in the operation) are included in cost either by charging the loss due tospoilage to the production order or charging it to production overhead so that it is spread over allproducts.
Any value realized from the sale of spoilage is credited to production order or production overheadaccounts, as the case may be. The cost of abnormal spoilage (i.e. arising out of causes not inherent inmanufacturing process) is charged to the costing profit and loss accounts. When spoiled work is theresult of rigid specifications the cost of spoiled work is absorbed by good production while the costof disposal is charged to production overheads. The problem of accounting for defective work is the problemof accounting of the costs of rectification or rework.
The possible ways of treatment are as below:
1- Defectives that are considered inherent in the process and are identified as normal can be recoveredby using the following methods:
a. Charged to good products – The loss is absorbed by good units. This method is used when‘seconds’ have a normal value and defectives rectified into ‘seconds’ or ‘first’ are normal;
b. Charged to general overhead – when the defectives caused in one department are reflectedonly on further processing, the rework cost are charged to general overhead;
c. Charged to the department overheads – If the department responsible for defectives canbe identified then the rectification costs should be charged to that department;
d. Charged to costing profit and loss accounts – If defectives are abnormal and are due tocauses beyond the control of organization, the rework cost should be charged to costingprofit and loss account.
2- Where defectives are easily identifiable with specific jobs, the work costs are debited to thejob.
Procedure for the control of spoilage and defectives – To control spoilage, allowance for a normalspoilage should be fixed up and actual spoilage should be compared with standard set. A systematic procedureof reporting would help control over spoilage. A spoilage report (as below) would highlight the normal andabnormal spoilage, the department responsible, the causes of spoilage and the corrective action taken ifany.
Spoilage Report
Units/Deptt.No……………………. Date…………
Production order no…………….....
Units Units Normal Spoilage Abnormal Spoilage Cost of Reason Action
Produced Spoiled Qty. % Qty. % Abnormal Spoilage taken
Spoilage
Rs.

76
Control of defectives may convert the following two areas:(a) Control over defectives produced(b) Control over reworking costs.
For exercising effective control over defectives produced and the cost or reworking, standards, for normalpercentage of defectives and reworking costs should be established. Actual performance should be comparedwith the standards set. Defective work report should be fed back to the respective centres of control.
5.5.5 Losses Due to Obsolete Stores
Obsolescence is defined as “the loss in the intrinsic value of assets due to its supersession,” Materialsmay become obsolete under any of the following circumstances:
(1) Where it is a spare part or a component of a machinery used in manufacture and that machinerybecomes obsolete ;
(2) Where it is used in the manufacture of a product which has become obsolete;(3) Where the material itself is replaced by another material due to either improved quality or fall in
price.
In all three cases, the value of the obsolete material held in stock is a total loss and immediate steps shouldbe taken to dispose it off at the best available price. The loss arising out of obsolete materials on abnormalloss does not form part of the cost of manufacture.
Losses due to obsolescence can be minimized through careful precaution and reduced stocking of spares,etc. Stores records should be continuously gone through to see whether any item is likely to becomeobsolete. There will be such probability if an item has not been used for a long time. (This does not apply topare parts of machines still in use).
Activity C:
1. Discuss about various types of material losses.
2. Write treatment of various types of material losses.
5.6 Consumption of Materials
Any product that is manufactured in a firm entails consumption of resources like material, labour etc. Themanagement for planning and control must know the cost of using these resources in manufacturing. Theconsumption of materials takes place say when the material is used in the manufacture of the product.
It is important to note that the amount of materials consumed in a period by a cost object need not be equalto the amount of material available with the concern. For example, during any period the total of rawmaterial stock available for use in production may not be equal to the amount of materials actually consumedand assigned to the cost object of the production. The difference between the material available and materialconsumed represents the stock of material at the end of the period.
5.6.1 Identification of Materials:
For the identification of consumption of materials with products of cost centre’s the followings points shouldbe noted:
1. It is required that the concern should follow coding system for all materials so that each material isidentified by unique code number.

77
2. It is required that each product of a cost centre should be given a unique code number so that thedirect material issued for production of particular product of a cost center can be collected againstthe code number of that product.
However, it may not be possible to allocate all materials directly to individual product of a costcentre e.g. maintenance materials, inspection and testing materials etc. The consumption of thesematerials are collected for cost centre and then charge to indicial product by adopting suitableoverhead absorption rate of cost center.
Overhead absorption rate of cost centre =
(E.g. labour hrs. or machine hrs.)
3. Each issue of materials should be recorded. One way of doing this is to use a material requisitionnote. This note shows the details of materials issued for product of cost centre and the cost centerwhich is to be charged with cost of materials.
4. A material return note is required for recording the excess materials returned to the store. This noteis required to ensure that original product of cost centre is credited with the cost of materials whichwas not used and that the stock records are updated.
5. A material transfer note is required for recording the transfer of materials from one product of costcentre to other or from one cost centre to other cost centre.
6. The cost of materials issued would be determined according to stock valuation method used.
5.6.2 Monitoring Consumption of Materials
For monitoring consumption of materials a storekeeper should periodically analyses the various materialsrequisitions, material return notes and material transfer notes. Based on this analysis, a material abstract ormaterial issue analysis sheet is prepared, which shows at a glance the value of material consumed inmanufacturing each product. This statement is also useful for ascertaining the cost of material issued for eachproduct.
The material abstract statement serves a useful purpose. It in fact shows the amount of material to bedebited to various products & overheads. The total amount of stores debited to various products & overheadsshould be the same as the total value of stores issued in any period.
5.7 Summary
Methods of pricing of issue of materials
FIFO – The materials received first are to be issued first. Material left as closing stock will be at the priceof latest.
LIFO – The materials purchased last are to be issued first. Closing stock is valued at the oldest stock price.
Wastage – portion of basic raw material lost in processing having no recoverable value.
Scrap -The incidental material residue coming out certain manufacturing operations having low recoverablevalue.
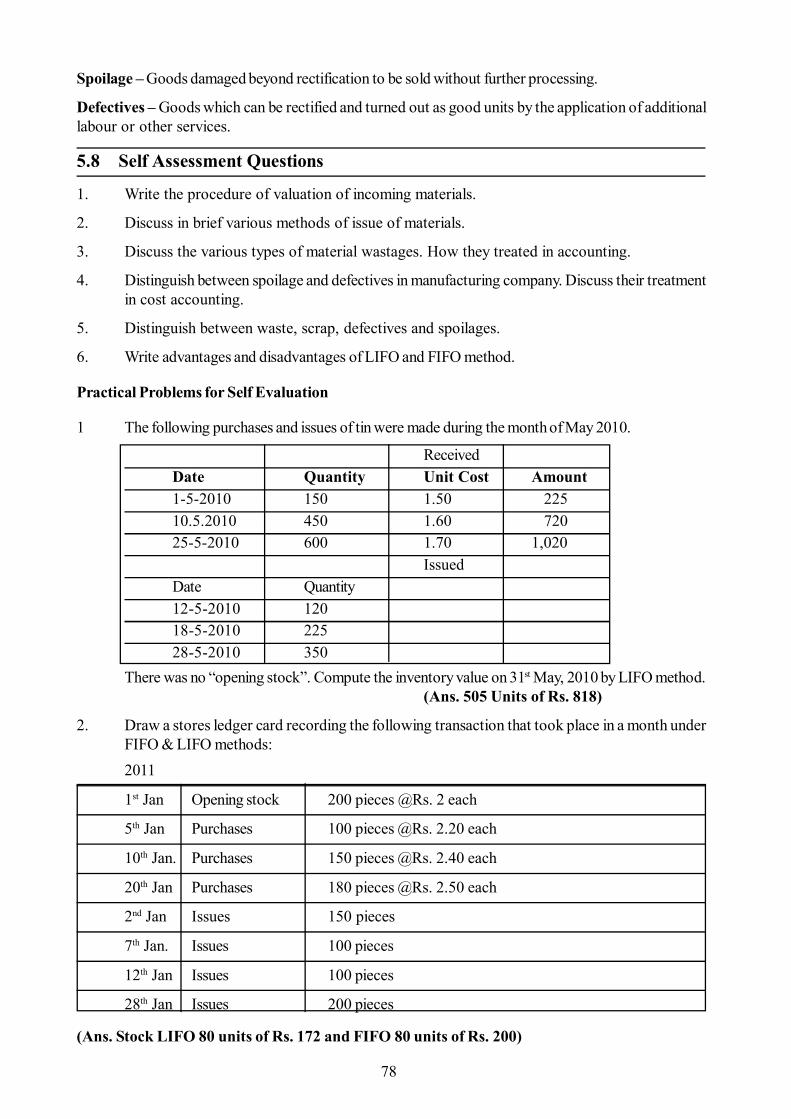
78
Spoilage – Goods damaged beyond rectification to be sold without further processing.
Defectives – Goods which can be rectified and turned out as good units by the application of additionallabour or other services.
5.8 Self Assessment Questions
1. Write the procedure of valuation of incoming materials.
2. Discuss in brief various methods of issue of materials.
3. Discuss the various types of material wastages. How they treated in accounting.
4. Distinguish between spoilage and defectives in manufacturing company. Discuss their treatmentin cost accounting.
5. Distinguish between waste, scrap, defectives and spoilages.
6. Write advantages and disadvantages of LIFO and FIFO method.
Practical Problems for Self Evaluation
1 The following purchases and issues of tin were made during the month of May 2010.
ReceivedDate Quantity Unit Cost Amount1-5-2010 150 1.50 22510.5.2010 450 1.60 72025-5-2010 600 1.70 1,020
IssuedDate Quantity12-5-2010 12018-5-2010 22528-5-2010 350
There was no “opening stock”. Compute the inventory value on 31st May, 2010 by LIFO method.(Ans. 505 Units of Rs. 818)
2. Draw a stores ledger card recording the following transaction that took place in a month underFIFO & LIFO methods:2011
1st Jan Opening stock 200 pieces @Rs. 2 each
5th Jan Purchases 100 pieces @Rs. 2.20 each
10th Jan. Purchases 150 pieces @Rs. 2.40 each
20th Jan Purchases 180 pieces @Rs. 2.50 each
2nd Jan Issues 150 pieces
7th Jan. Issues 100 pieces
12th Jan Issues 100 pieces
28th Jan Issues 200 pieces
(Ans. Stock LIFO 80 units of Rs. 172 and FIFO 80 units of Rs. 200)

79
3. Prepare a stores Ledger account from the following transactions assuming that the issue of storeshave been priced on the principle of “last-in-first-out”& “First-in-first-out” also.2011Jan.1 Received 1,000 units at Rs. 20 per unitJan.10 Received 260 units at Rs. 21 per unitJan.20 Issued 700 unitsFeb.4 Received 400 units at Rs. 23 per unitFeb.21 Received 300 units at Rs. 25 per unitMar.16 Issued 620 unitsApl.12 Issued 240 unitsMay 10 Received 500 units at Rs.22 per unitMay 25 Issued 380 units
(Ans. Stock LIFO 520 units of Rs. 10,640 and FIFO 520 units of Rs. 11,500)
4 The following transactions took place in respect of a material item:
Receipts Rate Issue
Quantity Rs. Quantity
2-3-2006 200 2.00
10-3-2006 300 2.40
15-3-2006 250
18-3-2006 250 2.60
20-3-2006 200
Prepare a priced Ledger sheet, pricing the issues at-
(a) Simple average rate :
(b) Weighted average rate
(Ans. Stock (a) 300 units of Rs. 720, (b) 300 units of Rs.726)
5 Record the following transactions in stores Ledger, pricing materials issues by (a) FIFO, (b) LIFOand (c) Average price methods. Show the balance of inventory after each transaction:
May1 Balance 50 units @ 25P. per units
May 1 Ordered 200 units, expected May 6, purchase order 55.
May 2 Issued 25 units, requisition No. 101 Dept.A
May 4 Ordered 100 units, expected May 8, purchase order 65.
May6 Received 200 units, purchase order 55 @ 30P. per unit
May 7 Issued 75 units, requisition 105, Production Order 313.
May 8 Returned to stock room 5 units from Dept. A requisition 101

80
May 10 Received 75 units, purchase order 65@ 38P. per unit
May 12 Ordered 50 units, Purchase Order 77, Expected May20
May 15 Issued 80 units, Requisition 125, Production Order 328.
May 18 Received 25 units, balance of Purchase Order 65@ 38P. per unit
May 21 Issued 30 units, Requisition 130, Dept.B
May 23 Returned to vendor 10 units from Purchase Order 65, received May 18.
May 25 Received 50 units, Purchase Order 77@ 25P. Per unit.
May 27 Freight on Purchase Order 77, Rs. 12.
May 29 Issued 60 units, Requisition 140, production Order 354.
(Ans. Stock FIFO 75 units @ 38P.+50 units @49P.=125 units of Rs. 53; LIFO 25 units@25P.+100 units@ 30.=125 units of Rs. 36.25; Weighted Av. Method 125 units of Rs. 46.63)
6 Show the stores ledger entries as they would appear when using.(a) The weighted Average Method.(b) The LIFO method.
Of pricing issues, in connection with the following transactions:
April Units Value1. Balance in hand b/f 300 6002. Purchased 200 4404. Issued 1506. Purchased 200 46011.Issued 15019.Issued 20022. Purchased 200 48027. Issued 250
(Ans. (a) 150 units of Rs. 342, (b) 150 units of Rs. 300)
7 Set up a “Stores Ledger” form and enter the following transactions adopting the weighted averagemethod of pricing out issues:
2010
August 1 Opening Balance -50 units@ Rs. 3 per unit.
August 5 Issued out to production: 2 units.
August 7 Purchased 48 units @ Rs. 4 per unit.
August 9 Issued out 20 units to production
August 19 Purchased 76 units @ Rs. 3 per unit.
August 24 Received back into stores 19 units out of 20 units issued on 9th August, 2006
August 27 Issued to production 10 units.(Ans. Stock 161 units of Rs. 527.70)
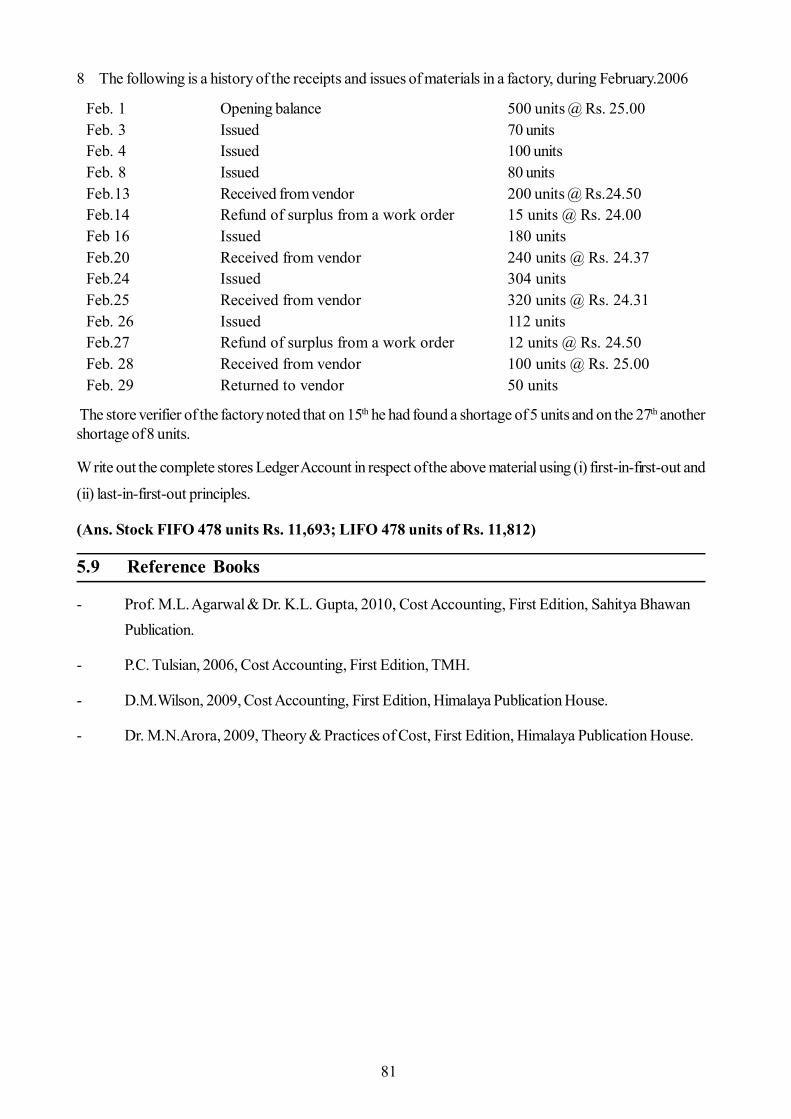
81
8 The following is a history of the receipts and issues of materials in a factory, during February.2006
Feb. 1 Opening balance 500 units @ Rs. 25.00Feb. 3 Issued 70 unitsFeb. 4 Issued 100 unitsFeb. 8 Issued 80 unitsFeb.13 Received from vendor 200 units @ Rs.24.50Feb.14 Refund of surplus from a work order 15 units @ Rs. 24.00Feb 16 Issued 180 unitsFeb.20 Received from vendor 240 units @ Rs. 24.37Feb.24 Issued 304 unitsFeb.25 Received from vendor 320 units @ Rs. 24.31Feb. 26 Issued 112 unitsFeb.27 Refund of surplus from a work order 12 units @ Rs. 24.50Feb. 28 Received from vendor 100 units @ Rs. 25.00Feb. 29 Returned to vendor 50 units
The store verifier of the factory noted that on 15th he had found a shortage of 5 units and on the 27th anothershortage of 8 units.
W rite out the complete stores Ledger Account in respect of the above material using (i) first-in-first-out and
(ii) last-in-first-out principles.
(Ans. Stock FIFO 478 units Rs. 11,693; LIFO 478 units of Rs. 11,812)
5.9 Reference Books
- Prof. M.L. Agarwal & Dr. K.L. Gupta, 2010, Cost Accounting, First Edition, Sahitya BhawanPublication.
- P.C. Tulsian, 2006, Cost Accounting, First Edition, TMH.
- D.M.Wilson, 2009, Cost Accounting, First Edition, Himalaya Publication House.
- Dr. M.N.Arora, 2009, Theory & Practices of Cost, First Edition, Himalaya Publication House.

82
Unit - 6 : Methods of Remunerating Labour
Structure of Unit:
6.0 Objectives6.1 Introduction6.2 Direct and Indirect Labour6.3 Control over Labour Cost6.4 Labour Turnover6.5 Labour Turnover Rates6.6 Cost Analysis of Specific Types of Labour Cost6.7 Remuneration System6.8 Normal Remuneration Method6.9 Incentive Wages Method6.10 Group Bonus Plans6.11 Summary6.12 Self Assessment Questions6.13 Reference Books
6.0 Objectives
After completing this unit you will be able to know that: Proper Accounting and control for labour cost constitutes one of the major objectives of all
business firms. It provides management labour cost information for effective planning of labour force in the
business and for adequate monitoring of labour costs. Efficiency of workers mostly depends on the amount and technique of remunerating labour so while
selecting a specific method of remuneration, qualification of employee, capability of employer,minimum wages and other factors should be considered.
6.1 Introduction
Labour is the second important element of production. The role of labour in production cannot be overlookedin spite of the fact that machines are being used a vast scale these days. The efficiency of productiondepartment is based on the skill of workers. In the absence of skilled workers product cannot bemanufactured. Workers convert raw materials into finished goods. Skilled worker helps in decreasing thecost of product besides increasing the quality and quantity of the production.
Labour can be direct as well as indirect. Labour is treated as direct if it can be conveniently allocated todifferent jobs. In other words, when there is any direct relationship between labour cost and the product,process or cost per unit, it is treated as direct. Wages paid to machine shop, assembly shop, factory etc. arethe examples of direct labour cost. Direct labour cost is known as the wage of those workers who areengaged in production process whose time can be efficiently and economically traceable to units of productse.g. wages paid to compositors in a printing press, labour of machine operators and assembles. It may alsobe defined as prime labour cost, process labour cost, operating labour cost, manufacturing wages, directwages and productive labour cost. Whereas indirect labour costs are not related with the production. Someworkers do not engage directly in conversion of output but they contribute indirectly. Labour is paid for theobjective of carrying tasks intended to goods or service provided. It cannot be practically traced to particularunits of output e.g. wages of store-keepers, foremen, time-keepers, supervisors, inspectors etc.

83
6.2 Direct and Indirect Labour
Labour involved in factory can be classified in to two categories:
1) Direct Labour 2) Indirect Labour
1) Direct Labour: Labour which can be conveniently identified with a particular cost centre or costunit, the remuneration which is payable to direct workers is direct wages. Ex- wages paid to machineoperators, furniture maker, shoe maker, tailor etc.
2) Indirect labour: Such cost cannot be conveniently identified with a specific job, product or processbut can be apportioned to or absorbed by cost centres or cost units. The remuneration which ispaid to indirect workers is known as indirect wages. Ex- Services of supervisor, inspector, foreman,time keeping officers, cleaners, general managers etc.
Difference between Direct Labour and Indirect Labour:
Basis of Distinction Direct Labour Indirect Labour
1) Identification It can be really identified It cannot be directly identified withwith a particular job or work order a particular job or work order.
2) Variability It changes directly with the It may or may not changesvolume of output. directly with the volume of
output.
3) Treatment of cost Direct labour cost is treated Indirect labour cost is treated asas part of prime cost part of overhead.
6.3 Control over Labour Cost
It has been stated above that labour is an essential element of the process of production, and it also plays avital role in producing a product. In large organisation or concerns, labour is controlled by following fivedepartments :
1. Personnel Department: In personnel department, selection, appointment and placement of workersafter a suitable training is made.
2. Work Study and Engineering Department: In work study and engineering department, workstudy related activities such as planning, job specification, job analysis, time and motion study, safeworking conditions and supervision of the production process are performed.
3. Time-keeping Department: In time-keeping department, attendance of workers and calculationof wages of workers are recorded.
4. Payroll Department: In this department, payroll, wages sheet and distribution of wages arerecorded.
5. Cost Accounting Department: In this department, accounting for all labour cost is recorded.
The brief study of the above department is as follows:
1. Personnel Department: All the activities of selection, appointment and placement of workers areperformed by this department. The personnel manager must have the knowledge of current labour laws andlabour conditions in the industry, labour policies of the company, production programme and several problems

84
of the workers. With the help of these information the manager is able to provide appropriate candidate tothe industry and manager can remove all the problems which are persists in the industry in favour of labour.The personnel manager records all these information of workers into a card which is called workers historycard.
(i) Workers History Card: Workers history card includes name of the workers, department,post, grade, date of appointment, salary and qualification of the workers. The specimen ofworkers history card is as follows:
Workers History card
Name . . . . . . . . . . . Name of Father/Husband . . . . . . . . . . No. .. .. .……...
Deptt. . . . . . . …… . Date of Appointment . . . . . . . . ….post ……..….......
Salary at the time of Appointment . . . . . . . . . . . . . …...Grade . ..... . .….. .
Address . . . . . . . . . . .Qualification. . . . . . . . ... . Married/Unmarried. … ..
Name and Address of Previous Employer . . …………. . Post ... . ……. . .
Reason to Leave Earlier Job . . . . . . . . . . . . . ……………………….. . . . .
Promotion . . . . . . . . . . . ………..…New Grade . . ……………. . . . . . . . .
New Qualification . . . . . . . …….. . . . . Other Details . . . . . ……….. . . . .
(ii) Labour Placement Requisition: Labour placement requisition is fulfilled by the personnelmanager. He checks whether an appropriate candidate is available from within the organization.For appropriate candidate, he gives advertisement in news paper, magazine and trade journals.A specimen of labour placement requisition is follows:
2. Work Study and Engineering Department: Work study department, helps in establishing controlover working conditions. This department also control over productive methods for each job and eachdepartment. The main functions of this department are as follows:
(i) Time Study: Time study determines standard time for an operation by direct time. It takes placewith the help of stop watches to fix standard time for the job/operations. While fling standard timenecessary time for rest is also added. Time study is very useful in standard costing and it is a base of
Labour Placement Requisition Requisition No. . . . . . . . . . . . . Department . . . . . . . . . . . . Date………………………….
Please recruit workers of the following grades for my department with the effect from . . . . . . . . . . . . This is as per the original/revised budget.
Any Special Remarks....................................... No. of Workers Requisitioned
Grade Job
Specification Description Remarks
Approved by . . . . . . . . . . . . . Requisition by . . . . . . . . . . Action taken by . . . . . . . . .

85
incentive schemes for workers. The basic purpose of time study is to find out required time forperforming the job/operations. I.L.P. has defined time study as, "a technique for determining accuratelyas possible from a limited number of observations the time necessary to carry out a given activity ata standard of performance.''
(ii) Motion Study: Motion study was developed by the American Management Expert F.B. Gilbrith.It is of motion performed by worker at an operation.
Motion study is related with the determination of standardised methods for performing several jobs.When a worker is required to perform operations at work during which his body is moving such asmovement at hands, eyes and neck. With the help of this study such movements can be minimizedby proper arrangement of light, place of machines and height of chairs to reduce fatigue and tiredness.Benjamin W. Niebel defined it as, "The study of the body motion used in performing an operation,with the thought of improving the operation by eliminating unnecessary motion and simplifying necessarymotions and then establishing the most favorable motion sequence for maximum efficiency".
(iii) Job Analysis: Job analysis includes preparation of a description and classification of each jobwith a list of qualification needed by the workers. United States Department of Labour has deemedjob analysis as, "Job analysis is the process of determining by observation and study, and reportingpertinent information relating to the nature of a specific job. It is the determination of the tasks whichcomprise the job and the sills, knowledge, abilities and responsibilities required of the workers forsuccessful performance and which differentiates the job from all others." Thus, the main object ofjob analysis is to ascertain the relative worth of each job through objective evaluations.
(iv) Merit Rating: Merit rating is the qualitative and quantitative assessment of the worker'spersonality and performance. Merit rating is based on following factors of workers -
(a) Quality of work,(b) Quantity of work,(c) Attendance,(d) Discipline and cc-operations,(e) Job knowledge,(f) Initiatives,(g) Reliability and responsibility, and(h) Aptitude of work.
3. Time-keeping Department: Generally, time keeping department records each worker's time 'in' and'out' of the factory and the time of each employee for each department. For time recording purpose, thisdepartment maintains different cards which are as follows:
(i) Daily Muster Roll(ii) Time Cardiii) Daily Time Sheet(iv) Weekly Time Sheet(v) Job Card(vi) Idle Time Card(vii) Piece Work Card
The detailed study of the above cards are as follows :
(i) Daily Muster Roll: The attendance register to note the exact timing 'in' and 'out' of each

86
worker of the factory is known as daily muster roll. The register provides sufficient number ofcolumns for attendance of each worker. All the entries of the arrival and departure columns may bemade by the foreman or the workers himself. In the case of literacy of workers they make sign onthe register to avoid any dispute later on. Each department maintains a separate register for hisworkers. The specimen of daily muster roll are as follows :
(ii) Time Card: It is an electronic card. In time card, time of arrival and departure or 'In' and 'out'is recorded by the machine. This card is issued to each worker and an identification number isprinted on it. The time card of each worker or employee is placed near the entrance of the factory/office in two racks. One is 'in' rack and the second is out rack. When worker/employee enters inthe factory/office, he puts the time card in a device (Machine) and card device prints the time ofarrival (in) and then he places this card in the 'in' rack. The same procedure is repeated at the timeof departure, the worker/employee again puts the card in card device and device (machine) printsthe time of departure or 'out'. This card helps to determine the time consumed or spent by theworker, for which wages of worker calculated according to the time recorded by the machine (timedevice). The specimen of the time card is as follows:
(iii) Daily Time Sheet: Daily time sheet is a special sheet which shows the times spent by aworker on each job during a day. A1l the entries in daily time sheet may be fulfilled by worker
Daily Muster Roll Day.............................. Date..................................... Department. ………………….
Worker's No.
Worker's Time Hours
Name Class Job No. In Out Normal Over-
time Total
Time Card Ticket No. of Worker. . ……………………. . Department . ……………………. Name of the Worker…………………………. Week Ending . . . . . . ………... ….
Days Normal Time Over Time Total Time
In Out In Out In Out Monday Tuesday Wednesday Thursday Friday Saturday
Wages payable Worker . . . . . . . . . . . . Ordinary time . . . . . . hrs. @ Rs. . . . . . ………... Wages Clerk . . . . .. . . . Overtime . ………… hrs. @ Rs. . . . . . . . …….
………... Less : Deductions . . . ……. Net Amount Payable ………. .

87
himself or by the foremen. It is very suitable in an organisation where one worker is engaged foronly one job a day. The specimen of daily time sheet is as follows:
(iv) Weekly Time Sheet: In weekly time sheet, weekly time consumed by the worker is recorded.This is quite similar to the daily time sheet. The specimen of weekly time sheet is as follows:
(v) Job Card: A card which is prepared for each job done by the worker is called job card. Whena job is given to the worker, a card with the number of the job is also given to him. The worker shallrecord the time of starting the job and finishing it. The specimen of job cash is as follows:
(vi) Idle Time Card: Idle time card is prepared to know the unproductive time in the factoryduring the job. Idle time card is prepared by the cost clerk, he want to know about the causes of
Daily Time Sheet Token No. of Worker. . ……………………. . Date . ……………… Name of the Worker………………………….
Job No. Department
Time Total Hours
Rate per Hour
Amount Rs. Start Finished Normal Over-time
Worker . . . . . . . . . . . Cost Clerk . . . . .. . . .
Foreman ….. ………. .
Weekly Time Sheet
Token No. of Worker………………… Department . . . . . . . . . . Nome of the Worker………………….. Week Ending . . . . . . . . .
Date Job. No. Job. No. Total Time Rate Rs.
Amount Rs. On Off On Off Normal Over-time
Worker.............. Cost Clerk . . . . . . . . . . . . Foreman.. . . . . . . . . .
Job hard
Token No. of Worker. . . . . . . . . . . . . . . . . . . Date . . . . . . . . . . Name of the Worker. . . . .' . . . . . . . . . . . . . . Job No. . . . . . . . . . Job No. Time Total Hours Rate Rs. Amount
Rs. ON OFF Normal Over-time
Worker...................... Cost Clerk ……….... Foreman ................
Card

88
idle time in a factory. Idle time is the time during which the workers were idle. There are severalcauses of idle time. But, generally, lack of materials lack of machine, lack of power, lack at instructions,mismanagement, transfer of workers and employer- employee-tussle are treated as major causesof idle time. Idle time may be classified into two categories normal and abnormal. If idle time isinevitable even in standard conditions it is known as normal idle time. Whereas, abnormal idle timeindicates the idle time noticed is an excess of normal idle time. In addition to it, idle time due toabnormal circumstance is also known as abnormal idle time. Abnormal idle time can be classifiedinto two categories controllable and uncontrollable. Controllable idle time is that idle time which canbe controlled by good planning at top level management whereas, uncontrollable idle time is thatidle time which cannot be controlled by individual action. The specimen of idle time card is asfollows:
(vii) Piece Work Card: This card is prepared for piece produced by each worker. This cardrecords numbers of pieces produced by the worker. The specimen of piece work card is asfollows:
6.4 Labour Turnover
Labour turnover is the number of employees who leave the factory during a period in relation to thenumber of workers employed during the year due to resignation, new appointment, retrenchment, oldage, ill health, pregnancy, death etc.
Idle Time Card Name of the Worker. . . . . . . . . .. . . . . . . . . Date . . . . ……….. . . . . . Token No. of Worker. . . . . . . . . . . . . . . . . . Department . . . . . ….. . . .
Reasons for Idle Time
Time Total Hrs.
From To Period Rate Rs. Amount Rs. Power Failure Breakdown of Machinery Waiting For :
Tools Materials …………….. Other Causes ……………..
worker . . . . . . . . . . . . . . Cost Clerk . . . . . . . . . . . . Foreman . . . . . . . . .
Piece Work Card Name of the Worker. . . . . . . . . . . . . . . . Date of Starting Job. . . . . . . . . . Token No. of Worker. . . . . . . . . . . . . . Date of Completion job . . . . . . .
Name of the Job
Quantity of Product
Quantity Accepted
Quantity Rejected
Rate per unit Rs. Total Time
Worker.............. Foreman . . . . . . . .
89
Causes of Labour turnoverCauses of labour turnover in an organization can be classified as follows:
a) Reasons Related to Employer- labour turnover can be arise due to unhealthy environment, lawwages, lack of changes for promotion and because of wrong behavior of employer towardsemployees.
b) Reasons Related to Employees - High labour turnover is sometimes due to nature and efficiencyof employees. Example - Retrenchment due to inefficiency, disciplinary action, change for bettermentetc.
c) Casual Reasons - The casual reasons such as permanent disability of employees, domestic problemsand family responsibilities, retirement due to ill health or old age, marriage of employee, pregnancyetc. resulted in the labour turnover.
Bad Effect of Labour Turnover: High labour turnover leads to increase in the cost of production anddeclines productivity by the following ways:
1) Cost of selection and training increase which result in the increment of cost.2) It leads to more wastage of materials, scrap, defective work and monitoring cost.3) Due to lower productivity of new recruits who may not have the similar experience as a workman
who left.4) It leads to less production because of the time lack between separation and recruitment of new
employees.5) It also leads to reduction in sales because of loss of contribution and goodwill.6) Regular flow of production gets disturbed because of frequent changes in labour force.
6.5 Labour Turnover Rates
Labour turnover rates are calculated to facilitate comparisons between different periods and differentorganizations. Labour turnover rates are calculated by three methods which are as follows:
1 Separation Rate Method2. Replacement Rate Method3. Flux Rate Method
(1) Separation Rate Method : This method shows number of worker who separated from factory duringa particular period. The following formula is used for calculation of separation rate.
No. of Workers separate during a year / periodSeparation Rate 100Average Number of Workers induring a year / period
The average number of workers is calculated by following formula:
No. of Workers at the
beginingof period No. of Workers at the end of period
2
The above method may be explained by following illustration :
Illustration - 1:
In a factory, there were 1,000 workers in the beginning of the year while there were 2000 workers at the
90
end of the year. During the year 50 workers were retrenched and 40 workers resigned from services. Findlabour turnover rate by separation rate method.
Solution:
No. of Workers separate during a year / periodSeparation Rate 100Average Number of Workers during a year / period50 40 100 6%1500
Working Notes:(i) Average number of workers in the year = 1,000 + 2,000 /2 = 1,500(ii) Workers left or retrenched during the year = 50 + 40 = 90
2. Replacement Rate Method: Under replacement rate method, the rate of replacement of new workersin the place of separate workers is calculated. The following formula is used to calculate the replacementrate :
No. of Workers Replaced during the periodReplacement Rate 100Average No. of Workers during the period
The average number of workers is calculated by following formula:
Number of workers at the beginning of periodReplacement Rate 100Number of workers at the end of period
The following illustration explain the calculation of replacement rate.
Illustration - 2
In a factory, there are 1,000 employees in the beginning of the year while they were 1400 employees at theend of the year. During the year 100 employees left and 500 employees joined out of which 80 employeesjoined to replace old employees, rest of employees joined in expansion programme. Find replacement rate.
Solution:
No. of Workers Replaced during the periodReplacement Rate 100Average No. of Workersduring the period80 100 6.67%
1200
Working Notes:
Average Number of employees in the year = 1,000+1,400/2 = 1,200
3. Flux Rate Method: The flux rate represents the total change in the composition of labour force due tosensations and replacement of workers. This is calculated by the following formula:
No. of Worker No. of Workers Seprated ReplacedFlux Rate 100
Average No. of Workersduring the period

91
The following illustration explains flux rate method:
Illustration - 3:
In a factory, there were 1,000 workers in the beginning of the year while 1200 workers at the end of theyear. During the year 50 workers left and & 60 workers joined for their work. Remaining employees joinedin an Expansion Programme. Calculate flux rate.
Solution:
No. of Worker No. of Workers Separated ReplacedFlux Rate 100
Average No. of Workersduring the period50 60 1001100110 100 10%
1100
Working Notes:
Average Number of Workers = 1000+1200 / 2 = 1100
Illustration - 4:
Calculate different labour turnover rates from the following information collected from the personnel departmentof Tailor manufacturing Co. for the month of January, 2008. You are also required to find out the relationshipamong the labour turnover rate calculated by different methods:
No. of Workers on 1st January 08 950No. of Workers on 31st January 08 1,050No. of Workers left the factory in January 10No. of Workers discharged in January 30Workers recruited in the month (including 120 for Expansion) 140
Solution:
No. of Workers separatedSepration Rate 100Average No. of Workers
10 30 100 4%1000
Annual Separation Rate: = 4 x 12 = 24%
Average workers =950+1,050 / 2 = 1,000
(2) No. of Workers ReplacedReplacement Rate 100Average No. of Workers
140 120 100 2%1000

92
Annual Replacement Rate = 2% x 12 = 24%
No. of WorkersSeparated + No. of Workers Replaced (3) Flux Rate Method Average No. of Workers during the period
40 20 100 6%1000
Annual Flux Rate = 6 x 12 = 72%
(4) Relationship among different labour Turnover Rate
Flux Rate = Separation Rate + Replacement Rate
72% = 48% + 24%
6.6 Cost Analysis of Specific Types of Labour Cost
Generally cost is treated as direct or indirect labour cost but still there are certain costs which sometimesmay be treated as direct labour cost and other times as indirect labour cost depending upon the situation.
Few examples of specific types of labour cost are follows:-
1) Cost Benefit Analysis of Overtime Work - Any work which cannot be completed during routine ornormal working hours, workers are asked to work for extra hours and the wages asked to work for extrahours and the wages paid during extra hours is known as overtime wages. The rate of wages during suchadditional hours is higher than normal wages so overtime is sectioned in specific circumstances only andthese are -
a) Making up time lostb) Seasonal rush of workc) Completion of job within a specified periodd) Shortage of labour or some workers on leavee) To utilize machine and infrastructure to the maximum extent
Effect, control and accounting of overtime
Effects: If overtime is sanctioned in special situations then it is good otherwise it will cause lots ofproblems like workers will increase the labour cost, workers will work slowly during normal time toget sanctioned the overtime, workers will be tired so during overtime productivity will be decreased,more depreciation on plant and machinery and adverse effect on health of workers.
Control: After discussing the above causes, it is clear that overtime working should be controlledand should be permitted in special circumstances only. For this some action may be taken -a) It should be permitted only if it is urgently required,b) It should be sanctioned by competent authority,c) Effective supervision may be exercised,d) Proper flow of work during normal working hours,
Accounting: When we talk about accounting treatment of overtime wages, that means how excesspayment i.e. overtime premium should be treated in cost accounts as another part of overtimewages i.e. normal wages in considered in the same way as wages paid during normal hours istreated. Treatment of overtime wages depends upon circumstances because of which overtime waspaid for:1. If overtime is due to general pressure of work, it may consider as overhead.

93
2. It may be charged to the concerning department, if it is because of department delay.3. If overtime is being worked because of the request of the customer or to complete an orderbefore time, it is charged to the job or order.
2) Cost Analysis of Losses Due to Idle Time: Idle time is the time for which labour attends the workplace but does not work actually, still wages is paid for the time spent in the workplace. Causes of idle timecan be divided into four parts:-
1. Relate to Production: Causes related to production can be further categorized as avoidable andunavoidable causes which are as follows:
i. Avoidable Causes: It includes lack of material because when enough material is not available thereis idle time which can be controlled. Causes such as lack of machinery, power and lack of instructionscan also be avoided.
ii. Unavoidable Causes: Causes such as time lost between completion of one job and commencementof next job; workers getting instructions from supervisor or time for setting machines and personalneeds and fatigue to a reasonable extent can't be controlled.
2. Administrative Causes: Idle time can also arise because of lack of proper administration,coordination and co-operation among workers. The major causes of idle time are mismanagementwhich occurs due to lack of discipline and control on workers. When workers are transferred to ajob which is not of their liking, it increases the chances of idle time which can be controlled. Whenthere is an dispute between employer and employee, it should be resolved at an initial stage as if itis referred to trade union, will lead to strike.
3. Economic Causes: In the case of seasonal industries workers may remain idle because of non-dismissal of workers in the off season, other season for the lack of demand are competition, changein export policy etc.
4. Other Causes: If in other concern, employees are not working efficiently or if there is no value ofhard working in the factory and society, workers will tend to go slow.
6.7 Remuneration System
The remuneration of employees is a reward of services rendered by him. It is an agreement among employerand employee. For remuneration, B.K. Bhar has rightly point out that, "Remuneration is the reward forlabour and services, whereas incentive is the stimulation of effort and effusiveness by offering monetaryinducement or extra facilities."
Labour cost plays an important role in total cost. It is based on efficiency and experience of workers. Manytimes labour cost forming 60 per cent to 70 per cent part of total cost. H.J. Sheldon stated that, "Lowwages do not necessarily mean low costs; in fact, it is widely recognized now that efficiently organizedfactories may pay the highest, and yet have lowest labour costs."
6.8 Normal Remuneration Method
It has already been stated that labour is one of the main element of production. The success of a businessorganization is based on the efficiency of labour. There are several methods of wage payment. These arediffering from each organisation to another organization. The methods of wage payment are as follows:
1. Time Rate Method: This method is very popular method of payment of wages. Under this method, thepayment is made on the basis of time devoted by worker in the factory. It is an oldest form of wage

94
payment. In this method wages is calculated as follows:
Wages = Hours Worked x Rate per Hour
Illustration - 5:
Calculate total weekly wages paid to Mohan, from the following information:
Per weekStandard Hours even to him 40 HoursActual Hours worked 30 HoursRate per Hour Rs. 20
Solution:
The total weekly wages paid to Mohan will be calculated as follows :
Formula:
Wages = Hours Worked x Rate Per Hour = 30 x Rs. 20 = Rs. 600
Thus, weekly wages paid to Mohan is Rs. 600
2. Piece Rate Method: In this method, wages is paid on the basis of units produced by the workers. Therate of payment is determined by production department. Under this method, wages of workers is calculatedby following formula:
Total Wages = No. of Units Produced x Rate Per Unit
Illustration - 6:
From the following information, calculate total wages by piece rate method and time rate method.Standard Hours 60
Actual Hours Worked 50
No. of Unit Produced 500
Rate per Hour Rs. 20
Rate per unit produced Rs. 5
Solution:
The total wages paid to workers is calculated as follows:
Time Rate Method
Formula = Actual Hours Worked x Rate per Hour = 50 x Rs. 20 = Rs. 1,000
6.9 Incentive Wages Method
Generally, incentive may be deemed as an extra payment paid by employer to worker/employees for hisadditional efficiency. The main object of an incentive plan to induce a worker to produce more to earnhigher wages. Incentive plans increase the efficiency and capacity of workers. Some important incentiveplans are as follows:
1. Halsey Premium Plan2. Rowan Bonus Plan3. Taylor's Plan4. Emerson's Efficiency Plan5. Merric's Plan

95
1. Halsey Premium Plan: This plan was developed by F.A. Halsey an American Engineer in 1891. Theydeveloped this plan for the payment of bonus. Under this plan, a worker is entitled to get bonus if he finishedhis work before his standard time. The total wages is paid to him as normal wages (Actual time x Rate perhour) plus a bonus on the basis of time saved by him on production. The rate of bonus may be 30 per centto 70 percent of wages for time saved by workers. But, in the absence of any Information the rate of bonusmay be taken at 50 percent. According to this plan, time saved can be calculated as follows:
Time saved = Standard Time - Actual Time
or TS = ST - AT
Therefore, the total wages of a workers in this plan can be calculated as follows :
Normal Wages (Actual Time x Rate per Hour) = x x xBonus (Time Saved x Rate x 50/100) = x x x
Total Wages x x x
The above calculation can also be solved as follows:
Total Wages = (Actual Hour worked X Rate per Hour) + (Time saved X Rate per hour X 50/100)
Illustration - 7:
Calculate the amount of total wages from the following information:Standard Output in 11 hours : 120 unitsActual Output in 10 hours : 132 unitsWages Rate per hour : Rs. 15
Solution:
At first standard time (ST) is calculated for 132 units and than total wages is calculated as follows :
= (10 x 15) + [ (11-10) x 15 x 50/100]
= 150 + 7.5 = Rs. 157.50
2. Rowan Bonus Plan: In 1901, this plan was developed by James David Rowan. This plan is similar toHalsey Premium Plan. But, the calculation of bonus is made on the proportion of time taken and timeallowed to him. In this plan the bonus is calculated as follows:
Bonus: Actual Time / Standard Time x Time saved x Rate per Hour
Therefore, the total wages is calculated as follows:
Normal Wages = (Actual Hours x Rate per Hour) x x x
Bonus = (Actual Time/standard Time x Time Saved x Rate per hour) x x x
Total Wages x x x
The above calculation can also be solved as follows :
Total wages = (AT x R) + (AT / ST x TS x R)
Illustration - 8:
Calculate the total wages under Rowan Bonus plan with the help of illustration 7.

96
Solution :
Total wages = (AT x R) + (AT / ST x TS x R)
= (10 x 15) = (10 / 11 x 1 x 15)
= 150 + 13.63 = Rs. 163.63
3. Taylors Plan: This plan was developed by the father of scientific management, F.W. Taylor. This plan isbased on time and motion study. Under this plan, the wages is paid according to the capacity of workers. Ifthe workers use less than 100% capacity then the low price rate equal to 80% of standard piece rate isgiven to him. But, if they use 100% or more than 100% capacity then higher price rate equal to 120% ofstandard piece rate is payable.
The piece rate is also expressed as follows :
RateBelow 100% Capacity : 80 % of Normal100% or More capacity : 120% of Normal Rate
Illustration - 9:When standard output in 40 units per hour and standard rate Rs. 4 per hour. The following differential piecerate is applied:
75% of piece rate when below standard. 125 of piece rate when above the standard. The workers haveproduced in a day 8 hours as follows :Ram 240 unitsShyam 400 units
Solution:Given, Standard time = 40 per hourStandard Rate = Rs. 4 per hour
On completing 40 units in one hour, a worker receives Rs. 4. Hence, the piece rate is 4 / 40 = 10 .
Differential Piece Rates :
Low Price Rate : 75% of Piece Rate = 75 x .10 / 100 = Rs. 0.075
High Price Rate : 125% of piece Rate = 125 x .10 / 100 = Rs. 0.125
Thus, at 40 units per hour, the standard output is 320 units per day. Ram produced 240 units and Shyamproduced 400 units. In this question, performance of Ram is below standard while Shyam's performance isabove standard. Hence, Ram is paid at lower rate and Shyam is paid at higher rate. i.e. Ram is paid = 240x.075 = Rs. 18, Shyam is paid = 400 x0.125 = Rs. 50
4. Emerson's Efficiency Plan: This plan was developed by Emerson. Under this plan, minimum wagesis guaranteed but, bonus is paid on the efficiency of workers. There are several slabs for efficient workers.The standard output is fixed at 100% efficiency. If the worker uses less than 100% efficiency, bonus is notpaid to him. The bonus slabs in this plan is as follows:

97
Illustration - 10:
Calculate the amount of bonus and total wages under Emerson plan with the help of following information:Standard Output in 10 Hours : 120 unitsActual Output in 10 hours : 132 unitsWages Rate : Rs. 15 per hour
Solution:
At first, the efficiency of worker is calculated:
Actual OutputEfficiency of worker 100Standard Output132 100 110%120
As efficiency of worker is more than 100% rate of bonus is calculated as follows : Rate of Bonus =20% + (Efficiency of worker - 100%)
= 20% + (110% - 100%)= 20% + 10% = 30%
5. Merric's Plan: This is a updated form of Taylor's plan. Taylor's plan gives two rates while merric's plangives three rates.
6.10 Group Bonus Plans
Group bonus refers to bonus paid for the collective efforts made by group of workers. Under a groupbonus scheme, bonus is paid to a team of employees working together. This scheme is generally introducedwhere individual efficiency cannot be established for the payment of bonus. If any incentive is to be offered,it should be offered to the team as whole. The quantum of bonus is determined on the basis of the production
Efficiency of Worker Bonus
(i) Below 66.67% or 66 2/3% (ii) 66.67% to 100% (iii) Above 100%
No Bonus 20% Bonus 20% Bonus + 1% bonus for each increase of 1% in efficiency
of actual wages
Particulars Amount
(Rs.) Wages For Actual Time = AT x AR = (10 x 15) 150 Bonus for Efficiency = AW x 30% = (150 x 30%) 45
195
Level of Efficiency Price Rate Upto 83.33% 83.33% to 100% Above 100%
Ordinary Piece Rate 110% of Piece Rate 120% of Piece Rate

98
of the team and the bonus is shared by individual workers in a certain proportions, mostly in the proportionof wages on time basis:
There are five schemes of group bonus plan - Priestman's Production Bonus Cost Efficiency Bonus Town Gain Sharing Plan Budgeted Expenses Bonus Waste Reduction Bonus
Illustration - 11:
Calculate the earnings of workers, x, y and z under straight piece state system from the following particulars:Normal state per hour Rs. 10.80Standard time per unit 30 seconds
Output per day is as follows:
Worker x - 780 units; Worker B - 900 units and Worker C - 1200 units.
Working hours per day are 8.
Solution:
Calculation of Normal wage rate per unit:Normal wage rate per hour Rs. 10.80Standard output per hour 120 unitsNormal wage rate per unit 0.09(Rs. 10.8/120 units)
Efficiency Level
X Y Z Actual Output per day (Units) (a) 780 900 1200 Standard output per day (b) 960 960 960 Efficiency level achieved (a/b x 100) 81.25% 93.75% 125%
Efficiency of workers under straight price rate system:
Worker x (780 units x Rs. 0.09) 70.2 Worker y (900 units x Rs. 0.09) 81.0 Worker y (1200 units x Rs. 0.09) 108.0
Earnings of workers under Mercies’ Multiple Price Rate System
X Y Z Efficiency Level 81.25% 93.75% 125% Actual output per day (units) (i) 780 900 1200 Applicable wage state per unit (ii) 0.09 0.09 0.09 Warning (Rs.) 70.2 81.0 108
Piece
Piece
Wages

99
6.11 Summary
Labour is the second major element of cost which converts the raw materials into finished products. Theremuneration payable to direct labour is known as direct wages and the labour which acts as ancillary to thedirect labour which is used in completing the production. Each concern should constantly strive to raise theproductivity of labour and the efforts for the control of labour cost should begin from the very beginning.The various schemes are introduced which depends upon nature of work and circumstances of each industry.
6.12 Self Assessment Questions
1. What so you mean by 'Labour Turnover'? Mention the various methods of its measurement andexplain what is the impact of Labour Turnover' on working of a manufacturing concern?
2. Write short notes on the following -a. Overtime.b. Idle time.c. Direct and Indirect labour.
3. A worker takes 9 hours to complete a job on daily wages and 6 hours on scheme of paymentby result. His wage rate is Rs.1.50 an hour, the material cost of the product is Rs.8 and theoverhead is150% of total direct wages. Calculate the factory cost of the product under followingplans.(a) Piecework Plan,(b) Halsey Plan, and(c) Rowan Plan
4. During one week the worker X manufactured 200 units. He received wages for a guaranteed45 hours week at the rate of Rs.14 per hour. The time allowed to produce one unit is 15minutes which is increased by 20% in case of piece rate system. Calculate his gross wagesunder each of following method remunerating labour:a. Time Rate;b. Piece Rate;c. Halsey Premium Plan;d. Rowan Premium Plan;
6.13 Reference Books
- Agrawal, Shah, Mendiratta, Agarwal, Sharma, Tailor, Cost and Management Accounting,(Malik and Co.)
- Jain, Khandelwal, Pareek, Cost Accounting (Ajmera Book depot, Jaipur)
- Oswal, Maheshwari, Modi, Cost Accounting ( RBD, Jaipur)
- Agrawal, Jain, Sharma, Shah, Mangal, Cost Accounting ( RBD, Jaipur)

100
Unit - 7 : Overheads – I
Structure of Unit:
7.0 Objectives7.1 Introduction7.2 Classification of Overheads7.3 Factory Overheads
7.3.1 Codification7.3.2 Collection7.3.3 Allocation7.3.4 Apportionment – Primary Distribution
7.4 Secondary Distribution of Service Department Overheads7.5 Summary7.6 Self Assessment Questions7.7 Reference Books
7.0 Objectives
After studying this unit you should be able to understand:
The meaning of overheads. Classify the overheads into different categories. Distribute factory overheads as per the different stages involved in distribution. Understand the primary and secondary distribution of factory overheads. Use different methods for apportionment of inter service departmental problems. Explain the meaning of certain key terms.
7.1 Introduction
Overhead costs refer to those items of cost which cannot be identified with particular products or processesor specific jobs or work orders. These are nither direct material nor direct wages, nor are these expenses ofa direct nature, so these cannot become the direct cost of manufacturing.
According to Blocker and Weltmer “Overhead costs are the operating costs of a business enterprisewhich cannot be traced directly to a particular unit of output.”
CIMA defines overhead cost as “The total cost of indirect material, indirect labour and indirect expenses.
Thus, overhead is the cost of material, labour and expenses which cannot be economically identified to anyone cost unit, but they constitute an essential element of cost as they are incurred for producing a commodityor making it ready for sale. Overhead costs are also termed as ‘indirect cost’ or ‘supplementary cost’ or‘non productive cost’ or on cost etc.
Steps in accounting of overheads
The important steps involved in accounting of overheads is as follows:
A. Classification and codification of overheadsB. Collection of overheads

101
C. Distribution of overheads using
- Allocation
- Apportionment
- Absorption
7.2 Classification of Overheads
CIMA defines classification as “the arrangement of items in logical groups having regard to their nature(subjective) or the purpose to be fulfilled (objective classification)” It is the process of arrangement of itemsinto groups according to their degree of similarity. The classification can be summarized as follows
A. According to Nature:(i) Indirect Material(ii) Indirect Labour(iii) Indirect Expenses
Each of these terms has been explained in detail in previous units.
B. According to Normality:
(i) Normal Overheads: These are expected to be incurred in attaining a given output and areunavoidable in nature. They are included in production cost.
(ii) Abnormal Overheads: These are not expected to be incurred in attaining a given output. Thesearise due to some abnormal reasons e.g. cost of abnormal idle time. They are charged to costingprofit and loss account.
C. According to Controllability
(i) Controllable overheads: Indirect costs which can be controlled by executive action at the pointof their incurrence. Normally variable overheads are controllable overheads.
Classification of overheads
Accounting to
Nature Controllability
Indirect Indirect IndirectMaterial labour Expenses
Controllability Uncontrollable
Normality Variability
Normal Abnormal Fixed Variable Semi variable
Function
FactoryOffice Selling and distribution

102
(ii) Uncontrollable overheads: Indirect costs, which cannot be controlled by executive action at thepoint of their incurrence. Normally fixed overheads come under this category.
D. According to Variability
(i) Fixed Overheads: Indirect costs which tend to remain unaffected by changes in the volume ofproduction or sale are known as fixed overheads. Factory rent, rates, insurance, staff salary etc. arefixed in nature irrespective of the level of capacity utilized or units produced.
It must be noted that fixed costs are not absolutely fixed for all times. If there is a change in thecapacity of production or sale these costs also tend to change. Since the amount of this type of costis fixed over a period of time, fixed cost per unit decreases as production increases and per unitfixed cost increases as production decreases. These overheads are also termed as shut downoverheads or period cost.
(ii) Variable Overheads: Indirect cost which vary in direct proportion to changes in the volume ofproduction or sale are known as variable overheads. Since the amount varies in relation to volume,the cost per unit tends to remain constant. For example, fuel and power, packing charges freight,selling commission etc.
(iii) Semi Variable Overheads: Some overhead costs tend to vary with changes in output or sales butnot in direct proportion to the change. They are neither perfectly variable nor absolutely fixed inrelation to changes in volume. These costs remain constant over a relatively short range of variationin output and then change to a new level with an increase or decrease in the volume of activity.These costs are partly fixed and partly variable. The examples of such costs are – repairs andmaintenance cost of supervision, depreciation of plant etc.
Chart showing the nature of overheads
Semi variable overheads are segregated into fixed and variable overheads by using either of the followingmethods: (i) High and Low Method (ii) Degree of Variability Method (iii) Scatter Diagram Method (iv)Least Square Method and Generally (v) Level of Output Compared with level of expenses method is used,which is as follows:
Fixed overheads
Semi Variable overheads
Variable overheads
Cos
t

103
outputin Changeoverheadin Change unit per cost Variable
producted units of No. unitper overhead variable overhead Variable
Fixed overhead = Total overhead - variable overhead
Illustration - 1:
The cost of producing 3000 units is as follows:
Material Rs. 36000, wages Rs. 24000, overhead charges (fixed and variable) Rs. 10000.
The company produces 8000 units and sells at Rs. 25 each and earns a profit of Rs. 20000. Find out theamount of fixed and variable overheads.
Solution : Calculation of total overheads for producing 8000 units
Selling price 8000×25 = 2,00,000
Less profit 20,000
Total Cost 1,80,000
36000 Less Material 8000 960003000
1,60,00
Total overheads (B/W) 20,000
500010000
3000800010000-20000
= Rs. 2 per unit
So, variable overhead for producing 3000 unit = 3000×2 = Rs. 6000
Fixed overheads = 10000-6000 = Rs. 4000
Activity A:
1 Distinguish between fixed variable and semi variable overhead costs, giving two examplesof each.
E. According to Function(i) Factory Overhead(ii) Office or Administration Overhead(iii) Selling and Distribution Overhead
In this unit we will discussed in detail about factory overheads only.
7.3 Factory Overheads
Factory overheads include all expenses which arise in connection with manufacturing operations but
24000Labour 8000 640003000
outputin Changeoverheadin Changeunit per overhead Variable
104
cannot be directly identified with particular products or jobs. It starts with supply of materials and endswith primary packing of the product.
Factory overhead is also called as ‘manufacturing overhead’ or ‘production overhead’, or ‘factory on cost’or ‘works overhead’. Examples of factory overheads are:
1. Rent rates and insurance of factory building.2. Depreciation and repairs of plant and machinery.3. Depreciation and repairs of factory building.4. Store keeping expenses, cost of consumable stores.5. Wages of indirect labour, normal idle time etc.6. Salary of works manager, foreman.7. Power used by machines.8. Drawing office expenses.
7.3.1 Codification
Codification means collecting similar overhead cost items under one heading. Each item of overhead isproperly analysed and written under its head. A code number is allotted to it which is known as standingorder number. It may consist number or latter or a combination of both. This also helps in adopting mechanizedsystem of accounting.
7.3.2 Collection
After classification and codification of overheads these are collected from the following sources:
1. Store requisition slip – Indirect material2. Job cards and wage book – Indirect labour3. Vouchers of expenses – Total amount of indirect expenses4. Cash book5. Other registers, books and special reports for depreciation wastage, residuals etc.
7.3.3 Allocation - Primary Distribution
Certain items of overheads can be clearly identifiable to the related job or cost unit e.g. repairs and maintenanceincurred for specific department, indirect wage or other expenses for particular department etc.. Allotmentof such items to specific department is known as allocation. Thus, charging the whole amount of particularexpense to particular department or cost centre is called as allocation of overheads.
7.3.4 Apportionment of Overheads
Certain items of overheads cannot be clearly allocated to any particular department or cost centre. In fact,these are combined expenses or overheads. Distribution of these combined overheads to various departmentsis known as apportionment of overheads. This is an indirect process to proportionate the amount of overheadon some equitable basis. This is also called as primary distribution of overheads, because in this distributionall the overhead cost should be allocated or apportioned to the production and service departments. Thecriteria on which apportionment of overhead is based may be as under:
1. Utility and Benefit Received Method: It is based on the theory that greater the amount of service,utility or benefit received by a particular department, the larger should be the share of overhead to be borneby that department. If all the service rendered was utilized by only one department, then total of that servicewill be charged to that department only. The following are some of the common bases in use:

105
(i) Capital Value of Asset: Overheads related to the value of property like depreciation, insuranceof plant and machinery of building can be apportioned on this basis.
(ii) Ratio of Area Occupied: Overheads which are related to the floor area, such as rent of thepremises, remuneration to watchman, repairs of building, lighting and heating are distributed byusing the ratio of area covered or occupied by the departments or cost centers.
(iii) Number of Employees: Expenses of canteen, pensions department, labour welfare section, library,club, hospital etc.
(iv) Departmental Wages: Overheads which are closely related to the departmental wages, likeemployers contribution towards provident fund, holiday pay, ESI etc. can be apportioned in theratio of departmental wages.
(v) Direct Labour Hours: Supervision expenses can be apportioned on this basis.(vi) Machine Hours Worked: Expenses closely related with the running of machine e.g. depreciation,
repairs of machine, general overheads etc. can be apportioned on the basis of machine hours.
Note: Sometimes special related bases are given, then priority is given to these e.g. electricity charges orpower if separate sub meters are there, kilowatts hours used is preferred, otherwise floor area orother nearest related base is used. Similarly for carriage inward value of material issued is useful.For lighting number of light points or area occupied can be used.
Illustration - 2:
A factory has two production departments and two service departments. Following figures have beenextracted from the books of the respective departments.
The following figures of actual costs were taken from the financial booksRs.
Rent 800Depreciation 2000Insurance 800Power 1000Canteen expenses 100Supervision 3000Repairs of plant and machinery 1200Light 1000Employers contribution to ESI 200
Apportion the above costs to various departments on most equitable bases and draw an overhead analysissheet.
Production
X
Department
Y
Service
A
Department
B
Wage (Rs.) 80000 60000 30000 30000
Area sq. meter 1500 1100 900 500
No. of employees 400 300 200 100
Value of plant (Rs.) 160000 120000 80000 40000
Value of stock (Rs.) 25000 15000 - -
Lighting units 500 300 150 50

106
Solution:
Overhead Analysis Sheet
Note: In absence of any indication, power has been apportioned on the basis of value of plant andmachinery.
2. Technical Estimates: Technical experts suggest equitable proportions in which these expenses shouldbe shared by the cost centers. Examples of these are oil and grease, internal transport, consumption ofwater, fire prevention etc.3. Ability to Pay: According to this principle, centres making higher profits take a higher share of theexpenses. The presumption is that larger profit earners can afford larger share of overhead costs.4. Neutrality and Equity or Fairness: It implies that the distribution scheme should produce an allocationwhich is neutral, just and fair to all departments involved.
7.4 Secondary Distribution of Service Department Overheads
If service department render service to production department only
Since actual production is confined only to production departments, so all factory overheads must beultimately charged to the production departments for costing purposes. Service departments overheads canbe apportioned on the basis of actual benefits received by the respective department (which is most commonlyused) or ability to pay (higher the revenue, higher is the proportionate charge for services) or the ease andconvenience with which benefits can be directly traced and measured in respect of the various productiondepartments can also be taken into account.
Illustration - 3:
The following figures are taken from the accounts of a manufacturing concern for the month of August 2010.
Indirect material: Production departments-
A-Rs. 8000 B. Rs. 15000 C.Rs. 4000
Service departments X- Rs. 16000 Y Rs. 6000

107
Indirect wages – Production departments A. Rs. 8000 B. Rs. 12000 C. Rs. 4000 Service departmentX Rs. 12000 Y Rs. 7000.
Other expenses ( Total) – Power and light Rs. 30000 Rent and Rates Rs. 14000, Supervision charges Rs.15000, Insurance of asset Rs. 5000, depreciation at 6% on capital value of asset per annum.
Departmental Data
Service rendered by service departments
A B CX 30% 50% 20%Y 40% 20% 40%
From the above data prepare a overhead distribution sheet.
Solution:
Distribution Sheet
Items A B C X Y
Area (Sq. ft.) 1500 2000 2000 500 1000
Kilowatt hours 800 2200 2000 250 750
Number of employees 60 240 180 40 80
Capital value of asset (Rs.) 400000 600000 500000 200000 300000
Items B asis Total
Rs.
Production Departm ents
Rs.
Service
Departments Rs.
A B C X Y
Indirect materia l Act ua l 49000 8000 15000 4000 16000 6000
Indirect labour Act ua l 43000 8000 12000 4000 12000 7000
Rent and Rates Area 14000 3000 4000 4000 1000 2000
Power and light Kilowatt hours
30000 4000 11000 10000 1250 3750
Insurance Value of assets
5000 1000 1500 1250 500 750
Supervis ion No. of
employees
15000 1500 6000 4500 1000 2000
Depreciation Value of
asset
10000 2000 3000 2500 1000 1500
Total 166000 27500 52500 30250 32750 23000
Distribution of
service overheads
X - 9825 16375 6550 (32750)
Y - 9200 4600 9200 (23000)
Total overheads 166000 46525 73475 46000 - -

108
Inter departmental service
When two or more service departments are mutually dependent then the overhead cost of any one departmentcannot be determined until the costs of other departments are known, while the cost of later cannot bedetermined units the cost of former is known. For example, power house gives power to the maintenancedepartment and in turn maintenance department carries out maintenance work of power house also. So, thepower house must bear a proportionate part of maintenance overheads. Similarly maintenance dept. mustbear the overhead cost of power house. The following are the main methods available for dealing with suchinter departmental distribution.:1. Simultaneous Equation Method: Under this method the total overhead cost for each service departmentis expressed in the form of an algebraic equation with the help of the percentage distribution of the servicecost. But this method may not be easy and practicable to apply if the number of interdependent servicedepartments are more than two. This method is illustrated in illustration 4.2. Repetitive Distribution Method or Continuous Allotment Method: Under this method, servicedepartment costs are apportioned over other departments, production as well as service, according toagreed percentage. This process continues till the amount to be transferred to a particular servicedepartment becomes very small or nil. This method is illustrated as under:
Illustration - 4:
X Ltd. have three productions departments P Q and R and two service departments S and T. The detailspertaining to which are as under:
The expenses of the service departments are allocated as under:
Distribute the service departments overheads as per (i) Repeated distribution method (ii) Simultaneousequations method. Calculate machine hour rate under each method.
Solution:
(A) Repeated Distribution Method
Overheads Distribution Sheet with Machine Hour Rate
Items Total Rs.
Production Department Service Department P
Rs. Q
Rs. R
Rs. S
Rs. T
Rs. Rent 8000 2000 3000 2000 600 400
Depreciation 2000 400 800 300 300 200
Power 800 160 320 120 120 80
Indirect Wages 400 100 160 60 40 40
General
Lighting
800 100 100 100 200 300
Estimated
Machine hours
- 2000 5000 3600
P Q R S T
S 30% 40% 20% - 10%
T 10% 20% 50% 20% -

109
Note : Total Departmental expenses is the total of rent depreciation power, indirect wages and generallighting of each department.
(B) Simultaneous Equations Method
Let, the total overheads of service department S be x Rs. and total overheads of service department T bey. Then we get the equations:
x = 1260 + .2 y andy = 1020 + .1 xx -.2 y = 1260 (i)-.1 x + y = 1020 (ii)
On multiplying equation (i) by 5
5x – y = 6300 (iii)-.1 x + y = 1020 (iv)
Adding equations (iii) and (iv)
4.9 x = 7320x = 1494 (Approximately)
By puting the value of x in equation (iv)
-149 + y = 1020y 1020+149 = 1169 (Approximately)
Particular Basis Production Departments
Rs.
Service Departments
Rs. P Q R S T
Total departmental expenses
Distribution of service overheads: First cycle Actual 2760 4380 2580 1260 1020
Department- S 30:40:20:10 378 504 252 -1260 126
Total 3138 4884 2832 - 1146
Department- T 115 229 573 229 -1146
Total 3253 5113 3405 229 -
Second Cycle
Department- S
69
92
46
-229
22
Total 3322 5205 3451 - 22
Department- T 2 4 12 4 -22
Total 3324 5209 3463 4 -
Third Cycle
Department- S
1
2
1
-
-
Total overheads 3325 5211 3464 - -
Estimated machine hours 2000 5000 3600
Machine hours rate 1.663 1.042 0.962

110
Distribution Summary
3. Step Ladder Method: The following procedure is followed in this method-
(i) The service departments are arranged in the order of their importance to other service departments. Thisis decided by the net value of the services rendered which is the difference between the value of servicerendered and the value of service received.
(ii) After determining the order of service departments the percentage for apportionment of service departmentsare proportionately inflated and apportionment is done by these inflated percentages. This method is illustratedas under.
Illustration - 5:
The distribution summary of overheads of a factory’s different departments is as follows:
Production Departments Service DepartmentsA Rs. 40000 X 8000B Rs. 30000 Y 32000C Rs. 20000 Z 16000
Percentage of service departments for overhead distribution.
Apportion the expenses of service departments to the production departments by step ladder method.
Solution:
(i) Statement showing service rendered and received by service departments.
Particulars P Q R S T
Allocated overheads (Rs.) 2760 4380 2580 1260 1020
Department-S (Apportioned) (Rs.) 448 598 299 -1494 149
Total (Rs.) 3208 4978 2879 -234 1169
Department-T (Apportioned) (Rs.) 117 234 584 234 -1169
Total overheads (Rs.) 3325 5212 3463 - -
Estimated machine hours (Rs.) 2000 5000 3600 - -
Machine hour rate (Rs.) 1.663 1.0424 0.962 - -
A B C X Y Z
X (%) 30 20 30 - 10 10
Y (%) 20 30 20 20 - 10
Z (%) 10 20 30 30 10 -
Service Departments
Total overheads
Production Departments
Service Departments Total Service Rendered X Y Z
X 8000 6400 - 800 800 1600 Y 32000 22400 6400 - 3200 9600 Z 16000 9600 4800 1600 - 6400 Service Received
11200 2400 4000 17600

111
(ii) Statement showing order for apportionment.
(iii) Statement showing apportionment of overheads.
The percentage of apportionment of overheads is as follows:
4. Ignoring Inter Service Department Transfers: For this purpose the distribution percentage of theproduction departments are inflated (up to 100%). Thus the overheads of service department are notapportioned to other service department and vice-versa. However this method can be used only when theinter service departmental service is comparatively insignificant.
Activity - B:
1 Write a note on ‘classification’ ‘allocation’ and ‘absorption’ of overheads. How does it help incontrolling overheads.
7.5 Summary
Overhead cost refers to the cost which cannot be wholly debited directly to a particular job, or workorders. It includes cost of indirect material, indirect labour and indirect expenses. This cost is also termed assupplementary cost.
Overheads may be classified according to their nature, normalcy, variability, controllability and functions.The distinction between fixed and variable overhead is helpful in preparation of budget estimates, for effective
Service Department
Service Rendered
Service Received
Net Product Received
Order
X 1600 11200 -9600 3 Y 9600 2400 +7200 1 Z 6400 4000 +2400 2
Particulars Service Department Product ion Departments
Y
Rs.
Z
Rs.
X
Rs.
A
Rs.
B
Rs.
C
Rs.
Total overheads 32000 16000 8000 40000 30000 20000
Service department –Y -32000 3200 6400 6400 9600 6400
Service department –Z -19200 6400 2134 4266 6400
Service department –X -20800 7800 5200 7800
Total overheads 56334 49066 40600
Z X A B C
Y (%) 10 20 20 30 20
Z (%) -
%33.33
1009030
%11.11
1009010
%22.22
1009020
%33.33
1009030
X (%) - -
%5.37
1008030
%25
1008020
%5.37
1008030

112
cost control and decision making and also helpful in the study of marginal costing and break even analysis.The functional classification is the conventional method of classifying overheads in order to calculate thecost of each main function with the ultimate objective of controlling the costs, therefore allotmentapportionment and absorption is normally done on this basis.
Key Terms
Overhead cost : It refers to those items of cost which cannot be identified with particularproducts or jobs or work orders.
Fixed overheads : Which will not vary with output but remains constant.
Variable overheads : Which vary in direct proportion to changes in the volume of
production or sales, are known as variable overheads.
Factory overheads : Those items of costs which have been incurred in connection with
production of a commodity before it comes out of the workshop.
Allocation of overheads: It implies identification of overhead cost with particular production
or service department or cost centres.
Apportionment : Distribution of overheads among various production and service
departments or cost centres on an equitable basis.
7.6 Self Assessment Questions
1. Explain the classification of overheads according to variability, controllability, normalacyand functions.
2. State the basic difference between allocation and apportionment.
3. The cost of producing 800 units of an article was Rs. 2400. When 1200 units of the samearticle were produced, the cost incurred was Rs. 3000. Segregate the fixed and variable partof the cost.
(Ans. Variable cost per unit Rs. 1.50 and fixed cost Rs. 1200)
4. What is meant by semi variable overheads.
5. What will be the impact on variable cost per unit and fixed cost per unit if the level ofactivity is changed.
6. Z Ltd. has three production departments P, Q and R and one service departmentT. The actual costs for a period are as follows:
Rs. Rs.
Rent 20000 Power 18000Repairs to Plant 12000 Supervision 30000Depreciation of Plant 9000 Fire insurance 10000Lighting 8000 Workmen’s insurance 3000
The following information is available in respect of these departments

113
Apportion the costs on the most equitable basis and re-apportion the expenses of service department T inthe ratio of 4:3:3.
(Answer : P –Rs. 48620, Q – Rs. 35440 and R – Rs. 25940)
7.7 Reference Books
- Ghosh,P.K., ‘Cost Accounting’, National Publishing House, New Delhi.
- Maheshwari, Mittal, ‘Cost Accounting and Financial Management’, Shri MahaveerBook Depot, Delhi.
- Ravi. M. Kishore, ‘Cost Accounting’, Taxmann Publication, New Delhi.
- Jain, Narang, ‘Cost Accounting’, Kalyani Publication, New Delhi.
- Arora M.N., ‘Cost Accounting - Principles and Practice’, Vikas Publication, New Delhi.
P Q R T Area in sq ft. 1500 1100 900 500 Value of plant (Rs.) 120000 90000 60000 30000 Value of stock (Rs.) 30000 18000 12000 - Total wages (Rs.) 30000 20000 15000 10000 No. of employees 60 45 30 15 Kilowatt hours 240 180 120 60

114
Unit - 8 : Overheads – IIStructure of Unit:
8.0 Objectives8.1 Introduction8.2 Administrative Overheads
8.2.1 Collection and Codification8.2.2 Departmentalization or Allocation and Apportionment
8.3 Selling and Distribution Overheads8.4 Absorption of Overheads
8.4.1 Methods of Absorption of Factory Overheads8.4.2 Methods of Absorption of Administrative Overheads8.4.3 Methods of Absorption for Selling and Distribution Overheads
8.5 Over and Under Absorption of Overheads8.6 Summary8.7 Self Assessment Questions8.8 Reference Books
8.0 Objectives
After studying this unit you should be able to-
Understand the meaning of Administrative Selling and Distribution Overheads. Use different methods of absorption of factory, office, selling and distribution overheads. Compare different methods and use the particular method as per requirement. Treat under and over absorption of overheads. Explain the meaning of certain key terms.
8.1 Introduction
As stated in previous unit in functional classification overheads can be of three types namely factory overheads,administrative overheads, selling and distribution overheads. Office overheads are the cost of formulatingpolicies where as selling and distribution overheads incurred in obtaining, retaining a customer by executingthe orders received from him. After determining all the overheads these are allotted to cost unit which iscalled absorption. In this unit we will discuss in detail about office overheads selling and distribution overheadsand absorption methods of overheads.
8.2 Administrative Overheads
Administrative overheads include all indirect expenses relating to the administration and management of anundertaking. This includes all expenses incurred in planning directing controlling or for general administrationof an enterprise.
CIMA, London defines it as “The cost of formulating the policy, directing the organization and controllingthe operations of an undertaking, which is not related directly to any production, selling, distributions,research or development activity or functions are included in administrative cost. Thus, this is the cost ofpolicy formulation and its implementation to attain the objectives of the organization. These overheads arealso known as establishment expenses, office on cost, office indirect expenses etc. These generally compriseof the following costs.

115
(i) Printing, stationery and postage used in the office.
(ii) Salary, allowance and fees of directors, general manager, executive staff, legal advisor, auditors.
(iii) Rent, rates and taxes and insurance of office building.
(iv) Office lighting, heating and cleaning expenses.
(v) Depreciation, insurance, repairs and maintenance of office furniture, buildings, equipments andfittings.
(vi) Audit fee, legal fee and bank charges.
(vii) Telegram, Telephone and other general expenses.
(viii) Air-conditioning expenses of office.8.2.1 Collection and Codification
Office overheads may be collected from stores requisition slip (for indirect material), vouchers, cash bookand wage book for indirect wages and indirect expenses, office registers and other records for depreciationetc. The code number given to an office overhead is termed as ‘Cost Account Number’ A card is maintainedfor every cost account number in which entries are made from journal, cash book, wages book etc. Thisfacilitates identification of the cost of an item.
8.2.2 Departmentalization or Allocation and Apportionment
Office overheads should form a part of total cost of production. But they are not directly connected withproduction or service activities. It is therefore necessary that they should be charged to cost units on suitablebasis. This is allocation and apportionment of overheads. These cost centres may be personnel department,general office, accounts department etc.
8.3 Selling and Distribution Overheads
Selling and distribution overheads refer to indirect costs relating to marketing and sale of product i.e. thecost of activities relating to create and stimulate and maintain demand for companies’ products and tosecure orders. These expenses are entirely divorced from production function and hence charged to thecost of sales.
These overheads may be divided into two brand categories- (a) Selling overheads (b) Distributionoverheads.
(a) Selling Overheads: CIMA London defines selling overheads as “This item includes all the expenditureincurred or cost of seeking to create and stimulate demand and securing orders. Sometimes it is also termedas marketing cost.” Some examples are as follows:
1. Cost of advertising.
2. Sales office and showroom’s rent.
3. Depreciation, insurance, repairs and maintenance of sales office, furniture and equipments.
4. Cost of preparing tenders-samples and folders.
5. Salaries of sales and publicity staff.
6. Commission brokerage etc. on sales.

116
7. Travelling expenses of sales men.
8. Stationery, Postage, Telephone expenses of sales department.
9. Bad debts and cost incurred for collection of bad debts.(b) Distribution Overheads: This item includes – “the cost of the sequence of operations which beginswith making the packed products available for dispatch and ends with making the reconditioned returnedempty packages, if any, available for reuse.” CIMA London, Thus, it refers to all expenses incurred inexecuting orders. It is also known as distribution on cost. Some examples of such items are:
1. Warehouse expenses2. Upkeep and running of delivery vans.3. Carriage outward.4. Salary of drivers, warehouse staff.5. General packing expenses and packing materials.6. Wastage of goods in transit.7. Administrative cost of distribution outlets.
Collection- Documents from which selling and distribution overheads are collected are storesrequisition slips for indirect material, job cards for indirect labour, vouchers and cash book for indirectexpenses, sales registers and other documents for depreciation, wastages etc.
Codification of Overheads – For proper collection of selling and distribution overheads, codificationunder proper heading is very much essential in which similar overheads cost items should be grouped underone heading. This is done by allocating Cost Accounting Numbers. This code number is written on everyrequisition note or job card so that indirect cost (distribution cost) of each department can easily be found.
Illustration - 1:
A manufacturer produces the following details of his expenses.
Rs.
Rent, Rates and Insurance Office 1620Rent, Rates and Insurance Warehouse 660Directors Remuneration 4000Travelling Expenses 860Office Salaries 3000
Bad Debts 500Warehouse Repairs 620
Warehouse Wages 2000Agent’s Commission 5000
Income Tax 2970Bank Charges 220
Donations 500Trade Magazine 150
Printing, Stationery etc. 2500

117
Lighting of Warehouse 200
Lighting of Office 160From the above information prepare a revised statement showing separate totals for (a) Administrationoverheads (b) Selling overheads (c) Distribution overheads and (d) Expenses which you would disregard inestimating the cost.
Solution: Statement showing expenses in related heads
8.4 Absorption of Overheads
After knowing the departmental overheads of each production department, the next step is to search foran appropriate basis for absorbing these overheads on different jobs, so that each job or cost unit maybe reasonably charged with that overheads and the cost of production or sale of the unit or job can beascertained.
CIMA defines it as “The process of absorbing all overheads, cost allocated or apportioned over a particularcost centre or production department by the units produced.”
The Institute of Cost and Management Accountants (UK) defines overhead absorption as “The allotment ofoverheads to cost units.” Absorption of overhead is also known as overhead appreciation, recovery, levy,burden rate etc.
(a) Administration overheads Rs. Rs.
Office salaries 3000
Directors Remuneration 4000
Rent, Rates and Insurance 1620
Lighting of Office 160
Printing, Stationery etc. 2500
Trade Magazine 150
Bank Charges 220 11650
(b) Selling overheads
Agent’s Commission 5000
Bad Debts 500
Traveling Expenses 860 6360
(c) Distributions overheads Rent, Rates and Insurance 660
Warehouse Repairs 620 Warehouse Wages 2000
Lighting of Warehouse 200 3480
(d) Expenses excluded from cost
Income Tax 2970 Donation 500 3470

118
8.4.1 Methods of Absorption of Factory Overheads
An absorption rate is determined to charge overheads costs to the products or jobs. This rate can bedetermined using any one of the following methods:
1. Percentage on Direct Material Cost Method.2. Percentage on Direct Labour Cost Method.3. Percentage on Prime Cost Method.4. Direct Labour Hour Rate Method.5. Machine Hour Rate Method.6. Combined Rate Method.7. Production Units Method.1. Percentage on Direct Material Cost Method: Under this method the overhead rate is expressedas a percentage of direct material cost. Arithmetically the operation may be expressed as follows:
Percentage of direct material cost = 100cost material actualor Budgeted
overheadfactory actualor Budgeted
For example of budgeted overhead is of Rs. 200000 and the budgeted direct material cost is Rs.500000 then overhead absorption rate is:
materialdirect of 40% 100500000200000
If a job consumes Rs. 10000 worth of material it will be charged Rs. 4000 as its share of factoryoverheads.
Advantages –
(i) This method is simple to understand and easily applicable.
(ii) This method is useful if material plays a major part.
(iii) It produces fairly accurate results if the prices and grades of materials do not fluctuate widelyfrom time to time and where output is uniform.
Disadvantages –
(i) This is a very unrealistic assumption that overheads are based on cost of material consumed.
(ii) It ignores the time factor.
(iii) If articles made of more expensive material are over charged with a high portion of factory overheads,sales prices will also tend to be high, which will lead to loss of market.
(iv) The quality of labour and the way machines are used by them constitute most of the factory overhead,but in this method we ignore their effect.
(v) If different types of materials are used in different jobs at the same time, this will charge differentvalue of overheads which is not appropriate.
Thus it is clear that this method is not very appropriate.
2. Percentage on Direct Labour Cost Method: Under this method the absorption rate is calculated onthe basis of direct labour cost, using the formula given below:

119
100costlabour direct actualor Budgeted
overheadfactory actualor Budgeted Rate
For example, if the budgeted overheads are of Rs. 200000 and the budgeted labour paid is of Rs.
400000 the absorption rate will be of = labourdirect of 50% 100400000200000
If a job which consumes Rs. 100000 worth of material 50000 worth of labour cost it will be charged withRs. 25000 as its share of factory overheads.
Advantages –
(i) It is simple to understand and easy to apply and popular also.(ii) This method is useful where labour cost is an important part of total cost units.(iii) Labour rates are more stable than material prices, so it gives constant results.
Disadvantages –
(i) Under this method, wages paid would be more for skilled labour and relatively less for unskilledworkers. But the time taken to complete such jobs may be relatively less than those whichinvolve employment of unskilled labour. Thus, applying this method may give improper results.
(ii) This method ignores the significance of all other factors in production, sometimes use ofmachine gives rise to certain overheads like power, deprecation, oil etc.
(iii) If labour are paid on piece rate basis this method is not appropriate and has no significance, soif (i) the nature of work under different jobs and their rate of wages is the same (ii) ratio ofskilled and unskilled workers is almost equal (iii) not too much use of machines. Then, thisbasis is suitable.
Activity A:
1 For costing purposes works expenses (indirect) may be charged to production by various methods,two of which are (a) a percentage on the cost of direct material (b) a percentage on the cost ofdirect wages.
You are required to describe these two methods briefly stating under what circumstances they maybe adopted,
3. Percentage on Prime Cost Method:
100cost prime actualor Budgeted
overheadfactory actualor Budgeted Rate Absorption
Prime Cost = Direct Material + Direct Labour + Direct expenses.
For example of the budgeted overheads are of Rs. 200000 and the budgeted prime cost is of Rs.1000000. Then
cost prime of 20% 1001000000200000 Rate
If a job consumes Rs. 100000 worth of material, 50000 worth of labour and 10000 as direct expenses itwill be charged (160000×20%) or 32000 as its share of factory overheads.

120
This method is simple to understand and easy to apply but (i) This method suffers from the disadvantages ofboth the above mentioned methods. (ii) if the ratio of direct material and direct labour on different jobs isdifferent, this method charges same amount of overhead which is not appropriate, so this method is used inrare cases.
The use of all the above three methods are illustrated as follows:
Illustration -2:
The following figures have been extracted from the department P of Q Ltd.
Direct material used Rs. 20000Direct Wages Rs. 30000Total overheads allocated to this department are Rs. 25000. On an order the department carried out jobno. 163. The details of job no. 163 are as follows:
Direct material used Rs. 600Direct Wages Rs. 1200Find out the overhead amount absorbed on job no. 163 under each of the following methods –
(i) Percentage on direct material cost basis.(ii) Percentage on direct labour cost basis.(iii) Percentage on prime cost basis.Solution:
The rates for absorption of overheads on different basis will be as follows-
(i) On the basis of direct material cost
%1251002000025000
(i) On the basis of direct labour cost.
%33.831003000025000
(i) On the basis of prime cost
%501005000025000
Statement showing factory cost of Job No. 163
4. Direct Labour Hour Rate Method: This is actually a time rate. In other words, the factoryoverheads are charged to production on the basis of time involved. This is the modified form of thepercentage of direct labour cost method.
Direct material cost basis
Direct labour cost basis
prime cost basis
Direct Material 600 600 600
Direct Labour 1200 1200 1200
Prime Cost 1800 1800 1800 Factory Overheads 750 1000 900
Factory Cost 2550 2800 2700

121
HoursLabour Direct Actualor BudgetedOverheadsFactory Actualor Budgeted Rate Absorption
If the factory overheads for a certain period of time are Rs. 24000 and labour hours worked during the
period is 8000, Then Rs.3800024000 rate per direct labour hour. If Rs. 400 hours are spent on a specific
job, it will be charged with 400×3 = Rs. 1200 as its share of factory overheads.
The labour hour rate provides a reasonably satisfactory method for absorption but this basis can be bestused in the industries where human labour is more important. Thus, it is not suitable in mechanized andcapital intensive production. Secondly, in this method no distinction is made of hours spent by skilled andunskilled labour.
Illustration – 3:
From the following details, calculate the direct labour hour rate of department P.
(i) The number of workers – 300(ii) The department works for 325 days in a year.(iii) The department works for one shift of 8 hours.(iv) 10% of the man – hours is expected to be lost in idle time and,(v) The total factory overheads of department P are Rs. 105300.
Also find out the overhead amount absorbable on job number 55 if the net direct labour hours spenton this job are 5000.
Solution:
(i) Calculation of labour hour rate
(ii) Absorption of factory overhead on job number 55
= Direct labour hours × rate per hour
= 5000×.15 = Rs. 750
5. Machine Hour Rate Method: CIMA defines machine hour rate as an “Actual or predetermined rateof cost apportionment or overhead absorption, which is calculated by dividing the cost to be apportioned orabsorbed by the number of hours for which a Machine or machines are operated or expected to be operated.
Number of working hours-
325 days × 8 hours per day 2600 hours
Less: 10% for idle time 260 hours
Effective working hours 2340 hours Total effective hours in the department
(2340×300)
702000 hours
Total factory overhead of the department 105300 Rs.
Direct labour hour rate = paisa 15702000105300

122
Thus, Hours Machine Actualor BudgetedOverheadFactory Actualor Budgeted Rate Absorption
Steps –
(i) Sort out the overheads department wise.
(ii) Departmental overheads are redistributed over the machines. For this, machines of different types workingin the department are classified in groups or we can take each machine separately. These overheads can beof two types (a) Standing charges (b) Machine or running charges.
(a) Standing charges
Rent and Rates - Floor area for each machine.
Insurance and taxes - Sum insured or value of machines.Supervision - Time devoted to each machine or No. ofworkers or Area.Lighting and Heating - No. of light points or area.Other indirect overheads - Direct charges or allocated.
(b) Machine Running chargesPower - Horse power or meter reading.Repairs - Actual or per HourDepreciation - Per hour
Note – if the rate is based on time basis, depreciation will be added in standing charges.
Normally a overhead distribution sheet is prepared for this redistribution.
(iii) The total or individual working hours of machines are estimated for that period.
(iv) The sum of standing charges is divided by estimated machine hours to find standing charges per machinehour while machine hour is calculated separately for each individual item of machine running expenses. Totalof both is machine hour rate. This method provides a satisfactory basis where machine operations arepredominant. But it requires detailed information of various kinds and thus proves to be somewhat typicaland experisive.
Activity B:
1 What are the principal factors to be considered while fixing a machine hour rate? Give a specimencomputation.
Illustration – 4:
Compute the machine hour rate from the following data.
(i) Departmental overheads (annual)Rent and Rates Rs. 100000Heat and Light Rs. 40000Supervision Rs. 260000
(ii) Departmental Area 70000 Sq. ft.Machine Area 2500 Sq. ft.
(iii) Total cost of machine to be depreciated Rs. 460000, life – 10 years(iv) Annual cost of reserve equipments for the machine Rs. 2800.
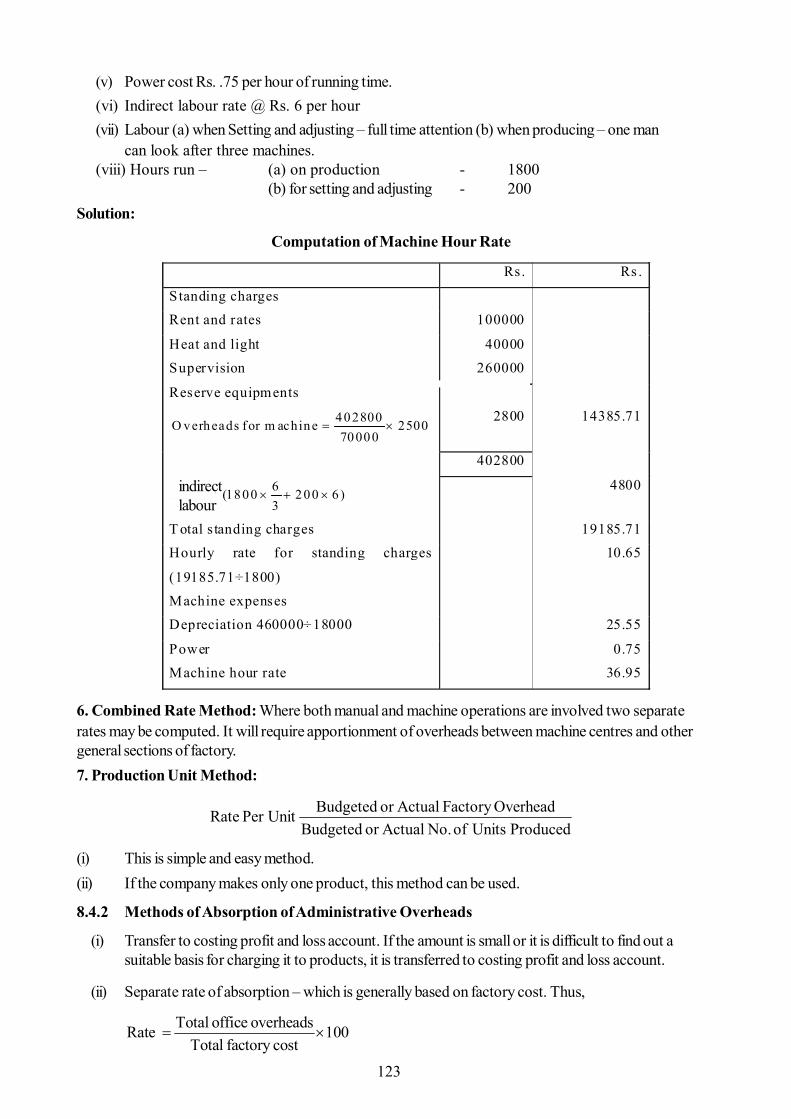
123
(v) Power cost Rs. .75 per hour of running time.(vi) Indirect labour rate @ Rs. 6 per hour(vii) Labour (a) when Setting and adjusting – full time attention (b) when producing – one man
can look after three machines.(viii) Hours run – (a) on production - 1800
(b) for setting and adjusting - 200Solution:
Computation of Machine Hour Rate
6. Combined Rate Method: Where both manual and machine operations are involved two separaterates may be computed. It will require apportionment of overheads between machine centres and othergeneral sections of factory.7. Production Unit Method:
Produced Unitsof No. Actualor BudgetedOverheadFactory Actualor BudgetedPer Unit Rate
(i) This is simple and easy method.(ii) If the company makes only one product, this method can be used.
8.4.2 Methods of Absorption of Administrative Overheads
(i) Transfer to costing profit and loss account. If the amount is small or it is difficult to find out asuitable basis for charging it to products, it is transferred to costing profit and loss account.
(ii) Separate rate of absorption – which is generally based on factory cost. Thus,
Total office overheadsRate 100Total factory cost
Rs. Rs .
S tanding charges
Rent and rates 100000
Heat and light 40000
Supervision 260000
Reserve equipments
250070000
402800 m achinefor O verheads
2800
14385.71
402800
L abour )620036 1800( 4800
T otal s tanding charges 19185.71
Hourly rate for standing charges
(19185.71÷1800)
10.65
Machine expenses
Depreciation 460000÷18000 25.55
Power 0.75
Machine hour rate 36.95
indirectlabour
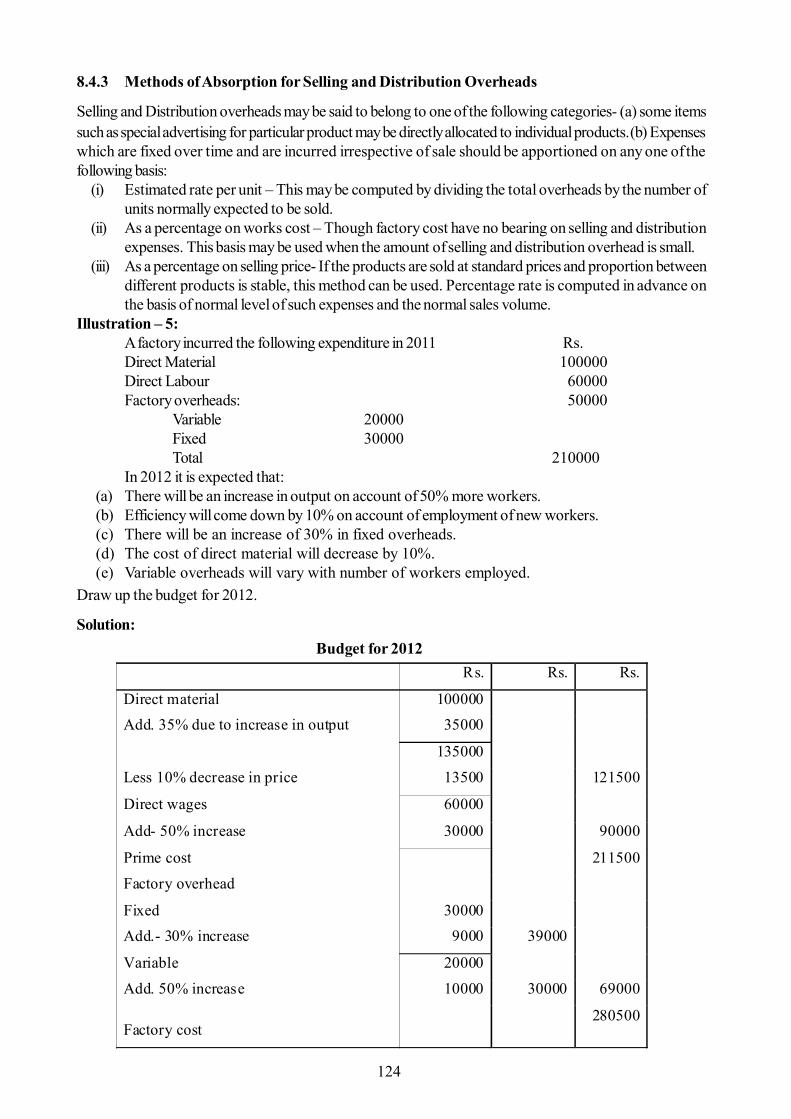
124
8.4.3 Methods of Absorption for Selling and Distribution Overheads
Selling and Distribution overheads may be said to belong to one of the following categories- (a) some itemssuch as special advertising for particular product may be directly allocated to individual products. (b) Expenseswhich are fixed over time and are incurred irrespective of sale should be apportioned on any one of thefollowing basis:
(i) Estimated rate per unit – This may be computed by dividing the total overheads by the number ofunits normally expected to be sold.
(ii) As a percentage on works cost – Though factory cost have no bearing on selling and distributionexpenses. This basis may be used when the amount of selling and distribution overhead is small.
(iii) As a percentage on selling price- If the products are sold at standard prices and proportion betweendifferent products is stable, this method can be used. Percentage rate is computed in advance onthe basis of normal level of such expenses and the normal sales volume.
Illustration – 5:A factory incurred the following expenditure in 2011 Rs.Direct Material 100000Direct Labour 60000Factory overheads: 50000
Variable 20000Fixed 30000Total 210000
In 2012 it is expected that:(a) There will be an increase in output on account of 50% more workers.(b) Efficiency will come down by 10% on account of employment of new workers.(c) There will be an increase of 30% in fixed overheads.(d) The cost of direct material will decrease by 10%.(e) Variable overheads will vary with number of workers employed.
Draw up the budget for 2012.
Solution:Budget for 2012
Rs. Rs. Rs.
Direct material 100000 Add. 35% due to increase in output 35000
135000
Less 10% decrease in price 13500 121500
Direct wages 60000
Add- 50% increase 30000 90000
Prime cost 211500
Factory overhead
Fixed 30000 Add.- 30% increase 9000 39000
Variable 20000
Add. 50% increase 10000 30000 69000
Factory cost 280500

125
Working Note:
Output in 2011 100%
Add. Increase on account of labours 50%
Less decline in efficiency by 10% 150%
15%
Total output 135%
Therefore, these is a net increase of 35%. in output
Illustration - 6:The manufacturing cost of 10000 units of a commodity is as follows:Material Rs. 40000, Wages Rs. 50000, Direct Expenses Rs. 800, Fixed overheads 32000, Variableoverheads Rs. 8000.For manufacturing every 1000 extra units, the cost increases as follows:
(a) Material – proportionately
(b)Wages – 5% less than proportionately
(c) Direct expenses- proportionately
(d)Fixed overhead- Rs. 400 extra
(e) Variable overheads 20% less than proportionately.You are required to calculate the estimated cost of manufacturing 16000 units.
Solution:
Working note-(i) Direct wages for 6000 units.
1500 % 5 Less
30000 60001000050000
Rs. 28500(i) Fixed overheads – Rs. 400 extra for every 1000 units. So for 6000 units.
Rs. 2400 60001000400
Particulars Cost of production Rs.
Total 16000 Units Rs.
10000 Units Extra 6000 Units Direct Material 40000 24000 64000 Direct Wages 50000 28500 78500 Direct Expenses 800 480 1280 Prime Cost 90800 52980 143780 Add: Fixed overheads 32000 2400 34400 Variable overheads 8000 3840 11840 Estimated Cost 130800 59220 190020

126
8.5 Over and Under Absorption of Overheads
As we have already discussed overheads may be absorbed either on the basis of predetermined rates oractual rates. The problem of under or over absorption arises when predetermined rates are used. Sincethere are seasonal differences, so the difference between the budgeted overhead and actual overheadincurred is bound to happen.If the actual overhead is more than the overhead absorbed, then this excess is termed as under absorptionas this portion remains uncharged to production.On the other hand if the overhead absorbed is more than the actual overhead, this difference is called as‘over absorption’ as the amount charged to production has not been incurred.Under or over absorption of overheads may arise due to the following reasons:
1. The overhead absorption rate may have wrongly been computed.
2. The seasonal fluctuations in the overhead costs in some industries.
3. Unforeseen changes in the capacity of production. Unexpected change in the volume of output.
Treatment of under or over absorption:
1. Use of Supplementary Rate – if the difference is considerable then supplementary rate is calculated.
2. Transfer to Costing Profit and Loss Account – if difference is due to abnormal reasons which arebeyond the control of management, then such amount should be transferred to Costing Profit andLoss Account.
3. Transfer to Overhead Suspense Account- if the difference is seasonal (for which it is possible thatby the end of the accounting period it will wipe out) then it should be transferred to overheadsuspense or adjustment account.
Illustration – 7:
In X Ltd, overheads were recovered at a predetermined rate of Rs. 25 per machine hour. The total factoryoverheads incurred were Rs. 83 lakhs and machine hours actually worked were 3 lakh. 80000 units of aproduct were produced out of which 70000 were sold. It was found that 60% of the unabsorbed overheadswere due to defective planning and the rest were attributable to increase in overhead cost.
How would unabsorbed overhead be treated in cost accounts.
Solution:
Rs.
Actual factory overheads 83 lakhsLess: Factory overheads recoveredRs. 25×3 lakhs machine hours 75 lakhsunabsorbed overhead 8 lakhs
Treatment:-(i) 60% of 8 lakh i.e. Rs. 480000 should be transferred to costing profit and loss account.(ii) The balance of Rs. 320000 should be recovered from this year’s production for this
supplementary rate i.e. Rs. 4 (320000 ÷ 80000) is used , which is charged as follow –(a) Cost of sales account 70000×4 = Rs. 280000(b) Closing stock account 10000×4 = Rs. 40000
Total Rs. 320000

127
Activity C:
1 In X ltd., two products are made. For a particular period production costs are as under:
Product- X Product –YMaterial used (Rs.) 1200 400Direct labour cost (Rs.) 1600 800Overheads actual (Rs.) 900 450
Overheads are charged at a rate of 25% on prime cost. Is there any difference in actual andabsorbed overhead?
8.6 Summary
Besides the indirect expenses in the factory, there are many expenses which have to be incurred for smoothrunning and functioning of business. The cost which relates to general administration of business is termed asadministrative overheads. On the other hand, expenditure incurred to create and stimulate demand andsecure orders is selling cost. The cost which begins with making the packed product available for dispatchand ends with making the returned packages available for reuse is distribution overheads.
After calculating the departmental overheads they are ultimately charged to or absorbed to cost units ordifferent jobs passing through that centre. This is known as the allotment of overhead to cost unit or absorption.
The purpose of cost apportionment is to charge expenses in an equitable proportion to the various departments;where as the purpose in overhead absorption is to distribute the total overheads of each manufacturingdepartment in a given period, so that overhead cost per unit of each product can be arrived. Absorptionrates are determined for the purpose of charging factory, office, selling and distribution overheads to variousunits. The chances of actual and absorbed overheads are same is rare. This difference is termed as ‘underor over absorption of overheads,’ which may be disposed off by using of supplementary rate or transferredto Costing P&L Account or can be carried to next year.
Key Terms
Administrative overheads - The cost of incurred on general administration of the business.Selling overheads - All expenses incurred in obtaining and retaining a customer.Distribution overheads - It includes all expenditure incurred from the time the product
is completed until it reaches its destination.Absorption - The allotment of overhead to cost units.Machine Hour Rate - The cost of running a machine for one hour.Over absorption - If the amount absorbed is greater than the actual amount of
overhead, this difference is over absorption.Under absorption - If the amount absorbed is less than the actual amount of
overhead incurred, this difference is termed as underabsorption.
8.7 Self Assessment Questions
1. What is machine hour rate? Explain briefly the situations in which a machine hour rate maysuitably be used in cost accounting.

128
2. Define administrative overheads and state briefly the treatment of such overheads in costaccounts.
3. Write a short note on “Documents for collection of overheads”.
4. Explain how under absorption and over absorption are treated in cost accounts.
5. How will you treat the following items in cost accounts of a manufacturing concern (i) carriageoutward (ii) idle time (iii) packing charges (iv) Interest on capital.
6. If in an industry estimated cost is – direct material Rs. 20000, direct wages Rs. 30000 and factoryoverheads Rs. 5000. on this basis calculate the total cost of a particular product in which directmaterial cost Rs. 1000, direct wages Rs. 600 and direct expenses Rs. 400 if the factory overheadsare charged on the basis of (a) direct material (b) direct labour and (c) prime cost.
(Answer- (a) Rs. 2250 (b) Rs. 2100 and (c) Rs. 2200)
7. Calculate machine hour rate for a machine from the following data-
Cost of machine Rs. 19200
Estimated scrap value Rs. 1200
Average repairs charges per month Rs. 150
Standing charges allocated to the machine per month Rs. 50
Effective working life of machine 10000 hours
Running hours per month 160 hours
Power used by machine -5 unit per hour @ 19 Paisa per unit
(Answer – Machine hour rate Rs. 4.00)
8. A manufacturer has shown an amount of Rs. 32380 in his books as establishment which includesthe following:
Insurance: Rs.
Office 460Warehouse 620Travelling expenses 1520Directors Remuneration 2800Office salaries 2260Office lighting 140Ware house repairs 1020Ware house wages 3600Agent’s commission 11500Bad debts 340Discount allowed 3940Bank charges 200Donations 300Trade magazines 140Printing stationery etc. 3000Lighting warehouse 540

129
From the above information prepare a statement showing totals of : (a) administration overheads(b) selling overheads (c) distribution overheads (d) expenses you would disregard in estimatingthe cost.
9. Calculate the tender price of 3000 units if the details of actual cost of 2000 units are as follows:
Material cost Rs. 4500, labour cost Rs. 2500, direct expenses Rs. 500, factory overheads Rs.1000, office overheads Rs. 800 and selling and distribution overheads Rs. 400. The further detailsin this connection are as follows-
(a) An increase of 10% is expected in the cost of raw material and 5% in the cost of labour.(b) 70% of factory overheads are fixed.(c) The ratio of fixed and variable expenses in administrative overhead is 6:4.(d) 50% of selling and distribution overheads is variable.The management desires to charge 25% profit on the sales price. Ascertain the selling price.
(Answer. Selling price of 3000 units Rs. 19630)
8.8 Reference Books
- Ghosh,P.K., ‘Cost Accounting’, National Publishing House, New Delhi.
- Maheshwari, Mittal, ‘Cost Accounting and Financial Management’, Shri MahaveerBook Depot, Delhi.
- Ravi. M. Kishore, ‘Cost Accounting’, Taxmann Publication, New Delhi.
- Jain, Narang, ‘Cost Accounting’, Kalyani Publication, New Delhi.
- Arora M.N., ‘Cost Accounting - Principles and Practice’, Vikas Publication, New Delhi.

130
Unit - 9 : Activity Based Costing
Structure of Unit:
9.0 Objectives9.1 Introduction9.2 Nature or Characteristics of Activity Based Costing (ABC)9.3 Concept of Activity Based Costing9.4 Need for Emergence of ABC9.5 Process of Activity Based Costing9.6 ABC vs. Traditional Based Costing9.7 Application of Activity Based Costing9.8 Advantages of Activity Based Costing9.9 Disadvantages of Activity Based Costing9.10 Summary9.11 Self Assessment Questions9.12 Reference Books
9.0 Objectives
After completing this unit, you will be able to understand:
Nature and concept of activity based costing The process and application of activity based costing The advantages and disadvantage of activity based costing The need and emergence of ABC in current era
9.1 Introduction
Activity based costing is framed to provide accurate information about the production and the supportingactivities so that management can focus on products and processes with the most leverage for increasingprofits. It assists the management for making better decisions about designing of products, pricing, market-ing and it leads to continued operating improvement.
Activity based costing focuses on the need for better understanding of the overhead costs behavior so ithelps in ascertain causes of costs and how they relate to product or services or in other words in activitybased costing the business is reviewed simultaneously on the collection of activities which are operated todesign, produce, market deliver and support its goods or services. The CINA Under defines ABC as "costattribution to cost units on the basic of benefits received from indirect activities e.g.:- ordering, setting-up,assuring quality."
Thus the ABC system is a system based on activities, linking, spending on resources to the products orservices produced or delivered to the customers.
9.2 Nature or Characteristics of Activity Based Costing (ABC)
The following are the characteristics of activity based costing:-
i) It provides a more refined approach to cost analysis for modeling.ii) It clearly defines the difference between different cost behavior patterns related to scale, scope,
event & period.

131
iii) It focuses on determination of cost drivers related to various organizational functions.
iv) Activity measures brought by this system, bridges the gap between the cost of the product andresources.
v) Under ABC system the cost model is more descriptive.
9.3 Concept of Activity Based Costing
Activity based costing is a new and scientific term which focuses on activities as fundamental cost objectsand make use of the costs of these activities as building blocks and compiling the costs of other cost objects.
It is not an alternative to job costing or process costing but it is a modern and active tool of chargingoverhead costs in which firstly costs are traced to activities further to the specific products or jobs.
To understand clearly the concept of the activity based costing system the following definitions aregiven by the experts are as under:-
Computer aided manufacturing international (CAM-I) has defined, "Activity based costing(ABC) is a methodology that measures the cost and performance of the activities, resourcesand cost objects. Resources are assigned to cost objects based on their use. Activity basedcosting recognizes the casual relationship of cost drivers to activities. "
Peter B.B. Turney has said, "ABC is a system that first accumulates overhead costs for each of theactivities of an organization and then assigns the costs of activities to the products, services or othercost objects that caused such activity. It measures the cost and performance of activities, resources,and cost objects. "
Elements of Activity Based Costing:
The following are elements of activity costing:-
i) Resources Available: These are the thing that an enterprise pays for such as machinic, men,equipments and facilities provided.
ii) Activity: These are processes performed by human and mechanical resources for example; re-ceiving orders from customers, interacting with production regarding capacity to produce and giv-ing commitment to the customer regarding delivery time etc.
iii) Activity Cost Pool: The result of assigning the resources cost to an activity is known as activitycost pool.
iv) Cost Driver: It is used to trace costs to products by use a major of resources consumer by eachactivity, for example, in a manufacturing firm, number of machine and setup of material handling; incase hotel industry number of rooms occupied.
v) Process: An aggregation of related function specific activities is a process for instance, activitieslike inspection of material, receiving material, recording and testing for its standards are all relatedwhen can be grouped under material handling process.
vi) Cost Object: It is an item for which cost measurement is required; these are linked to the organi-zation for instance, if the objective is to select a most profitable customer an individual customer isthe cost object.
vii) No Value Holding Activity: Those activities which continue to be carried on particularly in certainold factories and do not contribute to the value of a product for example - Movement of rawmaterial from one place to another and not adding any value to the product.

132
9.4 Need for Emergence of ABC
One of the techniques for maintaining sustainable competitive advantage is lost leadership through econom-ics of scale learning curve effects and lost control this means the cost leadership fall within the territory ofcost. Reduction programme that requires several managerial intervention and are possible only if the man-ager are availed with relevant correct cost related information. Therefore activity based costing providesuch information essential to achieve cost leadership. The need for activity based costing arises due to :
1) It generates accurate product cost information.2) It reduces cross subsidization of one product by the other.3) It identifies and differentiates between value adding activities and non-value adding activities.4) It also provides information about the cost and performance of activities and resources for
tracing cost accurately to cost object other then products such as customers and channels ofdistribution.
9.5 Process of Activity Based Costing
ABC is the process of tracing cost just from resources to activities through the activity drivers andthen partner from activities to specific products on the basis of cost drivers.
The following steps are involved to conduct the activity based costing:
1) Identification and Classification of the Activities: Activities are identified and then classifiedinto different categories that have relationship with different parts of the production process for e.g.machine related activities, labour related activities and various supporting activities.
2) Creation of Cost Pools for Each Activity: To compute and classify overhead cost of differentactivities into homogenous cost pools is the second step in the ABC system.
3) Identification of Cost Drivers: After the second step the next step in to determine the costdrivers for every activity that can be used to select the costs collected in cost pools to the costobjective this is based on the factor that drivers the consumption of the activity.
4) Calculation and Interpretation of Cost of Earn Activity: the next step in ABC system is todetermine the resource and cost of each activity. It is already known that each activity consumesresources which increase the cost of the product.
5) Assigning Activity Cost to Products: The final step in the ABC system is the assigning or tracingactivity cost to products or outputs using activity drivers which requires calculation of activity 'costdriver state' or 'pool state' for each activity. This is determined by dividing the actual cost of costpool by actual activity level of cost driver. Activity driver assign activity cost to product which isbased on consumption of individual products and calculated by multiplying the actual activity levelon quantity consumed by cost driver state.
9.6 ABC vs. Traditional Based Costing
The difference between ABC system and traditional costing is as follows:
1) Cause and Effect Relationship: ABC brings accuracy and reliability in product cost determina-tion by emphasis on cause and effect relationship in the cost incurrence where as traditional costingdoes not pay attention to the cost and effect relationship between resources used and productionactivities.

133
2) Cool Pools: ABC generates separate cost pool for service activities as well and overhead cost ofthese activities are assigned directly to specific products through applying cost driver states whereas in traditional system overhead cost of services departments is allocated to production depart-ments.
3) Product Specification: ABC allocates directly a major portion of overhead cost to specific prod-ucts whereas traditional costing uses more arbitrary bases for appointment of overhead cost.
4) Assignment of Overhead Cost: Under ABC system overhead cost are to be assigned to earnimportant activity and not to the departments whereas in traditional costing system, overheads arecollected department wise.
9.7 Application of Activity Based Costing
Activity based costing is more relevant in companies where product mix is diverse in batch sizes, physicalsizes, degrees of complexity and raw material characteristics. It also provides information required in deci-sion making for the service industry where range of service provided are diversified for instance a restaurantmay decided to sun its fast food section on self service basis, therefore eliminates the cost of waiterstherefore ABC system can be used when overheads are high, products are diverse in complexity, volume,amount of direct labour; cost of error are very high and profit margin cannot be easily explained.
Illustration - 1:ABZ Co. Ltd. produces three, product A, B and Z for which the standard cost and output are asfollows:Products A B COutput (units) 20,000 40,000 60,000Direct material per unit Rs. 50 40 32Direct labour per unit Rs. 30 40 48Labor hours per unit 3 4 5Machine hours per unit 4 4 7No. of purchase requisitions 600 900 1,000N0. of machine set-ups 120 130 150
Production overhead split by departments:Department X Rs. 12,00,000
Y Rs. 15,00,000Total Rs. 27,00,000
Department X is labour intensive and Y is machine intensive.Total labour hours in Dept. X = 2,00,000;Total machine hours in Dept. Y = 5,00,000Production overhead split by activity :
Receiving and inspection Rs. 14,00,000Production scheduling/set up Rs. 13,00,000Total 27,00,000
No. of batch received/inspected - 2,500No-of batches for scheduling/set up - 400
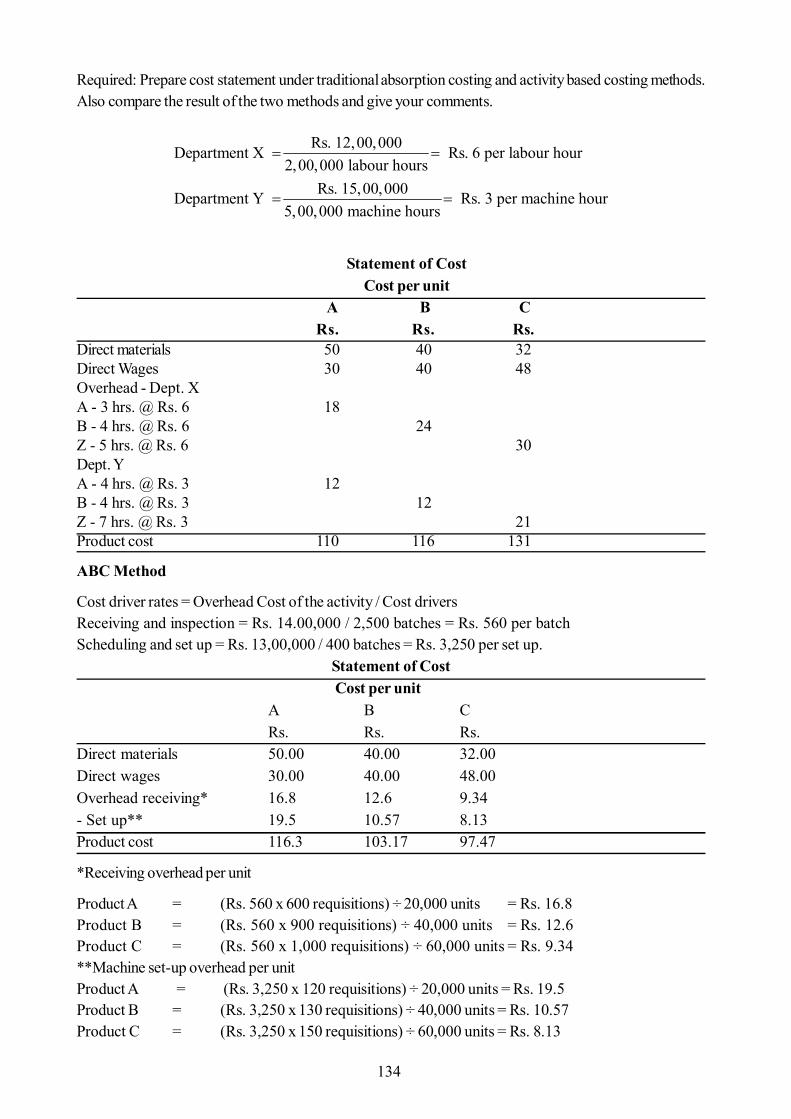
134
Required: Prepare cost statement under traditional absorption costing and activity based costing methods.Also compare the result of the two methods and give your comments.
Rs. 12,00,000Department X Rs. 6 per labour hour2,00,000 labour hours
Rs. 15,00,000Department Y Rs. 3 per machine hour5,00,000 machine hours
Statement of CostCost per unit
A B CRs. Rs. Rs.
Direct materials 50 40 32Direct Wages 30 40 48Overhead - Dept. XA - 3 hrs. @ Rs. 6 18B - 4 hrs. @ Rs. 6 24Z - 5 hrs. @ Rs. 6 30Dept. YA - 4 hrs. @ Rs. 3 12B - 4 hrs. @ Rs. 3 12Z - 7 hrs. @ Rs. 3 21Product cost 110 116 131
ABC Method
Cost driver rates = Overhead Cost of the activity / Cost driversReceiving and inspection = Rs. 14.00,000 / 2,500 batches = Rs. 560 per batchScheduling and set up = Rs. 13,00,000 / 400 batches = Rs. 3,250 per set up.
Statement of CostCost per unit
A B CRs. Rs. Rs.
Direct materials 50.00 40.00 32.00Direct wages 30.00 40.00 48.00Overhead receiving* 16.8 12.6 9.34- Set up** 19.5 10.57 8.13Product cost 116.3 103.17 97.47
*Receiving overhead per unit
Product A = (Rs. 560 x 600 requisitions) ÷ 20,000 units = Rs. 16.8Product B = (Rs. 560 x 900 requisitions) ÷ 40,000 units = Rs. 12.6Product C = (Rs. 560 x 1,000 requisitions) ÷ 60,000 units = Rs. 9.34**Machine set-up overhead per unitProduct A = (Rs. 3,250 x 120 requisitions) ÷ 20,000 units = Rs. 19.5Product B = (Rs. 3,250 x 130 requisitions) ÷ 40,000 units = Rs. 10.57Product C = (Rs. 3,250 x 150 requisitions) ÷ 60,000 units = Rs. 8.13

135
Comments:
Statements of cost prepared under traditional method and activity costing produce different results. Undertraditional method, product Z appears quite costly as compared to activity based costing. On the contrary,product A shows higher cost under activity based costing than traditional method. As the ABC approach isconsidered more Logical, it may be presumed that results produced by ABC are more accurate. If sellingprices are fixed on the basis of cost, product Z would be priced higher on traditional costing and product Awould be priced lower. This will result in loss of sales of Z and loss per unit on A, Leading to a loss to thecompany.
Illustration - 2:
XYZ Company produces two types of radio. Activity data are given below:
Activity Cost data
You are required to(i) Calculate the consumption ratios for each activity.(ii) Calculate the pool rate for each pooled group of activities.(iii) Calculate the cost per unit.
Solution:
(i) Consumption Ratios:
(a) 12/18 (A); 6/18 (B)(b)160/240 (A); 80/240 (B)(c) 18,000/ 1,80,000 (A); 1,62,000/1,80,000 (B)(d)14,000/1,40,000 (A); 1,26,000/1,40,000 (B)
Particulars Product-costing data A B Total
Units produced per year 12,000 12,000 1,32,000 Prime cost (Rs.) 80,000 70,000 7,80,000 Direct labour hours 14,000 1,26,000 1,40,000 Machine hours 18,000 1,62,000 1,80,000 Production runs 12 6 18 Number of moves 160 80 240
Activity Activity Cost (Rs.) Set up equipment 1,30,000 Material handling 1,70,000 Power 80,000 Testing 1,20,000
Total 4,00,000
Overhead Activity A B Activity Driver
Set up 0.67a 0.33a Production runs Material handling 0.67b 0.33b Number of moves Power 0.10c 0.90c Machine hours Testing 0.10d 0.90d Direct labour hours

136
(ii) Pool Rate
(iii) Per Unit Cost ABC System
9.8 Advantages of Activity Based Costing
The benefits of ABC are specifically essential in service industry where the variety of products is more andcost of facilities rather than the direct cost are important:
1) In ABC cost can be ascertain for specific distribution channel customer segments or geographicalregions.
2) It brings accuracy and reliability cost by focusing on causes and effect relationship.3) It helps to reduce cost by providing true and accurate information on the opportunities available for
reducing cost.4) Under ABC system various activities are identified and the cost incurred for them is specified.5) ABC provides accurate cost information which is important for most of the recent productivity
improvement approaches total quality management (TQM) business process reengineering (BPR)etc.
6) It helps in strategic decision making and the decisions selected to make or buy.7) It assists in providing reliable cost information for evaluating the performance of the transferor and
transferee departments.
9.9 Disadvantages of Activity Based Costing
Following are the short comings of activity based costing system:
1) ABC requires segregation of management process into planning and operation. The lack of clarityin the segregation security in the faulty application of ABC concept.
2) It is essentially not the panacea for all its.3) It may lead to weaker customer segmentation and also absorbs a lot of resources.4) The implementation of ABC agenda should be driver by the top management because if it is not
Batch even Pool Unit Level Pool Set up 1,30,000 Power Rs. 80,000 Material hands 70,000 Testing Rs. 1,20,000 Total 2,00,000 Rs. 2,00,000 Runs ÷ 18 Machine hours 1,80,000 Pool Rate = Rs. 11,111 per run Pool Rate = Rs. 1.11 per machine hour
Particulars A B Prime cost 80,000 7,00,000 Overhead costs : Batch level pool:
(Rs. 11111.1 x 12) 1,33,333.2 - (Rs. 11111.1 x 6) - 66,667
Unit Level costs (Rs. 1.11 x 18,000) 19,980 - (Rs. 1.11 x 1,62,000) - 1,79,820
Total manufacturing costs 2,33,313.2 9,46,487 Units produced 12,000 1,20,000 Per Unit Cost (Total Costs/units) Rs. 19.45 Rs. 7.90
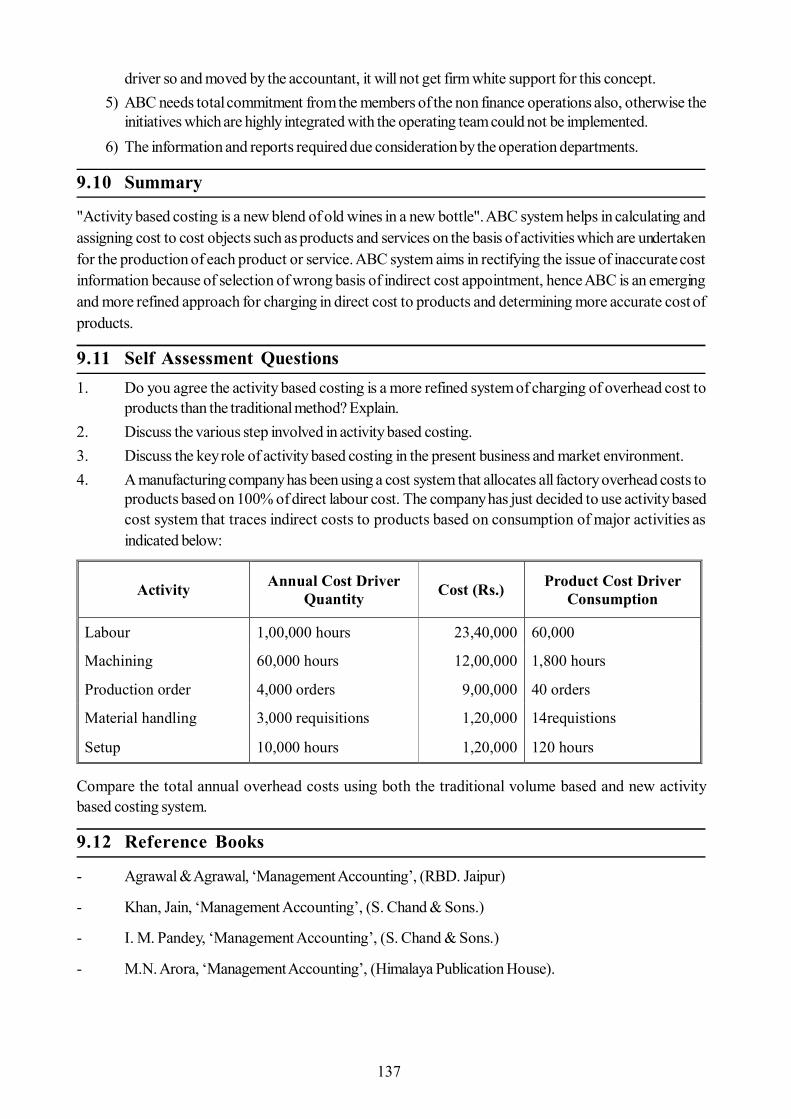
137
driver so and moved by the accountant, it will not get firm white support for this concept.5) ABC needs total commitment from the members of the non finance operations also, otherwise the
initiatives which are highly integrated with the operating team could not be implemented.6) The information and reports required due consideration by the operation departments.
9.10 Summary
"Activity based costing is a new blend of old wines in a new bottle". ABC system helps in calculating andassigning cost to cost objects such as products and services on the basis of activities which are undertakenfor the production of each product or service. ABC system aims in rectifying the issue of inaccurate costinformation because of selection of wrong basis of indirect cost appointment, hence ABC is an emergingand more refined approach for charging in direct cost to products and determining more accurate cost ofproducts.
9.11 Self Assessment Questions1. Do you agree the activity based costing is a more refined system of charging of overhead cost to
products than the traditional method? Explain.2. Discuss the various step involved in activity based costing.3. Discuss the key role of activity based costing in the present business and market environment.4. A manufacturing company has been using a cost system that allocates all factory overhead costs to
products based on 100% of direct labour cost. The company has just decided to use activity basedcost system that traces indirect costs to products based on consumption of major activities asindicated below:
Compare the total annual overhead costs using both the traditional volume based and new activitybased costing system.
9.12 Reference Books
- Agrawal & Agrawal, ‘Management Accounting’, (RBD. Jaipur)
- Khan, Jain, ‘Management Accounting’, (S. Chand & Sons.)
- I. M. Pandey, ‘Management Accounting’, (S. Chand & Sons.)
- M.N. Arora, ‘Management Accounting’, (Himalaya Publication House).
Activity Annual Cost Driver Quantity Cost (Rs.) Product Cost Driver
Consumption
Labour 1,00,000 hours 23,40,000 60,000
Machining 60,000 hours 12,00,000 1,800 hours
Production order 4,000 orders 9,00,000 40 orders
Material handling 3,000 requisitions 1,20,000 14requistions
Setup 10,000 hours 1,20,000 120 hours

138
Unit - 10 : Single or Output Costing
Structure of Unit:
10.0 Objectives10.1 Introduction10.2 Objects of Single Costing10.3 Collection of Cost10.4 Unit of Cost10.5 Methods of Ascertaining Unit Cost10.6 Cost Sheet10.7 Statement of Cost10.8 Difference between Cost Sheet and Statement of Cost10.9 Adjustment of Work – in – Progress10.10 Valuation and Adjustment of Opening and Closing Stock of Finished Goods10.11 Comparative Cost Sheet of Two Periods10.12 Absorption of Overhead10.13 Treatment of Defective or Scrap Materials10.14 Determination of Selling Price or Tender Price10.15 Production Account10.16 Difference between Cost Sheet and Production Account10.17 Summary10.18 Self Assessment Questions10.19 Reference Books
10.0 Objectives
After completing this unit, you will be able to understand:
How costs are accumulated and analysed under various elements of cost. The cost per unit is ascertained by dividing the total cost by the number of units produced or in other
words how the calculation of cost per unit is being done.
10.1 Introduction
Unit costing refers to the cost procedure, which is used in concerns where production is made at a largelevel and manufacture is continuous. The products manufactured are of homogenous nature and units areidentical. From the point of view of cost analysis this method is very simple because total cost is divided bytotal number of unit produced. It is a form of process costing. This method is also known as single costing,output costing, single-output costing, etc. A Concern where same products or few grades of same productsare produced unit costing method is used.
According to J.R. Batliboi, “single or output cost system is used in business where a standard productionis turned out and it is desired to find the cost of a basis unit of production”.
According to Harold J. Sheldon, “Single output or unit costing is a method of costing by the unit ofproduction where manufacture is continuous and the units are identical or can be made by means of ratios”.

139
Above definitions clears that this method is used in concern where production activities operate continuouslyat a large level, units of identical type are manufactured or can be turned out in an identical manner onproportionate basis, can be measured in physical units conveniently and per unit cost of goods manufactured,total production cost and proportionate amount of every element of cost is to be ascertained.
Name of industries where unit costing is most suitable:
Unit costing method may be used in mining industry sugar industry, brick industry, cement industry, leatherindustry, milk industry, cotton industry, flour mill, paper industry, textile industry etc.
Main Features of Single-Output Costing
(1) Unit costing is used in industries where production is on a large scale.
(2) Industries where units of production are homogenous, this method is used.
(3) Cost per unit of production to be ascertained.
(4) It is used in industries where production is continuous.
(5) This method is used where units are physical and natural.
(6) The cost units may be expressed in terms of weight, number, volume and time etc.
10.2 Objects of Single Costing
The main objects of unit costing are as follows:
(i) To Find Out Total Cost and Cost Per Unit: Main object of this method is to determine total costand cost per unit of goods produced in a certain period of time.
(ii) Analysis of Expenses Incurred on Cost Unit: To analyse element-wise total cost and cost perunit of each element unit costing method is useful. Cost is divided into four parts prime cost, workscost, cost of production and total cost.
(iii) Comparative Study: If we want information regarding any increase or decrease in any expense ispossible through comparative analysis for the year and years. Over expenses can be controlledunder output costing method by providing data in case of any increase.
(iv) To Find Out Percentage of Each Element of Cost to Total Cost: Under this methodproportionately share of each element in total cost can be determined. This will help in estimatingcost of each element in future. Control can be exercised through this method on the elements havinglarge amounts.
(v) To Find Out Selling Price and Profit: selling price per unit computed after adding a certainpercentage of profit in per unit, Profit or Loss can be ascertained by comparing total cost whenAmount of sales has been given.
(vi) To Find Out Tender Price: Selling price of a commodity is to be informed to customer prior to itsorder or estimate for a work is to be given termed as “Tender price”. This price is ascertained onthe basis of previous year’s costs.
10.3 Collection of Cost
Under this method, costs are classified and analysed under various elements, viz. Material, direct expensesand overheads. To ascertain the cost per unit, total cost of a particular period is divided by the total numberof units produced in the period. Cost Sheet or Statement of Cost or Production Account is prepared to findout the total cost. Cost Sheet is prepared to fulfill the objective containing following types of expenses:

140
(1) Direct Materials - Information concerning materials used in production according to its quantity andvalue can be taken from material abstract. Consumption of raw materials can be calculated by addingpurchase of raw materials and subtracting closing stock of raw materials in the amount of opening stock.Carriage inward incurred on purchase of materials also added.
Opening Stock of Raw MaterialsAdd : Purchases of Raw Materials .............Add : Carriage Inward .............
……….Less : Closing stock of Raw Materials .............Raw Materials Consumed ……….
As materials account for the larger portion of total cost so controls over material is required. Effectivecontrol helps for continuous supply of material and prevent from overstocking. If material cost iscollectively ascertained and can’t be allocated like lubricates, cotton waste, cement etc. than it shouldrelate to factory, office or selling overhead.
(2) Direct Wages: Labour is the post sensitive elements of cost. Cost of labour is collected from thewages bill, payrolls and relevant vouchers. Amount of direct wages can be known from wages abstract.If only one type of article is produced then wages are divided into direct and indirect. Thereafter, directwages is included in prime cost while indirect wages is included in factory cost.
(3) Direct Expenses: Direct expenses are directly related to production activity and their amount may beascertained by financial accounts. It includes royalty, excise duty, drawing and design expenses, specialmoulds etc.
(4) Indirect Expenses or Overhead: Overheads are indirect expenses which can’t be identified withparticular products. These indirect expenses are collected under the heads of factory, office andselling.
10.4 Unit of Cost
Unit of Cost means unit of productions or service for which cost is to be incurred. The unit cost in some ofthe industries are as under:
S.No. Industry Unit1. Tea Production Per quintal2. Steel Industry Per ton3. Liquor Production Per bottle4. Flour Production Per quintal5. Paper Production Per ton or per kg.6. Cotton Production Per quintal7. Cement Production Per ton8. Coal Production Per ton9. Milk Production Per litre10. Sugar Production Per quintal11. Brick Production Per 1000 bricks
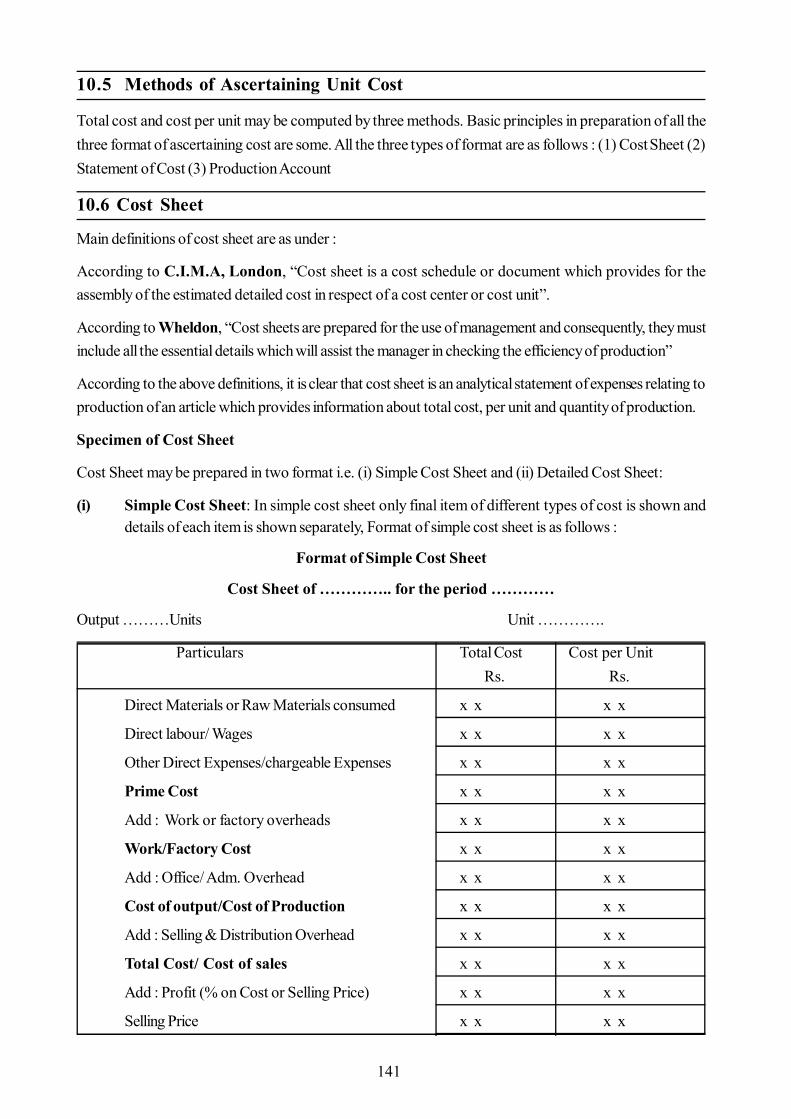
141
10.5 Methods of Ascertaining Unit Cost
Total cost and cost per unit may be computed by three methods. Basic principles in preparation of all thethree format of ascertaining cost are some. All the three types of format are as follows : (1) Cost Sheet (2)Statement of Cost (3) Production Account
10.6 Cost Sheet
Main definitions of cost sheet are as under :
According to C.I.M.A, London, “Cost sheet is a cost schedule or document which provides for theassembly of the estimated detailed cost in respect of a cost center or cost unit”.
According to Wheldon, “Cost sheets are prepared for the use of management and consequently, they mustinclude all the essential details which will assist the manager in checking the efficiency of production”
According to the above definitions, it is clear that cost sheet is an analytical statement of expenses relating toproduction of an article which provides information about total cost, per unit and quantity of production.
Specimen of Cost Sheet
Cost Sheet may be prepared in two format i.e. (i) Simple Cost Sheet and (ii) Detailed Cost Sheet:
(i) Simple Cost Sheet: In simple cost sheet only final item of different types of cost is shown anddetails of each item is shown separately, Format of simple cost sheet is as follows :
Format of Simple Cost Sheet
Cost Sheet of ………….. for the period …………
Output ………Units Unit ………….
Particulars Total Cost Cost per Unit Rs. Rs.
Direct Materials or Raw Materials consumed x x x x
Direct labour/ Wages x x x x
Other Direct Expenses/chargeable Expenses x x x x
Prime Cost x x x x
Add : Work or factory overheads x x x x
Work/Factory Cost x x x x
Add : Office/ Adm. Overhead x x x x
Cost of output/Cost of Production x x x x
Add : Selling & Distribution Overhead x x x x
Total Cost/ Cost of sales x x x x
Add : Profit (% on Cost or Selling Price) x x x x
Selling Price x x x x
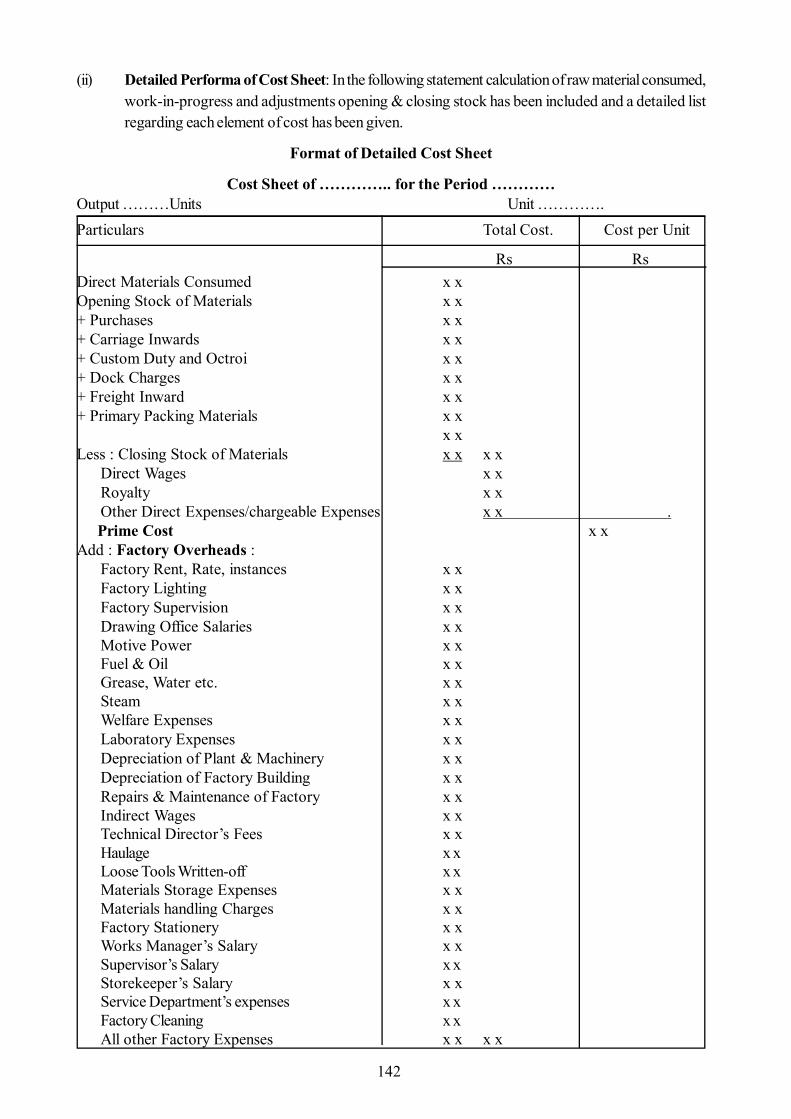
142
(ii) Detailed Performa of Cost Sheet: In the following statement calculation of raw material consumed,work-in-progress and adjustments opening & closing stock has been included and a detailed listregarding each element of cost has been given.
Format of Detailed Cost Sheet
Cost Sheet of ………….. for the Period …………Output ………Units Unit ………….Particulars Total Cost. Cost per Unit
Rs RsDirect Materials Consumed x xOpening Stock of Materials x x+ Purchases x x+ Carriage Inwards x x+ Custom Duty and Octroi x x+ Dock Charges x x+ Freight Inward x x+ Primary Packing Materials x x
x xLess : Closing Stock of Materials x x x x
Direct Wages x xRoyalty x xOther Direct Expenses/chargeable Expenses x x .
Prime Cost x xAdd : Factory Overheads :
Factory Rent, Rate, instances x xFactory Lighting x xFactory Supervision x xDrawing Office Salaries x xMotive Power x xFuel & Oil x xGrease, Water etc. x xSteam x xWelfare Expenses x xLaboratory Expenses x xDepreciation of Plant & Machinery x xDepreciation of Factory Building x xRepairs & Maintenance of Factory x xIndirect Wages x xTechnical Director’s Fees x xHaulage x xLoose Tools Written-off x xMaterials Storage Expenses x xMaterials handling Charges x xFactory Stationery x xWorks Manager’s Salary x xSupervisor’s Salary x xStorekeeper’s Salary x xService Department’s expenses x xFactory Cleaning x xAll other Factory Expenses x x x x

143
Add: Opening Work-in-progress x xx x
Loss : Closing Work-in-progress x x x x Factory Cost/Works Cost x xAdd : Office Overheads :
Office Rent, Rates & Taxes x xStaff Salaries x xOffice Lighting x xOffice Cleaning x xPrinting & Stationery x xPostage & Telegram x xOffice Convenyance x xDepreciation of Office Building & Furniture x xAl1 Expenses of Directors x xDepreciation of Office Equipments x xOffice Repairs x xSundry Expenses x xGeneral Expenses x xLegal Expenses x xAudit Fees x xBank Charges x x .Total Office Overhead x xCost of Production/cost of Output x x
Add : Opening Stock of Finished Goods x xLoss : Closing Stock of Finished Goods x x xx Cost of Finished Goods Sold xxAdd : Selling Overheads
Advertisement x xShow Room Expenses x xTravelling Expenses x xCommission on Sales x xSalesman Salaries x xExpenses on Market Research x xBad Debts x xSamples & Gifts x x x x xx
Add : Distribution OverheadsCounting House Salaries x xService Expenses x xDemonstration Expenses x xPacking Expenses x xLoading and Carriage Charges on sales x xRent of Warehouse (of finished goods) x xInsurance & Lighting of Warehouse x xExpenses of Delivery Van x xSalaries of Packing Department x xCollection Charges x xCost of Catalogues x xCost of Mailing Literature x xCost of Tenders x xBranch Expenses x x x x xx

144
Total Selling and Distribution Overhead x xTotal Cost or Cost of Sales x xProfit x xSales x x
10.7 Statement of Cost
Cost sheet and statement of cost are prepared in a same manner. When cost per unit of production is notnecessary to calculate then a statement of cost is prepared to ascertain total cost and profit or loss onproduction.
10.8 Difference between Cost Sheet and Statement of Cost
1. Total quantity, total cost and per unit cost is presented in cost sheet on the other hand only total costis presented in statement of cost.
2. Normally profit is not shown is cost sheet while cost, selling price and profit is shown in statementof cost.
3. Cost sheet is prepared to calculate actual cost of units produced in a period while statement of costis prepared to estimate cost for a future period for determination of tender price.
4. Cost Sheet is prepared only when production quantity is given while statement of cost is preparedwhen quantity of production has not been given.
5. Comparative study of cost of two types of articles or two periods may be studied in cost sheetwhich it is not feasible in statement of cost.
Illustration 1 :
From the following particulars, prepare a statement of cost showing different components separately for theperiod ending 31st March, 2012:
Stock of Materials Rs. Depreciation Rs.1st April, 2011 34,300 Plant and Machinery 2,80031st March, 2012 29,400 Office Buildings 1,500Purchased of Materials 65,100 Delivery Vans 400Productive Wages 45,000 Office Stationery 1,000Direct Expenses 4,000 Loose Tools written off 500Unproductive Wages 12,300 Rent and Taxes (Office) 800Factory Rent and taxes 8,400 Bad Debts 200Factory Lighting 2,800 Advertisement 300Factory Insurance 1,500 Upkeep of Delivery Vans 600Office Insurance 700 Bank Charges 80Legal Expenses 400 Commission on Sales 1,920Rent of Warehouse 500 Sales DepartmentFactory Heating 1,800 Salaries 1,800Motive Power 4,600 Water Supply 1,200Director’s Fees (Works) 1,500 Haulage 3,500Director’s Fees (Office) 3,000 Factory Stationary 400Factory Cleaning 700 Estimating Expenses 750
Sundry Office Expenses 250

145
Solution:
Statement of Cost for the year ended 31st March, 2012 Particulars Rs. Rs. Amount Rs.
Opening Stock of Raw Materials 34,300Add : Purchases 65,100 99,400
Less : Closing Stock of Raw Materials 29,400Raw Materials consumed 70,000Productive Wages 45,000Direct Expenses 4,000
Prime Cost 1,19,000Add : Factory Overhead
Unproductive Wages 12,300Factory Rent & Taxes 8,400Factory Lilting 2,800Factory Insurance 1,500Depreciation of Plant & Machinery 2,800Factory Heating 1,800Motive Power 4,600Haulage 3,500Director’s Fee (Works) 1,500Factory Cleaning 700Factory Stationery 400Loose Tools written-off 500Water-supply 1,200 42,000
Factory Cost 1,61,000Add : Administrative overhead
Office Insurance 700Legal expenses 400Directors Fees (Office) 3,000Sundry Office Expenses 250Printing Expenses 750Office Stationery 1,000Rent & Taxes (Office) 800Depreciation of Office Buildings 1,500Bank Charges 80 8,480
Cost of Production 1,69,480Add : Selling & Distribution Overheads
Commission on Sales 1,920Bad-Debts 200Advertisement 300Sales Department Salaries 1,800Rent of Warehouse 500Depreciation of Delivery Vans 400Upkeep of Delivery Vans 600 5,720
1,75,200Total Cost

146
10.9 Adjustment of Work – in – Progress
Work-in-progress refers to semi-finished goods or part of work which is still in production or process onthe date of preparing accounts. It is necessary to compute the value of opening and closing work-in-progress. Valuation of work-in-progress is made according to stage of completion, if there is no direction inquestion it should be done at factory cost. Opening stock of work-in-progress is added to factory overheadand closing stock of work-in-progress is deducted.
Adjustment of opening and closing value of work in progress is done as under:
Valuation of Work-in-Progress at Prime Cost
Direct Materials .................
Direct Wages .................
Direct Expenses .................
Add: WIP (Opening) .................
Less: WIP (Closing) .................
Prime Cost .................
Valuation of Work in Progress-in-Progress at Work Cost
Prime Cost .................
Add: Factory Overhead ................
Add: WIP (Opening) .................
Less: WIP (Closing) .................
Works Cost .................
10.10 Valuation and Adjustment of Opening and Closing Stock of Finished Goods
Production cost of goods sold is essential to find out profit. Cost of production shows cost of all producedunits during a certain period. Opening and closing stocks of finished goods are adjusted before calculatingproduction cost of goods sold. If quantities of opening and closing stocks of finished goods are given but thevalues of stocks are not given they are valued at current cost per unit.
The following formula is used for the valuation of opening and closing stock of finished goods:
Opening Stock or Closing Stock × Per Unit Cost of finished goods of ProductionIt is shown in a cost sheet/statement of cost as under : Rs.Cost of Production …………...Add : Opening Stock of finished goods …………...
……………Less : Closing stock of finished goods …………… Cost of Goods sold ……………
Illustration - 2:
From the following information prepare a cost sheet giving (a) Cost of materials consumed’, (b) Prime cost;(c) Factory overhead and its percentage on wages; (d) Factory cost; (e) General overhead and its percentageon factory (f) Total cost, and (g) Profit.
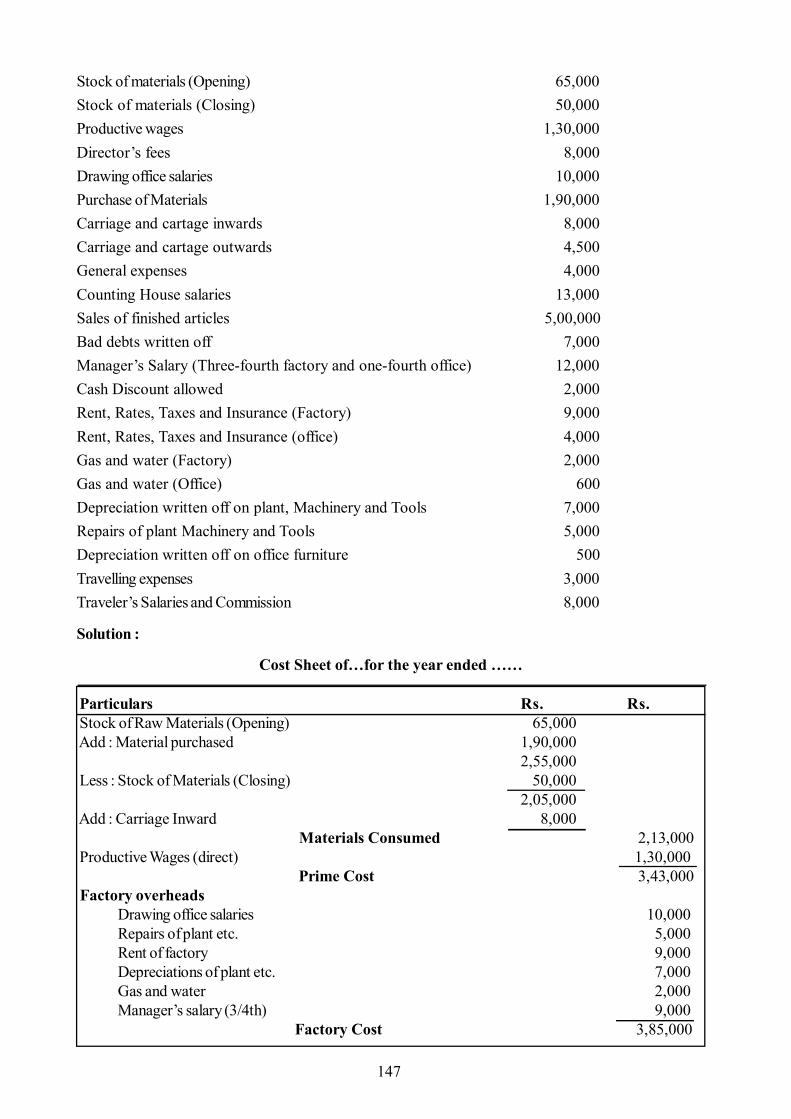
147
Stock of materials (Opening) 65,000Stock of materials (Closing) 50,000Productive wages 1,30,000Director’s fees 8,000Drawing office salaries 10,000Purchase of Materials 1,90,000Carriage and cartage inwards 8,000Carriage and cartage outwards 4,500General expenses 4,000Counting House salaries 13,000Sales of finished articles 5,00,000Bad debts written off 7,000Manager’s Salary (Three-fourth factory and one-fourth office) 12,000Cash Discount allowed 2,000Rent, Rates, Taxes and Insurance (Factory) 9,000Rent, Rates, Taxes and Insurance (office) 4,000Gas and water (Factory) 2,000Gas and water (Office) 600Depreciation written off on plant, Machinery and Tools 7,000Repairs of plant Machinery and Tools 5,000Depreciation written off on office furniture 500Travelling expenses 3,000Traveler’s Salaries and Commission 8,000
Solution :
Cost Sheet of…for the year ended ……
Particulars Rs. Rs. Stock of Raw Materials (Opening) 65,000 Add : Material purchased 1,90,000
2,55,000 Less : Stock of Materials (Closing) 50,000
2,05,000 Add : Carriage Inward 8,000 Materials Consumed 2,13,000 Productive Wages (direct) 1,30,000 Prime Cost 3,43,000 Factory overheads
Drawing office salaries 10,000Repairs of plant etc. 5,000Rent of factory 9,000Depreciations of plant etc. 7,000Gas and water 2,000Manager’s salary (3/4th) 9,000
Factory Cost 3,85,000

148
Particulars Rs. Rs. General Overheads
Counting house salaries 13,000Carriage outwards 4,500Bad debts 7,000Rent etc. of office 4,000Travelling expenses 3,000Traveler’s salaries etc. 8,000Depreciation of furniture 500Director’s fees 8,000Gas and water 600Manager’s salary 3,000General expenses 4,000 55,600
Total Cost 4,40,600 Profit 59,400 Sales (Given) 5,00,000
Cash Discount is a financial item. Some authors distribute overheads into factory and General Overhead.
Illustration - 3 :
From the following’ information compute (a) Value of materials consumed, (b) Total cost of production, (c)Cost of goods sold (d) Profit on goods sold, (e) Net profit for the month.
Rs.Purchase of raw materials 25,000Selling and distribution expenses 6,000Stock in hand on 1st January
Raw materials 30,000Finished goods 20,000
Stock in hand on 31st JanuaryRaw materials 28,000Finished goods 17,000
Non-productive wages 10,000Office and Administrative expenses 4,000Direct wages 47,000Sales of finished goods 75,000Solution:
Cost Sheet of…For the Month of January
Particulars Rs. Rs.Stock of raw materials (Opening) 30,000Add : Purchase of raw materials 25,000
55,000Less : Stock of raw materials (Closing) 28,000Value of materials consumed 27,000Direct wages 20,000 Prime cost 47,000Non-productive wages 10,000

149
Works cost 57,000Office and administrative expenses 4,000 Cost of production 61,000Add : Stock of finished goods (Opening) 20,000
81,000Less : Stock of finished goods (Closing) 17,000 Production cost of goods sold 64,000Profit on goods sold (sales-cost of sales) 11,000 Sales of finished goods 75,000Profit on goods sold (Gross profit) 11,000Less : Selling and Distribution expenses 6,000 Net profit for January 5,000
Opening Stock of finished goods is added and closing stock of finished goods is deducted from thecost of production.
10.11 Comparative Cost Sheet of Two Periods
For comparative study of cost of two periods a comparative cost sheet is to be prepared to find out totalcost and cost per unit of both the period. Thereafter, cost of current period is computed with the cost ofprevious period. If any increase or decrease is found out in it, causes are searched by analytical study. Whilepreparing such cost sheets data of current period are shown on right hand side and cost data related withthe previous period are shown on left side of the cost sheet.
Illustration - 4:
From the following information prepare a comparative cost sheet showing cost per ton.
Three months ended
31.3.2011 30.6.2011
Rs. Rs.
Direct expenses 2,000 2,000
Taxes and Insurance (factory) 1,200 1,200
Productive wages 1,10,000 1,50,000
Raw materials 60,000 75,000
Unproductive labour 50,000 65,000
Output was 10,000 and 15,000 tons, respectively
Light and water 2,000 2,000
Factory repairs 5,000 10,000
Plant depreciation 5,000 5,000
Administrative expenses 20,000 30,000
Factory rent 2,500 2,500

150
Solution:Cost Sheet
10.12 Absorption of OverheadFactory, office & administrative overheads, selling and distribution overheads are included in overheads.Although there are many methods to absorb overheads but generally, factory overheads are absorbedas a percentage of direct wages, office and administrative overheads are absorbed as a percentage ofwork cost and selling and distribution overheads are as a percentage of work cost or on the basis ofper unit sold. Data of previous period are used to ascertain the percentage for this purpose.
Illustration - 5:
In a factory two types of ratios are manufactured, viz. Orient and Sujon models. From the followingparticulars, prepare a statement of cost showing cost and profit per ratio sold. There is no openingand closing stock.
Orient SujonRs. Rs.
Materials 27,300 1,08,680Labour 15,600 62,920Works overhead are 80% of labour and office overhead 15% of works cost. Unit produced 78 and 286respectively.Solution:
Statement of Cost and ProfitParticulars Orient Sujon
Rs. Rs.Materials 27,300.00 1,08,680.00Labour 15,600.00 62,920.00 Prime Cost 42,900.00 1,71,600.00Works Overhead (80% of Labour) 12,480.00 50,336.00 Work Cost 55,380.00 2,21,936.00Office Overhead (15% on Works Cost) 8,307.00 33,290.40 Total Cost (i) 63,687.00 2,55,226.00
Three months ended 31.3.2011
10,000 tons
Particulars Three months ended 30.6.2011
15,000 tons Rs. Cost per
unit Rs. Cost per
unit 60,000 6 Raw material 75,000 5
1,10,000 10 Productive wages 1,50,000 10 15,000 1.5 Direct Wages 20,000 1.33
1,85,000 18.5 Prime Cost 2,45,000 10.33 50,000 5 Unproductive labour 65,000 4.33
2,500 .25 Factory rent 2,500 .16 5,000 .50 Factory repairs 10,000 .66 2,000 .20 Light and water 2,000 .13 1,200 .12 Taxes and insurance 1,200 .06 5,000 .5 Plant depreciation 5,000 .33
2,50,700 25.07 Work Cost 3,30,000 22.00 20,000 2.00 Administration expenses 30,000 2.00
2,70,700 27.07 Total Cost 3,60,700 24.00

151
No. of Units Produced (ii) 78.00 286.00Cost per unit (i) ÷ (ii) 816.50 892.40Profit per Unit (Balance) 183.50 107.60Selling Price per Unit 1,000.00 1,000.00
10.13 Treatment of Defective or Scrap Materials
Produced unit which are not according to predetermined standard are termed as spoilage or defective. Ifthese units can be improved and sold after incurring additional expenses then such additional expenses areadded to factory overheads.
If there is no chance of improvement, then it is sold and factory overhead will be realized from the realizedamount. Part of material which is left at the end of production process and cannot be used next process isknown as scrap. It’s quantity and value is quite ignorable.
If it is related to raw material then amount realised from its sale will be reduced from the amount of cost ofmaterial. It is due to production process then its sale value will be reduced from factory cost. Abnormal losswill be transferred to profit and Loss Account.
Illustration - 6:
The following information is available from the records of a manufacturing Company for a month: Rs.
Opening Stock of Raw Materials 15,000Closing Stock 12,000Raw Materials Purchase 77,000Manufacturing wages 20,000Non-Productive Wages 5,000Experiment Expenses 2,000Wastage of Materials 200Establishment Expenses 10,000Other Work Expenses 42,800Selling and Distribution Expenses 30,000Finished Goods stock :
Opening 6,000Closing 16,000
Sales of Finished Goods 2,00,000
You are asked to prepare a Statement of Cost showing: (i) Cost of raw materials used; (ii) Prime Cost, (iii)Works Cost; (iv) Cost of production; (v) Cost of goods sold; (vi) Total cost; (vii) Profit on sales.Solution: Statement of Cost
Rs. Rs. Raw materials purchased 77,000 Add : Opening stock 15,000
92,000 Less : Closing stock 12,000
(i) Raw Material Used 80,000 Manufacturing wages 20,000
(ii) Prime cost 1,00,000

152
Add : Work Overhead:Non-Productive Wages 5,000Experiment Expenses 2,000Wastage of Materials 200Other Works Expenses 42,800 50,000
(iii) Works Cost 1,50,000 Add : Establishment Expenses 10,000
(iv) Cost of Production 1,60,000 Add: Opening stock of finished goods 6,000
1,66,000 Less: Closing stock of finished goods 16,000
(v) Cost of Goods Sold 1,50,000 Add: Selling and distribution of Overheads 30,000
(vi) Total Cost 1,80,000 Profit (Balancing figure) 20,000 Sales (given) 2,00,000
Note: Wastage of materials is part of works overhead.
10.14 Determination of Selling Price or Tender Price
The price to be quoted before receiving any sale order or prior to complete a job is known as “TenderPrice”. As the receipts of orders greatly depend upon the tender price, it is suggested that a tender shouldbe made very carefully. Experience of preceding periods is required to determine tender price.
While preparing the tender, change in material cost, labour cost and in-other overheads should be considered,the time of preparation of tender, the past percentage of factory overhead generally on wages, office, sellingand distribution overheads on factory cost should be considered. When there is no information.
Illustration - 7:
A manufacturer of coolers finds that in 2011, it costs him Rs. 7,20,000 to manufacture 175 coolers, whichhe sold for Rs. 5,400 each. The cost was made up of: Rs.Materials 2,82,000Direct Wages 3,24,000Factory Overheads 48,600Office Overheads 65,460For the next year he estimates that:
a. Each cooler will require materials of Rs. 1,600 and labour Rs. 1,800;b. The factory overheads will bear the same relation to wages as in the previous period; andc. The office overheads percentage on factory cost will be the same as in the past.
Prepare a Statement of Cost showing the profit he would make per unit, if he reduces the price ofcoolers by Rs. 200Solution:
Statement of Cost for 2011
Particulars Total AmountRs.
Materials 2,82,000Wages 3,24,000
Prime cost 6,06,000

153
Add: Factory Overhead 48,600Factor cost 6,54,600
Add: Office Overhead 65,460Total cost 7,20,060
Profit (Balance) 2,24,940Sales (5,400 x 175) 9,45,000
Percentage of Factory Overhead to Wages:48,000/ 3,24,000 x 100 = 15%Percentage of office overhead to factory cost65,400/ 6,54,600 x 100 = 10%
Statement Showing Estimated Cost and Profit per CoolerParticulars Total Amount
Materials 1,600Wages 1,800
Prime Cost 3,400Add : Factory Overhead (15% of wages) 270
Factory Cost 3,670Add : Office overheads (10% of factory cost) 367
Total Cost 4,037Profit 1,163
Selling price (5,400 – 200) 5,200
Illustration - 8:
In respect of a factory, the following figures have been obtained for the year 2011.
Cost of materials 6,00,000Wages for labour 5,00,000Factory overloads 3,00,000Administration Charges 3,36,000Selling charges 2,24,000Distribution charges 1,40,000Profit 4,20,000
A work order has been executed in 2009 and the following expenses have been incurred:
Materials 8,000Wages for labour 5,000
Assuming that in the year 2012 the rate for factory overhead has gone up by 20%. Distribution Chargeshave gone down by 10% and selling and administration charges each have gone up by 12½%. At whatprice should the product be sold so as to earn the same percentage of profit as on the selling price in the year2011? Factory Overhead is based on direct labor and Administration, Selling and Distribution overhead onfactory cost. Prepare necessary statement of cost.Solution:
Statement of Cost for the year 2011Particular Total Amount
Rs.Cost of Material 6,00,000Wages for labour (Direct wages) 5,00,000
Prime cost 11,00,000
Rs.
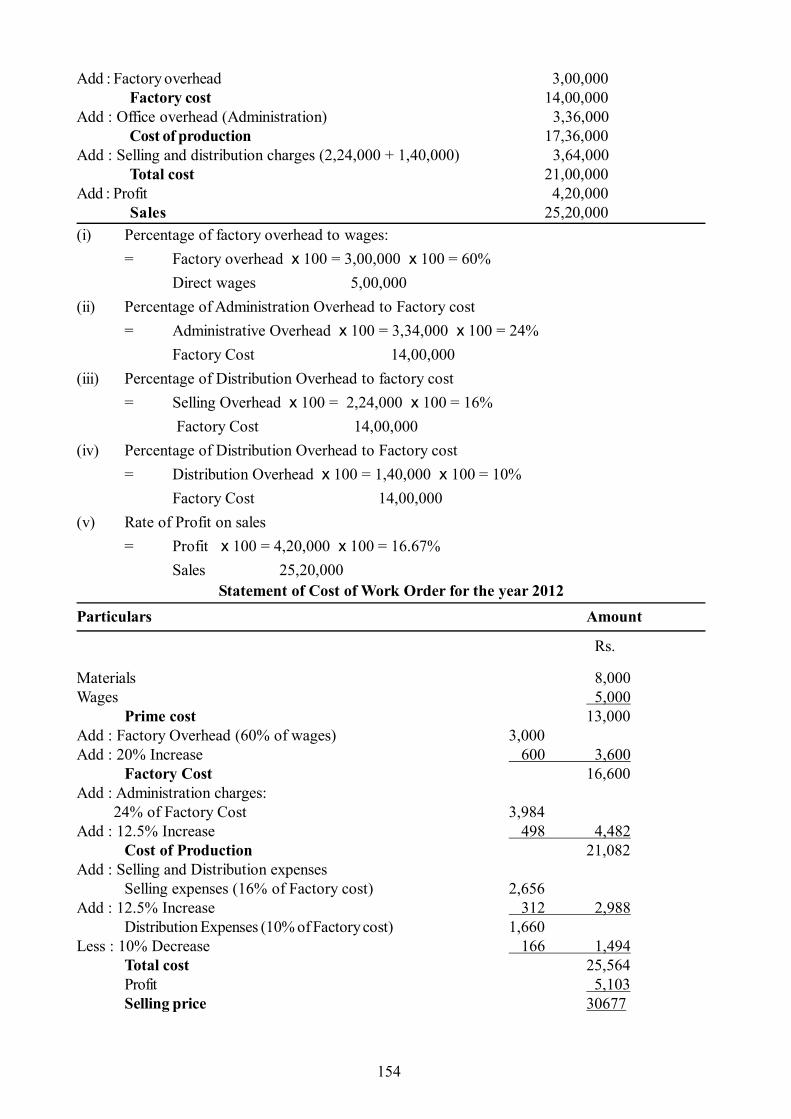
154
Add : Factory overhead 3,00,000Factory cost 14,00,000
Add : Office overhead (Administration) 3,36,000Cost of production 17,36,000
Add : Selling and distribution charges (2,24,000 + 1,40,000) 3,64,000Total cost 21,00,000
Add : Profit 4,20,000Sales 25,20,000
(i) Percentage of factory overhead to wages:= Factory overhead x 100 = 3,00,000 x 100 = 60%
Direct wages 5,00,000(ii) Percentage of Administration Overhead to Factory cost
= Administrative Overhead x 100 = 3,34,000 x 100 = 24%Factory Cost 14,00,000
(iii) Percentage of Distribution Overhead to factory cost= Selling Overhead x 100 = 2,24,000 x 100 = 16%
Factory Cost 14,00,000(iv) Percentage of Distribution Overhead to Factory cost
= Distribution Overhead x 100 = 1,40,000 x 100 = 10%Factory Cost 14,00,000
(v) Rate of Profit on sales= Profit x 100 = 4,20,000 x 100 = 16.67%
Sales 25,20,000Statement of Cost of Work Order for the year 2012
Particulars Amount
Rs.
Materials 8,000Wages 5,000
Prime cost 13,000Add : Factory Overhead (60% of wages) 3,000Add : 20% Increase 600 3,600
Factory Cost 16,600Add : Administration charges: 24% of Factory Cost 3,984Add : 12.5% Increase 498 4,482
Cost of Production 21,082Add : Selling and Distribution expenses
Selling expenses (16% of Factory cost) 2,656Add : 12.5% Increase 312 2,988
Distribution Expenses (10% of Factory cost) 1,660Less : 10% Decrease 166 1,494
Total cost 25,564Profit 5,103Selling price 30677

155
10.15 Production Account
Cost Sheet and Cost Statement have been explained in previous pages to ascertain unit cost. Cost statementmay be presented m the form of ledger account termed as “production account”. Production accountpresents information of production cost in an analytical manner according to double entry system. Cost ofproduction and profit can be computed in this ledger. It is prepared in two parts. Debit side of first partreveals cost of production under different headings after adjusting opening and closing stock of work-in-progress. Such cost of production is carried over to debit side of second part of production account.Opening stock of finished goods is shown in debit side while closing stock appears in credit side. Amount ofsales is also shown in credit side thereafter amount of difference is computed. If the total of credit side ismore than debit side the amount of difference will be recorded as profit or vice versa it will be loss.SeparateProduction Account will be prepared for two or more products.
10.16 Difference between Cost Sheet and Production Account
Performa of Production AccountParticulars Rs. Particulars Rs.
To Direct Materials - By Sales of Waste -To Direct Labour - By Cost of Production c/d -To Direct Expenses -Prime Cost -To Works Overhead -Add: OpeningWork in Progress -Less: ClosingWork – in – Progress -Work Cost -To Office Overheads -To Cost of Production b/d - By Sales -To Opening Stock of By Closing Stock ofFinished Goods - Finished Goods -To Selling & Distribution By Transfer to other
Basis of difference Cost Sheet Production Account
1. Form It is prepared in the from of a statement.
It is prepared like an account.
2. Double entry It is not based on double entry system.
It is based on double entry system and there are debit and credit side.
3. Period It is prepared with a view ascertain total-cost as well as per unit cost of production.
It is prepared after completion of production.
4. Comparative Comparative study for two periods or two type of production is feasible.
Such comparative study is not possible in this methods.
5. Comparison with results of Financial accounts
Results cannot be compared with financial account's results.
Results of Production Account can be compared with financial account's results.
6. Cost analysis Detailed analysis of cost is made to control different elements of cost, viz. material labour and exp.
Different items of cost are shown as totals and are not analysed.
system
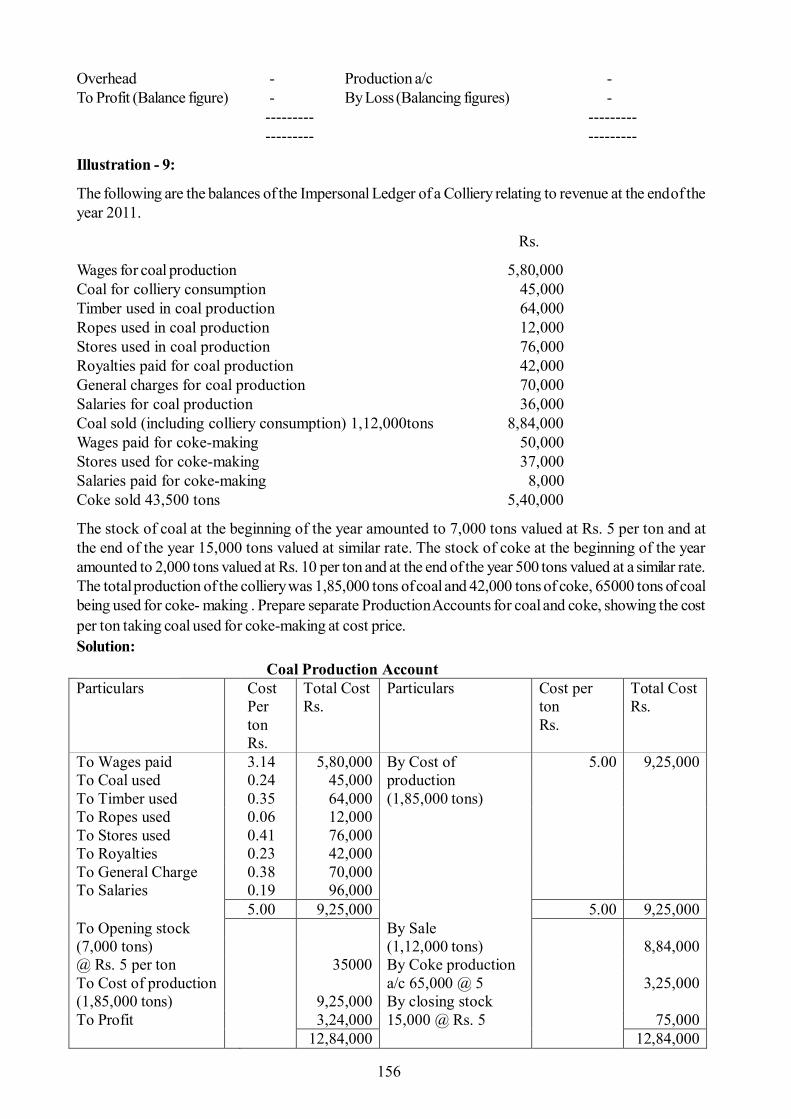
156
Overhead - Production a/c -To Profit (Balance figure) - By Loss (Balancing figures) -
--------- --------- --------- ---------
Illustration - 9:
The following are the balances of the Impersonal Ledger of a Colliery relating to revenue at the end of theyear 2011.
Rs.
Wages for coal production 5,80,000Coal for colliery consumption 45,000Timber used in coal production 64,000Ropes used in coal production 12,000Stores used in coal production 76,000Royalties paid for coal production 42,000General charges for coal production 70,000Salaries for coal production 36,000Coal sold (including colliery consumption) 1,12,000tons 8,84,000Wages paid for coke-making 50,000Stores used for coke-making 37,000Salaries paid for coke-making 8,000Coke sold 43,500 tons 5,40,000
The stock of coal at the beginning of the year amounted to 7,000 tons valued at Rs. 5 per ton and atthe end of the year 15,000 tons valued at similar rate. The stock of coke at the beginning of the yearamounted to 2,000 tons valued at Rs. 10 per ton and at the end of the year 500 tons valued at a similar rate.The total production of the colliery was 1,85,000 tons of coal and 42,000 tons of coke, 65000 tons of coalbeing used for coke- making . Prepare separate Production Accounts for coal and coke, showing the costper ton taking coal used for coke-making at cost price.
Solution: Coal Production Account Particulars Cost
Per ton Rs.
Total Cost Rs.
Particulars Cost per ton Rs.
Total Cost Rs.
To Wages paid 3.14 5,80,000 By Cost of 5.00 9,25,000 To Coal used 0.24 45,000 production To Timber used 0.35 64,000 (1,85,000 tons) To Ropes used 0.06 12,000 To Stores used 0.41 76,000 To Royalties 0.23 42,000 To General Charge 0.38 70,000 To Salaries 0.19 96,000 5.00 9,25,000 5.00 9,25,000 To Opening stock By Sale (7,000 tons) (1,12,000 tons) 8,84,000 @ Rs. 5 per ton 35000 By Coke production To Cost of production a/c 65,000 @ 5 3,25,000 (1,85,000 tons) 9,25,000 By closing stock To Profit 3,24,000 15,000 @ Rs. 5 75,000 12,84,000 12,84,000
Solution:

157
10.17 Summary
Unit or output costing is a basic costing method which is applied to ascertain the cost per unit of theproduction, where production activities operates continuously at a large level, units of identical typeare manufactured or can be turned out in an identical manner on proportionate basis, can be measuredin physical units conveniently and per unit cost of goods manufactured, total production cost andproportionate amount of every element of cost is to be ascertained. It is used in mining industry,cotton industry, paper industry, textile industry, cement industry, brick industry etc.
10.18 Self Assessment Questions
1. Write short notes on:-a) Valuation of work-in-progress.b) Valuation of finished goods.c) Production Accountd) Direct and Indirect Expenses.
2. What is Tender Price? How it is determined?
3. The following figures have been obtained from the cost records of Megha Ltd., for the year2011.
Rs. Rs.
Cost of materials 2,40,000 Administration expenses 1,34,400Wages of labour 2,00,000 Selling expenses 89,600Factory overhead 1,20,000 Profit 1,68,000Distribution expenses 56,000
A work order has been executed in the year 2011 for which cost of materials was Rs. 32,000 andwages was Rs. 20,000.
Assuming that in the year 2011 the rate for factory overhead went up by 20%. Distribution charges
Coke Production Account Particulars Cost per
ton Rs. Total cost Rs.
Particulars Cost per ton Rs.
Total cost Rs.
To Coal used 7.74 3,25,000 By Cost of production 10.00 4,20,000 (65,000 tons of 42, 000 ton @ Rs. 5.00 per ton) To Wages 1.19 50,000 To Stores used 0.88 37,000 To Salaries paid 0.19 8,000 10.00 4,20,000 10.00 4,20,000 To Opening stock By Sales (43,500 tons) 5,40,000 (2,000tons @ Rs. By Stock Closing 500 10 per ton) 20,000 Tons @ Rs. 10 To Cost of production Per ton 5,000 42,000 tons 4,20,000 To Profit 1,05,000 5,45,000 5,45,000
Coal

158
went down by 10% and selling and administration charges went up by 12½%.
At what price should the product of the job be quoted so as to earn the same (earlier) rate of profiton the selling price? Administration, Distribution and Selling Overheads are based on the FactoryCost.
4. Pratap Ltd. has received an order for the supply of three types of casting weighing 36, 90 and 54tons respectively. 10% of the raw materials used are wasted in manufacturing and are sold as scrapfor 25% of the cost price of raw material. Materials cost Rs. 500 per ton and the wages wouldamount to Rs. 12,000; Rs. 31,500 and Rs. 16,500 respectively. The cost of moulds, for casting isRs. 1,200; Rs. 1,000 and Rs. 900 respectively. Factory overheads are to be charged at 30% ofwages and administration and other overheads at 20% of works cost. It is desired to earn a profitof 25% on selling price. Ascertain the price to be quoted for the supply of these different types ofcosting.
10.19 Reference Books
- Agrawal & Agrawal, ‘Management Accounting’, (RBD. Jaipur)
- Khan, Jain, ‘Management Accounting’, (S. Chand & Sons.)
- I. M. Pandey, ‘Management Accounting’, (S. Chand & Sons.)
- M.N. Arora, ‘Management Accounting’, (Himalaya Publication House).

159
Unit - 11 : Contract Costing
Structure of Unit:
11.0 Objectives11.1 Introduction11.2 Meaning of Contract Costing11.3 Recording of Contract Costs11.4 Cost of Work Certified11.5 Work Uncertified11.6 Retention Money11.7 Cash Received11.8 Work-in-Progress11.9 Notional Profit11.10 Estimated Profit11.11 Accounting Standard-711.12 Profit\Loss on Incomplete Contracts11.13 Cost plus Contract11.14 Escalation Clause11.15 Summary11.16 Self Assessment Questions11.17 Reference Books
11.0 Objectives
After studying this unit, you should be able to: Understand the meaning of contract costing Understand recording of contract costs Understand the terminology regarding contract costing Learn the Computation of profit on incomplete contracts Understand cost of certified and uncertified work
11.1 Introduction
A contract usually takes several years to get it completed. If the profit on such contracts is recorded onlyafter their completion, then wide fluctuations may be noted in the profit figures of contractors from year toyear. To avoid these fluctuations in the reported profits and to reflect the revenue in the accounting periodduring which the activity is undertaken, the profit in respect of each contract in progress is transferred to theprofit and loss account of the year by calculating the notional profit. The portion of notional profit to betransferred to the profit and loss account depends on the stage of completion of a contract. To determinesuch a profit figure the knowledge of various concepts as discussed below is essential in contract costing.
11.2 Meaning of Contract Costing
Contract or terminal costing, as it is termed, is one form of application of the principles of job costing. In facta bigger job is referred to as a contract. Contract costing is usually adopted by building contractors engagedin the task of executing civil contracts. Contract costing have the following distinct features:
1. The major part of the work in connection with each contract is ordinarily carried out at the site ofthe contract.
160
2. The bulk of the expenses incurred by the contractor are considered as direct.
3. The indirect expenses mostly consist of office expenses of the yards, stores and works.
4. A separate account is usually maintained for each contract.
5. The number of contracts undertaken by a contractor at a time is not usually very large.
6. The cost unit in contract costing is the contract itself.
11.3 Recording of Contract Costs
Material Cost: All materials supplied from the stores or purchased directly for the contract are debited tothe concerned contract account. In the case of transfer of excess material from one contract to othercontract, their costs would be adjusted on the basis of material transfer note, signed both by the transfereeand the transferor foreman. In case the return of surplus material appears uneconomical on account of highcost of transportation, the same is sold and the concerned contract account is credited with the sale price.Any loss or profit arising there from is transferred to the Profit and Loss Account. Any theft or destructionof material by fire represents a loss and as such, the same is transferred to the Profit and Loss Account. Ifany stores items are used for manufacturing tools, the cost of such stores items are charged to the workexpenses account. If the contractee has supplied some materials without affecting the contract price, noaccounting entries will be made in the contract account, only a note may be given about it.
Labour Cost: Labour actually employed on the site of the contract is regarded as direct (irrespective of thenature of the task performed) and the wages paid to them are charged to the concerned contract directly oron the basis of a wage analysis sheet (if concurrently a number of contracts are carried on and labours arerequired to devote their time on two or more contracts).
Direct Expenses: Direct expenses (if any) are directly charged to the concerned contract.
Indirect Expenses: Indirect expenses (such as expenses of engineers, surveyors, supervisors etc.) may bedistributed over several contracts as a percentage of cost of materials, or wages paid or of the prime cost.If however, the contracts are big, the labour hour method may be used for the distribution of expenses.
Plant and Machinery: The value of the plant in a contract may be either debited to contract account andthe written down value thereof at the end of the year entered on the credit side for closing the contractaccount, or only a charge (depreciation) for use of the plant may be debited to the contract account.
Sub-Contract: Sub-contract costs are also debited to the Contract Account.
Extra Work: The extra work amount payable by the contractee should be added to the contract price. Ifextra work is substantial, it is better to treat it as a separate contract. If it is not substantial, expensesincurred should be debited to the contract account as “Cost of Extra work”.
11.4 Cost of Work Certified
All building contractors received payments periodically known as “running payment” on the basis of thearchitect’s or surveyor’s certificates. Normally payments are not equal to the value of the work certified, asmall percentage of the amount due is retained as security for any defective work which may be discoveredlater within the guarantee period.
Cost of work certified = Cost of work to date - (Cost of work uncertified + Material in hand + Plant at site)

161
The amount retained is called retention money. The full value of the work certified should be credited to theContract Account and debited to the account of the contract. Since the cash received from him will be less,the balance in his account will be shown as an asset in the balance sheet.
11.5 Work Uncertified
It represents the cost of the work which has been carried out by the contractor but has not been certified bythe contractor’s architect. It is always shown at cost price. The cost of uncertified work may be ascertainedas follows:
Rs.Total cost to date —Less: Cost of work certified —Material in hand —Plant at site —Cost of work uncertified —
11.6 Retention Money
A contractor does not receive full payment of the work certified by the surveyor. Contractor retains someamount (say 10% to 20%) to be paid, after sometime, when it is ensured that there is no fault in the workcarried out by contractor. If any deficiency or defect is noticed in the work, it is to be rectified by thecontractor before the release of the retention money. Retention money provides a safeguard against the riskof loss due to faulty workmanship.
11.7 Cash Received
It is ascertained by deducting the retention money from the value of work certified i.e., Cash received =Value of work certified - Retention money.
11.8 Work-in-Progress
In Contract Accounts, the value of the work-in-progress consists of(i) The cost of work completed, both certified and uncertified;(ii) The cost of work not yet completed; and(iii) The amount of profit taken as credit.
In the Balance Sheet, the work-in-progress is usually shown fewer than two heads, viz., certified anduncertified. The cost of work completed and certified and the profit credited will appear under the head‘certified’ work-in-progress, while the completed work not yet certified and the cost of labour, material andexpenses of work which has not yet reached the stage of completion are shown under the head “uncertified”work-in-progress.
11.9 Notional Profit
It represents the difference between the value of work certified and cost of work certified. It is determined:
Notional profit = Value of work certified - (Cost of work to date - Cost of work not yet certified)
11.10 Estimated Profit
It is the excess of the contract price over the estimated total cost of the contract.

162
11.11 Accounting Standard - 7
This standard issued by the Institute of Chartered Accountant of India of relates to ‘Accounting forConstruction Contracts for the financial Statements of Contractors. In the initial years, this accountingstandard will be recommendatory in character.’
Detail:
(1) This standard deals with accounting for construction Contracts in the financial statements ofcontractors.
(2) The feature which characterises a construction contract dealt with in this Statement is the fact thatthe date at which the contract is secured and the date when the contract activity is completed fallinto different accounting periods. The specific duration of the contract performance is not used as adistinguishing feature of a construction is essentially a process of measuring the results of relativelylong- term events and allocating those results to relatively short-term accounting periods.
(3) For the purposes of this statement a construction contract is a contact for the construction of anasset or of a combination of assets which together constitute a single project. Examples of activitycovered by such contracts include the construction of bridges, dam’s ships, buildings and complexpieces of equipment.
(4) Contracts for the provision of services come within the statement to the extent that they are directlyrelated to a contract or the construction of an asset.
(5) The principal problem relating to accounting for construction contracts is the allocation of revenuesand related costs to accounting periods over the duration of the contract.
(6) Types of Construction Contracts: Construction contracts are formulated in a variety of ways butgenerally fall into two basic types:
i) Fixed price contracts: the contractor agrees to a fixed contract price, or rate, in some casessubject to cost escalation clauses;
ii) Cost plus contracts: the contractor is reimbursed for allowable or otherwise defined costs, and isalso allowed a percentage of these costs or a fixed fee.
Both types of contracts are within the scope of this Statement.
Illustration - 1:
Compute a conservative estimate of profit on a contract (which has been 90% complete) from the followingparticulars:
(Rs.)Total expenditure to date 22, 50,000Estimated further expenditure to complete thecontract (including contingencies) 2, 50,000Contract price 32, 50,000Work certified 27, 50,000Work uncertified 1, 75,000Cash received 21, 25,000

163
Solution:Calculation of conservative Estimate of Profit (Rs.)Total expenditure to date 22, 50,000Estimated further expenditure to complete thecontract (including contingencies) 2, 50,000
25, 00,000Estimated profit on contract 7, 50,000Contract price 32, 50,000
Profit to be transferred to Profit and Loss A/c
priceContract receivedCash Profit Estimated
4,90,385 .Rs32,50,000 Rs.21,25,000 Rs. 7,50,000 Rs.
11.12 Profit/Loss on Incomplete Contracts
To determine the profit to be taken to Profit and Loss Account, in the case of incomplete contracts, thefollowing four situations may arise:
(i) Completion of contract is less than 25 per cent. In this case no profit should be taken to profitand loss account.
(ii) Completion of contract is up to 25 per cent or more than 25 per cent but less than 50 per cent. Inthis case one-third of the notional profit, reduced in the ratio of cash received to work certified,should be transferred to the Profit and Loss Account. Mathematically:
1 Cash receivedNotionalprofit3 Work certified
(iii) Completion of contract is up to 50 per cent or more than 50 per cent but less than 90 per cent. Inthis case, two-third of the notional profit, reduced by proportion of cash received to work certified,is transferred to the Profit and Loss Account. Mathematically:
2 Cash receivedNotional profit3 Work certified
(iv) Completion of contract is up to 90 per cent or more than 90 per cent i.e. it is near to completion: Inthis case the profit to be taken to Profit and Loss Account is determined by determining the estimatedProfit and using any one of the following formulas:
(a) priceContract certifiedWork Profit Estimated
(b) certifiedWork receivedCash
priceContract certifiedWork Profit Estimated
OR
PriceContract receivedCash Profit Estimated
164
(c) cost totalEstimateddate work toofCost Profit Estimated
(d)certifiedWork receivedCash
cost totalEstimateddate work toofCost Profit Estimated
(e) priceContract certifiedWork Profit Notional
(This formula may be preferably used in the absence of estimated profit figure)
It is preferable to use formula (b) in the absence of specific instructions.
11.13 Cost plus Contract
Under Cost plus Contract, the contract price is ascertained by adding a percentage of profit to the total costof the work. Such type of contracts are entered into when it is not possible to estimate the contract cost withreasonable accuracy due to unstable condition of material, labour services, etc.
Cost plus contracts have the following advantages and disadvantages:
Advantages:
(i) The Contractor is assured of a fixed percentage of profit. There is no risk of incurring any loss onthe contract.
(ii) It is useful especially when the work to be done is not definitely fixed at the time of making theestimate.
(iii) Contractee can ensure himself about ‘the cost of the contract’, as he is empowered to examinethe books and documents of the contractor to ascertain the cost of the contract.
Disadvantages:
The contractor may not have any inducement to avoid wastages and effect economy in production toreduce cost.
11.14 Escalation Clause
If during the period of execution of a contract, the prices of materials, or labour etc., rise beyond a certainlimit, the contract price will be increased by the agreed amount. Inclusion of such a clause in a contract deedis called as “Escalation Clause”.
Illustration - 2:The following expenses were incurred on a contract:
Rs.Material purchased 6, 00,000Material drawn from stores 1, 00,000Wages 2, 25,000Plant issued 75,000Chargeable expenses 75,000Apportioned indirect expenses 25,000

165
The contract was for Rs. 20, 00,000 and it commenced on January 1, 2010. The value of the workcompleted and certified up to 30th November, 2010 was Rs. 13, 00,000 of which Rs. 10, 40,000 wasreceived in cash, the balance being held back as retention money by the contractee. The value of workcompleted subsequent to the architect’s certificate but before 31st December, 2010 was Rs. 60,000.There were also lying on the site materials of the value of Rs. 40,000. It was estimated that the valueof plant as at 31st December, 2010 was Rs. 30,000. Prepare contract account and the amount whichwill be shown in the balance sheet of contractor
Solution:
Contract Account
Dr. Cr.Particular Rs. Particular Rs.To Material purchased 6,00,000 By Work-in-progress:To Stores issued 1,00,000 By Work certified 13,00,000To Wages 2,25,000 By Work uncertified 60,000To Plant 75,000 By Material unused 40,000To Chargeable expenses 75,000 By Plant less depreciation 30,000To Indirect expenses 25,000To Profit and Loss Account, (2/3rd of Profit on Cash basis) 1,76,000*
To Work in progress balance of profit c/d 1,54,000
14,30,000 14,30,000
To Balance b/d: Work certified 13,00,000
Uncertified 60,000
Material at site 40,000
Plant at site 30,000
14,30,000
Less : Reserve 1,54,000
12,76,000
* Computation of Profit Rs.Apparent profit 3,30,0002/3rd of that since 66.67% of the work is complete 2,20,00080% of that on cash basis (22000x80%) 1,76,000
An alternative method of presentation can be to deduct the balance of profit to be carried down (Rs. 1,54,000 in the above case) from the work certified before it is entered in the contract account. It will be Rs.11, 46,000 in the illustration given above. Of course, the reserve to be so deducted from the work certifiedwill have to be first ascertained by considering the value of the work certified.
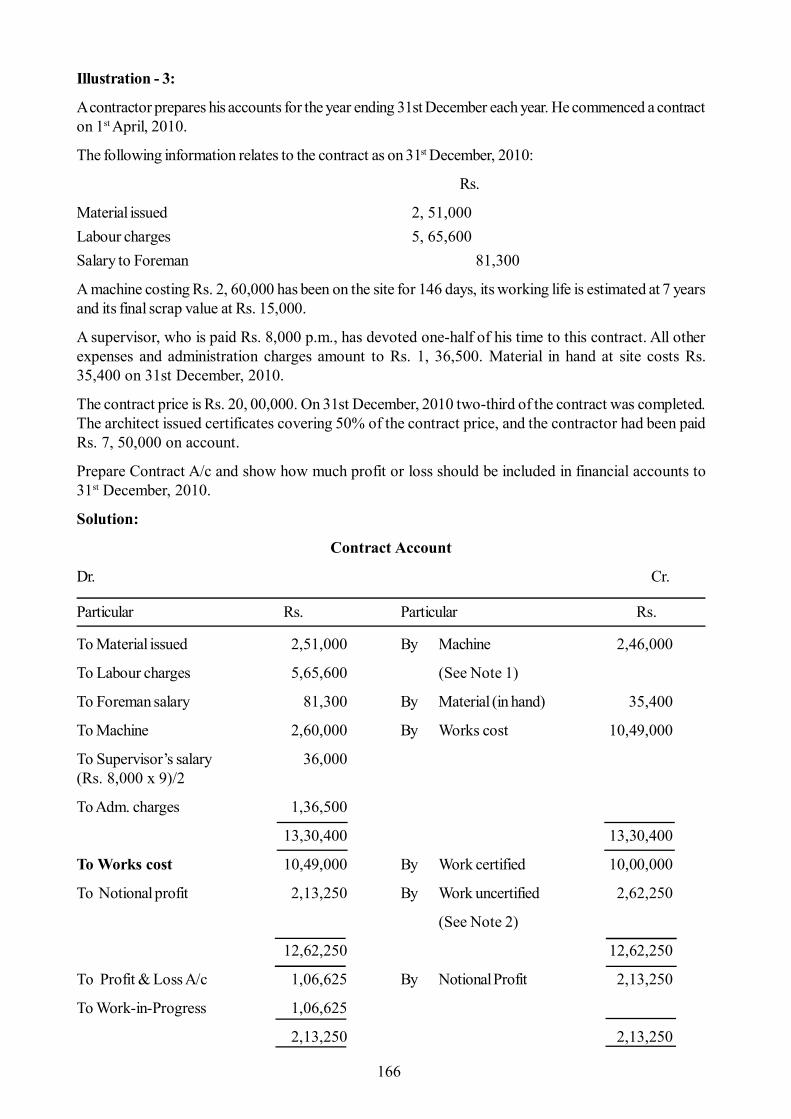
166
Illustration - 3:
A contractor prepares his accounts for the year ending 31st December each year. He commenced a contracton 1st April, 2010.
The following information relates to the contract as on 31st December, 2010:
Rs.
Material issued 2, 51,000Labour charges 5, 65,600Salary to Foreman 81,300
A machine costing Rs. 2, 60,000 has been on the site for 146 days, its working life is estimated at 7 yearsand its final scrap value at Rs. 15,000.
A supervisor, who is paid Rs. 8,000 p.m., has devoted one-half of his time to this contract. All otherexpenses and administration charges amount to Rs. 1, 36,500. Material in hand at site costs Rs.35,400 on 31st December, 2010.
The contract price is Rs. 20, 00,000. On 31st December, 2010 two-third of the contract was completed.The architect issued certificates covering 50% of the contract price, and the contractor had been paidRs. 7, 50,000 on account.
Prepare Contract A/c and show how much profit or loss should be included in financial accounts to31st December, 2010.
Solution:
Contract Account
Dr. Cr.
Particular Rs. Particular Rs.
To Material issued 2,51,000 By Machine 2,46,000
To Labour charges 5,65,600 (See Note 1)
To Foreman salary 81,300 By Material (in hand) 35,400
To Machine 2,60,000 By Works cost 10,49,000
To Supervisor’s salary 36,000(Rs. 8,000 x 9)/2
To Adm. charges 1,36,500
13,30,400 13,30,400
To Works cost 10,49,000 By Work certified 10,00,000
To Notional profit 2,13,250 By Work uncertified 2,62,250
(See Note 2)
12,62,250 12,62,250
To Profit & Loss A/c 1,06,625 By Notional Profit 2,13,250
To Work-in-Progress 1,06,625
2,13,250 2,13,250

167
Notes:
1. Machine:
[(Rs. 2, 60,000 - Rs. 15,000) + 7] * 365146
= Rs. 14,000
Hence the value of machine after the period of 146 days is Rs. 2,60,000 - Rs. 14,000 = Rs. 2,46,0002. The cost of 66.67% of the contract is Rs. 10,49,000
Cost of 100% of the contract is Rs. 66.6710,49,000
x 100 = Rs. 15, 73,500
Cost of 50% of the contract which has been certified by the architect is Rs. 7, 86,750. Also the cost of16.67% of the contract, which has been completed but not certified by the architect, is Rs. 2, 62,250.
Illustration - 4:
M/s. Bansalas Construction Company Ltd. took a contract for Rs. 60, 00,000 expected to be completedin three years. The following particulars relating to the contract are available:
2008 2009 2010 Rs. Rs. Rs.
Materials 6,75,000 10,50,000 9,00,000Wages 6,20,000 9,00,000 7,50,000Cartage 30,000 90,000 75,000Other expenses 30,000 75,000 24,000Cumulative work certified 13,50,000 45,00,000 60,00,000Cumulative work uncertified 15,000 75,000 -
Plant costing Rs. 3,00,000 was bought at the commencement of the contract. Depreciation was to becharged at 25% per annum, on the written down value method. The contractee pays 75% of the value ofwork certified as and when certified, and makes the final payment on completion of the contract.
You are required to make a contract account and contractee account as they would appear in each of thethree years. Also show how the work-in-progress and other items should appear in the balance sheet.
Solution:Contract Account
Dr. Cr.
2008 Rs. 2008 Rs.To Materials 6,75,000 By Plant at site c/d 2,25,000To Wages 6,20,000 By work-in-progress c/dTo Cartage 30,000 Work certified 13,50,000To Other expenses 30,000 Work uncertified 15,000 13,65,000To Plant 3,00,000 By Profit & Loss A/c (Loss transferred) 6,5,000
16,55,000 16,55,000
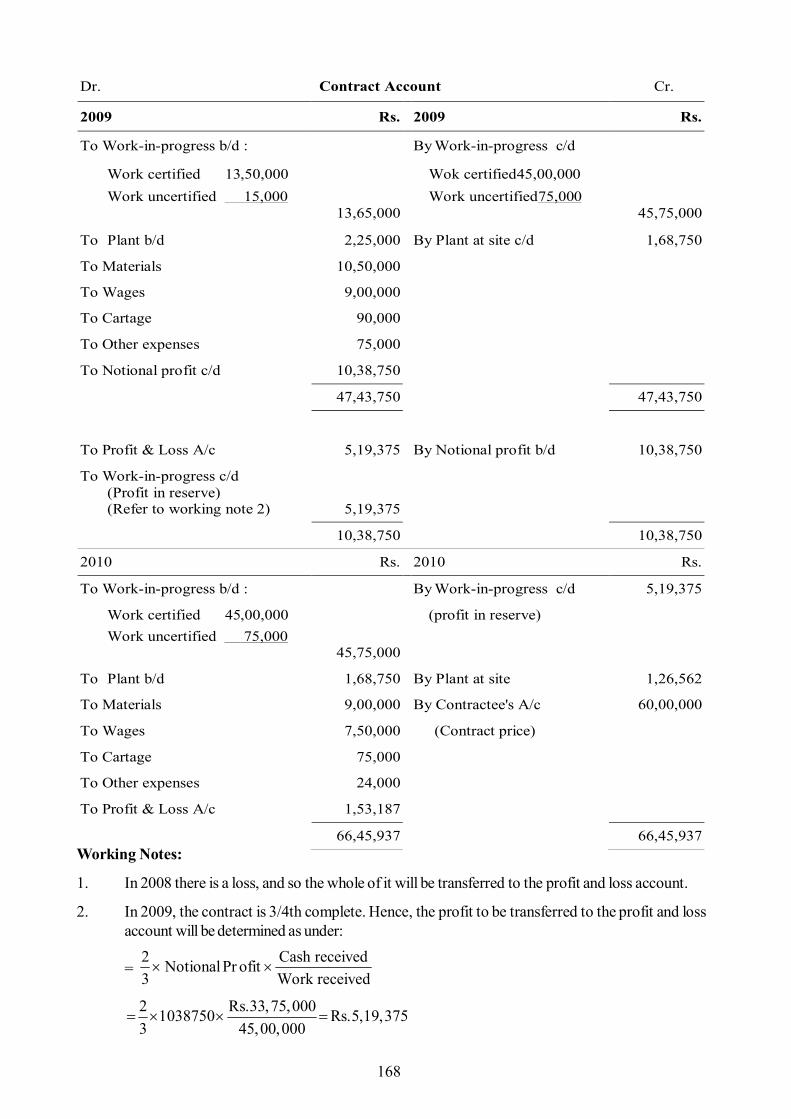
168
Working Notes:
1. In 2008 there is a loss, and so the whole of it will be transferred to the profit and loss account.
2. In 2009, the contract is 3/4th complete. Hence, the profit to be transferred to the profit and lossaccount will be determined as under:
= received WorkreceivedCash ofitPrNotional
32
2 Rs.33,75,0001038750 Rs.5,19,3753 45,00,000
Dr. Contract Account Cr.
2009 Rs. 2009 Rs.
To Work-in-progress b/d : By Work-in-progress c/d
Work certified 13,50,000 Work uncertified 15,000 13,65,000
Wok certified45,00,000 Work uncertified75,000
45,75,000
To Plant b/d 2,25,000 By Plant at site c/d 1,68,750
To Materials 10,50,000
To Wages 9,00,000
To Cartage 90,000
To Other expenses 75,000
To Notional profit c/d 10,38,750
47,43,750 47,43,750
To Profit & Loss A/c 5,19,375 By Notional profit b/d 10,38,750
To Work-in-progress c/d (Profit in reserve) (Refer to working note 2) 5,19,375
10,38,750 10,38,750
2010 Rs. 2010 Rs.
To Work-in-progress b/d : By Work-in-progress c/d 5,19,375
Work certified 45,00,000 Work uncertified 75,000 45,75,000
(profit in reserve)
To Plant b/d 1,68,750 By Plant at site 1,26,562
To Materials 9,00,000 By Contractee's A/c 60,00,000
To Wages 7,50,000 (Contract price)
To Cartage 75,000
To Other expenses 24,000
To Profit & Loss A/c 1,53,187
66,45,937 66,45,937

169
* The total value of work certified at the end of 2009 was Rs. 45,00,000 of that worth Rs. 13,50,000 wascertified in 2008. Hence, the cash to be received in 2009 is 75% of Rs. 31,50,000 (Rs. 45,00,000 - Rs.13,50,000) i.e. Rs. 23,62,500.
Balance sheet (Extract) 2008
2008 Rs . 2008 Rs.
To Balance c/d 10,12,500 By Bank 10,12,500
2009 2009
To Balance c/d 33,75,000 By Balance b/d 10,12,500
By Bank 23,62,500*
33,75,000 33,75,000
2010 2010
To Contract A/c 60,00,000 By Balance b/d 33,75,000
(Contract price) By Bank 26,25,000
60,00,000 60,00,000
Balance sheet (Extract) 2010
Liabilities Rs. Assets Rs.
Capital — Plant at site 1,26,562
Add: Profit during the year 1,53,157
Contractee Account
Liabilities Rs. Assets Rs. Capital — Plant at site 2,25,000
Less ."Loss during the year 65,000 Work in Progress Rs. Work certified 13,50,000
Work uncertified 15,000
1365000
Less : Cash Received 10,12,500 3,52,500
Balance sheet (Extract) 2009 Liabilities Rs. Assets Rs. Capital — Plant at site 1,68,750
Add: Profit during the year 5,19,375 Work in Progress Rs.
Work certified 45,00,000
Work uncertified 75,000
45,75,000
Less : Profit in Reserve 5,19,375 40,55,625
Less : Cash
Received 33,75,000 6,80,625

170
Illustration - 5:Compute a conservative estimate of profit on a contract (which has been 90% complete) from the followingparticulars. Calculate the proportion of profit to be taken to Profit & Loss Account under various methodsand give your recommendation.
Rs.Total expenditure to date 4,50,000Estimated further expenditure to completethe contract (including contingencies) 25,000Contract price 6,12,000Work certified 5,50,800Work uncertified 34,000Cash received 4,40,640Solution:Computation of notional profit Rs.Value of work certified 5,50,800Less: Cost of work certified(Rs. 4,50,000 - Rs. 34,000) 4,16,000Notional profit 1,34,800Computation of estimated profit Rs.Contract price 6,12,000Less: Cost of work to date 4,50,000Estimated further expenditure tocomplete the contract 25,000Estimated total cost 4,75,000Estimated profit 1,37,000
Under various methodsWork certified
(i) priceContract
certifiedW ork profit Notional
= 1,21,320 Rs.6,12,000 Rs.5,50,800 Rs. 1,34,800 Rs.
(ii) priceContract
certifiedWork profit Estimated
= 1,23,300 Rs.6,12,000 Rs.5,50,800 Rs.
1,37,000 Rs.
(ii i) certifiedWork receivedCash
priceContract certifiedWork profit Estimated
= 640,98.Rs5,50,800 Rs.4,40,640 Rs.
6,12,000 Rs.5,50,800 Rs. 1,37,000 Rs.
(iv) cost totalEstimated
date work ofCost profit Estimated
= 1,29,790 Rs.4,75,000 Rs.4,50,000 Rs. 1,37,000 Rs.
(v) certifiedWork receivedCash
cost totalEstimateddate work ofCost profit Estimated
= 832,03,1.Rs5,50,800 Rs.4,40,640 Rs.
4,75,000 Rs.4,50,000 Rs. 1,37,000 Rs.

171
Recommendation : It is recommended that a sum of Rs. 98,640 may be transferred to the profit and lossaccount. This amount is the least and has been arrived by using the formula (iii) above. According to thisformula, profit transferred to the profit and loss account is generally kept the minimum and allows withholdingin reserve a larger portion of notional profit to meet future unforeseen expenses and contingencies.
Illustration - 6:
A contractor has entered into a long term contract at an agreed price of Rs. 1,75,000 subject to an escalationclause for materials and wages as spelt out in the contract and corresponding actuals are as follows :
Standard Actual
Materials Qty (tones) Rate (Rs.) Qty (tones) Rate (Rs.)
A 5,000 5 5,050 4.80
B 3,500 8 3,450 7.90
C 2,500 6 2,600 6.60
Labour Hours Hourly Hours HourlyRate (Rs.) Rate (Rs.)
X 2,000 7.00 2,100 7.20
Y 2,500 7.50 2,450 7.50
Z 3,000 6.50 3,100 6.60
Reckoning the full actual consumption of material and wages the company has claimed a final price ofRs. 1,77,360. Give your analysis of admissible escalation claim and indicate the final price payable.
Solution:
Statement showing final claim
Standard Standard Actual Rate Variation in Escalation
Qty/Hrs. Rate(Rs.) (Rs.) Rate(Rs.) Claim (Rs.)
Materials (a) (b) (c) (d) = (c)-(b) (e) =(a) x (d)
A 5,000 5.00 4.80 (-) 0.20 (-) 1,000
B 3,500 8.00 7.90 (-)0.10 (-) 350
C 2,500 6.00 6.60 (+) 0.60 1,500
Materials escalation claim : (P) 150
Labour
X 2,000 7.00 7.20 (+) 0.20 400
Y 2,500 7.50 7.50 - -
Z 3,000 6.50 6.60 (+) 0.10 300
Wages escalation claim: (Q) 700
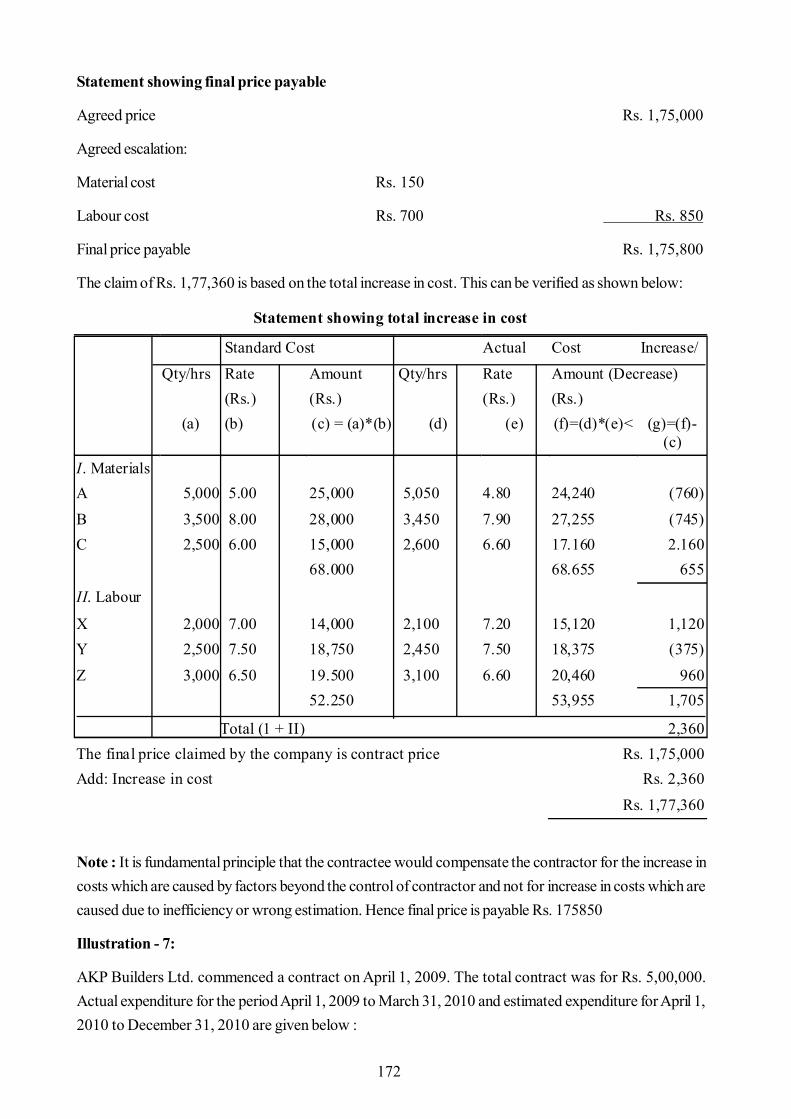
172
Statement showing final price payable
Agreed price Rs. 1,75,000
Agreed escalation:
Material cost Rs. 150
Labour cost Rs. 700 Rs. 850
Final price payable Rs. 1,75,800
The claim of Rs. 1,77,360 is based on the total increase in cost. This can be verified as shown below:
Note : It is fundamental principle that the contractee would compensate the contractor for the increase incosts which are caused by factors beyond the control of contractor and not for increase in costs which arecaused due to inefficiency or wrong estimation. Hence final price is payable Rs. 175850
Illustration - 7:
AKP Builders Ltd. commenced a contract on April 1, 2009. The total contract was for Rs. 5,00,000.Actual expenditure for the period April 1, 2009 to March 31, 2010 and estimated expenditure for April 1,2010 to December 31, 2010 are given below :
Statement showing total increase in cost
Standard Cost Actual Cost Increase/ Qty/hrs Rate Amount Qty/hrs Rate Amount (Decrease) (Rs.) (Rs.) (Rs.) (Rs.)
(a) (b) (c) = (a)*(b) (d) (e) (f)=(d)*(e)< (g)=(f)-(c)
I. Materials A 5,000 5.00 25,000 5,050 4.80 24,240 (760) B 3,500 8.00 28,000 3,450 7.90 27,255 (745) C 2,500 6.00 15,000 2,600 6.60 17.160 2.160 68.000 68.655 655
II. Labour
X 2,000 7.00 14,000 2,100 7.20 15,120 1,120 Y 2,500 7.50 18,750 2,450 7.50 18,375 (375) Z 3,000 6.50 19.500 3,100 6.60 20,460 960 52.250 53,955 1,705
Total (1 + II) 2,360 The final price claimed by the company is contract price Rs. 1,75,000 Add: Increase in cost Rs. 2,360 Rs. 1,77,360

173
Particulars 2009-10 2010-11(actual) (9months)(estimated)
Materials issued 90,000 85,750Labour: Paid 75,000 87,325Outstanding at the end 6,250 8,300Plant 25,000 -Sundry expenses: Paid 7,250 6,875Prepaid at the end 625 -Establishment charges 14,625 -
A part of the material was unsuitable and was sold for Rs.18,125 (cost being Rs. 15,000) and a partof plant was scrapped and disposed of for Rs.2,875. The value of plant at site on 31 March, 2010 wasRs. 7,750 and the value of material at site was Rs. 4,250. Cash received on account to date was Rs.1,75,000, representing 80% of the work certified. The cost of work uncertified was valued at Rs.27,375.
The contractor estimated further expenditure that would be incurred in completion of the contract: The contract would be completed by 31st December, 2010. A further sum of Rs.31,250 would have to be spent on the plant and the residual value of the
plant on the completion of the contract would be Rs.3,750. Establishment charges would cost the same amount per month as in the previous year. Rs. 10,800 would be sufficient to provide for contingencies.
Required :
Prepare Contract Account and calculate estimated total profit on this contract. Profit transferrable toProfit and Loss Account is to be calculated by reducing estimated profit in proportion of work certifiedand contract price.
Solution : AKP Builders Ltd. Contract Account (2009-10)
Particulars Rs. Particulars Rs.
To Materials issued 90,000 By Material sold 18,125
To Labour 75,000 By Plant sold 2,875
Add : Outstanding 6,250 81,250 By Plant at site 7,750
To Plant 25,000 By Material at site 4,250
To Sundry Expenses 7,250 ByWork-in-progress
Less : Prepaid 625 6,625 Work certified 2,18,750
To Establishment charges 14,625 Work uncertified 27,375 2,46,125
To Profit & Loss A/c 3,125
(profit on sale of material)
To Notice profit c/d 58,500
2,79,125 2,79,125
To Profit & Loss A/c (transfer)
29,960 By Notional profit b/d 58,500
ToWork-in-progress (reserve) 28,540
58,500 58,500

174
Profit to be transferred to Profit and Loss Account
= priceContract CertifiedWork profit Estimated
= 29,960 Rs. 5,00,0002,18,750 68,481 s.R
Illustration - 8:
RST Construction Ltd. commenced a contract on April 1, 2010. The total contract was for Rs. 49,21,875.It was decided to estimate the total profit on the contract and to take to the credit of Profit and Loss A/c thatproportion of estimated profit on cash basis, which work completed to total contract. Actual expenditurefor the period April 1, 2010 to March 31, 2011 and estimated expenditure for April 1, 2011 to September30, 2011 are given below:
(Rs.)
April 1, 2010 April 1, 2011 to to March 31, 2011 Sept. 30, 2011
(Actual) (Estimated)
Materials issued 7,76,250 12,99,375
Labour : Paid 5,17,500 6,18,750
Prepaid 37,500 -
Outstanding 12,500 5,750
Calculation of Estimated Profit (Rs.)
(1) Material consumed (90,000 + 3,125-18,125)75,000
Add: Further consumption 85.750 1,60,750
(2) Plant used (25,000-2,875) 22,125
Add: Further plant introduced 31,250 Less: Closing balance of plant 3,750 49,625
(3) Establishment charges 14,625
Add: Further charges for nine month(14,625 x 9/12) 10,969 25,594
(4) Sundry expenses 6,625
Add: Further expenses 6,875
Add: Prepaid expenses 625 14125
(5) Labour cost 81,250
Add: Further cost (87,325-6,250) 81,075
Add: Outstanding 8.300 1,70,625
(6) Reserve for contingencies 10,800
Estimated profit (balancing figure) 68.481
Contract price 5.00.000

175
Plant purchased 4,00,000 -
Expenses : Paid 2,25,000 3,75,000
Outstanding 25,000 10,000
Prepaid 15,000 -
Plant returns to store (historical cost) 1,00,000 3,00,000
(on Sept. 30, 2010 (on Sept. 30, 2011
Work Certified 22,50,000 Full
Work uncertified 25,000 -
Cash received 18,75,000 -
Materials at site 82,500 42,500
The plant is subject to annual depreciation @ 25% on written down value method. The contract is likely tobe completed on September 30, 2011.
Required : Prepare the Contract A/c. Determine the profit on the contract for the year 2010-11 on prudentbasis, which has to be credited to Profit and Loss A/c.
Solution:
Calculation of written down value of plant as on 30-9-2011. (Rs.)
Plant purchased on 1-4-2010 4,00,000
Less: Plant returned to store on 30-9-2010 1,00,000
(Depreciation on it Rs. 1,00,000 x 25/100 x 6/12 = Rs. 12,500) 3,00,000
Less: Depreciation on Balance plant (3,00,000 x 25/100) 75,000
WDV of Plant on 1-4-2011 2,25,000
Less : Depreciation (2,25,000 x 25/100 x 6/12) 28,125
WDV of plant returned to store on 30-9-2011 1,96,875
Contract Account (1-4-2010 to 31-3-2011) Particulars Rs. Particulars Rs. To Materials issued
7,76,250 Plant returned to Store on 30-9-2010 1,00,000
To Labour 5,17,500 Less : Depreciation 12,500 87,500 Add : Prepaid 37,500 4,80,000 Plant at site on 31.03.11 3,00,000 Add : Outstanding 12,500 4,92500 Less : Depreciation 75,000 2,25,000 To Plant purchased 4,00,000 82,500 To Expenses 2,25,000 Less : Prepaid 15,000 By Work-in-progress 2,10,000 Work certified 22,50,000 Add : outstanding 25,000 2,35,000 Work uncertified 25,000 To Notional profit c/d 7,66,250 - 26,70,000 26,70,000 To Profit & Loss A/c (Tr.) 3,89,000 By Notional profit b/d 7,66,250 To Work-in-Progress (Res.) 3,77,250 7,66,250 7,66,250

176
Computation of Estimated Profit
Since the contract is near to completion, the following formula is used for transfer of profit to Profit and LossAccount.
priceContract receivedCash Profit Estimated = 49,21,875
18,75,000 10,21,125 = Rs. 3,89,000
Illustration - 9:
A contractor commenced a building contract on October 1, 2009. The contract price is Rs. 4,40,000. Thefollowing data pertaining to the contract for the year 2010-2011 has been compiled from his books and isas under:
Rs.
April 1, 2010 Work-in-progress not certified 55,000
Materials at site 2000
2010-11 Expenses incurred:
Materials issued 1,12,00
Wages paid 1,08,000
Hire of plant 20,000
Other expenses 34,000
March 31, 2011 Materials at site 4,000
Work-in-progress: Not certified 8,000
Work-in-progress : Certified 4,05,000
The cash received represents 80% of work certified. It has been estimated that further costs to completethe contract will be Rs. 23,000 including the materials at site as on March 31, 2011.
Contract A/c (1-4-2010 to 30-9-2011) Particulars Rs. Particulars Rs. To Materials issued (7,76,250+12,99,375)
20,75,625 By Materials at site By Plant returned to stone on
42,500
To Labour (5,17,500-37,500 + 12,500 + 6,18,750+37,500-12,500 + 5,750)
11,42,000 30.9.2010 (1,0 0,000 -12,500)
To Plant purchased 4,00,000 By Plant returned to store on 30.9.11 (4,00,000-1,00,000- 1,03,125)
1,96,875
To Expenses (2,25,000+25,000-15,000+ 3,75,000 - 25,000 + 15,000 + 10,000)
6,10,000 By Contractee A/c 49,21,875
To Estimated profit 10,21,125 52,48,750 52,48.750

177
Required: Determine the profit on the contract for the year 2010-11 on prudent basis, which has to becredited to P/L A/c.
Solution :
Contract Account for the year 2010-11
Dr. Cr.
Particulars (Rs.) Particulars (Rs.)
1.4.2010To Work-in-progress (not certified) 55,000 By Material at site 4,000
To Materials at site 2,0002010-11
To Materials issued 1,12,000 By Cost of contract c/d (to date) 3,27,000To Wages paid 1,08,000To Hire of plant 20,000To Other expenses 34,000
3,31,000 3,31,00031.03.11
To cost of contract b/d 3,27,000 By Work certified 4,05,000(to date)To Profit & Loss A/c 66,273 By Work uncertified 8000To Profit in reserve 19,727
4,13,000 4,13,000
90000x80% 92.05% = 66273
Estimated profit (on the completion of the contract)
Rs.Cost of the contract (to date) 3,27,000Further cost of completing the contract Total cost: (A) 23,000Total cost: (A) 3,50,000Contract price: (B) 4,40,000Estimated profit on the completion of contract: {(A) - (B)} 90,000
Work certifiedSince 100Contract p r ice
= 92.05% 100000,40,4.Rs000.05.4.Rs
Illustration - 10:
A construction company under-taking a number of contracts, furnished the following data relating to itsuncompleted contracts as on March, 2011 :

178
(Rs. in Lacs) Contract Numbers723 726 729 731
Total Contract Price 23.20 14.40 10.08 28.80Estimated Costs on completion of contract 20.50 11.52 12.60 21.60Expenses for the year ended 31.3.2011 :Direct Materials 5.22 1.80 1.98 0.80Direct Wages 2.32 4.32 3.90 2.16Overheads (Excluding Depreciation) 1.06 2.60 2.62 1.05Profit Reserve as on 1.4.2010 1.50 — — —Plant issued at Cost 5.00 3.50 2.75 3.00Materials at Site on 1.4.2010 0.75 — — —Materials at Site on 31.3.2011 0.45 0.20 0.08 0.05Work Certified till 31.3.2010 4.65 — — —Work Certified during the year 2010-11 12.76 13.26 7.56 4.32Work Uncertified as on 31.3.2011 0.84 0.24 0.14 0.18Progress payments received during the year 9.57 9.0 5.75 3.60
Depreciation @ 20% per annum is to be charged on plant issued. While the Contract No. 723 was carriedover from last year, the remaining contracts were started in the 1st week of April, 2010. Required :
(i) Determine the profit/loss in respect of each contract for the year ended 31st March, 2011.(ii) State the profit/loss to be carried to Profit & Loss A/c for the year ended 31st March, 2011.
Solution:
(i) Statement of Profit/Loss in respect of following contract numbers for the year ended 31stMarch, 2011
(Rs.in lacs)Contract Numbers
723 726 729 731
A. Contract completion percentage:Work certified: (a) 17.41 13.26 7.56 4.32Contract price: (b) 23.20 14.40 10.08 28.80Percentage of completion : [(a) - (b)] 75.04 92.08 75.00 15.00
B. Estimated profit on completion:Contract price: (c) 23.20 14.40 10.08 28.80Estimated costs on completion : (d) 20.50 11.52 12.60 21.60Estimated profit (loss) on completion : [(c) - (d)]2.70 2.88 (2.52) 7.20
C. Profit of the year:Op. stock of materials 0.75 — — —Materials issued 5.22 1.80 1.98 0.80Direct wages 2.32 4.32 3.90 2.16Overheads 1.06 2.60 2.62 1.05Depreciation 1.00 0.70 0.55 0.60Total: (P) 10.35 9.42 9.05 4.61

179
Profit in reserve 1.50 — — —Material at site on 31/3/2011 0.45 0.20 0.08 0.05
Total: (Q) 1.95 0.20 0.08 0.05
Cost of contract: (R) = [(P) - (Q)] 8.40 9.22 8.97 4.56
Work certified 12.76 13.26 7.56 4.32
Work not certified 0.84 0.24 0.14 0.18
Total: (S) 13.60 13.50 7.70 4.50
Profit (loss) for the year [(R) - (S)] 5.20 4.28 (1.27) (0.06)
(ii) Profit to be taken to Profit & Loss Account of the year in respect of respective contract
2 Cash receivedContact 723 Notionalprofit3 Work certified
reserve. tolacs 2.60 Rs. Balance
lacs 2.60 Rs.76.1257.920.5
32
Contract 729 =Provide for current loss of Rs. 1.27 lacs
= Provide for expected loss of Rs. 1.25 lacs
Contract 731 = Provide for current loss of Rs. 0.06 lacs
11.15 Summary
Contract Costing
Accounts maintained as per contract wise.
Some computation of profit are main point so profit computation is as follow :
the case of incomplete contracts, the following four situations may arise:(i) Completion of contract is less than 25 per cent: No profit should be taken to profit and loss
account.(ii) Completion of contract is up to 25 per cent or more than 25 per cent but less than 50 percent:
receivedWork receivedCash Profit Notional
31
(iii) Completion of contract is up to 50 per cent or more than 50 per cent but less than 90 percent:2 Cash receivedNotional Profit3 Work received
(iv) Completion of contract is up to 90 per cent or more than 90 per cent i.e. it is nearing completion:
(a)Cash receivedEstimated Pr ofitContract Price

180
11.16 Self Assessment Questions
1. What is Contract Account? How it is prepared? Give a specimen of such an account using imaginaryfigures.
2. Explain the nature and use of batch costing. Describe the concept of the economical batch with thehelp of any suitable example.
3. Why is a portion of profit on uncompleted contracts transferred to the profit and loss account?How would you determine the amount of profit to be transferred to the profit and loss account?
4. What is mean by Contract Costing Method? Where is it used? Discuss in brief the variousitems appearing in debit and credit side of Contract Account.
Numeric Questions
5. A Contractor, who prepared his accounts on 31st March each year, commenced a contractNo. 119 on 1st July, 2009. The information at 31st March, 2010 are as under:
Materials charged out to site 2,51,000
Labour 5,65,600
Foreman 81,300
A machine costing Rs. 2,60,000 has been on the site for 146 days. Its working life is estimatedat 7 years and its final scrap value at Rs. 15,000. A supervisor, who is paid Rs. 8,000 permonth, has devoted approximately one half of his time to this contract. All other expenses andadministration amount to Rs. 1,36,500. Material in hand at site on 31st March, 2010 cost Rs.35,400. The contract price is Rs. 20,00,000. On 31st March, 2010 two-third of the con-tractwas completed; architect’s certificates had been issued covering 50% of the contract priceand Rs. 7,50,000 had so far been paid . on account and state how much profit or loss shouldbe included in financial accounts to 31st March, 2010.
[Ans. Work uncertified Rs. 2,62,250, Total Profit Rs. 2,13,250, P. & L. a/c Rs. 1,06,625. ]
6. Contractors Ltd. having an authorised capital of Rs. 2,00,000 f divided in 500 12% PreferenceShares of Rs. 200 each and 5,000 Equity Shares of Rs. 20 each, commenced business on 1stJanuary, 2010. During this year, they were engaged in one Cinema Building Contract, the contractprice of which was Rs. 8,00!,000. The trial balance as on 31st December, 2010 was as follows:
(a) received WorkcertifiedWork Profit Estimated
(b) certifiedWork receivedCash
iceCont ractprcertifiedWork Profit Estimated
OR
iceContractpr
receivedCash Profit Estimated
(c) cost totaldEstimatedate work toofCost Profit Estimated
(d) cert ifiedWork receivedCash
cost totalEstimateddate work toofCost Profit Estimated
(e) iceContractpr
certifiedWork Profit Estimated
Work certifiedNotionalprofitContract price

181
Share Capital : Rs. Rs.
400 Preference Shares fully paid 80,000
5,000 Equity Shares, Rs. 16 paid up 80,000
Sundry Creditors 16,000
Land and Building at cost 68,000
Cash at Bank 18,000
Cinema Building Contract Account :
Materials 1,60,000
Plant 30,000
Wages 2,10,000
Expenses 10,000
Cash received (80% of work certified) 3,20,000
4,96,000 4,96,000
Of the plant and materials charged to the contract, plant costing Rs. 4,000 and materials costing Rs.3,900 were destroyed in an accident. On 31st December, 2010 plant costing Rs. 8,000 was returnedto stores. The value of materials on site was Rs. 8,000 and the cost of work done but not certifiedwas Rs. 4,000. Charge 10% depreciation on plant, carry to the Profit and Loss account two-thirdof profit and prepare the contract account for the year, 2010 and also the Balance Sheet as on thatdate.
[Ans. Total Profit Rs. 33,300, Profit to P. & L. ale Rs. 17,760, W.I.P. Rs. 3,88,460, BISTotal Rs. 1,85,860, N.P. 17,760- 7,900 = 9,860.]
7. Mr. Rakesh undertook a contract to build a Bungalow for a contract price of Rs. 3,00,000. At theend of first year, contract account stands debited with the value of materials issued, wages andoverhead incurred. It stands credited with materials at site Rs. 5,000 and the plant at site Rs.80,000 after charging depreciation at 20%. The net cost of the contract is Rs. 1,65,000. The ratioof materials, labour and overheads is 7: 4:1. Two-third of the contract has been certified of which80% was received by cheques. It is informed that 2/3rd of the Notional Profit on cash basis creditedto Profit and Loss a/c is Rs. 32,000. Prepare the Contract account as it would appear at the end offirst year giving full details and show the cost of work uncertified. Also prepare Work-in-Progressaccount.
[Ans. Cost of material, labour and overhead Rs. 1,50,000. National Profit Rs. 60,000.]
8. Modern Construction (Private) Limited undertook a contract for the construction of a Bridge on1st January, 2010. The following balances were revealed from the costing records in respect of thatcontract:
Materials at site Rs. 75,000, Plant at site Rs. 1,80,000, work certified for Rs. 18,00,000 of which80% was received by cheques. Cost of work uncertified was Rs. 3,00,000 and Profit reserved forfuture contingencies was Rs. 1,05,000. During this year the following further expenses were incurred:

182
Materials Rs. 2,40,000, Wages Rs. 3,20,000. Wages accrued on 1st January, 2010 were Rs.15,000 and on 31st December, 2010 Rs. 21,000. Administration expenses paid Rs. 84,000,which includes Rs. 3,000 for the last year. At end of the year, materials in hand was worth Rs.10,500. Depreciation on plant be provided at 10% per annum. Materials costing Rs. 8,300 wasfound unsuitable for the contract and was sold for Rs. 7,900. Work certified during the year for 18lakhs. Cost of work uncertified was Rs. 11,000. Contract price of this contract is Rs. 40 lakhs.Prepare Bridge Contract Account for the year ended 31st December, 2010 and what profit betaken to Profit & Loss a/c? U.N.V.U., 2000]
[Ans. Profit Rs. 8,94,800, Profit to P.& L. ale. Rs. 4,77,227.]
9. Mr. Mehta undertook a contract for Rs. 1,35,000 which took 13 weeks in its completion.From the following details prepare Contract account and Contractee’s account assuming theamount due from the contractee to be received:
Rs. Rs.
Direct materials 30,375 Tractor expenses:
Direct wages 23,250 Fuel etc. 3,450
Stores issued 15,750 Driver’s wages 4,500
Loose tools 3,600 Other expenses 3,975
The value of loose tools and stores returned at the end of the period were Rs. 300 and Rs.4,500 respectively. The Plant was also returned at the value of Rs. 24,000 after chargingdepreciation at 20%. The value of Tractor was Rs. 30,000 on which depreciation @ 15% perannum was to be charged. The administration and office expenses are to be provided at 20%on works cost.
[Ans. Works Cost Rs. 87,225, T.C. Rs. 1,04,670, Profit Rs. 30,330.]
10. From the following data relating to a contract extracted from the books of a company preparecontract account as on 31st March, 2010. Also compute the profit and the value of work-in-progress for preparing the final accounts :
Rs. Rs.
Materials issued 90,000 Work certified 1,76,000
Wages paid 50,000 Work uncertified 9,000
Plant issued 75,000 Amount received 1,58,400
Supervisor’s Salary 5,500 Contract price 3,00,000
You are further informed that : (i) Work commenced on 1st October, 2009, (ii) Wages ofworkers for one week and salary of the supervise;} staff for one month were due at the end ofthe period, (iii) Depreciation to be charged @ 10% per annum on Plant; (iv) Materials at siteon 31st March, 2010 was Rs. 4,200
[Ans. Total Profit Rs. 36,850, Profit to P. & L. ale Rs. 22,110, W.I.P. Rs. 1,70,260.]
11. The contract ledger of M/s. Lucky Engineers reveals the following details for four years:
Years : I II III IV
Rs. Rs. Rs. Rs.
Materials 47,000 80,000 2,50,000 50,000

183
Wages 50,000 1,00,000 2,00,000 80,000
Overhead 4,000 5,000 16,800 2,300
Work uncertified 10,000 30,000 40,000 -
Work certified during the year 1,00,000 2,00,000 5,00,000 2,00,000
Capital equipment at the commencement of the contract was Rs. 50,000 and at end it wasvalued at Rs. 40,000, contract price was Rs. 10 lakhs and 90% of the work certified wasreceived in cash, balance was received on completion of the contract. Show contractaccount and Work-in-Progress account for four years.
[Ans; Profit to P. & L. ale : (i) Nil; (ii) Rs. 11,700; (Hi) Rs. 40,800; v) Rs. 52,400.]
12. Mr. Lucky a contractor completed the contract of constructing a Bungalow in two years. Theexpenses incurred by him in the first year were:
Rs.
Material 80,000
Wages 40,000
Other expenses 12,000
Plant issued 1,00,000
Depreciation on plant 1 0% on original value
Work certified 60% of contract price
Work uncertified Nil
In the second year, cost of materials and labour expenses were more than 10% of first yearand other expenses remains the same as that of the first year. Mr. Lucky made a profit of 20%on contract price. Ascertain the contract price and prepare contract account for two yearsseparately showing profit to be credited to profit and loss account assuming that he received90% of the work certified as an advance from the contractee.
[Ans. Profit to P. & L. ale (1) Rs. 48,000, (II) Rs. 26,000] (P-135) Calculation of TenderPrice
11.17 Reference Books
- K.L. Narang and Jain, SP, ‘Cost Accounting’, Kalyani Publisher, New Delhi.- Tulsian PC, ‘Practical Costing’, Vikas Publisher, New Delhi- Maheswari S.N., ‘Advance Problem and Solutions in Cost Accounting’, Sultanchand and Sons,
New Delhi- Arora M.N., ‘Cost Accounting Principle and Practice’, Vikas Publisher, New Delhi- Maheswari and Mittal, ‘Cost Accounting’ Mahaveer Prakashan, New Delhi- Oswal and Maheswari, ‘Cost Accounting’ Ramesh Book Depot, Jaipur (Raj.)- Agarwal M.L., ‘Cost Accouating’, Sahitya Bhawan Publisher, Agra ( UP)- Khan M.Y. and P.K., ‘Management Accounting’, Tata Mcgraw hill Publisher, New Delhi- Horngren, Charles, Foster and Data, ‘Cost Accounting - A Managerial Emphasis’, Prentice Hall of
India, New Delhi- Jain, Khendelwal and Pareekh, ‘Cost Accounting’, Ajmer Book Company, Jaipur
184
Unit - 12 : Process Costing
Structure of Unit:
12.0 Objectives12.1 Introduction12.2 Meaning of Process Costing12.3 Basic Features12.4 Costing Procedure12.5 Operation Costing12.6 Treatment of Normal Process Loss, Abnormal Process Loss and Abnormal Gain12.7 Costing of Equivalent Production Units12.8 Valuation of Work-in-Progress12.9 Joint Products and By-Products12.10 Apportionment of Joint Costs12.11 Suggested Production Plan for Maximising Profits12.12 Summary12.13 Self Assessment Questions12.14 Reference Books
12.0 Objectives
After studying this chapter, you should be able to: Understand the meaning of Process and Operation costing. Understand and differentiate between Joint and By-products. Understand the accounting treatment required for normal and abnormal process losses. Understand the treatment for abnormal gain. Understand the accounting treatment required for joint products and by products.
12.1 IntroductionProcess costing is used where the production moves from one process or department to next, until its finalcompletion. There is a continuous production of identical units through a series of processing operations.Process in a check entity of an industrial unit in which specific work is done through the various well definedstages of production. This method of costing is used to know the cost of product in each process. Astandard product passes through various stages of production called as processes.
12.2 Meaning of Process Costing
Process Costing is a method of costing used in industries where the material has, to pass through two ormore processes for being converted into a final product. It is defined as “a method of Cost Accountingwhereby costs are charged to processes or operations and averaged over units produced”. A separateaccount for each process is opened and all expenditure pertaining to a process is charged to that processaccount. Such type of costing method is useful in the manufacturing of products like steel, paper, medicinessoap, chemicals, rubber, vegetable oil, paints, varnish etc. where the production process is continuous andthe output of one process becomes the input of the following process till completion.

185
12.3 Basic Features
Industries, where process costing can be applied, have normally one or more of the following features:
1. Each plant or factory is divided into a number of processes, cost centres or departments, and eachsuch division is a stage of production or a process.
2. Manufacturing activity is carried on continuously by means of one or more process run sequentially,selectively or parallel.
3. The output of one process becomes the input of another process.
4. The end product usually is of like units not distinguishable from one another.
5. It is not possible to trace the identity of any particular lot of output to any lot of input materials. Forexample, in the sugar industry, it is impossible to trace any lot of sugar bags to a particular lot ofsugarcane fed or vs. versa.
6. Production of a product may give rise to Joint and/or By-Products.
12.4 Costing Procedure
The Cost of each process comprises the cost of;(i) Materials (ii) Labour(iii) Direct expenses, and (iv) Overheads of production.
(i) Materials: Materials and supplies which are required for each process are drawn againstmaterial requisitions from stores. Each process for which the above drawn materials will beused should be debited with the cost of materials consumed on the basis of the informationreceived from the Cost Accounting department. The finished product of first process generallybecome the raw materials of second process; under such a situation the account of secondprocess, be debited with the cost of transfer from the first process and the cost of any additionalmaterial required under this second process.
(ii) Labour: Each process account should be debited with the labour cost or wages paid tolabour for carrying out the processing activities. Sometimes the wages paid are apportionedover the different processes after selecting appropriate basis.
(iii) Direct Expenses: Each process account should be debited with direct expenses like depreciation,repairs, maintenance, insurance etc. associated with it.
(iv) Overheads Related to Production: Expenses like rent, power expenses, lighting bills, gas andwater bills etc. are known as production overheads. These expenses cannot be allocated to aprocess. The suitable way-out to recover them is to apportion them over different processes byusing suitable basis. Usually, these expenses are estimated in advance and the processes debitedwith these expenses on a pre-determined basis.
12.5 Operation Costing
It is defined as the refinement of process costing. It is concerned with the determination of the cost of eachoperation rather than the process. In those industries where a process consists of distinct operations, themethod of costing applied or used is called operation costing. Operation costing offers better scope forcontrol. It facilitates the computation of unit operation cost at the end of each operation by dividing the totaloperation cost by total output units.

186
Illustration - 1:
From the following data, prepare process accounts indicating the cost of each process and the total cost.The total units that pass through each process were 240 for the period.
Process A Process B Process C Rs. Rs. Rs. Materials 1,500 500 200 Labour 800 2,000 600 Other expenses 260 720 250 Indirect expenses amounting to Rs. 850 may be apportioned on the basis of wages. There was no opening or closing stock. Solution:
Process 'A' Account Dr. Cr.
Per unit Total Per unit
Total
Rs. Rs. Rs. Rs. To Material 6.25 1,500 By Transfer to " Labour 3.34 800 Process 'B A/c 11.50 2,760 " Other expenses 1.08 260 " Indirect expenses 0.83 200 11.50 2,760 11.50 2,760
Process 'B' Account Dr. Cr. Per unit Total Per
unit Total
Rs. Rs. Rs. Rs. To be transferred By Transfer to from Process 'A' A/c 11.50 2,760 Process 'C A/c 27.00 6,480 " Materials 2.08 500 " Labour 8.34 2,000 " Other expenses 3.00 720 " Indirect expenses 2.08 500 27.00 6,480 27.00 6,480
Process 'C' Account Dr. Cr. Per unit Total Per
unit Total
Rs. Rs. Rs. Rs. To be transferred By Finished stock from Process 'B' A/c 27.00 6,480 A/c transfer 32.00 7,680 " Materials 0.83 200 " Labour 2.54 600 " Other expenses 1.04 250 " Indirect expenses 0.59 150 32.00 7,680 32.00 7,680
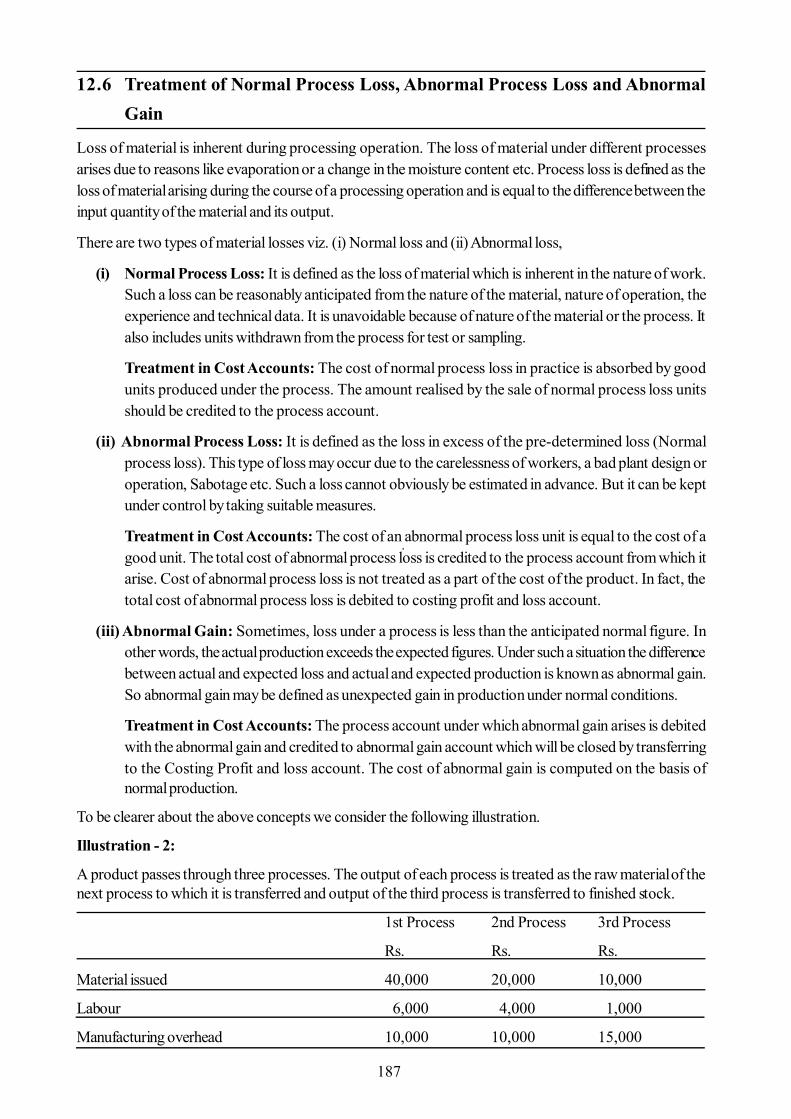
187
12.6 Treatment of Normal Process Loss, Abnormal Process Loss and AbnormalGain
Loss of material is inherent during processing operation. The loss of material under different processesarises due to reasons like evaporation or a change in the moisture content etc. Process loss is defined as theloss of material arising during the course of a processing operation and is equal to the difference between theinput quantity of the material and its output.
There are two types of material losses viz. (i) Normal loss and (ii) Abnormal loss,
(i) Normal Process Loss: It is defined as the loss of material which is inherent in the nature of work.Such a loss can be reasonably anticipated from the nature of the material, nature of operation, theexperience and technical data. It is unavoidable because of nature of the material or the process. Italso includes units withdrawn from the process for test or sampling.
Treatment in Cost Accounts: The cost of normal process loss in practice is absorbed by goodunits produced under the process. The amount realised by the sale of normal process loss unitsshould be credited to the process account.
(ii) Abnormal Process Loss: It is defined as the loss in excess of the pre-determined loss (Normalprocess loss). This type of loss may occur due to the carelessness of workers, a bad plant design oroperation, Sabotage etc. Such a loss cannot obviously be estimated in advance. But it can be keptunder control by taking suitable measures.
Treatment in Cost Accounts: The cost of an abnormal process loss unit is equal to the cost of agood unit. The total cost of abnormal process loss is credited to the process account from which itarise. Cost of abnormal process loss is not treated as a part of the cost of the product. In fact, thetotal cost of abnormal process loss is debited to costing profit and loss account.
(iii) Abnormal Gain: Sometimes, loss under a process is less than the anticipated normal figure. Inother words, the actual production exceeds the expected figures. Under such a situation the differencebetween actual and expected loss and actual and expected production is known as abnormal gain.So abnormal gain may be defined as unexpected gain in production under normal conditions.
Treatment in Cost Accounts: The process account under which abnormal gain arises is debitedwith the abnormal gain and credited to abnormal gain account which will be closed by transferringto the Costing Profit and loss account. The cost of abnormal gain is computed on the basis ofnormal production.
To be clearer about the above concepts we consider the following illustration.
Illustration - 2:
A product passes through three processes. The output of each process is treated as the raw material of thenext process to which it is transferred and output of the third process is transferred to finished stock.
1st Process 2nd Process 3rd Process
Rs. Rs. Rs.
Material issued 40,000 20,000 10,000
Labour 6,000 4,000 1,000
Manufacturing overhead 10,000 10,000 15,000

188
10,000 units have been issued to the 1st process and after processing, the output of each process is as under:
Output Normal Loss Process No. 1 9,750 units 2%
Process No. 2 9,400 units 5% Process No. 3 8,000 units 10%
No stock of materials or of work-in-progress was left at the end. Calculate the cost of the finished articles.
Solution : Process No. 1 Account
Units Rs. Units Rs. To Material 10,000 40,000 By Normal wastage 200 " Labour 6,000 " Abnormal wastage 50 286 " Overhead 10,000 (cost per unit,
Rs. 5.714) " Process No. 2 9,750 55,714
(Transfer of completed units)
10,000 56,000 10,000 56,000
Note : The cost of the abnormal wastage :
Normal Output = 10,000 units-200 units = 9,800 units
Cost per unit of normal output = Rs. 56,000 + 9,800 units = Rs. 5.714
Cost of 50 units = Rs. 5.714 x 50 = Rs. 286
Process No. 2 Account
Units Rs. Units Rs.
To Process No. 1 9,750 55,714 By Normal wastage 488 -
" Materials 20,000 (5% of 9,750)
" Labour 4,000 " Process No. 3 9,400 91,051
" Overhead 10,000 (cost per unit Rs. 9.686)
" Abnormal gain @ Rs. 9.686
138 1,337
9,888 91,051 9,888 91,051
Note : The cost per unit is obtained by dividing Rs. 89,714 by 9,262 units, i.e., 9,750 units less 488 units.
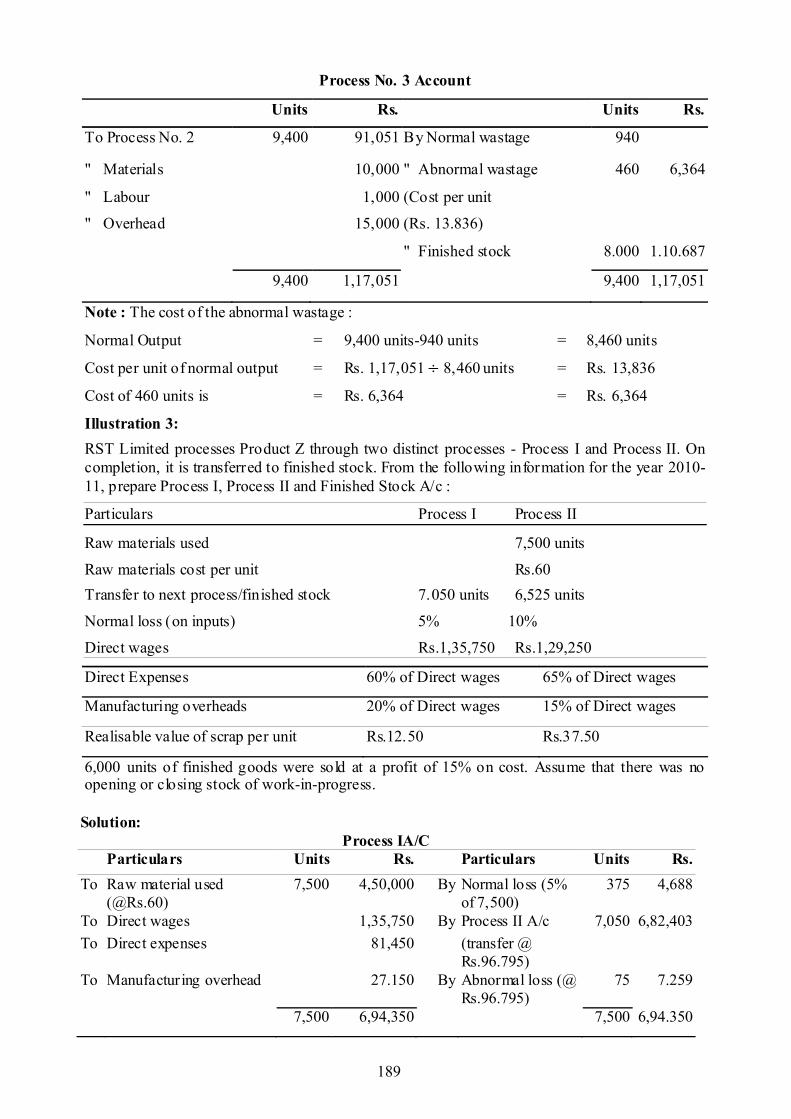
189
Process No. 3 Account
Units Rs. Units Rs.
To Process No. 2 9,400 91,051 By Normal wastage 940
" Materials 10,000 " Abnormal wastage 460 6,364
" Labour 1,000 (Cost per unit
" Overhead 15,000 (Rs. 13.836)
" Finished stock 8.000 1.10.687
9,400 1,17,051 9,400 1,17,051
Note : The cost of the abnormal wastage :
Normal Output = 9,400 units-940 units = 8,460 units
Cost per unit of normal output = Rs. 1,17,051 ÷ 8,460 units = Rs. 13,836
Cost of 460 units is = Rs. 6,364 = Rs. 6,364
Illustration 3: RST Limited processes Product Z through two distinct processes - Process I and Process II. On completion, it is transferred to finished stock. From the following information for the year 2010-11, prepare Process I, Process II and Finished Stock A/c :
Particulars Process I Process II
Raw materials used 7,500 units
Raw materials cost per unit Rs.60 Transfer to next process/finished stock 7.050 units 6,525 units
Normal loss (on inputs) 5% 10%
Direct wages Rs.1,35,750 Rs.1,29,250
Direct Expenses 60% of Direct wages 65% of Direct wages
Manufacturing overheads 20% of Direct wages 15% of Direct wages
Realisable value of scrap per unit Rs.12.50 Rs.37.50
6,000 units of finished goods were sold at a profit of 15% on cost. Assume that there was no opening or closing stock of work-in-progress.
Solution: Process IA/C
Particulars Units Rs. Particulars Units Rs. To Raw material used
(@Rs.60) 7,500 4,50,000 By Normal loss (5%
of 7,500) 375 4,688
To Direct wages 1,35,750 By Process II A/c 7,050 6,82,403 To Direct expenses 81,450 (transfer @
Rs.96.795)
To Manufacturing overhead 27.150 By Abnormal loss (@ Rs.96.795)
75 7.259
7,500 6,94,350 7,500 6,94.350

190
12.7 Costing of Equivalent Production Units
In the case of process type of industries, it is possible to determine the average cost per unit by dividing the
Transfer price in Process IA/C
= Rs.694,350-Rs.4,688
= Rs.6,89,662
= Rs. 96.795 p.u.
7,500units - 375 units 7125 units
Process II A/c Particulars Units Rs. Particulars Units Rs. To Process I A/c
(transfer @ Rs.96.795) 7,050 6,82,403 By Normal loss
(10% of 7,050 units)
705 26,438
To Direct wages 1,29,250 By Finished Stock A/c (transfer® Rs.140.05)
6,525 9,13,825
To Direct expenses 84,013 To Manufacturing overhead 19,387 To Abnormal gain
(@ Rs.140.05) 180 25,210
7,230 9,40,263 7,230 9,40,263
Transfer price in Process IA/C
= Rs.9,15,053-Rs.26,438
= Rs.8,88,615
= Rs. 140.05 p.u. 7,050 units - 705 units 6345 units
Finished Goods Stock A/c
Particulars Units Rs. Particulars Units Rs.
To Process II A/c (transfer @Rs.140.05)
6,525 9,13,825 By By
Cost of sales Balance c/d
6,000 525
8,40,300 73,525
6,525 9,13,825 6,525 9,13.825
Income Statement
Particulars Rs. Particulars Rs.
To Cost of sales (6,000 units @ Rs.140.05)
8,40,300 By Abnormal gain Process II A/c -180 units (Rs.140.05-Rs.37.50)
18,459
To Abnormal loss Process 1-75 units (Rs. 96.795-Rs.12.50)
6322
To Net Profit 1,38,197 By Sales (6,000 units @ Rs.1,61.06)
9,66,360
9,84,819 9,84,819
191
total cost incurred during a given period of time by the total number of units produced during the sameperiod. But this is hardly the case in most of the process type industries where manufacturing is a continuousactivity. The reason is that the cost incurred in such industries represents the cost of work carried onopening work-in-progress, closing work-in-progress and completed units. Thus to ascertain the cost ofeach completed unit it is necessary to ascertain the cost of work-in-progress in the beginning and at the endof the process.
The valuation of work-in-progress presents a good deal of difficulty because it has units under differentstages of completion from those in which work has just begun to those which are only a step short ofcompletion. Work-in-progress can be valued on actual basis, i.e., materials used on the unfinished units andthe actual amount of labour expenses involved. However, the degree of accuracy in such a case cannot besatisfactory. An alternative method is based on converting partly finished units into equivalent finished units.
Equivalent production means converting the incomplete production units into their equivalent completedunits. Under each process, an estimate is made of the percentage completion of work-in-progress withregard to different elements of costs, viz., material, labour and overheads. It is important that the estimate ofpercentage of completion should be as accurate as possible. The formula for computing equivalent completedunits is:
Equivalent completed units
= {Actual number of units in the process of manufacture} * {Percentage of work completed}
For instance, if 25% of work has been done on the average of units still under process, then 200 such unitswill be equal to 50 completed units and the cost of work-in-progress will be equal to the cost of 50 finishedunits.
12.8 Valuation of Work-in-Progress
(1) First-in-First Out (FIFO) method.
(2) Last-in-First Out (LIFO) method.
(3) Average Cost Method (or weighted average cost method).
(1) First-in-First-Out Method
Under this method the units completed and transferred include completed units of opening work-in-progressand subsequently introduced units. Proportionate cost to complete the opening work-in-progress and thatto process the completely processed units during the period are derived separately. The cost of openingwork-in-progress is added to the proportionate cost incurred on completing the same to get the completecost of such units. Complete cost of such units plus cost of units completely processed constitute the totalcost of units transferred. In this method the closing stock of Work in progress is valued at current cost.
Illustration - 4:
Opening work-in-progress 1,000 units (60% complete); Cost Rs. 1,100. Units introduced during the period10,000 units; Cost Rs. 19,300. Transferred to next process - 9,000 units.
Closing work-in-progress - 800 units (75% complete). Normal loss is estimated at 10% of total inputincluding units in process at the beginning. Scrap realise Re. 1 per unit. Scrapped are 100% complete.

192
Compute equivalent production and cost per equivalent unit. Also evaluate the output.
(2) Last-in First-Out Method
According to this method units lastly entering in the process are the first to be completed. This assumptionhas a different impact on the costs of the completed units and the closing inventory of work-in-progress.The completed units will be shown at their current cost and the closing inventory of work-in-progress willcontinue to appear at the cost of the opening inventory of work-in-progress.
Illustration - 5:
From the following information relating to the month of April 06, calculate the equivalent production unitsand the value of finished production and work-in-progress, using the LIFO method.
Solution:
FIFO Method Statement of equivalent production and cost per unit
Input Output Equivalent Production
Particulars units Particulars units % of work done during
current period
Equivalent units
Op. work-in-process 1,000 Op. WIP: Completed 1,000 40 400 Units introduced 10,000 Completed 8,000 100 8,000 Normal loss 1,100 - - Closing work-in-process 800 75 600
Abnormal loss 100 100 100 11,000 9,100
Cost of the Process (for the period) Rs. 19,300 Less: Scrap value of normal loss Rs. 1.100
Cost per equivalent unit Rs. 18,200 9,100 units = Rs. 2
Statement of Evaluation
Particulars Equivalent units
Cost per equi-valent unit
Amount
Rs. Rs. 1. Opening WIP completed 400 2.00 800 Add : Cost of opening WIP - - 1,100 Complet e Cost of 1,000 units of Op. WIP 1,000 1.90 1,900 2. Complet ely processed units 8,000 2.00 16,000 3. Abnormal loss 100 2.00 200 4. Closing WIP 600 2.00 1,200
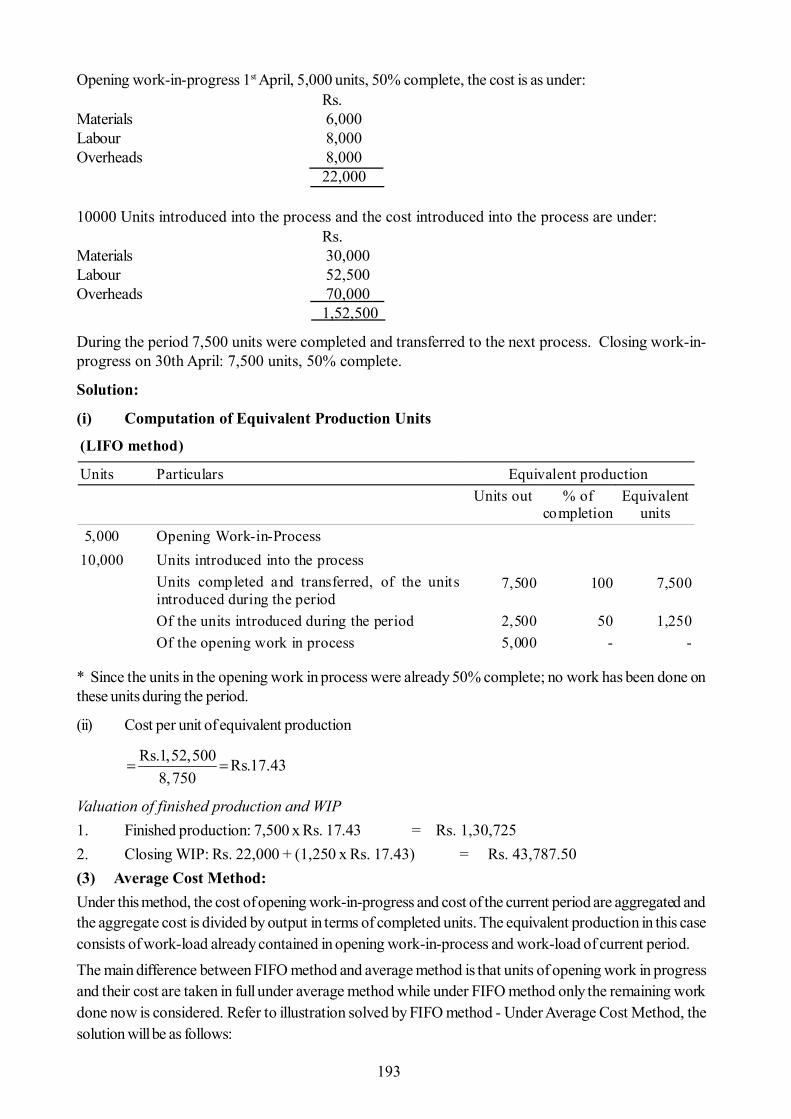
193
Opening work-in-progress 1st April, 5,000 units, 50% complete, the cost is as under:Rs.
Materials 6,000Labour 8,000Overheads 8,000
22,000
10000 Units introduced into the process and the cost introduced into the process are under:Rs.
Materials 30,000Labour 52,500Overheads 70,000
1,52,500
During the period 7,500 units were completed and transferred to the next process. Closing work-in-progress on 30th April: 7,500 units, 50% complete.
Solution:
(i) Computation of Equivalent Production Units
* Since the units in the opening work in process were already 50% complete; no work has been done onthese units during the period.
(ii) Cost per unit of equivalent production
Rs.1,52,500 Rs.17.438,750
Valuation of finished production and WIP1. Finished production: 7,500 x Rs. 17.43 = Rs. 1,30,7252. Closing WIP: Rs. 22,000 + (1,250 x Rs. 17.43) = Rs. 43,787.50(3) Average Cost Method:Under this method, the cost of opening work-in-progress and cost of the current period are aggregated andthe aggregate cost is divided by output in terms of completed units. The equivalent production in this caseconsists of work-load already contained in opening work-in-process and work-load of current period.The main difference between FIFO method and average method is that units of opening work in progressand their cost are taken in full under average method while under FIFO method only the remaining workdone now is considered. Refer to illustration solved by FIFO method - Under Average Cost Method, thesolution will be as follows:
(LIFO method)
Units Particulars Equivalent production Units out % of
completion Equivalent
units 5,000 Opening Work-in-Process 10,000 Units introduced into the process
Units completed and transferred, of the units introduced during the period
7,500 100 7,500
Of the units introduced during the period 2,500 50 1,250 Of the opening work in process 5,000 - -

194
Solution:Statement of Equivalent Production and Cost per unit
Illustration - 6:Following information is available regarding process A for the month of February, 2011:
Output Units Equivalent Percentage
Production units
Transferred to Next Process 9,000 100 9,000 Normal Loss 1,100 - - Abnormal Loss 100 100 100 Closing work-in-process 800 75 600 9,700 Costs: Rs.
Opening Work-in-Process 1,100 Cost of units introduced 19,300 20,400 Less: Scrap value realised on normal loss 1,100 19,300 Cost per equivalent unit - Rs. 19,300 + 9,700 units = Rs. 1.99 (approx.)
Statement of Evaluation Particulars Equivalent
units Cost per
equivalent unit (Rs.)
Amount (Rs.)
1. Transferred to next process 9,000 1.99 17,910 2. Abnormal loss 100 1.99 199 3. Closing Work-in-process 600 1.99 1,194 19,303
Production Record Units Units in process as on 1.2.2011 4,000 (All materials used, 25% complete for labour and overhead) New units introduced 16,000 Units completed 14,000 Units in process as on 28.2.2011 6,000 (All materials used, 33-1/3% complete for labour and overhead) Cost Records Work-in-process as on 1.2.2011 Rs. Materials 6,000 Labour 1,000 Overhead 1,000
8,000 Cost during the month Materials 25,600 Labour 15,000
Overhead 15,000 55,600

195
Presuming that average method of inventory is used, prepare:(i) Statement of equivalent production.(ii) Statement showing cost for each element.(iii) Statement of apportionment of cost.(iv) Process cost account for process A.
Solution:
(i) Statement of equivalent production: (Average cost method) Particulars
Input (units)
Output Units Materials Labour Overhead % Completion Equivalent
units % Completion Equivalent
units % CompletionEquivalent
units 20,000Completed14,000 100 14,000 100 14,000 100 6,000
WIP 6,000 100 6,000 33-1/3 2,000 33-1/3 2,000 20,000 20,000 20,000 16,000 16,000
(ii) Statement showing cost for each element: Particulars Materials Labour Overhead Total Cost of opening work-in-progress (Rs.) 6,000 1,000 1,000 8,000 Cost incurred during the month (Rs.) 25,600 15,000 15,000 55,600
Total cost (Rs.) : (A) 31,600 16,000 16,000 63,600 Equivalent units : (B) 20,000 16,000 16,000 Cost per equivalent unit (Rs.): 1.58 1 1 3.58 (iii) Statement of apportionment of cost: Rs. Rs. Value of output transferred : (a) 14,000 units @ Rs. 3.58 50,120 Value of closing work-in-progress : (b) Materials 6,000 units® 1.58 9,480 Labour 2,000 units @ Re. 1 2,000 Overhead 2,000 units @ Re. 1 2.000 13,480
Total cost: (a + b) 63,600 (iv) Process cost account for process A:
Process A Cost Account Dr. Cr. Units Rs. Units Rs. To Opening WIP 4,000 8,000 By Completed units 14,000 50,120 To Materials 16,000 25,600 By Closing WIP 6,000 13,480 To Labour 15.000 To Overhead 15,000 20,000 63,600 20,000 63,600
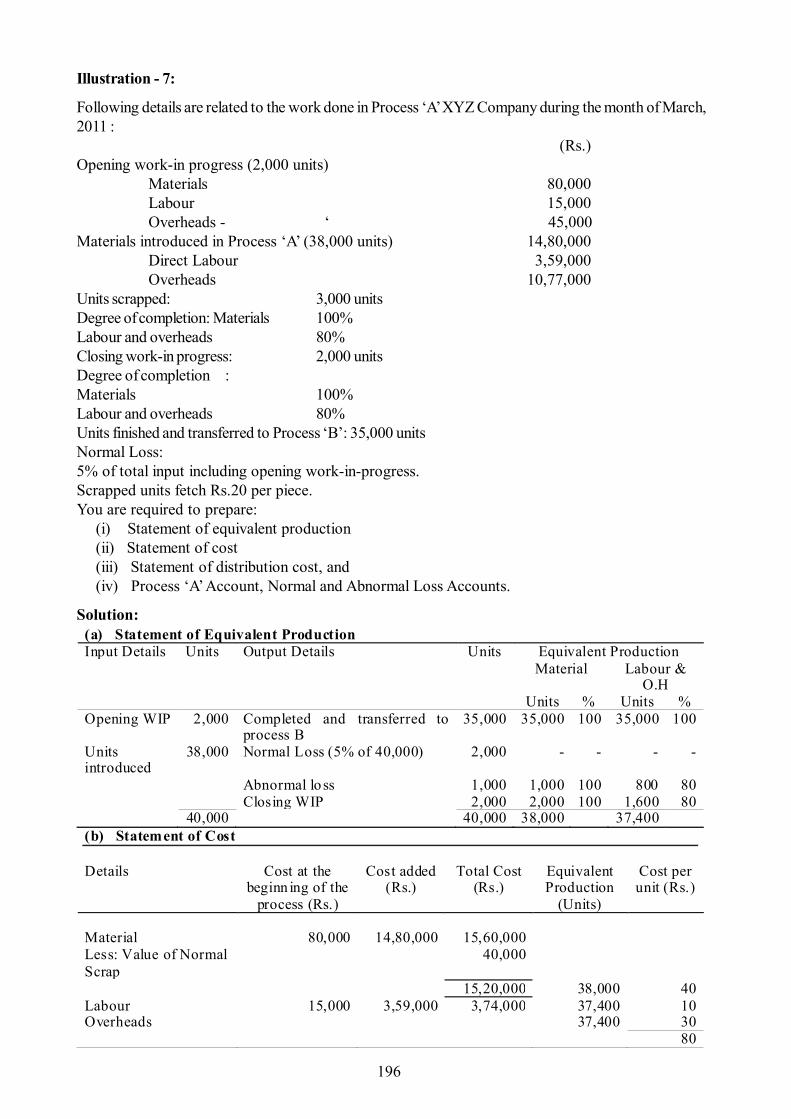
196
Illustration - 7:
Following details are related to the work done in Process ‘A’ XYZ Company during the month of March,2011 :
(Rs.)Opening work-in progress (2,000 units)
Materials 80,000Labour 15,000Overheads - ‘ 45,000
Materials introduced in Process ‘A’ (38,000 units) 14,80,000Direct Labour 3,59,000Overheads 10,77,000
Units scrapped: 3,000 unitsDegree of completion: Materials 100%Labour and overheads 80%Closing work-in progress: 2,000 unitsDegree of completion :Materials 100%Labour and overheads 80%Units finished and transferred to Process ‘B’: 35,000 unitsNormal Loss:5% of total input including opening work-in-progress.Scrapped units fetch Rs.20 per piece.You are required to prepare:
(i) Statement of equivalent production(ii) Statement of cost(iii) Statement of distribution cost, and(iv) Process ‘A’ Account, Normal and Abnormal Loss Accounts.
Solution: (a) Statement of Equivalent Production Input Details Units Output Details Units Equivalent Production Material Labour &
O.H Units % Units % Opening WIP 2,000 Completed and transferred to
process B 35,000 35,000 100 35,000 100
Units introduced
38,000 Normal Loss (5% of 40,000) 2,000 - - - -
Abnormal lo ss 1,000 1,000 100 800 80 Closing WIP 2,000 2,000 100 1,600 80 40,000 40,000 38,000 37,400 (b) Statement of Cost Details Cost at the
beginn ing of the process (Rs.)
Cost added (Rs.)
Total Cost (Rs.)
Equivalent Production
(Units)
Cost per unit (Rs.)
Material
80,000
14,80,000
15,60,000
Less: Value of Normal Scrap
40,000
15,20,000 38,000 40 Labour 15,000 3,59,000 3,74,000 37,400 10 Overheads 37,400 30 80
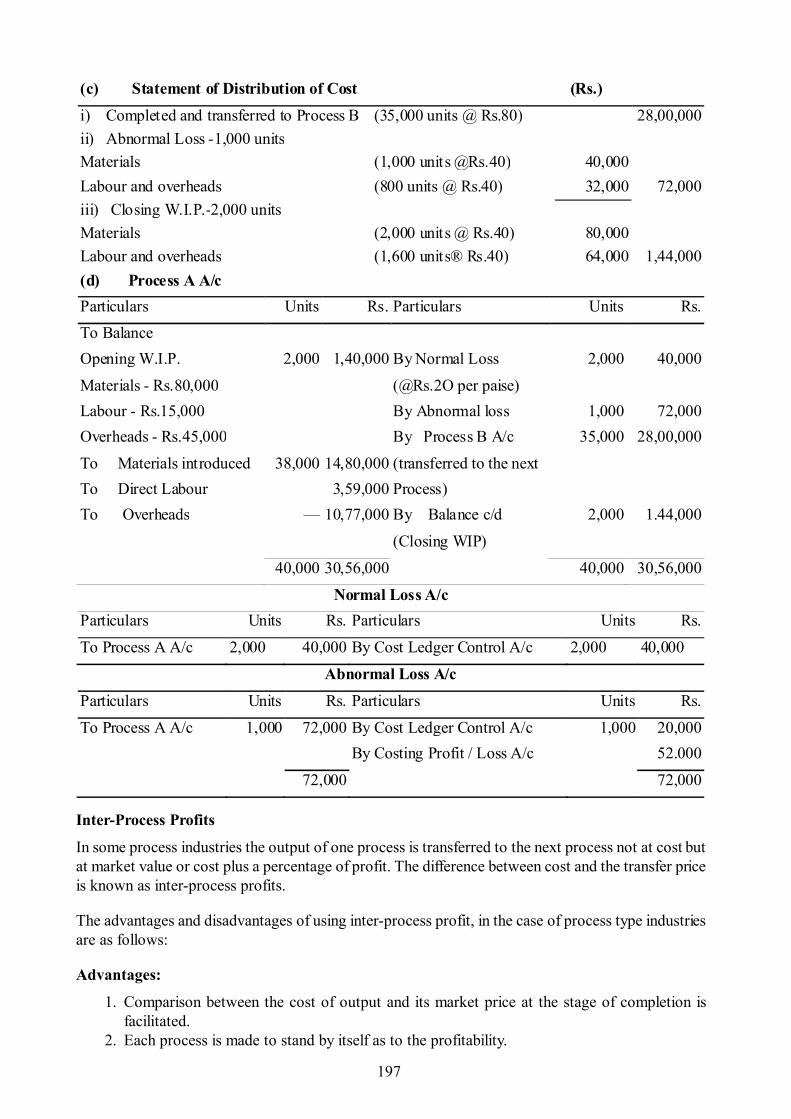
197
(c) Statement of Distribution of Cost (Rs.) i) Completed and transferred to Process B (35,000 units @ Rs.80) 28,00,000 ii) Abnormal Loss -1,000 units Materials (1,000 units @Rs.40) 40,000 Labour and overheads (800 units @ Rs.40) 32,000 72,000 iii) Closing W.I.P.-2,000 units Materials (2,000 units @ Rs.40) 80,000 Labour and overheads (1,600 units® Rs.40) 64,000 1,44,000 (d) Process A A/c Particulars Units Rs. Particulars Units Rs. To Balance Opening W.I.P. 2,000 1,40,000 By Normal Loss 2,000 40,000
Materials - Rs.80,000 (@Rs.2O per paise) Labour - Rs.15,000 By Abnormal loss 1,000 72,000 Overheads - Rs.45,000 By Process B A/c 35,000 28,00,000
To Materials introduced 38,000 14,80,000 (transferred to the next To Direct Labour 3,59,000 Process) To Overheads — 10,77,000 By Balance c/d 2,000 1.44,000
(Closing WIP)
40,000 30,56,000 40,000 30,56,000
Normal Loss A/c Particulars Units Rs. Particulars Units Rs.
To Process A A/c 2,000 40,000 By Cost Ledger Control A/c 2,000 40,000
Abnormal Loss A/c Particulars Units Rs. Particulars Units Rs.
To Process A A/c 1,000 72,000 By Cost Ledger Control A/c 1,000 20,000 By Costing Profit / Loss A/c 52.000
72,000 72,000
Inter-Process Profits
In some process industries the output of one process is transferred to the next process not at cost butat market value or cost plus a percentage of profit. The difference between cost and the transfer priceis known as inter-process profits.
The advantages and disadvantages of using inter-process profit, in the case of process type industriesare as follows:
Advantages:
1. Comparison between the cost of output and its market price at the stage of completion isfacilitated.
2. Each process is made to stand by itself as to the profitability.
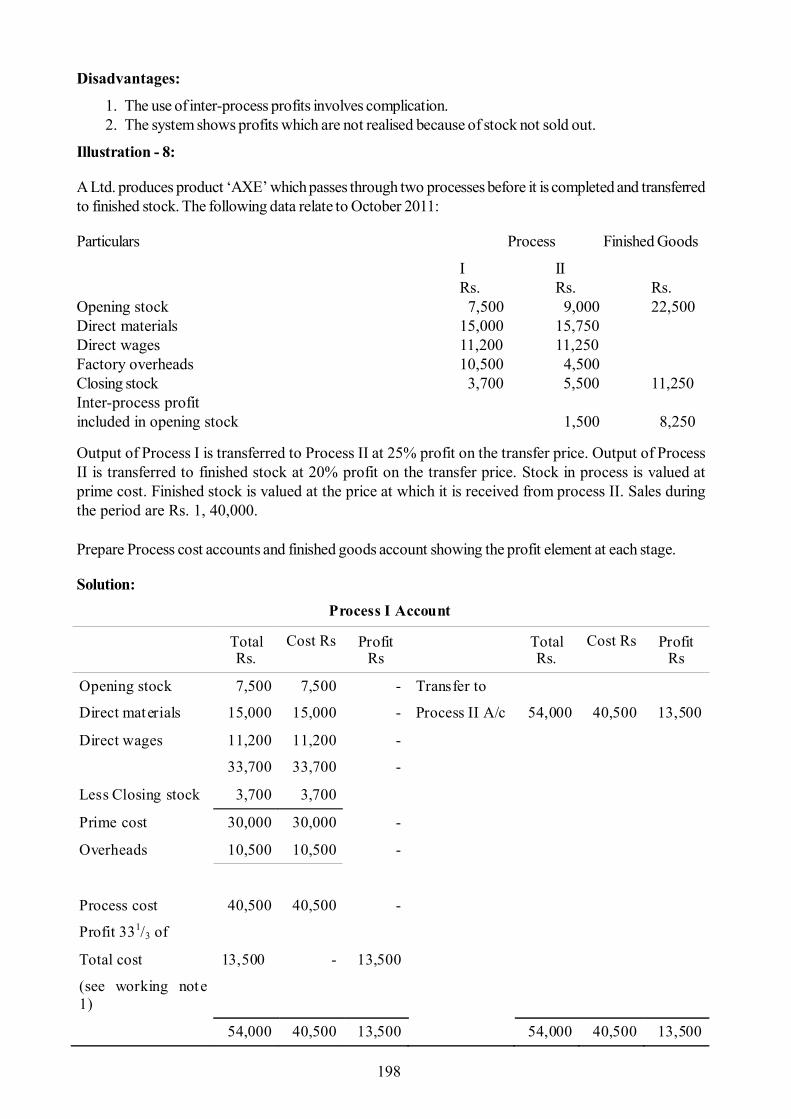
198
Disadvantages:
1. The use of inter-process profits involves complication.2. The system shows profits which are not realised because of stock not sold out.
Illustration - 8:
A Ltd. produces product ‘AXE’ which passes through two processes before it is completed and transferredto finished stock. The following data relate to October 2011:
Particulars Process Finished Goods
I IIRs. Rs. Rs.
Opening stock 7,500 9,000 22,500Direct materials 15,000 15,750Direct wages 11,200 11,250Factory overheads 10,500 4,500Closing stock 3,700 5,500 11,250Inter-process profitincluded in opening stock 1,500 8,250
Output of Process I is transferred to Process II at 25% profit on the transfer price. Output of ProcessII is transferred to finished stock at 20% profit on the transfer price. Stock in process is valued atprime cost. Finished stock is valued at the price at which it is received from process II. Sales duringthe period are Rs. 1, 40,000.
Prepare Process cost accounts and finished goods account showing the profit element at each stage.
Solution:Process I Account
Total Rs.
Cost Rs Profit Rs
Total Rs.
Cost Rs Profit Rs
Opening stock 7,500 7,500 - Transfer to
Direct materials 15,000 15,000 - Process II A/c 54,000 40,500 13,500
Direct wages 11,200 11,200 -
33,700 33,700 -
Less Closing stock 3,700 3,700
Prime cost 30,000 30,000 -
Overheads 10,500 10,500 -
Process cost 40,500 40,500 -
Profit 331/3 of
Total cost 13,500 - 13,500
(see working note 1)
54,000 40,500 13,500 54,000 40,500 13,500

199
Process II Account
Total Rs. Cost Rs
Profit Rs
Total Rs.
Cost Rs
Profit Rs
Opening stock 9,000
7,500
1,500
Transfer to
Transferred from finished 1,12,500 75,750 36,750
Process I 54,000 40,500 13,500 stock A/c
Direct materials 15,750 15,750 —
Direct wages 11,250 11,250
90,000 75,000 15,000
Less: Closing Stock
5,500 3,750 750
Prime Cost 84,500 71,250 14,250
Overheads 4,500 4,500 —
Process Cost 90,000 75,750 14,250
Profit 25% on total cost (See working note 2)
22,500 - 22,500
1,12,500 75,750 36,750 1,12,500 75,750 36,750
(Finished Stock Account)
Total Rs.
Cost Rs
Profit Rs
Total Rs.
Cost Rs
Profit Rs
Opening stock 22,500 14,250 8,250 Sales 1,40,000 82,500 57,500
Transferred from
Process II 1,12,500 75,750 36,750
1,35,000 90,000 45,000
Less: Closing stock
11,250 7,500 3,750
Finished stock : Cost 1,23,750 82,500 41,250
Profit 16,250 — 16,250
1,40,000 82,500 57,500 1.40,000 82,500 57,500

200
Working Notes:
Let the transfer price be 100 then profit is 25; i.e. cost price is Rs.75.1. If cost is Rs. 75 then profit is Rs. 25
If cost is Rs. 40,500 then profit is 500,407525
= Rs. 13,500
2. If cost is Rs. 80 then profit is Rs. 20
If cost is Rs. 90,000 then profit is 000,908020
= Rs. 22,500
12.9 Joint Products and By-Products
Meaning of Joint Products and By-Products
Agricultural product industries, chemical process industries, sugar industries, and extractive industries aresome of the industries where two or more products of equal or unequal importance are produced eithersimultaneously or in the course of processing operation of a main product.
In all such industries, the management is faced with the problems such as, valuation of inventory, pricing ofproduct and income determination, problem of taking decision in matters of further processing of by-productsand/or joint products after a certain stage etc. In fact the various problems relate to
(i) Apportionment of common costs incurred for various products and(ii)Aspects other than mere apportionment of costs incurred up to the point of separation. Before
taking up the above problems, we first define the various necessary concepts.
Joint Products - Joint products represent “two or more products separated in the course of the sameprocessing operation usually requiring further processing, each product being in such proportion thatno single product can be designated as a major product”.
In other words, two or more products of equal importance, produced, simultaneously from the sameprocess, with each having a significant relative sale value are known as joint products. For example,in the oil industry, gasoline, fuel oil, lubricants, paraffin, coal tar, asphalt and kerosene are all producedfrom crude petroleum. These are known as joint products.
Co-Products - Joint products and co-products are used synonymously in common parlance, butstrictly speaking a distinction can be made between two. Co-products may be defined as two or moreproducts which are contemporary but do not emerge necessarily from the same material in the sameprocess. For instance, wheat and gram produced in two separate farms with separate processing ofcultivation are the co-products. Similarly timber boards made from different trees are co-products.
By-Products - These are defined as “products recovered from material discarded in a main process,or from the production of some major products, where the material value is to be considered at thetime of severance from the main product.” Thus by-products emerge as a result of processing operationof another product or they are produced from the scrap or waste of materials of a process. In short aby-product is a secondary or subsidiary product which emanates as a result of manufacture of themain product.
The point at which they are separated from the main product or products is known as split-off point. Theexpenses of processing are joint till the split-off point.

201
Examples of by-products are molasses in the manufacture of sugar, tar, ammonia and benzene obtained oncarbonisation of coal and glycerine obtained in the manufacture of soap.
Distinction between Joint-Product and By-Product - The main points of distinction as apparent fromthe definitions of Joint Products and By-Products are :
a) Joint products are of equal importance whereas by-products are of small economic value.b) Joint products are produced simultaneously but the by-products are produced incidentally in addition
to the main products.
12.10 Apportionment of Joint Costs
Joint product costs occur in many industries such as : petroleum, oil refinery, meat-making, textiles, dairy,flour mill, saw mill and many other process industries and top management of business concerns require theAccountants to give their opinion for many managerial decisions such as to process further or to sell at split-off stage. To answer this question they require apportionment of joint costs over different products produced.
The main problem faced in the case of joint products/by-products is the apportionment of the total costincurred up to the point of separation of joint products/or by products. For costs incurred after the split offpoint there is no problem, as these costs can be directly allocated to individual joint products or by-products.Thus the apportionmesnt of joint costs over different products produced involves the following two cases.
1. When two or more products are simultaneously produced and there is by-product.2. When there are both joint products and by-products.
Method of apportioning joint cost over joint products
Proper apportionment of joint cost over the Joint Products is of considerable importance, as this affects (a)Valuation of closing inventory; (b) Pricing of products; and (c) Profit or loss on the sale of different products.
The commonly used methods for apportioning total process costs up to the point of separation over thejoint products are as follows :
(i) Physical Unit Method(ii) Average Unit Cost Method(iii) Survey Method(iv) Contribution Margin Method(v) Market Value Method:
(a) At the Point of Separation(b) After Further Processing(c) Net Realisable Value,
(i) Physical Unit Method
This method is based on the assumption that the joint products are capable of being measured in the sameunits. Accordingly joint costs here are apportioned on the basis of some physical base, such as weight ormeasure expressed in gallons, tonnes etc. In other words, the basis used for apportioning joint cost over thejoint products is the physical volume of material present in the joint products at the point of separation. Anyloss arising during the stage of processing is also apportioned over the products on the same basis. Thismethod cannot be applied if the physical units of the two joint products are different. The main defect of thismethod is that it gives equal importance and value to all the joint products.
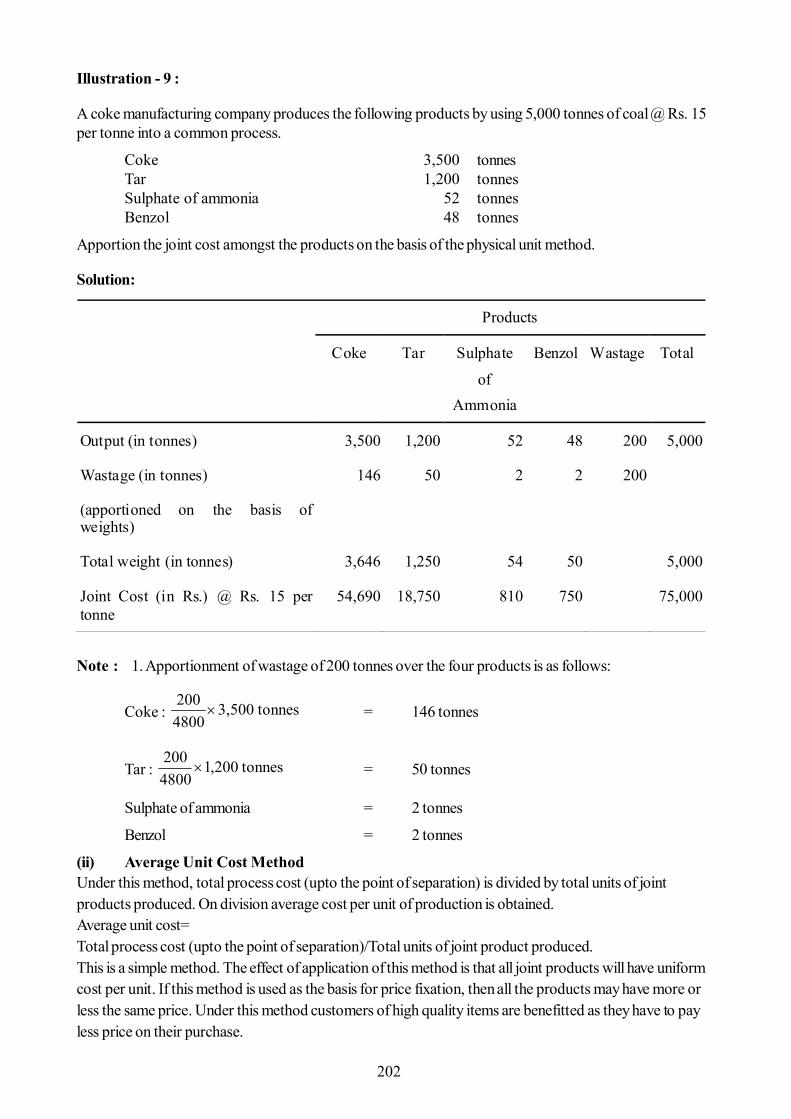
202
Illustration - 9 :
A coke manufacturing company produces the following products by using 5,000 tonnes of coal @ Rs. 15per tonne into a common process.
Coke 3,500 tonnesTar 1,200 tonnesSulphate of ammonia 52 tonnesBenzol 48 tonnes
Apportion the joint cost amongst the products on the basis of the physical unit method.
Solution:
Note : 1. Apportionment of wastage of 200 tonnes over the four products is as follows:
Coke : tonnes3,5004800200
= 146 tonnes
Tar : tonnes,20014800200
= 50 tonnes
Sulphate of ammonia = 2 tonnes
Benzol = 2 tonnes
(ii) Average Unit Cost MethodUnder this method, total process cost (upto the point of separation) is divided by total units of jointproducts produced. On division average cost per unit of production is obtained.Average unit cost=Total process cost (upto the point of separation)/Total units of joint product produced.This is a simple method. The effect of application of this method is that all joint products will have uniformcost per unit. If this method is used as the basis for price fixation, then all the products may have more orless the same price. Under this method customers of high quality items are benefitted as they have to payless price on their purchase.
Products
Coke Tar Sulphate
of Ammonia
Benzol Wastage Total
Output (in tonnes) 3,500 1,200 52 48 200 5,000
Wastage (in tonnes) 146 50 2 2 200
(apportioned on the basis of weights)
Total weight (in tonnes) 3,646 1,250 54 50 5,000
Joint Cost (in Rs.) @ Rs. 15 per tonne
54,690 18,750 810 750 75,000
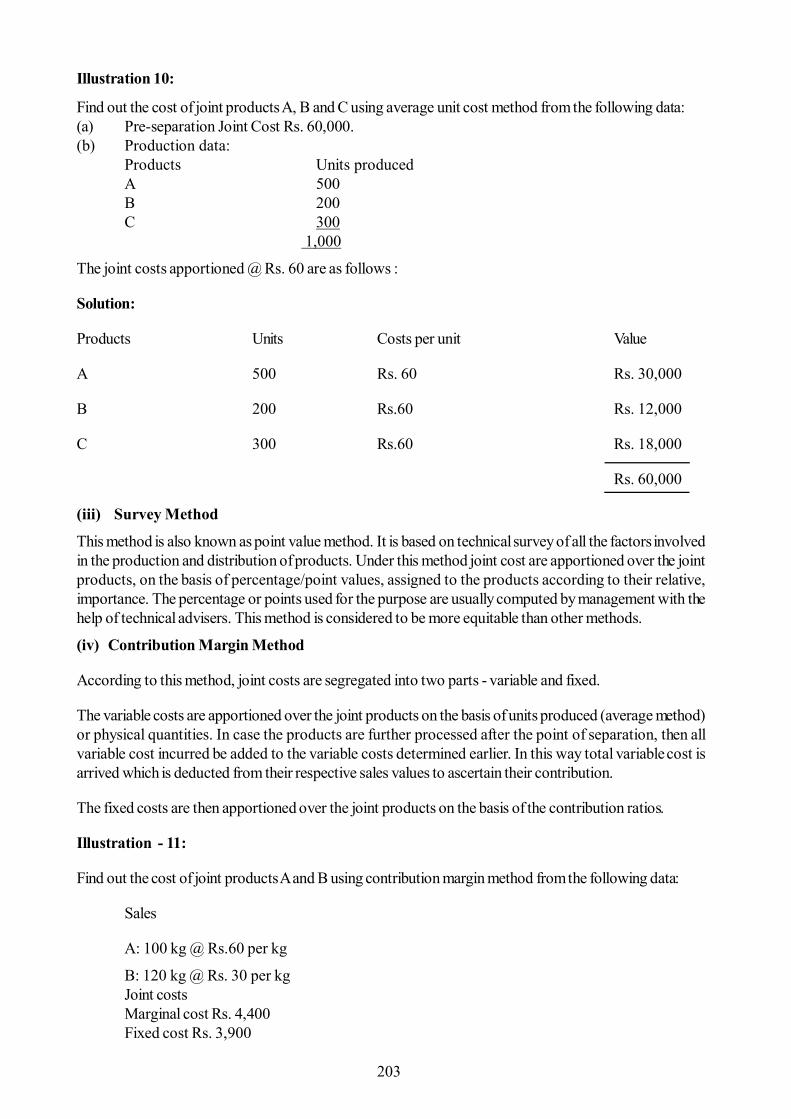
203
Illustration 10:
Find out the cost of joint products A, B and C using average unit cost method from the following data:(a) Pre-separation Joint Cost Rs. 60,000.(b) Production data:
Products Units producedA 500B 200C 300
1,000
The joint costs apportioned @ Rs. 60 are as follows :
Solution:
Products Units Costs per unit Value
A 500 Rs. 60 Rs. 30,000
B 200 Rs.60 Rs. 12,000
C 300 Rs.60 Rs. 18,000
Rs. 60,000
(iii) Survey Method
This method is also known as point value method. It is based on technical survey of all the factors involvedin the production and distribution of products. Under this method joint cost are apportioned over the jointproducts, on the basis of percentage/point values, assigned to the products according to their relative,importance. The percentage or points used for the purpose are usually computed by management with thehelp of technical advisers. This method is considered to be more equitable than other methods.
(iv) Contribution Margin Method
According to this method, joint costs are segregated into two parts - variable and fixed.
The variable costs are apportioned over the joint products on the basis of units produced (average method)or physical quantities. In case the products are further processed after the point of separation, then allvariable cost incurred be added to the variable costs determined earlier. In this way total variable cost isarrived which is deducted from their respective sales values to ascertain their contribution.
The fixed costs are then apportioned over the joint products on the basis of the contribution ratios.
Illustration - 11:
Find out the cost of joint products A and B using contribution margin method from the following data:
Sales
A: 100 kg @ Rs.60 per kg
B: 120 kg @ Rs. 30 per kgJoint costsMarginal cost Rs. 4,400Fixed cost Rs. 3,900
204
Solution:
The marginal cost (variable cost) of Rs. 4,400 is apportioned over the joint products A and B in the ratioof their physical quantity i.e 100 :120
Marginal cost for Product A:100Rs.440220
= Rs. 2,000
Marginal cost for Product B : 2201204,400 Rs. = Rs. 2,400
The fixed cost of Rs. 3,900 is apportioned over the joint products A and B in the ratio of theircontribution margin i.e. 40:12(Refer to working note)
Product A : Rs. 3,900 x 40/52 = Rs. 3,000Product B : Rs. 3,900 x 12/52 = Rs. 900
Working Note:
Computation of contribution margin ratioProducts Sales revenue Marginal cost Contribution
(Rs.) (Rs.) (Rs.)
A 6,000 2,000 4,000
B 3,600 2,400 1200
(Refer to above)
Contribution ratio is 40 :12
(v) Market Value Method
This is the most popular and convenient method because it makes use of a realistic basis for apportioningjoint costs. Under this method joint costs are apportioned after ascertaining “what the traffic can bear”. Inother words, the products are made to bear a proportion of the joint cost on the basis of their ability toabsorb the same. Market value means weighted market value i.e. units produced price of a unit of jointproduct.
(a) Market Value at the Point of Separation: This method is used for the apportionment of joint coststo joint products upto the split off point. It is difficult to apply this method if the market value of the productsat the point of separation are not available. It is a useful method where further processing costs are incurreddisproportionately.
To determine the apportionment of joint costs over joint products, a factor known as multiplying factor isdetermined. This multiplying factor on multiplication with the sales values of each joint product gives rise tothe proportion of joint cost. For example, a concern incurs a joint cost of Rs. 64,500 in producing twoproducts A (200 units), B (200 units) and earns a sales revenue of Rs. 86,000 by selling @ Rs. 170 per unitof product A and B @ Rs. 260 per unit of product B. The multiplying factor in this case is obtained bydividing the total joint cost by total sales revenue and finally multiplying the figure so obtained by 100. Themultiplying factor based on the data can be computed as follows:

205
Multiplying factor: 10086,000 Rs.64,000 Rs.
= 75%
Joint cost apportioned over product A = Sales revenue of product A x 75%= Rs. 34,000 75%= Rs. 25,500
Joint cost apportioned over product B = Sales revenue of product B x 75%= Rs. 52,000 x 75%= Rs. 39,000
Alternatively - This joint cost may be apportioned in the ratio of sales values of different joint products.
(b) Market Value after Processing: Here the basis of apportionment of joint cost is the total sales valueof finished products and involves the same principle as discussed in (a) above. Suppose that in the examplegiven in Part (a) above, if sales prices of products A and B after further processing is Rs. 200 and Rs. 300respectively the joint cost apportioned over Products A and B is as follows :
The pre-separation costs of Rs. 64,500 will be apportioned in the ratio of (2 : 3) as follows: Market salesvalue after further processing
Rs.
A : 200 units * Rs. 200 = 40,000
B : 200 units * Rs. 300 = 60,000
1,00,000
Joint Cost apportioned :
A = 25,800 Rs. 1,00,000 Rs.40,000 Rs.64,500 Rs.
B = 38,700 Rs. 1,00,000 Rs.60,000 Rs.64,500 Rs.
The use of this method is unfair where further processing costs after the point of separation aredisproportionate or when all the joint products are not subjected to further processing. The net realisablevalue method which is discussed as below overcomes the shortcoming of this method.
(c) Net Realisable Value Method: From the sales value of the joint products (at finished stage) arededucted :
(i) estimated profit margins,
(ii) selling and distribution expenses, if any, and
(iii) post-split off costs.The resultant figure so obtained is known as net realisable value of joint products. Joint costs are apportionedin the ratio of net realisable value. Suppose that in the example given in part (a) above if further processingcosts for products A and B are Rs. 4,000 and Rs. 32,000 respectively the Joint cost may be apportioned toproducts A and B as follows:

206
Joint cost apportioned over product A = Rs. 64,500 x 3/5 = Rs. 38,700
Joint cost apportioned over product B = Rs. 64,500 x 2/5 = Rs. 25,800
This method is extensively used in many industries.
Illustration - 12:
Inorganic Chemicals purchases salt and processes it into more refined products such as Caustic Soda,Chlorine and PVC. In the month of July, Inorganic Chemicals purchased Salt for Rs. 40,000. Conversion ofRs. 60,000 was incurred up to the split off point, at which time two sealable products were produced.Chlorine can be further processed into PVC.
The July production and sales information is as follows:
Production(tonnes) Sales quantity(tonnes) Selling price(per tonnes)
Caustic Soda 1,200 1,200 Rs. 50
Chlorine 800 — —
PVC 500 500 Rs. 200
All 800 tonnes of Chlorine were further processed, at an incremental cost of Rs. 20,000 to yield 500 tonnesof PVC. There was no beginning or ending inventories of Caustic Soda, Chlorine or PVC in July.
There is active market for Chlorine. Inorganic Chemicals could have sold all its July production of Chlorineat Rs. 75 per tonne.
Required:
(1) To calculate how joint cost of Rs. 1,00,000 would be apportioned between Caustic Soda andChlorine under each of following methods :(a) Sales value at split off,(b) Physical measure (method), and(c) Estimated net realisable value.
(2) Lifetime Swimming Pool Products offers to purchase 800 tonnes of Chlorine in August at Rs. 75per tonne. This sale of Chlorine would mean that no PVC would be produced in August. How theacceptance of this offer for the month of August would affect operating income?
Products Sales revenue (Rs.)
Further processing cost (Rs.)
Net realisable value (Rs.)
Joint cost apportioned
ratio
(a) (b) (c)=(a)-(b)
A 34,000 4,000 30,000 3/5
B 52,000 32,000 20,000 2/5

207
Solution :
(a) Sales value at split off method
Products Sales inSelling price Sales Joint Cost Apportioned*
tonnes per tonne (Rs.) revenue (Rs.) (Rs.)
(a) (b) (c)=(a) x (b)Caustic Soda 1,200 50 60,000 50,000Chlorine 800 75 60,000 50,000
1,20,000 1,00,000
Apportioned joint cost = Total jo int cos t sale revenueof each productTotalsale value
Joint cost apportioned to Caustic Soda = 50,000 Rs. 60,000 Rs. 0Rs.1,20,000Rs.1,00,00
Joint cost apportioned to Chlorine = 50,000 Rs. 60,000 Rs. 0Rs.1,20,000Rs.1,00,00
(b) Physical measure method
Products Sale in (tonnes) Joint cost apportioned **
Caustic Soda Chlorine 1,200 60,000 800 40,0002,000 1,00,000
**Apportioned joint cost =
producteach of units Physical valuephysical Totacostjoint Total
Joint cost apportioned to Caustic Soda = Rs.1,00,000 1,200 tones Rs.60,000
2,000
Joint cost apportioned to Chlorine = Rs.1,00,000 800 tones Rs.40,000
2,000
(c) Estimated net realisable value methodProducts Sales inSelling price Sales Joint Cost Apportioned*
Tonnes Tonne (Rs.) revenue (Rs.) (Rs.)(a) (b) (c)=(a) - (b)
Caustic Soda 60,000 — 60,000 42,857
(1,200 tonnes x Rs. 50)Chlorine 1,00,000 20,000 80,000 57,143
(500 tonnes of PVC x Rs. 200)
1,40,000 1,00,000

208
**Apportioned joint cost =
producteach of valuerealisableNet valuerealisablenet Total
costjoint Total
Apportioned joint cost for Caustic = 857,42.Rs000,60.sR1,40,000 Rs.
0Rs.1,00,00
Apportioned joint cost for Chlorine = 143,57.Rs000,80.sR1,40,000 Rs.
0Rs.1,00,00
2. Incremental revenue from further
processing of Chlorine into PVC Rs. 40,000
(500 tonnes x Rs. 200 - 800 tonnes x Rs. 75)
Less: Incremental cost of further processing of Chlorine into PVC Rs. 20,000
Incremental operating income from further processing Rs. 20,000
The operating income of Inorganic Chemicals will be reduced by Rs. 20,000 in August if it sells 800 tonnesof Chlorine to Lifetime Swimming Pool Products, instead of further processing of Chlorine into PVC forsale.
Illustration - 13:
Sunmoon Ltd. produces 2,00,000 : 30,000; 25,000; 20,000 and 75,000 units of its five products A, B, C,D and E respectively in a manufacturing process and sells them at Rs. 17, Rs. 13, Rs. 8, Rs. 10 and Rs. 14per unit. Except product D remaining products can be further processed and then can be sold at Rs. 25, Rs.17, Rs. 12 and Rs. 20 per unit in case of A, B, C and E respectively.
Raw material costs Rs. 35,90,000 and other manufacturing expenses cost Rs. 5,47,000 in the manufacturingprocess which are absorbed on the products on the basis of their ‘Net realisable value’. The further processingcosts of A, B, C and E are Rs. 12, 50,000; Rs. 1,50,000; Rs. 50,000 and Rs. 1,50,000 respectively. Fixedcosts are Rs. 4,73,000.
You are required to prepare the following in respect of the coming year:
(a) Statement showing income forecast of the company assuming that none of its products are to befurther processed.
(b) Statement showing income forecast of the company assuming that products A, B, C and E are to beprocessed further.
Can you suggest any other production plan whereby the company can maximise its profits? If yes, thensubmit a statement showing income forecast arising out of adoption of that plan.Solution:
Working Note:Statement showing apportionment of joint costs on net realisable value basis

209
Products Sales value Post separation Net realisable Apportioned joint
value costs
(1)Rs. (2)Rs. (1)-(2)=(3)Rs. (4)Rs.
A 50,00,000 12,50,000 37,50,000 26,25,000(2,00,000 units * Rs. 25)
B 5,10,000 1,50,000 3,60,000 2,52,000(30,000 units xRs. 17)
C 3,00,000 50,000 2,50,000 1,75,000(25,000 units xRs. 12)
D 2,00,000 — 2,00,000 1,40,000(20,000 units * Rs. 10)
E 15,00,000 1,50,000 13,50,000 9,45,000(75,000 units * Rs. 20)
59,10,000 41,37,000
Total joint cost = Raw material costs + Manufacturing expenses
= Rs. 35,90,000 + Rs. 5,47,000 = Rs. 41,37,000
Apportioned joint cost = producteach of valuerealisableNet valuerealisablenet Total
costjoint Total
Apportioned joint cost for Product A = 000,25,26000,50,37.Rs59,10,000.Rs
00Rs.41,37,0
Similarly, the apportioned joint cost for products B, C, D and E are Rs. 2,52,000; Rs. 1,75,000; Rs.1,40,000 and Rs. 9,45,000 respectively.
(a) Statement showing income forecast of the company assuming that none of its productsare further processed
ProductsA B C D E TotalRs. Rs. Rs. Rs. Rs. Rs.
Sales revenue 34,00,000 3,90,000 2,00,000 2,00,000 10,50,000 52,40,000
(2,00,000 (30,000 (25,000 (20,000 (75,000units
Units x Units x Units x units * Units x
Rs. 17) Rs. 13) Rs. 8) Rs. 10) Rs. 14)
Less: Apportioned joint cost 26.25.000 2.52.000 1.75.000 1.40.000 9.45.000 41.37.000(Refer to working note)
Excess of revenue overjoint cost of manufacturing 7,75,000 1,38,000 25,000 60,000 1,05,000
11,03,000Less: Fixed cost 4,73,000Profit 6,30,000

210
(b) Statement showing income forecast of the company: assuming that products A, B, C andE are further processed (Refer to working note)
ProductsA B C D E TotalRs. Rs. Rs. Rs. Rs. Rs.
Sales revenue (X) 50,00,000 5,10,000 3,00,000 2,00,000 15,00,000 75,10,000
Apportioned joint cost: (Y) 26,25,000 2,52,000 1,75,000 1,40,000 9,45,000 41,37,000
Further processing cost: (Z) 12,50,000 1,50,000 50,000 — 1,50,000 16,00,000
Total manufacturing cost:
(K)=(Y)+(Z) 38,75,000 4,02,000 2,25,000 1,40,000 10,95,000 57,37,000
Excess of sales revenue
over total manufacturing 11,25,000 1,08,000 75,000 60,000 4,05,000 17,73,000cost: [(X)-(K)]Less: Fixed cost 4,73,000Profit 13,00,000
12.11 Suggested Production Plan for Maximising Profits
On comparing the figures of excess of revenue over cost of manufacturing in the above statements oneobserves that the concern is earning more after further processing of A, C and E products but is losing a sumof Rs. 30,000 in the case of product B (if it is processed further). Hence the best production plan will be tosell A, C and E after further processing and B and D at the point of split off. The profit statement based onthis suggested production plan is as below:
Profit statement based on suggested production plan
Products A B C D E Total Rs. Rs. Rs. Rs. Rs. Rs.
1 2 3 4 5 6 7
Sales revenue: (X) 50,00,000 3,90,000 3,00,000 2,00,000 15,00,000 73,90,000
Apportioned joint cost: (Y) 26,25,000 2,52,000 1,75,000 1,40,000 9,45,000 41,37,000Further processing 12,50,000 - 50,000 - 1,50,000 14,50,000cost: (Z)Total manufacturingcost: (K)=(Y)+(Z) 38,75,000 2,52,000 2,25,000 1,40,000 10,95,000 55,87,000Excess of sales revenueover manufacturing 11,25,000 1,38,000 75,000 60,000 4,05,000 18,03,000 cost[(X) - (K)]Less: Fixed cost 4,73,.000
Profit 13,30,000

211
Methods of apportioning joint cost over by-products
The following methods may be adopted for the accounting of by-products and arriving at the cost ofproduction of the main product:
(a) Market Value or Value on Realisation: The realisation on the disposal of the by-product may bededucted from the total cost of production so as to arrive at the cost of the main product. For example, theamount realised by the sale of molasses in a sugar factory goes to reduce the cost of sugar produced in thefactory.
When the by-product requires some additional processing and expenses are incurred in making it saleableto the best advantage of the concern, the expenses so incurred should be deducted from the total valuerealised from the sale of the by-product and only the net realisations should be deducted from the total costof production to arrive at the cost of production of the main product. Separate accounts should be maintainedfor collecting additional expenses incurred on:
(i) further processing of the by-product, and(ii)selling, distribution and administration expenses attributable to the by-product.
(b) Standard Cost in Technical Estimates: By-products may be valued at standard costs. The standardmay be determined by averaging costs recorded in the past and making technical estimates of the number ofunits of original raw material going into the main product and the number forming the by-product or byadopting some other consistent basis.
This method may be adopted where the by-product is not saleable in the condition in which it emerges orcomparative prices of similar products are not available.
(c) Comparative Price: Under this method, the value of the by-product is ascertained with reference tothe price of a similar or an alternative material.
Suppose in a large automobile plant a blast furnace not only produces the steel required for the car bodiesbut also produces gas which is utilised in the factory. This gas can be valued at the price which would havebeen paid to a gas company if the factory were to buy it from outside sources.
(d) Re-use Basis: In some cases the by-product may be of such a nature that it can be reprocessed in thesame process as part of the input of the process. In that case the value put on the by-product should besame as that of the materials introduced into the process. If, however, the by-product can be put into anearlier process only, the value should be the same as for the materials introduced into the process.
Treatment of By-Product Cost in Cost-Accounting
By-product cost can be dealt in cost accounting in the following ways:
(a) When They are of Small Total Value: When the by-products are of small total value, the amountrealised from their sale may be dealt in any one the following two ways :
1. The sales value of the by-products may be credited to the Profit and Loss Account and no credit begiven in the Cost Accounts. The credit to the Profit and Loss Account here is treated either asmiscellaneous income or as additional sales revenue.
2. The sale proceeds of the by-product may be treated as deductions from the total costs. The saleproceeds in fact should be deducted either from the production cost or from the cost of sales.

212
(b) When the By-Products are of Considerable Total Value: Where by-products are of considerabletotal value, they may be regarded as joint products rather than as by-products. To determine exact cost ofby-products the costs incurred upto the point of separation, should be apportioned over by-products andjoint products by using a logical basis. In this case, the joint costs may be divided over joint products andby-products by using relative market values; physical output method (at the point of split off) or ultimateselling prices (if sold).
(c) Where They Require Further Processing: In this case, the net realisable value of the by-product atthe split-off point may be arrived at by subtracting the further processing cost from the realisable value ofby-products.
If total sales value of by-products at split-off point is small, it may be treated as per the provisions discussedabove under (a).
In the contrary case, the amount realised from the sale of by-products will be considerable and thus it maybe treated as discussed under (b).
(Students must solve a large number of questions from process costing so as to acquire the required proficiencyin the area).
12.12 SummaryProcess Costing:- Used in industries where the material has to pass through two or more processes forbeing converted into a final product
Operation Costing:- It is the refinement of process costing. It is concerned with the determination of thecost of each operation rather than the process.
Treatment of Losses in process costing:-
(i) Normal process loss - The cost of normal process loss is absorbed by good units produced underthe process. The amount realised by the sale of normal process loss units should be credited to theprocess account.
(ii) Abnormal process loss - The total cost of abnormal process loss is credited to the processaccount from which it arise, the total cost of abnormal process loss is debited to costing profitand loss account.
Abnormal gain- The process account under which abnormal gain arises is debited with the abnormalgain and credited to Abnormal gain account which will be closed by transferring to the Costing Profitand loss account.
Equivalent production units: This concept use in the industries where manufacturing is a continuousactivity. Converting partly finished units into equivalent finished units.
Equivalent production means converting the incomplete production units into their equivalent completedunits.
Equivalent completed units = {Actual number of units in the process of manufacture} x{Percentage of work completed}
Valuation of work-in-progress : three methods:
(1) First-in-First Out (FIFO) method.

213
(2) Last-in-First Out (LIFO) method.
(3) Average Cost method (or weighted average cost method).
Inter-process Profits: The output of one process is transferred to the next process not at cost but atmarket value or cost plus a percentage of profit. The difference between cost and the transfer price isknown as inter-process profits.
Joint Products - Two or more products of equal importance, produced, simultaneously from the sameprocess, with each having a significant relative sale value are known as joint products.
Co-Products - Two or more products which are contemporary but do not emerge necessarily from thesame material in the same process.
By-Products - “products recovered from material discarded in a main process, or from the production ofsome major products
12.12 Self Assessment Question
Short Answer Type Questions
1. Define and explain the terms “Joint Products” and “By-products”. Enumerate the methodswhich may be employed in costing joint products.
2. Explain briefly the methods of accounting for by-products.
3. Distinguish between:
(i) Joint product and By-product(ii) Abnormal loss and abnormal gain.
4. How would you deal with by-products in costing :
(i) Where they are of small total value?(ii) Where they are of considerable total value? (iii) Where they require further processing?
5. Describe briefly the various ways of valuing work-in-progress in process costing.
Long Answer Type Questions
1. Describe the general features of process costing. How is unit cost determined in processcosting?
2. What is meant by operation costing? Is it different from process costing?
3. What do you understand by the terms, “normal process loss” and “abnormal process loss”?How is the value of abnormal process loss determined?
4. What is meant by abnormal gain in process costing? How is it dealt with in Cost Accounting?
5. What do you understand by the term “inter-process profits”? What is the utility of transferring theoutput of one process to another process at more than cost?
Numerical Questions :
1. A product passes through three processes, A, B, and C. The normal wastage of each process is asfollows : Process A-3%m Process B-5% and Process C-8%.

214
The wastage of process A was sold at 0.25 p. per unit, that of process B at 0.50 p. per unit, and thatof process C, at Re. 1 per unit. 10,000 units were issued to the Process A in the beginning ofOctober 1998 at a cost of Re. 1 per unit. The other expenses were:
Process A Process B Process C
Sundry materials Rs. 1,000 Rs. 1,500 Rs. 500
Labour 5,000 8,000 6,500
Direct expenses 1,050 1,188 2,000
Actual output (units) 9,500 9,100 8,100
Prepare the Process accounts, assuming that there were no opening or closing stocks. Also give the Abnormal Wastage and the Abnormal Gain Accounts.
Ans: Process A Ab. wastage Rs. 350, Process B Ab. Gain Rs. 225, Process C Ab. wastageRs. 272.
2. In a manufacturing unit, raw materials passes through four processes I, II, III & IV and the outputof each process is the input of the subsequent process. The loss in the four processes I, II, III & IVare respectively 25%, 20% and 16-2/3% of the input. If the end product at the end of Process IVis 40,000 Kg. what is the quantity of raw material required to be fed at the beginning of Process Iand the cost of the same at Rs. 5 per Kg.?
Find out also the effect of increase or decrease in the material cost of the end product for variationof every rupee in the cost of raw material.
Ans: For every increase or decrease in the material cost, the cost of the end productwould increase/ decrease by 2.5 times.
3. In a certain period 300 units of main product are produced and 200 units are sold at Rs. 30 per unit.The by-product emerging from the main product is sold at Rs. 600. The total cost of production of300 units is Rs. 4,500. Calculate the amount of gross profit after crediting by-product value (a) tothe cost of production and (b) to cost of sales.
Ans: Rs. 3,400, Rs. 3,600.
4. The following information is given about two products produced jointly upto a stage.
Joint cost (Rs) 40,000Number of units of Product A 2,000
B 600Selling price (Rs.) A 30
B 25Special (separate) expenses (Rs.) A 8,000
B 3,000
Ascertain the profit earned in total and by each product.
Ans: Total profit Rs. 24,000 : A Rs. 20,000 or Rs. 19,500; B, Rs. 4,000, Rs. 4,500.
5. A factory producing article P also produces a by-product Q which is further processed into afinished product. The cost of manufacture is given below:
215
Subsequent Cost
Joint Costs (Rs.) P(Rs.) Q (Rs.)
Material 5,000 3,000 1,500Labour 3,000 1,400 1,000Overheads 2.000 600 50010.000 5.000 3.000
Selling Price Are P : Rs. 16,000, and Q : Rs. 8,000
Estimated profit on selling prices are 25% for P and 20% for Q. Assume that selling and distributionexpenses are in proportion of the sale prices. Show how you would apportion joint costs ofmanufacture and prepare a statement showing cost of production of P and Q.
Ans: P. Rs. 11,733 ;Q. Rs. 6,267
6. X Ltd. manufactures product A, which yields two by-products B and C. In a period, the amountspent upto the point of separation was Rs. 20,000. Subsequent expenses were :
A 8 C
Rs. Rs. Rs.Materials 250 180 60Direct wages 500 300 120Overheads 840 300 180Total 1,100 7 80 360Gross sale value 15,200 10,000 5,100
It was estimated that profit as a percentage of sales of B and C would be 25% and 15% respectively.Ascertain the profit earned on A.
Ans: Rs. 4,795.
12.14 Reference Books
- K.L. Narang and Jain, SP, ‘Cost Accounting’, Kalyani Publisher, New Delhi.
- Tulsian PC, ‘Practical Costing’, Vikas Publisher, New Delhi
- Maheswari S.N., ‘Advance Problem and Solutions in Cost Accounting’, Sultanchand and Sons,New Delhi
- Arora M.N., ‘Cost Accounting Principle and Practice’, Vikas Publisher, New Delhi
- Maheswari and Mittal, ‘Cost Accounting’ Mahaveer Prakashan, New Delhi
- Oswal and Maheswari, ‘Cost Accounting’ Ramesh Book Depot, Jaipur (Raj.)
- Agarwal M.L., ‘Cost Accouating’, Sahitya Bhawan Publisher, Agra ( UP)
- Khan M.Y. and P.K., ‘Management Accounting’, Tata Mcgraw hill Publisher, New Delhi
- Horngren, Charles, Foster and Data, ‘Cost Accounting - A Managerial Emphasis’, Prentice Hall ofIndia, New Delhi
- Jain, Khendelwal and Pareekh, ‘Cost Accounting’, Ajmer Book Company, Jaipur

216
Unit - 13 : Nature and Scope of Management Accounting
Structure of Unit:
13.0 Objectives13.1 Introduction13.2 Nature of Management Accounting13.3 Objectives of Management Accounting13.4 Scope of Management Accounting13.5 Techniques of Management Accounting13.6 Functions of Management Accounting13.7 Role of Management Accounting in Decision Making13.8 Difference between Cost Accounting and Management Accounting13.9 Limitations of Management Accounting13.10 Organisation of Management Accounting13.11 Management Accountant13.12 Qualities of Management Accountant13.13 Summary13.14 Self Assessment Questions13.15 Reference Books
13.0 Objectives
After completing this unit, you will be able to understand that:
Management Accounting is the accounting service to the management. It helps the management to assist in the execution of determination of policies, planning,
decision-making and co-ordinating functions.
13.1 Introduction
Word “Management Accounting” is formed by joining two words Management + Accounting.Management has been defined differently by various scholars but planning, organizing, directing andcontrolling are included in it whereas accounting means recording of facts. This way we can say thatmanagement accounting is a process which increases the managerial efficiency. It is one of the toolsused for increasing the managerial efficiency. Though the instruments used in management accountingare taken from the financial accounting or the financial books but its objective is not to clarify the pastposition instead its job is to forecast the future activities by using the information which can help intaking bold and scientific management decisions. The main aim of management accounting is to helpin formulation of corporate planning for affecting the attention of management towards future plansand continuously comparing the expected aid actual results for increasing the managerial efficiency.
Management Accounting keeps a regular check on internal control and establishes balance, constantdiagnose of the mistakes and motivates the management to improve over them. Whereas financialaccounting is historical in nature i.e., it accounts only the past facts and information on the other handmanagement accounting tries to look into the future. The calibre of financial accounting is shown in thepresentation of financial statements in the purest form, whereas the capability of management accounting isdepicted in close examination of future activities.

217
Definitions of Management Accounting-It had been defined differently by various scholars of the field.Some of the famous and broadly accepted defections of Management Accounting are as under:
“Management Accounting is the adaptation and analysis of accounting information, and its diagnosis andexplanation in such a way as to assist management” – T. G. Rose
“Management Accounting is concerned with accounting information, that is useful to management” - RobertN. Anthony
“Management Accountancy is the presentation of accounting information in such a way as to assist managementin the action of policy and in day-to-day operation of undertakings -Anglo-American Council ofProductivity
“Any form of accounting which enables a business to be conducted mode efficiently can be regarded asmanagement accountancy’’. - Institute of Chartered Accountants, England
“Management Accounting is the term used to describe the accounting methods, systems and techniques,which coupled with special knowledge and ability, assist management in its task of maximising profitsor minimizing losses”- J. Batty
“Management Accounting is the application of appropriate techniques and concepts in processing thehistorical and projected economic data of any entity to assist management in establishing a plan for reasonableeconomic objectives and in the making of rational decisions with a view toward achieving these objectives.”-Report of tie. Committee- on Management Accounting, Accounting Review, April 1959 (AmericanManagement Association)
‘’Management accounting can be defined as the art of presenting to management such figures, whether interms of money or other units, as will assist management to do its job.” -Bostock
From the above definition it is clear that the corporate organizations used to take help of managementaccounting for running in a smooth way. Some part of such information is derived from financialstatements and rest comes from other statements. The main purpose of financial statements is toprovide information to external parties like shareholders, creditors and government. The rules,techniques and basis on which the financial data of the organization should be collected and presented,are decided mostly keeping in view the requirements of these parties.
But most of the information important for the outer world is not of any use for management. Therefore,management accounting creates such information, which can be used by the management and increasesthe management efficiency. In short, we can say that in management accounting financial and otherinformation is presented in intelligent and informative way through the use of some specific ways,techniques and procedures such that the available information shall be able to understand and solvethe problems of management to a great extent.
13.2 Nature of Management Accounting
Management accounting comprises of various financial and non-financial data, subjects, procedures,formats and other related facts.
Information in business is gathered for various purposes and used with a little difference in various statements.The most important of these statements are financial statements, cost statements and statistical analysis. Butthe work of management accounting is not only to collect the historical facts because these facts tell onlywhat happened? They docs not throw light on what should be? Thus for getting expected results some

218
standards have to be set. Check can be kept on efficiency by composing the expected and actual results.Standard costing and budgetary control are based on the standards set. .
In management accounting system there is a necessity of Amendment in the traditional approach of notgiving emphasis on the improvement in managerial efficiency and just looking into the balancing of financialbooks. But in management accounting, the management accountant generates such information, based onhis knowledge and experiences, which helps the managers in the decision-making process. The nature ofmanagement accounting can be studied on the basis of following characteristics:
(1) Management Accounting is related with Future- In management accounting, the forecastsabout the future are prepared. The actual results are compared with these forecasts. This helps themanagement in effective controlling. It include budgetary control, standard costing etc in managementaccountancy. In all these methods facts relating to future are studied, thus we say managementaccounting is related with future.
(2) Management Accounting is of a Selective Nature- In management accounting the most profitableand best alternative is chosen after analysis and comparative study of various alternatives. In thesame way, only selected information is presented to the management. Thus at every stage it requiresselection and presentation of necessary information to the management, therefore managementaccounting is selective in nature
(3) Established Financial Accounting Rules are not followed in Management Accounting-Thework of management accountant is, to increase the efficiency. For this purpose, he can frame hisown rules different from that of set rules on the basis of his logic, knowledge, experience andimagination and creates an information system which can serve the cause. Therefore it is moreappropriate to say that there are no set of rules for management accounting.
(4) Management Accounting Furnishes Facts and Not the Decisions-The management accountantonly collects and analyses the data and presents it to the management. He does not take anydecision over it. Decision-making is in the preview of management and he helps in decision making.
(5) In Management Accounting Special Emphasis is Laid on Cause and its Effect- Inmanagement accounting not only the results are seen but also attempt is made to understand that theresult is affected with what factors and how it can be improved. For Example, in financial accountingonly profit is calculated but in management accounting it is studied that why the profit remains atcertain level and what will be its effect on the health of the enterprise and how it can be increased.
(6) Emphasis is Placed on the Study and Analysis of the Nature of Elements of Cost-The studyof cost elements is of great importance in management accounting.
Total cost can be distributed in various parts such as variable cost, fixed cost and semi-variablecost. In management accounting this classification has an important place.
For taking managerial decisions, marginal costing, cost volume-profit analysis, variance analysisetc. are used, which are based on this classification
(7) Service Function -Management accounting is a service function through which, the informationnecessary for deciding policies of the organisation and taking decisions is provided on time Theseinformation can be related to cost, price, income and profits etc..
(8) Integrated System - Management accounting is an integrated system of various systems, methodsand techniques. In this we include cost accounts, budgetary control, financial accounts along witheconomics, psychology, statistics and other related subjects.

219
(9) Developing Subject - Management accounting had developed in less than 50 years and till today ithas not developed fully. Its tools, methods, and systems are constantly progressing because ofwhich it is getting more refined.
(10) Potentiality of Development as a Profession - It has not evolved as a profession in India, asyet. But some institutions are trying to establish it in that way. Among them the main are Institute ofChartered Accountants of India and Institute of Cost & Work Accounts of India.
13.3 Objectives of Management Accounting
The main objective of management accounting is to provide information for successfully carrying out themanagerial duties. According to Henry Fayol, “To manage is to forecast and plan, to organise, to command,to co-ordinate and to control. To forecast and plan is to provide means for examining the future and drawingup the plan of action. To organise means building up the dual structure, material and human of the undertaking.To command means maintaining activity among the personal. To co-ordinate means seeing that everythingoccurs in conformity with established rule and express command.” Management accounting helps in all theabove mentioned works of management. The objectives of management Accounting is as under:
(1) Helpful in Planning-For the set on future goals that should be done, is called planning. Forachieving the desired goals of business it is necessary for management to prepare plan of action.Management accounting gives an ample help in this cause of management. The forecast of production,sale, purchase, capital, investment and cash etc. helps the management in framing a profitable planfor future. The best alternative is chosen by the managers with the help of management accounting.
(2) Helpful in Organising-Every management tries to unite its organization and departments in thebest possible way. The distribution of authorities and responsibilities of carrying out the plans comesunder the organizing. Management accounting helps into this by emphasizing more on the budgetand cost centres.
The responsibilities can be divided easily on the basis of budget and cost centres and by calculatingthe rate of return on investment made in each cost centre, the profitability and effectiveness of eachcan be checked. On the basis of investigation the weak areas can be strengthen. The employeesremain conscious and work properly due to the constant investigation through the system andmethods of management accounting. .
(3) Helpful in Co-ordination - Every manager tries to establish co-ordination between the activitiescarried out under him so that organization can prove to be more profitable and efficient. Managementaccounting helps the management in this work. For example, there should be a co-ordination betweenproduction and sale, according to estimated production the raw material, finance and labour shouldbe available. This co-ordination is facilitated by budgetary control system.
(4) Helpful in Communication- By communication, we mean the transfer of information between theemployees of the organization (Managers and Labourers) and among the organization and externalInstitutions like customers, creditors, suppliers, government etc. For correct and immediatecommunication the management should have up to date information. Through management accountingthe daily reports can be presented in form of reports. The yearly performance can be presented inthe form of final accounts and yearly reports. Through the cost accountancy, the cost of production,

220
operations and processes can be known and it can be presented to management in the form ofdetails. For keeping the employees informed memos, circulars and notices can be prepared. Fortaking any solid decision, information remains the base. For this proper explanation and interpretationof information is required and management accounting helps in the smooth flow of this.
(5) Helpful in Controlling- Controlling means the comparison of actual and expected results andtaking the corrective action wherever the intolerable deviations are found. In managerial tasks,controlling comes on front seat. Various techniques are employed by management accountant tohave a better control mechanism. Through standard and overhead costs and budgetary control,control is kept on various activities and departments.
(6) Helpful in Motivating Employees-Every manager tries to make his subordinates: a loyal employee.For this a good leadership is required, and good leadership is possible only if correct informationare available. This is taken care of by the management accounting and the management accountantkeeps on increasing the knowledge of management by providing adequate and timely information.This keeps the self-confidence of the managers at high levels and they lead better.
(7) Helpful in Analysis and Interpreting the Financial Information-This is again one of the mainobjectives of management accounting. Accounting is a technical subject. Management is not expectedto understand the minute details of it. Thus it is the responsibility of management accountant tointerpret this information and present it in most new technical form so that it could be understood byeach and every one. For this, graphs and diagrams etc. are used.
(8) Helpful in Decision-Making-The most important part of management is decision-making. Decisionmeans choosing the best out of the rest. Management has to take various decisions in business. Fortaking decision on complex matters, It is the responsibility of management accountant to present thedata and information various possible alternatives. Various tools and techniques are available forthis purpose.
(9) Helpful in Reporting-The most important work of management accountant is to provide dataand contents to the management for tacking important decisions. This work is done through reports.Various departmental heads pass on the operation reports of their departments to the top management.In this job, management accounting plays a major role.
(10) Helpful in Fixing Responsibility-With the help of management accounting techniques theresponsibility centres are formed in the undertaking, which fixes responsibility of particularperson for a particular work.
13.4 Scope of Management Accounting
In management accounting the accounting information is collected and presented in such a way that it can beused to carry out day to day operations in a better way. Management accounting reports should be presentedin such a way and intervals that it is most useful for the management. The subject matter of managementaccounting is the past, present and future activities of any organization. The past records are used to knowthe difference between the standards and the actual results? What were the reasons for such differences andwere they important? Analysis of present situations is done to know that whether the present activities arebeing carried out in accordance with the standards? Is there a need of improvement in them and if requiredthe undesirable activities should be rectified immediately to save the organization from losses? The future

221
forecast is made just to make fool proof future plans and activities shall be carried out accordingly? Todecide what is to be done in future is called planning. For planning the analysis of present and past only, isnot sufficient. It is necessary to peep in future. In short, in the management accounting the past, present andfuture related financial and other facts are collected, classified, arranged and analysed with such systems,methods and techniques so that to help the management in understanding, solving and taking decisionsabout management problems.
This way the preview of management accounting is too vast and includes various aspects of businessoperations. Following subjects are included in management accounting:-
(1) Financial Accounting- It is the general accounting which includes the primary record of transactions,ledger posting and finding out the balances. After this, final accounts are prepared, which show theprofit & loss of the business and the balance sheet shows the position as on that date. The financialaccounting forms the basis of details and reports to be presented under the management accounting;without them, management accounting cannot establish control and co-ordination over the activities.
(2) Cost Accounting-It is one of the branches of accounting. It is the process and technique of knowingthe cost. The effective planning, decisions and control are the basic work of management accountingand its tools are standard costing, budgetary control, marginal costing etc.
(3) Budgeting and Forecasting-Budgeting means planning, policies and goals for a specified futuretime. All this work is done on the basis of business forecasting. The responsibilities for variousdepartments of organisation and their goals are pre-decided and the actual performance is knownby comparing actual with standard.
(4) Statistical Methods -statistical tools like graphs, charts, tables, index numbers etc. make thepresentation of information more attractive. Various methods of statistics are helpful forforecasting purposes.
(5) Inventory Control – The material from the time of procurement till the time of its consumption,remains under control and that is called as inventory control. It is important because a hugeamount is spent on the materials. Management needs to decide maximum stock level, minimumstock level, re-order level and other things. The study of inventory control is very useful forthe management.
(6) Interpretation of Data-The analysis and interpretation of financial statements is very necessary.The comparison of financial statements can be made with that of previous years or with the otherrelated firms.
(7) Tax Planning and Management- In present times, tax planning and management is very essential.Central and State Governments put so many taxes and require the filing of returns, assessment oftax and payment of tax. Every work is to be done in stipulated time period.
(8) Internal Audit- For assessing the work of various departments of the organization it is necessaryto internally audit them. It helps in holding the officials responsible for the work done under theirdepartments.
(9) Reporting-The reports prepared at various levels of organization should be synchronised andpresented to the top management so that they can take proper steps. Sending them after delaymakes them stale. Reporting can be done on quarterly, half-yearly or yearly basis. It can be relatedto cash, profit and loss funds etc.

222
(10) Methods and Procedures - Generally the secretarial or official service administration should alsofall under the work of management accountant. The processing and use of data, filing, copying andpostage are the official works. The optimum utilization of machines and other electronic equipmentsis to be insured.
Various types of surveys and forecasts are also made. Due to the information given above it is clear that thescope of management accounting is increasing day by day.
13.5 Techniques of Management Accounting
The development of this subject was done for the facilitation of managerial work. Therefore following toolsand techniques have been adopted:
Some scholars divide the techniques of management accounting as under-
(A) Techniques Based on Information Contained in Financial Accounting-(i) Comparative Financial Statements,(ii) Common-size Financial Statements,(iii) Tread Analysis,(iv) Ratio Analysis,(v) Funds Flow Statement,(vi) Cash Flow Statement, and(vii) Graphs, Diagrams and Charts.
(B) Techniques Based on Information Contained in Cost Accounts-(i) Standard Costing,(ii) Direct or Incremental Costing,(iii) Marginal Costing, and(iv) Cost-Volume-Profit Analysis.
(C) Techniques Based on Quantitative Methods -(i) Operations Research,(ii) Game Theory and Queuing Theory,(iii) Network Analysis,(iv) Simulation Theory,(v) Linear Programming,(vi) Co-relation and Regression Analysis,(vii) Analysis of Time Series,(viii) Standard Deviation, and(ix) Quality Control Techniques.
(D) Techniques Based on Estimated Information-(i) Business Forecasting,(ii) Budgeting,(iii) Project Appraisal, and(iv) Projected Financial Statement. .
(E) Other Techniques –(i) Managerial Reporting,(ii) Internal Control Techniques and Auditing.

223
13.6 Functions of Management Accounting
Management accounting’s main purpose is to help in managerial works. It helps in the management in twoways:I. Providing Necessary Accounting Information to Management.II. Helping in Managerial Works and Activities.
I. Providing Necessary Accounting Information to Management:
For this work in management accounting the job of creating information and making it available, is done infour phases:
(1) Measuring (2) Recording (3) Analysis (4) Reporting
The description about them is as follows:
(1) Measuring- In management accounting, the accountant helps in measuring the work efficiencyin different areas. For helping the management it is done on the past and present incidentswith context to future. In standard costing and budgetary control, standard and actualperformance is compared to find out efficiency. .
As the forecasting is involved in management accounting, therefore it is natural that there canbe some faults, thus management accountant presents these data at certain level of confidence.It is to be made clear that forecasted information cannot be fully correct, then also thereshould be reasonable fairness in them. That is why, in management accounting, at the place ofemphasizing on 100% correctness, reasonable correctness is needed. .
(2) Recording-Recording is the primary job of accounting. Production, labour, sale and purchase etc.have transactions on every day. Firstly they are recorded in accounting and cost books. But in caseof management accounting this recording is done on the basis of assumption and even those itemswhich cannot be expressed financially are included in management accounting. Thus in managementaccounting both, the quantitative and qualitative types of data are included.
(3) Analysis -The work of management accounting is to collect and analyse the facts related to themanagerial problems and then present them in clear and simple way. Till the facts are properlyanalysed and no differentiation is made between useful and wasteful facts, the management cannotuse it. For this purpose there should be a working knowledge of accounting. Managers generallylack this awareness so there arises the need of management accountant. He analyses the variousprojects, alternatives and procedures and presents them to the management with proper details.
(4) Reporting- One of the major works of management accounting is to prepare useful reports.Under this subject mainly two types of reports are prepared-
(a) Regular Reports -Such reports are prepared at regular time intervals, for the use of someimportant officials. These reports are used to keep a check on operational activities and work area.The format of such reports can be different in various organizations but reports regarding the sales,purchases, production and operational cost are helpful in assessing the results of the organisation.The reports prepared for whole organisation are very short, for some department it is detailed butfor various works of departments it is very detailed. In such statements, for controlling the cost andefficiency the information is presented in comparative form.
(b) Special Reports - These reports are prepared on the request of any manager or department.Top management confronts such problems generally, where the regular reports are not enough.

224
There is some information in the accounts which is never used in the preparation of reports but atthe time of need these information can be collected in the form of reports, with special efforts.Generally, the special reports are not only prepared on the information present in the accounts buton the basis of common sense and forecast, a special report is prepared. For example, if managershave to decide to produce a particular product in a factory or purchase from others; the old machinesshould be replaced or not; all the processes of production should run or to be closed; it is difficult totake the decision. Here the comparative study is required therefore, management accountant isrequired to collect information from various sources and prepare a special report.
II. Helping in Managerial Works and Activities:
Some great changes in science and industry has made it non-profitable to carry out the work of managementon the basis of traditional methods. Presently, management tries to take the decision on the basis of statisticalfacts and quantitative techniques and not on situations. They do not need only the facts of present activitiesand the past ones but also likes to forecast on the basis of it. The complexities have increased in themanagerial tasks, therefore, it has become necessary for managers to delegate their responsibility. Butpassing on responsibility down the chain requires proper control. The main functions of management areplanning, organizing, staffing, directing provides information to the various levels responsibilities properlyand effectively. It is helpful in various managerial functions as under: -
(1) Planning- Planning includes the decision taken regarding “What to do” in future and then formulatingplans and policies to activate it. It is considered as the basic function and always have some goalsbehind it. Till today, the aim or goal of business was considered to be profit earning, but withchanged situations, industrial democracy socialism and interference of government, every businessneeds to give equitable weighing to profit making and social welfare. Through management accountingforecasts regarding the sales, purchases, production etc. can be obtained, which helps in makingjustifiable plans. On the basis of cost, price, income and production level the alternative plans canbe compared and best is chosen. The tools of management accounting like standard costing,managerial costing cost-volume-profit, analysis etc. are of great help in planning.
(2) Organising - Organising is a system where in the responsibilities of employees and the posts theyare holding in organization, are decided. The present industrial era has even birth to various levels ofmanagement namely, top management, middle level management and down level management. Theeffect of this is that, not only top management wants to assess its workings but also the middle andlower level management tries to find out their efficiency. On .the other hand, the heads of variousdepartments want to know the performance of their subordinates. In such cases, the financialaccounting is of no use and this need can be fulfilled only through the management accounting. Thebudgetary control and establishing cost centre techniques of management accounting helps incontrolling costs and fixing responsibility, which result in efficient management. In managementaccounting whole organisation is divided into various departments, on the basis of work or production,and then detailed information are prepared to simplify the thing. Internal audit increases the efficiency.By inspecting the various procedures and systems; the labour, the supervisors and managers getmotivation to constantly improve their work.
(3) Staffing-The meaning of staffing is to fill the various positions in organisation with the capablepeople and to maintain a balance between the requirement of the position and the qualificationof the employees. Management accounting helps the managers in this work. Merit rating andjob evaluation are two important functions to be performed for staffing. Generally, only thoseemployees are useful for the organization, whose value of work done by them is more than the

225
value paid to them. Training is required for maintaining balance between the position and thepersonnel. But before starting training programmes it should be evaluated whether the cost ofit is less than the benefit delivered or not, otherwise such training programmes can prove to bea costly and burdened affair for the organisation. Thus by doing Cost- benefit analysismanagement accounting is useful in staffing function.
(4) Directing-The purpose and meaning of directing is to order the employees for doing tasks and toguide them. It motivates the employees to work in group. For proper directing, the essentials areco-ordination, leadership, communication and motivation. In all these tasks, management accountingis of great help. Through standard costing and budgeting help is provided in supervision and leadership.
(5) Controlling- To see that all the activities in the organization are heading according to plans or notand if any deviation found then correcting it is called controlling. In this way, for controlling anythingfirst the standards are to be set, then actual performance is compared with standards and on findingany deviation, the reasons for it are enquired and corrective action is taken. Thus, we can say thatthere are three main steps in controlling:
(i) Setting up performance standards.(ii) Comparing actual performance with the standards set.(iii) If deviation is found then taking corrective action.
Here it is important to maintain that controlling is most important function of management becausewithout it all other functions like planning, directing, organizing etc. are of no use. And thisprocess of controlling is month governed by the tools provided in the management accounting.
From all above discussion, it is clear that management accounting is an important tool and techniqueof management. Though managerial decision depend upon the type of manager but the grass-rootinformation required for it is provided by management accounting.
13.7 Role of Management Accounting in Decision Making
Management of every organisation has to face many problems which are to be properly analysed. Theseproblems require decision making and policy formation. Management needs require data and information toresolve such problems. Management accounting plays important role in providing the required information.We provide few managerial problems relating to purchase, production, marketing and finance, which requiresmanagerial decision making and the role of management accounting in providing the required data to helpmanagement in decision making-
(1) Purchase Decision -Management has to take decision relating to purchase f different items forproduction function. Following may be the useful information analysed and provided by managementaccounting for purchase decision-(a) Data related to quantity, rate and the amount involved of different material in a particular period.(b) Analysis of items in capital nature and revenue nature(c) Purchase by different departments(d) Time and quantity of material required by the organisation.(e) Order placed and the schedule of receiving such orders(f) Safety stock required to be maintained.(g) Material available for the expected production(h) Re-order level and Economic order quantity

226
(2) Production Decision -Management has to take decision related to production to meet the needsof customers. Management accounting collects and provides following information to solve variousproblems related to production function-(a) Order received and schedule of despatch(b) Information related to raw material, labour and other infrastructure to meet the pending orders(c) Estimation of demand and production sequencing(d) Nature of expenses at different levels of production, i.e., fixed variable and semi variable.(e) Past failures and reasons thereof.
(3) Marketing Decision - Management Accounting provides following information related to differentproblems of marketing management, i.e., division of selling areas, decision for Sales budget, policyfor Sales promotion, credit policy etc.-(a) Quantity and price of items sold in a particular period(b) Cash and credit Sales and their analysis with respect to financial effectiveness(c) Branch wise and department wise sales(d) Item wise, Area wise, Dealer wise, Agent wise sales(e) Marketing expenditures and justification budget(f) Analysis of goods returned by the customers(g) Customer’s feedback and new products in the market
(4) Finance Decision - Management has the problem of collection and utilization of short term andlong term finance. Management also faces the emblem of proper allocation of funds. Managementaccounting helps in collecting and analysing following information. for the purpose of appropriatedecisions for these problems-(a) Requirement of finance for purchase(b) Fixed payments and variable payments at different levels of production(c) Estimation of Cash and credit purchase as well as Sales(d) Estimation of time schedule in collecting funds from different sources(e) Dividend and Taxation information(f) Cost of collecting and continuing loans.(g) Alternative sources of finance.
Now, it can be verified from the above details that management accounting plays an important role invarious decisions of the management although at the, same time, it is true that it is not an alternative to themanagement.
13.8 Difference between Cost Accounting and Management Accounting
Due to the limitations and incompleteness of financial accounting, separate system of accounting was evolvedto do accounting of cost related matters. Basically, the accounting knowledge has improved along with thetime. In spite of the new accounting procedures and technical innovations there was not much improvementin the historical nature of financial accounting, thus leaving a very limited scope for it in the field of management.It has proved to be unsuccessful in providing facts for management control, decision making, cost controland forecasting. Cost accounting development removed these drawbacks of financial accounting and helpedmanagement in establishing proper control.
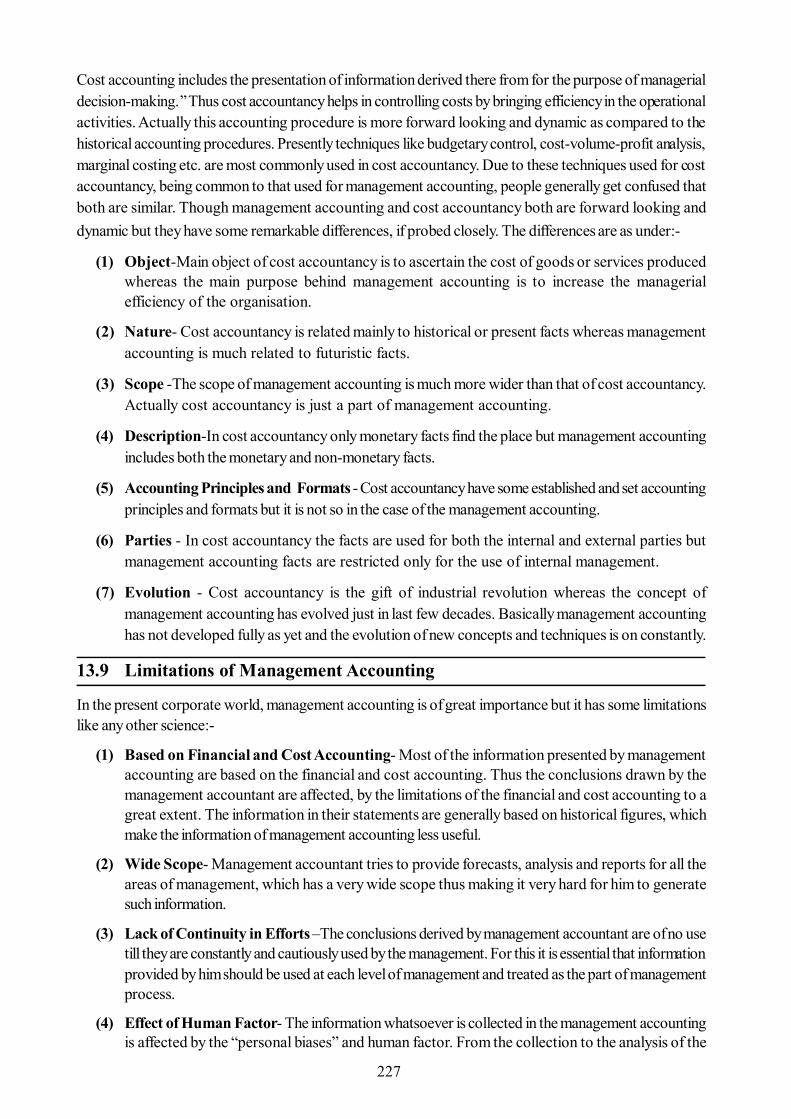
227
Cost accounting includes the presentation of information derived there from for the purpose of managerialdecision-making.’’ Thus cost accountancy helps in controlling costs by bringing efficiency in the operationalactivities. Actually this accounting procedure is more forward looking and dynamic as compared to thehistorical accounting procedures. Presently techniques like budgetary control, cost-volume-profit analysis,marginal costing etc. are most commonly used in cost accountancy. Due to these techniques used for costaccountancy, being common to that used for management accounting, people generally get confused thatboth are similar. Though management accounting and cost accountancy both are forward looking anddynamic but they have some remarkable differences, if probed closely. The differences are as under:-
(1) Object-Main object of cost accountancy is to ascertain the cost of goods or services producedwhereas the main purpose behind management accounting is to increase the managerialefficiency of the organisation.
(2) Nature- Cost accountancy is related mainly to historical or present facts whereas managementaccounting is much related to futuristic facts.
(3) Scope -The scope of management accounting is much more wider than that of cost accountancy.Actually cost accountancy is just a part of management accounting.
(4) Description-In cost accountancy only monetary facts find the place but management accountingincludes both the monetary and non-monetary facts.
(5) Accounting Principles and Formats - Cost accountancy have some established and set accountingprinciples and formats but it is not so in the case of the management accounting.
(6) Parties - In cost accountancy the facts are used for both the internal and external parties butmanagement accounting facts are restricted only for the use of internal management.
(7) Evolution - Cost accountancy is the gift of industrial revolution whereas the concept ofmanagement accounting has evolved just in last few decades. Basically management accountinghas not developed fully as yet and the evolution of new concepts and techniques is on constantly.
13.9 Limitations of Management Accounting
In the present corporate world, management accounting is of great importance but it has some limitationslike any other science:-
(1) Based on Financial and Cost Accounting- Most of the information presented by managementaccounting are based on the financial and cost accounting. Thus the conclusions drawn by themanagement accountant are affected, by the limitations of the financial and cost accounting to agreat extent. The information in their statements are generally based on historical figures, whichmake the information of management accounting less useful.
(2) Wide Scope- Management accountant tries to provide forecasts, analysis and reports for all theareas of management, which has a very wide scope thus making it very hard for him to generatesuch information.
(3) Lack of Continuity in Efforts –The conclusions derived by management accountant are of no usetill they are constantly and cautiously used by the management. For this it is essential that informationprovided by him should be used at each level of management and treated as the part of managementprocess.
(4) Effect of Human Factor- The information whatsoever is collected in the management accountingis affected by the “personal biases” and human factor. From the collection to the analysis of the

228
information there comes some part of effect because of the character, intentions, and behavior ofthe person doing it. These decisions are affected by personal influence and the self knowledge to agreat extent. That’s why the conclusions drawn from them are also affected.
(5) Lack of Thorough Knowledge-The right conclusions, from the information collected in managementaccounting, can be drawn only if the person is having in-depth knowledge of accountancy, statistics,economics, auditing, principles of management and engineering etc. Management accountant andmanagers both don’t have this much knowledge, which ultimately affects the quality of decisions.
(6) Not an Alternative of Administration -Management accounting is just a tool in the hands ofmanagement and it cannot replace the administration and management. Management accountantjust supplies some information to the management, taking decision and activating them are not in hisperipheral. Thus, management accounting provides basis for decision-making and not the decision.
(7) Effect of Time Factor-Most of the information gathered by management accountant is of historicalnature. When any forecast is made regarding a project at that time if this information is used, then itcan pose some problems, which puts management in awkward situations. Sometimes quick decisionsare needed regarding the project and at such time management accountant cannot reproduce effectiveinformation, which is a failure.
(8) Top Heavy Structure- For the establishment of management accounting system there is a requirementof a broad organization and employees, which makes it a costly affair, therefore it can be adoptedonly by large organisations.
(9) Evolutionary Stage-The tools of management accounting has not developed fully as yet, there isa constant change in it from time to time, which makes them instable for use.
(10) Use of Alternative Techniques -In management accounting various techniques can be used forsolving a problem. Different conclusions will be drawn for the same problem on using differenttools.
(11) Psychological Resistance- Managers generally resist the information of management accountingbecause it can change the basis of the whole established management system and it can be used asa tool against manager. Therefore, managers oppose it from the beginning itself.
13.10 Organisation of Management Accounting
Wherever two or more people work together, there is a need of organization. And when responsibilities areassigned to persons with certain authorities it is called organization. The goals of a business cannot beachieved, without organization. For the efficient working of management accounting in any business thereshould be a separate organization. The shape and size of such organization depends upon the nature andsize of the business itself. In a small-business, a clerk can be kept for doing book-keeping and the serviceof public auditor or management auditor can be taken on periodic basis. In a middle sized business a chiefaccountant can be appointed and under him there can be separate accountants for accounting, costing,plant etc.
The management accounting organization structure usually found in small and middle sized business is asunder:
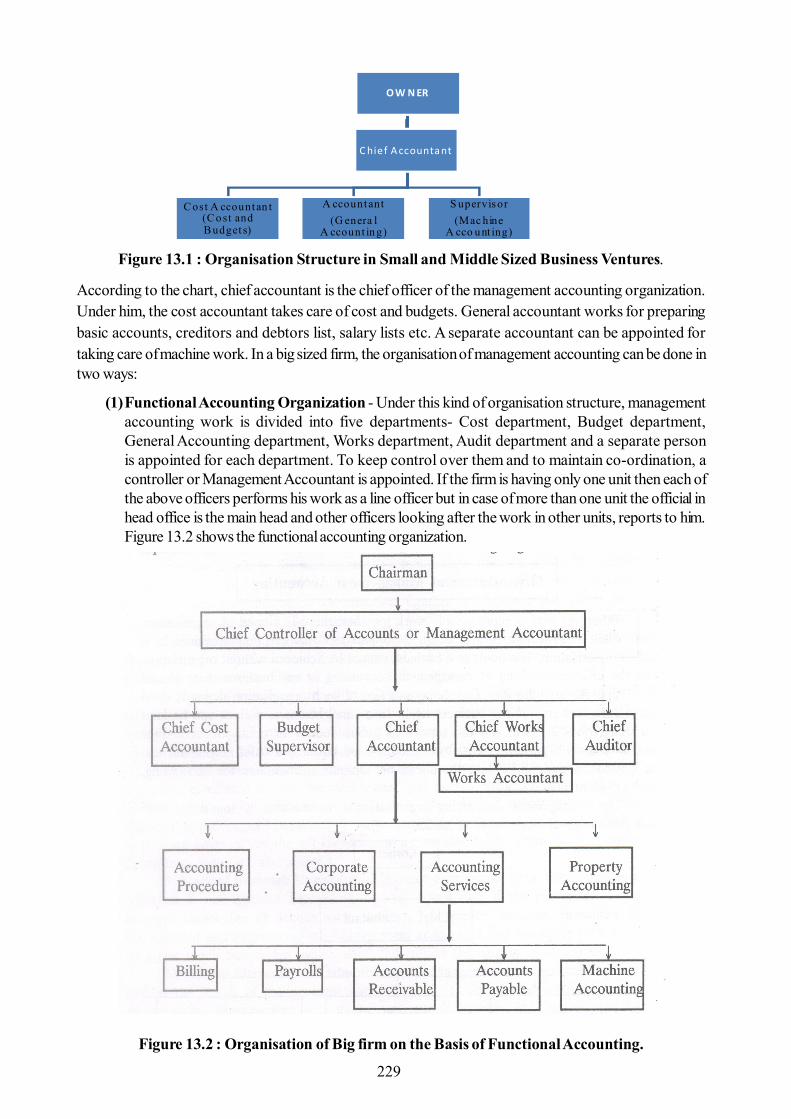
229
Figure 13.1 : Organisation Structure in Small and Middle Sized Business Ventures.
According to the chart, chief accountant is the chief officer of the management accounting organization.Under him, the cost accountant takes care of cost and budgets. General accountant works for preparingbasic accounts, creditors and debtors list, salary lists etc. A separate accountant can be appointed fortaking care of machine work. In a big sized firm, the organisation of management accounting can be done intwo ways:
(1)Functional Accounting Organization - Under this kind of organisation structure, managementaccounting work is divided into five departments- Cost department, Budget department,General Accounting department, Works department, Audit department and a separate personis appointed for each department. To keep control over them and to maintain co-ordination, acontroller or Management Accountant is appointed. If the firm is having only one unit then each ofthe above officers performs his work as a line officer but in case of more than one unit the official inhead office is the main head and other officers looking after the work in other units, reports to him.Figure 13.2 shows the functional accounting organization.
Figure 13.2 : Organisation of Big firm on the Basis of Functional Accounting.
O W N ER
C ost A ccountan t (C o st and B udget s)
A ccountant (G enera l
A ccount in g)
S upervisor(Mac hine
A cco u nt ing)
C hief A ccounta nt

230
Various benefits are derived by organizing the accounting work on functional basis. The biggestbenefit is that for various accounting works different people are appointed who become expert intheir work. In case, of more than one units, the improvement measures taken by one officer can beintroduced in the other units.
(2)Accounting Organization According to Divisions of the Company-Some firms do theiramounting on the basis of divisions. For this purpose they create divisions first. For example dividingin ‘Division A’, ‘Division B’ and ‘Division C’.
After this accounting of each division is arranged to a particular controller and he is responsible forthe performance of his division. In a venture, some works are not divisible in divisions, therefore,they are carried out under the supervision of control officers. The work of Chief Accountant andChief Auditor is like that.
Figure 13.3 shows the accounting organisation according to the divisions of the Company:
Figure 13.3 : The Organisation of Big Firm on the Basis of Divisions.
231
The biggest advantage of this organization is that every controller can keep the proper care of each problemof his division. He can adopt proper procedures and systems according to his requirements. It proves to bemore useful where the working of each division is different. It also helps in developing the employee’sknowledge. They got acquainted to handle higher positions in future.
13.11 Management Accountant
The person who carries out the management accounting work in organisation is called management accountant.It is also addressed as chief accountant, controller, accounting manager, financial director, financial controlleretc. Actually he is the person who provides a practical shape to management accounting in the organisation.
He is the person who collects the data and information and supplies it to the managers at various levels sothat they can perform their work efficiently. It has the same place in organization as a ‘’nerve system’’ has ina human body. He is an efficient analyst of the business because of his special qualification and knowledge,and he is responsible for maintaining financial accounts and to analyse them. He is very able and importantperson of the organization.
The status of a management accountant in any organisation is not fixed. His position in organisation is notrelated only to his seat but to his ability, personality, industrial background of the country, honesty, andability to win confidence of others etc. The terms of his appointment also affect his position. Therefore thestatus of management accountant in various organisations is different.
The Controllers Institute Committee of America has given the following recommendation for the organisationalstatus :-
(1) Controller should be an officer at the decision-making level and should be responsible to the chiefexecutive officer.
(2) Board of directors should instruct the controller to present the reports at particular intervalsand it should comment on the activities and financial position of the enterprise.
(3) Controller should be the member of the board of directors. If he is not then at least he should beasked to attend the board meetings and present his views.
13.12 Qualities of Management Accountant
Generally a controller should have following qualities:
(1) Knowledge of Accounting-He should have full knowledge of financial and cost accounting. If hedoes not have that then how would he provide correct information to the managers.
(2) Knowledge of Statistics -The proper knowledge of statistics is necessary to present the informationin the form of graphs, charts, tables etc. to make them more understandable. .
(3) Knowledge of Economics -Most of the economic decisions of the organisation are based on theprinciples of economics. Thus, he should have its knowledge, price fixation, production decisions,capital expenditure etc. are based on this
(4) Knowledge of Law-The law complexities are increasing day by day, thus controller should knowall the laws which can affect the business. New capital issue, distribution of dividend, depreciationand reserve accounts, publishing and auditing etc. are bounded by legal obligations which have tobe fulfilled.
(5) Knowledge of Psychology-He needs to take work from his colleagues and subordinates. If hehas good knowledge of psychology then he can maintain good relations with them.

232
(6) Knowledge of Mercantile and Industrial Laws - Companies Act., Partnership Act, Sale ofGoods Act, Factories Act etc. are some legislations which must be known to him.
(7) Effective Personality- Controller should have qualities like good nature, dignity, integrity, honesty,hard work, fun-loving etc.
(8) Deep Interest in the Firm- Controller should be able to relate his success with the success of thefirm.
(9) Understanding-He should of in depth understanding about the problems of the firm then only hecan be effective or otherwise he will be unsuccessful.
(10) Balanced Outlook- He should be able to think in balanced way about the original present situationand the potentialities of future.
13.13 Summary
Management accounting is the presentation of accounting information in such a way as to assist managementin the creation of policy and the day-to-day operation of an undertaking. This work is performed by suchtechniques and systems coupled with special knowledge and ability so that the available information mayprove helpful in understanding and solving the problems of management.
13.14 Self Assessment Questions
1 Explain the term ‘Management Accounting’ and state its objectives and functions.
2 Explain the nature and scope of Management Accounting.
3 Discuss the techniques of Management Accounting.
4 Explain the objectives, functions and limitations of ‘Management Accounting’.
5 “Management Accounting is concerned with accounting information that is useful tomanagement”. Comment and define management accounting. How does it differ from CostAccounting.
13.15 Reference Books
- Agrawal, Shah, Mendiratta, Agarwal, Sharma, Tailor, ‘Cost and Management Accounting’,Malik and Co.
- Agrawal & Agrawal, ‘Management Accounting’, RBD, Jaipur
- Khan, Jain, ‘Management Accounting’
- I. M. Pandey, ‘Management Accounting’

233
Unit - 14 : Marginal Costing
Structure of Unit:
14.0 Objectives14.1 Introduction14.2 Definitions of Marginal Cost and Marginal Costing14.3 Features of Marginal Costing14.4 Advantages14.5 Disadvantages14.6 Cost-Volume-Profit Analysis14.7 Break-Even-Chart14.8 Summary14.9 Self Assessment Questions14.10 Reference Books
14.0 Objectives
After completing this unit, you would be able to:
Understand the concept of Marginal Cost and Marginal Costing. Know the merits and demerits of Marginal Costing. Learn to compute the various components of CVP analysis. Understand the margin of safety with respect Break even sales. Able to draw the Break Even Chart and show the different components of Marginal Costing on
Chart.
14.1 Introduction
Marginal costing is not a method of cost ascertainment like job costing or contract costing. Marginal costingis a technique of costing which may be used with other methods of costing, viz., job or process. For decisionmaking, it is more helpful to the management. The other names for marginal costing are direct costing,differential costing, incremental costing and comparative costing.
In marginal costing, only variable items of costs are taken into account. These variable costs will change indirect relation to the change in the volume of production or change in the production by one unit. As such,variable costs are called product costs and are charged to production. Fixed costs are not allocated to costunit; and these are charged directly to profit and loss account during the period and are called as periodcosts or capacity costs.
14.2 Definitions of Marginal Cost and Marginal Costing
Marginal cost means the same thing as variable cost. The term is not new one. The accountants' concept ofmarginal cost differs from economists' concept of marginal cost. Economists define marginal cost as additionalcost of producing one additional unit. This shall include an element of fixed cost also. Moreover, the economists'marginal cost per unit cannot be uniform with the additional production since the law of diminishing orincreasing returns is applicable; whereas the accountants' marginal cost shall be constant per unit of outputwith the additional production.

234
The Institute of Cost and Works Accountants of India (ICWAI) defined marginal cost as, "the amount atany given volume of output by which aggregate costs are changed, if the volume of output is increased ordecreased by one unit". In this case the unit may be a single article, a batch of articles, an order, and a stageof production capacity, a process or a department. To ascertain the marginal cost, we need the followingelements of cost.
Direct Materials Direct Labour Other direct expenses, and Total variable overheads.
That is, Marginal cost = Prime cost + Total Variable OverheadsOr
Marginal Cost = Total cost - Fixed Cost
Marginal costing is defined by the ICWAI as, "the ascertainment by differentiating between fixed costs,and variable costs, of marginal costs and of the effect on profit of changes in volume of type of output".
According to Dr. Joseph, "Marginal costing is a technique of determining the amount of change in theaggregate costs due to an increase of one unit over the existing level of production. As such, it arises fromthe production of additional increments of output".
Batty defines Marginal Costing as "a technique of cost accounting which pays special attention to thebehavior of costs with changes in the volume of output".
It may be remembered that marginal cost takes into account only variable cost and excludes the fixedcost.
Fixed cost is one which tends to be unaffected by variation in volume of output. Fixed cost does notchange with the increase or decrease in production with a certain range. Period cost is another namefor fixed cost, as it is related to periods.
Variable cost is one which tends to vary directly with the volume of output. Variable cost changeswith the increase or decrease in production. In direct costing variable cost is known as direct.
Activity A:
1. According to you, what are the elements of Marginal Costing? Which type of overheads areincluded in it? Identify and make a list.
14.3 Features of Marginal Costing
The main features of Marginal costing can be enumerated as below:
1. Marginal costing is a technique or working of costing, which is used in conjunction with othermethods of costing (process or job).
2. Fixed and variable costs are kept separate at every stage. Semi-variable costs are also separatedinto fixed and variable.
3. As fixed costs are period costs, they are excluded from product cost or cost of production or costof sales. Only variable costs are considered as the cost of the product.
4. When evaluation of finished goods and work-in-progress are taken into account, they will be onlyvariable costs.

235
5. As fixed costs are period costs, they are charged to profit and loss account during the period inwhich they are incurred. They are not carried forward to the next year's income.
6. Marginal income or marginal contribution is known as the income or the profit.
7. The difference between the contribution and fixed costs is the net profit or loss.
8. Fixed costs remain constant irrespective of the level of output/activity.
9. Sales price and variable cost per unit remain the same.
10. Cost-Volume-Profit relationship is fully employed to reveal the state of profitability at various levelsof activity.
14.4 Advantages
The advantages of Marginal Costing can be enumerated as below:
1. Constant in Nature: Variable costs fluctuate from time to time, but in the long run, marginal costsare stable. Marginal costs remain the same, irrespective of the volume of production.
2. Effective Cost Control: It divides cost into fixed and variable. Fixed cost is excluded from product.As such, Management can control marginal cost effectively.
3. Treatment of Overheads Simplified: It reduces the degree of over or under-recovery of overheadsdue to the separation of fixed overheads from production cost.
4. Uniform and Realistic Valuation: As the fixed overhead costs are excluded from product cost,the valuation of work-in-progress and finished goods becomes more realistic.
5. Helpful to Management: It enables the management to start a new line of production which isadvantageous. It is helpful in determining which is profitable- whether to buy or manufacture aproduct. The management can take decision regarding pricing and tendering.
6. Helps in Production Planning: It shows the amount of profit at every level of output with the helpof cost volume profit relationship. The break even chart may be used for this.
7. Better Results: When used with standard costing. It gives better results.
8. Fixation of Selling Price: The differentiation between fixed costs and variable costs is very helpfulin determining the selling price of the products or services. Sometimes, different prices are chargedfor the same article in different markets to meet varying degrees of competition.
9. Helpful in Budgetary Control: The classification of expenses is very helpful in budgeting andflexible budget for various levels of activities.
10. Preparing Tenders: Many business enterprises have to compete in the market in quoting thelowest price. Total variable cost, when separately calculated, becomes the 'floor price'. Any priceabove this floor price may be quoted to increase the total contribution.
11. 'Make or Buy' Decision: Sometimes a decision has to be made whether to manufacture acomponent or a product or to buy it readymade from the market. The decision to purchase it wouldbe having taken if the price paid recovers some of the fixed expenses.
12. Better Presentation: The statements and graphs prepared under marginal costing are betterunderstood by management executives. The bread even analysis presents the behavior of cost,sales, contribution etc. in terms of charts and graphs. And, thus the results can easily be grasped.

236
14.5 Disadvantages
The disadvantage can be enumerated as below:1. Difficulty to Analyse Overhead: Separation of costs into fixed and variable is a difficult problem.
In marginal costing, semi-variable or semi-fixed costs are not considered.2. Time Element Ignored: Fixed costs and variable costs are different in the short run; but in the
long run, all costs are variable. In the long run all costs change at varying levels of operation. Whennew plants and equipments are introduced, fixed costs and variable costs will vary.
3. Unrealistic Assumption: Assumption of sale price will remain the same at different levels of operation.In real life, they may change and give unrealistic results.
4. Difficulty in the Fixation of Price: Under marginal costing, selling price is fixed on the basis ofcontribution. In case of cost plus contract it is very difficult to fix price.
5. Complete Information not Given: it does not explain the reason for increase in production orsales.
6. Significance Lost: In capital intensive industries, fixed cost occupies major portions in the totalcost. But marginal costs cover only variable costs. As such, it loses its significance in capital industries.
7. Problem of Variable Overheads: Marginal costing overcomes the problem of over and underabsorption of fixed overheads. Yet there is the problem in the case of variable overheads.
8. Sales Oriented: Successful business has to go in a balanced way in respect of selling productionfunctions. But marginal costing is criticized on account of its attaching over importance toselling function. Thus, it is said to be sales oriented. Production function is given less importance.
9. Unreliable Stock Valuation: Under marginal costing stock of work-in-progress and finished stockis valued at variable cost only. No portion of fixed cost is added to the value of stocks. Profitdetermined, under this method, is depressed.
10. Claim for Loss of Stock: Insurance claim for loss or damage of stock on the basis of such avaluation will be un-favourable to business.
11. Automation: Now a days increasing automation is leading to increase in fixed costs. If increasingfixed costs are ignored, the costing system cannot be effective and dependable.Marginal costing, if applied alone, will not be much in use, unless it is combined with othertechniques like standard costing and budgetary control.
Activity B:
1. Discuss the merits and demerits of the Marginal Costing with the help of a company's financialstatement.
14.6 Cost-Volume-Profit Analysis
As the term itself suggests, the cost-volume-profit (CVP) analysis is the analysis of three variables,viz, cost, volume and profit. In CVP analysis, an attempt is made to measure variations of costs andprofit with volume. Profit as a variable is the reflection of a number of internal and external conditionswhich exert influence on sales revenue and costs.
The cost-volume-profit analysis helps or assists the management in profit planning. In order to increasethe profit, a concern must increase the output. When the output is at maximum, within the installed capacity,it adds to the contribution. In the words of Heiser, "The most significant single factor in profit planning of the
237
average business is the relationship between the volume of business, costs and profit." Thereby, cost volumeprofit analysis is the relationship among cost, volume and profit. When volume of output increases, unit costof production decreases, and vice versa; because the fixed cost remains unaffected, when the output increases,the fixed cost per unit decreases. Therefore, profit will be more, when sales price remains constant. Generally,costs may not change in direct proportion to the volume. Thus, a small change in the volume will affect theprofit.
The management is always interested in knowing that which product or product mix is most profitable, whateffect a change in the volume of output will have on the cost of production and profit etc. All these problemsare solved with the help of the cost-volume-profit analysis.
Marginal cost equations
Sales = Variable cost + Fixed Cost + Profit or minus lossSales - Variable cost = Fixed Cost + Profit or minus lossSales - Variable cost = ContributionContribution = Fixed cost + Profit
From the above equation, we can understand that in order to earn profit, the contribution must be more thanthe fixed cost. To avoid any loss, the contribution must be equal to fixed cost.
14.6.1 Contribution
Contribution is the difference between sales and marginal cost of sales. Contribution enables to meet fixedcosts and adds to the profit. Contribution is also known as gross margin. Fixed costs are covered by thecontribution; and the balance amount is an addition to the net profit.
Marginal Cost = Prime Cost + Variable Overhead
Contribution= Sales - Marginal Cost or Contribution = Sales - Variable Cost
Contribution = Fixed Cost + Profit or minus Loss
Profit = Contribution - Fixed Cost
Sale - Variable Cost = Fixed Cost + Profit
Or C= S - VC = FC + P
Illustration: From the following information, find out the amount of profit earned during the year usingmarginal costing technique:
Fixed cost - Rs.500000; Variable Cost- Rs. 10 per unit; Selling Price- Rs. 15 per unit; Output level -150000 units.
Solution:
Contribution = Selling Price - Marginal Cost
= Rs. 22,500,00 - Rs. 15,000,00 = Rs. 7,500,00
Contribution = Fixed Cost + Profit
Rs. 7,50,000 = Rs. 5,00,000 + Profit
Profit = Rs. 2,50,000

238
Activity C:
1. If Marginal cost is Rs 15, sales Rs. 10, fixed Cost Rs. 10000 and Unit sold 2500. What profityou would suggest for decision making in case of marginal costing.
14.6.2 Break -Even Analysis
The break-even point and bread-even chart are two by-products of break even analysis. In a narrowsense, it is concerned with the break even point and in a broad sense; it is concerned with the break evenchart. Break-even analysis is also known as cost volume profit analysis. The analysis is a tool of financialanalysis whereby the impact on profit of the changes in volume, price, costs and mix can be estimated withreasonable accuracy. Break-even-point is equilibrium point or balancing point of no-profit no loss. This is apoint at which loss ceases and profit begins. This is a point where income is exactly equal to expenditure.
Break-even-point: Break-even-point is a point where the total sales are equal to total cost. In this pointthere is no profit or loss in the volume of sales. The formula to calculate bread-even point is:
Illustration:
From the following information, you are required to compute break-even point
Variable cost per unit - Rs. 12; Fixed cost- Rs. 60000; Selling price per unit- Rs. 18.
Solution:
Contribution = Selling Price - Variable Cost
= Rs. 18 - Rs. 12 = Rs. 6
B.E.P. in Units = Fixed Cost/ Contribution per Unit
= Rs. 60000/Rs. 6 = 10000 Units
Break Even Point Sales = Rs. 18 X 10000 Units = Rs. 180000
Illustration: A company estimates that next year it will earn a profit of Rs. 50000. The budgeted fixedcosts and sales are Rs. 250000 and 993000 respectively. Find out the break-even point for the company.
Solution:
Contribution = Fixed Cost + Profit = Rs. 250000 + Rs. 50000 = Rs. 300000
B.E.P. (in Units) = (Fixed Cost X Sales)/ Contribution
= (Rs. 250000 X Rs. 993000)/Rs. 300000 = Rs. 827500
14.6.3 Profit Volume Ratio (P/V Ratio)
Profit volume ratio, which is popularly known as P/V ratio, expresses the relationship of contribution tosales. Another name for this ratio is contribution sales ratio or marginal income ratio or variable profit ratio.The ratio, expressed as a percentage, indicated the relative profitability of different products.
Total Fixed Cost B.E.P. (in units) = ----------------------------
Contribution per unit Or
Fixed Cost = --------------------------------------------
Selling price per unit – Variable cost per Unit

239
The formula for computing the P/V ratio is given below:
It can also be expressed in percentage. Normally, this ratio is expressed in percentage. When we know theP/V ratio, B.E.P. can be calculated, by using the formula:
The profit of a business can be increased by improving P/V ratio. As such management will make efforts toimprove the ratio. A higher ratio means a greater profitability and vice versa. So management will increasethe P/V ratio:
a. By increasing sales price per unitb. By decreasing variable costsc. By increasing the production of products which is having a high P/V ratio and vice-versa.
P/V ratio is very important in decision making. It can be used for the calculation of B.E.P. and inproblems regarding profit sales relationship.
2. Fixed Cost = B.E.P. x P/V ratio
3. Sales required in units to maintain a desired profit
4. Contribution = Sales x P/V ratio
5. Variable costs = Sales (1 - P/V ratio)
6. S X P/V ratio = F+P
Illustration:
From the given data, compute Profit Volume Ratio.
Contribut ion C P/V Ratio = -------------------------- = ------------
Sales S Fixed Cost + Profit FC + P
Or = ---------------------= ----------- Sales S
Sale s – Variable Cost S - VC Or = ----------------------------= ----------
Sales S W hen two periods Sa les and Profit is given then P/V ratio can be computed as below
Change in Profit P/V ratio = ----------------------- x 100
Change in Sa les
F ixed Cost FC B.E .P. (Sales vo lume) = ---------------- or = -----
P/V Ratio P/V Ratio
Fixed Cost FC 1. B.E.P. = -------------- = ------
P/V ratio P/V ratio
F.C. + Desired Profit FC + P Required Contribution -------------------------- = ---------- = ----------------------------
P/V Ratio P/V ratio new contribution per unit

240
Marginal Cost- Rs. 2400; Selling Price- Rs. 3000
Solution:
Contribution = Selling Price - Marginal Cost = Rs. 3000 - Rs. 2400 = Rs. 600
P/V Ratio = (Contribution/ Sales) X 100 = (Rs. 600/ Rs. 3000) X 100 = 20%
Illustration:
The sales turnover and profits during two periods are as under:Period I: Sales Rs. 20 lakhs; Profit- Rs. 2 lakhsPeriod II: Sales Rs. 30 lakhs; Profit Rs. 4 lakhsCalculate P/V Ratio
Solution:
P/V Ratio = (Change in Profit/Change in Sales) X 100
= (Rs. 4 lakhs - Rs. 2 lakhs/ Rs. 30 lakhs - Rs. 20 lakhs) X 100
= (200000/1000000) X 100 = 20%
Activity D:
1. If your trading concerns result for first and second quarter sales and profits are Rs. 25000; Rs.5000; Rs. 37,500 and Rs. 10000 respectively. What is the Profit Volume Ratio of your tradingconcern? If you want to earn a profit of Rs. 7500 then what would be your sales and if salesis Rs. 20,000 then how much profit you will be able to earn?
14.6.4 Margin of Safety
Margin of Safety is an important concept in Marginal Costing approach. Total sales minus the sales atbreak-even point are known as the margin of safety (MOS). That is, Margin of safety is the excess ofnormal or actual sales over sales at break-even point. In other words, sales over and above break-even sales are known as Margin of Safety. The Margin of Safety refers to the amount by which salesrevenue can fall before a loss is incurred. That is, it is the difference between the actual sales and salesat the break-even point. Break-even-point can be compared to a Red signal point. If margin of safety islarge, it is sign of soundness of the business and vice versa. The margin of safety serves as a guide is areliable indicator of the business strength and soundness. Margin of safety can be expressed in absolutesales amount or in percentage.
High margin of safety indicates the soundness of a business because even with substantial fall in sale or fallin production, some profit shall be made. Small margin of safety on the other hand is an indicator of theweak position of the business and even a small reduction in sale or production will adversely affect the profitposition of the business.
Margin of safety can be increased by:
a. Decreasing the fixed cost;
b. Decreasing the variable cost;
c. Increasing the selling price;
d. Increasing output and sales;
e. Changing to product mix that improves P/V ratio

241
Margin of safety: Actual Sales - Sales at B.E.P.
Illustration: From the following details find out i) Profit Volume Ratio ii) B.E.P. and iii) Margin of safety.
Sales- Rs. 1,00,000; Total Cost- Rs. 80,000; Fixed Cost- Rs. 20,000 and Net Profit- Rs. 20,000
Solution:
i) P/V ratio = Contribution/Sales X 100
= (100000 - 60000)/100000 X 100 = 40%
ii) B.E.P. = Fixed Cost/ Profit volume ratio
= Rs. 20000/40% = Rs. 50000
iii) Margin of safety = Profit/ Profit Volume ratio
= Rs. 20000/ 40% = Rs. 50000
Or Margin of Safety = Actual Sales - Sales at BEP
= Rs. 100000 - Rs. 50000 = Rs. 50000
Illustration: From the following data, calculate: i) P/V Ratio ii) Profit when sales are Rs. 20000 iii) NewBreak Even Point if selling price is reduced by 20%; Fixed Expenses- Rs. 4000; Break-Even Point- Rs.10000
Solution:i) Break Even Sales = Fixed Expenses/ Profit Volume Ratio
Profit Volume Ratio = Fixed Expenses/Break Even Sales= (Rs. 4000/Rs. 10000) X 100 = 40%
ii) When sales are Rs.20000, the profit is= Sales X Profit Volume Ratio - Fixed Expenses= Rs. 20000 X 40% - Rs. 4000 = Rs. 4000
iii) If selling price is reduced by 20%, the new break even point would be Rs. 80 (say Rs.100 - Rs.20).
Variable Cost per Unit = 100 - 40% = Rs. 60
New P/V Ratio = (80 - 60)/80 X 100 = 25%
New Break Even Point = (4000 X 100)/25 = Rs. 16000
Activity E:
1. If your Company's given data are margin of safety ratio 20%; P/V ratio 60% and fixed costRs. 30000 and you are eager to know Break Even Sales, actual sales, variable cost and profit forthe year for the meeting. How would you know all this? Explain
Profit Profit (or) = -------------- or = ---------------
P/V ratio Contribution Marg in of Safety
As a percentage = ----------------------- x 100 Total Sales

242
14.7 Break-Even-Chart
The technique of break-even analysis can be made easy with the help of graph or mathematical formula.Graphical representation of break-even point (or cost-volume-profit) is known as the break-even chart.Dr. Vance is of the opinion that "it is a graph showing the amounts of fixed variable costs and the salesrevenue at different volumes of operation. It shows at what volume the firm first covers all costs withrevenue of break-even." B.E.C. shows the profitability or otherwise of an undertaking at various levels ofactivity, and indicates the point at which neither profit nor loss is made. Break-even point is known as "noprofit, no loss point". So the chart is also known as bread-even chart. At this point, the total costs arerecovered and profit begins.
14.7.1 Significance of B.E.C.at various levels of activity1. It will show the variable costs, fixed costs and total costs.2. Sales value or unit can be known.3. Profit or loss can be known.4. Margin of safety can be known.5. Angle of incidence or the intersection of sales line with costs line can also be known.
Thus, it is very useful for managerial decision.
14.7.2 Assumptions of Break-even chart1. Fixed costs remain the same and do not change with level of activity.2. Costs are divided into fixed and variable costs. Variable costs change according to the volume of
production.3. Variable cost varies with the volume of output but price of variable costs such as wage rate, price of
materials, suppliers will be unchanged.4. Selling price remains the same at different levels of activity.5. There is no change in the product mix.6. There is no change in the level of efficiency.7. Policies of management do not change.8. No change in the manufacturing process is due to non-static operating efficiency.9. As the number of units produced and sold is the same, there is no closing or opening stock.
14.7.3 Construction of Break-even Chart
1. On the graph the 'X' axis (horizontal axis) shows the volume of production and the 'Y' axis (verticalaxis) shows the cost and production. A graph has two sides which are known as 'axes'. The horizontalside at the bottom of the graph is the X axis. The left hand vertical side is the 'Y' axis. On the 'Y'axis, costs and revenues are exhibited. On the 'X' axis one or more of production quantity, capacityon percentage form, sale volumes etc. are shown.
2. Draw both the axes on the suitable graph paper on the basis of appropriate scale.3. Insert production quantity on X axis and cost and sales revenues on Y-axis.4. Draw the fixed cost line on the graph. Even if zero production, the fixed costs will be the loss.5. The total cost line is drawn above the fixed cost line. For this purpose, the variable cost is added to
the fixed cost to arrive at the total cost and drawn at each and every scale of production.6. Sales revenue line is drawn commencing at zero and finishing at the last point.7. Then the sales line cuts the total cost line i.e., sales equals the total costs line i.e. sales equals the
total cost. This is known as Break-even point. If dotted line is drawn from BEP to X axis, itindicates BEP (Units) and if it is drawn towards Y-axis, it indicates BEP (value).

243
8. The difference between the sales line and total cost line is marked as profit and it is to the right ofBEP. The angle at which sales line cuts the total cost line is the angle of incidence.
9. The position to the left of the BEP on the graph indicates the loss which goes up to the total amountof fixed costs which is the maximum loss at the zero production.
10. Then the graph will indicate the BEP, profit and loss at different level of output, margin of safety,contribution and the relationship between the marginal cost, fixed cost and total cost.
14.7.4 Advantages of Break-even Analysis and Chart1. Total cost, variable cost and fixed cost can be determined.
2. Break-even output or sales value can be determined.
3. Cost, volume and profit relationship can be studied and they are very useful to the managerialdecision making.
4. Inner-firm comparison is possible.
5. It is useful for forecasting plans and profits.
6. The best product mix can be selected.
7. Total profits can be calculated.
8. Profitability of different levels of activity, various products or profit, i.e. plans can be known.
9. It is helpful for cost control.
14.7.5 Limitations of Break-even chart
B.E.C. is constructed under some unrealistic assumptions:
1. Exact and accurate classification of cost into fixed and variable is not possible. Fixed costs varybeyond a certain level or output. Variable costs per unit are constant and it varies in proportion tothe volume.
2. Constant selling price is not true.
3. Detailed information cannot be known from the chart. To know all the information about fixed cost,variable cost and selling price, a number of charts must be drawn.
4. No importance is given to opening and closing stocks.
5. Various product mixes on profits cannot be studied as the study is concern.
Activity F:
1. Your supervisor is interested to know the pictorial figure to understand the BEP and otheraspects. You have the data of fixed cost Rs. 2000; Variable Cost Re. 0.50; Sales Re. 1 per unit andUnit produced and sold 2000, 4000, 6000, 8000 and 10000. With the help of this draw a chart toshow your command on the concept.
14.8 Summary
Marginal Costing is an extremely valuable technique with the management. The cost-volume-profit relationshiphas served as a key to locked storehouse of solutions to many situations. It enables the management totackle many problems which are faced in the practical business. The introduction of marginal cost principlesdoes is to give the management a fresh and perhaps a refreshing, insight into the progress of their business.

244
14.9 Self Assessment Questions
1. What do you mean by Marginal Costing and Marginal Cost? How Marginal Costing is differs fromtotal cost?
2. How Break - even analysis contributes in Profit Planning?
3. What are the uses of Break-Even-Chart?
4. How absorption costing is different from marginal Costing?
5. What do you understand by 'C-V-P analysis? Explain its importance.
14.10 Reference Books
- Management Accounting by I. M. Pandey
- Management Accounting by S.N. Maheswari
- Management Accounting I by M. R. Agarwal

245
Unit - 15 : Standard Costing and Variance Analysis
Structure of Unit:
15.0 Objectives15.1 Introduction15.2 Definitions of Standard, Standard Cost and Standard Costing15.3 Advantages of Standard Costing15.4 Limitations of Standard Costing15.5 Setting the Standards15.6 Variance Analysis15.7 Favourable and Unfavourable Variances15.8 Controllable and Uncontrollable Variances15.9 Computation of Variances15.10 Material Variances15.11 Labour Variances15.12 Overhead Variances15.13 Summary15.14 Self Assessment Questions15.15 Reference Books
15.0 Objectives
After completing this unit, you would be able to:
Understand the concept of Standard, Standard Cost and Standard Costing. Know the advantages and limitation of Standard Costing. Learn to set the various type of Standards Able to identify the favourable and unfavourable variances. Identify the controllable and Uncontrollable Variances. Understand the utility of Variance Analysis for management decision making. Point out the Favourable and Adverse Variances in order to take the remedial action. Able to compute Material, Labour and Overhead Variances.
15.1 Introduction
Historical costing or actual costing is a system where costs are ascertained after they are incurred. Itis a post-mortem of the costs. Historical costing does not help in finding mistakes and inefficiencies, whichall lead to variation in profit. Due to these disadvantages and limitations of historical costing, the standardcosting technique was introduced in the U.S.A. and in the U.K. in India also standard costing is used widelyand recognized greatly.
Standard cost seeks to establish the cost of a product, operations or process under standard operatingconditions. The aim of standard cost is to eliminate the influence of abnormal changes in prices. It is used asa guide for future decision and action over a period of time. Standard costing is an effective managementtool for planning, decision making, coordination and control of business. The object of standard cost is toascertain the quotation and determination of price policy. It is a technique of cost control.
246
15.2 Definitions of Standard, Standard Cost and Standard Costing
15.2.1 Standard: According to Prof. Eric L. Kohler, "Standard is a desired attainable objective, a perfor-mance, a goal, a model". Standard may be used to a predetermined rate or a predetermined amount or apredetermined rate or a predetermined amount or a predetermined cost.
15.2.2 Standard Cost: Standard costs are predetermined cost or forecast estimate of cost. I.C.M.A.Terminology defines standard cost as, "a predetermined cost which is calculated from management stan-dards of efficient operations and the relevant necessary expenditure. It may be used as a basis for pricefixing and for cost control through variance analysis". The other names for standard costs are predeterminedcosts, budgeted costs, projected costs, model costs, measured costs, specification costs etc. Standard costis predetermined estimate of cost to manufacture a single unit or a number of units of a product during afuture period. Actual costs are compared with these standard costs.
15.2.3 Standard Costing: It is defined by I.C.M.A. Terminology as "The preparation and use of standardcosts, their comparison with actual costs and the analysis of variances to their causes and points of inci-dence".
According to Wheldon "Standard costing is a method of ascertaining the costs whereby statistics are pre-pared to show (a) the standard cost (b) the actual cost (c) the difference between these costs, which istermed the variance".
Thus the technique of standard cost study comprises of1. Ascertainment and use of standard costs.2. Comparison of actual costs with standard costs and measuring the variances.3. Controlling costs by the variance analysis.4. Reporting to management for taking proper action to maximize the efficiency.
Activity A:
1. Analyse the Standard, Standard Cost and Standard Costing. Do you feel that these aredifferent from Historical and Estimate Cost for a business? If yes then justify your analysis.
15.3 Advantages of Standard Costing
The advantages of standard costing can be enumerated as below:
1. It helps the management in formulating price and production policy.
2. It is a yardstick of performance. Standard costs are compared with actual costs, and the differ-ences are analysed and effective cost control is taken. Thus reduction of cost is possible by increas-ing the profits.
3. It reduces avoidable wastages and losses.
4. It facilitates to reduce clerical and accounting cost and managerial time.
5. It creates cost consciousness among the personnel because the variance analysis fixes responsibilityfor favourable or unfavourable performances.
6. Executive become more responsible, as it shows clearly who is responsible for the cost centers.
7. By the variance analysis and reporting, "the principle of management by exception" is facilitated.Management must concentrate their attention on variations only.
8. It aids in budgetary control and in decision making.

247
9. Opening stock and closing stock are valued at the standard price. This helps in the preparation ofProfit and Loss account for a short period say a week, a month.
10. It facilitates timely cost reports to management and a forward looking mentality is encouraged at alllevels of the management. It is a basis for the implementation of an incentive system for the employ-ees.
Standard cost forms a basis for future planning, preparation of tenders, fixation of price etc. Otherwise, orin the absence of standard cost, decision will be based on actual cost. The prices of material, labour etc.may change from time to time. There must be a fixed cost structure based on normal standard efficiency.Thus it helps the management in formulating price and production policy.
When standards have been fixed, the section heads safely delegate the responsibility to the workers. Thestandard of activity can be measured through the costing reports.
Introduction of standard cost facilitates timely reporting. The management gives attention to the variancesand takes corrective steps. The costing reports, based on standard cost, reveal the overall result of themanufacturing side.
15.4 Limitations of Standard Costing
Standard Costing suffers from following limitations1. It is costly, as the setting of standards needs high technical skill.2. Keeping of up-to-date standard is a problem. Periodic revision of standard is a costly thing.3. Inefficient staff is incapable of operating this system.4. Since it is difficult to set correct standards, it is difficult to ascertain correct variances.5. Industries, which are subject to frequent changes in technological process or the quality of material
or the character of labour, need a constant revision of standard. But revision of standard is moreexpensive.
6. For small concerns, standard costing is expensive.7. It is difficult to apply this method where production takes more than one accounting period. Stan-
dard costing may not be effective in industries which deal in non-standardised products or jobs asper the customer's requirements.
Activity B:
1. If you have to suggest to your supervisor for adopting the standard costing system in the business.How would you convince your supervisor indicating pros and cons of the standard costing system?
15.5 Setting the Standards
While setting standard cost for operations, process of products, the following preliminaries must be gonethrough:
1. There must be Standard Committee, similar to Budget Committee in which purchase manager,personnel manager and Production manager are represented. The cost accountant coordinates thefunctions of the Standard Committee.
2. Study the existing costing system, cost records and forms in use. If necessary, review the existingsystem.

248
3. A technical survey of the existing methods of production should be undertaken so that accurate andreliable standards can be established.
4. Determine the type of standard to be used.5. Fix standard for each element of cost.6. Determine standard costs for each product.7. Fix the responsibility for setting standards.8. Classify the accounts properly so that variances may be accounted for in the manner desired.9. Comparison of actual costs with pre-determined standards to ascertain the deviations.10. Action to be taken by management to ensure that adverse variance is not repeated.
Activity C:
1. Assume yourself as a cost accountant and taking the example of a hypothetical company, setthe standard and its outline.
15.6 Variance Analysis
The most significant contribution of standard costing to the science and art of management is the presenta-tion of 'variances'. As a matter of fact, without determination and analysis of variances, standard costing ismeaningless. The term 'Variances' has been derived from the verb 'To vary' meaning to differ. In costaccounting, variance means deviation of the actual cost from the standard cost. In standard costing, stan-dard costs are predetermined and refer to the amounts which ought to be incurred. These become theyardsticks against which actual costs can be compared.
Variance analysis is the process of analyzing variance by sub-dividing the total variance in such a way thatmanagement can assign responsibility for off-standard performance. It, thus, involves the measurement ofthe deviation of actual performance from the intended performance. That is, variance analysis is a tool tomeasure performances and based on the principle of management by exception. In variance analysis, theattention of management is drawn not only to the monetary value of unfavourable and favourable managerialperformance but also to the responsibility and causes for the same.
After the standard costs have been fixed, the next stage in the operation of standard costing is to ascertainthe actual cost of each element and compare them with the standard already set. Computation and analysisof variances is the main objective of standard costing. The deviation of actual from the standard is called'variance'. The difference between the actual cost and the standard cost is known as the 'cost variance'.
Activity D:
1. How you would interpret that the different variances can contribute in business decision making?Explain with the help of suitable example.
15.7 Favourable and Unfavourable Variances
Variances may be favourable (positive or credit) or unfavourable (negative or adverse or debit) dependingupon whether the actual resulting cost is less or more than the standard cost.
15.7.1 Favourable Variance: When the actual cost incurred is less than the standard cost, the deviation isknown as favourable variance. The effect of favourable variance increases the profit. Again favourablevariance would result when the actual cost is lower than the standard cost. It is also known as positive orcredit variance and viewed only as savings.

249
15.7.2 Unfavourable Variance: When the actual cost incurred is more than the standard cost, there is avariance, known as unfavourable or adverse variance. Unfavourable variance refers to deviation to the lossof the business. It is also known as negative or debit variance and viewed as additional costs or losses.
When the profit is greater than the standard profit, it is known as favourable variance. When the profit is lessthan the standard profit, it is known as unfavourable variance. This favourable variance is a sign or efficiencyof the organization and the unfavourable variance is a sign of inefficiency of the organisation.
15.8 Controllable and Uncontrollable Variances
Variances may be controllable or uncontrollable, depending upon the controllability of the factors causingvariances.
15.8.1 Controllable Variance: A variance is said to be controllable if it can be identified as the primaryresponsibility of a specified person or department. That is, it refers to a deviation caused by suchfactors which could be influenced by the executive action. For example excess usage of materials,excess time taken by a worker etc. is example for controllable variance. When compared to the standardcost it becomes controllable because the responsibility can be fixed on the in-charge or foreman of thedepartment.
15.8.2 Uncontrollable Variance: When variance is due to the factors beyond the control of the con-cerned person (or department), it is said to be uncontrollable. Cost variance is due to outside factors, forexample, the wage rate increased on account of strike, Government restrictions, change in market price etc.No person or department can be held responsible for uncontrollable variances. Here revision of standardsis required to remove such variances in future.
Activity E:
1. What can be the probable reasons for the Variance? Can it be Controlled? If yes, then list outthose variances and the strategies to be adopted for controlling them.
15.9 Computation of Variances
The computation and analysis of variance are the objectives of standard costing. The causes of variance arenecessary to find remedial measures. Variances can be found out with respect to all the elements of cost, i.e.direct material, direct labour and overheads. In other words, the total cost variance is split into its compo-nent parts on the basis of elements, and each element is further subdivided to locate the responsibility ofvariance. The variances can be studied in the following manner.
A) Material VariancesB) Labour or wage VariancesC) Overhead Variances (i) Variable and (ii) FixedD) Sales VariancesE) Profit Variances
This Unit will describe only above three variances
15.10 Material Variances
Material variance involves the below mentioned Variances
15.10.1 Material Cost Variance: It is the difference between the standard cost of direct materials speci-fied for the output achieved and the actual cost of direct materials used. The standard cost of materials is

250
computed by multiplying the standard price with the standard quantity for actual output; and the actual costis computed by multiplying the actual price with the actual quantity.
Material Cost Variance (MCV) = Standard Cost of Materials - Actual Cost of Material Used
Or
MCV = Standard Cost of Actual Output - Actual Cost
Or
MCV= (Standard Quantity for Actual Output X Standard Price) - (Actual Quantity X Actual Price) = (SQX SP) - (AQ X AP)
Illustration: The standard cost of material for manufacturing a unit of a particular product is estimated asfollows: 16 kg. of raw materials @ Rs. 2 per kg. On completion of the unit, it was found that 20 kg. of rawmaterial costing Rs. 1.50 per kg. has been consumed. Compute material variances.
Solution: MCV = (SQ X SP) - (AQ X AP) = (16 X Rs. 2) - (20 X Rs. 1.50) = Rs. 32 - Rs. 30 = Rs. 2 (Favourable)
15.10.2 Material Price Variance: Material price variance is that portion of the direct material cost vari-ance which is the difference between the standard price specified and the actual price paid for the directmaterials used. The formula is:
Material Price Variance (MPV) = (Actual quantity consumed X Standard Price) - (Actual quantity con-sumed X Actual Price)
Or
MPV = Actual quantity consumed (Standard Rate - Actual Rate) = AQ (SR - AR)
Illustration:
The standard cost of material for manufacturing a unit of a particular product is estimated as follows: 20 kgof raw materials @ Rs. 2 per kg. On completion of the unit, it was found that 25 kg. of raw material costingRs. 3 per kg. has been consumed.
Solution:
MPV = AQ (SR - AR)
= 25 (Rs. 2 - Rs. 3) = Rs. 25 (Adverse)
15.10.3 Material Usage (Quantity) Variance: It is the deviation caused by the standards due to thedifference in quantity used. It is calculated by multiplying the difference between the standard quantityspecified and the actual quantity used by the standard price.
Material Usage or Quantity Variance (MU or QV) = Standard Rate (Standard Quantity - Actual Quantity)= SR(SQ - AQ)
Illustration:
From the following data, you are required to material usage variance.Standard - 20 kg. at Rs. 5.50 per kg.Actual - 25 kg. at Rs. 6 per kg.

251
Solution:
MUV = SR (SQ - AQ)
= Rs. 5.50 (20 -25) = Rs. 27.50 (Adverse)
Material Usage Variance may further be classified into Material Mix Variance (MMV) and either MaterialYield Variance (MYV) or Material Revised Usage Variance.
15.10.4 Material Mix Variance: I.C.M.A. defines it as 'that portion of direct material usage variancewhich is the difference between the actual quantities of ingredients used in a mixture at standard price andthe total quantity of ingredients used at the weighted average price per unit of ingredient as shown by thestandard cost sheet'. When two or more materials are used in the manufacture of a product, the differencebetween the standard composition and the actual composition of material mix is the Material Mix Variance(MMV).
MMV = Standard Rate (Standard Mix - Actual Mix)
I) When actual weight of mix and standard weight of mix are the same.
MMV = Standard Rate (Standard Quantity - Actual Quantity) = SR(SQ -AQ)
Standard is revised due to the shortage of a particular type of material. The formula is: MMV = StandardRate (Revised Standard Quantity - Actual Quantity) = SR (RSQ - AQ)
Total weight of actual mixRSQ = -------------------------------- X Standard Quantity
Total weight of standard mix
II) When the actual weight of mix and standard weight of mix differ from each other, the formulato find new standard mix is:Total weigh of actual mix---------------------------------Total weigh of standard mix
After finding out this revised standard mix it is multiplied by the revised standard cost of standard mix andthen the standard cost of actual mix is subtracted from the result.
Revised usage variance or sub-usage variance = Standard Rate (Standard Quantity - Revised StandardQuantity)
Material mix variance arises when standard mix of the materials is different from the actual mix ratio. If theratio of standard mix and actual mix is the same, the quantities may differ, there will be no mix variance.
15.10.5 Material Yield Variance: It is that portion of the direct material usage variance which is due tothe difference between the standard yield specified and the actual yield obtained. The variance arise due toabnormal contingencies like spoilage, chemical reaction etc. Since the variance is a measure of the waste orloss in the production, it can also be known as material loss or waste variance. In case actual yield is morethan the standard yield, the materials yield variance is favourable and if the actual yield is less than thestandard yield, the variance is unfavourable or adverse.

252
I) When actual mix and standard mix are the same the formula is:
MYV = Standard Yield Rate (Standard Yield - Actual Yield) or
= Standard Revised Rate (Actual Loss - Standard Loss)Standard cost of standard mix
Standard Yield Rate = --------------------------------Net Standard Output
Net Standard Output = Gross Output - Standard Loss.
II) When the actual mix and the standard mix differ from each other, the formula is:
MYV = Standard Rate (Actual Standard Yield - Revised Standard Yield)
Standard Cost of Revised Standard MixStandard Rate = ----------------------------------
Net Standard Output
Relationship or Verification MCV = MPV + MUV MUV = MMV + MYV MCV = MPV + MMV + MSUV
Illustration: The standard material cost for 100 kg. of Chemical D is made up of: Chemical A -30 kg@ Rs. 4 per kg.; Chemical B - 40 kg. @ Rs. 5 per kg.; Chemical C - 80 kg. @ Rs. 6 per kg.
In a batch, 500 kg of chemical D were produced from a mix of: Chemical A - 140 kg. at a cost of Rs.588; Chemical B - 220 kg. at a cost of Rs. 1056; Chemical C - 440 kg. at a cost of Rs. 2860.
How do the yield, mix and the price factor contribute to the variance in the actual per 100 kg. ofchemical D over the standard cost?
Solution: We have to find out the variances only for 100 kg. of output. Therefore, the data requiredis calculated as follows: 588Chemical A : Rate = --------- = Rs. 4.20 per kg. 140
1056Chemical B: Rate = ------------ = Rs. 4.80 per kg.
220
2860Chemical C: Rate = ------------- = Rs. 6.50 per kg.
440
For 100 kg. of chemical D, the required Chemical is:
140 X 100 220 X 100 400 X 100A = -------------- = 28 kg. B = ------------- = 44 kg. C = ---------------- = 88 kg. 500 500 500
Material Cost Variance (MCV) = (SQ XSP) - (AQ X AP)

253
Chemical A = (30 X Rs. 4) - (28 X Rs. 4.20) = Rs. 2.40 (F)
Chemical B = (40 X Rs. 5) - (44 X Rs. 4.80) = Rs. 11.20 (A)
Chemical C = (80 X Rs. 6) - (88 X Rs. 6.50) = Rs. 92.00 (A)
Total MCV = Rs. 100.80 (A)
Material Price Variance (MPV) = AQ (SP - AP)
Chemical A = 28 (4 - 4.20) = Rs. 5.60 (A)
Chemical B = 44 (5 - 4.80) = Rs. 8.80 (F)
Chemical C = 88 (6 - 6.50) = Rs. 44.00 (A)
Total MPV = Rs. 40.80 (A)
Material Usage variance (MUV) = SP (SQ -SP)
Chemical A = 4 (30 - 28) = Rs. 8 (F)
Chemical B = 5(40 - 44) = Rs. 20 (A)
Chemical C = 6 (80 - 88) = Rs. 48 (A)
Total MUV = Rs. 60 (A)
Material Mix Variance (MMV) = SP (RSQ - AQ)
The actual quantity of 160 kg. is to be apportioned in the standard proportion i.e. 30:40:80, so RSQ isrequired.
160 X 30 160 X 40 160 X 80
A = -------------- = 32 kg. B = --------------- = 42.67 kg. C = ---------------- = 85.33 kg.
150 150 150
Chemical A = 4 (32 - 28) = Rs. 16.00 (F)
Chemical B = 5 (42.67 - 44) = Rs. 6.67 (A)
Chemical C = 6 (85.33 - 88) = Rs. 16.00 (A)
Total MMV = Rs. 6.67 (A)
Material Yield Variance (MYV) = SP (AY - SY)
Total Standard Price 800
Standard Price = ---------------------------- = ------------ = Rs. 8
Standard Output 100
150 kg. mix will produce 100 kg. so 160 kg. of mix will produce = 100 X 160/150 = 106.67 kg.
MYV = Rs. 8 (100kgs. - 106.67) = Rs. 53.33 (A)
Verification: MCV = MPV + MUV Rs. 100.80 (A) = Rs.40.80 (A) + Rs. 60 (A)
MUV = MMV + MYV Rs. 60 (A) = Rs. 6.67 (A) + Rs. 53.33 (A).

254
Activity F:
1. If your company is engaged in producing a standard mix using 60 kgs of chemical X and 40 kgs. Ofchemical Y. The standard loss of production is 30%. The standard price of X is Rs. 5 per kg. andof Y is Rs. 10 per kg. The actual mixture for X- 80 kgs. @ Rs. 4.50 per kg. and for Y- 70 kgs. @Rs. 8.00 per kg. and actual yield is 115 kgs. What are the relevant material variances which can becomputed.
15.11 Labour Variances
Labour variances arise because of i) difference in actual rates and standard rates of labour and ii) thevariation in actual time taken by workers and the standard time allotted to them for performing a job. Thesevariances are computed on the same pattern as those of material variances. One can find out the variousformulae for labour variances by simply putting the word 'time' or 'hour' at the place of 'quantity' and 'rate'at the place of 'price' in the formulae of material variances. The various labour variances can be analysed asfollows:
15.11.1 Labour Cost Variance or Labour Wage Variance (LCV or LWV): This variance representsthe difference between the standard labour cost and the actual labour costs. That is, it is the differencebetween standard direct wages specified for the activity achieved and the actual direct wages paid. Labourcosts may be considered wages including pay, allowances and other expenses on labour. If the standardcost is higher, the variation is favourable and vice versa. This variance can be calculated with the help of thefollowing formulae:
Labour Cost Variance (LCV) = Standard Cost of Labour - Actual Cost of Labour
LCV = (Standard Hour X Standard Rate) - (Actual Hour X Actual Rate)
LCV = (SH X SR) - (AH X AR)
15.11.2 Labour or Wage Rate Variance (L or WRV): This variance is the direct result of the wages paidat a rate different from the standard rate. That is, it is the difference between the standard rate of payspecified and the actual rate paid. If the standard rate is higher then the variance is favourable and viceversa.
Labour Rate Variance (LRV) = Actual Hour (Standard Rate - Actual Rate)
LRV = AH (SR - AR)
15.11.3 Labour Efficiency Variance (LEV): The terminology defines Labour Efficiency Variance as 'thedifference between the standard hours for the actual production achieved and the hours actually worked,valued at the standard labour rate.' This variance represents standard wages for the difference between thehours allowed for a job and the hours actually taken. When the workers finish the specific job in less thanthe standard time, the variance is favourable. It is important to note that the actual time should be taken afterdeducting abnormal idle time if any.
Labour Efficiency Variance (LEV) = Standard Rate (Standard Hour - Actual Hour)
LEV = SR (SH - AH)
15.11.4 Labour Idle Time Variance (LITV): This type of variance arises because of the time duringwhich the labour remains idle due to abnormal reasons, i.e., power failure, strikes, machine breakdown,shortage of materials etc. The idle time will affect the efficiency of employees when such time loss is beyondtheir control. This will always be an adverse variance.

255
Labour Idle Time Variance (LITV) = Abnormal Idle Time X Standard Hourly Rate
15.11.5 Labour Mix Variance or Gang Composition Variance (LMV): It results from employingdifferent grades of labour from the standard fixed in advance. It is the difference between the standardcomposition of workers and the actual gang of workers. It is a part of labour efficiency variance. Thisvariance enables the management to study the labour cost variance occurred because of the changes in thecomposition of labour force. The rates of pay of the different categories of workers- skilled, semi-skilledand unskilled, are different. Hence, any change made in composition of the workers will naturally causevariance. There are two situations of the changes in the composition of workers.
i) When the total hours i.e. time of the standard composition and actual composition of workersdo not differ, the formulae is:Labour Mix Variance (LMV) = (Standard Cost of Standard Mix) - (Standard Cost of ActualMix)
ii) When the total hours i.e. time of the standard composition and actual composition of workersdiffer, the formulae is:
LMV = (Total time of Actual Mix / Total time of Standard Mix X Standard Cost of Standard Mix) -(Standard Cost of Actual Mix)
15.11.6 Labour Yield Variance (LYV): It is the difference between the standard labour output and actualoutput or yield. It is calculated as below:
Labour Yield Variance (LYV) = Standard Cost per Unit (Standard Production of Actual Mix - ActualProduction)
If the actual production is more than standard production, it would result in a favourable variance andvice versa.
Relationship or VerificationLCV = LRV + LEVLEV = LMV + LITVLEV = LYV + LITVLEV = LMV + LYV + LITV
Illustration:
From the following information, you are required to compute the labour variance:
Direct Wages: Rs. 3000; Standard hours produced: 1600 and Standard rate per hour: Rs. 1.50.
Actual hours paid 1500 hours, out of which hours not worked (abnormal idle time) are 50.
Solution:
Labour Cost Variance (LCV) = (SH X SR) - (AH X AR)= (1600 X Rs. 1.50) - (1500 X Rs. 2) = Rs. 600 (A)
Labour Rate Variance (LRV) = AH (SR - AR)= 1500 (Rs. 1.50 - Rs. 2.00) = Rs. 750 (A)
Labour Efficiency Variance (LEV) = SR (SH - AH)Actual Hour = Actual Hour Paid - Abnormal idle Hour
= 1500 - 50 = 1450
= Rs. 1.50 (1600 - 1450) = Rs. 225 (F)

256
Labour Idle Time Variance (LITV) = Idle Time X SR
= 50 X Rs. 1.50 = Rs. 75 (A)
Verification: LCV = LRV + LEV + LITV
Rs. 600 (A) = Rs. 750 (A) + Rs. 225 (F) + Rs. 75 (A)
Illustration:
Standard labour hours and rate of production of Article A are given below:
Skilled Worker- 5 hours @ Rs. 1.50 per hour Total Rs. 7.50
Unskilled Worker- 8 hours @ Rs. .50 per hour Total Rs. 4.00
Semi-skilled Worker- 4 hours @ Rs. .75 per hour Total Rs. 3.00
Grand Total Rs.14.50
Actual Data
Article produced- 1000 units
Skilled Worker- 4500 hours, Rate Rs. 2.00 per hour Total Rs. 9000
Unskilled Worker- 10000 hours, Rate Rs. 0.45 per hour Total Rs. 4500
Semi-skilled Worker- 4200 hours, Rate Rs. 0.75 per hour Total Rs. 3150
Grand Total Rs. 16650
Calculate a) Labour Cost Variance b) Labour Rate Variance c) Labour efficiency Variance and d) LabourMix Variance.
Solution:
a) Labour Cost Variance (LCV) = (SH for Actual Production X SR) - (AH X AR)
Computation of Standard Hour for Actual Production
Skilled Worker- 1000 X 5 = 5000 Hours
Unskilled Worker- 1000 X 8 = 8000 Hours
Semi-skilled Worker- 1000 X 4 = 4000 Hours
Labour Cost Variance (LCV)
Skilled Worker = (5000 X Rs. 1.50) - (4500 X Rs. 2) = Rs. 1500 (A)
Unskilled Worker = (8000 X Rs. 0.50) - (10000 X Rs. 0.45) = Rs. 500 (A)
Semi-skilled Worker = (4000 X Rs. 0.75) - (4200 X Rs. 0.75) = Rs. 150 (A)
Total Labour Cost Variance = Rs. 2150 (A)
b) Labour Rate Variance (LRV) = AH (SR - AR)
Skilled Worker = 4500 (1.50 - 2) = Rs. 2250 (A)
Unskilled Worker = 4200 ( 0.75 - 0.75) = Nil
257
Semi-skilled Worker = 1000 (0.50 - 0.45) = Rs. 500 (F)
Total Labour Rate Variance = Rs. 1750 (A)
c) Labour Mix Variance (LMV) = SR (RSH - AH)
Revised Standard Hour (RSH) = Standard Mix/Total Standard Hours X Total Actual Hours
Skilled Worker = 5000/17000 X 18700 = 5500 hours
Unskilled Worker = 8000/17000 X 18700 = 8800 hours
Semi-skilled Worker = 4000/17000 X 18700 = 4400 hours
Labour Mix Variance
Skilled Worker = 1.50 (5500 - 4500) = Rs. 1500 (F)
Unskilled Worker = 0.50 ( 8800 - 10000) = Rs. 600 (A)
Semi-skilled Worker = 0.75 (4400 - 4200) = Rs. 150 (F)
Total Labour Mix Variance = Rs. 1050 (F)
d) Labour Efficiency Variance (LEV) = SR (SH for Actual Production - RSH)
Skilled Worker = 1.50 (5000 - 5500) = Rs. 750 (A)
Unskilled Worker = 0.50 ( 8000 - 8800) = Rs.400 (A)
Semi-skilled Worker = 0.75 (4000 - 4400) = Rs. 300 (A)
Total Labour Efficiency Variance = Rs. 1450 (A)
Verification = LCV = LRV + LMV +LEV
Rs. 2150 (A) = Rs. 1750 (A) + Rs. 1050 (F) + Rs. 1450 (A)
Activity G:
1. Your are instructed by your supervisor to report the labour variances from the following data:Standard labour rate- Rs. 2 per hour; Standard hours- 2 per unit; Actual labour rate- Rs. 2.25per hour; Actual units produced- 1000 units and actual hours worked 1950 hours. Whatlabour variances, you would report to your supervisor?
15.12 Overhead Variances
Overhead variance is the difference between the standard cost of overhead absorbed in the actual outputachieved and the actual overhead cost. The term overhead includes indirect material, indirect labour andindirect expenses and the variances relate of factory, office and selling and distribution overheads. Over-head variances are divided into two broad categories i) Variable Overhead variances and ii) Fixed Over-head variances. Some overhead calculation is used as below:Standard Overhead Rate per Unit = Budgeted Overheads/ Budgeted OutputStandard Overhead Rate per Hour = Budgeted Overheads/ Budgeted HoursStandard Hours for actual Output = (Budgeted hours/Budgeted output) X Actual OutputStandard Output for actual Time = (Budgeted Output/Budgeted Hours) X Actual HoursRecovered or absorbed overhead = Standard Rate per Unit X Actual Output

258
15.12.1 Variable Overhead Variance: Variable cost varies in proportion to the level of output, where thecost is fixed per unit. As such the standard cost per unit of these overheads remains the same irrespective ofthe level of output attained. As the volume does not affect the variable cost per unit or per hour, the onlyfactor leading to difference is price.
15.12.1.1 Variable Overhead Cost Variance (VOCV): It is the difference between standardoverheads for actual output i.e. Recovered Overhead and actual variable overheads.
VOCV = Variable Recovered Overhead - Actual Variable Overhead
Variable Recovered Overhead = Variable Actual Output/Variable Standard Output X StandardVariable Overhead
VOCV = (Variable Actual Output/Variable Standard Output X Standard Variable Overhead) -Actual Variable Overhead.
It is divided into two namely Variable Overhead Expenditure Variance and Variable OverheadEfficiency Variance.
15.12.1.2 Variable Overhead Expenditure Variance (VOExp.V): It is the difference betweenactual variable overhead expenditure incurred and the standard variable overheads set in for aparticular period.
VOExp.V = Budgeted Variable Overhead - Actual Variable Overhead or BVO -AVO
15.12.1.3 Variable Overhead Efficiency Variance (VOEff.V): It shows the effect of change inlabour efficiency on variable overheads recovery.
VOEff.V = Standard Rate per hour (Standard hours for actual production - Actual Variable Hours)
15.12.2 Fixed Overhead Variance: Fixed overhead variance depends on a) fixed expenses incurred andb) the volume of production obtained. The volume variance includes three variances namely i) Efficiency ii)Calendar and iii) Capacity.
15.12.2.1 Fixed Overhead Cost Variance (FOCV): It is the difference between standardoverheads for actual output i.e. recovered overhead and actual fixed overheads.
FOCV = Fixed Recovered Overhead - Actual Fixed Overhead
Fixed Recovered Overhead = Fixed Actual Output/Fixed Standard Output X Standard FixedOverhead
FOCV = (Fixed Actual Output/Fixed Standard Output X Standard Fixed Overhead) - ActualFixed Overhead.
15.12.2.2 Fixed Overhead Expenditure Variance (FOExp.V): It is that portion of the fixedoverhead which is incurred during a particular period due to the difference between the budgetedfixed overheads and the actual fixed overheads.
FOExp.V = Budgeted Fixed Overhead - Actual Fixed Overhead or BFO - AFO
15.12.2.3 Fixed Overhead Volume Variance (FOVV): This variance is the difference betweenthe standard cost of overhead absorbed in actual output and the standard allowance for that output.This variance measures the over or under recovery of fixed overheads due to deviation of actualoutput from the budgeted output level.
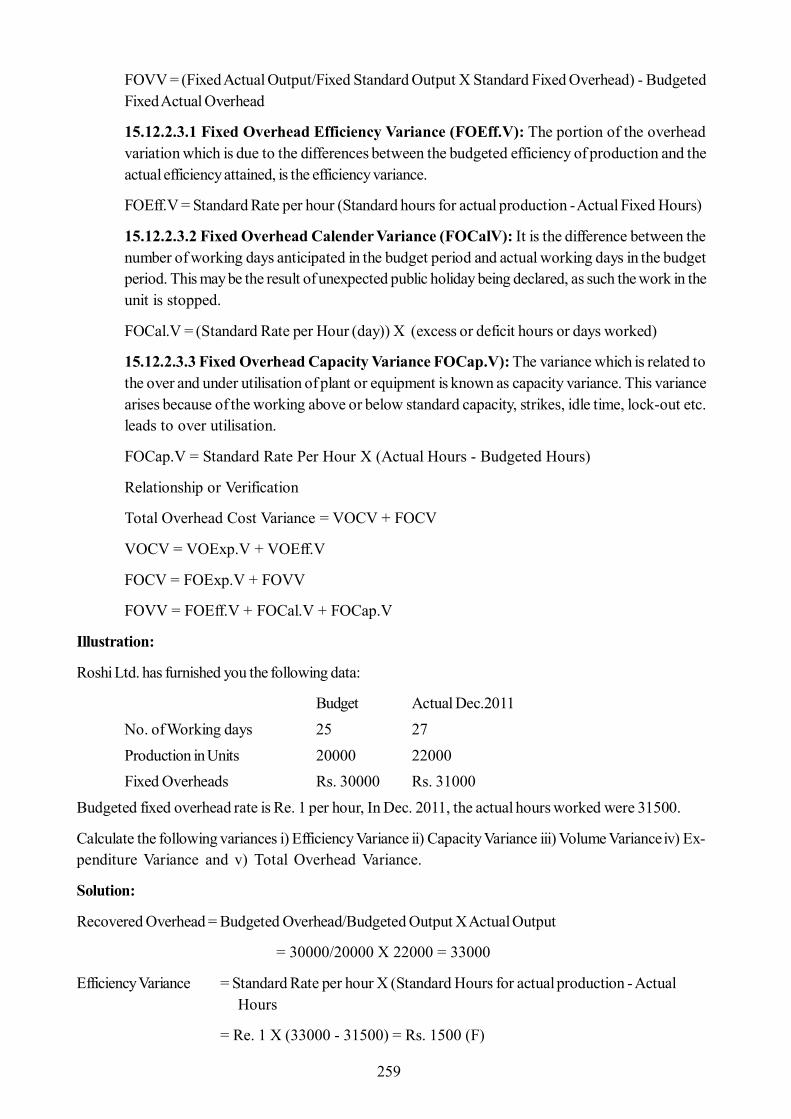
259
FOVV = (Fixed Actual Output/Fixed Standard Output X Standard Fixed Overhead) - BudgetedFixed Actual Overhead
15.12.2.3.1 Fixed Overhead Efficiency Variance (FOEff.V): The portion of the overheadvariation which is due to the differences between the budgeted efficiency of production and theactual efficiency attained, is the efficiency variance.
FOEff.V = Standard Rate per hour (Standard hours for actual production - Actual Fixed Hours)
15.12.2.3.2 Fixed Overhead Calender Variance (FOCalV): It is the difference between thenumber of working days anticipated in the budget period and actual working days in the budgetperiod. This may be the result of unexpected public holiday being declared, as such the work in theunit is stopped.
FOCal.V = (Standard Rate per Hour (day)) X (excess or deficit hours or days worked)
15.12.2.3.3 Fixed Overhead Capacity Variance FOCap.V): The variance which is related tothe over and under utilisation of plant or equipment is known as capacity variance. This variancearises because of the working above or below standard capacity, strikes, idle time, lock-out etc.leads to over utilisation.
FOCap.V = Standard Rate Per Hour X (Actual Hours - Budgeted Hours)
Relationship or Verification
Total Overhead Cost Variance = VOCV + FOCV
VOCV = VOExp.V + VOEff.V
FOCV = FOExp.V + FOVV
FOVV = FOEff.V + FOCal.V + FOCap.V
Illustration:
Roshi Ltd. has furnished you the following data:
Budget Actual Dec.2011No. of Working days 25 27Production in Units 20000 22000Fixed Overheads Rs. 30000 Rs. 31000
Budgeted fixed overhead rate is Re. 1 per hour, In Dec. 2011, the actual hours worked were 31500.
Calculate the following variances i) Efficiency Variance ii) Capacity Variance iii) Volume Variance iv) Ex-penditure Variance and v) Total Overhead Variance.
Solution:
Recovered Overhead = Budgeted Overhead/Budgeted Output X Actual Output
= 30000/20000 X 22000 = 33000
Efficiency Variance = Standard Rate per hour X (Standard Hours for actual production - Actual Hours
= Re. 1 X (33000 - 31500) = Rs. 1500 (F)

260
Capacity Variance = Standard Rate per Hour X (Actual Hours - Budgeted Hours)
= Re. 1 X (31500 - 30000) = Rs. 1500 (F)
Volume Variance = Recovered Overhead - Budgeted Overhead
= Rs. 33000 - Rs. 30000 = Rs. 3000 (F)
Expenditure Variance = Budgeted Overhead - Actual Overhead
= Rs. 30000 - Rs. 31000 = Rs. 1000 (A)
Total Overhead Variance = Recovered Overhead - Actual Overhead
= Rs. 33000 - Rs. 31000 = Rs. 2000 (F)
Verification:
FOCV = FOExp.V + FOVVRs. 2000(F) = Rs. 1000 (A) + Rs. 3000(F)FOVV = FOEff.V + FOCap.VRs. 3000 (F) = Rs. 1500 (F) + Rs. 1500 (F)
Illustration:
RVS Ltd. has furnished you the following information for the month of August 2011.
Budget ActualOutput (Units) 30000 32500Hours 30000 33000Fixed Overhead Rs. 45000 Rs. 50000Variable Overhead Rs. 60000 Rs. 68000Working days 25 26Calculate the Variances
Solution:
Standard Hour per Unit = Budgeted Hours/ Budgeted Units
= 30000/30000 = 1 hour
Total standard overhead rate per hour = Budgeted Overheads/Budgeted Hours
= 105000/30000 = Rs. 3.50 per hour
Standard fixed overhead rate per hour = Budgeted fixed overhead/ Budgeted Hours
= 45000/30000 = Rs. 1.50
Standard Variable Overhead Rate per hour = Budgeted Variable Overheads/Budgeted Hours
= 60000/30000 = Rs.2
Overhead Cost Variance = Recovered Overheads - Actual Overheads
Recovered Overheads = Standard Rate per Unit X Actual Output = 325,00 X Rs. 3.50 = Rs. 113750

261
Total Overhead Cost Variance = Rs. 113750 - Rs. 118000 = Rs. 4250 (A)Variable Overhead Cost Variance = Rs. 65000 - Rs. 68000 = Rs. 3000 (A)
Fixed Overhead Cost Variance = Rs. 48750 - Rs. 50000 = Rs. 1250 (A)Expenditure Variance = Budgeted Overheads - Actual Overheads
= Rs. 45000 - Rs. 50000 = Rs. 5000 (A)Volume Variance = Recovered Overheads - Budgeted Overheads
= Rs. 48750 - Rs. 45000 = Rs. 3750 (F)Efficiency Variance = Standard Rate X (Standard hours for actual Output - actual Hours)
= Rs. 1.50 X (32500 - 33000) = Rs. 750 (A)Capacity Variance = Standard Rate X (Actual Hours - Budgeted Hours)
= Rs. 1.50 X (33000 - 30000) = Rs. 4500 (F)
Calender Variance = Extra/Deficit hours worked X Standard Rate
No. of extra hours worked = 30000/25 = 1200
Calender Variance = Rs. 1.50 X 1200 = Rs. 1800 (F)
Verification
Total Overhead Cost Variance = VOCV + FOCV
Rs. 4250 (A) = Rs. 1250 (A) + Rs. 3000 (A)
FOCV = FOExp.V + FOVV
Rs. 1250 (A) = Rs. 5000 (A) + Rs. 3750 (F)
FOVV = FOEff.V + FOCap.V
Rs. 3750 (F) = Rs. 750 (A) + Rs. 4500 (F)
Activity H:
1. You are engaged in a company where you come across with more indirect cost, hence you want toknow the exact variances from the available data in order to take the remedial step. The availabledata is as below:
Standard ActualFixed overheads Rs. 8,000 Rs. 8,500Variable overheads 12,000 11,200Output in units 4,000 3,800
15.13 Summary
Standard Cost is scientific tool, used for effective cost control and to take proper action to maximiseefficiency. The variance analysis is important tool of cost control and cost reduction and it generate anatmosphere of cost consciousness in the organisation. The comparison of actual with standard costwhich reveals the efficiency or inefficiency of performance. The inefficiency or unfavourable variance isanalysed and immediate action is taken. Thus, variance is like a barometer. This can be used by the manage-

262
ment to apply the principle of management by exception and to maximise the profits by analysing thevariances into controllable and uncontrollable; the controllable variances are further analysed so as to bringa cost reduction, indirectly more profit.
15.14 Self Assessment Questions
1. What do you know by the term 'Standard', 'Standard Cost' and 'Standard Costing'? Explain theadvantages and disadvantages.
2. What is 'Variance Analysis'? Indicate its significance to the Management.
3. "Setting of standard is the most important mission of standard cost system. These should be set withthe greatest care and sound judgement". Discuss the statement and show how standards are fixedfor different elements of cost.
4. How controllable and uncontrollable variance is different?
5. Explain Favourable and Unfavourable Variance in detail.
15.15 Reference Books
- Management Accounting by I. M. Pandey
- Management Accounting by S.N. Maheswari
- Management Accounting I by M. R. Agarwal