unit 1 computer - an introduction to...computer application in management 1 unit 1 computer - an...
TRANSCRIPT
Computer Application in Management 1
Unit 1 Computer - An Introduction
Learning Outcome
After reading this unit, you will be able to:
• Explain the basic concept of computer and its structure
• Understand basic computer organisation and its advantages
• Know different types of computer software application
• Give overview of the components of computer system
• Explicate various computer generations
• Elucidate on different business software packages
Time Required to Complete the unit
1. 1st Reading: It will need 3 Hrs for reading a unit
2. 2nd Reading with understanding: It will need 4 Hrs for reading and understanding a
unit
3. Self Assessment: It will need 3 Hrs for reading and understanding a unit
4. Assignment: It will need 2 Hrs for completing an assignment
5. Revision and Further Reading: It is a continuous process
Content Map
1.1 Introduction
1.2 Introduction to Computer
1.2.1 Evolution of Computer Technology
1.2.2 Advantages of Computers
1.2.3 Types of Computers
2 Computer Application in Management
1.3 Basic elements of Computer System
1.3.1 Basic Computer Functioning
1.3.2 Components of Computer System
1.4 Generations of Computers and Computer languages
1.4.1 Generations of Computers
1.4.2 Computer Languages
1.5 PC Software Packages
1.6 Summary
1.7 Self-Assessment Test
1.8 Further Reading

Computer Application in Management 3
1.1 Introduction
Our lifestyles have undergone a sea change with the advancement in technology
especially in the field of computers. Computers are an integral part of our lifestyles today
and are found at offices, homes, schools, colleges, hotels, shops etc. This advance in
technology has made our lives easy and comfortable. For instance, we can execute a number
of activities using computer based systems- we can write a draft on word processor and
email it, make calculations using an electronic spreadsheet and incorporate graphics, create
a database of friends with their phone numbers, addresses and e-mail ids etc. It is an
arduous process to perform these activities using existing traditional methods.
Computers can also simplify other tasks such as word processing, designing, web site
development, database management etc. Therefore, a computer should be referred to as a
‘data processor’.
1.2 Introduction to Computer
The computer comprises of technologically advanced hardware put together to work
at great speed. To accomplish its various tasks, the computer is made of different parts, each
serving a particular purpose in conjunction with other parts. In other words, a 'computer' is
an ensemble of different machines that you will be using to accomplish your job. A
computer is primarily made of the Central Processing Unit (usually referred to as the
computer), the monitor, the keyboard and the mouse. Other pieces of hardware, commonly
referred to as peripherals, can enhance or improve your experience with the computer.
1.2.1 EVOLUTION OF COMPUTER TECHNOLOGY
The origin of computer technology took place in the 19th century. People desired to
have a machine that would carry out mathematical calculations for them. The ABACUS is
considered to have been the first computer in the world. It was used to perform simple
measurements and calculations. ABACUS is available even today for school going children.
In the 17th century, a scientist named Pascal developed a machine that could
perform mathematical calculations. This machine comprised of a number of gears. The
movement of gear mechanism was used to perform some calculations. He named the
machine PASCALINE.
However, the concept of the modern computer was propounded by the scientist and
mathematician Charles Babbage. He first wrote on the use of logic and loops in process
execution. Based on the concept of logic and loops, Babbage envisaged two models for

4 Computer Application in Management
performing computations- Analytical Engine and Difference Engine. In those days,
electronics was not developed. Therefore, these models proposed by Babbage existed only
on paper. However, the ideas given by Babbage were implemented after the invention of
electronics.
George Boolean developed the famous Boolean Algebra based on binary numbers.
De Morgan put forward theorems on logic gates. These theorems are known as De Morgan’s
Theorems.
Lady Ada was the first computer programmer.
The real application of computers began in the late fifties. The computers were used
in the United States for various applications such as census, defence, R&D, universities etc.
1.2.2 ADVANTAGES OF COMPUTERS
Compared to traditional systems, computers offer many noteworthy advantages.
This is one reason that traditional systems are being replaced rapidly by computer-based
systems. The main advantages offered by computers are as follows:
• High Accuracy
• Superior Speed of Operation
• Large Storage Capacity
• User-friendly Features
• Portability
• Platform independence
• Economical in the long term
1.2.3 TYPES OF COMPUTERS
Computers are classified in a variety of ways depending upon the principles of
working, construction, size and applications. Various types of computers are discussed in this
section.
DIGITAL AND ANALOG COMPUTERS
ANALOG COMPUTERS
The computers that process analog signals are known as Analog Computers. The
analog signal is a continuous signal. For example, sine wave is an analog signal. The analog

Computer Application in Management 5
quantities are based on decimal number systems. Examples of Analog computers are the
slide rule, ABACUS etc.
The operational amplifiers are widely used in the construction of analog computers
when the analog electrical signal is to be processed. For example, a differentiator is the op
amp circuit that differentiates input signal. If the input signal V sin θ is given to analog
computer, the output would be V cos θ. Accordingly, the analog computer that generates
the second order differential equation can be drawn as given in Fig 1.1
Fig. 1.1: Analog Computers
DIGITAL COMPUTERS
Computers that process digital signals are known as Digital Computers. The Digital
signal is a discrete signal with two states 0 and 1. In practice, the digital computers are used
and not analog.
Examples of digital computers are personal computers, supercomputers, mainframe
computers etc.
Supercomputers Are the most powerful computers in terms of speed of
execution and large storage capacity. NASA uses
supercomputers to track and control space explorations.
Mainframe Computers Are next to supercomputers in terms of capacity. The
mainframe computers are multi terminal computers, which
can be shared simultaneously by multiple users. Unlike
personal computers, mainframe computers offer time-sharing.

6 Computer Application in Management
For example, insurance companies use mainframe computers
to process information about millions of its policyholders.
Minicomputers These computers are also known as midrange computers.
These are desk-sized machines and are used in medium scale
applications. For example, production departments use mini-
computers to monitor various manufacturing processes and
assembly-line operations.
Microcomputers As compared to supercomputers, mainframes and
minicomputers, microcomputers are the least powerful, but
these are very widely used and rapidly gaining in popularity.
Personal Computer PC is the term referred to the computer that is designed for
use by a single person. PCs are also called microcontrollers
because these are smaller when compared to mainframes and
minicomputers. The term ‘PC’ is frequently used to refer to
desktop computers. Although PCs are used by individuals, they
can also be used in computer networks.
Fig. 1.2: Personal Computer
Desktop Computer This is the most commonly used personal computer. It comprises
of a keyboard, mouse, monitor and system unit. The system unit is
also known as cabinet or chassis. It is the container that houses
most of the components such as motherboard, disk drives, ports,
switch mode power supply and add-on cards etc. The desktop

Computer Application in Management 7
computers are available in two models- horizontal model and
tower model.
Laptops Are also called notebook computers. These are the portable
computers. They have a size of 8.5 x 11 inch and weigh about
three-to-four kilos.
Palmtops Palmtops are also called handheld computers. These are
computing devices, which are small enough to fit into your palm.
The size of a palmtop is like an appointment book. The palmtops
are generally kept for personal use such as taking notes,
developing a list of friends, keeping track of dates, agendas etc.
The Palmtop can also be connected to a PC for downloading data.
It also provides value-added features such as voice input, Internet,
cell phone, camera, movie player and GPS.
Personal Digital Assistant (PDA) – is the palm type computer. It combines pen input, writing
recognition, personal organisational tools and communication
capabilities in a small package.
Study Notes
Assessment
Write notes on the following:
1. Evolution of Computer Technology
2. Advantages of Computers

8 Computer Application in Management
3. Types of Computers
4. Digital and Analog computers
Discussion
What do you know about ABACUS? Discuss.
1.3 Basic Elements of Computer System
Basic elements of a computer system are Mouse, Keyboard, monitor, memory, CPU,
motherboard, Hard Disk, Speakers, Modem, power supply and processor.
Mouse: Mouse is used for operating the system. Nowadays, optical
mouse is more popular as compared to simple mouse.
Keyboard: Keyboard is used to input data in to the system so that the
system gives output to the user. Therefore, the keyboard is an
integral part of the input system. A computer is essentially
incomplete without a keyboard.
Monitor: Monitor, which again is a very essential part of the computer
system, displays the actions that the computer performs on
our command.
Motherboard: Motherboard again a necessary element of the computer
system contains different elements as memory, processor,
modem, slots for graphic card and LAN card.
Hard Disk: Hard disk is used to store data permanently on computer.
Modem: Modem is used to connecting to the Internet. Two types of
modems are widely used. One is known as software modems
and the other is known as hardware modems.
Speakers: Speakers are also included in basic elements of a computer. It
is not indispensible, because a computer can perform its

Computer Application in Management 9
function without speakers. However, we use them to for
multiple purposes.
1.3.1 Basic Computer Functioning
A computer can be defined as an electronic device that accepts data from an input
device, processes it, stores it in a disk and finally displays it on an output device such as a
monitor.
To understand the basic rudiments of the functioning of the computer refer to the
basic block diagram of a computer as shown in Fig. 1.3 This flow of information holds true
for all types of computers such as Personal Computers, Laptops, Palmtops etc. In other
words, the fundamental principle of working is the same.
Fig 1.3: Block diagram of computer
As shown in Fig 1.3, there are four main building blocks in a computer's functioning-
input, processor, output and memory. The data is entered through input devices like the
keyboard, disks or mouse. These input devices help convert data and programs into the
language that the computer can process.
The data received from the keyboard is processed by the CPU, i.e. the Central
Processing Unit. The CPU controls and manipulates the data that produce information. The
CPU is usually housed within the protective cartridge. The processed data is either stored in
the memory or sent to the output device, as per the command given by the user. The
memory unit holds data and program instructions for processing data.
Output devices translate the processed information from the computer into a form
that we can understand.

10 Computer Application in Management
1.3.2 Components of Computer System
MOTHERBOARD
The motherboard is the main component inside the case. It is a large rectangular
board with integrated circuitry that connects the various parts of the computer as the CPU,
RAM, Disk drives (CD, DVD, Hard disk or any others) as well as any other peripherals
connected via the ports or the expansion slots.
Components directly attached to the motherboard include:
• The central processing unit (CPU) performs most of the calculations that enable a
computer to function and is sometimes referred to as the "brain" of the computer. It is
usually cooled by a heat sink and fan.
• The chip set aids communication between the CPU and the other components of the
system, including main memory.
• RAM (Random Access Memory) stores all running processes (applications) and the
current running OS.
• The BIOS includes boot firmware and power management. The Basic Input Output
System tasks are handled by operating system drivers.
• Internal Buses connect the CPU to various internal components and to expansion cards
for graphics and sound.
Current Technology
• The north bridge memory controller, for RAM and PCI Express
• PCI Express, for expansion cards such as graphics and physics processors, and high-end
network interfaces
• PCI, for other expansion cards
• SATA, for disk drives
Obsolete Technology
• ATA (superseded by SATA)
• AGP (superseded by PCI Express)
• VLB VESA Local Bus (superseded by AGP)
• ISA (expansion card slot format obsolete in PCs but still used in industrial computers)

Computer Application in Management 11
• External Bus Controllers support ports for external peripherals. These ports may be
controlled directly by the south bridge I/O controller or based on expansion cards
attached to the motherboard through the PCI bus.
USB
FireWire
SATA
SCSI
POWER SUPPLY
A power supply unit (PSU) converts alternating current (AC) electric power to low-
voltage DC power for the internal components of the computer. Some power supplies have
a switch to change between 230 V and 115 V. Other models have automatic sensors that
switch input voltage automatically or are able to accept any voltage within these limits.
Power supply units used in computers are generally switch mode power supplies (SMPS).
The SMPS provides regulated direct current power at several voltages as required by the
motherboard and accessories such as disk drives and cooling fans.
REMOVABLE MEDIA DEVICES
• CD (compact disc): The most common type of removable media, suitable for music and
data
� CD-ROM Drive: A device used for reading data from a CD
� CD Writer: A device used for both reading and writing data to and from a CD
• DVD (digital versatile disc): A popular type of removable media that is the same size as a
CD but stores up to 12 times as much information- the most common way of transferring
digital video and is popular for data storage
� DVD-ROM Drive: A device used for reading data from a DVD
� DVD Writer: A device used for both reading and writing data to and from a DVD
� DVD-RAM Drive: A device used for rapid writing and reading of data from a special type
of DVD
• Blu-ray Disc: A high density optical disc format for data and high-definition video that can
store 70 times as much information as a CD
� BD-ROM Drive: A device used for reading data from a Blu-ray disc
12 Computer Application in Management
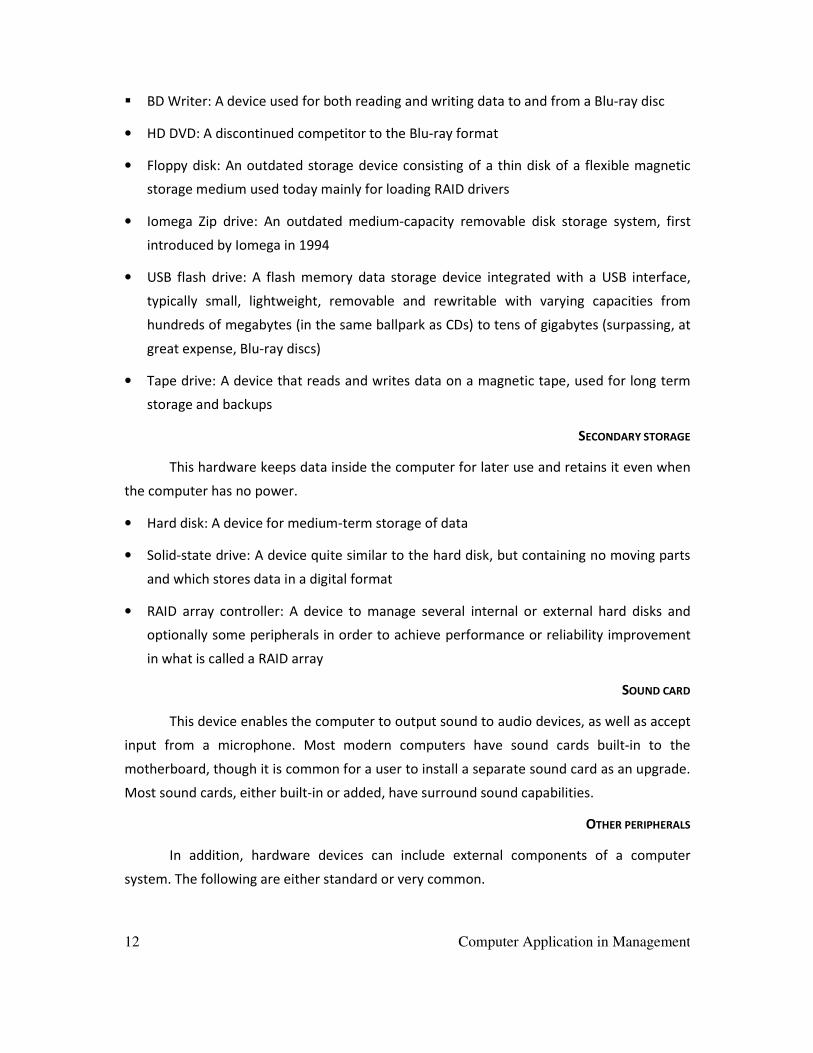
� BD Writer: A device used for both reading and writing data to and from a Blu-ray disc
• HD DVD: A discontinued competitor to the Blu-ray format
• Floppy disk: An outdated storage device consisting of a thin disk of a flexible magnetic
storage medium used today mainly for loading RAID drivers
• Iomega Zip drive: An outdated medium-capacity removable disk storage system, first
introduced by Iomega in 1994
• USB flash drive: A flash memory data storage device integrated with a USB interface,
typically small, lightweight, removable and rewritable with varying capacities from
hundreds of megabytes (in the same ballpark as CDs) to tens of gigabytes (surpassing, at
great expense, Blu-ray discs)
• Tape drive: A device that reads and writes data on a magnetic tape, used for long term
storage and backups
SECONDARY STORAGE
This hardware keeps data inside the computer for later use and retains it even when
the computer has no power.
• Hard disk: A device for medium-term storage of data
• Solid-state drive: A device quite similar to the hard disk, but containing no moving parts
and which stores data in a digital format
• RAID array controller: A device to manage several internal or external hard disks and
optionally some peripherals in order to achieve performance or reliability improvement
in what is called a RAID array
SOUND CARD
This device enables the computer to output sound to audio devices, as well as accept
input from a microphone. Most modern computers have sound cards built-in to the
motherboard, though it is common for a user to install a separate sound card as an upgrade.
Most sound cards, either built-in or added, have surround sound capabilities.
OTHER PERIPHERALS
In addition, hardware devices can include external components of a computer
system. The following are either standard or very common.

Computer Application in Management 13
WHEEL MOUSE
Includes various input and output devices, usually external to the computer system
INPUT
• Text input devices
� Keyboard: A device to input text and characters by pressing buttons (referred to as keys)
• Pointing devices
� Mouse: A pointing device that detects two-dimensional motion relative to its supporting
surface
� Optical Mouse: Uses light to determine motion
� Trackball: A pointing device consisting of an exposed protruding ball housed in a socket
that detects rotation about the two axes
� Touch screen: Senses the user pressing directly on the display
• Gaming devices
� Joystick: A control device that consists of a handheld stick that pivots around one end, to
detect angles in two or three dimensions
� Gamepad: A handheld game controller that relies on the digits/ fingers (especially
thumbs) to provide input
� Game controller: A specific type of controller specialized for certain gaming purposes
• Image, video input devices
� Image scanner: A device that provides input by analysing images, printed text,
handwriting or an object
� Webcam: A low resolution video camera used to provide visual input that can be easily
transferred over the Internet
• Audio input devices
� Microphone: An acoustic sensor that provides input by converting sound into electrical
signals

14 Computer Application in Management
Study Notes
Assessment
Write notes on the following:
1. Keyboard
2. Motherboard
3. Wheel Mouse
4. Sound card

Computer Application in Management 15
Discussion
Discuss and Match Column 'A' with Column 'B'.
S.
No.
Column 'A' Column 'B'
1. Mouse It used to connecting to the Internet.
2. Keyboard It is used for operating the system. Nowadays,
optical is more popular as compared to simple one.
3. Motherboard It displays the actions that the computer performs
on our command.
4. Hard Disk It is used to input data in to the system so that the
system gives output to the user.
5. Monitor It contains different elements as memory,
processor, modem, slots for graphic card and LAN
card.
6. Modem It is used to store data permanently on computer.
1.4 Generations of Computers and Computer Languages
1.4.1 GENERATIONS OF COMPUTERS
Using size and features as the bases, computers are classified into various
generations. These generations of computers are discussed below:
FIRST GENERATION
The first generation computers were bulky in size. They were able to execute
hundreds of instructions per second and were expensive as well. They used vacuum tubes as
their main components. Machine language is a first generation language, for example
EDVAC, UNIVAC etc.

16 Computer Application in Management
SECOND GENERATION
The second-generation computers were smaller in size as compared to the first
generation computers. These were capable of executing thousands of instructions per
second, with a transistor as its main component. Assembly language is the second-
generation language in which programs were written using mnemonic codes, for example,
PDP (Programmed data processor), PDP1 etc.
THIRD GENERATION
The third generation computers were more advanced and used integrated circuits.
These computers contained thousands of components per circuit. They were cheaper than
second-generation computers. The languages used in this generation were BASIC, COBOL
etc. for example, IBM 307 Series, PDP II etc.
FOURTH GENERATION
The fourth generation computers used complex circuits like the large-scale
integrated circuits called microprocessors or chips, which surprisingly cost less than the third
generation computers. These computers were able to execute millions of instructions per
second. The languages used in this generation are C++, SQL etc. for example, CRAY 2, IBM
3090/600 Series.
FIFTH GENERATION
These computers work on artificial languages (AI) like LISP, PROLOG etc. They use
super/ultra large-scale integrated circuits, which is also called parallel processing method.
They execute billions of instructions per second, for example, Laptops, Palmtops, PDA
(Personal Digital Assistant) etc.
Different kinds of languages emphasise different parts about the problem, and so are
better at describing different aspects of the solution or even different kinds of problems and
solutions. Computer Science is ever evolving, so there is continual evolution of the concepts
we need to use and the notations for describing these concepts.
Operational languages, for example, express how something is achieved, and makes
the reader figure out what is being achieved. Declarative languages express what must be
achieved and make the system work out how to achieve it.
The earliest languages had few restrictions, so they were very powerful, but turned
out to be very dangerous to use. After a while, people developed languages that were much

Computer Application in Management 17
safer to use, but there were complaints about their lack of power. Nowadays, we see
languages that are both safe and powerful.
Sometimes we have to use assembly language (Low-Level Language, LLL) because
there is just no other reasonable way of telling the computer what it must do. However,
most programming is done in High-Level Languages (HLLs) because of productivity. It is
usually easier, or more cost-effective, to use a HLL. Some of the reasons for this are:
• Easy to write: Useful concepts and facilities, relevant to application
• Easy to read: For reuse, maintenance, enhancement etc.
• Portability: Other compiler/toolset suppliers, users, computers - standards
• Error detection and reporting
1.4.2 COMPUTER LANGUAGES
The computer performs its functions based on the instructions given by the user. The
set of such instructions written for a particular task is known as a computer program.
Program is the set of instructions that tells the computer how to process the data,
into the form desired by the user.
The language in which a computer program is written is known as programming
language. The programming languages are classified as Low-level language and High-level
language. See figure 1.4.
Fig 1.4: Programming Languages

18 Computer Application in Management
Low-level language is further classified as Machine language and Assembly language.
Machine language is expressed in terms of binary numbers i.e. 0 and 1 as the
processor understands binary numbers only. However, it is difficult to read and write the
program in terms of 0s and 1s.
The machine language code is further simplified by converting it to the code called
op code. The op code depends upon the type of processor. The program written in the op
code is known as Assembly language code. During the run time, it is necessary to convert the
op code into machine language so that the processor will understand and process the code.
The internal program that translates op code to machine code is known as Assembler. Some
examples of Assembler are Microsoft Assembler (MASM), Z-80, 8085, 8086 etc. The
Assembler for each processor is different.
Usage of the Assembly language requires knowledge of the Assembly language and
computer hardware. It is more convenient to write a program in a High level language,
which comprises of instructions in simple English. Examples of High level language are BASIC,
FORTRAN, COBOL etc. A compiler is the internal program that translates High level language
to Machine language.
'Software' is another name for program. In most cases, the terms ‘software’ and
‘program’ are interchangeable.
There are two types of software - system software and application/ utility software.
Application software is the end user software. The programs written under
application software are designed for general purpose and special purpose applications. An
example of application software is Microsoft Internet Explorer.
System Software enables an application software to interact with the computer
hardware. System software is the ‘background’ software that helps the computer to manage
its internal resources. The most important system software is the operating system. The
system software performs important tasks such as running the program, storing data,
processing data etc. Windows XP is an example of system software.
We will be studying in detail about system software and application software later in
this book.

Computer Application in Management 19
BATCH PROCESSING AND TIME SHARING
The computer works on either batch processing or time-sharing basis.
• Batch Processing: In batch processing, the computer acts as a ‘stand-alone’ unit. As such,
it is available for a single user. Therefore, a number of programs can be executed
simultaneously. They have to stand in queue.
Fig. 1.5: Batch Processing
• Time-sharing: Unlike batch processing, time sharing offers simultaneous usage of
computer. The computer is provided with multiple terminals from which the system can
be accessed simultaneously by a number of users.
Fig. 1.6: Time Sharing
20 Computer Application in Management
Study Notes
Assessment
Differentiate between:
1. Application software and System Software
2. Machine language and Assembly language
3. Batch processing and Time-sharing
Discussion
Discuss Generations of Computers.
1.5 PC Software Packages
WORD PROCESSING SOFTWARE
Word processing software is used for creating documents. Drafts, letters, reports,
essays, write-ups etc can be created using word processing software. Earlier, Word Star was
being used widely for this purpose. Sidekick and Word Perfect are also used for drafting

Computer Application in Management 21
letters. However, the most commonly used word processing package in the world is
Microsoft Word, which will be discussed later in this book.
SPREADSHEETS
Spreadsheet is a computer application that simulates a paper worksheet. It displays
multiple cells that together, make up a grid consisting of rows and columns, each cell
containing either alphanumeric text or numeric values. Spreadsheets are frequently used for
financial information because of their ability to re-calculate the entire sheet automatically
after a change to a single cell is made.
MICROSOFT EXCEL
Microsoft had been developing Excel on the Macintosh platform for several years to
the point, where it has developed into a powerful system. A port of Excel to Windows 2.0
resulted in a fully functional Windows spreadsheet. Starting in the mid 1990s and continuing
through the present, Microsoft Excel has dominated the commercial electronic spreadsheet
market.
PRESENTATION PROGRAMS
Microsoft PowerPoint is a presentation program developed by Microsoft. It is part of
the Microsoft Office suite and runs on Microsoft Windows and Apple's Mac OS X computer
operating systems.
PowerPoint is widely used by business people, educators, students and trainers and
is among the most prevalent forms of persuasive technology. Beginning with Microsoft
Office 2003, Microsoft revised the branding to emphasize PowerPoint's place within the
office suite, calling it Microsoft Office PowerPoint instead of just Microsoft PowerPoint. The
current versions are Microsoft Office PowerPoint 2007 for Windows and 2008 for Mac.
GRAPHICS PROGRAMS
Computer graphics are graphics, which are created with the aid of computers and the
representation and manipulation of pictorial data by a computer.
The development of computer graphics has made the application more user-friendly.
It is also easier to understand and interpret many types of data. Developments in computer
graphics had a profound impact on many types of media and revolutionized the animation
and video game industry.
The term computer graphics includes everything on computers that is not text or
sound. Today nearly all computers use some graphics and users expect to control their

22 Computer Application in Management
computer through icons and pictures rather than just by typing. Computer graphics has the
following features:
• Representation and manipulation of pictorial data by a computer
• Development of technologies used to create and manipulate such pictorial data
• Digitally synthesizing and manipulating visual content
Today computer-generated images touch many aspects of our daily life. Computer
imagery is found on television, in newspapers, in weather reports and during surgical
procedures. A well-constructed graph can present complex statistics in a way that is easier
to understand and interpret. Such graphs are used to illustrate papers, reports, thesis and
other presentation material. A range of tools and facilities are available to enable users to
visualize their data.
Study Notes
Assessment
Explain the followings:
1. Word Processing Software
2. Spreadsheets
3. Microsoft Excel
4. Presentation Programs
5. Graphics Programs
Computer Application in Management 23
Discussion
What is Ms Office. Discuss all the components of Ms Office.
1.6 Summary
INTRODUCTION
Computers are an integral part of our lifestyles today and are found at offices,
homes, schools, colleges, hotels, shops etc. This advance in technology has made our lives
easy and comfortable. For instance, we can execute a number of activities using computer
based systems.
INTRODUCTION TO COMPUTER
A 'computer' is an ensemble of different machines that you will be using to
accomplish your job. A computer is primarily made of the Central Processing Unit (usually
referred to as the computer), the monitor, the keyboard and the mouse. Other pieces of
hardware, commonly referred to as peripherals, can enhance or improve your experience
with the computer.
EVOLUTION OF COMPUTER TECHNOLOGY
The origin of computer technology took place in the 19th century. People desired to
have a machine that would carry out mathematical calculations for them. The ABACUS is
considered to have been the first computer in the world. It was used to perform simple
measurements and calculations. In the 17th century, a scientist named Pascal developed a
machine that could perform mathematical calculations. The real application of computers
began in the late fifties. The computers were used in the United States for various
applications such as census, defence, R&D, universities etc.
Advantages of Computers
• High accuracy
• Superior speed of operation
• Large storage capacity
• User-friendly features

24 Computer Application in Management
• Portability
• Platform independence
• Economical in the long term
TYPES OF COMPUTERS
ANALOG COMPUTERS
The computers that process analog signals are known as analog computers. The analog
signal is a continuous signal. For example, sine wave is an analog signal. The analog
quantities are based on decimal number systems. Examples of Analog computers are the
slide rule, ABACUS etc.
DIGITAL COMPUTERS
Computers that process digital signals are known as Digital Computers. The Digital signal
is a discrete signal with two states 0 and 1. In practice, the digital computers are used
and not analog.
BASIC ELEMENTS OF COMPUTER SYSTEM
Basic elements of a computer system are Mouse, Keyboard, monitor, memory, CPU,
motherboard, Hard Disk, Speakers, Modem, power Supply and processor.
BASIC COMPUTER FUNCTIONING
Computer is defined as an electronic device that accepts data from an input device,
processes it and stores it in a disk and finally displays it on an output device such as a
monitor. There are four main building blocks of a computer organisation – input, processor,
output and memory.
COMPONENTS OF COMPUTER SYSTEM
MOTHERBOARD
The motherboard is the main component inside the case. It is a large rectangular
board with integrated circuitry that connects the various parts of the computer as the CPU,
RAM, Disk drives (CD, DVD, Hard disk or any others) as well as any other peripherals
connected via the ports or the expansion slots.
POWER SUPPLY
A power supply unit (PSU) converts alternating current (AC) electric power to low-
voltage DC power for the internal components of the computer.
Computer Application in Management 25
REMOVABLE MEDIA DEVICES
• CD (compact disc): The most common type of removable media, suitable for music and
data
� CD-ROM Drive: A device used for reading data from a CD
� CD Writer: A device used for both reading and writing data to and from a CD
• HD DVD: A discontinued competitor to the Blu-ray format
• Floppy disk: An outdated storage device consisting of a thin disk of a flexible magnetic
storage medium used today mainly for loading RAID drivers
SECONDARY STORAGE
This hardware keeps data inside the computer for later use and retains it even when
the computer has no power.
SOUND CARD
This device enables the computer to output sound to audio devices, as well as accept
input from a microphone.
OTHER PERIPHERALS
Hardware devices can include external components of a computer system. The
following are either standard or very common.
WHEEL MOUSE
Includes various input and output devices, usually external to the computer system.
INPUT
• Text input devices
• Pointing devices
� Optical mouse uses light to determine mouse motion
• Gaming devices
• Image, video input devices
• Audio input devices

26 Computer Application in Management
GENERATIONS OF COMPUTERS AND COMPUTER LANGUAGES
FIRST GENERATION
The first generation computers were bulky in size. They were able to execute
hundreds of instructions per second and were expensive
SECOND GENERATION
The second-generation computers were smaller in size as compared to the first
generation computers. These were capable of executing thousands of instructions per
second, with a transistor as its main component.
THIRD GENERATION
The third generation computers were more advanced and used integrated circuits.
These computers contained thousands of components per circuit.
FOURTH GENERATION
The fourth generation computers used complex circuits like the large scale integrated
circuits called microprocessors or chips, which surprisingly cost less than the third
generation computers. These computers were able to execute millions of instructions per
second.
FIFTH GENERATION
These computers work on artificial languages (AI) like LISP, PROLOG etc. They use
super/ultra large-scale integrated circuits which is also called parallel processing method.
PROGRAMMING LANGUAGES
Program is the set of instructions that tells the computer how to process the data,
into the form desired by the user. The language in which a computer program is written is
known as programming language. The programming languages are classified as Low-level
language and High-level language. The programming languages are classified as Low-level
language and High-level language. Low-level language is further classified as Machine
language and Assembly language.
PC SOFTWARE PACKAGES
WORD PROCESSING SOFTWARE
Word processing software is used for creating documents. Drafts, letters, reports, essays,
write-ups etc can be created using word processing software.

Computer Application in Management 27
SPREADSHEETS
Spreadsheet is a computer application that simulates a paper worksheet. It displays
multiple cells that together, make up a grid consisting of rows and columns, each cell
containing either alphanumeric text or numeric values. Spreadsheets are frequently used for
financial information because of their ability to re-calculate the entire sheet automatically
after a change to a single cell is made.
MICROSOFT EXCEL
Microsoft had been developing Excel on the Macintosh platform for several years to
the point, where it has developed into a powerful system.
PRESENTATION PROGRAMS
Microsoft PowerPoint is a presentation program developed by Microsoft. It is part of
the Microsoft Office suite and runs on Microsoft Windows and Apple's Mac OS X computer
operating systems.
GRAPHICS PROGRAMS
Computer graphics are graphics, which are created with the aid of computers and the
representation and manipulation of pictorial data by a computer.
1.7 Self-Assessment Test
Broad Questions
1. Explain in detail the different types of digital computers.
2. What do you mean by programming languages? Elaborate.
Short Notes
a. Computer generations
b. Types of software packages
c. Different types of computers
d. Basic computer organisation
e. Batch processing and time sharing
1.8 Further Reading
1. Automating Managers: The Implications of Information Technology for Managers, John,
Moss Jones, London, Printer, 1990

28 Computer Application in Management
2. Computers, Concepts and Uses 2nd ed., Summer M., Englewood Cliffs, New Jersey,
Prentice Hall Inc, 1988
3. Foundations of Business Systems, David Van Over, Fort Worth, Dryden 1992
4. Information Systems: Theory and practice 5th ed., Burch, John And Grudniski Gary, New
York., John Wiley, 1989
5. Online Business Computer Applications 2nd Ed, Eliason Alan L., Chicago Science Research
Associates, 1987

Computer Application in Management 29
Assignment
Write in detail about any two or three software packages / programs that are new to the
market.
___________________________________________________________________________
___________________________________________________________________________
___________________________________________________________________________
___________________________________________________________________________
___________________________________________________________________________
___________________________________________________________________________
___________________________________________________________________________
___________________________________________________________________________
___________________________________________________________________________
___________________________________________________________________________
___________________________________________________________________________
___________________________________________________________________________
___________________________________________________________________________
___________________________________________________________________________
___________________________________________________________________________
___________________________________________________________________________
___________________________________________________________________________
___________________________________________________________________________
___________________________________________________________________________
___________________________________________________________________________
___________________________________________________________________________
___________________________________________________________________________

30 Computer Application in Management
___________________________________________________________________________
___________________________________________________________________________
___________________________________________________________________________
___________________________________________________________________________
___________________________________________________________________________
___________________________________________________________________________
___________________________________________________________________________
___________________________________________________________________________
___________________________________________________________________________
___________________________________________________________________________
___________________________________________________________________________
___________________________________________________________________________
___________________________________________________________________________
___________________________________________________________________________
___________________________________________________________________________
___________________________________________________________________________
___________________________________________________________________________
___________________________________________________________________________
___________________________________________________________________________
___________________________________________________________________________
___________________________________________________________________________
___________________________________________________________________________
___________________________________________________________________________
___________________________________________________________________________

Computer Application in Management 31
Unit 2 Disk Operating Systems and Windows
Learning Outcome
After reading this unit, you will be able to:
• Identify the features of Windows and its versions
• Explain the concept and application of spreadsheets
• Elucidate on the overview of MS Excel and how to work with it
• Enter and copy formulas
• Retrieve spreadsheets
Time Required to Complete the unit
1. 1st Reading: It will need 3 Hrs for reading a unit
2. 2nd Reading with understanding: It will need 4 Hrs for reading and understanding a
unit
3. Self Assessment: It will need 3 Hrs for reading and understanding a unit
4. Assignment: It will need 2 Hrs for completing an assignment
5. Revision and Further Reading: It is a continuous process
Content Map
2.1 Introduction
2.2 Disk Operating Systems and Windows
2.2.1 Introduction to DOS
2.2.2 Features of Windows
2.2.3 Overview of different versions of Windows

32 Computer Application in Management
2.3 Text Processing Software
2.4 Introduction to Spreadsheets
2.5 Creation of Spreadsheet Application
2.5.1 Components of an Excel Workbook
2.5.2 Closing the Excel Workbook
2.6 Formulae Function
2.6.1 Adding Numbers
2.6.2 Auto Sum Method
2.6.3 Division and Percent
2.6.4 Absoluting (and Multiplication)
2.7 Spreadsheet Operations
2.7.1 Retrieving Spreadsheets
2.7.2 Inserting Cells, Columns and Rows
2.7.3 More Cell Formatting
2.7.4 Copying
2.8 DataBase Functions in Spreadsheet
2.9 Summary
2.10 Self-Assessment Test
2.11 Further Reading

Computer Application in Management 33
2.1 Introduction
Windows predecessor MS-DOS (Microsoft Disk Operating System) was the most
popular operating system earlier. However, its numerous drawbacks led to the emergence
of a new class of system software. Windows, which was a product of this class, was based on
a radically different approach called Graphical User Interface (GUI).
The user is not expected to memorise or type any command; all that he needs to do
is click on the appropriate picture (icon) with the help of a small hand-held device called a
mouse.
Using a mouse is easier than using a keyboard. In a Graphical User Interface, the
various commands and options are represented on the screen in the form of small images
called ‘Icons’. Clicking on an icon is easier than typing commands through a keyboard. GUI
based interfaces work on WYSIWYG (What You See Is What You Get) technology, making the
work of the user easier. Therefore, GUI-based interfaces are much more user friendly.
With Windows, Microsoft has successfully addressed all the limitations of MS-DOS, in
addition to the new user-friendly features. Windows has been aptly named as it rightly
facilitates the users to work on several Windows simultaneously..
2.2 Disk Operating Systems and Windows
As the name implies, the Operating System is used for operating the System or the
Computer. It is a set of computer programs, which is used to execute a specific task. The
single user operating is DOS (Disk Operating System). The main functions of DOS are to
manage disk files and allocate system resources according to the requirement. DOS provides
vital features to control hardware devices such as Keyboard, Screen, Disk Devices, Printers,
Modems and Programs.
2.2.1 INTRODUCTION TO DOS
Disk Operating System (specifically) and disk operating system (generically), most
often abbreviated as DOS, refers to an operating system software, used in most computers,
which provides the abstraction and management of secondary storage devices and the
information on them (e.g., file systems for organizing files of all sorts). Such software is
referred to as a disk operating system since the storage devices it manages are made of
rotating platters (such as hard disks or floppy disks).
DOS is the medium through which the user and external devices attached to the
system communicate. DOS translates the command issued by the user in the format that is

34 Computer Application in Management
comprehensible by the computer and instructs the computer to function accordingly. It also
translates the result and any error message in the format for the user to understand.
2.2.2 FEATURES OF WINDOWS
Microsoft Windows is a series of software operating systems and graphical user
interfaces developed by Microsoft. Some of its important features are listed below:
1. Faster Operating System: Windows include tools that increase the speed of the
computer. Windows includes a set of programs designed to optimize the efficiency of
computer, especially when used together.
2. Improved Reliability: Windows improves computer reliability by introducing new
wizards, utilities and resources that lend a hand in helping your system operate
effortlessly.
3. Innovative, Easy to use features: Windows makes your computer easier to use with new
and enhanced features.
2.2.3 OVERVIEW OF DIFFERENT VERSIONS OF WINDOWS
The different versions of Windows are discussed below:
WINDOWS 1.0
Microsoft released the first version of Windows way back in 1985. It marked a major
breakthrough as it allowed users to switch from character based (CUI)/non-graphical MS-
DOS to the GUI based operating system. The product incorporated a set of desktop
applications, including the MS-DOS file management program and value additions such as a
calendar, card file, notepad, calculator, clock and telecommunications programs. It allowed
users to work with multiple applications at the same time (multitasking).
WINDOWS 3.0
Microsoft released this version of Windows in 1990. Some of its main features were:
• 32 bit operating system with support for advanced graphics
• Inclusion of Program Manager, File Manager and Print Manager
• A completely rewritten application development with new capabilities and native
support for applications running in extended memory and fully pre-emptive MS-DOS
multitasking

Computer Application in Management 35
• Inclusion of Windows software development kit (SDK), which facilitated software
developers focus more on writing applications and less on writing device drivers
• Improved Windows icons
WINDOWS NT 3.1/3.11
Microsoft released this version of Windows on July 27, 1993. This OS marked an
important milestone for Microsoft. Some of its main features were:
• It was the first Windows operating system to merge support for high-end client/server
business applications.
• It contains new built-in features for security, operating system power, performance,
desktop scalability and reliability.
• It included support for multiprocessor (more than one CPU) architecture.
• Windows NT was geared towards business users and had a rich Application Programming
Interface (API), which made it easier to run high-end engineering and scientific
applications.
WINDOWS 95
Microsoft released this version of Windows in 1995. Some of its main features were:
• Provided 32 bit operating system with built-in Internet-support
• Facilitated easy installation of hardware peripherals and software applications through
plug- and- play capabilities
• Enhanced multimedia capabilities, more powerful features for mobile computing and
integrated networking
WINDOWS 98
Microsoft released this version of Windows in 1998. It is often described as an
operating system that ‘Works Better, Plays Better’. Some of its main features were:
• New features were added to enable easy access to Internet-related information.
• Multiple display support allowed using several Visual Display Units (VDU) simultaneously
to augment the capacity of the desktop and to allow running of different programs on
separate monitors.

36 Computer Application in Management
• USB Support – the Universal Serial Bus made a computer easier to use with advanced
plug-and-play capabilities. It allowed supplementing devices to your computer without
having to restart each time a device is added to the computer.
• Accessibility wizard made it easier for physically challenged people to operate a
computer without installing any special software.
• An extensive and easy-to-use self-help system was provided.
WINDOWS 2000 PROFESSIONAL
Microsoft released this version of Windows in 2000. It was an upgrade to Windows
NT4.0. It was designed with the aim to replace Windows 95, Windows 98 and Windows NT
4.0 on desktops and laptops. It added major improvement in reliability, easy usage, internet
compatibility and support for mobile computing. It made hardware installation much easier
by adding support to a wide variety of new Plug and Play hardware, including advanced
networking and wireless products, USB devices and infrared devices.
WINDOWS XP
Windows XP features user-friendly screens, simplified menus among other features. It was a
major breakthrough for desktop operating systems. Two main versions of Windows XP were
released, viz. Windows XP Home Edition and Windows XP Professional Edition. Features of
Windows XP are:
Safe and easy personal computing: Windows XP makes personal computing easy and
enjoyable. Along with unmatched dependability and security, Windows XP displays power,
performance, a bright original appearance and abundant assistance tailored to one's
requirement. World of Digital Media: Work at length using digital media while at home, at
work and on the Internet. Enjoy photography, music, videos, computer games and more.
• Connected Home and Office: Share files, photos, music, even a printer and Internet
connection; all on a network that is private and secure.
• Best for Business: With Windows XP, you get the established reliability of Microsoft
Windows 2000, enhanced for high-speed performance and even superior consistency.

Computer Application in Management 37
Study Notes
Assessment
1. What is Disk Operating systems?
2. What is Windows?
Discussion
Discuss different versions of windows.
2.3 Text Processing Software
The text processing Software or Word Processing is one of the most significant
Application packages of Windows. The Word processing software is used for creating
documents. Drafts, letters, reports, essays, write-ups etc. can be created by means of word
processing software. Earlier, Word Star was being used extensively for this purpose.
However, the most commonplace word processing package used today is Microsoft Word.
Microsoft Word is Microsoft's word processing software. It was first released in 1983
bearing the name Multi-Tool Word for Xenix systems. Later, Versions for several other
platforms including IBM PCs running DOS (1983), the Apple Macintosh (1984), SCO UNIX,
OS/2 and Microsoft Windows (1989) were written. It is a component of the Microsoft Office
system; however, it is also sold as a standalone product and included in Microsoft Works
Suite.

38 Computer Application in Management
Beginning with the 2003 version, the branding was revised to emphasize Word's
identity as a component within the Office suite. Microsoft began calling it Microsoft Office
Word instead of merely Microsoft Word. The latest releases are Word 2007 for Windows
and Word 2008 for Mac OS X.
Once again, the 2010 version appears to be branded as Microsoft Word, once again.
The contemporary versions are Microsoft Word 2010 for Windows and 2008 for Mac.
The significant features of MS Word are as follows:
1. It is an easy and simple package for a general user.
2. The features such as paragraph, font, symbols, spell check, table, drawing, bullets and
numbering, page numbering provided by this package enable a user to develop a
document in an error free format.
3. The text file generated by MS Word is .doc. This file can be used in other applications
such as MS Excel, MS Visual Studio 6.0, MS Visual Studio.net, Web browser, pdf format
etc.
Study Notes
Assessment
What do you understand by Text Processing Software?

Computer Application in Management 39
Discussion
Discuss significant features of MS Word
2.4 Introduction to Spreadsheets
Spreadsheet is a computer application that simulates a paper worksheet. It displays
multiple cells that together formulate a grid consisting of rows and columns, each cell
containing either alphanumeric text or numeric values. A spreadsheet cell may alternatively
contain a formula that defines how the contents of that cell are to be calculated from the
contents of any other cell (or combination of cells) each time any cell is updated.
Spreadsheets are frequently used for financial information as they robotically enable the re-
calculation of the total sheet, after a modification to a single cell is made.
VisiCalc was typically considered the original electronic spreadsheet (although this
has been challenged) and it helped turn the Apple II computer into a success and greatly
assisted in their widespread application. Lotus 1-2-3 was the most popular spreadsheet in
use when DOS was the dominant operating system. Excel is now considered to have the
largest market share on the Windows and Macintosh platforms
MICROSOFT EXCEL
Microsoft had been developing Excel on the Macintosh platform for several years,
eventually converting it into a powerful system. A port of Excel to Windows 2.0 resulted in a
fully functional Windows spreadsheet. The highly robust Windows 3.x platforms of the early
1990s made it possible for Excel to take a significant amount of market share from Lotus. By
the time Lotus responded with serviceable Windows products, Microsoft had started
compiling their Office suite. Starting in the mid 1990s and continuing through to the present,
Microsoft Excel has dominated the commercial electronic spreadsheet market.
Study Notes

40 Computer Application in Management
Assessment
What are Spread Sheets?
Discussion
Discuss Microsoft Excel in detail.
2.5 Creation of Spreadsheet Application
TO START MICROSOFT EXCEL
1. Move the mouse pointer over the Start button present on the extreme left of the task
bar and then click the left mouse button. A push-up menu appears.
2. Place the mouse pointer over the Program option inside the push up menu. A submenu
is displayed.
3. Move the mouse pointer over the Microsoft Excel option and click the left mouse button.
A blank workbook is instantly displayed on the screen. Data can be entered in the file
Book1 and calculations can be made on entered data.
When MS-Excel is loaded, the Excel window will appear on the screen. The Excel
window is shown below:

Computer Application in Management 41
Fig. 2.1: PART OF MS-EXCEL WINDOW
1. Title Bar: Displays the application name, file name and various window controls, such as
minimize button, maximize button and close button.
a. Minimize button: This is used for altering a window/sheet into a button. The screen
is minimized and appears in the form of a button on the taskbar.
b. Maximize button: This is used for magnifying a window/sheet subsequent to its
minimization and restoration.
c. Close button: This is used to close a window/sheet.
2. Menu Bar: Different options for selection
File: Use this option to create a new file, open an existing file and save a file. Other
options are printing, print preview, setting up of print area, closing the worksheet, exiting
Excel etc.
Edit: This helps in copying, cutting and deleting a range of text, pasting text that is
copied or cut from another location, clearing the contents of cells, finding the particular text
in the worksheet, etc.
View: This helps in enabling and disabling certain tools in the Excel worksheet
Insert: This can be used to insert cells, rows and columns in the work sheet.
Format: This helps in formatting the row/ column to increase/decrease height, width
etc.

42 Computer Application in Management
Tools: This helps the spell check and protection of worksheets/ workbooks by setting
a password for accessing it and customising it according to one’s specification etc.
Data: This is used to sort (ascending/descending), filter the list, to obtain the subtotal
etc.
Window: This is used to hide/unhide the workbook, to create a new window, to split
the pane etc.
Help: This can be used to get any help about Excel.
3. Standard tool bar: Displayed by default, allows giving common commands like saving the
file, opening a file, printing etc.
New: This is used to create a new workbook.
Open: This is used to open an existing file.
Save: This is used to save the file.
Print: This is used to take a printout of the file.
Preview: This is used to preview the document before the actual printing.
Spell check: This is used to check the spelling and grammatical errors in the file.
Cut: This is used to move a selected block from one location to another.
Copy: This is used to copy a selected block from one location to another.
Paste: This is used to place the selected block during the copy or cut operation at a
certain location.

Computer Application in Management 43
Undo: This is used to retain any modifications made to a file.
Redo: This is used to reverse the last undo action performed on the file.
Auto Sum Button: This is used to add the numbers on a particular range.
Paste function Button: This is used to perform different operations on a selected set of
numbers, such as calculating the average or finding the minimum or
maximum of set of numbers etc.
Sort Ascending: This is used to arrange a set of numbers in ascending (increasing) order.
Sort Descending: This is used to arrange a set of numbers in descending (decreasing) order.
Chart Wizard Button: This is used in creating chart graphs for a set of numbers.
Drawing: This is used to add the drawing tool bar just above the status bar of the
window.
Zoom: This is used to change the size of the work sheet or to display the selected
block in greater size.
4. Formatting toolbar: Allows the user to give commands related to formatting cells and
cell contents such as Bold, Underline, Font Style, Font Size, Colour etc.
Font: This helps in changing the style of the text typed in the work sheets.
One can select a required font from the available font list and change the
style of the text inside the selected block.
Font Size: This helps in changing the size of the text. One can select a required size
for the font from the available list and change the size of the text inside
the selected block.
Bold: This helps in making the selected look bolder/ darker than the other text
Italic: This helps to make the text in the selected block look tilted or slanted.
Underline: This helps in underlining the selected text.
Align Left: This helps in left justifying the contents of cell in the selected block.
Centre: This helps in centre justifying the contents of the cell inside the selected
block.
Align Right: This helps in right justifying the contents of the cell inside the selected
block.
44 Computer Application in Management
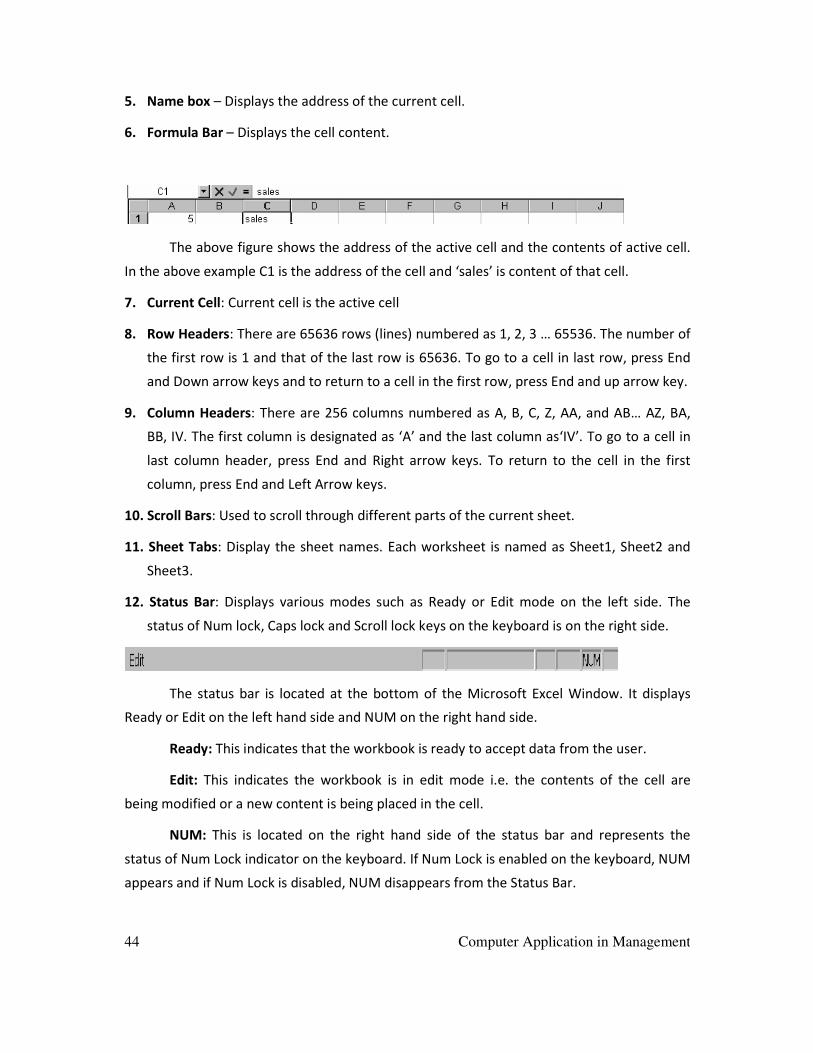
5. Name box – Displays the address of the current cell.
6. Formula Bar – Displays the cell content.
The above figure shows the address of the active cell and the contents of active cell.
In the above example C1 is the address of the cell and ‘sales’ is content of that cell.
7. Current Cell: Current cell is the active cell
8. Row Headers: There are 65636 rows (lines) numbered as 1, 2, 3 … 65536. The number of
the first row is 1 and that of the last row is 65636. To go to a cell in last row, press End
and Down arrow keys and to return to a cell in the first row, press End and up arrow key.
9. Column Headers: There are 256 columns numbered as A, B, C, Z, AA, and AB… AZ, BA,
BB, IV. The first column is designated as ‘A’ and the last column as‘IV’. To go to a cell in
last column header, press End and Right arrow keys. To return to the cell in the first
column, press End and Left Arrow keys.
10. Scroll Bars: Used to scroll through different parts of the current sheet.
11. Sheet Tabs: Display the sheet names. Each worksheet is named as Sheet1, Sheet2 and
Sheet3.
12. Status Bar: Displays various modes such as Ready or Edit mode on the left side. The
status of Num lock, Caps lock and Scroll lock keys on the keyboard is on the right side.
The status bar is located at the bottom of the Microsoft Excel Window. It displays
Ready or Edit on the left hand side and NUM on the right hand side.
Ready: This indicates that the workbook is ready to accept data from the user.
Edit: This indicates the workbook is in edit mode i.e. the contents of the cell are
being modified or a new content is being placed in the cell.
NUM: This is located on the right hand side of the status bar and represents the
status of Num Lock indicator on the keyboard. If Num Lock is enabled on the keyboard, NUM
appears and if Num Lock is disabled, NUM disappears from the Status Bar.

Computer Application in Management 45
CELL AND CELL ADDRESS
The intersection of a column and a row is known as a cell. Each cell has a name or a
cell address. The cell address consists of the column letter and row number. For example,
the first cell is in the first column and first row. First column name is A and first row number
is 1. Therefore, the first cell address is A1. Similarly, the address of last cell is IV65536 i.e.
column IV and row number is 65536.
The total cells in a worksheet are 256*65536.
ALIGNING CELLS
Now we will type some more. Go to cell
C3 SEPT (Type-in SEPT and press the Enter key)
Notice again, how SEPT is automatically aligned to the left. Logically, since you are
using Excel in the English version, the text is left-aligned. We would also like to centre SEPT
in cell C3. Click on cell C3 to “mark” the cell. One way to do centre SEPT is to simply click on
the Centre button in the button bar at the top of the screen. Make sure that you are on cell
C3 when you click (see image above right).
Fig. 2.2: Right click options
Here is another way to centre the word. Right Click on cell C3. Then click on Format
Cells.

46 Computer Application in Management
Fig. 2.3: Cell format window
When the Format Cells Menu appears, first click on the Alignment Tab, then on
Horizontal/Centre/Vertical/Centre and finally click OK. Try it.
Now type the text below in the cells indicated.
D3 OCT
E3 NOV
F3 DEC
G3 MONTHLY TOTALS (press the Enter key and then correct the width of this
column)
Next, we will highlight cells D3 through G3. To do this, point to D3 and click the left
button on the mouse. Then, holding this button, drag the mouse to the right through G3.
When the cells are highlighted, take your finger off the left mouse button. Now point to the
group of cells and click the right mouse button to bring up the Format Cells menu. Click on

Computer Application in Management 47
Alignment and select Centre (vertical & horizontal). Finally, point to OK and click the left
mouse button. All of the cells will then be centered.
Fig. 2.4: Format cell window
You could also click the Centre button as done previously
MONTHLY TOTALS will not fit into its space when you do this. Thus, move the cursor
over the line between cells G and H and drag the line to the right to widen the G cell just as
you did a few minutes ago.
2.5.1 COMPONENTS OF AN EXCEL WORKBOOK
Row Number: The horizontal group of cells is termed as a row. Each row is assigned a
number. The row numbers appear on the left side of the workbook
Column Number: The vertical group of cells is termed as a column. Each column is
assigned a number. The column number appears below the Formula Bar in the workbook.
Column Headings: The name given to each column is termed as column heading.
These appear just below the Formula Bar.
Vertical Scroll Bar: The vertical scroll bar consists of two buttons Up Arrow Scroll
button and the Down Arrow Scroll button. Clicking on any of these buttons allows you to see
those rows of a sheet, which are not visible on the screen.

48 Computer Application in Management
Horizontal Scroll Bar: The horizontal scroll bar consists of two buttons: Right Arrow
Scroll button and the Left Arrow Scroll button. Clicking on any of these buttons allows you to
see those columns of a sheet, which are not visible on the screen.
Select ‘All’ button: This is the first place where the row numbers and column
headings meet.
Sheet tab: Using this, one can move from one sheet to another of the workbook. By
default, an Excel workbook has three sheets with its name displayed. The default names of
these sheets are Sheet1, Sheet2 and Sheet3. These names can be changed and new names
can be assigned to them. This tab appears just above the Status Bar.
2.5.2 CLOSING THE EXCEL WORKBOOK
A. To close the Excel workbook:
• Select the File option on the Menu bar and click the left button of the mouse. A pull-
down menu is displayed immediately.
• Select the Close option and click the left mouse button. A message box is displayed
immediately, asking you whether you want to save this sheet with three options ‘Yes’,
‘No’ and ‘Cancel’. Select 'Yes' to save the workbook. You will be asked for a file name.
Give a name to the file and click 'Save'. If you do not wish to save the workbook, select
'No' and click the left mouse button. This will close the sheet without saving it. Click
'Cancel' to cancel the operation.
Fig. 2.5: Saving option

Computer Application in Management 49
B. To close the Excel program:
• Move the mouse pointer to the 'Close' button at the right hand corner of the Title bar.
• Click the left mouse button.
SAVING THE WORKBOOK
The various ways in which you can save the workbook are given below:
1. Select the 'Save' option from the standard tool bar. Then select the drive and folder and
give the file a name. Finally click on the ‘Save’ button.
2. Use of File option button on Menu Bar:
a. Click on the 'File' option in the Menu Bar
b. Select 'Save' from the dropdown menu
c. A window will open. Here, select the drive and the folder, give the file a name and
then click on 'Save' button.
3. Press 'Ctrl' and 'S' keys simultaneously. The 'Save' window will appear. Follow the same
procedure as given above.
Study Notes

50 Computer Application in Management
Assessment
1. Explain the following:
a. Title Bar
b. Menu Bar
c. Standard tool bar
d. Formatting toolbar
e. Name box
f. Scroll Bars
g. Status Bar
2. What are the components of an Excel Workbook.
Discussion
Discuss the process "To start Microsoft Excel" and process "To close the Workbook".
2.6 Formulae Function
From the example given below, you will learn how to enter and copy formulas. In this
example, you have to calculate the total price of each quantity and then the final total value
of all quantities. To calculate the total price of the pens, you enter the quantity in cell
address B2 and price in cell address C2. Multiply these values and place the result in cell
address D2. Repeat the procedure for the items Pencil and Pen Box. The total of all the
three items will be placed in cell address D5.

Computer Application in Management 51
Fig. 2.6: Excel sheet
Formula can also be entered by using the cell address. In the above example, the
value is to be calculated by using the formula Quantity * Rate. To calculate the value of first
item, pen, in the cell D2, type = B2 * C2 or +B2*C2. (Cell names can be indicated by small
letters or capital letters). When typed, it will appear in cell D2 as shown below:
Press Enter. The value will be calculated and displayed as shown below:

52 Computer Application in Management
Use the same procedure to calculate the cost for Pencil and Pencil Box and then add
the values to get the final total.
2.6.1 ADDING NUMBERS
There are several ways for learning how to add numbers. Each method has its
advantages and disadvantages.
To commence,, move the cursor to cell C9 and click on it.
Always move the cursor to the cell where you want the answer to be located.
TYPE-IN METHOD
We want to add the three numbers in cells C6, C7 and C8. To use this method, type
(using the keys on the keyboard) the following in cell C9:
= C6 + C7 + C8
Fig. 2.7: Spread sheet
The spreadsheet should look like the image above as you are typing in this equation.

Computer Application in Management 53
Now press the Enter key. Then, click on cell C9 again. The total of these cells will now
appear in C9.
When you have completed typing your equation, you will see this formula in the area
below the menu bar.
Change the number in cell C6 to 500 (and press Enter). You can see how the total is
automatically recalculated. Whenever a number is entered in a cell, the entire spreadsheet
will mechanically recalculate.
SUBTRACTION, MULTIPLICATION AND DIVISION
You can put in a MINUS (-) for subtraction, ASTERISK (*) for multiplication, and SLASH
(/) for division.
Two important points to remember about Excel formulas:
• Formulas in Excel always begin with the equal sign ( = ).
• The =EQUAL sign always goes in the cell where you want the answer to appear.
Use Cell References in Formulas
Even though you can use numbers directly in a formula, it is much better to use the
cell references of the numbers you want to subtract.
If previously you have used the cell references rather than the actual data, then later,
if you need to change the data in either cell, the results of the formula will update
automatically without you having to rewrite the formula.
Setting Up the Subtraction Formula
As an example, lets create a formula in cell E3 that will subtract the contents of cell
E1 from cell E2.

54 Computer Application in Management
Fig. 2.8: Use of formula
Our formula:
=E1 - E2
• Insert the number 20 in cell E1
• Insert the number 10 in cell E2
Formula Steps
To subtract 10 from 20 and have the answer appear in cell E3:
• Type an EQUAL sign in cell E3.
• Click on cell E1 with the mouse pointer.
• Type a MINUS sign (-) in cell E3.
• Click on cell E2 with the mouse pointer.
• Press the ENTER key on the keyboard.
• The answer 10 should be present in cell E3.
To expand your formula to include additional operations such as addition,
multiplication or more subtractions, simply continue to add the correct mathematical
operator followed by the cell reference containing your data.
POINT METHOD
With reference to the examples mentioned under Type in method, we will use the
same for explaining the Point method. Move to cell C9 and click on it. We will now add the
numbers in a second way. Press the Delete key on the keyboard to delete the current
formula.
First, press the ‘=’ and point the cursor to cell C6 using the mouse, press the left
mouse button pointing to cell C6 (you will see a marquee box go around the cell). Now press

Computer Application in Management 55
a '+' and move cursor to C7. Press the left mouse button, and press another '+' before
moving the cursor to C8. Again press the left mouse button (notice that as you click " + and
point ", the addition formula is built in cell C9). Now press Enter. The same formula can be
built using the arrow movement keys on the keyboard (except that you do not have to click
on each cell as the cell is marked when you move the arrows). Notice, as you are entering
the cell addresses, when you place another '+' in the formula, the cursor “returns” to cell C9.
Also notice that as you point to each cell, it is highlighted by a “marquee box.” This “tells”
which cell you have pointed.
FUNCTION METHOD
Once again, move the cursor to cell C9. Delete the formula by pressing the Delete
key.
Now type the following: =SUM(
[This tells Excel that we are going to sum some numbers in a range, which will follow
the =SUM(.]
There are two ways to enter this range:
ARROW KEY AND ANCHOR METHOD
With the arrow keys, move the cursor to cell C6. As you do this, you will notice that
the cell where the cursor is located appears after the =SUM(. When you get to C6, press the
‘.’ (Period) key. This is called an anchor and it holds one end of the range in place. You will
notice that a C6:C6 appears in the formula area under the button bar. This is a one-cell
range. Now move with the arrow keys to cell C8. See how cells C6, C7 and C8 get highlighted.
This indicates that the range is C6:C8. Excel assumes logically that these are the numbers
you want to add. Now press Enter. The numbers still add, but now the formula reads
=SUM(C6:C8) instead of =C6+C7+C8 as it did before.
MOUSE METHOD
Again move to cell C9. Delete the formula in cell C9 by pressing the Delete key. Type
in =SUM( as done earlier). Now using the mouse, point the cursor to Cell C6.Click and hold
down the left mouse button and move/drag the cursor down to cell C8. (Cells C6, C7 and C8
should be highlighted.) Now press Enter.
This =SUM Function is a convenient way to add many numbers, or a block/range of
numbers. By simply anchoring and using page downs or using the mouse, you can highlight

56 Computer Application in Management
many numbers to add quickly. However, since it performs only addition, (sums), you cannot
do subtraction, etc.
Once again point to cell C9.. Press the Delete key to eliminate the formula present in
cell C9.
Functions
Fig. 2.9: Formulas
There are a number of formulas built into Excel such as SUM. These formulas are
called Functions. Below the Menu Bar (see the figure above), you will see a “sigma” ∑ with
an inverted triangle to its right. Click on the inverted triangle. The drop-down menu will
appear on the right. Move the cursor down to More Functions and click on More Functions.
Fig. 2.10: Insert function
Two menu screens will appear simultaneously. An “Office Assistant” will appear (see
image) and you can ask questions (the little assistant may be a paper clip or just about
anything).

Computer Application in Management 57
Fig. 2.11: Office assistant
The Insert Function menu screen will also appear (like the one above on the right).
The two menu screens work jointly to assist you when you are using functions.
Fig. 2.12: Insert function
Let us work with the Insert Function menu screen. Click on the small inverted triangle
to the right of 'Or select a category' (see arrow at left).
In the drop-down menu that appears, you can see that there are all kinds of formulas
(functions) that come with Excel spreadsheet (e.g. statistical, mathematical, financial etc.).

58 Computer Application in Management
Instead of referring to mathematical, financial, or statistical tables in a book, you can enter
data from your spreadsheet into the formulas and obtain answers.
Click on All in the drop-down menu.
Then by selecting a function menu out of those displayed on ALL, the below given
figure will appear:.
Look at all the functions (formulas) before we commence our study on using the
addition formula (SUM).These formulas will be available at this location, in case one needs
to revisit them in the future.
Use the elevator bar located to the right of the 'Select a function menu 'screen and
move down the list until you see SUM. Click on SUM.
Then click on OK.

Computer Application in Management 59
When you click on OK, the Function Arguments menu screen (above) will appear. If
you look at the top of the screen in the SUM area, you will see that Excel XP has “guessed”
that you desire to add the numbers above cell C9 – where you clicked in your spreadsheet.
Notice that it indicates that cells C6:C8 will be added (sum cells C6 through C8 – the colon (:)
means “through.” It also indicates the numbers in cells C6, C7 and C8 and gives you the sum
(= 700).
But it is a little unclear how Excel did this. To see how this SUM equation works, you
will go to Help. To do this, click on Help on this function in the lower left corner of the screen
(see left arrow above).
You will now see a Microsoft Excel Help window (similar to the one above) that will
show you how to use this SUM function (or any function). One advantage of these Help
windows is that there are examples for each function.
We move down the SUM help screen using the elevator bar on the right of the help
screen. The bottom of the screen looks like the image at the top of the next page. Spend a
few minutes looking at the SUM Help window and observe all the features.

60 Computer Application in Management
Fig. 2.13: SUM Help screen
The bottom of the SUM Help screen looks like the image above. Notice that it gives
you examples from a small spreadsheet that has data in cells A1 through A6. It uses these
numbers too in the examples at the bottom of the help screen.
When you have reviewed all of the help, you care to see, click on the X at the upper
right corner of Microsoft Excel Help blue bar to close the Microsoft Excel Help window. If
you accidentally close the spreadsheet, simply reply 'yes' to Save and then re-open the
spreadsheet.

Computer Application in Management 61
Fig. 2.14: Function Arguments menu screen
The Function Arguments menu screen will still be on the screen.
If the Office Assistant is still on the screen, simply point to it and click the right side
button on the mouse. A pop-up menu will appear. Click on Hide. This will put the Assistant
away until we need it again
As you can see, in the area to the right of Number 1, the “Wizard” has “guessed” that
you want to add numbers in the range C6 to C8. Now, point to some “plain part,” in the gray
area above. Click and hold down the left mouse button and drag the above SUM box “away”
so that you can see your numbers in C column cells. When you have done this, release the
mouse button. Now click on the “small box” at the right edge of the Number 1 area (see
arrow above). It has a little red arrow in it.

62 Computer Application in Management
The below window will appear.
Highlight cells C6 to C8 in the spreadsheet (click on C6, hold down the left mouse
button and drag until the three cells are highlighted). A “marquee” will begin to flash around
the cells, indicating they are highlighted. The Function Arguments area will appear as shown
above. Now click on the small button to the right of the cell (see arrow above). The numbers
will show in the area to the right of Number 1. Now, click on OK at the bottom of the
Function Arguments menu screen. You will see that the SUM formula [=SUM (C6:C8)] shows
in the formula area at the top of the screen.
2.6.2 AUTO SUM METHOD
Since, we add numbers more than any other operation in spreadsheets, Excel
spreadsheet has an additional feature - Auto Sum. Move to cell C9 again and press the
delete key to erase your last formula. Now look at the upper area of the screen, just below
the menu bar, for a ∑ (summation) symbol button. Point to it and click with the left mouse
button. It is added automatically. Observe that the cells you would logically desire to add,
have a marquee around them and that the SUM function is displayed in cell C9. You will
need to confirm that this is the correct formula. Press the Enter key and the SUM function
will now be set in cell C9.
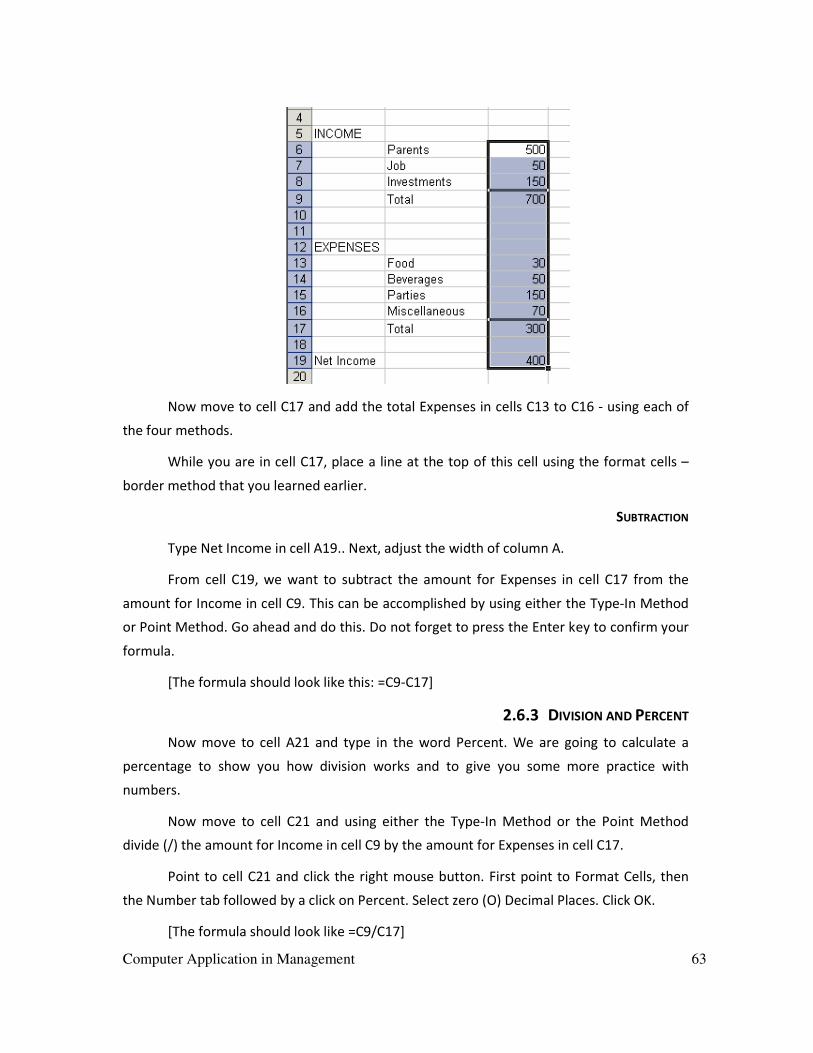
Computer Application in Management 63
Now move to cell C17 and add the total Expenses in cells C13 to C16 - using each of
the four methods.
While you are in cell C17, place a line at the top of this cell using the format cells –
border method that you learned earlier.
SUBTRACTION
Type Net Income in cell A19.. Next, adjust the width of column A.
From cell C19, we want to subtract the amount for Expenses in cell C17 from the
amount for Income in cell C9. This can be accomplished by using either the Type-In Method
or Point Method. Go ahead and do this. Do not forget to press the Enter key to confirm your
formula.
[The formula should look like this: =C9-C17]
2.6.3 DIVISION AND PERCENT
Now move to cell A21 and type in the word Percent. We are going to calculate a
percentage to show you how division works and to give you some more practice with
numbers.
Now move to cell C21 and using either the Type-In Method or the Point Method
divide (/) the amount for Income in cell C9 by the amount for Expenses in cell C17.
Point to cell C21 and click the right mouse button. First point to Format Cells, then
the Number tab followed by a click on Percent. Select zero (O) Decimal Places. Click OK.
[The formula should look like =C9/C17]

64 Computer Application in Management
2.6.4 ABSOLUTING (AND MULTIPLICATION)
Sometimes, when we are work with a spreadsheet, we do not want a cell to "roll" to
the next column when we use the copy feature of the spreadsheet. To stop cells from
“rolling” we utilize absoluting. The following is an illustration of absoluting:
Go to cell A23 and type in Number. Go to cell A25 and type in Result.
Go to cell C23 and type in a 2 and press the Enter key.
We will now create a formula to multiply our number times Net Income. You may use
either the Type-in or Point method. Go to cell C25, and type in a formula to multiply cell C23
times cell C19.
The formula should look like this: =C23*C19
The result in C25 should be two times the net income in cell C19.
Now copy the formula in cell C25 to cells D25, E25, F25 and G25. Your row 25 should
look like the one below.
Point to each of the cells D25, E25, F25 and G25. Notice, as you click on each and
look at the screen, how C23 (the cell with the 2) "rolled" and became D23, E23, F23 and G23
(which are blank - and caused the "0's"). To do this, we utilize Absoluting or Anchoring.
Go back to cell C25. Now we will enter the formula again, but a little differently (to
anchor the 2).
Type in a =C23 (or you could type = and point to C23). Now, press the F4 key. Notice,
in the Edit bar at the top of the screen, that the =C23 changes to: $C$23. (This tells you that
cell C23 is absoluted or anchored. The "$'s" indicate the absoluting.) Now finish the formula
by typing in or pointing *C17 as before. Press Enter.
The formula should look like this: =$C$23*C19
Now copy the formula in cell C25 to cells D25, E25, F25 and G25 again.
The numbers should now be correct. Point to cells D25, E25, F25 and G25 (as you did
before). You will notice the "$'s" have copied the =$C$23 to each cell (absoluting) and the
Net Income figures have rolled as they should. You may practice by changing some more
numbers or the income and expense titles.

Computer Application in Management 65
Study Notes
Assessment
Write a note on:
a. Function method
b. Point method
c. Arrow key and anchor method
d. Mouse method
e. Auto sum method
Discussion
Find out the sum of first 100 natural numbers in Ms Excel.
2.7 Spreadsheet Operations
The various operations that can be performed on a worksheet are explained below:
2.7.1 RETRIEVING SPREADSHEETS
When you need to return to a spreadsheet, you first load Excel, as you did originally.
When Excel is on the screen, click on File in the menu bar and then click on Open.

66 Computer Application in Management
The following Open menu screen will appear:
Fig. 2.15: Open menu screen
Click on the down triangle to the right of the Look in box (similar to the triangle in the
Save in box). Click on the My Documents. Files saved on the disk will appear in the box
below. Click on your file and then click on Open. Your file will be opened. You could also
double-click quickly on the file to open it.
Also, if you have not done so already, move your cursor slowly over the "buttons"
located below the menu bar. You will notice a little box that tells you what these buttons do.
These little boxes are called Text Help boxes. Notice, that under File and Edit in the Menu
bar, there is a small folder (Open) and a diskette (Save). Clicking on them will take you
directly to Open and Save.
2.7.2 INSERTING CELLS, COLUMNS AND ROWS
To insert cells, columns and rows, follow the steps given below:
1. Click on the Insert button on the Menu bar, then in the drop down menu click on cells.
You will get a screen as shown in the following figure:

Computer Application in Management 67
Fig. 2.16: Inserting cells
2. You will get four options. Depending on your requirement, select the appropriate option.
a. Shift cells right
b. Shift cells down
c. Entire row
d. Entire column
a. Shift cells right: This will add a blank cell to the left of the selected cell. This is shown
in Figure below:
b. Shift cells down: This will add a blank cell at the top of the selected cell.

68 Computer Application in Management
c. Entire row: This will add a blank row above the selected row. After executing the
command the worksheet will appear as:
d. Entire column: This will add a blank column to the left of the selected column.
Considering the figure below, after executing the command the worksheet will
appear as:
e. To insert one or more columns
• To insert one column: Follow the steps listed below.
� Select the cell to the left of which you want to insert the column

Computer Application in Management 69
� Click on the Insert button in the Menu bar
� Select the Column option from the drop-down menu
• To insert more than one column: Follow the steps listed below:
� Select the cell to the left of which you want to insert the columns
� Select the number of columns to be inserted
� Click on the Insert button in the Menu bar
� Select the Column option from the drop down menu.
f. To insert one or more rows
• To insert one row: Follow the steps listed below:
� Select the cell above which you want to insert the row
� Click on the Insert button on the Menu bar
� Select the Row option from the dropdown menu
• To insert more than one row: Follow the steps listed below:
� Select the cell above which you want to insert the rows
� Block/ Select the number of Rows to be inserted
� Click on the Insert button on the Menu bar
� Select the Row option from the drop down menu
WIDENING COLUMNS
You probably noticed that as you typed in the numbers, some of the words were just
too wide for the default cell width (Investments and Miscellaneous). Let us widen column B
to take care of this. Move the mouse arrow slowly to the right edge of the B cell (between
the B and the C). The cursor will turn into an arrow pointing right and left with a small
vertical line in the middle (see arrow below). Hold down the left mouse button and move
(drag) the line to the right.

70 Computer Application in Management
As soon as you start to move (drag), a dotted vertical line will go down the
spreadsheet and it will move as you hold down the left button and drag the mouse. Keep
dragging to the right until you are past the widest word and a bit more (for some space).
Release the button. The column is widened. As you hold down and drag the mouse, you will
learn about the current width of the column by observing the upper left corner of the
screen, below File in the menu bar, and above the buttons.
This was one way to widen a column. Here is another way. Point to the B at the top
of column B (in the Gray area) and click the left mouse button. (The cell should turn black
and the column blue).
Now, keeping the cursor somewhere in the “blue” area, click the right mouse button.
Notice that a menu with Column Width appears. Click on Column Width. Then type into it 15
and click on OK. This is another way to widen a column. Another way is to put the cursor on

Computer Application in Management 71
the edge of the cell and double click on the mouse. If there is any text in a cell in that column
that is wider than the cell, the column will adjust to that width.
2.7.3 MORE CELL FORMATTING
Since we want our numbers to look better, we can include dollar signs and decimal
points in our numbers. This is done by using the mouse. Point to cell C6, hold down the left
mouse button and drag it down slowly to highlight cells C6 through C19. Your screen should
look like the image shown below:
Now point anywhere in the highlighted area and click the right mouse button.. A
pop-up menu will appear. Click on Format Cells (like you have done before).

72 Computer Application in Management
Then click on the Number “Tab” at the top of the Format Cells menu screen. Point to
Currency and click on Currency.
Notice several things. The right side shows the number of decimal places. The 2 is the
default for cents. We will use 2. Notice the box above Decimal Places. It is a sample of what
our number will look like. At the lower right, it shows how negative numbers can appear,
depending on your choice. When a negative number is calculated, it will appear with your
choice. Now click on OK. All the numbers now have $. If you have large numbers that are
"too wide" for the current column width, you will see some ######## in the cells where
these numbers are located. If this occurs in your spreadsheet, go ahead and widen the
columns as you did previously.

Computer Application in Management 73
Your spreadsheet numbers should now look like the image above.
2.7.4 COPYING
We could repeat what we did to this point and fill in the Income and Expenses for
each of the remaining columns. There is a simpler way to do this. Assuming our income and
expense amounts are about the same throughout the months, we want to copy the amounts
in Column C to Columns D, E and F. This will require two “steps”.

74 Computer Application in Management
Move your cursor to cell C6. First, we will highlight what we want to copy; next, we
will tell the spreadsheet where we want to place it. So, point to C6, hold down the left
mouse button and drag down the column until cells C6 through C21 are highlighted. Your
highlighted area should look like the image above.
Now, point to Edit in the Menu bar. Click the left mouse button. Point to Copy in the
menu that appears. Click the left button. The menu disappears.
You will notice that once again, when you highlight an area, a marquee of running
lights moves around the copy area. Thus, you will know you have highlighted the correct
area.
Now we will notify the program where to copy the information. Point to cell D6, click
and hold down the left mouse button and drag down and to the right to cell F21. (This will
highlight three columns OCT, NOV, DEC to copy.) When you have finished highlighting, your
screen should look like the image shown below:
Now point to Edit in the Menu Bar again and click the left mouse button. Point to
Paste. Click left button. Click on a cell away from the area where the numbers are located.
This will “turn-off” the highlight. Press the Esc key and the marquee will also disappear.
Note: You can also utilize the copy and paste buttons in the button bar to do this if
you desire.

Computer Application in Management 75
Change a few numbers in each of the months in both the income and expense areas
to see how the spreadsheet works.
Study Notes
Assessment
Write the process for the following:
a. Retrieving Spreadsheets
b. Inserting Cells, Columns and Rows
c. Widening Columns
d. Copy pasting in spread sheet
Discussion
Try out above-mentioned processing practically on a Computer system.

76 Computer Application in Management
2.8 Data Base Functions in Spreadsheet
Microsoft Excel contains number of database functions that are available and will
assist you in extracting information from your database.
DAVERAGE
Averages the values in a column of a list or database that match conditions you
specify. Syntax DAVERAGE (database, field, criteria) A database is a list of related data in
which rows of related information are records, and columns of data are fields. The first row
of the list contains labels for each column.
DCOUNT
Counts the cells that contain numbers in a column of a list or database that match
conditions that you specify. The field argument is optional. If field is omitted, DCOUNT
counts all records in the database that match the criteria.
DCOUNTA
Counts the nonblank cells in a column of a list or database that match conditions that
you specify. The field argument is optional. If field is omitted, DCOUNTA counts all records in
the database that match the criteria.
DGET
It extracts a single value from a column of a list or database that matches conditions
that you specify.
DMAX
It returns the largest number in a column of a list or database that matches
conditions that you specify.
DMIN
It returns the smallest number in a column of a list or database that matches conditions that
you specify.
DPRODUCT
It multiplies the values in a column of a list or database that match conditions that
you specify.
Computer Application in Management 77
DSTDEV
It estimates the standard deviation of a population based on a sample by using the
numbers in a column of a list or database that match conditions that you specify.
DSTDEVP
It calculates the standard deviation of a population based on the entire population by
using the numbers in a column of a list or database that match conditions you specify.
DSUM
It adds the numbers in a column of a list or database that match conditions that you
specify.
DVAR
It estimates the variance of a population based on a sample by using the numbers in
a column of a list or database that match conditions that you specify.
DVARP
It calculates the variance of a population based on the entire population by using the
numbers in a column of a list or database that match conditions that you specify.
Study Notes

78 Computer Application in Management
Assessment
Explain the following:
a. DAVERAGE
b. DCOUNTA
c. DPRODUCT
d. DSTDEV
e. DSUM
Discussion
Discuss purpose of DGET, DMAX and DMIN functions
2.9 Summary
With Windows, Microsoft has successfully addressed all the limitations of MS-DOS, in
addition to new user-friendly features. Windows is so-called because it allows users to work
on several Windows at the same time. Windows, which was a product of this class, was
based on a radically different approach called Graphical User Interface (GUI). In a Graphical
User Interface, the various commands and options are represented on the screen in the
form of small images called ‘Icons’.
A spreadsheet is a “number manipulator”. To make the manipulation of numbers
easier all spreadsheets are organised into rows and columns.
DISK OPERATING SYSTEMS AND WINDOWS
The operating System is used for operating the system or the computer. It is a set of
computer programs and also known as DOS (Disk Operating System). The main functions of
DOS are to manage disk files, allocate system resources according to the requirement.

Computer Application in Management 79
FEATURES OF WINDOWS
1. Faster Operating System: Windows include tools that increase the speed of the
computer. Windows include a set of programs designed to optimize your computer’s
efficiency, especially when used together.
2. Improved Reliability: Windows improves computer reliability by introducing new
wizards, utilities and resources that help keep your system running smoothly.
3. Innovative, Easy to use features: Windows makes your computer easier to use with new
and enhanced features.
TEXT PROCESSING SOFTWARE
Word processing software is used for creating documents. Drafts, letters, reports,
essays, write-ups etc can be created using word processing software. Earlier, Word Star was
being used widely for this purpose. Sidekick and Word Prefect are also used for drafting
letters. However, the most commonly used word processing package in the world is
Microsoft Word.
INTRODUCTION TO SPREADSHEETS
Spreadsheet is a computer application that simulates a paper worksheet. It displays
multiple cells that together make up a grid consisting of rows and columns, each cell
containing either alphanumeric text or numeric values. Spreadsheets are frequently used for
financial information because of their ability to re-calculate the entire sheet automatically
after a change to a single cell is made.
MICROSOFT EXCEL
Microsoft had been developing Excel on the Macintosh platform for several years at
this point, where it had developed into a powerful system. A port of Excel to Windows 2.0
resulted in a fully functional Windows spreadsheet.
DATA BASE FUNCTIONS IN SPREADSHEET
Microsoft Excel contains number of database functions that are available and will
assist you in extracting information from your database.
DAVERAGE
DCOUNT
DCOUNTA
DGET

80 Computer Application in Management
DMAX
DMIN
DPRODUCT
DSTDEV
DSTDEVP
DSUM
DVAR
DVARP
2.10 Self-Assessment Test
Broad Questions
1. Discuss the components of an Excel Workbook.
2. Explain any five database functions of Excel.
3. Take any 10 numbers and do the following:
a. Subtraction
b. Multiplication
c. Division
Short Notes
a. Objectives of MS-Excel
b. Inserting rows in an Excel Worksheet
c. Methods of closing Excel Workbook
d. Parts of an Excel window
e. Absoluting and Multiplication
2.11 Further Reading
1. Automating Managers: The Implications of Information Technology for Managers, John,
Moss Jones, London, Printer, 1990
2. Computers, Concepts and Uses 2nd ed., Summer M., Englewood Cliffs, New Jersey,
Prentice Hall Inc, 1988

Computer Application in Management 81
3. Foundations of Business Systems, David Van Over, Fort Worth, Dryden 1992
4. Information systems: Theory and practice 5th ed., Burch, John And Grudniski Gary, New
York., John Wiley, 1989
5. Online Business computer Applications 2nd Ed, Eliason A. L.,. Chicago Science Research
Associates, 1987

82 Computer Application in Management
Assignment
Use and practice MS Excel formulas and note down the commands for your reference.
___________________________________________________________________________
___________________________________________________________________________
___________________________________________________________________________
___________________________________________________________________________
___________________________________________________________________________
___________________________________________________________________________
___________________________________________________________________________
___________________________________________________________________________
___________________________________________________________________________
___________________________________________________________________________
___________________________________________________________________________
___________________________________________________________________________
___________________________________________________________________________
___________________________________________________________________________
___________________________________________________________________________
___________________________________________________________________________
___________________________________________________________________________
___________________________________________________________________________
___________________________________________________________________________
___________________________________________________________________________
___________________________________________________________________________
___________________________________________________________________________

Computer Application in Management 83
Unit 3 Modes of Data Processing
Learning Outcome
After reading this unit, you will be able to:
• Explain the modes of data processing
• Take a complete overview of a computer software system
• Define software development process
• Distinguish between data file types
• Describe the relevance of data base management system
Time Required to Complete the unit
1. 1st Reading: It will need 3 Hrs for reading a unit
2. 2nd Reading with understanding: It will need 4 Hrs for reading and understanding a
unit
3. Self Assessment: It will need 3 Hrs for reading and understanding a unit
4. Assignment: It will need 2 Hrs for completing an assignment
5. Revision and Further Reading: It is a continuous process
Content Map
3.1 Introduction
3.2 Data Processing
3.3 Computer Software System
3.4 Software Development Process
3.4.1 Software Development Models

84 Computer Application in Management
3.5 Data File Types
3.6 Master and Transaction File
3.7 Relevance of Database Management System
3.8 Summary
3.9 Self-Assessment Test
3.10 Further Reading

Computer Application in Management 85
3.1 Introduction
This unit explains the basic concepts of how a data is managed and processed, it is
meant to give a precise idea of how data processing is done. The unit also emphasizes on the
different types of software and their importance and applications. A brief concept on the
system development Life cycle has also been explained to give the students a fair idea of
how software is developed. Different types of file system are also a part of this unit.
3.2 Data Processing
The term Data Processing can be used to describe any computer procedure that
transforms data into information. It is an automatic process. As data is most helpful when
presented systematically, data-processing structures are frequently called information
systems. Data-processing systems characteristically maneuver raw data into information and
similarly information systems characteristically use raw data as input to generate
information as output.
In the framework of data processing, data is described as figures or characters that
represent dimensions from discernible phenomena. Calculated information is then
algorithmically deduced to multiple data. Information is described as either a meaningful
response to a question or a meaningful motivation that can give rise to further questions.
Fig. 3.1: Information Processor
Fig. 3.2: Data Processor
A data entry is a specialized component or form of information processing (sub)
system. Its chief difference is that it tends to perform a dedicated function (i.e. its program is

86 Computer Application in Management
not easy to change). Its dedicated function is normally to perform some (intermediate) step
of converting input ('raw' or unprocessed) data, or semi-processed information, from one
form into a further or final form of information. This is done through a process called
decoding/encoding, formatting, re-formatting, translation or data conversion before the
information can be output from the data processor to a further step in the information
processing system.
For the hardware data processing system, this information may be used to change
the sequential states of a (hardware) machine called a computer. In all essential aspects, the
hardware data processing unit is indistinguishable from a computer's central processing unit
(CPU), i.e. the hardware data processing unit is just a dedicated computer. However, the
hardware data processing unit is normally dedicated to the specific computer application of
format translation.
A software code compiler (e.g. for FORTRAN or Algol) is an example of a software
data processing system. The software data processing system makes use of a (general-
purpose) computer, in order to complete its functions. A software data processing system is
normally a stand-alone unit of software, in that its output can be directed to any number of
other (not necessarily as yet identified) information processing (sub) systems.
Study Notes
Assessment
What us a Data Processor and Data Processing?

Computer Application in Management 87
Discussion
Discuss what is software code compiler.
3.3 Computer Software System
Computer software, or just software, is the collection of computer programs and
related data that provide the instructions telling a computer what to do. The term was
coined to contrast the old term hardware (meaning physical devices). In contrast to
hardware, software is intangible, meaning it "cannot be touched". Software is also
sometimes used in a more narrow sense, to include application software only. Sometimes
the term includes data that has traditionally not been associated with computers, such as
film, presses and records.
The various types of Computer Software are discussed below:
SYSTEM SOFTWARE
System software is the program that controls computer hardware. It also maintains
computer operation efficiently. The main components of system software are the operating
system, network operating system and utility.
System software is computer software designed to operate the computer hardware
and to provide and maintain a platform for running application software.
The most basic types of system software are:
• The computer BIOS and device firmware, which provides basic functionality to operate
and control the hardware connected to or built into the computer.
• The operating system (prominent examples being Microsoft Windows, Mac OS X and
Linux), which allows the parts of a computer to work together by performing tasks like
transferring data between memory and disks or rendering output onto a display device.
It also provides a platform to run high-level system software and application software.
• Utility software, which helps to analyze, configure, optimize and maintain the computer.
APPLICATION SOFTWARE
Application software, is computer software designed to help the user to perform
singular or multiple related specific tasks. Examples include enterprise software, accounting
software, office suites, graphics software, and media players.

88 Computer Application in Management
Application software is contrasted with system software and middleware, which
manage and integrate a computer's capabilities, but typically there is no direct application of
them in the performance of tasks that benefit the user.
We have seen that the application software tells the computer how to accomplish
specific tasks such as word processing or creating drawings for the user. Some of the
categories of application software include:
• Word Processing Software
• Spreadsheets
• Database Management Software
• Presentation Programs
• Graphics Programs
• Multimedia Authoring Applications
• Entertainment and Education software
• Web design tools and Web browsers
• Games
PROGRAMMING SOFTWARE
Programming software usually provides tools to assist a programmer in writing
computer programs and software using different programming languages in a more
convenient way. The tools include:
• Compilers
• Debuggers
• Interpreters
• Linkers
• Text editors
An Integrated Development Environment (IDE) is a single application that attempts
to manage all these functions.
Computer Application in Management 89
PROGRAMMING LANGUAGES
Different programming languages support different styles of programming (called
programming paradigms). The choice of language used is subject to many considerations
such as company policy, suitability to task, availability of third-party packages or individual
preference. Ideally, the programming language best suited for the immediate task will be
selected. Trade-offs from this ideal involve finding enough programmers, who know the
language to build a team, the availability of compilers for that language and the efficiency
with which programs written in a given language execute.
Many computer languages provide a mechanism to call functions provided by
libraries. Provided the functions in a library follow the appropriate run time conventions
(e.g. method of passing arguments), then these functions may be written in any other
language.
Study Notes
Assessment
What are Programming Languages. Give few examples.
Discussion
Differentiate between System Software, Application Software and Programming Software.

90 Computer Application in Management
3.4 Software Development Process
A software development process is a structure imposed on the development of a
software product. Similar terms include software life cycle and software process. There are
several models for such processes; each describing approaches to a variety of tasks or
activities in the process.
OVERVIEW
The large and growing body of software development organisations implements
process methodologies. The international standard for describing the method of selecting,
implementing and monitoring the life cycle for software is ISO 12207.
A decades-long goal has been to find repeatable, predictable processes that improve
productivity and quality. Some try to systematize or formalize the seemingly unruly task of
writing software. Others apply project management techniques for writing software.
Without project management, software projects can easily be delivered late or over budget.
With large numbers of software projects not meeting their expectations in terms of
functionality, cost or delivery schedule, effective project management appears to be lacking.
Organisations may create a Software Engineering Process Group (SEPG), which is the
focal point for process improvement. Composed of line practitioners who have varied skills,
the group is at the centre of the collaborative effort of everyone in the organisation involved
with the improvement of the software engineering process.
PLANNING
An important task in creating a software product is extracting the requirements or
requirements analysis. Customers typically have an abstract idea of what they want as a
result, but not of what the software should do. Frequently demonstrating the live code may
help reduce the risk of incorrect requirements.
Once the general requirements are gathered from the client, an analysis of the scope
of the development should be determined and clearly stated. This is often called a scope
document.
IMPLEMENTATION, TESTING AND DOCUMENTING
Implementation is the part of the process where software engineers actually
program the code for the project.
Software testing is an important part of the process. It ensures that defects are
recognised as early as possible.

Computer Application in Management 91
Documenting the internal design of software for the purpose of future maintenance
and enhancement is done throughout development. This may also include the writing of an
API, be it external or internal. It is very important to document everything in the project.
DEPLOYMENT AND MAINTENANCE
Deployment starts after the code is appropriately tested, approved for release and
sold or otherwise distributed into a production environment.
Software Training and Support is an important stage for people venturing into an
unfamiliar area and may be required to learn the new software.
Maintaining and enhancing software to cope with newly discovered problems or new
requirements can take far more time than the initial development of the software. It may be
necessary to add a code that does not fit the original design, in order to correct an
unforeseen problem. It may also be that a customer is requesting more functionality and a
code can be added to accommodate his requests. If the labour cost of the maintenance
phase exceeds 25% of the prior-phases' labour cost, then it is likely that the overall quality of
at least one prior phase is poor In that case, management should consider the option of
rebuilding the system (or portions) before maintenance cost goes out of control.
Bug Tracking System tools are often deployed at this stage of the process to allow
development teams to interface with customer/field teams testing the software, to identify
any real or perceived issues. These software tools, both open source and commercially
licensed, provide a customizable process to acquire, review, acknowledge and respond to
reported issues.
3.4.1 SOFTWARE DEVELOPMENT MODELS
Several models exist to streamline the development process. Sometimes a
combination of the models may be more suitable.
WATERFALL MODEL
The waterfall model shows a process where developers follow the steps in this order:
• Requirements specification (Requirements analysis)
• Software design
• Implementation (or Coding)
• Integration
• Testing (or Validation)

92 Computer Application in Management
• Deployment (or Installation)
• Maintenance
In a Waterfall model, after each phase is finished, it proceeds to the next one.
Reviews may occur before moving to the next phase, allowing the possibility of changes.
Reviews may also be employed to ensure that the phase is indeed complete; the phase
completion criteria are often referred to as a "gate" that the project must pass through to
move to the next phase. Waterfall discourages revisiting and revising any prior phase once it
is complete. This "inflexibility" in a pure Waterfall model has been a source of criticism by
other more "flexible" models.
SPIRAL MODEL
The key characteristic of a Spiral model is risk management at regular stages in the
development cycle. In 1988, Barry Boehm published a formal software system development
"spiral model". It combines some key aspects of the waterfall model and rapid prototyping
methodologies, but provides emphasis in a key area: deliberate iterative risk analysis. The
Spiral is visualised as a process passing through a number of iterations, with the four
quadrant diagrams representative of the following activities:
• Formulate plans to: identify software targets selected to implement the program and
clarify project development restrictions
• Risk analysis: an analytical assessment of selected programs to consider how to identify
and eliminate risk
• Implementation of the project: the implementation of software development and
verification
The spiral model has some restrictive conditions as given below:
• Spiral model emphasizes risk analysis and is often adapted to large-scale internal
software development.
• If the implementation of risk analysis greatly affects the profits of the project, then risk
analysis is meaningless; therefore, spiral model is suitable for large-scale software
projects.
• Good software developers should look for possible risks and accurately analyse the risk,
otherwise it may lead to greater risk.

Computer Application in Management 93
The first stage is to determine the goal of accomplishing these objectives, options
and constraints and then from the perspective of risk analysis program, development
strategy one must strive to remove all potential risks. If some risk cannot be ruled out, the
program must end immediately, or else start the development of the next steps. The next
stage is the evaluation results and the design of the next phase.
Study Notes
Assessment
Explain the following Software Development Models in detail:
a. Waterfall Model
b. Spiral Model
Discussion
Discuss Software Development Process.

94 Computer Application in Management
3.5 Data File Types
Data Files: A data file is used to store data records. These data files are well-defined
data structures that contain related data organized in convenient groupings (records) of data
items. Each data file has two additional types of records: Header record and trailer record.
Header records contain file identification information and keep different groups of records
in a file. Trailer records contain codes to mark the end of a set of data records. They also
record file usage information.
CATEGORIES OF DATA FILES
Categories of data files: Depending upon the nature of data, data files can be
categorized as:
• Master file
• Transaction file
• Work file
• Audit file
• Backup file
Program files: Program files are used to store programs in different languages
provided by different software vendors. These files have different extensions depending on
the language used to write a program, e.g. a program file in 'C' Language has extension .c
while a program file in C++ has extension .cpp.
Object code files: These files store compiled programs written in a language. These
files contain the machine code, e.g. after compilation, C compiler creates a file having
extension .obj.
Executable Files: These files store ready to execute programs. These files may have
the extension .exe, .com or .bat. These programs can be directly executed from the
command Prompt.
Unformatted Text Files: These files are simple files containing simple text. Text files
can be created using any text editor or line editor, e.g. text files can be created using MS-
DOS Edit editor or Notepad editor provided by MS-Windows.
Formatted Text Files: These files contain formatted text. They also contain some
commands and symbols to format the text. These files can be created using any word
processor, e.g. MS-WORD creates a formatted text file having extension .doc.
Computer Application in Management 95
Study Notes
Assessment
1. What are Data Files?
2. What are the categories of data files?
Discussion
Differentiate between: Unformatted Text Files and Formatted Text Files
3.6 Master and Transaction File
MASTER FILE
This is a collection of records pertaining to one of the main subjects of an
information system such as customers, employees, products and vendors. Master files
contain descriptive data such as name and address, as well as summary information such as
amount due and year-to-date sales.
Following are the kinds of fields that make up a typical master record in a business
information system. There can be many more fields depending on the organisation. The
"key" fields below are the ones that are generally indexed for matching against the

96 Computer Application in Management
transaction records as well as fast retrieval for queries. The account number is usually the
primary key, but name may also be primary. There can be secondary indexes; for example, in
an inverted file structure, almost all the fields could be indexed.
Employee Master Record
Key: Employee account number
Key: Name (last)
Name (first)
Address, city, state, zip
Hire date
Birth date
Title
Job class
Pay rate
Year-to-date gross pay
Customer Master Record
Key: Customer account number
Key: Name
Bill-to address, city, state, zip
Ship-to address, city, state, zip
Credit limit
Date of first order
Sales-to-date
Balance due
Vendor Master Record
Key: Vendor account number
Key: Name
Address, city, state, zip

Computer Application in Management 97
Terms
Quality rating
Shipping method
Product Master Record
Key: Product number
Key: Name
Description
Quantity on hand
Location
Primary vendor
Secondary vendor
TRANSACTION FILE
This is a collection of transaction records. The data in transaction files is used to
update the master files that contain data about the subjects of the organisation (customers,
employees, vendors, etc.). Transaction files also serve as audit trails and history for the
organisation. They are often kept online.
Following are the kinds of fields that make up a distinctive transaction record in a
business information system. There can be many more fields depending on the organisation.
The "key" fields below are the ones that are generally indexed for fast matching against the
master record. The account number is usually the primary key; however, name may also be
used as a primary key.
Employee Payroll Record
Key: Employee account number
Today's date
Hours worked
Order Record
Key: Customer account number
Today's date
Quantity

98 Computer Application in Management
Product number
Payment Record
Key: Customer number
Today's date
Invoice number
Amount paid
Check number
Purchase Order
Key: Purchase order number
Today's date
Department
Authorizing agent
Vendor account number
Quantity
Product number
Due date
Total cost
Warehouse Receipt
Key: Purchase order number
Key: Invoice number
Today's date
Quantity
Product number
Study Notes

Computer Application in Management 99
Assessment
1. What is master file?
2. What is Transaction file?
Discussion
What is the difference between Master File and Transaction File?
3.7 Relevance of Database Management System
Database is a software program used to store, delete, update and retrieve data. A
database can be limited to a single desktop computer or can be stored in large server
machines such as the IBM Mainframe. There are various database management systems
available in the market. Some of them are Sybase, Microsoft SQL Server, Oracle RDBMS,
PostgreSQL, MySQL, etc.
The advantages of the database management systems can be enumerated as under:
WAREHOUSE OF INFORMATION
The database management systems are warehouses of information, where large
amount of data can be stored. The common examples in commercial applications are
inventory data, personnel data, etc. Examples for these would be the address book of a cell
phone, digital diaries, etc. Both these equipments store data in their internal database.

100 Computer Application in Management
DEFINING ATTRIBUTES
The unique data field in a table is assigned a primary key. The primary key helps in
the identification of data. It also checks for duplicates within the same table, thereby
reducing data redundancy. There are tables, which have a secondary key, in addition to the
primary key. The secondary key is also called 'foreign key'. The secondary key refers to the
primary key of another table, thus establishing a relationship between the two tables.
SYSTEMATIC STORAGE
The data is stored in the form of tables. The tables consist of rows and columns. The
primary and secondary keys help to eliminate data redundancy, thus enabling systematic
storage of data.
CHANGES TO SCHEMA
The table schema can be changed and it is not platform dependent. Therefore, the
tables in the system can be edited to add new columns and rows without hampering the
applications that depend on that particular database.
NO LANGUAGE DEPENDENCE
The database management systems are not language dependent. Therefore, they
can be used with various languages and on various platforms.
JOINING/ MERGING TABLES
The data in two or more tables can be integrated into a single table. This enables to
reduce the size of the database and helps in easy retrieval of data.
MULTIPLE SIMULTANEOUS USAGE
The database can be used simultaneously by a number of users. Various users can
retrieve the same data simultaneously. The data in the database can also be modified, based
on the privileges assigned to users.
DATA SECURITY
Data is the most important asset. Therefore, there is a need for data security.
Database management systems helps to keep the data secured.
PRIVILEGES

Computer Application in Management 101
Different privileges can be given to different users. Some users, for example, can edit
the database, but are not allowed to delete the contents of the database.
ABSTRACT VIEW OF DATA AND EASY RETRIEVAL
DBMS enables easy and convenient retrieval of data. A database user can view only
the abstract form of data; the complexities of the internal structure of the database are
hidden from him. The data retrieved exists in a user-friendly format.
DATA CONSISTENCY
Data consistency ensures a consistent view of data to every user. It includes the
accuracy, validity and integrity of related data. The data in the database must satisfy certain
consistency constraints, for example, the age of a candidate appearing for an exam should
be of number data type and in the range of 20-25. When the database is updated, these
constraints are checked by the database systems.
The commonly used database management system is called relational database
management system (RDBMS). The most important advantage of database management
systems is the systematic storage of data, by maintaining the relationship between the data
members. The data is stored as tuples in a RDBMS.
The advent of object-oriented programming gave rise to the concept of object
oriented database management systems. These systems combine properties like
inheritance, encapsulation, polymorphism, abstraction with atomicity, consistency, isolation
and durability, also called ACID properties of DBMS.
Study Notes
Assessment

102 Computer Application in Management
What are the advantages of the database management systems?
Discussion
"Database management systems have brought about systematization in data storage, along
with data security". Discuss.
3.8 Summary
DATA PROCESSING
The processing is typically supposed to be automatic and running on a computer. As
data are most helpful when presented systematically and in fact educational, data-
processing structures are frequently called as information systems to highlight their
practicality. Nonetheless, both terms mean the same, executing alike conversions; data-
processing systems characteristically maneuver raw data into information and similarly
information systems characteristically use raw data as input to generate information as
output.
For the hardware data processing system, this information may be used to change
the sequential states of a (hardware) machine called a computer. In all essential aspects, the
hardware data processing unit is indistinguishable from a computer's central processing unit
(CPU), i.e. the hardware data processing unit is just a computer. However, the hardware
data processing unit is normally dedicated to the specific computer application of format
translation.
COMPUTER SOFTWARE SYSTEM
Computer software, or just software, is the collection of computer programs and
related data that provide the instructions telling a computer what to do.
SYSTEM SOFTWARE
System software is the program that controls computer hardware. It also maintains
computer operation efficiency. The main components of system software are operating
system, network operating system and utility.

Computer Application in Management 103
APPLICATION SOFTWARE
The application software tells the computer how to accomplish specific tasks such as
word processing or creating drawings for the user.
PROGRAMMING SOFTWARE
Programming software provides tools to assist a programmer in writing computer
programs, and software using different programming languages in a more convenient way.
PROGRAMMING LANGUAGES
Different programming languages support different styles of programming (called
programming paradigms). The choice of language used is subject to many considerations,
such as company policy, suitability to task, availability of third-party packages or individual
preference.
SOFTWARE DEVELOPMENT PROCESS
A software development process is a structure imposed on the development of a
software product. Similar terms include software life cycle and software process.
OVERVIEW
The international standard for describing the method of selecting, implementing and
monitoring the life cycle for software is ISO 12207.
PLANNING
An important task in creating a software product is extracting the requirements or
requirements analysis. Once the general requirements are gathered from the client, an
analysis of the scope of the development should be determined and clearly stated. This is
often called a scope document.
IMPLEMENTATION, TESTING AND DOCUMENTING
Implementation is the part of the process where software engineers actually
program the code for the project.
Software testing is an important part of the process. It ensures that defects are
recognised as early as possible.

104 Computer Application in Management
Documenting the internal design of software for the purpose of future maintenance
and enhancement is done throughout development. This may also include the writing of an
API, be it external or internal. It is very important to document everything in the project.
DEPLOYMENT AND MAINTENANCE
Deployment starts after the code is appropriately tested, approved for release and
sold or otherwise distributed into a production environment. Maintaining and enhancing
software to cope with newly discovered problems or new requirements can take far more
time than the initial development of the software.
SOFTWARE DEVELOPMENT MODELS
Several models exist to streamline the development process.
WATERFALL MODEL
The waterfall model shows a process where developers follow the steps in this order:
• Requirements specification (Requirements analysis)
• Software design
• Implementation (or Coding)
• Integration
• Testing (or Validation)
• Deployment (or Installation)
• Maintenance
SPIRAL MODEL
• Formulate plans to: identify software targets selected to implement the program and
clarify project development restrictions
• Risk analysis: an analytical assessment of selected programs to consider how to identify
and eliminate risk
• Implementation of the project: the implementation of software development and
verification
DATA FILE TYPES
A data file is used to store the data records. These data files are well-defined data
structures that contain related data organized in convenient groupings (records) of data

Computer Application in Management 105
items. Each data file has two additional types of records: Header record and trailer record.
Header records contain file identification information and keep separate groups of records
in a file. Trailer records contain codes to mark the end of a set of data records. They also
record file usage information
MASTER FILE
This is a collection of records pertaining to one of the main subjects of an
information system, such as customers, employees, products and vendors. Master files
contain descriptive data, such as name and address, as well as summary information, such as
amount due and year-to-date sales.
TRANSACTION FILE
This is a collection of transaction records. The data in transaction files is used to
update the master files, which contain the data about the subjects of the organisation
(customers, employees, vendors, etc.). Transaction files also serve as audit trails and history
for the organisation. Where earlier they were transferred to offline storage after some
period, they are increasingly being kept online for routine analyses.
RELEVANCE OF DATABASE MANAGEMENT SYSTEM
Database is a software program used to store, delete, update and retrieve data.
There are various database management systems available in the market. Some of them are
Sybase, Microsoft SQL Server, Oracle RDBMS, PostgreSQL, MySQL, etc.
The advantages of the database management systems can be enumerated as under:
Warehouse of Information: The database management systems are warehouses of
information, where large amount of data can be stored. The common examples in
commercial applications are inventory data, personnel data, etc.
• Defining Attributes
• Systematic Storage
• Changes to Schema
• No Language Dependence
• Table Joins
• Multiple Simultaneous Usage
• Data Security
106 Computer Application in Management
• Privileges: Different privileges can be given to different users. Some users, for example,
can edit the database, but are not allowed to delete the contents of the database.
• Abstract View of Data and Easy Retrieval
• Data Consistency
3.9 Self-Assessment Test
Board Questions
1. Explain software development process in detail.
2. Explain how Data base Management system forms the backbone of any software
application.
Short Notes
a. Master and transaction File
b. System software
c. Data Files
d. Functions of network operating system
e. Software development models
3.10 Further Reading
1. Automating Managers: The Implications of Information Technology for Managers, John,
Moss Jones, London, Printer, 1990
2. Computers, Concepts and Uses 2nd ed., Summer M., Englewood Cliffs, New Jersey,
Prentice Hall Inc, 1988
3. Foundations of Business Systems, David Van Over, Fort Worth, Dryden 1992
4. Information systems: Theory and practice 5th ed., Burch, John And Grudniski Gary, New
York., John Wiley, 1989
5. Online Business Computer Applications 2nd Ed, Eliason A. L.,. Chicago Science Research
Associates, 1987

Computer Application in Management 107
Assignment
Explain in detail the different types of software system, their relevance and meaning of
database.
___________________________________________________________________________
___________________________________________________________________________
___________________________________________________________________________
___________________________________________________________________________
___________________________________________________________________________
___________________________________________________________________________
___________________________________________________________________________
___________________________________________________________________________
___________________________________________________________________________
___________________________________________________________________________
___________________________________________________________________________
___________________________________________________________________________
___________________________________________________________________________
___________________________________________________________________________
___________________________________________________________________________
___________________________________________________________________________
___________________________________________________________________________
___________________________________________________________________________
___________________________________________________________________________
___________________________________________________________________________
___________________________________________________________________________
___________________________________________________________________________

108 Computer Application in Management
___________________________________________________________________________
___________________________________________________________________________
___________________________________________________________________________
___________________________________________________________________________
___________________________________________________________________________
___________________________________________________________________________
___________________________________________________________________________
___________________________________________________________________________
___________________________________________________________________________
___________________________________________________________________________
___________________________________________________________________________
___________________________________________________________________________
___________________________________________________________________________
___________________________________________________________________________
___________________________________________________________________________
___________________________________________________________________________
___________________________________________________________________________
___________________________________________________________________________
___________________________________________________________________________
___________________________________________________________________________
___________________________________________________________________________
___________________________________________________________________________
___________________________________________________________________________
___________________________________________________________________________

Computer Application in Management 109
Unit 4 Basics of Data Processing
Learning Outcome
After reading this unit, you will be able to:
• Explain the basics of data processing
• Enlist the elements of data processing
• Work on an overview of data hierarchy and data file structure
• Apply portfolio development
• Define the concept of micro database manager
Time Required to Complete the unit
1. 1st Reading: It will need 3 Hrs for reading a unit
2. 2nd Reading with understanding: It will need 4 Hrs for reading and understanding a
unit
3. Self Assessment: It will need 3 Hrs for reading and understanding a unit
4. Assignment: It will need 2 Hrs for completing an assignment
5. Revision and Further Reading: It is a continuous process
Content Map
4.1 Introduction
4.2 Basics of Data Processing
4.2.1 Data Analysis
4.2.2 Processing
4.2.3 Elements of Data Processing

110 Computer Application in Management
4.3 Data Hierarchy and Data File Structures
4.3.1 File Structure
4.4 Application Portfolio Management
4.5 Introduction to Micro DataBase Manager
4.6 Summary
4.7 Self-Assessment Test
4.8 Further Reading

Computer Application in Management 111
4.1 Introduction
Elements of Data processing, the way data is analysed and the details and intricacies
of it is explained in this unit. The way the data is managed, the data hierarchy has also been
mentioned for the students to understand the concepts in detail. Different types of file
format and file structure are also explained in this unit. A brief idea and introduction of
application portfolio management is also given. In short, the student would have a fair idea
of the hierarchy and structure of data.
4.2 Basics of Data Processing
Data processing means any process that uses a computer program to enter data and
summarise, analyse or otherwise convert data into usable information. The process may be
automated and run on a computer. It involves recording, analysing, sorting, summarising,
calculating, disseminating and storing data. Because data is most useful when well
presented and actually informative, data-processing systems are often referred to as
information systems.
Nevertheless, data-processing systems typically manipulate raw data into
information, and likewise information systems typically take raw data as input to produce
information as output.
Data processing may or may not be distinguished from data conversion, when the
process is merely to convert data to another format and does not involve any data
manipulation.
4.2.1 DATA ANALYSIS
When the domain from which the data is harvested is a science or an engineering
field, data processing and information systems are considered terms that are too broad and
the more specialized term data analysis is typically used. This is a focus on the highly
specialised and highly accurate algorithmic derivations and statistical calculations that are
less often observed in the typical general business environment.
In these contexts data analysis packages like DAP, gretl or PSPP are often used. This
divergence of culture is exhibited in the typical numerical representations used in data
processing versus numerical; data processing's measurements are naturally represented by
integers or by fixed-point or binary-coded decimal representations of numbers, whereas the
majority of data analysis measurements are often represented by floating-point
representation of rational numbers.
112 Computer Application in Management
4.2.2 PROCESSING
Practically all naturally occurring processes can be viewed as examples of data
processing systems where "observable" information in the form of pressure, light, etc. are
converted by human observers into electrical signals in the nervous system. We recognise
these senses as touch, sound, and vision. Even the interaction of non-living systems may be
viewed in this way as rudimentary information processing systems.
4.2.3 ELEMENTS OF DATA PROCESSING
In order to be processed by a computer, data needs to first be converted into a
machine-readable format. Once data is in digital format, various procedures can be applied
on the data to get useful information. Data processing may involve various processes,
including:
• Data acquisition
• Data entry
• Data cleaning
• Data coding
• Data transformation
• Data translation
• Data summarization
• Data aggregation
• Data validation
• Data tabulation
• Statistical analysis
• Computer graphics
• Data warehousing
• Data mining
• Data fusion

Computer Application in Management 113
Study Notes
Assessment
What do you understand by Data Processing and Data Analysing?
Discussion
Discuss various elements of Data Processing.
4.3 Data Hierarchy and Data File Structures
This refers to the systematic organisation of data, often in a hierarchical form. Data
organisation involves fields, records, files and so on.
• A data field holds a single fact. Consider a date field, e.g. "September 19, 2004". This can
be treated as a single date field (e.g. birthdate) or as three fields, namely, month, day of
month and year.
• A record is a collection of related fields. An Employee record may contain a name
field(s), address fields, birth date field and so on.

114 Computer Application in Management
• A file is a collection of related records. If there are 100 employees, then each employee
would have a record (e.g. called Employee Personal Details record) and the collection of
100 such records would constitute a file (in this case, called Employee Personal Details
file).
• Files are integrated into a database. This is done using a Database Management System.
If there are other facets of employee data that we wish to capture, then other files such
as Employee Training History file and Employee Work History file could be created as
well.
• In terms of data storage, data fields are made of bytes and these in turn are made up of
bits.
DATA FILE STRUCTURES
This is a particular way that information is encoded for storage in a computer file.
Since a disk drive, or indeed any computer storage, can store only bits, the computer
must have some way of converting information to 0s and 1s and vice-versa. There are
different kinds of formats for different kinds of information. Within any format type, e.g.
word processor documents, there will characteristically be several different formats.
File formats are divided into proprietary and open formats.
GENERALITY
Some file formats are designed to store only a particular type of data: the JPEG
format, for example, is designed only to store static photographic images. Other file formats,
however, are designed for storage of several different types of data: the GIF format supports
storage of both still images and simple animations, and the QuickTime format can act as a
container for many different types of multimedia. A text file is simply one that stores any
text, in a format such as ASCII or UTF-8. Some file formats, such as HTML are also text files.
SPECIFICATIONS
Many file formats, including some of the most well-known file formats, often have a
published specification document (often with a reference implementation) that describes
exactly how the data is to be encoded, and which can be used to determine whether or not
a particular program treats a particular file format correctly.
Using file formats without a publicly available specification can be costly. Learning
how the format works will require either reverse engineering from a reference
implementation or acquiring the specification document for a fee from the format
Computer Application in Management 115
developers. This second approach is possible only when there is a specification document
and typically requires the signing of a non-disclosure agreement. Both strategies require
significant time, money or both. Therefore, generally, file formats with publicly available
specifications are supported by a large number of programs, while non-public formats are
supported by only a few programs.
IDENTIFYING THE TYPE OF A FILE
A method is required to determine the format of a particular file within the file
system- an example of metadata. Different operating systems have traditionally taken
different approaches to this problem, with each approach having its own advantages and
disadvantages.
Of course, most modern operating systems and individual applications, need to use
all of these approaches to process various files, at least to be able to read 'foreign' file
formats, if not work with them completely.
FILENAME EXTENSION
One popular method in use by several operating systems, including Mac OS X, CP/M,
DOS, VMS, VM/CMS and Windows, is to determine the format of a file based on the section
of its name following the final period. This portion of the filename is known as the filename
extension.
For example, HTML documents are identified by names that end with .html (or .htm)
and GIF images by .gif. In the original FAT file system, filenames were limited to an eight-
character identifier and a three-character extension, which is known as 8.3 filename. Many
formats, thus, still use three-character extensions, even though modern operating systems
and application programs no longer have this limitation.
One artifact of this approach is that the system can easily be tricked into treating a
file as a different format simply by renaming it. An HTML file can, for instance, be easily
treated as plain text by renaming it from filename.html to filename.txt. Although this
strategy was useful to expert users, who could easily understand and manipulate this
information, it was frequently confusing to less technical users, who might accidentally
make a file unusable (or 'lose' it) by renaming it incorrectly.
This led more recent operating system shells such as Windows 95 and Mac OS X, to
hide the extension when displaying lists of recognised files. This separates the user from the
complete filename, preventing the accidental changing of a file type, while allowing expert
users to retain the original functionality through enabling the displaying of file extensions.

116 Computer Application in Management
A downside of hiding the extension is that it then becomes possible to have what
appear to be two or more identical filenames in the same folder. This is especially true when
image files are needed in more than one format for different applications.
For example, a company logo may be needed in both .tif format (for publishing) and
.gif format (for web sites). With the extensions visible, these would appear as the unique
filenames "CompanyLogo.tif" and "CompanyLogo.gif". With the extensions hidden, these
would both appear to have the identical filename "Company Logo", making it more difficult
to determine which one to select for a particular application.
A further downside is that hiding such information can become a security risk. This is
because on a filename extensions-reliant system all usable files will have such an extension
(for example all JPEG images will have ".jpg" or ".jpeg" at the end of their name), so seeing
file extensions would be a common occurrence and users may depend on them when
looking for a file's format. By having file extensions hidden, a malicious user can create an
executable program with an innocent name such as "Holiday photo.jpg.exe". In this case, the
".exe" will be hidden and a user will see this file as "Holiday photo.jpg", which appears to be
a JPEG image, unable to harm the machine save for bugs in the application used to view it.
However, the operating system will still see the ".exe" extension and thus will run the
program, which is then able to cause harm and presents a security risk. This issue requires
users with hidden extensions to be vigilant and never open files, which seem to have a
known extension displayed despite the hidden option being enabled (since it must therefore
have 2 extensions, the real one being unknown until hiding is disabled). This presents a
practical problem for Windows systems where extension hiding is turned on by default.
INTERNAL METADATA
A second way to identify a file format is to store information regarding the format
inside the file itself. Usually, such information is written in one (or more) binary string(s),
tagged or raw texts placed in fixed, specific locations within the file. Since the easiest place
to locate them is at the beginning of it, this area is usually called a file header when it is
greater than a few bytes or a magic number if it is just a few bytes long.
FILE HEADER
First, the meta-data contained in a file header are not necessarily stored only at the
beginning of it, but might be present in other areas too, often including the end of the file;
that depends on the file format or the type of data it contains. Character-based (text) files
have character-based human-readable headers, whereas, binary formats usually feature
Computer Application in Management 117
binary headers, although that is not a rule: a human-readable file header may require more
bytes, but is easily discernable with simple text or hexadecimal editors. File headers may not
only contain the information required by algorithms to identify the file format alone, but
also real metadata about the file and its contents.
For example, most image file formats store information about image size, resolution,
colour space/format and optionally other authoring information like who, when and where
it was made, what camera model and shooting parameters it was taken with and so on. Such
metadata may be used by a program reading or interpreting the file both during the loading
process and after that, but can also be used by the operating system to quickly capture
information about the file itself without loading it all into memory.
The downsides of file header as a file-format identification method are at least two.
First, at least a few (initial) blocks of the file need to be read, in order to gain such
information; those could be fragmented in different locations of the same storage medium,
thus requiring more time to find. Second, if the header is binary hard-coded (i.e. the header
itself is subject to a non-trivial interpretation in order to be recognised), especially for
metadata content protection's sake, there is a risk that the file format may be
misinterpreted, or even badly written at the source, often resulting in corrupt metadata,
which might even render the file unreadable.
A more logically sophisticated example of file header is the one used in wrapper (or
container) file formats.
EXTERNAL METADATA
A final way of storing the format of a file is to explicitly store information about the
format in the file system, rather than within the file itself.
This approach keeps the metadata separate from both the main data and the name,
but it is also less portable than either file extensions or "magic numbers", since the format
has to be converted from filesystem to filesystem.
Zip files or archive files solve the problem of handling metadata. A utility program
collects multiple files together along with metadata about each file and the
folders/directories they came from all within one new file (e.g. a zip file with extension .zip).
The new file is also compressed and possibly encrypted, but now is transmissible as a single
file across operating systems by FTP systems or attached to email. At the destination, it must
be unzipped by a compatible utility to be useful, but the problems of transmission are solved
this way.

118 Computer Application in Management
MAC OS TYPE-CODES
The Mac OS' Hierarchical File System stores codes for creator and type as part of the
directory entry for each file. These codes are referred to as OS Types, and for instance a
HyperCard "stack" file has a creator of WILD (from HyperCard's previous name, "Wildcard")
and a type of STAK. The type code specifies the format of the file, while the creator code
specifies the default program to open it with when double-clicked by the user. For example,
the user could have several text files all with the type code of TEXT, but each one may open
in a different program, due to having differing creator codes. RISC OS uses a similar system,
consisting of a 12-bit number, which can be looked up in a table of descriptions- e.g. the
hexadecimal number FF5 is "aliased" to PoScript, representing a PostScript file.
MAC OS X UNIFORM TYPE IDENTIFIERS (UTIS)
A Uniform Type Identifier (UTI) is a method used in Mac OS X for uniquely identifying
"typed" classes of entity such as file formats. It was developed by Apple as a replacement for
OSType (type & creator codes).
The UTI is a Core Foundation string, which uses a reverse-DNS string. Common or
standard types use the public domain (e.g. www.public.png for a Portable Network Graphics
image), while other domains can be used for third-party types (e.g. www.adobe.pdf for
Portable Document Format). UTIs can be defined within a hierarchical structure, known as a
conformance hierarchy. Thus, public.png conforms to a super type of public image, which
itself conforms to a super type of public data. A UTI can exist in multiple hierarchies, which
provides great flexibility.
In addition to file formats, UTIs can also be used for other entities, which can exist in
OS X, including:
• Pasteboard data
• Folders (directories)
• Translatable types (as handled by the Translation Manager)
• Bundles
• Frameworks
• Streaming data
• Aliases and symlinks

Computer Application in Management 119
OS/2 EXTENDED ATTRIBUTES
The HPFS, FAT12 and FAT16 (but not FAT32) file systems allow the storage of
"extended attributes" with files. These comprise an arbitrary set of triplets with a name, a
coded type for the value and a value, where the names are unique and values can be up to
64 KB long. There are standardized meanings for certain types and names (under OS/2). One
such type is that the ".TYPE" extended attribute is used to determine the file type. Its value
comprises a list of one or more file types associated with the file, each of which is a string,
such as "Plain Text" or "HTML document". Thus a file may have several types.
The NTFS file system also allows the storage of OS/2 extended attributes, as one of
file forks, but this feature is merely present to support the OS/2 subsystem (not present in
XP), so the Win32 subsystem treats this information as an opaque block of data and does
not use it. Instead, it relies on other file forks to store meta-information in Win32-specific
formats. OS/2 extended attributes can still be read and written by Win32 programs, but the
data must be entirely parsed by applications.
POSIX EXTENDED ATTRIBUTES
On Unix and Unix-like systems, the ext2, ext3, ReiserFS version 3, XFS, JFS, FFS, and
HFS+ file systems allow the storage of extended attributes with files. These include an
arbitrary list of "name=value" strings, where the names are unique, which can be accessed
by their "name" parts.
PRONOM UNIQUE IDENTIFIERS (PUIDS)
The PRONOM Persistent Unique Identifier (PUID) is an extensible scheme of
persistent, unique and unambiguous identifiers for file formats, which has been developed
by The National Archives of the UK as part of its PRONOM technical registry service. PUIDs
can be expressed as Uniform Resource Identifiers using the info:pronom/namespace.
MIME TYPES
MIME types are widely used in many Internet-related applications. These consist of a
standardised system of identifiers (managed by IANA) consisting of a type and a sub-type,
separated by a slash — for instance, text/html or image/gif. MIME types identify files on
BeOS, AmigaOS 4.0 and MorphOS, as well as store unique application signatures for
application launching. In AmigaOS and MorphOS the Mime type system works in parallel
with Amiga specific Data type system.

120 Computer Application in Management
There are problems with the MIME types as several organisations and people have
created their own MIME types without registering them properly with IANA, which makes
the use of this standard awkward in some cases.
FILE FORMAT IDENTIFIERS (FFIDS)
File format identifiers is another, not widely used way to identify file formats
according to their origin and their file category. It was created for the Description Explorer
suite of software. It is composed of several digits of the form NNNNNNNNN-XX-YYYYYYY. The
first part indicates the organisation origin/maintainer; this number represents a value in a
company/standards organisation database. The next two digits categorize the type of file in
hexadecimal. The final part is composed of the usual file extension of the file or the
international standard number of the file, padded left with zeros. For example, the PNG file
specification has the FFID of 000000001-31-0015948 where 31 indicates an image file,
0015948 is the standard number and 000000001 indicates the ISO Organisation.
FILE CONTENT BASED FORMAT IDENTIFICATION
Another but least popular way to identify the file format is to look at the file contents
for distinguishable patterns among file types. As we know, the file contents are a sequence
of bytes and a byte has 256 unique patterns (0~255). Thus, counting the occurrence of byte
patterns it is often referred to as byte frequency distribution. There are many content-based
file-type-identification schemes that use byte frequency distribution to build the
representative models for file type and use any statistical and data mining techniques to
identify file types
4.3.1 FILE STRUCTURE
There are several types of ways to structure data in a file. The most popular ones are
described below:
UNSTRUCTURED FORMATS (RAW MEMORY DUMPS)
Earlier file formats used raw data formats that consisted of directly dumping the
memory images of one or more structures into the file.
This has several drawbacks. Unless the memory images also have reserved space for
future extensions, extending and improving this type of structured file is very difficult. It also
creates files that might be specific to one platform or programming language (for example, a
structure containing a Pascal string is not recognized as such in C). On the other hand,
developing tools for reading and writing these types of files is very simple.

Computer Application in Management 121
The limitations of the unstructured formats led to the development of other types of
file formats that could be easily extended and compatible at the same time.
CHUNK BASED FORMATS
Electronic Arts and Commodore-Amiga pioneered this file format in 1985, with their
IFF (Interchange File Format) file format. In this kind of file structure, each piece of data is
embedded in a container that contains a signature identifying the data, as well as the length
of the data (for binary encoded files). This type of container is called a "chunk". The
signature is usually called a chunk id, chunk identifier or tag identifier.
With this type of file structure, tools that do not know certain chunk identifiers
simply skip those that they do not understand.
This concept has been taken again and again by RIFF (Microsoft-IBM equivalent of
IFF), PNG, JPEG storage, DER (Distinguished Encoding Rules) encoded streams and files
(which were originally described in CCITT X.409:1984 and therefore predate IFF) and
Structured Data Exchange Format (SDXF). Even XML can be considered a kind of chunk-
based format, since each data element is surrounded by tags, which are similar to chunk
identifiers.
DIRECTORY BASED FORMATS
This is another extensible format, that closely resembles a file system (OLE
Documents are actual file systems), where the file is composed of 'directory entries' that
contain the location of the data within the file itself as well as its signatures (and in certain
cases its type). Good examples of these types of file structures are disk images, OLE
documents and TIFF images.
Study Notes

122 Computer Application in Management
Assessment
1. Differentiate between:
a. Generality And Specifications of file.
b. Internal metadata and External metadata
2. What is file structure?
3. What is Data Hierarchy?
Discussion
Discuss how can you identifying the type of a file. What are Filename extensions.
4.4 Application Portfolio Management
IT Application Portfolio Management (APM) is a practice that has emerged in
medium to large size Information Technology (IT) organisations since the mid 1990s.
Application Portfolio Management attempts to use the lessons of financial portfolio
management to justify and measure the financial benefits of each application in comparison
to the costs of the application's maintenance and operations.
PORTFOLIO
Taking ideas from investment portfolio management, practitioners of APM gather
information about each of the applications used in a business or organisation, including the
cost to build and maintain the application, the business value produced, the quality of the
application, and the expected lifespan. Using this information, the portfolio manager is able
to provide detailed reports on the performance of the IT infrastructure in relation to the cost
to own and the business value delivered.
DEFINITION OF AN APPLICATION
In the field of application portfolio management, the definition of an application is a
critical component. Many service providers offer services specifically tailored to helping an
organisation create their own definition of an application due to the often contentious
results that come from these definitions.

Computer Application in Management 123
• Application software- An executable software component or tightly coupled set of
executable software components (one or more), deployed together, that deliver some or
all of a series of steps needed to create, update, manage, calculate or display
information for a specific business purpose. In order to be counted, each component
must not be a member of another application.
• Software component- An executable set of computer instructions contained in a single
deployment container in such a way that it cannot be broken apart further. Examples
include a Dynamic Link Library, an ASP web page and a command line "EXE" application.
A zip file may contain zero or more software components because it is easy to break
them down further (by unpacking the ZIP archive).
Software application and software component are technical terms used to describe a
specific instance of the class of application software for the purposes of IT portfolio
management.
THE REQUIREMENTS OF A DEFINITION
The definition of an application has the following needs in the context of Application
Portfolio Management:
• It must be simple for business team members to explain, understand and apply.
• It must make sense to development, operations and project management in the IT
groups.
• It must be useful as an input to a complex function whose output is the overall cost of
the portfolio. In other words, there are many factors that lead to the overall cost of an IT
portfolio. The sheer number of applications is one of those factors.
• It must be useful for the members of the Enterprise Architecture team who are
attempting to judge a project with respect to their objectives for portfolio optimization
and simplification.
• It must clearly define the boundaries of an application so that a person working on a
measurable 'portfolio simplification' activity cannot simply redefine the boundaries of
two existing applications in such a way as to call them a single application.
Examples
Often the definition of an application can be a difficult thing to convey clearly. The
section below offers some examples of how to interpret this definition. There are examples

124 Computer Application in Management
of things that are applications, things that are not applications and things that are a
composite of two or more applications.
INCLUSIONS
By this definition, the following are applications:
• A web service endpoint that presents three web services: Invoice Create, Invoice Search
and InvoiceDetailGet
• A service-oriented business application (SOBA) that presents a user interface for creating
invoices, and that turns around and calls the Invoice Create service. (The service itself is
a different application).
• A legacy system composed of a rich client, a server-based middle tier and a database, all
of which are tightly coupled (e.g. changes in one are very likely to trigger changes in
another)
• A website publishing system that pulls data from a database and publishes it to an HTML
format as a sub-site on a public URL
• A database that presents data to a Microsoft Excel workbook that queries the
information for layout and calculations. An Excel spreadsheet that contains a coherent
set of reusable macros that deliver business value. The spreadsheet itself constitutes a
deployment container for the application (like a TAR or CAB file).
• A set of ASP or PHP web pages that work in conjunction with one another to deliver the
experience and logic of a web application. It is entirely possible that a sub-site would
qualify as a separate application under this definition if the coupling is loose.
• A web service end point that no one uses, but that can be rationally understood to
represent one or more useful steps in a business process.
EXCLUSIONS
The following are not applications:
• An HTML website
• A database that contains data but is not part of any series of steps to deliver business
value using that data
• A web service that is structurally incapable of being part of a set of steps that provide
value. For example, a web service, which will only accept data that breaks the schema.

Computer Application in Management 125
• A stand-alone batch script that compares the contents of two databases by making calls
to each and then sends an e-mail to a monitoring alias if data anomalies are noticed
COMPOSITES
The following are many applications:
• A composite SOA application composed of a set of reusable services and a user interface
that leverages those services. There are at least two applications here (the user interface
and one or more service components). Note that each service is not counted as an
application.
• A legacy client-server app that writes to a database to store data, and an excel
spreadsheet that uses macros to read data from the database to present a report. There
are two apps in this example. The database clearly belongs to the legacy app in that was
developed with it, delivered with it and is tightly coupled to it. This is true even if the
legacy system uses the same stored procedures as the Excel spreadsheet.
Study Notes
Assessment
1. Define application.
2. What are the exclusions of an application?

126 Computer Application in Management
Discussion
Discuss what are composites?
4.5 Introduction to Micro DataBase Manager
Micro DB Manager is a database abstraction class written in PHP using object-
oriented technologies.
The class realizes the following functionalities:
• Connecting to the database
• Executing queries
• Converting results to associative array
• Getting selected rows
• Getting affected rows
• Getting last insert id
• Getting the number of executed queries
• Getting the execution time of the queries
• Getting error messages and codes
Study Notes

Computer Application in Management 127
Assessment
What is Micro Data Base Manager?
Discussion
Discuss functions of Micro Data Base Manager.
4.6 Summary
BASICS OF DATA PROCESSING
Data processing means any process that uses a computer program to enter data and
summarise, analyse or otherwise convert data into usable information. The process may be
automated and run on a computer. It involves recording, analysing, sorting, summarising,
calculating, disseminating and storing data.
DATA ANALYSIS
This is a focus on the highly specialized and highly accurate algorithmic derivations
and statistical calculations that are less often observed in the typical general business
environment. In these contexts data analysis packages like DAP, gretl or PSPP are often used.
PROCESSING
Practically all naturally occurring processes can be viewed as examples of data
processing systems where "observable" information in the form of pressure, light, etc. are
converted by human observers into electrical signals in the nervous system as the senses we
recognize as touch, sound, and vision.
ELEMENTS OF DATA PROCESSING
Once data is in digital format, various procedures can be applied on the data to get
useful information. Data processing may involve various processes, including:
• Data acquisition
• Data entry

128 Computer Application in Management
• Data cleaning
• Data coding
• Data transformation
• Data translation
• Data summarization
• Data aggregation
• Data validation
• Data tabulation
• Statistical analysis
• Computer graphics
• Data warehousing
• Data mining
• Data fusion
DATA HIERARCHY AND DATA FILE STRUCTURES
This refers to the systematic organisation of data, often in a hierarchical form. Data
organisation involves fields, records, files and so on.
DATA FILE STRUCTURES
This is a particular way that information is encoded for storage in a computer file. File
formats are divided into proprietary and open formats.
GENERALITY
Some file formats are designed to store only a particular type of data: the JPEG
format, for example, is designed only to store static photographic images.
SPECIFICATIONS
Many file formats, including some of the most well-known file formats, often have a
published specification document (often with a reference implementation) that describes
exactly how the data is to be encoded, and which can be used to determine whether or not
a particular program treats a particular file format correctly.

Computer Application in Management 129
IDENTIFYING THE TYPE OF A FILE
A method is required to determine the format of a particular file within the file
system- an example of metadata.
FILENAME EXTENSION
Many formats still use three-character extensions, even though modern operating
systems and application programs no longer have this limitation. For example, HTML
documents are identified by names that end with .html (or htm) and GIF images by .gif. In
the original FAT file system, filenames were limited to an eight-character identifier and a
three-character extension, which is known as 8.3 filename.
INTERNAL METADATA
A second way to identify a file format is to store information regarding the format
inside the file itself.
FILE HEADER
First, the meta-data contained in a file header are not necessarily stored only at the
beginning of it, but might be present in other areas too, often including the end of the file;
that depends on the file format or the type of data it contains.
MAGIC NUMBER
The magic number approach offers better guarantees that the format will be
identified correctly. It can often determine more precise information about the file.
FILE FORMAT IDENTIFIERS (FFIDS)
It was created for the Description Explorer suite of software. It is composed of
several digits of the form NNNNNNNNN-XX-YYYYYYY. The first part indicates the organisation
origin/maintainer (this number represents a value in a company/standards organisation
database), the next two digits categorize the type of file in hexadecimal. The final part is
composed of the usual file extension of the file or the international standard number of the
file, padded left with zeros.
FILE CONTENT BASED FORMAT IDENTIFICATION
Counting the occurrence of byte patterns is often referred to as byte frequency
distribution. There are many content-based file type identification schemes that use byte
frequency distribution to build the representative models for file type and use any statistical
and data mining techniques to identify file types.

130 Computer Application in Management
FILE STRUCTURE
There are several types of ways to structure data in a file. The most popular ones are
described below:
UNSTRUCTURED FORMATS (RAW MEMORY DUMPS)
Earlier file formats used raw data formats that consisted of directly dumping the
memory images of one or more structures into the file. The limitations of the unstructured
formats led to the development of other types of file formats that could be easily extended
and compatible at the same time.
CHUNK BASED FORMATS
With this type of file structure, tools that do not know certain chunk identifiers
simply skip those that they do not understand.
This concept has been taken again and again by RIFF (Microsoft-IBM equivalent of
IFF), PNG, JPEG storage, DER (Distinguished Encoding Rules) encoded streams and files
(which were originally described in CCITT X.409:1984 and therefore predate IFF) and
Structured Data Exchange Format (SDXF).
DIRECTORY BASED FORMATS
This is another extensible format, that closely resembles a file system (OLE
Documents are actual file systems), where the file is composed of 'directory entries' that
contain the location of the data within the file itself as well as its signatures (and in certain
cases its type).
APPLICATION PORTFOLIO MANAGEMENT
Application Portfolio Management attempts to use the lessons of financial portfolio
management to justify and measure the financial benefits of each application in comparison
to the costs of the application's maintenance and operations.
PORTFOLIO
Taking ideas from investment portfolio management, practitioners of APM gather
information about each of the applications used in a business or organisation, including the
cost to build and maintain the application, the business value produced, the quality of the
application, and the expected lifespan.

Computer Application in Management 131
THE REQUIREMENTS OF A DEFINITION
The definition of an application has the following needs in the context of Application
Portfolio Management:
• It must be simple for business team members to explain, understand and apply.
• It must make sense to development, operations and project management in the IT
groups.
• It must be useful as an input to a complex function whose output is the overall cost of
the portfolio. In other words, many factors lead to the overall cost of an IT portfolio. The
sheer number of applications is one of those factors.
• It must be useful for the members of the Enterprise Architecture team who are
attempting to judge a project with respect to their objectives for portfolio optimization
and simplification.
• It must clearly define the boundaries of an application so that a person working on a
measurable 'portfolio simplification' activity cannot simply redefine the boundaries of
two existing applications in such a way as to call them a single application.
INTRODUCTION TO MICRO DATA BASE MANAGER
Micro DB Manager is a database abstraction class written in PHP using object-
oriented technologies.
The class realizes the following functionalities:
• Connecting to the database
• Executing queries
• Converting results to associative array
• Getting selected rows
• Getting affected rows
• Getting last insert id
• Getting the number of executed queries
• Getting the execution time of the queries
• Getting error messages and codes

132 Computer Application in Management
4.7 Self-Assessment Test
Broad Questions
1. Elaborate the data hierarchy structure in detail.
2. Explain several types of ways to structure data in a file
Short Notes
a. Data Processing and its elements
b. Application Portfolio Development
c. Data analysis
d. Different kinds of file formats
e. Micro data base manager
4.8 Further Reading
1. Automating Managers: The Implications of Information Technology for Managers, John,
Moss Jones, London, Printer, 1990
2. Computers, Concepts and Uses 2nd ed., Summer M., Englewood Cliffs, New Jersey,
Prentice Hall Inc, 1988
3. Foundations of Business Systems, David Van Over, Fort Worth, Dryden 1992
4. Information Systems: Theory and practice 5th ed., Burch, John And Grudniski Gary, New
York., John Wiley, 1989
5. Online Business Computer Applications 2nd Ed, Eliason A. L.,. Chicago Science Research
Associates, 1987

Computer Application in Management 133
Assignment
Discuss the concept of application portfolio management
___________________________________________________________________________
___________________________________________________________________________
___________________________________________________________________________
___________________________________________________________________________
___________________________________________________________________________
___________________________________________________________________________
___________________________________________________________________________
___________________________________________________________________________
___________________________________________________________________________
___________________________________________________________________________
___________________________________________________________________________
___________________________________________________________________________
___________________________________________________________________________
___________________________________________________________________________
___________________________________________________________________________
___________________________________________________________________________
___________________________________________________________________________
___________________________________________________________________________
___________________________________________________________________________
___________________________________________________________________________
___________________________________________________________________________
___________________________________________________________________________

134 Computer Application in Management
___________________________________________________________________________
___________________________________________________________________________
___________________________________________________________________________
___________________________________________________________________________
___________________________________________________________________________
___________________________________________________________________________
___________________________________________________________________________
___________________________________________________________________________
___________________________________________________________________________
___________________________________________________________________________
___________________________________________________________________________
___________________________________________________________________________
___________________________________________________________________________
___________________________________________________________________________
___________________________________________________________________________
___________________________________________________________________________
___________________________________________________________________________
___________________________________________________________________________
___________________________________________________________________________
___________________________________________________________________________
___________________________________________________________________________
___________________________________________________________________________
___________________________________________________________________________
___________________________________________________________________________

Computer Application in Management 135
___________________________________________________________________________
Unit 5 Programming Concepts
Learning Outcome
After reading this unit, you will be able to:
• Work with PowerPoint XP
• Make a basic presentation
• Explain slide views and auto shapes
• List the characteristics of LAN and WAN
• Define data communication networking
Time Required to Complete the unit
1. 1st Reading: It will need 3 Hrs for reading a unit
2. 2nd Reading with understanding: It will need 4 Hrs for reading and understanding a
unit
3. Self Assessment: It will need 3 Hrs for reading and understanding a unit
4. Assignment: It will need 2 Hrs for completing an assignment
5. Revision and Further Reading: It is a continuous process
Content Map
5.1 Introduction
5.2 Use of Tiles in Programming
5.2.1 Basic Programming Concepts
5.3 Presentation Graphics

136 Computer Application in Management
5.4 Creating a presentation on PC
5.4.1 Blank Presentation
5.4.2 Inserting, Copying and Deleting Slides
5.4.3 Working with Slide views
5.4.4 Applying a Design Template
5.4.5 Formatting Text
5.4.6 Adding Clip Art and Pictures
5.4.7 Adding Charts, Diagrams, Tables and AutoShapes
5.4.8 Animating Slides
5.4.9 Adding Transition
5.5 Data Communication Networking
5.5.1 Local Area Network (LAN)
5.5.2 Wide Area Network (WAN)
5.6 Summary
5.7 Self-Assessment Test
5.8 Further Reading

Computer Application in Management 137
5.1 Introduction
The main aim of this unit is the basic understanding of Microsoft PowerPoint
presentation and how a presentation is made. It explains all the detailed steps of making a
PowerPoint presentation. With PowerPoint, you can easily create slide shows for illustrating
your presentations. This unit teaches about the usage of layouts to organize the content on
each slide. PowerPoint has several slide layouts to select from. You can learn the method of
creating slides, making changes to slides, applying a theme and running a slide show.
The following unit explains about the computer networking and LAN & WAN.
5.2 Use of Tiles in Programming
A program is a sequence of commands that a computer executes, in order to perform
some actions; be it the calculation of the number of calories in your lunch or the path, the
space shuttle will follow on its re-entry to Earth from space. The sequence of commands can
be as short as just 1 command or as complex as you can imagine (millions of commands or
more). It is the job of the programmer to create and test the commands that will perform
some predefined task.
A programming language is a language in which you can specify the commands in a
program. Just as there are innumerable ways to say "Hello" in the spoken languages of the
world, there are innumerable ways to make a computer say "Hello", depending on what
programming language you use. Different computer programming languages have
different pros and cons to their use. Some are only available on certain operating systems
(i.e. Visual Basic only works on Microsoft Windows), some are very complex (like C++ or
Java), some are simple (Basic) and some are designed for specific tasks like mathematics
(Fortran). It is partially up to the programmer to choose the appropriate language for his or
her program.
5.2.1 BASIC PROGRAMMING CONCEPTS
Statements: A statement is the simplest concept in a programming language. A
statement is merely a single command to perform a single well-defined task. For example,
"Stop the car", and "leave the house" are single statements describing single well-defined
tasks. Note that even seemingly simple statements can often be broken down into many
simpler statements. "Stop the car" could be broken down in to steps such as "Apply the
brakes"", Downshift"", pull over to the curb" and "Apply the parking brake".
The number of steps you should supply and the level of detail you should use for
describing their performance will be determined in part by the programming language you

138 Computer Application in Management
use. In some languages "Stop the car" may be a single statement, on others, hundreds or
thousands of statements.
Variables: Statements only get you so far without additional concepts. Variables are
perhaps the most ubiquitous entity in any programming language. You can think of a
variable as a box in which you can store something - a number, a date, someone's name, the
price of a sweater, the number of people in your immediate family, the current speed at
which your car is travelling, etc. The beauty of a variable is that you can store information in
it and retrieve information from it any time you want.
Each variable "box" has a name. You refer to the different variables that you are
using by their names. With variables, you can start having more interesting statements and
have the computer perform mathematics.
Logic: One thing that computers do really well is obey the rules of logic. In particular,
they are good at doing calculations and comparisons. For example, "5 is less than 3" is a false
statement and "2 + 2 = 4" is a true statement; these are all straight-forward logical
conclusions. "Yellow is a nice happy colour" is not something that can be determined
logically unless you have already specified what makes a colour "nice and happy".
Performing logical operations, especially when a variable is involved, allows you to
determine the truth or falsity of all kinds of things. This is known as "Boolean logic" as the
result is the 2-valued truth or falsity of the statement.
Conditionals: Since we can determine if comparison is true or false, it would be nice
if we could act on this information. This is where a conditional comes in. Consider the
example of driving. We know that if the stoplight is red then stop the car. This uses a little
logic (is the stoplight red?) for us to determine whether we should stop the car. As you can
imagine, we use these types of rules all the time in everyday life without ever realizing it.
They are used all the time in computer programs too.
Study Notes

Computer Application in Management 139
Assessment
Explain:
a. Statements
b. Variables
c. Logic
d. Conditionals
Discussion
Discuss the use of Tiles in Programming.
5.3 Presentation Graphics
A type of business software that enables users to create highly stylized images for
slide shows and reports. The software includes functions for creating various types of charts
and graphs and for inserting text in a variety of fonts. Most systems enable you to import
data from a spreadsheet application to create the charts and graphs. Presentation graphics
is often called business graphics.
STARTING MICROSOFT POWERPOINT
The PowerPoint screen has many elements.

140 Computer Application in Management
Fig. 5.1: PowerPoint screen
TITLE BAR
The Title bar generally appears at the top of the screen. The Title bar displays the
title of the current presentation.
MENU BAR
The Menu bar displays the menu. You use the menu to give instructions to
PowerPoint.
STANDARD AND FORMATTING TOOLBARS
PowerPoint has several toolbars. Toolbars provide shortcuts to menu commands.
The most commonly used toolbars are the Standard and Formatting toolbars. You use the
Standard toolbar to do such things as open a file; save a file; print a file; check spelling; cut,
copy, and paste; undo and redo; or insert a chart or table. You use the Formatting toolbar to
change the font, font size or font color; bold, underline, or italicize text; left align, right align,
center, or justify; bullet or number lists; highlight; or decrease or increase the indent.
RULERS
Rulers are vertical and horizontal guides. You use them to determine where you want
to place an object. They are marked in inches.

Computer Application in Management 141
PLACEHOLDERS
Placeholders hold the objects in your slide. You use placeholders to hold text, clip art
and charts.
STATUS BAR
The Status bar generally appears at the bottom of the screen. The Status bar displays
the number of the slide that is currently displayed, the total number of slides and the name
of the design template in use or the name of the background.
OUTLINE TAB
The Outline displays the text contained in your presentation.
SLIDES TAB
The Slides tab displays a thumbnail of all your slides. You click the thumbnail to view
the slide in the Slide pane.
VIEW BUTTONS
The view buttons at the left bottom corner of the screen allow three slide views:
Normal View, Slide Sorter View and Slide Show.
The view buttons can be useful as you prepare your presentation. They control the
way slides are displayed on the screen. Click a view button to see a different view.
NORMAL VIEW
Normal view splits your screen into three major sections: Outline and Slides tabs,
Slide pane and Task pane. The Outline and Slides tabs are on the left side of your screen.
They enable you to shift between two different ways of viewing your slides. The Slides tab
shows thumbnails of your slides. The Outline tab shows the text on your slides. The Slide
pane is located in the centre of your screen. The Slide pane shows a large view of the slide
on which you are currently working. The Task pane is located on the right side of your
screen. The Tasks pane enables you to select the task you want to perform.
SLIDE SORTER VIEW
Slide Sorter view enables you to view thumbnails of all your slides. In Slide Sorter
view you can easily add, delete or change the order of your slides. When you are in Slide
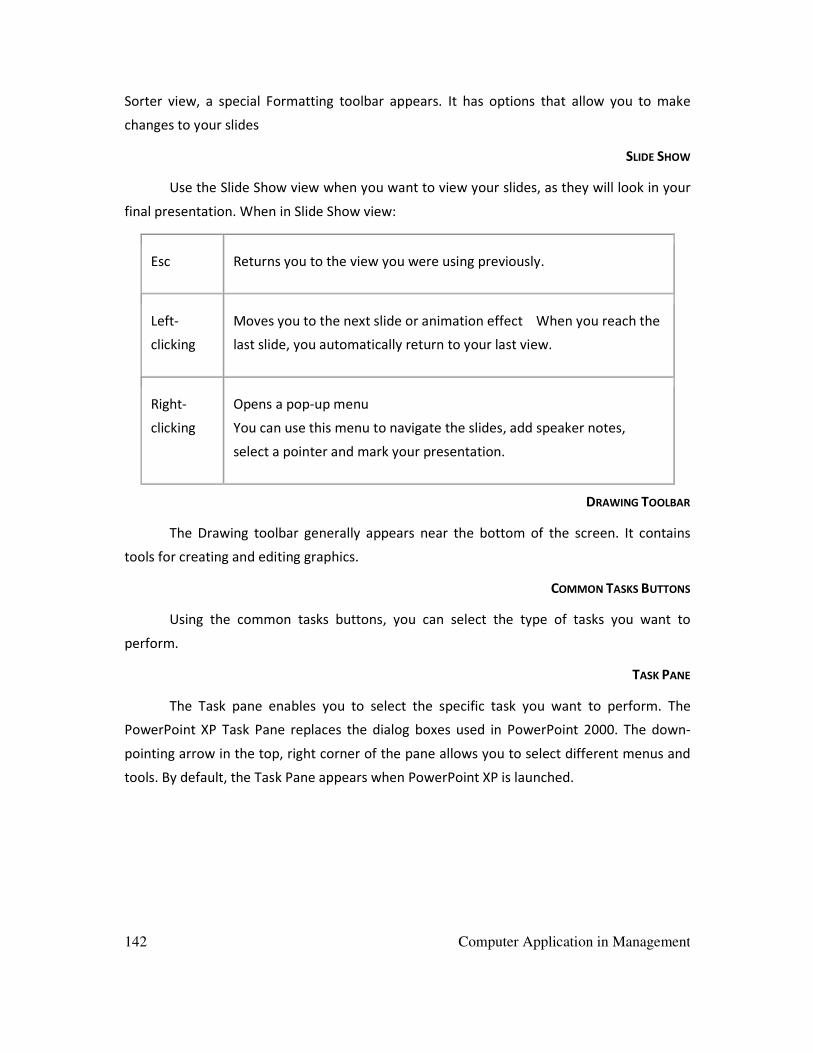
142 Computer Application in Management
Sorter view, a special Formatting toolbar appears. It has options that allow you to make
changes to your slides
SLIDE SHOW
Use the Slide Show view when you want to view your slides, as they will look in your
final presentation. When in Slide Show view:
Esc Returns you to the view you were using previously.
Left-
clicking
Moves you to the next slide or animation effect When you reach the
last slide, you automatically return to your last view.
Right-
clicking
Opens a pop-up menu
You can use this menu to navigate the slides, add speaker notes,
select a pointer and mark your presentation.
DRAWING TOOLBAR
The Drawing toolbar generally appears near the bottom of the screen. It contains
tools for creating and editing graphics.
COMMON TASKS BUTTONS
Using the common tasks buttons, you can select the type of tasks you want to
perform.
TASK PANE
The Task pane enables you to select the specific task you want to perform. The
PowerPoint XP Task Pane replaces the dialog boxes used in PowerPoint 2000. The down-
pointing arrow in the top, right corner of the pane allows you to select different menus and
tools. By default, the Task Pane appears when PowerPoint XP is launched.

Computer Application in Management 143
Fig. 5.2: Task Pane
The Slide Layout and Slide Design panes within the Task Pane help organize layouts,
design templates, and color schemes. When you select a design option, your slides are
quickly updated with the new look.
You can view the Slide Layout and Slide Design panes by clicking on the down-
pointing arrow next to New Presentation in the Task Pane.
Select Slide Layout or Slide Design (Design Templates, Color Schemes, Animation
Schemes).

144 Computer Application in Management
Fig. 5.3: Slide Layout or Slide Design
VERTICAL SPLITTER BAR
You can click and drag the vertical splitter bar to change the size of your panes.
MINIMIZE BUTTON
You use the Minimize button to remove a window from view. While a window is
minimized, its title appears on the taskbar.
MAXIMIZE/RESTORE BUTTON
You use the Maximize button to cause a window to fill the screen. After you
maximize a window, if you click the Restore button, the window returns to its former size.
CLOSE BUTTON
You use the Close button to exit the window and close the program.
Study Notes

Computer Application in Management 145
Assessment
Explain the following:
a. Task Pane
b. View Buttons
c. Placeholders
d. Standard and Formatting Toolbars
Discussion
What is the difference between "Slide Show" and "Slide Sorter View".
5.4 Creating a Presentation on PC
PowerPoint offers three ways to create a presentation: Blank presentation, From
Design Template and From AutoContent Wizard.
5.4.1 BLANK PRESENTATION
The Blank presentation option is one of the most commonly used methods. It offers
several blank slides with layouts for text and graphics.

146 Computer Application in Management
• Open PowerPoint
• A slide featuring a place for a title and subtitle appears by default. You may begin your
presentation with this slide or choose a different slide layout.
• The New Presentation Pane appears on the right side of the screen.
• Under New, click Blank Presentation.
• A list appears.

Computer Application in Management 147
Choosing a Slide Layout
As you work on your presentation, think about the type of layout you want. Do you
want a slide with text and lots of clip art or one with text and a chart? PowerPoint offers
many layout options.
• Move your arrow pointer over the layouts or use the scroll bar in the Slide Layout Pane.
• A gray bar appears on the right of each layout.
• When you find a layout that you like, click the down-pointing arrow and choose Apply to
Selected Slide.
Placeholders
Once you choose a layout for your slides, you can begin adding text, graphics or
other items. You do this with placeholders- specials places within a slide where you can add
content.

148 Computer Application in Management
To Add Text to a Placeholder
• Click on the placeholder.
• Start typing.
Fig. 5.4: Placeholders
Saving a Presentation
You can save, close and exit presentations in PowerPoint, just as you would while
using other Microsoft applications.
• Click on File Save. (Ctrl + S)
• Select the location where you want to save your presentation.

Computer Application in Management 149
• Type a name in the File Name box or keep the one that PowerPoint has provided.
Closing a Presentation and Exiting PowerPoint
Once you have finishing working on your presentation, you can close it.
To Close a Presentation
• Click the X in the PowerPoint presentation window (Ctrl + W).
• The PowerPoint application remains open and you can start a new presentation.
To Exit PowerPoint
• Click the X in the far right top corner.
OR
• Choose File Exit. (Alt + F4)
5.4.2 INSERTING, COPYING AND DELETING SLIDES
OPENING A PRESENTATION
You can quickly open a presentation that you have previously saved by using the Task
Pane.
• Start PowerPoint.
• In the Task Pane under Open a Presentation, click on the presentation that you want to
open.

150 Computer Application in Management
OR
• Select File Open.
• Navigate to the file you want to open
Inserting a New Slide
Once you have created your opening slide, you will want to add more slides to your
presentation.
• Click on Insert New Slide (Ctrl + M).
• Move your arrow pointer over layouts or use the scroll bar and select a slide layout.
• A grey bar appears on the right
• Click the down-pointing arrow and select Insert New Slide.
OR
• Click the New Slide button at the top of the screen

Computer Application in Management 151
• Move your arrow pointer over layouts or use the scroll bar and select a design layout.
• A grey bar appears on the right.
• Click the down-pointing arrow and select Insert New Slide.
COPYING A SLIDE
Copying is another technique that you may use as you work on your slide
presentation. For example, you may want to repeat a slide later in the presentation or copy
a slide and make slight changes to it to make a different point.
• Click the slide you want to copy in the pane on the left.
• Click on the Copy Button on the Standard Toolbar (Ctrl + C).
• Move the arrow pointer to where you want the copied slide to appear.
OR
• Right click the slide you want to copy in the pane on the left.
• Move the arrow pointer to where you want the copied slide to appear.
• A horizontal cursor appears.
• Click the Paste Button on the Standard Toolbar or right click Paste (Ctrl + V).
Fig. 5.5: COPYING A SLIDE
Deleting a Slide
Sometimes you may want to take one or more slides out of your presentation.
• Click the slide.
• Press Delete on your keyboard.

152 Computer Application in Management
OR
• Right click the slide you want to delete in the pane to the left Delete Slide.
Fig. 5.6: Deleting a Slide
5.4.3 WORKING WITH SLIDE VIEWS
SLIDE SORTER VIEW
As you are working on your presentation, you may want to change the order of your
slides. You can rearrange slides in Slide Sorter View. It enables you to view miniature slides
that you can drag and drop.
To Manipulate Slides in Slide Sorter View
• Click on the Slide Sorter View button in the left bottom corner of the page.
• Click the slide you want to move.
• Hold down the left mouse button and drag the slide to its new location. A pointer with a
box appears as you drag the slide.

Computer Application in Management 153
• Click on the Normal View button to return to Normal View.
Working with Slides in Normal View
You can also easily move slides in Normal View. Remember, this is the Tri-Pane View
that shows small slides on the left, a slide in the centre and the Task Pane on the right.
To Move Slides in Normal View
• Click on the Normal View button .
• Click a slide in the left pane, drag, and drop it to its new location.
• Hold down the left mouse button and drag the slide to its new location. A pointer with a
box appears as you drag the slide.

154 Computer Application in Management
To toggle between the different views in PowerPoint XP, click on the View buttons or click
on View Slide Sorter, Normal or Slide Show.
CHANGING AND VIEWING SLIDES IN OUTLINE VIEW
Outline View also allows you to make changes to slides. While you can drag and drop
slides in this view, it's also useful for making changes to the text of your slides or for viewing
multiple slides.
To View or Make Changes to Text in Outline View:
• Click the Outline View tab in the left pane.
• An outline view of your slides appears with text.
• Click on the small grey slide you want to make changes to.
• Scroll through the slides in outline view.
• Select the slide in the outline and then type changes directly onto the center slide.

Computer Application in Management 155
• You can view the text of all of your slides in this view.
• Return to Normal View by clicking the Slides tab in the left pane.
VIEWING SLIDES IN SLIDE SHOW VIEW
After you have made some changes to your PowerPoint presentation, you can get an idea of
how it will look as a slide show.
To View Slides in Slide Show View:
• Click on the Slide Show button at the bottom left corner of the screen.
OR
• Click on View Slide Show.
• Click on each slide until you reach the end of the slide show. (black screen)
• Click to exit and return to Normal View.
5.4.4 APPLYING A DESIGN TEMPLATE
PowerPoint offers Design Templates to make it easy to create an attractive
presentation. These templates come in a variety of colors and styles. You can apply a design
to existing slides or begin a new presentation with a template.
To Begin a New Presentation with a Design Template
• Open PowerPoint.
• In the Task Pane under New, click on From Design Template.
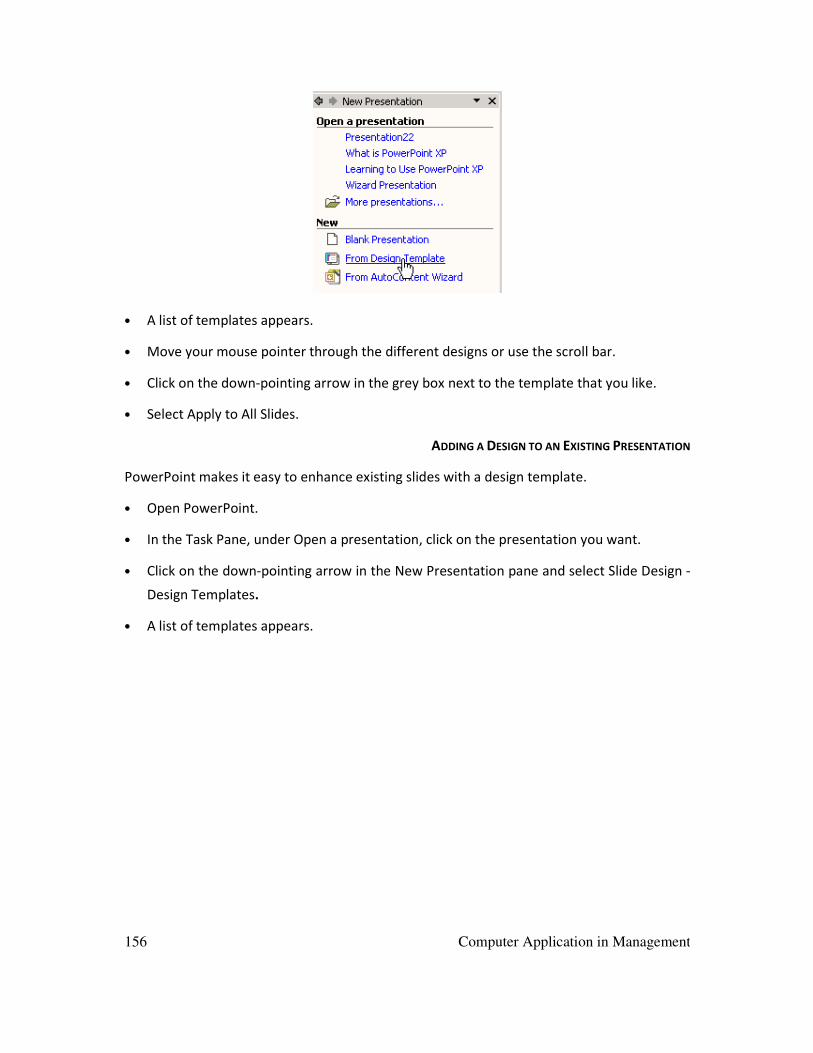
156 Computer Application in Management
• A list of templates appears.
• Move your mouse pointer through the different designs or use the scroll bar.
• Click on the down-pointing arrow in the grey box next to the template that you like.
• Select Apply to All Slides.
ADDING A DESIGN TO AN EXISTING PRESENTATION
PowerPoint makes it easy to enhance existing slides with a design template.
• Open PowerPoint.
• In the Task Pane, under Open a presentation, click on the presentation you want.
• Click on the down-pointing arrow in the New Presentation pane and select Slide Design -
Design Templates.
• A list of templates appears.

Computer Application in Management 157
Fig. 5.7: Design Templates
• Move your mouse pointer through the different designs or use the scroll bar.
• Click on the down-pointing arrow in the grey box next to the template that you like.
• Select Apply to All Slides.
Applying a Design Template to Selected Slides
As you are working on your presentation, you can select Apply to Selected Slides if
you want one or more slides to have a different look.

158 Computer Application in Management
5.4.5 FORMATTING TEXT
ADDING TEXT TO AN ORIGINAL SLIDE
Many of PowerPoint's slides have text boxes already included and ready for you to
add information. However, if you create an original slide you will need to add a text box or
two.
• Insert a blank New Slide.
• Click on the Text Box button in the Drawing Toolbar.
• Click and drag your mouse pointer to create a text box on the slide.
OR
• Click on Insert Text Box.

Computer Application in Management 159
• Click and drag your mouse pointer to create a text box.
THE FORMATTING TOOLBAR
PowerPoint's default font or text type is Arial. However, you may want to change the
font type, font size and more. Use the Formatting Toolbar to set the colour, size, and overall
look of your text. It does not matter whether the text is an original slide or is in a preset
layout.
Here are some of the formatting options:
• Font type
• Font size
• Bold, Italics and Underline
• Center, Align Left and Align Right
• Bullets and Numbering
• Font color
• Increase Font Size
• Decrease Indent
Fig. 5.8: FORMATTING TOOLBAR
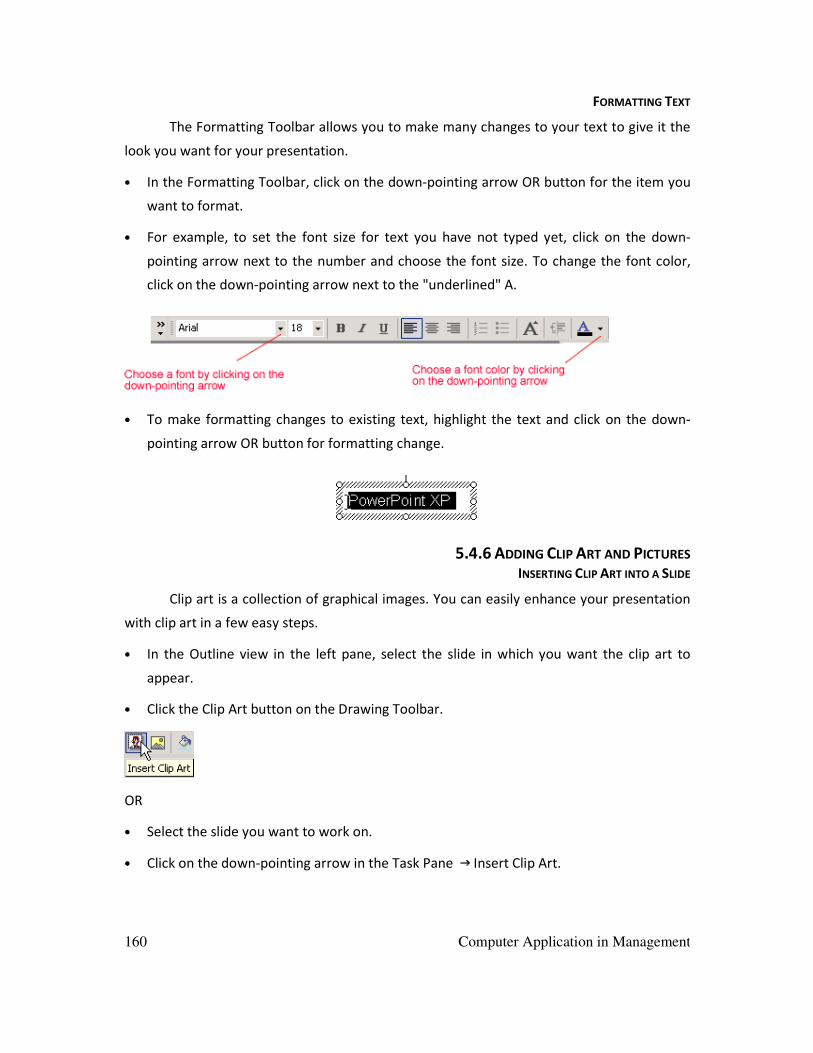
160 Computer Application in Management
FORMATTING TEXT
The Formatting Toolbar allows you to make many changes to your text to give it the
look you want for your presentation.
• In the Formatting Toolbar, click on the down-pointing arrow OR button for the item you
want to format.
• For example, to set the font size for text you have not typed yet, click on the down-
pointing arrow next to the number and choose the font size. To change the font color,
click on the down-pointing arrow next to the "underlined" A.
• To make formatting changes to existing text, highlight the text and click on the down-
pointing arrow OR button for formatting change.
5.4.6 ADDING CLIP ART AND PICTURES INSERTING CLIP ART INTO A SLIDE
Clip art is a collection of graphical images. You can easily enhance your presentation
with clip art in a few easy steps.
• In the Outline view in the left pane, select the slide in which you want the clip art to
appear.
• Click the Clip Art button on the Drawing Toolbar.
OR
• Select the slide you want to work on.
• Click on the down-pointing arrow in the Task Pane Insert Clip Art.

Computer Application in Management 161
INSERTING PICTURES FROM FILE
Complementing your presentation with a few pictures may also help engage the
audience's attention. Click on Insert Picture From File.
• Navigate to the folder where you've saved your picture.
• Click on the picture you want to insert into the slide.
OR
• Click the Insert Picture button on the Drawing Toolbar.
• Navigate to the picture that you want to use.
• Select the picture and click Insert.
Inserting Pictures or Clip Art Using a Slide Design Layout
Some slide layouts already have icons for clip art and pictures. PowerPoint allows you
to insert pictures though these slide design layouts.
To Insert Pictures Using a Slide Design Layout:
• Browse the slide design layouts to find one with an icon for a picture.
• Click on the picture icon.

162 Computer Application in Management
• Navigate to the picture you want to insert.
• Select the picture and click Insert.
RESIZING PICTURES AND CLIP ART
Once you insert clip art or a picture, you may need to resize it to fit your slide better.
• Click the cursor the edge of the graphic and a resizing handle appears. A resizing handle
is a black, double-headed arrow that changes to a "plus sign", + ,once you start resizing
the image:
• Drag the graphic to the size that you want.
5.4.7 ADDING CHARTS, DIAGRAMS, TABLES AND AUTO SHAPES
INSERTING A CHART
PowerPoint allows you to insert charts into your slide presentation to display
different types of information to your audience.
• Insert a new slide with a title and a chart icon.
• When the slide appears, click the Insert Chart icon.

Computer Application in Management 163
• A chart appears with a data sheet and sample data.
• Replace the sample data in the data sheet with actual data that you want to present. The
Y-axis is for values or numbers. For example, number of hours worked or amount of
money earned. The X-axis is the label for the information. It now reads East, West and
North.
• You can delete some information in columns or rows of the sheet. Right click on the row
or column and choose Cut, Delete or Clear Contents.
NOTE: You can expand the chart columns to fit your data or titles. Place your mouse
pointer over the end of the column in the grey heading. A black cross with double arrows
appears. Right click and drag the columns to the size you want.
• To format column width, click on Format Column width.

164 Computer Application in Management
• Notice that as you enter the new data and titles etc., the chart on the slide changes to
show this new information.
If the datasheet disappears, double click on the chart and select View Datasheet.
INSERTING A DIAGRAM OR ORGANIZATION CHART
An organisation chart shows hierarchal relationships in a company or organization
such as president, vice president etc. Diagrams are used to show relationships between
various elements.
• Insert a new slide with a Diagram or Organization Chart icon.
• Click on the Insert Diagram or Organization Chart icon.
• When the Diagram Gallery dialog box appears, select a diagram or chart type.

Computer Application in Management 165
• Click OK.
OR
• If working in a blank slide, click the Insert Diagram or Organisation Chart button on the
Drawing Toolbar.
INSERTING A TABLE
PowerPoint also gives you the option of displaying information within your
presentation in a table.
• Insert a new slide with a table icon.
• Click on the Insert Table icon.
• When the dialog box appears, set the number of columns and rows for your table.
• Click OK.
• Enter the data for your table.
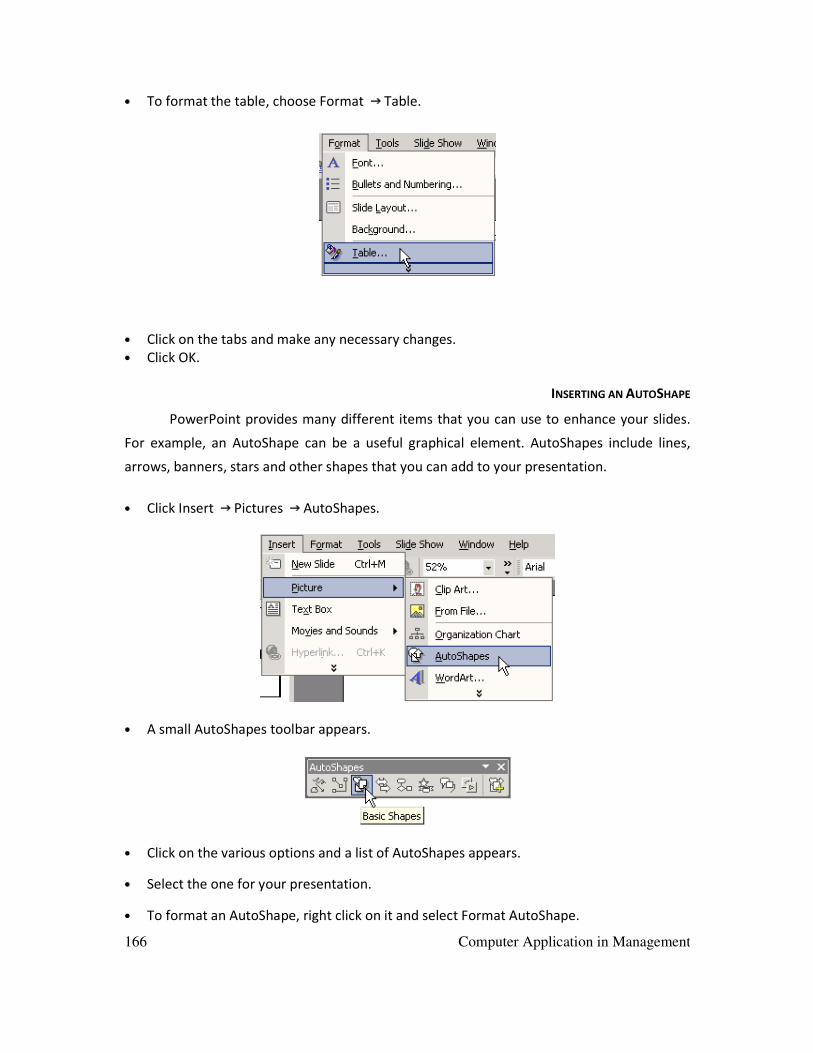
166 Computer Application in Management
• To format the table, choose Format Table.
• Click on the tabs and make any necessary changes.
• Click OK.
INSERTING AN AUTOSHAPE
PowerPoint provides many different items that you can use to enhance your slides.
For example, an AutoShape can be a useful graphical element. AutoShapes include lines,
arrows, banners, stars and other shapes that you can add to your presentation.
• Click Insert Pictures AutoShapes.
• A small AutoShapes toolbar appears.
• Click on the various options and a list of AutoShapes appears.
• Select the one for your presentation.
• To format an AutoShape, right click on it and select Format AutoShape.

Computer Application in Management 167
• A dialog box appears with various formatting options.
OR
• Insert AutoShapes by clicking on the Drawing Toolbar at the bottom of the PowerPoint
screen. A list of options appears.
You can click and drag an AutoShape to increase its size and you can add text by
selecting Insert Text Box.
5.4.8 ANIMATING SLIDES
ANIMATING SLIDES
Animating slides involves adding movement and sometimes sound to text or to the
slides in a presentation. Animation can help create a livelier and more interesting slide show.
PowerPoint provides some preset animation or allows you to customize the animation to fit
your needs.
To Animate Slides using Animation Schemes:
• Open the PowerPoint presentation that you want to work on.
• Select the slide that you want to animate.
• In the Task Pane, click the down-pointing arrow next to New Presentation Slide Design
Animation Schemes.

168 Computer Application in Management
5.4.9 ADDING TRANSITION Adding Transition
Once you have completed all of your slides, create a cohesive presentation by adding
transition. You can move from slide to slide with interesting transitions that affect the
timing, entrance and exit of your slides. A transition is an effect that is applied to some or all
of the slides in a presentation.
To Make Transitions from Slide to Slide:
• Click on Slide Show Slide Transition.
OR
• In the Task Pane, click on the down-pointing arrow next to New Presentation, Slide
Transition.

Computer Application in Management 169
• In the Slide Transition pane, select the effect you want from the drop-down menu. Ex.
Blinds Horizontal, Blinds Vertical, Box In and Box Out.
• Automatically preview each transition by clicking on it. (Auto Preview has to be
selected).
• Click Apply to All when you have chosen an effect.
• Select to proceed from slide to slide on mouse click or automatically after the number
of seconds that you select.
• To see how your transition works, preview the slide show.
PREVIEWING A SLIDE SHOW
If you want to get an idea of what your completed task would look like to an
audience, preview it. PowerPoint allows you to view your show in slide show format.
• Click on View Slide Show. (F5)
OR
• Click on Slide Show View Show.

170 Computer Application in Management
OR
• Click on the Slide Show button to start the presentation.
• To move to the next slide, click the mouse. (Space bar or Enter).
• When the screen goes dark, click the screen to return to the PowerPoint screen.
• You can exit the slide show by pressing ESC on the keyboard at any time.
If you have set the slides to advance mechanically, you don't need to click through
the slides. Just sit back and enjoy the show. At the end of the show, click the left mouse
button to return to the PowerPoint Screen.
SETTING UP A SLIDE SHOW
Once you have added, created a presentation and previewed it, set up a show. Take
the necessary steps to make sure your slides are ready for a real audience.
• Click on Slide Show Set Up Show.
• The Set Up Show dialog box appears.
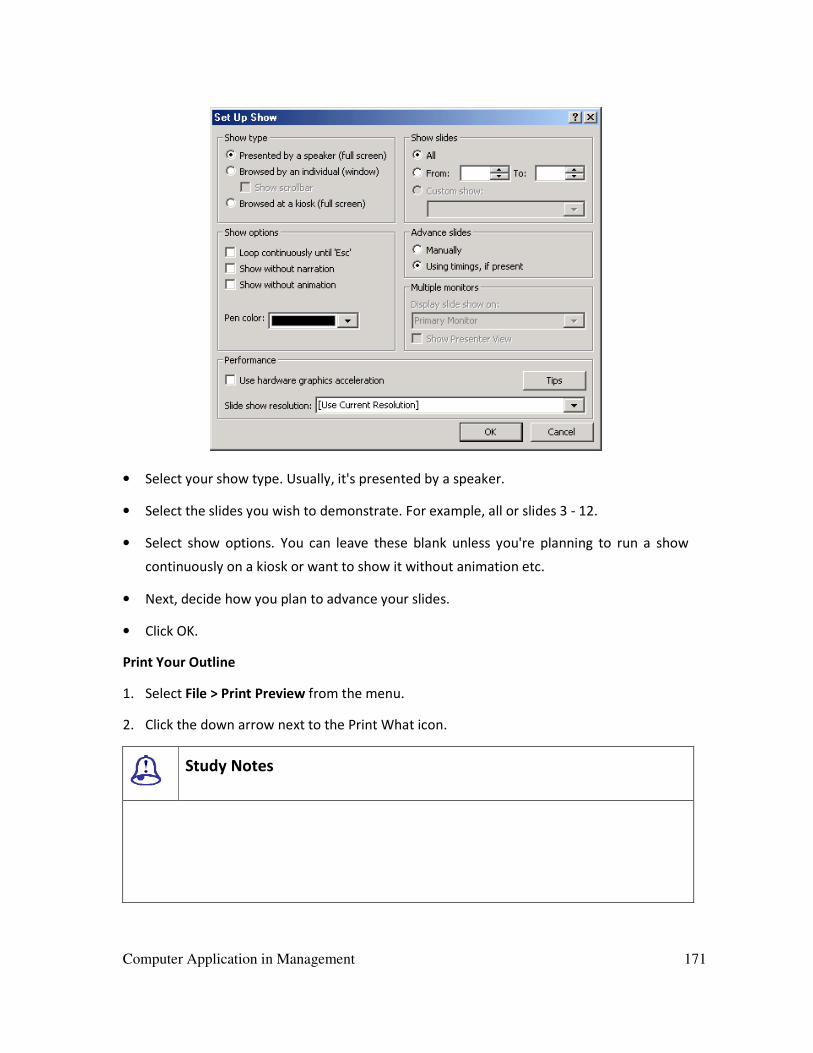
Computer Application in Management 171
• Select your show type. Usually, it's presented by a speaker.
• Select the slides you wish to demonstrate. For example, all or slides 3 - 12.
• Select show options. You can leave these blank unless you're planning to run a show
continuously on a kiosk or want to show it without animation etc.
• Next, decide how you plan to advance your slides.
• Click OK.
Print Your Outline
1. Select File > Print Preview from the menu.
2. Click the down arrow next to the Print What icon.
Study Notes

172 Computer Application in Management
Assessment
Write the process for the following:
a. Inserting a New Slide
b. Applying a Design Template
c. Viewing Slides in Slide Show View
d. Closing a Presentation and Exiting PowerPoint
e. To Add Text to a Placeholder
f. Deleting a Slide
g. Adding Text to an Original Slide
h. Inserting a Chart
i. Adding Transition
j. Inserting Clip Art into a Slide
Discussion
Prepare a presentation on the topic "Basics of Computers".
5.5 Data Communication Networking
A computer network, often simply referred to as a network, is a collection of
computers and devices connected by communications channels that facilitate
communication and sharing of resources among users. Networks may be classified according
to a wide variety of characteristics.
5.5.1 LOCAL AREA NETWORK (LAN)
A Local Area Network (LAN) is a combination of programs and equipment that
connect a number of personal computers. It is by far the most common type of data
network. As the name suggests, a LAN serves a local area and supplies networking capability

Computer Application in Management 173
to a group of computers in close proximity to each other such as in an office building, a
school or a home.
Typical installations are in industrial plants, office buildings, college or university
campuses or similar locations. In these locations, it is feasible for the owning organisation to
install high quality, high-speed communication links interconnecting nodes. Typical data
transmission speeds are one to 100 megabits per second.
A LAN is useful for sharing resources like files, printers, games or other applications.
A LAN, in turn, often connects to other LANs and to the Internet or other WAN.
Fig. 5.9: Local area network
Specialised operating system software may be used to configure a local area
network.
Examples:
The most common type of local area network is an Ethernet LAN. The smallest home
LAN can have precisely two computers; a large LAN can accommodate many thousands of
computers. Many LANs are divided into logical groups called subnets. An Internet Protocol
(IP) "Class A" LAN can, in theory, accommodate more than 16 million devices organised into
subnets.

174 Computer Application in Management
Unfortunately, the networking software and operating systems used with the PC,
LANs were quite different from the networking software used on midrange and mainframe
computers and office automation equipment (for example, dedicated word processing
machines and intelligent copiers). This, of course, set up the predictable and inevitable
conflict between PCs, office automation equipment and the larger midrange and mainframe
computers.
LAN TOPOLOGIES
Whether the purpose of the LAN is to interconnect PCs, minicomputers, or both is
almost extraneous; the first issue is often selecting the topology of the LAN. This choice
dictates the cable, cabling methodology and the networking software that can operate on
the LAN. The three basic topologies are the ring, the star and the bus.
• Ring: As its name suggests, a ring LAN joins a set of attachment units together via a
series of point-to-point connections between each unit. Each attachment unit, in turn,
interfaces to one or more computers or computing devices. Information flows from
attachment unit to attachment unit in a single direction, thus forming a ring network.
Because each PC in a ring network acts as a repeater, performance degrades with each
additional PC. Consequently, this is on average appropriate only in small networks.
• Star: In a star LAN, each computer or computer-related device is connected on a point-
to-point link to a central device called a Hub. The hub acts as the LAN traffic manager,
setting up communication paths between two devices seeking to exchange information.
This configuration makes it very easy to isolate problem nodes, and is one of the most
common LAN models.
• Bus: The simplest form of bus LAN is a set of computers or devices connected to a
common, linear connection. Under the bus topology, information is transmitted over the
distance of the network. As a result, each computer can pick up its intended information.
Links from the main bus line might break off into additional linear links with multiple
attachments; this type of bus structure is also referred to as a tree because multiple
branches reach out from the main trunk. This model is used in high-speed PBXs.

Computer Application in Management 175
Star and ring network topologies are sometimes combined into one network to
provide a higher degree of fault tolerance. Because a star network is susceptible to a failure
in the hub and a ring network is sensitive to a break in the ring, combining both forms offer
an alternate route in case one topology fails.

176 Computer Application in Management
5.5.2 WIDE AREA NETWORK (WAN)
A Wide Area Network (WAN) is a collection of LANs
Fig. 5.10: Wide Area Network
A WAN spans a large geographic area, such as a state, a province or a country. WANs
often connect multiple smaller networks, such as local area networks (LANs) or metro area
networks (MANs). World's most popular WAN is the Internet. Some segments of the
Internet, like VPN-based extranets, are also WANs in themselves. Finally, many WANs are
corporate or research networks that utilize leased lines. WANs generally utilize different and
a good deal of expensive networking equipment than do LANs. Key technologies often found
in WANs include SONET, Frame Relay and ATM.
• Wide Area Network (WAN) is a computer network that covers a broad area (i.e. any
network, whose communications links cross metropolitan, regional, or national
boundaries). This is in contrast with personal area networks (PANs), local area networks
(LANs), campus area networks (CANs) or metropolitan area networks (MANs), which are
usually limited to a room, building, campus or specific metropolitan area (e.g. a city)
respectively.
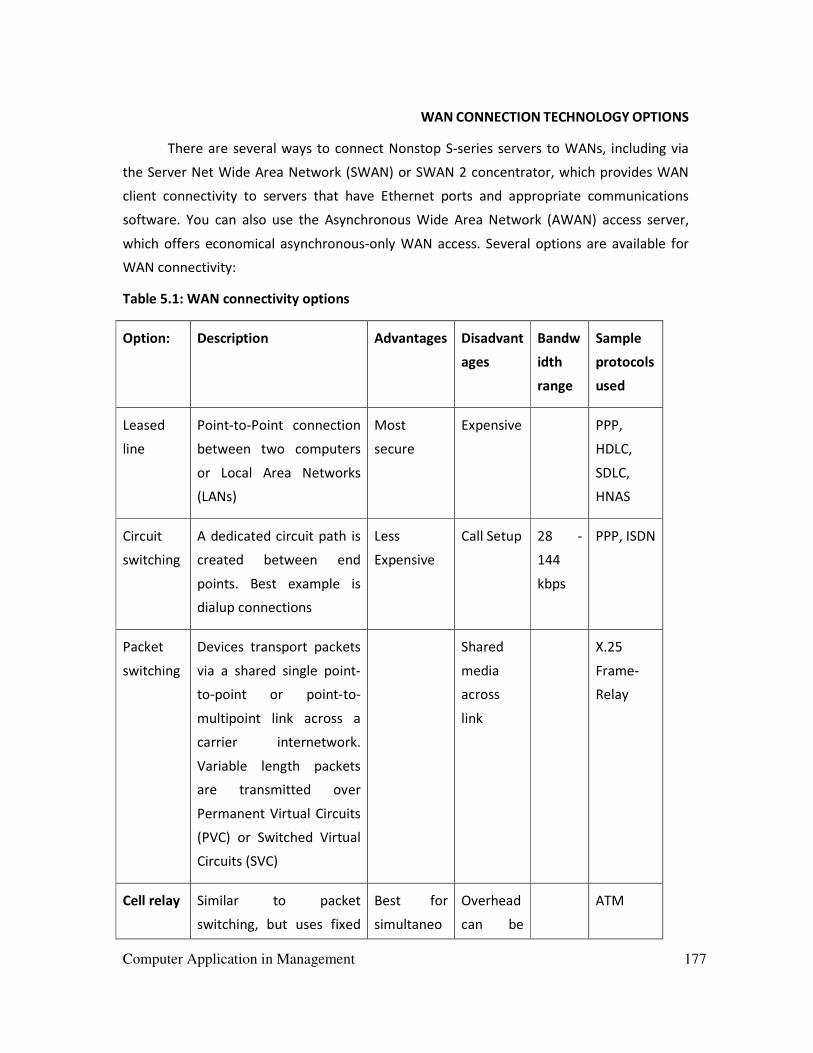
Computer Application in Management 177
WAN CONNECTION TECHNOLOGY OPTIONS
There are several ways to connect Nonstop S-series servers to WANs, including via
the Server Net Wide Area Network (SWAN) or SWAN 2 concentrator, which provides WAN
client connectivity to servers that have Ethernet ports and appropriate communications
software. You can also use the Asynchronous Wide Area Network (AWAN) access server,
which offers economical asynchronous-only WAN access. Several options are available for
WAN connectivity:
Table 5.1: WAN connectivity options
Option: Description Advantages Disadvant
ages
Bandw
idth
range
Sample
protocols
used
Leased
line
Point-to-Point connection
between two computers
or Local Area Networks
(LANs)
Most
secure
Expensive PPP,
HDLC,
SDLC,
HNAS
Circuit
switching
A dedicated circuit path is
created between end
points. Best example is
dialup connections
Less
Expensive
Call Setup 28 -
144
kbps
PPP, ISDN
Packet
switching
Devices transport packets
via a shared single point-
to-point or point-to-
multipoint link across a
carrier internetwork.
Variable length packets
are transmitted over
Permanent Virtual Circuits
(PVC) or Switched Virtual
Circuits (SVC)
Shared
media
across
link
X.25
Frame-
Relay
Cell relay Similar to packet
switching, but uses fixed
Best for
simultaneo
Overhead
can be
ATM

178 Computer Application in Management
length cells instead of
variable length packets.
Data is divided into fixed-
length cells and then
transported across virtual
circuits
us use of
voice and
data
considera
ble
Transmission rates usually range from 1200 bps to 24 Mbps, although some
connections such as ATM and Leased lines can reach speeds greater than 156 Mbps. Typical
communication links used in WANs are telephone lines, microwave links and satellite
channels.
Recently with the proliferation of low cost of Internet connectivity, many companies
and organisations have turned to VPN to interconnect their networks, creating a WAN in
that way. Companies such as Cisco, New Edge Networks and Check Point offer solutions to
create VPN networks.
Study Notes
Assessment
1. What is LAN?
2. What is WAN?

Computer Application in Management 179
Discussion
Discuss LAN Topologies.
5.6 Summary
INTRODUCTION
Microsoft PowerPoint is a widely used utility to create presentations relating to
products, organisation, research papers etc. This is effective software, which provides
techniques for designing dynamic presentations.
Microsoft PowerPoint is a powerful tool to create professional presentations and
slide shows. PowerPoint allows you to construct presentations from scratch or by using the
easy to use wizard.
USE OF TILES IN PROGRAMMING
A program is a sequence of commands that a computer executes in order to perform
some actions. A programming language is a language in which you can specify the
commands in a program.
BASIC PROGRAMMING CONCEPTS
Statements: A statement is the simplest concept in a programming language. A
statement is merely a single command to perform a single well-defined task.
Variables: The beauty of a variable is that you can store information in it and retrieve
information from it any time you want.
Logic: One thing that computers do really well is obey the rules of logic. In particular,
they are good at doing calculations and comparisons.
Conditionals: Well, since we can determine if comparison is true or false, it would be
nice if we could act on this information. This is where a conditional comes in.
PRESENTATION GRAPHICS
A type of business software that enables users to create highly stylized images for
slide shows and reports. The software includes functions for creating various types of charts
and graphs and for inserting text in a variety of fonts. Most systems enable you to import

180 Computer Application in Management
data from a spreadsheet application to create the charts and graphs. Presentation graphics
is often called business graphics.
CREATING A PRESENTATION ON A PC
PowerPoint offers three ways to create a presentation: Blank presentation, From
Design Template or From AutoContent Wizard.
DATA COMMUNICATION NETWORKING
A computer network, often simply referred to as a network, is a collection of
computers and devices connected by communications channels that facilitate
communication and sharing of resources among users.
LOCAL AREA NETWORK (LAN)
A Local Area Network (LAN) is a combination of programs and equipment that
connect a number of personal computers. It is by far the most common type of data
network. A LAN is useful for sharing resources like files, printers, games or other
applications. A LAN, in turn, often connects to other LANs and to the Internet or other WAN.
LAN TOPOLOGIES
Whether the purpose of the LAN is to interconnect PCs, minicomputers, or both is
almost irrelevant; the first issue is often about selecting the topology of the LAN. This choice
dictates the cable, cabling methodology and the networking software that can operate on
the LAN. The three basic topologies are ring, star and bus.
WIDE AREA NETWORK (WAN)
A Wide Area Network (WAN) is a collection of LANs. A WAN spans a large geographic
area, such as a state, a province or a country. WANs often connect multiple smaller
networks, such as local area networks (LANs) or metro area networks (MANs). The world's
most popular WAN is the Internet.
5.7 Self-Assessment Test
Broad Questions
1. Explain the difference between LAN and WAN
2. Discuss about Presentation Graphics
Computer Application in Management 181
Short Notes
a. Uses of PowerPoint
b. Slide Layouts
c. Adding slides
d. Creating a presentation
e. Programming Concepts
5.8 Further Reading
1. Automating Managers: The Implications of Information Technology for Managers, John,
Moss Jones, London, Printer, 1990
2. Computers, Concepts and Uses 2nd ed., Summer M., Englewood Cliffs, New Jersey,
Prentice Hall Inc, 1988
3. Foundations of Business Systems, David Van Over, Fort Worth, Dryden 1992
4. Information systems: Theory and practice 5th ed., Burch, John and Grudniski Gary, New
York., John Wiley, 1989
5. Online Business Computer Applications 2nd Ed, Eliason A. L.,. Chicago Science Research
Associates, 1987

182 Computer Application in Management
Assignment
Create a Power Point presentation of at least 18-20 slides to show the use of Computers in
various fields of Management.
___________________________________________________________________________
___________________________________________________________________________
___________________________________________________________________________
___________________________________________________________________________
___________________________________________________________________________
___________________________________________________________________________
___________________________________________________________________________
___________________________________________________________________________
___________________________________________________________________________
___________________________________________________________________________
___________________________________________________________________________
___________________________________________________________________________
___________________________________________________________________________
___________________________________________________________________________
___________________________________________________________________________
___________________________________________________________________________
___________________________________________________________________________
___________________________________________________________________________
___________________________________________________________________________
___________________________________________________________________________
___________________________________________________________________________
___________________________________________________________________________

Computer Application in Management 183
Glossary
BIOS: Basic Input/output system: The BIOS of a PC software is built into the PC and is the
first code run by a PC when powered on.
Bus: In computer architecture, a bus is a subsystem that
transfers data between computer components inside a
computer or between computers.
Encapsulation: This term is often used interchangeably with
information hiding. A common use of information
hiding is to hide the physical storage layout for data so
that if it is changed, the change is restricted to a small
subset of the total program.
GUI: Graphical User Interface: It is a type of user interface that allows users to interact
with programs by offering graphical icons.
Inheritance: It is a way to compartmentalise and reuse code by
creating collections of attributes and behaviours called
objects, which can be based on previously created
objects.
Macintosh: A series of several lines of personal computers
designed, developed and marketed by Apple Inc.
Peripherals: A device attached to host computer, but not a part of it
and is more or less dependent on the host.
Polymorphism: It is the ability of one type A to appear as and be used
like another type B. The ability of referring a particular
data type in more than one form is Polymorphism.
RAID: Redundant array of inexpensive disks.
SCSI: Small Computer System Interface. It is a set of
standards for physically connecting and transferring
data between computers and peripheral devices.