unique full-scale bollard pull test of large dp vessel ... · – bollard pull requirement was 30...
TRANSCRIPT
DYNAMIC POSITIONING CONFERENCEOCTOBER 9‐11, 2017
DESIGN/OPERATIONS
Unique full-scale bollard pull test of large DP vessel newbuilding with six Azipod® CZ thrusters
Ole Jacob Irgens & Kimmo KokkilaABB OY
DP CONFERENCE | OCTOBER 10, 2017
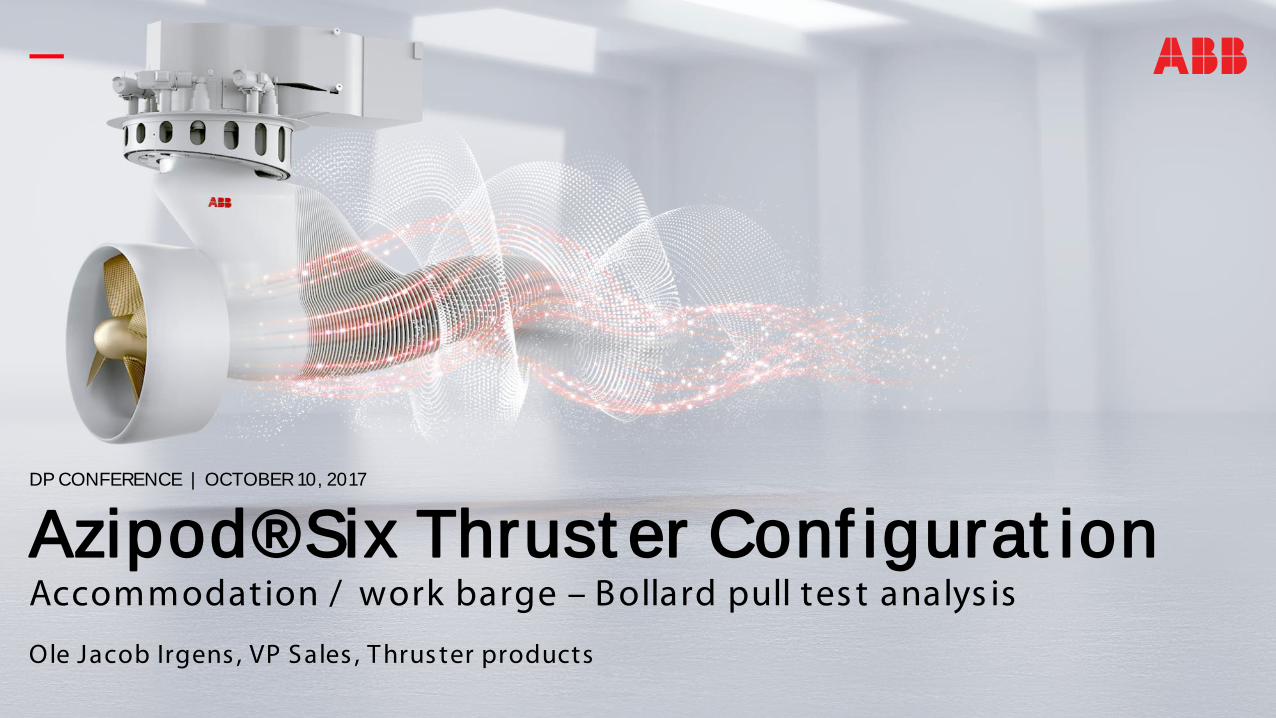
Azipod® Six Thrust er Conf igurat ionAccommodation / work barge – Bollard pull tes t analys is
Ole Jacob Irgens , VP Sales , T hrus ter products
Int roduct ionCFD Analys is and Cavitation T unnel T es t
Bollard Pull T es t in China
Bollard Pull T es t Res ults and Ref lections
Conclus ions
October 16, 20 17 S lide 2
Agenda

—Int roduct ion
Int roduct ion
Oct ober 16, 2017 Slide 4
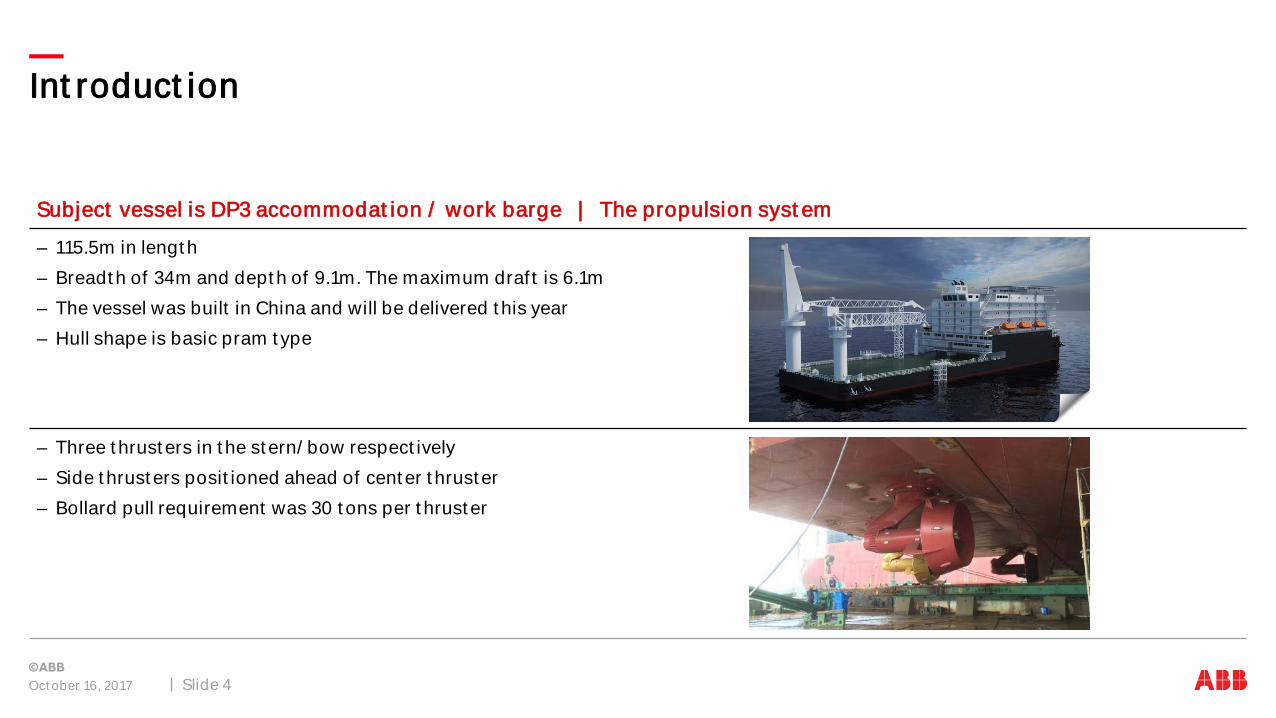
– 115.5m in lengt h– Breadt h of 34m and dept h of 9.1m. The maximum draf t is 6.1m – The vessel was built in China and will be delivered t his year – Hull shape is basic pram t ype
– Three t hrust ers in t he st ern/ bow respect ively– Side t hrust ers posit ioned ahead of cent er t hrust er – Bollard pull requirement was 30 t ons per t hrust er
Subject vessel is DP3 accommodat ion / work barge | The propulsion syst em
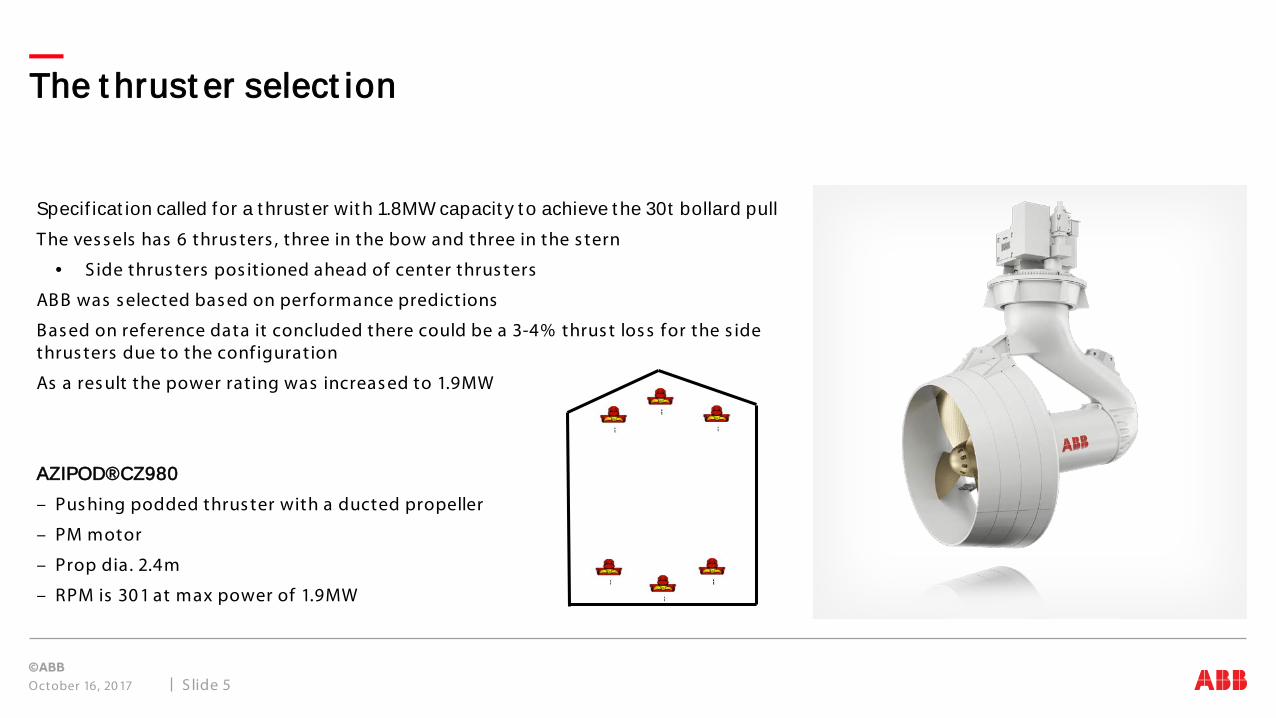
Specif icat ion called for a t hrust er wit h 1.8MW capacit y t o achieve t he 30t bollard pullT he ves s els has 6 thrus ters , three in the bow and three in the s tern
• Side thrus ters pos it ioned ahead of center thrus ters
ABB was s elected bas ed on performance predictions
Bas ed on reference data it concluded there could be a 3-4% thrus t los s for the s ide thrus ters due to the conf iguration
As a res ult the power rating was increas ed to 1.9MW
AZIPOD® CZ980– Pus hing podded thrus ter with a ducted propeller
– PM motor
– Prop dia. 2.4m
– RPM is 30 1 at max power of 1.9MW
October 16, 20 17 S lide 5
The t hrust er select ion
—CFD Analysis and Cavit at ion Tunnel Test

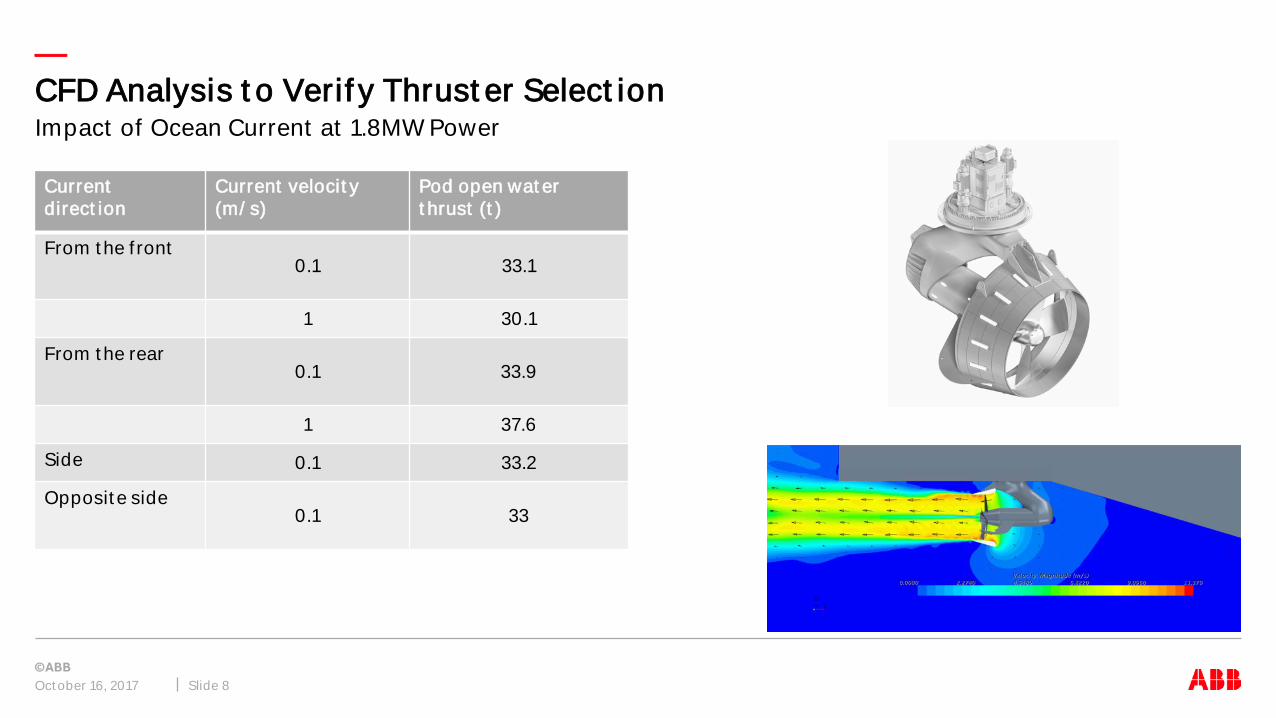
1.8MW was used for t he CFD analysisCFD Analysis t o Verif y Thrust er Select ion
October 16, 20 17 S lide 7
T he corres ponding BP thrus t for s ide thrus ters at 1.9MW would be ~ 34.5 tonnes .
With the hull related thrus t deduction the thrus t would then be ~ 33.4 tonnes .
Based on reference dat a
CZ980 Thrust ers at 1.8 MW Thrust (t )BP condit ion pod thrus t 33.4
Hull related thrus t deduction at BP condit ion 0 .96
Ves s el BP w/ thrus t deduction 32.5
—
Current direct ion
Current velocit y (m/ s)
Pod open wat er t hrust (t )
From t he f ront0.1 33.1
1 30.1
From t he rear0.1 33.9
1 37.6
Side 0.1 33.2
Opposit e side0.1 33
CFD Analysis t o Verif y Thrust er Select ion
Oct ober 16, 2017 Slide 8
Impact of Ocean Current at 1.8MW Power
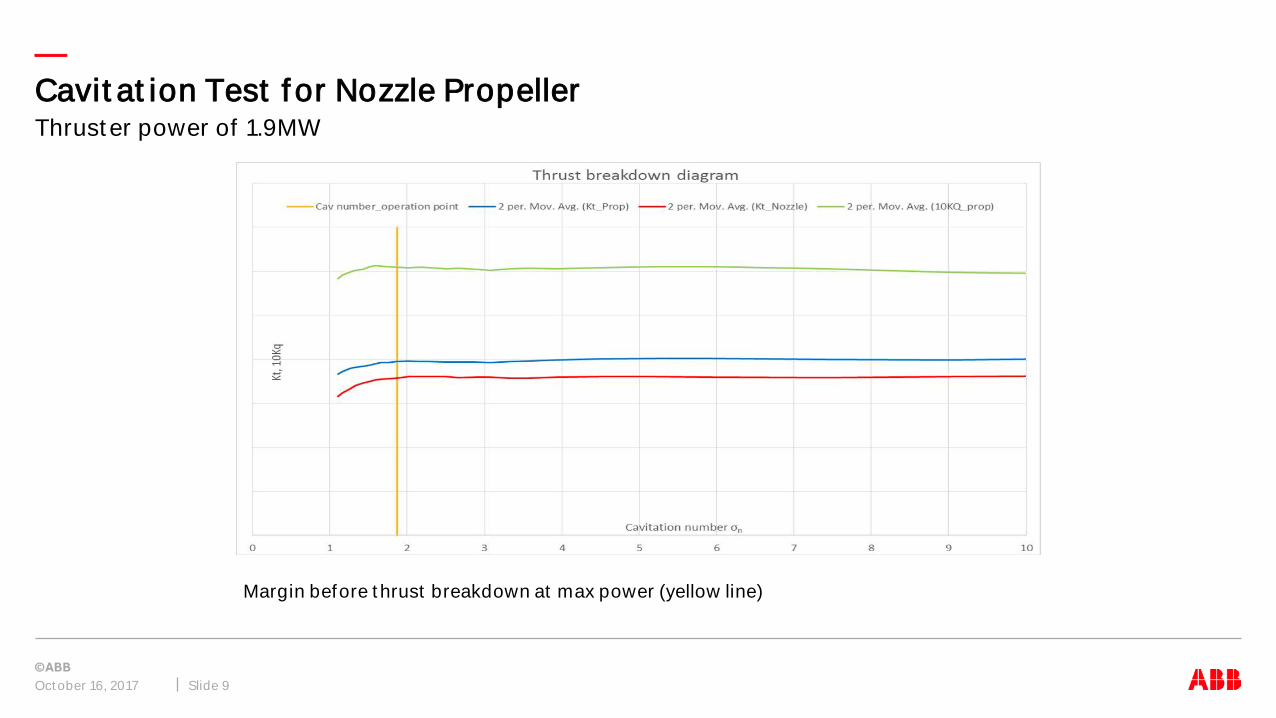
—Cavit at ion Test f or Nozzle Propeller
Oct ober 16, 2017 Slide 9
Thrust er power of 1.9MW
Margin before t hrust breakdown at max power (yellow line)

—Bollard Pull Test in China
—
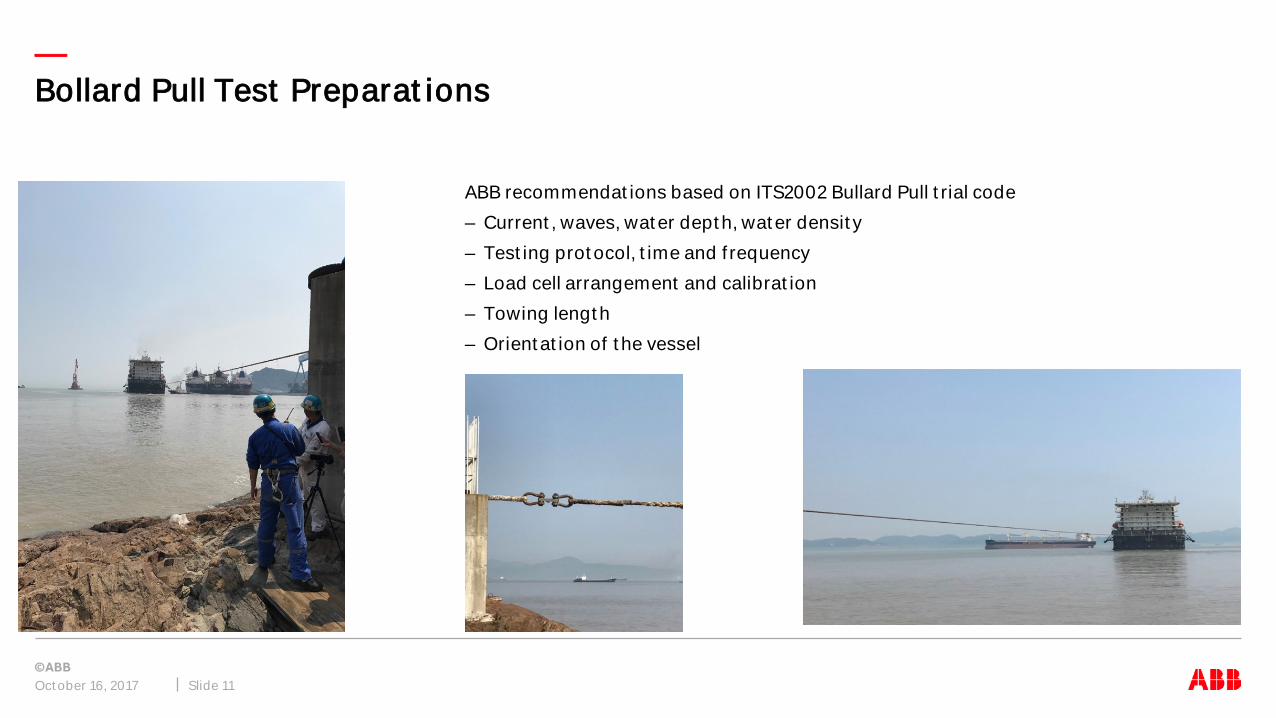
ABB recommendat ions based on ITS2002 Bullard Pull t rial code – Current , waves, wat er dept h, wat er densit y – Test ing prot ocol, t ime and f requency– Load cell arrangement and calibrat ion– Towing lengt h– Orient at ion of t he vessel
Bollard Pull Test Preparat ions
Oct ober 16, 2017 Slide 11
—Bollard Pull Test Condit ions
Oct ober 16, 2017 Slide 12
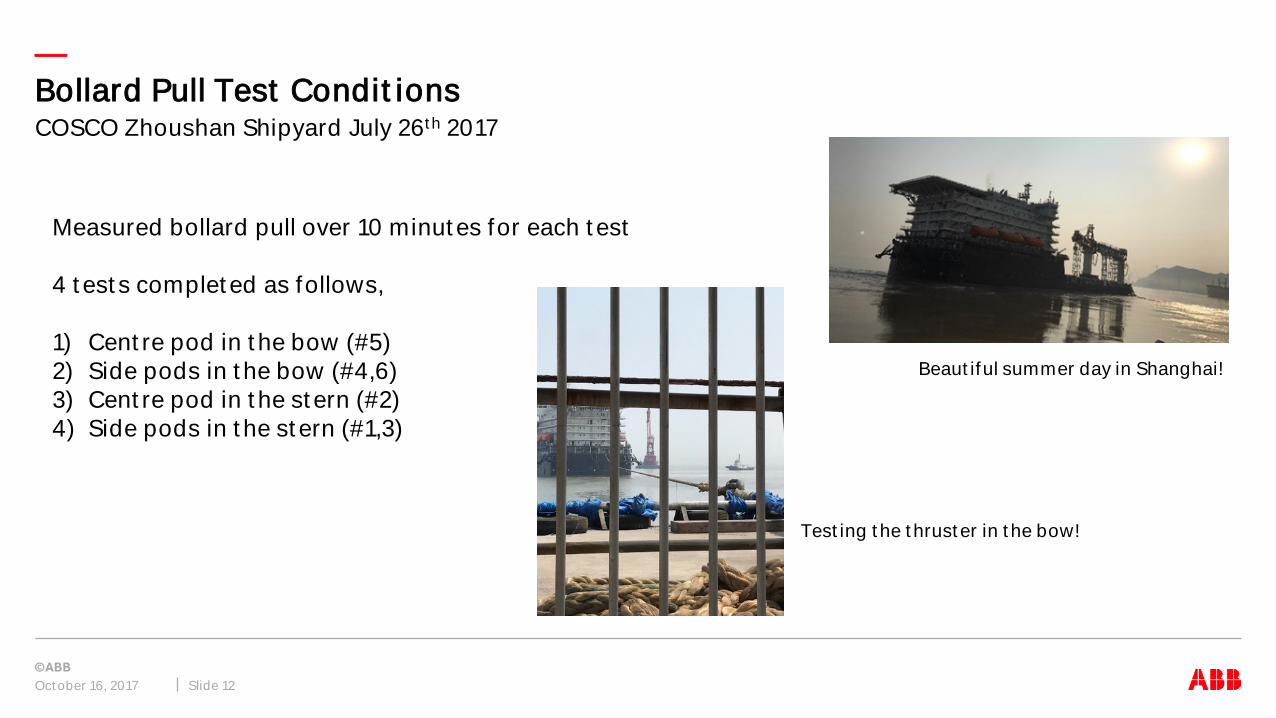
COSCO Zhoushan Shipyard July 26t h 2017
Beaut iful summer day in Shanghai!
Test ing t he t hrust er in t he bow!
Measured bollard pull over 10 minut es for each t est
4 t est s complet ed as follows,
1) Cent re pod in t he bow (#5)2) Side pods in t he bow (#4,6)3) Cent re pod in t he st ern (#2)4) Side pods in t he st ern (#1,3)
—Bollard Pull Test Condit ions
Oct ober 16, 2017 Slide 13
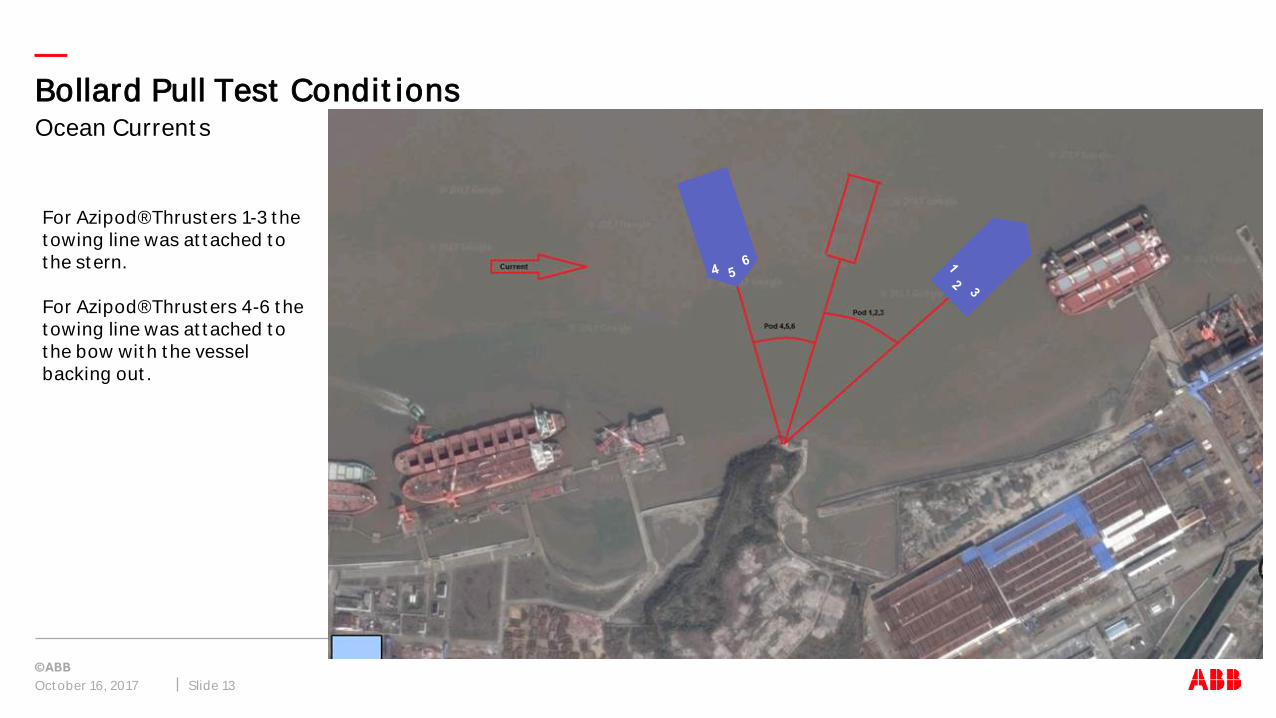
Ocean Current s
For Azipod® Thrust ers 1-3 t he t owing line was at t ached t o t he st ern.
For Azipod® Thrust ers 4-6 t he t owing line was at t ached t o t he bow wit h t he vessel backing out .

—Bollard Pull Test Result s and Ref lect ions

—Bollard Pull Test Result sTest 1 – Cent re pod in t he bow
Pod St at ic bollard pull (t )
Sust ained bollard pull
(t )
Average RPM
CurrentAverage (kn)
Current direction
Pod # 5 34.7 31.6 305 0.6 Ahead/port side
t 1 Ves s el backing out with towing line fas tened in the bow.
Sus tained BP of 31.6 tons and Static BP of 34.7 tons
. Impact f rom varying head current ~ -1-1.5 tons .
Higher RPM value due to the head current. 5
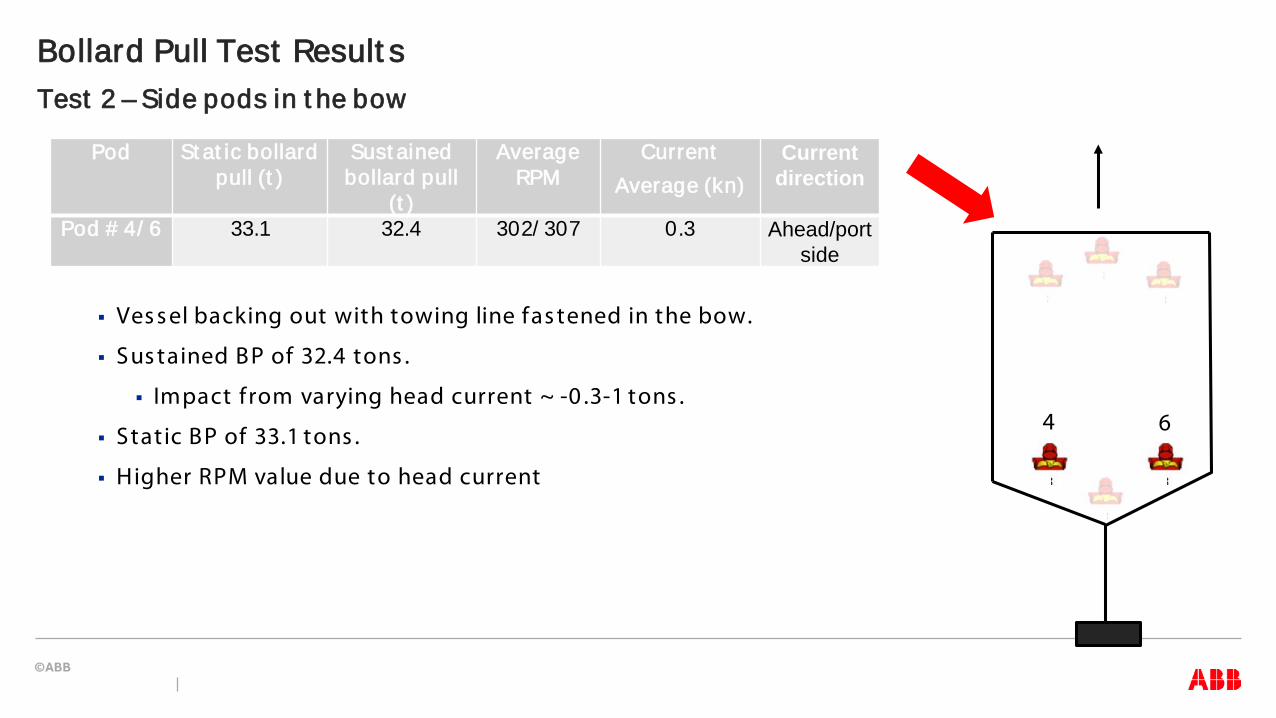
—Bollard Pull Test Result sTest 2 – Side pods in t he bow
Pod St at ic bollard pull (t )
Sust ained bollard pull
(t )
Average RPM
CurrentAverage (kn)
Current direction
Pod # 4/ 6 33.1 32.4 302/ 307 0.3 Ahead/port side
Ves s el backing out with towing line fas tened in the bow.
Sus tained BP of 32.4 tons .
Impact f rom varying head current ~ -0 .3-1 tons .
Static BP of 33.1 tons .
Higher RPM value due to head current
4 6

—Bollard Pull Test Result sTest 3 – Cent er pod in t he st ern
Pod St at ic bollard pull (t )
Sust ained bollard pull
(t )
Average RPM
CurrentAverage (kn)
Current direction
Pod # 5 37.2 35.9 298 1.1 Stern/port side
t 1
2
Ves s el moving forward with towing line fas tened in the s tern.
Sus tained BP of 35.9 tons .
Impact f rom varying head current ~ +2-3 tons .
Static BP of 37.2 tons
Lower RPM value due to the current f rom behind.
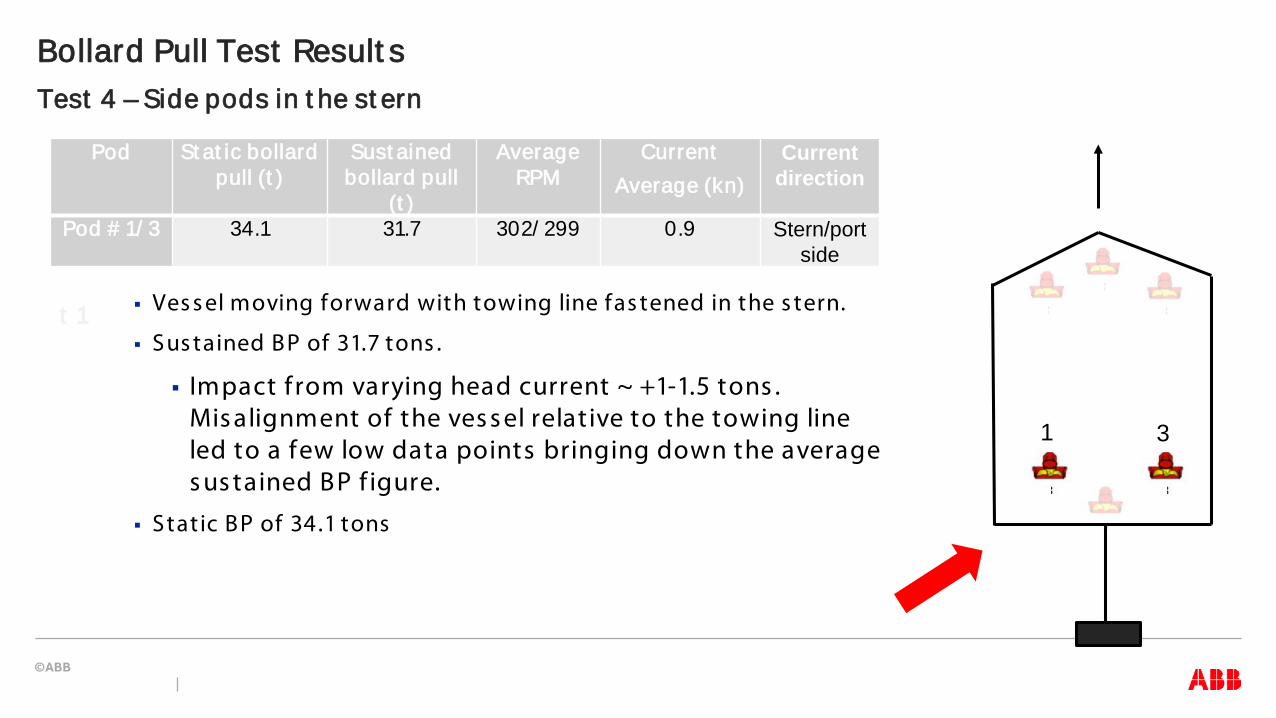
—Bollard Pull Test Result sTest 4 – Side pods in t he st ern
Pod St at ic bollard pull (t )
Sust ained bollard pull
(t )
Average RPM
CurrentAverage (kn)
Current direction
Pod # 1/ 3 34.1 31.7 302/ 299 0.9 Stern/port side
t 1
1 3
Ves s el moving forward with towing line fas tened in the s tern.
Sus tained BP of 31.7 tons .
Impact f rom varying head current ~ +1-1.5 tons . Mis alignment of the ves s el relative to the towing line led to a few low data points bringing down the average s us tained BP f igure.
Static BP of 34.1 tons
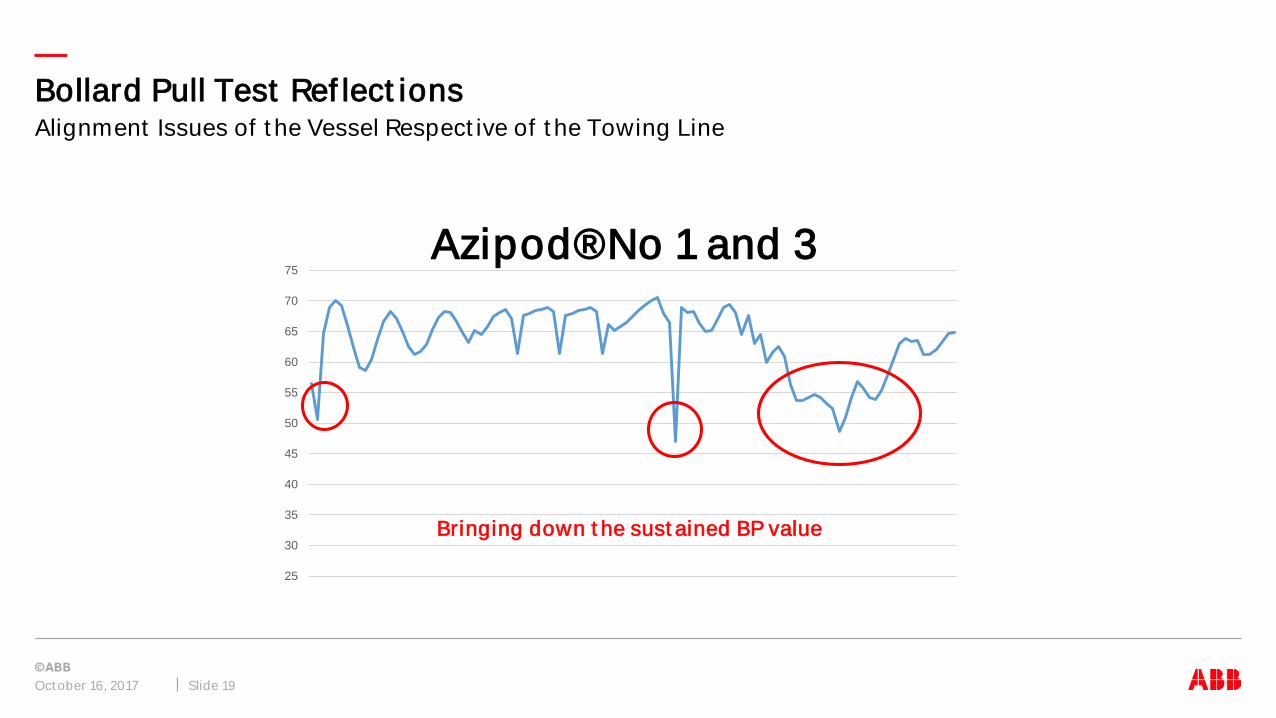
—Bollard Pull Test Ref lect ions
Oct ober 16, 2017 Slide 19
Alignment Issues of t he Vessel Respect ive of t he Towing Line
25
30
35
40
45
50
55
60
65
70
75Azipod® No 1 and 3
Bringing down t he sust ained BP value
—
Pod #
St at ic bollard pull
(t )
Current Impact (t)
CalibratedStatic BP (t)
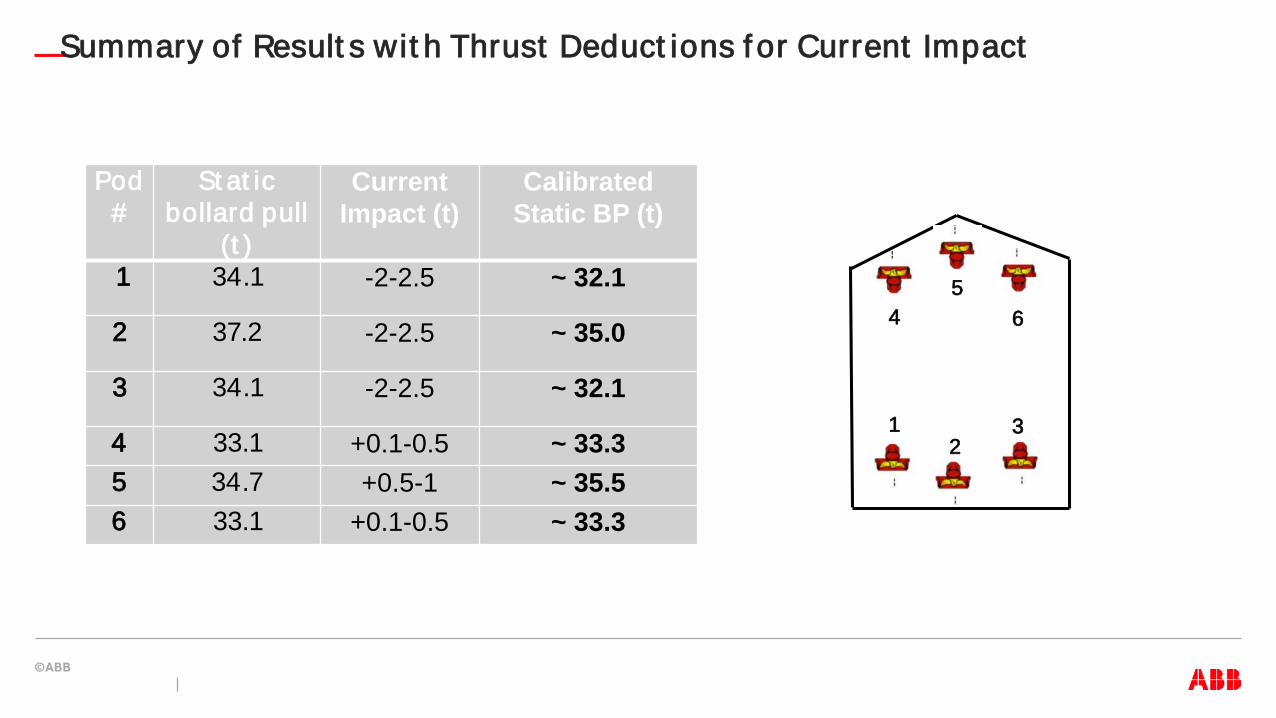
1 34.1 -2-2.5 ~ 32.1
2 37.2 -2-2.5 ~ 35.0
3 34.1 -2-2.5 ~ 32.1
4 33.1 +0.1-0.5 ~ 33.35 34.7 +0.5-1 ~ 35.56 33.1 +0.1-0.5 ~ 33.3
Summary of Result s wit h Thrust Deduct ions f or Current Impact
45
6
12
3

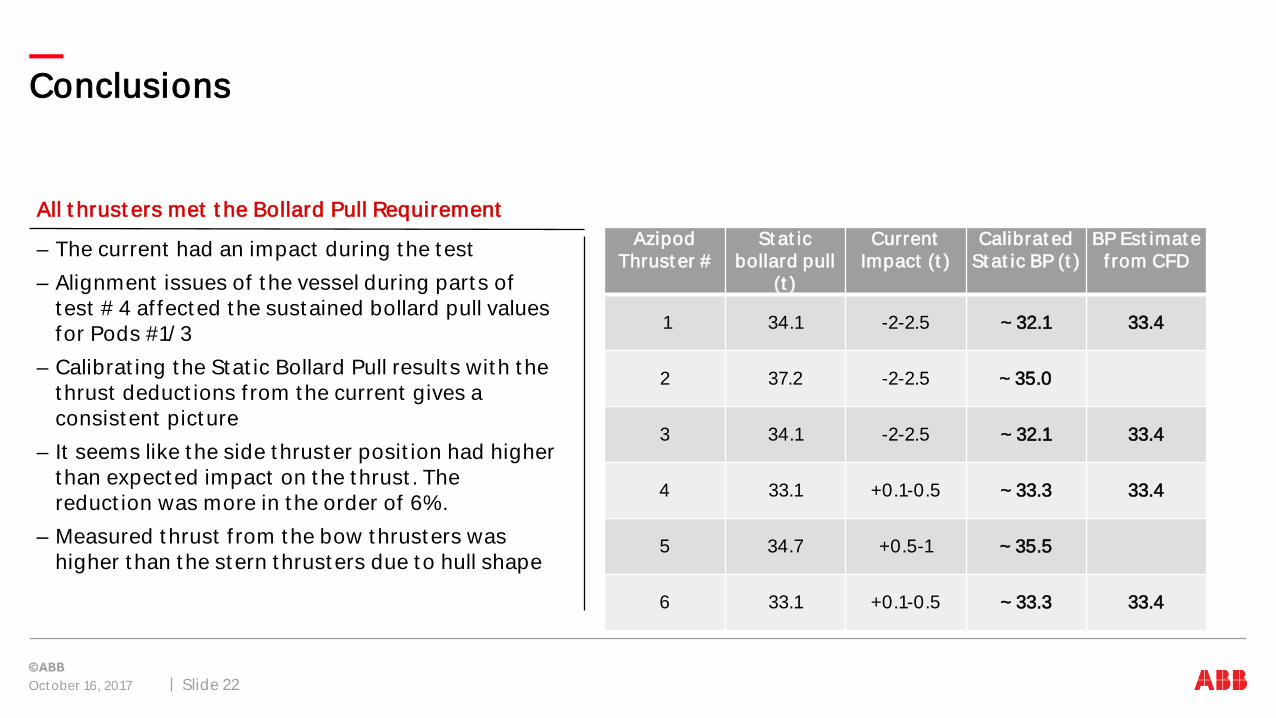
—Conclusions
Conclusions
Oct ober 16, 2017 Slide 22
– The current had an impact during t he t est – Alignment issues of t he vessel during part s of
t est # 4 af fected t he sustained bollard pull values for Pods #1/ 3
– Calibrat ing t he Stat ic Bollard Pull result s wit h t he t hrust deduct ions f rom the current gives a consistent picture
– It seems like t he side t hruster posit ion had higher t han expected impact on t he t hrust . The reduct ion was more in t he order of 6%.
– Measured t hrust f rom the bow thrusters was higher t han t he stern t hrusters due t o hull shape
All t hrust ers met t he Bollard Pull RequirementAzipod
Thrust er #St at ic
bollard pull (t )
Current Impact (t )
Calibrat edSt at ic BP (t )
BP Est imat ef rom CFD
1 34.1 -2-2.5 ~ 32.1 33.4
2 37.2 -2-2.5 ~ 35.0
3 34.1 -2-2.5 ~ 32.1 33.4
4 33.1 +0.1-0.5 ~ 33.3 33.4
5 34.7 +0.5-1 ~ 35.5
6 33.1 +0.1-0.5 ~ 33.3 33.4