unine - ifa australia · dice, segment and conduct comparative analysis. • deduplication,...
TRANSCRIPT


Meet Hunter Jiang
Who is this?Hunter has designed and delivered many practical hands-on step by step training courses to accelerate the acquisition of financial management skills. As well as identifying key financial concepts in budgeting, reporting and analysis, he supports this knowledge with many simple and sophisticated Excel models. He also has the ability to access complex BI and reporting tools and make them come alive in common sense ways which can be replicated by the learner back in the office environment.
Skills
78%Leadership
51%Organitation
59%Prepairing
85%Execution
Innovation
25%
Hunter Jiang
Senior Group Financial Controller

Hunter Jiang
Senior Group Financial Controller
David Han
Senior Group Finance Director
David Barnard
Senior Corporate Consultant
Brian Ye
Firm Partner MBA CPA Tax Agent
Angi Zang
Senior Commercial Analyst
Jimmy Cao
Corporate CFO
Andy Chen
Senior FMCG Commercial Analyst
Richard Zhu
Corporate FP&A Manager
Meet the Awesome Team

Our CustomersThe journey towards Business Partnering
Data ProcessingWhat happened ?
Assistant Accountant
Closing the month end
General Ledger
Excel
Financial Accountant
Reporting
20% 80%
Management Accountant
Analyzing
Financial Controller
Budgeting & Forecasting
20%80%
InformationWhat is happening ?
Knowledge & InsightWhy things happened?
General Ledger
Financial
Statements 60% 40%Review Evaluation 70% 30%History Future
Decision & ImpactWhat will happen?
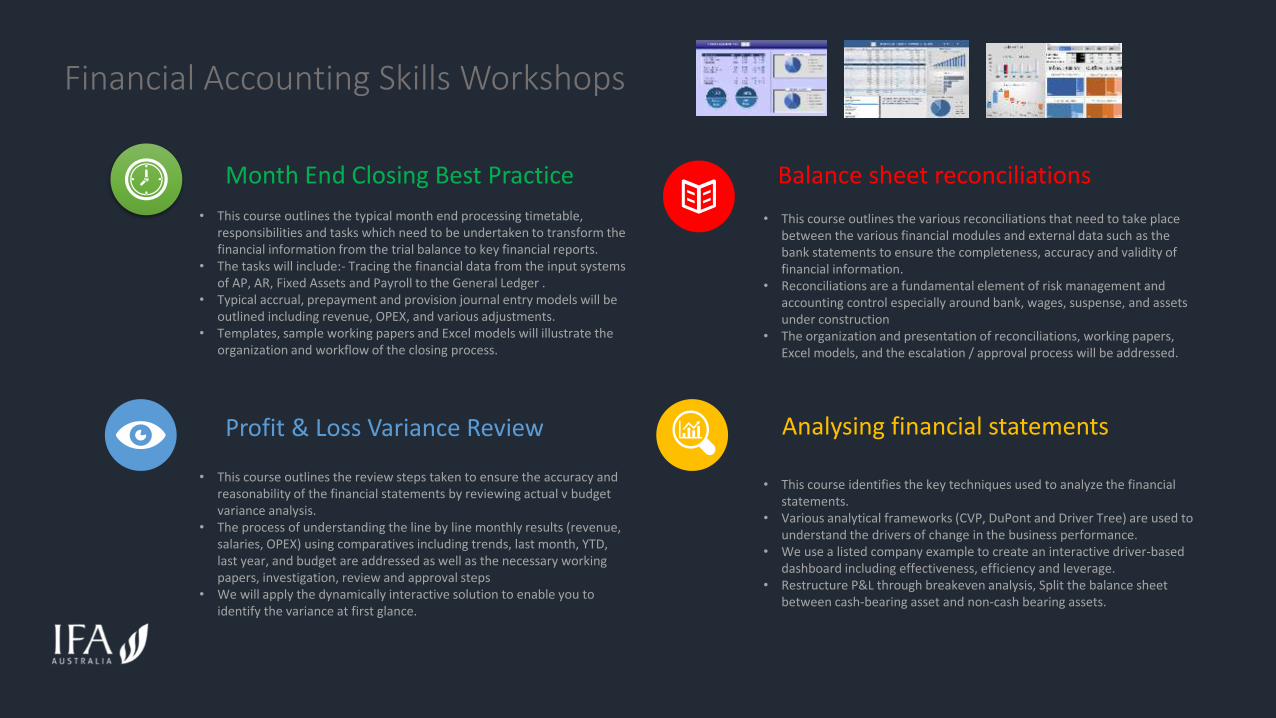
Financial Accounting Skills Workshops
Month End Closing Best Practice
Profit & Loss Variance Review
Balance sheet reconciliations
• This course outlines the typical month end processing timetable, responsibilities and tasks which need to be undertaken to transform the financial information from the trial balance to key financial reports.
• The tasks will include:- Tracing the financial data from the input systems of AP, AR, Fixed Assets and Payroll to the General Ledger .
• Typical accrual, prepayment and provision journal entry models will be outlined including revenue, OPEX, and various adjustments.
• Templates, sample working papers and Excel models will illustrate the organization and workflow of the closing process.
• This course outlines the various reconciliations that need to take place between the various financial modules and external data such as the bank statements to ensure the completeness, accuracy and validity of financial information.
• Reconciliations are a fundamental element of risk management and accounting control especially around bank, wages, suspense, and assets under construction
• The organization and presentation of reconciliations, working papers, Excel models, and the escalation / approval process will be addressed.
• This course outlines the review steps taken to ensure the accuracy and reasonability of the financial statements by reviewing actual v budget variance analysis.
• The process of understanding the line by line monthly results (revenue, salaries, OPEX) using comparatives including trends, last month, YTD, last year, and budget are addressed as well as the necessary working papers, investigation, review and approval steps
• We will apply the dynamically interactive solution to enable you to identify the variance at first glance.
Analysing financial statements
• This course identifies the key techniques used to analyze the financial statements.
• Various analytical frameworks (CVP, DuPont and Driver Tree) are used to understand the drivers of change in the business performance.
• We use a listed company example to create an interactive driver-based dashboard including effectiveness, efficiency and leverage.
• Restructure P&L through breakeven analysis, Split the balance sheet between cash-bearing asset and non-cash bearing assets.

Management l Accounting Skills Workshops
Developing the Budget
Rolling-Over Financial Forecasting
Cash Flow Analysis and Forecasting
Developing KPI’s
• This budget cycle for a business is typically 6-10 weeks and occurs before the financial year end so that it can be approved prior to the start of the financial year.
• The key elements of the budget include business strategy, financial objectives, sales and expense budget templates, letter of guidance and instructions, budget collation worksheet, budget analysis and approval.
• This course will outline the process and key steps and includes worked examples, Excel working papers, and templates.
• This course addresses the need to forecast the cashflow and financing needs of the organization using the direct method.
• To manage the cash flow various Excel models including debtors’ receipts, salaries, OPEX, and capex will be developed. Various forecast scenarios will be developed as well as identifying financing techniques.
• Templates, worked examples, Excel models and classroom exercises will be used to build the skills to communicate the required management actions to improve cash flow.
• Financial rollover forecasts are used to assist the organization to become “future ready”.
• A driver based Excel model will be developed. This will be further developed to include a rollover forecast with appropriate medium financial and business targets. Scenario forecasts and relevant management playbooks will be identified.
• Templates, Excel models, classroom exercises, and worked examples will be used to support the learning.
• The role of the finance leader as business partner with the rest of the organization requires a deep understanding of what drives the business.
• The selection of a few Key Performance Indicators helps the organization understand the “measures that matter”.
• We will undertake classroom exercises to develop KPI’s and develop a simple system of trends, targets & charts which can later be transferred from Excel to a more robust BI tool. Worked examples, Excel models and templates will support the learning.

Technical Skills Workshops
Data Visualization
Data manipulation using Excel
Power BI Using Excel
Dashboard Reporting
• Data visualization is the presentation of data in a pictorial or graphical format so as to identify trends, patterns, and correlations.
• This technical Excel course will use financial data to develop exciting views of information which can provide insights and support decision making.
• We will help create traffic light , bullet , waterfall , Gantt and gauge charts.
• Power BI allows the user to access large volumes of data, analyze visual insights and publish them for the rest of the organization.
• Regular monthly reporting executed in 50% less time with greater accuracy and consistency.
• This course provides techniques each of these elements and the steps to deliver the results using worked examples Excel models, and templates.
• This course will introduce advanced techniques to extract, transform and load data to be used by the analytical engine to produce insights.
• Multiple data sources can be consolidated to benchmark, slice and dice, segment and conduct comparative analysis.
• Deduplication, inconsistent data structures, extraction routines, timetabling considerations will be addressed including working papers, Excel models and worked examples.
• A dashboard is an easy to read, often one page, real time user interface showing a graphical presentation of current status and trends of an organization's KPI’s.
• The dashboard will include P&L, Balance sheet, Cash flow, HR , IT , Sales, Marketing and Projects .
• This course will show you how to create and update a dashboard, how to interact using filters, how to choose the charts to fit the data, and provide animation.

Finance For Non- Finance Managers
Let your eyes gain experience
This course will help operation and general managers have a good understanding of the financial dimensions of the business.
In particular the manager will gain an understanding of the purposes and key elements of the 3 main Financial Statements – Profit & Loss, Balance Sheet, and Cash Flow.
Managers will also learn advanced financial techniques including budgets, key financial indicators (analysis including the DuPont driver tree analysis), breakeven analysis, costing and pricing decisions.
