unilever in india accelerating change · pdf fileaccelerating change unilever in india doug...
TRANSCRIPT

Accelerating changeUnilever in IndiaDoug BaillieGroup Vice President, South Asia
Unilever
Mumbai
14th November 2007
Safe harbour statement
This presentation may contain forward-looking statements, including 'forward-looking statements' within the meaning of the United States Private Securities Litigation Reform Act of 1995. Words
such as 'expects', 'anticipates', 'intends' or the negative of these terms and other similar expressions of future performance or results, including financial objectives to 2010, and their negatives are intended to identify such forward-looking statements. These forward-looking
statements are based upon current expectations and assumptions regarding anticipated developments and other factors affecting the Group. They are not historical facts, nor are they guarantees of future performance. Because these forward-looking statements involve risks and uncertainties, there are important factors that could cause actual results to differ materially from
those expressed or implied by these forward-looking statements, including, among others, competitive pricing and activities, consumption levels, costs, the ability to maintain and manage key customer relationships and supply chain sources, currency values, interest rates, the ability to integrate acquisitions and complete planned divestitures, physical risks, environmental risks,
the ability to manage regulatory, tax and legal matters and resolve pending matters within current estimates, legislative, fiscal and regulatory developments, political, economic and social
conditions in the geographic markets where the Group operates and new or changed priorities of the Boards. Further details of potential risks and uncertainties affecting the Group are described
in the Group's filings with the London Stock Exchange, Euronext Amsterdam and the US Securities and Exchange Commission, including the Annual Report & Accounts on Form 20-F.
These forward-looking statements speak only as of the date of this presentation
Agenda
Overview
India opportunity
How are we winning
The road ahead….
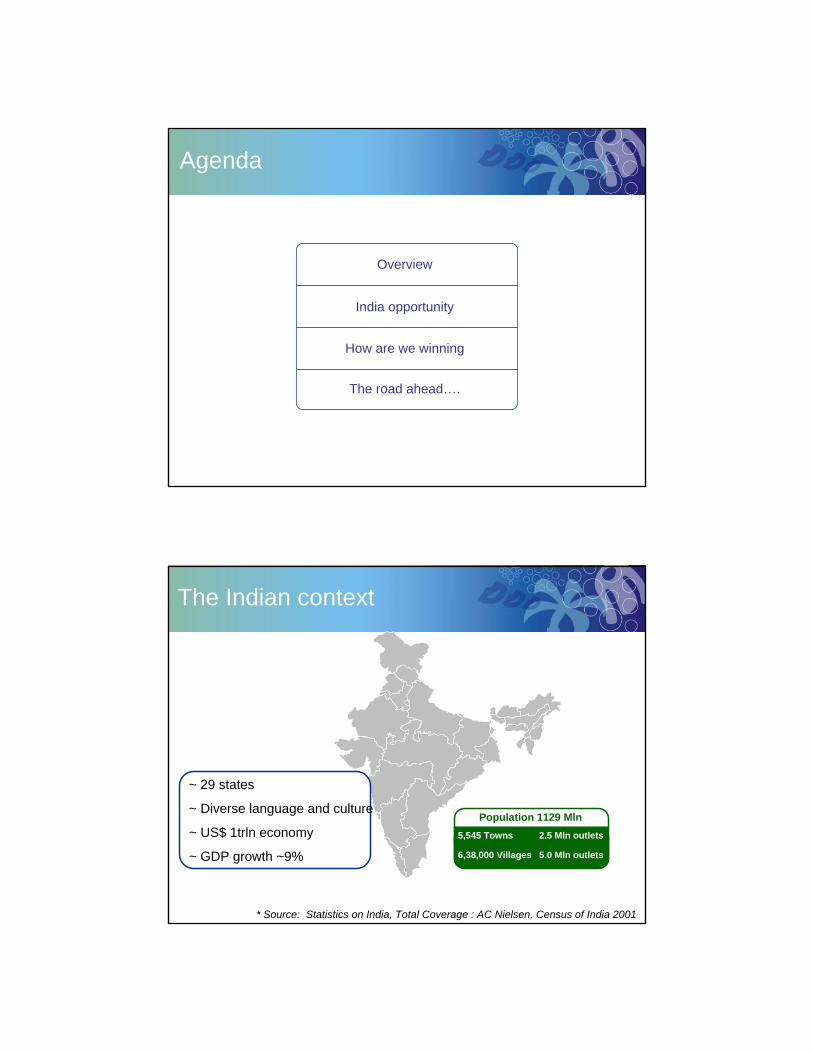
* Source: Statistics on India, Total Coverage : AC Nielsen, Census of India 2001
The Indian context
Population 1129 Mln5,545 Towns 2.5 Mln outlets
6,38,000 Villages 5.0 Mln outlets
~ 29 states
~ Diverse language and culture
~ US$ 1trln economy
~ GDP growth ~9%

Unilever in India: Where have we come from
• 75 year history in India
Sunlight soap first imported in 1888
Lever Brothers incorporated in 1933
Hindustan Lever Ltd formed through merger in 1956
• Unilever equity diluted in 1977 and 1980 to 51%
1993 : TOMCO merged with HLL
1996 : Brooke Bond Lipton & HLL merge
1998 : Ponds merges with HLL
1999 : Modern Foods acquired
2006 : Move to one Unilever structure
2007 : Name change to Hindustan Unilever Ltd
690503 396 320 314 307 273 254 180
2961
Unilever Nestle Britannia Dabur Marico P&GCombined
Colgate GSK Tata Tea Godrej CP
Unilever – Largest FMCG in India
2006 TTM Turnover –Source: Audited Reports and Company Press releaseP&G Turnover is the combined Turnover of its listed entity together with its estimated turnover of its unlisted entity
Turnover (US$m)

Sales growth trend
3.7 4.8 3.6
0.3
12.7 12.8
-0.5
2000 2001 2002 2003 2004 2005 2006
FMCG Underlying sales growth %
excludes non-FMCG businesses such as Chemicals.
Operating margin
13.2%
15.5%
19.3%20.1%
14.7%13.3%
14.1%
2000 2001 2002 2003 2004 2005 2006
* Before restructuring and disposal profits

2007 where we stand…
14.0%22.3%16.2%1.1%Operating profit growth*
14.1%
12.8%
9.4%
2006
13.0%
14.5%
10.8%
YTD ’06
12.1%11.4%Reported turnover growth
13.3%
12.7%
2005
13.3%Operating margin* %
12.2%FMCG Underlying Sales Growth
YTD ‘07
* Before restructuring and disposal profits
Market share – Stable in key categories
22.3
30.0
55.1
54.0
47.5
36.5
Q2-07
23.4
30.0
55.0
53.2
47.7
37.0
Q3-07
30.030.430.730.2Oral
54.854.754.454.7Skin Care
21.922.923.923.7Tea
55.355.354.154.6Personal wash
46.948.548.948.0Shampoo
35.234.634.334.1Laundry
Q1-07Q4-06Q3-06Q2-06
% value market share

Source : A.C Nielsen - Quarter Ended Sept 2007 Value shares
Leadership across FMCG categories
63.6
5.1
47.5
23.4
59.8
47.7
55.056.453.2
37.0 36.8
20.214.1
24.3
7.48.610.213.2
FabricWash
PersonalWash
PacketTea
Skin Shampoo TalcumPowder
Dishwash Jams
26.930.0 30.9
48.2
Toothpaste Ketchups
Market leader Strong No. 2
HUL – Market Share (%) Main Competitor Market Share (%)
Coffee
Agenda
Overview
India opportunity
How are we winning
The road ahead…

Opportunities and challenges
• A buoyant and growing economy
• Increasing per capita income drives FMCG growth
• Current FMCG market growth
• A changing profile of a differentiated set of consumers
• Opportunity to grow consumption and penetration
• The Foods opportunity
• Evolving trade structure
Video

Sustained 8% + growth
• Growth trend line has significant upward bias
• Per capita Income has doubled in 4 years
• India embarking on an accelerated growth cycle
Source: IMF Website
-8
-4
0
4
8
12
58 62 66 70 74 78 82 86 90 94 98 02 06
%
3-4% Growth 5-6% Growth 7-9% Growth
1960- 1980 1980- 2000 2000-2006
Rising GDP and Per Capita Income
423 441 467553
634730
851
0
200
400
600
800
2000-01 2001-02 2002-03 2003-04 2004-05 2005-06 2006-07
GDP ($ Bln)
Per Capita Income ($)H
PC S
pend
Per
Cap
ita (U
S$)
Source: Euromonitor, Morgan Stanley Research 2006
Per capita incomes drive consumption
Disposable income per capita vs HPC spend per capita
Increasing per capita income drives FMCG growth
0
100
200
300
0 1000 2000 3000 4000 5000 6000 7000
India
Per capita Disposable Income (US$)

Market size and growth
912
672
466
907
19721522
0%
4%
8%
12%
16%
20%
LaundryPersonal WashOral
Hair Wash
SkinTea
Growth
Size of Market US$m.
India - 2013
2003181 mn hhlds
131
46
3
2013231 mn hhlds
124
11
96
Affluent
Aspirers
Strivers
Source : National Council of Agriculture & Economic Research
The shape of India is going to change…from a pyramid to a diamond

22.916.6
12.1
2.21.91.4
India Indonesia China Brazil Germany USA
7.56.7
6.0
1.01.00.3
India China Indonesia Brazil USA Germany
Per capita consumption (US$ )
Source : Euromonitor, 2006
1.0 3.0 5.9
33.9
49.4
0.2
India Indonesia China Brazil Germany USA
0.8 3.2
12.2
26.9
36.6
0.3
India Indonesia China Brazil USA Germany
Opportunity to grow consumption
Laundry Shampoo
Ice creams Skin care
India India
IndiaIndia
Source : MRUC, Hansa Research - Guide to Indian Markets 2006
*Penetration numbers based on study conducted by Indian Readership Survey, on a sample size of ~250,000 based on usage in 6 months
Penetration %*
Category All India % Urban % Rural %
Deodorants 2 6 1
Toothpaste 49 75 38
Skin Cream 22 32 18
Shampoo 38 52 32
Utensil cleaner 28 60 15
Instant coffee 7 16 3
Washing powder 86 91 84
Detergent bar 89 91 87
Toilet soap 92 97 89
Opportunity to grow penetration

Foods opportunity…
•Packaged Food market $14 Billion
•Largely Urban (80%), rapid historical growth: 13%
•Poised to accelerate: income elasticity of 1.33
Source: Euromonitor, Family Budget Study
196
2137
196
75
14
138
6.6
3.8
2.3
5.2
Eastern Europe Latin America Africa and WestAsia
India
HPC Market Size
Food Market
Ratio of Food Market to HPMC Market
US$bn
The “real” India Foods opportunity
Unpackaged/ Fresh, 95% $ 275 Billion
Bulk of food in India is still consumed fresh & unpackaged….. Conversion Opportunity
Packaged, 5% $ 14 Billion

Evolving trade structure…
General TradeModern Trade
90%10%201075%25%2025
95%5%2007General TradeModern TradeYear
Agenda
Overview
India Opportunity
How are we winning
The road ahead….

Unilever in India – Uniquely positioned to create value
• Evolving strategic focus
• Unmatched brand portfolio
• Innovation and R&D capabilities to straddle the pyramid
• Versatile distribution network
• Strong corporate responsibility and governance
• Strong local talent base
Evolving strategic focus
One Company
Leading positions
High growth spaces
2000 2004
AFS
Quest
Nickel Catalyst
Adhesives
SeedsDiversey
Lever
DIVESTED
Mushrooms
Oils & Fats
Non Core
Business
35 PowerfulBrands
Industries Categories Brands
Non Core Processes Outsourced
One Sales Force
Global Innovation; Local Activation
One Top Team
110 Brands

Portfolio straddling the pyramidCase study : Laundry
$ 1773 M.Market Size37.0%Unilever share13.2%
Current
No.2 Share
Laundry
Affluent
Aspiring
Striving
Our Strategy
Work the pyramid; Grow profitably ahead of the market; Regain profitability through judicious price increases and cost effectiveness programmes
Source: AC Nielsen retail panel; Euromonitor
Path breaking activation

Exceptional ratings for a websites
• No. of hits : 200 million • Nos. of registration : 280,000• No. of gangs : 26,000• Time spent on the site : 14 mins
Recognition
• Enquiry from Star groups on acquisition
• Google & Travelguru sought alliance
• Link on Orkut site• Competitor imitation
(www.beingagirl.com)
Innovation in activation Case Study : Sunsilk gang-of-girls.com
Opportunity from increased penetration
2123
27
31
35
39 39 4042 42 42
15
20
25
30
35
40
45
MQ 04 JQ 04 SQ 04 DQ 04 MQ 05 JQ 05 SQ 05 DQ 05 MQ 06 JQ 06 SQ 06
Rollout of Rs 1 (2 cents) and Rs 0.50 (1 cent) sachets
SSK Black 8mRural plan
Rural shampoo penetration : % households bought once/quarter
Low price shampoo sachets have helped drive category penetration
Unique innovations & promotions to drive category penetration

Unilever India leads global research in Oral, Skin and Laundry
Some achievements:
• Single Shot Soap making process
• Skin Lightening Cream
• Non Soap Detergent Bars
• Poly coated Dish Wash Bar
• Drinking water purifier (Pure-It)
Innovation and R&D capabilities
R&D achievements
20 % of the world population in 30 countries face water shortage; No. to rise - 30% in 50 countries by 2025Context
Proposition: Technology to deliver superior clean while significantly reducing water consumption
Surf Excel Quick Wash
Opportunity of Increasing consumption and penetration of skin creams by breaking the affordability barrier and driving price point strategy
Context
Proposition: Packaging Innovation to develop an unique multiuse sachets, small containers at a cost of 10 cents (1/5th of the regular tube)
Skin Creams Low Unit Packs

COST220 liters of pure water for $ 1
Proposition: ‘as safe as boiled water’ without hassles of boilingno harmful virus, bacteria, parasites, pesticides Works without electricity & piped water
Business model based on sale of consumables
R&D achievements…Water
~ 220 Mln Households, where safe drinking water in short supply
Context
Affordable price: Cost of Unit - ~$ 40; Cost of battery - $ 7
Being Rolled out across key towns and urban areas
Our strategy
Build brand image leadership & strong consumer relationship through effective communication; secure ongoing sale of consumables
Winning with “Go to Market Approach”
67:33Urban : Rural Ratio
11FMCG Growth (Value %)
14.5Per Capita FMCG Spend (Annual,$)
16448FMCG Market (Annual, $ Mln)*
6.8Store Density (Stores Per 1000 People)
7.74Number of Retail Stores (Mlns)
1.1Total population (In Bln.)
HIGHEST STORE DENSITY IN THE WORLD ! Source AC Nielsen
Direct coverage – 1milllion outlets Brands reach – 6.3 million outlets
Strong IT capability, end to end connectivity
Unique channel Initiatives to Win at “Point of Purchase”
Portfolio of category and Brands give unique reach in Modern Trade
Project Shakti, a competitive advantage in Rural India
Distribution Strength

Leveraging IT for growth
CENTRAL UNIFY
Distributor Mgmt System
Hand Held Terminals
Retailers
End 2008
~1m outlets~4000 stockists
35 Brands, 1500 skus 45 Depots, 4000 stockist
Source : Retailer POS Data & AC Nielson Comparison with Top 6 Metros in GT
Organized retail - A source of competitive advantage
HUL Market Shares in Modern Trade
HUL Modern Trade (MT) Shares are higher than its General Trade (GT) shares in many categories
NSD Bars NSDPowders
Shampoo SkinCleansing
Skin Care ToothPaste
Tea Coffee Overall
GT MT

What sets us apart - Reaching shoppers
DAIRY Ice creamMEAT
WINE
CHECKOUTS
BA
KER
Y
DE LI
Jam
s, S
quas
hes
Soap
Cosm
etics
LAU
ND
RY
SOU
P
SEA
SON
ING
S
DR
ESSI
NG
S
SNA
CK
S
PAST
A S
AU
CE
SAU
CETe
a
OIL
Cus
tard
s an
d je
lly
Cof
fee
Hai
r
Skin
Toot
hpas
te
T
ooth
bru
sh
Dis
h W
ash
DEO
DIA
PER
S
Sani
tary
nap
kins
Pape
r pdt
s
Project Shakti- Enabling direct rural reach
• To Reach:• Small, scattered settlements and poor
infrastructure make distribution difficult• Over 500,000 villages not reached directly
by Unilever
• To Communicate:• Low literacy hampers effectiveness of print
media• Poor media-reach: 500 million Indians lack
TV and radio
• To Influence:• Low category penetration, consumption,
brand awareness• Per capita consumption in Unilever
categories is 33% of urban levels

ShaktiThree Shakti initiatives
• Shakti entrepreneur; currently ~ 42000 women cover 1,23,000 villages
• Shakti Vani: one-to-many communication for category growth
• iShakti: customized interaction with remote consumers
Impact on community• Business and social impact can go together• Partnerships with diverse stakeholders
Corporate Responsibility – Aiding in the Development of the Country
Combining corporate responsibility and business strategies to aid development of rural India
Lifebouy Swasthya Chetana - Health & Hygiene
Shakti – Empowerment of women through micro-enterprise Opportunity
Yashodadham - Relief and Reconstruction in Gujarat's Kutch district
Asha Daan - Happy Home actively supported by Unilever

Diarrhoea – Kills a child every 10 secs - 33%(1 mn) of these deaths are in India
LSHTM* Study - Washing hands with soap and water reduces diarrhoeal diseases by 47%
Business objective – To increase soap consumption in rural India
Lifebuoy - India’s leading health soap brand - Role in propagating health & hygiene awareness in villages
* London School of Hygiene & Tropical Medicine
The Challenge in rural India: 1. Lack of awareness about disease causing germs2. Need for repeated contacts to drive behaviour change3. Lack of media reach
SWASTYA CHETNA
Lifebuoy Swastya Chetna
* Expect to complete by end 2007
Health Check- up
Glow Germ Demo
Healthy Family
Health Check- up
14080No. of people contacted (mn)
4000027800No of villages contacted
Cum. 2007
2002-2006
Results

#9#9
2007 Rankings2007 RankingsMost Respected Company RanksMost Respected Company Ranks
Most respected company rank (2006 rank : 17)
Most respected company rank (2006 rank : 17)
#1#1Most respected FMCGMost respected FMCG
#2#2Most respected MNCMost respected MNC
#9#9
2007 Rankings2007 RankingsMost Respected Company RanksMost Respected Company Ranks
Most respected company rank (2006 rank : 17)
Most respected company rank (2006 rank : 17)
#1#1Most respected FMCGMost respected FMCG
#2#2Most respected MNCMost respected MNC
#4#4Global RankGlobal Rank
#1#1Rank in AsiaRank in Asia
#1#1Rank in IndiaRank in India
Hewitt Top Company for Leaders
Our talent and corporate reputation…
Overview
India Opportunity
How are we winning
The road ahead…
Agenda

Focus on growing ahead of the market by leading market development activities
Grow a profitable foods business by leading market development in the category
Grow the bottom-line ahead of top line
Leverage the impact on the consumer from the growing Indian eonomy
Manage Cost pressure effectively to improve margins
Strong commitment to sustainable development
The road ahead …
Thank You

Accelerating changeUnilever in IndiaDoug BaillieGroup Vice President, South Asia
Unilever
Mumbai
14th November 2007