unido file 9920891 - united nations industrial development
TRANSCRIPT

WHAT FACTORS DRIVE SUCCESSFUL INDUSTRIALIZATION?
EVIDENCE AND IMPLICATIONS FORDEVELOPING COUNTRIES
Inclusive and Sustainable Industrial Development Working Paper SeriesWP 7 | 2017

DEPARTMENT OF POLICY, RESEARCH AND STATISTICS
WORKING PAPER 7/2017
What factors drive successful industrialization? Evidence and implications for developing countries
Bruno Martorano Institute of Development Studies and
ETH Zurich, NADEL Center for Development and Cooperation
Marco Sanfilippo University of Bari and Institute of Development Policy and Management
University of Antwerp
Nobuya Haraguchi UNIDO
UNITED NATIONS INDUSTRIAL DEVELOPMENT ORGANIZATION
Vienna, 2017

The designations employed, descriptions and classifications of countries, and the presentation of the
material in this report do not imply the expression of any opinion whatsoever on the part of the Secretariat
of the United Nations Industrial Development Organization (UNIDO) concerning the legal status of any
country, territory, city or area or of its authorities, or concerning the delimitation of its frontiers or
boundaries, or its economic system or degree of development. The views expressed in this paper do not
necessarily reflect the views of the Secretariat of the UNIDO. The responsibility for opinions expressed
rests solely with the authors, and publication does not constitute an endorsement by UNIDO. Although
great care has been taken to maintain the accuracy of information herein, neither UNIDO nor its member
States assume any responsibility for consequences which may arise from the use of the material. Terms
such as “developed”, “industrialized” and “developing” are intended for statistical convenience and do
not necessarily express a judgment. Any indication of, or reference to, a country, institution or other legal
entity does not constitute an endorsement. Information contained herein may be freely quoted or reprinted
but acknowledgement is requested. This report has been produced without formal United Nations editing.

iii
Table of Contents
1. Introduction ........................................................................................................................... 2
2. Identification of successful industrializers ............................................................................ 5
3. Data and model specification .............................................................................................. 11
3.1 Control variables ......................................................................................................... 12
4. Regression results ................................................................................................................ 17
4.1 Additional specifications ............................................................................................. 21
4.2 Robustness checks ....................................................................................................... 26
5. Conclusions and policy implications ................................................................................... 28
Appendix ..................................................................................................................................... 37
List of Tables
Table 1 Descriptive statistics on the two variables of interest ............................................... 5
Table 2 List of industrializers ................................................................................................. 7
Table 3 List of “successful” industrializers ............................................................................ 8
Table 4 Structural transformation in successful industrializers .............................................. 9
Table 5 Variable description ................................................................................................ 15
Table 6 Descriptive statistics on the overall period and the two sub-periods ...................... 15
Table 7 Means comparison between successful industrializers and other countries ............ 16
Table 8 Results – Determinants of industrialization periods ................................................ 18
Table 9 Determinants of industrialization episodes ............................................................. 22
List of Figures
Figure 1 MVA growth and GDP growth ................................................................................. 3
Figure 2 Pattern of structural change within manufacturing ................................................. 11
Figure 3 MVA growth and GFCF_GDP................................................................................ 19
Figure 4 MVA growth and capital account liberalization, 1991 - 2010 ................................ 20

1
Abstract
This paper analyses the drivers of successful industrialization in developing countries. We
consider two different periods, 1970-1990 and 1991-2014, which are likely to be affected by
different patterns of industrialization due to major political, technological and organizational
changes. We subsequently develop a simple methodology to identify a small group of countries
for each period, which have exhibited a pattern of industrialization that is not only remarkable
in absolute terms, but also sustained (i.e. industrialization that occurs over a long period of
time). Based on this classification, our empirical analysis reveals that successful
industrialization is driven by a combination of factors, including the country’s initial economic
conditions, its factor endowments as well as other characteristics, such as demographic structure
and geography. We also show that other variables that policymakers can control play a crucial
role. This includes, among others, the promotion of investments in capital (both public and
privately funded) and education; the management of trade and capital openness; financial sector
development and the promotion of both macroeconomic and institutional stability.
Keywords: Industrialization; developing countries; policies

2
1. Introduction
There is consensus that industrialization plays a key role in the process of a nation’s economic
development. There are many reasons why pursuing sustained industrialization has long lasting
benefits on economic development. Some of these reasons are rooted in Kaldor’s law, which
provides a conceptual framework for the link between manufacturing and economic growth.
The major argument of proponents of industrialization relies on the productivity advantage of
manufacturing over other sectors, as well as on the higher externalities that can arise from
manufacturing growth (see also Szirmai, 2012, for a detailed discussion). As a matter of fact,
not only the manufacturing sector displays levels of productivity that are higher compared to
those of other sectors and has a greater capacity to absorb labour force (Timmer et al., 2015;
McMillan et al., 2014), it also promotes savings, boosts the process of capital accumulation and
offers higher investment opportunities (Lewis, 1954; Szirmaia and Verspagen, 2015). In
addition, the manufacturing sector promotes economies of scale by driving technological
progress (Arrow, 1962; Thirlwall, 2002), while providing spillover effects through linkages to
other economic sectors (Hirschman, 1958). More recent research has shown that
industrialization allows for greater economies of scope, with countries that are able to produce
larger varieties of goods also being far more likely to undergo rapid economic growth
(Hausman et al., 2007; Hidalgo et al., 2007).
As far as developing countries are concerned, both the data (Figure 1) and the existing empirical
evidence seem to support the industrialization-growth nexus. Rodrik (2006) emphasizes that
episodes of growth acceleration are often associated with an increasing role of manufacturing in
the economy. Szirmaia and Verspagen (2015) analyse the importance of manufacturing as a
driver of economic growth using data for 88 countries (21 advanced economies and 67
developing countries) over the period 1950–2005. They report that manufacturing has a positive
impact on economic growth. Cantore et al. (2014) get to similar results using a sample of 80
countries. Still, this early evidence contrasts with more recent analyses revealing a tendency in
developing countries to embark on a path of growth not driven by rapid industrialization
(Rodrik, 2016; Diao et al., 2017). According to Haraguchi et al (2017), however, this trend
should not be interpreted as one that downplay the importance of manufacturing as an engine of
growth. Using very detailed data drawn from different sources, the authors show that the
significance of manufacturing for developing countries has not faded over the last decades, but
has instead been concentrated in a small number of highly populated countries (Haraguchi et al.,
2017). Wood (2017) reaches a similar conclusion using a different lens of analysis. He
demonstrates that the pattern of re-distribution of manufacturing is consistent with the results of

3
an augmented Heckscher-Ohlin model, i.e. a model based on countries’ relative factor
endowments. Over time, manufacturing value added has moved towards (skill-scarce) labour
abundant and land-scarce countries in Asia, while it failed to reach land-abundant countries in
Africa and Latin America (Wood, 2017).
Figure 1 MVA growth and GDP growth
Source: Authors’ elaboration of UN National Accounts Statistics
Yet, what are the factors that contribute to a successful process of industrialization? And why
have some countries—more than others—been successful in maintaining a sustained pattern of
industrialization over the last decades? Policies obviously play a decisive role. Newman et al.
(2016) review the causes of weak manufacturing development in Africa by comparing it to
successful cases in East Asia, and claim that the role of policies is key in explaining the
different patterns observed in the two country groups. Rodrik (2004) discusses the role of
policies in promoting industrialization and emphasizes the importance of strategic collaboration
between the government and the private sector. In a subsequent paper, he focuses on the
challenge of industrialization within the context of an open economy (Rodrik, 2007).
Specifically, Rodrik (2007) explains that successful industrial policies should be based on a
combination of targeted interventions to promote new export industries and a competitive
exchange rate. Aghion et al (2011) argue that sectoral policies may foster productivity and
economic growth when they target the most competitive sectors. A similar argument has been
put forward by promoters of the new structural economics approach, namely that countries
should pursue a path of development that is based on the identification and the exploitation of
existing comparative advantages (Lin, 2012).

4
Obviously, the successful and extensive experience of many Asian economies with
industrialization and structural transformation over the last decades represents the most relevant
example for other low- and middle-income countries around the world. Asian countries display
a set of policies and institutional conditions that have pushed rapid industrialization and
structural change. Yet, in contrast to the current evidence of “premature deindustrialization” in
developing countries (Rodrik 2016), many Asian countries still exhibit a strong specialization in
manufacturing, alongside sustained economic growth (Wood, 2017; Diao et al., 2017). The key
elements for such success stories can be found, among others, in the capacity to implement a
transformation based on labour-saving technological change combined with high levels of
investment in human and physical capital (Aizenman et al., 2012; Martorano et al., 2016).
In light of the above, the objective of this paper is to analyse the drivers of successful
industrialization in developing countries. Our analysis involves two steps. First, we select a
group of rapid industrializers by applying a simple analysis to define successful industrialization
as a sustained pattern of rapid growth of manufacturing value added. Second, we examine
whether their experiences entail a set of common factors. We do this by empirically analysing
the determinants of successful cases of industrialization among a large group of emerging and
developing countries, accounting for two different periods, 1971-1990 and 1991-2014. The idea
of using 1990 as a breaking point follows Rodrik (2016), who shows that pre- and post-1990
trends in manufacturing employment are statistically distinguishable. As a matter of fact, the
post-1990 period is not only characterized by strong political changes, but also a phase during
which economic globalization definitely began thriving, marking important changes in the
organization of international production and thus affecting the industrialization patterns of the
majority of countries around the world. Understanding the drivers of successful and sustained
processes of industrialization raises important policy implications for a number of developing
countries, particularly in SSA, Latin America and South Asia, which are still underperforming
in terms of industrialization and their likely capacity to link up to regional and global
production networks.
The remainder of the paper is structured as follows. Section 2 develops a simple methodology to
select a group of successful industrializers. Section 3 presents the empirical analysis, providing
detailed information on the data and the model. Section 4 discusses the results of the empirical
specification. Section 5 concludes, highlighting some of the implications of our findings.

5
2. Identification of successful industrializers
In this section, we explain how we identify “successful” industrializers. Our main source of
information is the UN National Accounts Statistics, which provides, among others, annual data
on manufacturing value added (MVA) in constant US dollars over the period 1970 – 2014 for
virtually all countries in the world. Considering our focus on developing countries, we have
removed all countries from our initial sample classified as high income by the World Bank at
the end of each of the periods (1970-1990 and 1991-2014). Moreover, we also dropped
countries with a population of less than 1 million from our analysis to eliminate potential
outliers from our sample.1 Our final sample includes 126 countries for the period 1971 – 1990
and 112 countries for the period 1991 – 2014.2
Based on this sample, we computed the annual MVA growth rates and analysed the distribution
of this variable for the sample over the two periods. Table 1 reports the mean, median and 75th
percentile value referring to the countries included in our analysis.
Table 1 Descriptive statistics on the two variables of interest
MVA growth
1971-2014 Post 1990 Pre 1990
Mean 4.57% 4.26% 4.99%
Median 3.58% 3.16% 4.23%
75pc 8.06% 7.50% 8.82%
Source: Author’s elaboration of UN National Accounts Statistics
To proceed with the identification of “successful” industrializers, our strategy relies on a simple
methodology that uses thresholds drawn directly from the observed distribution of the outcome
of interests. The identification strategy builds on the following stages:
1. For each country, the average MVA growth rate during the period of analysis (1971-
1990 and 1991-2014) must be higher than the average growth rate of MVA for the entire
sample over the same period (i.e. larger than 4.26 per cent in the post-1990, and larger than
4.99 per cent in the pre-1990 period);
1 The excluded countries had a population lower than 1 million in terms of average value for both periods. 2 Over the period 1971 – 1990, our sample includes 42 African countries, 35 Asian Pacific countries, 22 American
countries and 20 European countries. Over the period 1991 – 2014, our sample includes 47 African countries, 32
Asian Pacific countries, 19 American countries and 9 European countries.

6
2. We then define an “episode” of industrialization as any year in which the annual rate of
MVA growth is higher than the average annual MVA growth rate of the reference
group/period;
3. A first group of industrializers is identified by grouping countries according to number
of successful “episodes” recorded over each of the two periods. Countries are classified as
“industrializers” if they experienced a number of episodes larger than the average number
of episodes for the entire distribution (i.e. 9.5 in the first and 9.9 in the second period).
Table 2 presents the list of industrializers, together with some summary statistics on episodes of
industrialization, for the two periods.
Finally, in order to refine our selection and to focus on a smaller group of “successful
industrializers”, we add two additional criteria that relate to the pattern and sustainability of the
industrialization process:
1. We consider only those countries that recorded less than 25 per cent negative
episodes (i.e. less than 5 drops in 1970-1990 and less than 6 in 1991-2014);
2. We select only those countries that recorded more than 75 per cent episodes of
above average growth (i.e. 16 or more years of high growth for the first period and 18
or more years of high growth for the second period).
Table 3 provides a list of the selected countries. It is not surprising to see that the list is
dominated by Asian countries, including early Tigers, and newly industrialized countries during
the first period, and large emerging economies, as well as production hubs involved in global
and regional value chains during the second period.

7
Table 2 List of industrializers
1970 - 1990
1991 - 2014
Country n of
episodes
n of
negative
avg
MVA
growth
Country n of
episodes
n of
negative
avg
MVA
growth
Algeria 13 4 6.49%
Albania 12 6 5.72%
Botswana 14 4 16.10%
Angola 15 3 5.45%
Brazil 13 5 4.92%
Bangladesh 18 0 7.73%
Bulgaria 15 2 5.41%
Belarus 13 6 5.23%
Burundi 11 1 5.81%
Botswana 11 5 5.54%
Cameroon 10 5 5.84%
Cambodia 20 1 12.59%
China 15 2 7.67%
Chad 13 6 9.14%
Costa Rica 11 2 4.91%
China 20 0 9.92%
Côte d'Ivoire 11 5 6.78%
Ethiopia 15 1 8.12%
Egypt 16 2 6.32%
Gabon 13 4 5.58%
Honduras 14 3 4.74%
India 18 0 7.56%
India 12 1 5.83%
Indonesia 13 1 5.46%
Indonesia 19 0 13.53%
Iran 12 6 5.61%
Iran 13 5 8.20%
Jordan 13 1 7.93%
Kenya 15 0 7.48%
Laos 20 0 9.72%
Laos 10 5 6.46%
Lebanon 13 2 6.33%
Lesotho 12 3 9.07%
Lesotho 12 5 7.39%
Libya 14 5 9.53%
Malaysia 14 3 6.36%
Malawi 10 5 5.10%
Mozambique 11 4 7.55%
Malaysia 17 1 10.96%
Myanmar 20 0 15.15%
Mongolia 13 0 6.09%
Nigeria 13 5 6.17%
Morocco 10 1 4.97%
Sri Lanka 17 1 6.14%
Nepal 11 4 5.70%
Sudan (Former) 13 3 7.61%
Niger 12 5 7.01%
Turkmenistan 14 6 10.44%
Nigeria 13 3 8.05%
Tanzania 16 1 6.20%
Oman 16 3 18.95%
Uganda 14 1 7.88%
Pakistan 15 0 6.86%
Viet Nam 21 0 10.43%
Paraguay 11 4 5.33%
Yemen 13 4 9.11%
R. of Korea 18 1 14.25%
Sri Lanka 10 5 4.85%
Thailand 16 1 10.10%
Tunisia 13 2 8.96%
Turkey 16 2 6.52%

8
Table 3 List of “successful” industrializers
Country n of episodes n of negative
episodes
Average MVA growth
for the period
1971 - 1990
Indonesia 19 0 13.5%
Malaysia 17 1 11.0%
Oman 16 3 19.0%
Republic of Korea 18 1 14.3%
Thailand 16 1 10.1%
Turkey 16 2 6.5%
1991 - 2014
Bangladesh 18 0 7.7%
Cambodia 20 1 12.6%
China 20 0 9.9%
India 18 0 7.6%
Laos 20 0 9.7%
Myanmar 20 0 15.2%
Viet Nam 21 0 10.4%
The successful industrializers were selected on the basis of sustained, high MVA growth. These
countries’ MVA not only grew rapidly over a long period of time, but also experienced
structural change with increases in the share of MVA in GDP, indicating faster growth of their
manufacturing sector relative to the rest of the economy. At the beginning of the two periods,
i.e. 1970 and 1991, the respective groups of successful industrializers with the exception of
China had a lower share of manufacturing in GDP than the average of other developing
countries (Table 4). After two decades, the majority of successful industrializers had a higher
manufacturing share than the average of other developing countries. Even those countries that
had a lower manufacturing share than the average increased their manufacturing share
significantly over the years.3
3 Oman, which is a resource-rich country, may be an exception. Even though the country’s manufacturing share
tripled from 1970 to 1990, its share was still low at the end of the period because the country started with a very low
manufacturing share of less than 1 per cent.
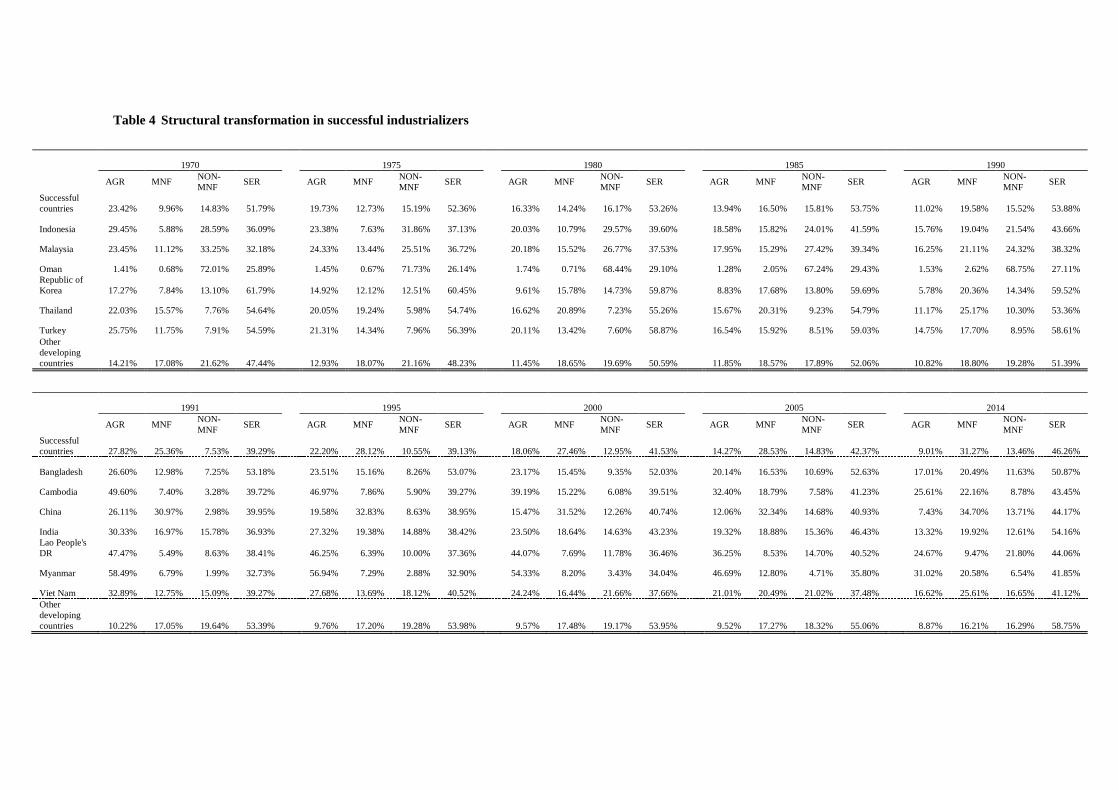
Table 4 Structural transformation in successful industrializers
1970 1975 1980 1985 1990
AGR MNF NON-
MNF SER
AGR MNF NON-
MNF SER
AGR MNF NON-
MNF SER
AGR MNF NON-
MNF SER
AGR MNF NON-
MNF SER
Successful
countries 23.42% 9.96% 14.83% 51.79%
19.73% 12.73% 15.19% 52.36%
16.33% 14.24% 16.17% 53.26%
13.94% 16.50% 15.81% 53.75%
11.02% 19.58% 15.52% 53.88%
Indonesia 29.45% 5.88% 28.59% 36.09%
23.38% 7.63% 31.86% 37.13%
20.03% 10.79% 29.57% 39.60%
18.58% 15.82% 24.01% 41.59%
15.76% 19.04% 21.54% 43.66%
Malaysia 23.45% 11.12% 33.25% 32.18%
24.33% 13.44% 25.51% 36.72%
20.18% 15.52% 26.77% 37.53%
17.95% 15.29% 27.42% 39.34%
16.25% 21.11% 24.32% 38.32%
Oman 1.41% 0.68% 72.01% 25.89%
1.45% 0.67% 71.73% 26.14%
1.74% 0.71% 68.44% 29.10%
1.28% 2.05% 67.24% 29.43%
1.53% 2.62% 68.75% 27.11%
Republic of
Korea 17.27% 7.84% 13.10% 61.79%
14.92% 12.12% 12.51% 60.45%
9.61% 15.78% 14.73% 59.87%
8.83% 17.68% 13.80% 59.69%
5.78% 20.36% 14.34% 59.52%
Thailand 22.03% 15.57% 7.76% 54.64%
20.05% 19.24% 5.98% 54.74%
16.62% 20.89% 7.23% 55.26%
15.67% 20.31% 9.23% 54.79%
11.17% 25.17% 10.30% 53.36%
Turkey 25.75% 11.75% 7.91% 54.59%
21.31% 14.34% 7.96% 56.39%
20.11% 13.42% 7.60% 58.87%
16.54% 15.92% 8.51% 59.03%
14.75% 17.70% 8.95% 58.61%
Other
developing
countries 14.21% 17.08% 21.62% 47.44% 12.93% 18.07% 21.16% 48.23% 11.45% 18.65% 19.69% 50.59% 11.85% 18.57% 17.89% 52.06% 10.82% 18.80% 19.28% 51.39%
1991 1995 2000 2005 2014
AGR MNF NON-
MNF SER
AGR MNF NON-
MNF SER
AGR MNF NON-
MNF SER
AGR MNF NON-
MNF SER
AGR MNF NON-
MNF SER
Successful
countries 27.82% 25.36% 7.53% 39.29%
22.20% 28.12% 10.55% 39.13%
18.06% 27.46% 12.95% 41.53%
14.27% 28.53% 14.83% 42.37%
9.01% 31.27% 13.46% 46.26%
Bangladesh 26.60% 12.98% 7.25% 53.18%
23.51% 15.16% 8.26% 53.07%
23.17% 15.45% 9.35% 52.03%
20.14% 16.53% 10.69% 52.63%
17.01% 20.49% 11.63% 50.87%
Cambodia 49.60% 7.40% 3.28% 39.72%
46.97% 7.86% 5.90% 39.27%
39.19% 15.22% 6.08% 39.51%
32.40% 18.79% 7.58% 41.23%
25.61% 22.16% 8.78% 43.45%
China 26.11% 30.97% 2.98% 39.95%
19.58% 32.83% 8.63% 38.95%
15.47% 31.52% 12.26% 40.74%
12.06% 32.34% 14.68% 40.93%
7.43% 34.70% 13.71% 44.17%
India 30.33% 16.97% 15.78% 36.93%
27.32% 19.38% 14.88% 38.42%
23.50% 18.64% 14.63% 43.23%
19.32% 18.88% 15.36% 46.43%
13.32% 19.92% 12.61% 54.16%
Lao People's
DR 47.47% 5.49% 8.63% 38.41%
46.25% 6.39% 10.00% 37.36%
44.07% 7.69% 11.78% 36.46%
36.25% 8.53% 14.70% 40.52%
24.67% 9.47% 21.80% 44.06%
Myanmar 58.49% 6.79% 1.99% 32.73%
56.94% 7.29% 2.88% 32.90%
54.33% 8.20% 3.43% 34.04%
46.69% 12.80% 4.71% 35.80%
31.02% 20.58% 6.54% 41.85%
Viet Nam 32.89% 12.75% 15.09% 39.27%
27.68% 13.69% 18.12% 40.52%
24.24% 16.44% 21.66% 37.66%
21.01% 20.49% 21.02% 37.48%
16.62% 25.61% 16.65% 41.12%
Other
developing
countries 10.22% 17.05% 19.64% 53.39% 9.76% 17.20% 19.28% 53.98% 9.57% 17.48% 19.17% 53.95% 9.52% 17.27% 18.32% 55.06% 8.87% 16.21% 16.29% 58.75%

10
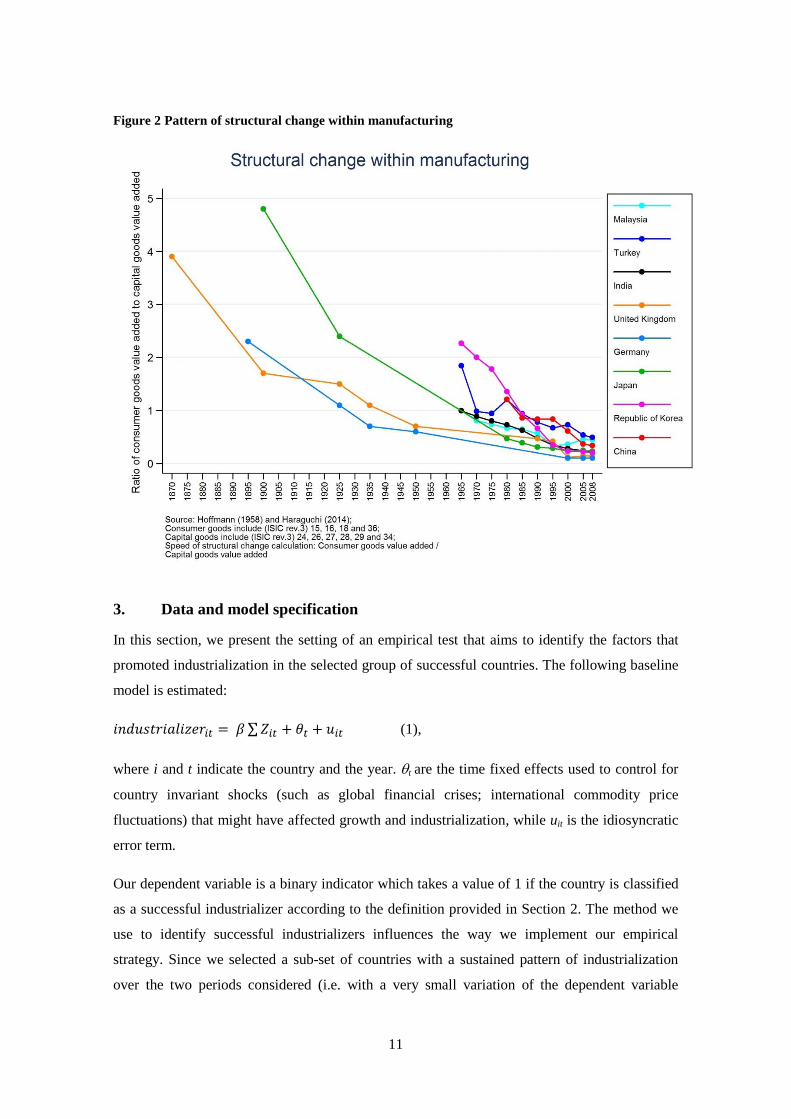
Aside from economy-wide structural change, Hoffmann (1958) empirically showed that
successful industrialization was accompanied by structural change within manufacturing. In his
analysis on industrial development of advanced countries, he illustrated that the value added
share of consumer goods industries declined while the share of capital goods increased as
industrialization proceeded in those countries.4
Figure 2 presents structural change within manufacturing and its speed (slope) based largely on
Hoffmann’s industry classification (Hoffmann, 1958).5 The Y axis represents the ratio of
consumer to capital goods value added. The smaller the ratio is, the more capital intensive the
manufacturing structure. The required value added data for the set of industries over the long
period of time are limited, especially for post-1990 successful industrializers. The figure
therefore only includes four countries from the pre-1990 group, one country (India) from the
post-1990 group, and the long-term trends of Germany, Japan and the UK for reference
purposes. The recently successful industrializers followed the trends of early industrializers and
changed their manufacturing structure by steadily increasing the contribution of capital goods
industries relative to that of the consumer goods industries to manufacturing value added. As
indicated by the slope of their curves, the speed of their structural change was much faster than
that of Germany and the UK. It only took around 40 years for the Republic of Korea to reduce
the ratio from 2 to the level commonly observed in industrialized countries, while it took the
UK and Germany more than 100 years and Japan around 70 years to achieve such
transformation.
5 In our analysis, consumer goods industries include food and beverages, wearing apparel, and furniture while capital
goods industries include chemicals, non-metallic minerals, fabricated metals, machinery and equipment, and motor
vehicles. Although Hoffmann’s classification included tobacco in the consumer goods industries and basic metals in
the capital goods industries, they were dropped here due to data limitation.
11
Figure 2 Pattern of structural change within manufacturing
3. Data and model specification
In this section, we present the setting of an empirical test that aims to identify the factors that
promoted industrialization in the selected group of successful countries. The following baseline
model is estimated:
𝑖𝑛𝑑𝑢𝑠𝑡𝑟𝑖𝑎𝑙𝑖𝑧𝑒𝑟𝑖𝑡 = 𝛽 ∑ 𝑍𝑖𝑡 + 𝜃𝑡 + 𝑢𝑖𝑡 (1),
where i and t indicate the country and the year. t are the time fixed effects used to control for
country invariant shocks (such as global financial crises; international commodity price
fluctuations) that might have affected growth and industrialization, while uit is the idiosyncratic
error term.
Our dependent variable is a binary indicator which takes a value of 1 if the country is classified
as a successful industrializer according to the definition provided in Section 2. The method we
use to identify successful industrializers influences the way we implement our empirical
strategy. Since we selected a sub-set of countries with a sustained pattern of industrialization
over the two periods considered (i.e. with a very small variation of the dependent variable

12
during each sub-period), the dummy takes a value of 1 for the entire sub-period of interest if the
country is in the group of successful industrializers. For example, while Indonesia and Oman
report a value of 1 for all 19 years of the period 1971-1990, the value for all the years included
in the 1991-2014 period is 0, as both countries were not classified as successful industrializers
in the second period. In view of this, our analysis uses the pooled dimension of the data
applying a standard probit estimator. The results should therefore be interpreted as the incidence
of each factor on the probability of belonging to the group of more successful industrializers in
any given period.
3.1 Control variables
In equation 1, Z is a vector of variables on which we base our main output (Table 5). Along the
lines of existing literature (Haraguchi, 2014; Chenery and Syrquin, 1975; Lin, 2012), these
variables refer to economic, demographic, institutional and policy-related factors that may have
affected the incidence of successful industrialization over the period of analysis. While these
variables cover a number of dimensions found in previous literature to matter for
industrialization, structural transformation and overall economic development (McMillan et al.,
2012; Hausman et al., 2005), data limitations, especially concerning the coverage of earlier
years and of some low-income economy, have affected the possibility to include additional
variables that might contribute to the identification of sustained patterns of industrialization.
The first control is the level of real GDP per capita (LGDP_PC), which is used to account for
cross-country differences in stages of development. Such differences may matter since countries
that start from lower levels of economic development have more probability to catch up with
more advanced countries and therefore, to undertake sustained patterns of industrialization.
Indeed, poorer countries are characterized by a higher productivity growth rate in their
manufacturing sector, which in turn promotes an unconditional convergence with the
technological frontier (Rodrik, 2013).
To control for the role of investment, we introduce the gross fixed capital formation (private and
public) on GDP (GFCF_GDP). Higher investments are expected to promote industrialization by
stimulating aggregate demand and boosting productive capacities (Weiss and Clara, 2016). As a
result, higher investments can play a key role in sustaining the development of the local
industry, fostering structural transformation and being a pre-requisite for long-term growth
(Cornia and Martorano, 2012).
Several growth theories also emphasize the crucial role of human capital. Endogenous growth
models assume that investment in human capital prevents returns to capital from falling and

13
contributes to an increase in capabilities for innovation and the adaptation of new technologies
(Romer, 1986). This is clearly relevant for industrialization. To capture this effect, we include a
variable representing human capital endowments measured by the average number of years of
education of the workforce (HC), derived from the Barro-Lee (2013) dataset.
We use information on the domestic credit to the private sector (as a percentage of GDP) to
control for the level of financial development (CREDIT). The nexus between financial
development and production goes back to Schumpeter, who claimed that well-functioning
financial institutions boost technological innovation by selecting and funding the winners, i.e.
entrepreneurs with high probabilities of implementing innovative processes and realizing
innovative products. There is a large body of literature that focuses on the role of financial
systems in promoting savings and investment decisions of individuals and firms, especially in
industries within the manufacturing sector (Rajan and Zingales, 1998).
Macroeconomic policies related to international openness and integration are also included,
since they can—directly or indirectly—affect the manufacturing sector’s development. First, we
include the real effective exchange rate (REER), which plays an important role in fostering the
productive sector, as discussed extensively in the literature (Rodrik, 2008). More specifically, a
stable and competitive exchange rate is expected to promote the growth of the tradable sector
(Martorano and Sanfilippo, 2015). A competitive exchange rate has been found to be more
protective of the nascent domestic manufacturing sector compared, for instance, to tariffs
(Helleiner, 2011), especially in countries that specialize in labour intensive industries. Second,
we also include an indicator of capital account openness (KAOPEN). Capital account can result
in both positive and negative spillovers to the domestic economy, and it has been managed
differently by developing countries over time. In a Solow growth model, opening to capital
inflows lowers interest rates and allows firms to borrow, thus raising their investment rates
(Chari et al., 2012). On the other hand, capital liberalization might lead to higher volatility and
economic instability (Cornia, 2005).
We also account for the countries’ institutional conditions. Stable institutions have been
identified as a key precondition for economic development, as well as a way to enable a good
business climate for the private sector (Alesina et al., 1992; Xu, 2010). We use the number of
consecutive years under the current regime type (Boix et al., 2014) as a proxy for political
stability (POL). The underlying idea is that a strong and stable government might ensure the
successful implementation of a long-term plan, which might be necessary to promote the
development of new industries.

14
To capture other important characteristics of the country, including their endowments, we add
the share of mineral rents as a percentage of GDP (NAT_RES). Greater reliance on natural
resources tends to increase cyclical fluctuations in national income and raises the probability of
negative performance in the long run (Rodriguez and Sachs, 1999). More specifically, Sachs
and Warner (2001) use the Dutch disease argument to point out the potential detrimental effects
of high natural resource rents on the development of the manufacturing sector.
Finally, factors related to geography can also impede industrialization. We add a dummy
accounting for each country’s access to the sea (LANDLOCKED). Landlocked countries have
fewer opportunities to be open to trade and to foster a successful process of industrialization
(Easterly and Levine, 2003). As such, geographic constraints hamper the ability of these
countries to increase productivity due to their limited access to large markets or their
opportunities to exploit economies of scale (Sachs and Warner, 1995).
Table 5 presents a description of the variables and their source. Table 6 provides descriptive
statistics for the entire sample disaggregated by period. The means of the two sub-periods do
not differ significantly. This might be understood as an indication of similarities among
countries’ policies and characteristics over the two sub-periods. The only exceptions are
represented by the variables measuring openness-related policies (REER and KAOPEN), which
reflect a different international trend as regards trade and financial liberalization policies.
Moreover, the level of domestic credit to the private sector increased following the process of
internal liberalization while the stability of the political regime has decreased.

15
Table 5 Variable description
Variable Description source
LGDP_PC level of real GDP per capita UNIDO
GFCF_GDP gross fixed capital formation (both private and public) on GDP UNIDO
CREDIT domestic credit to private sector (as a percentage of GDP)
World
Development
Indicators
database
REER real effective exchange rate Darvas6
KAOPEN indicator of capital account openness Chinn and Ito
(2008)
HC the average numbers of years of education of the workforce Barro and Lee
(2013)
POL the number of consecutive years of the current regime type Boix et al. (2014)
NAT_RES the share of mineral rents as percentage of GDP
World
Development
Indicators
database
LANDLOCKED dummy accounting for each country’s access to the sea CEPII
Table 6 Descriptive statistics on the overall period and the two sub-periods
<1991 >=1991
Variable Obs Mean Std. Dev. Min Max Mean Std. Dev. Mean Std. Dev.
MVA_GROWTH 4607 0.05 0.34 -0.95 18.14
0.05 0.14 0.05 0.44
LGDP_PC 4734 7.02 1.11 4.03 9.68
7.00 1.16 7.04 1.07
GFCF_GDP 4689 0.22 0.12 0.01 1.59
0.22 0.14 0.22 0.10
CREDIT 3849 25.69 23.85 0 166.5
23.33 17.3 27.23 27.17
REER 4106 150.09 892.56 0.38 56273.63
207.14 1363.15 107.71 66.47
KAOPEN 4058 -0.51 1.3 -1.89 2.39
-0.78 1.15 -0.31 1.36
HC 4213 5.41 2.7 -0.7 11.87
4.64 2.67 6.17 2.51
POL 3975 37.53 46.75 1 211
41.18 51.02 34.06 42.01
NAT_RES 3900 1.46 4.06 0 44.64
1.49 3.96 1.44 4.13
LANDLOCKED 5067 0.27 0.44 0 1
0.26 0.44 0.27 0.44
6 http://bruegel.org/publications/datasets/real-effective-exchange-rates-for-178-countries-a-new-database/

16
Table 7 reports a disaggregation of previous statistics distinguishing between the groups of
successful industrializers and the rest of the countries, for the entire period as well as for both
sub-periods separately. In nearly all cases, the mean values are statistically different, which is
promising in view of the multivariate analysis. A preliminary assessment of such differences
seems to indicate that the group of successful industrializers are, on average—and
independently of the period considered—characterized by lower income; higher investments,
access to credit and institutional stability, as well as by a lower dependence on natural resource
rents and more competitive exchange rates. Other variables, such as capital openness and
education, show less obvious differences.
Table 7 Means comparison between successful industrializers and other countries
All Countries Rest of countries Industrializers
Period Variable Mean Std. Dev. Mean Std. Dev. Mean Std. Dev. diff
MVA_GROWTH 0.05 0.01
0.04 0.01 0.11 0.00 -0.07
1970 - 2014 LGDP_PC 7.02 0.02
7.03 0.02 6.85 0.06 0.18
GFCF_GDP 0.22 0.00
0.22 0.00 0.25 0.01 -0.03
CREDIT 25.69 0.38
24.88 0.38 36.28 1.92 -11.40
REER 150.01 13.90
151.85 14.73 119.34 2.75 32.51
KAOPEN -0.51 0.02
-0.51 0.02 -0.47 0.08 -0.04
HC 5.39 0.04
5.42 0.04 5.02 0.10 0.40
POL 37.45 0.74
36.20 0.73 58.78 4.61 -22.58
NAT_RES 1.46 0.06
1.51 0.07 0.67 0.14 0.84
LANDLOCKED 0.27 0.01
0.28 0.01 0.08 0.02 0.20
All Countries Rest of countries Industrializers
Period Variable Mean Std. Dev. Mean Std. Dev. Mean Std. Dev. diff
MVA_GROWTH 0.05 0.03
0.04 0.00 0.12 0.01 -0.08
1970 - 1990 LGDP_PC 7.00 0.03
6.96 0.03 7.71 0.08 -0.75
GFCF_GDP 0.22 0.00
0.22 0.00 0.23 0.01 -0.01
CREDIT 23.33 0.44
22.50 0.45 33.65 1.92 -11.15
REER 207.31 32.68
211.77 34.72 136.29 5.63 75.48
KAOPEN -0.78 0.03
-0.87 0.03 0.41 0.13 -1.28
HC 4.61 0.06
4.59 0.06 4.94 0.19 -0.35
POL 41.19 1.17
40.47 1.17 52.73 6.60 -12.26
NAT_RES 1.50 0.10
1.59 0.11 0.23 0.03 1.36
LANDLOCKED 0.26 0.01
0.27 0.01 0 0 0.27
All Countries Rest of countries
Industrializers

17
Period Variable Mean Std. Dev. Mean Std. Dev. Mean Std. Dev. Diff
MVA_GROWTH 0.05 0.01
0.05 0.01 0.10 0.00 -0.05
1991 - 2014 LGDP_PC 7.04 0.02
7.09 0.02 6.20 0.06 0.89
GFCF_GDP 0.22 0.00
0.22 0.00 0.26 0.01 -0.04
CREDIT 27.23 0.56
26.42 0.56 38.16 2.98 -11.74
REER 107.83 1.37
107.94 1.44 105.91 1.18 2.03
KAOPEN -0.31 0.03
-0.25 0.03 -1.08 0.06 0.83
HC 6.17 0.05
6.27 0.06 5.07 0.10 1.20
POL 33.94 0.93
32.19 0.89 65.06 6.40 -32.87
NAT_RES 1.43 0.09
1.46 0.09 1.08 0.25 0.38
LANDLOCKED 0.27 0.01
0.28 0.01 0.14 0.02 0.14
Note: Means in bold are statistically significant at 5 per cent.
4. Regression results
Table 8 presents the main output of our analysis, in which the variables described in the
previous section are regressed against a dummy variable identifying the successful
industrializers vis-à-vis other countries in our sample, for both the entire period (Column 1), and
the two sub-periods (pre- and post-1990, Columns 2 and 3, respectively).
The coefficient related to the level of real GDP per capita is negative and statistically
significant. This result seems consistent with standard patterns of structural transformation
identified in previous studies (Timmer et al., 2013), and confirms that countries that
experienced a prolonged period of high MVA growth are generally those at earlier stages of
economic development. Note that this pattern is consistent across the different time periods.
Though this might seem to contradict the trend of “premature de-industrialization” in the most
recent period as highlighted by Rodrik (2016), it does not seem to be an issue here considering
that the successful industrializers in the post-1990 period include countries (all Asian) that have
not been affected by this trend.

18
Table 8 Results – Determinants of industrialization periods
(1) (2) (3)
VARIABLES Whole
period Pre_1990 Post_1990
LGDP_PC -0.444*** -0.190** -1.701***
[0.058] [0.087] [0.181]
GFCF_GDP 1.104*** -0.416 6.455***
[0.263] [0.325] [0.810]
CREDIT 0.012*** 0.010** 0.024***
[0.001] [0.004] [0.003]
REER -0.006*** -0.005*** -0.005*
[0.001] [0.001] [0.003]
KAOPEN -0.055 0.239*** -1.011***
[0.035] [0.045] [0.181]
HC 0.062*** 0.084* 0.105***
[0.022] [0.045] [0.028]
POL 0.002*** -0.002 0.008***
[0.001] [0.002] [0.002]
NAT_RES -0.041** -0.369*** -0.014
[0.017] [0.066] [0.017]
LANDLOCKED -0.528***
-0.752***
[0.115]
[0.220]
Constant 1.839*** 0.729 5.847***
[0.455] [0.604] [1.041]
Observations 2,745 998 1,491
Robust standard errors in brackets *** p<0.01, ** p<0.05, * p<0.1
Second, Table 8 shows that investment was an important factor in the industrialization process
over the period of analysis. Yet, there are some differences when looking at the two periods.
While investment was a key ingredient in explaining the successful process of industrialization
in the post-1990 period, our analysis indicates that it was less important in promoting
industrialization in the pre-1990 period. One potential explanation is the characteristics of the
countries considered and the models of specialization followed over time. While development in
the first wave of industrializers was mostly attributable to labour intensive industries requiring
lower shares of fixed assets, and the pre-1990 period is characterized by low FDI inflows (in
turn, an important component of GFCF, Amighini et al., 2017), investment played a key role in

19
the process of development in countries such as China, India, Laos and Viet Nam. These trends
are illustrated in Figure 3. While the figure depicts a strong positive relationship between
investments and industrialization over time, it also shows that over the period 1991–2014,
successful industrializers represent a cluster reporting above average levels of investment
compared to the rest of the countries included.
Figure 3 MVA growth and GFCF_GDP
1970 – 1990 1991 – 2014
Source: Authors’ elaboration of UN National Accounts Statistics
Our results also show that human capital endowments, measured by the number of years of
education, are among the key factors contributing to a sustained process of rapid
industrialization. This result is in line with our expectations. Countries that experienced rapid
industrialization, such as the early Asian Tigers (and, most notably, the Republic of Korea) or
most recently China, invested in human capital to fuel the increasing demand from expanding
industries, as well as by upgrading the labour force’s skills as soon as the industries moved up
the value chain (Jankowska et al., 2013).
The level of credit to the private sector is an additional factor that may explain the good
performance recorded by successful industrializers. Indeed, credit constraints hamper firms
from exploiting investment opportunities (Levine, 2005). This is especially true in low income
settings in which the economy operates in a suboptimal equilibrium (Banerjee and Newman,
1993; Aghion and Bolton, 1997). Moreover, in case of macroeconomic shocks, this also affects
the innovation process and long-term growth (Aghion et al., 2004). Easier access to finance
represents an important pre-requisite for firms to expand and for industry to grow quickly.
Indonesia
Malaysia
Oman
Republic of Korea
Thailand
Turkey
0
.05
.1.1
5.2
(mea
n)
mva
_g
row
th
0 .2 .4 .6 .8 1(mean) gfcf_gdp
Bangladesh
Cambodia
China
India
Laos
Myanmar
Viet Nam
-.0
5
0
.05
.1.1
5
(mea
n)
mva
_g
row
th
0 .1 .2 .3 .4(mean) gfcf_gdp
20
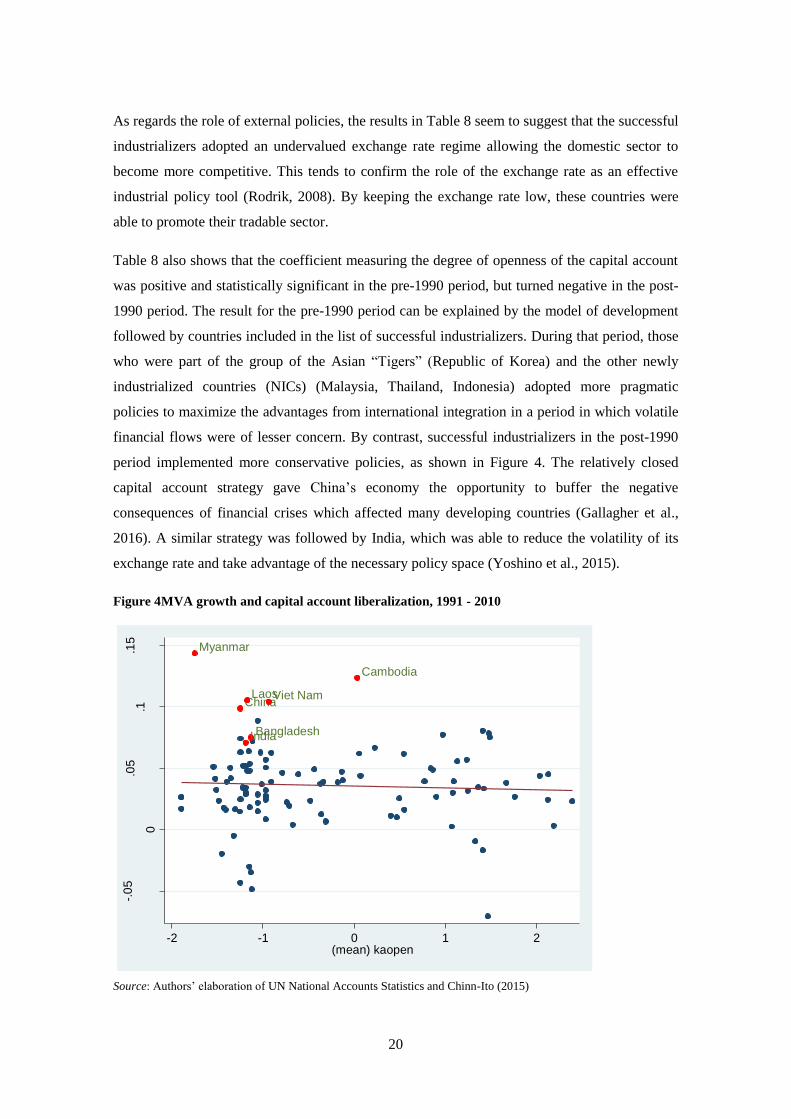
As regards the role of external policies, the results in Table 8 seem to suggest that the successful
industrializers adopted an undervalued exchange rate regime allowing the domestic sector to
become more competitive. This tends to confirm the role of the exchange rate as an effective
industrial policy tool (Rodrik, 2008). By keeping the exchange rate low, these countries were
able to promote their tradable sector.
Table 8 also shows that the coefficient measuring the degree of openness of the capital account
was positive and statistically significant in the pre-1990 period, but turned negative in the post-
1990 period. The result for the pre-1990 period can be explained by the model of development
followed by countries included in the list of successful industrializers. During that period, those
who were part of the group of the Asian “Tigers” (Republic of Korea) and the other newly
industrialized countries (NICs) (Malaysia, Thailand, Indonesia) adopted more pragmatic
policies to maximize the advantages from international integration in a period in which volatile
financial flows were of lesser concern. By contrast, successful industrializers in the post-1990
period implemented more conservative policies, as shown in Figure 4. The relatively closed
capital account strategy gave China’s economy the opportunity to buffer the negative
consequences of financial crises which affected many developing countries (Gallagher et al.,
2016). A similar strategy was followed by India, which was able to reduce the volatility of its
exchange rate and take advantage of the necessary policy space (Yoshino et al., 2015).
Figure 4 MVA growth and capital account liberalization, 1991 - 2010
Source: Authors’ elaboration of UN National Accounts Statistics and Chinn-Ito (2015)
Bangladesh
Cambodia
China
India
Laos
Myanmar
Viet Nam
-.0
5
0
.05
.1.1
5
(mea
n)
mva_
gro
wth
-2 -1 0 1 2(mean) kaopen

21
Crucially, our results confirm the role of political stability as a driver of sustained
industrialization. Higher stability provides the right environment to promote investments and is
a necessary precondition for economic development. Finally, we show that geographic
characteristics and countries’ endowments play a role as well. Geographic remoteness
represents a major constraint to the development of a strong industrial sector due to the
difficulty of achieving economies of scale caused by high transport costs. Column (3) shows
that geographic characteristics also played a role in the period between 1991 and 2014. Indeed,
all countries included in the list of successful industrializers has access to the sea. The only
exception is Laos. By contrast, the dummy accounting for each country’s access to the sea is
omitted in the analysis for the period 1970 to 1990 due to the lack of landlocked countries in the
list of successful industrializers.
On the other hand, however, we find that the probability of a country to initiate a rapid and
sustained process of rapid industrialization reduces, the higher the dependence on natural
resources, whose curse may crowd-out the local industry through an increase in the price of
domestic factors.
4.1 Additional specifications
In this section, we provide a set of additional specifications and robustness checks in which we
take potentially relevant dimensions into account, which have not been included in our core
regressions due to (a) their high correlation/substitution with some of the key variables in (1);
and (b) the lack of a sufficient number of observations, especially for earlier periods and for
some lower income countries. Table 9 reports a first set of such variables.

Table 9 Determinants of industrialization episodes
(1) (2) (3) (4) (5) (6) (7) (8) (9) (10)
LGDP_PC -0.492*** 0.053 -0.691*** -0.586*** -2.713*** -2.724*** -0.298*** -0.364*** -0.424*** -0.516***
[0.065] [0.086] [0.072] [0.068] [0.447] [0.448] [0.072] [0.053] [0.047] [0.057]
GFCF_GDP
0.388 2.097*** 4.164*** 21.958*** 21.986*** 1.319*** 1.121*** 1.561*** 1.365***
[0.308] [0.377] [0.922] [3.570] [3.579] [0.288] [0.251] [0.279] [0.263]
CREDIT 0.010*** 0.019*** 0.014*** 0.003 0.045*** 0.045*** 0.012*** 0.003** 0.014*** 0.012***
[0.001] [0.002] [0.002] [0.002] [0.008] [0.008] [0.002] [0.001] [0.002] [0.001]
REER -0.006*** -0.011*** -0.009*** -0.010*** 0.007 0.007 -0.006*** -0.004*** -0.005*** -0.006***
[0.001] [0.002] [0.002] [0.002] [0.005] [0.005] [0.001] [0.001] [0.001] [0.001]
KAOPEN -0.074** 0.093** -0.133*** 0.125** -0.220** -0.222** -0.002 0.037 -0.026 -0.070*
[0.035] [0.042] [0.049] [0.049] [0.097] [0.098] [0.037] [0.032] [0.036] [0.037]
HC 0.056*** 0.046 0.062*** -0.130*** 0.208*** 0.208*** -0.011
0.090***
[0.021] [0.039] [0.022] [0.032] [0.065] [0.065] [0.018]
[0.019]
POL 0.002*** 0.004*** 0.001 -0.004*** 0.007** 0.007** 0.002*** 0.004*** 0.001 0.002**
[0.001] [0.001] [0.001] [0.001] [0.003] [0.003] [0.001] [0.001] [0.001] [0.001]
NAT_RES -0.043** -0.166*** -0.012 -0.569*** -0.057* -0.056* -0.015 -0.032** -0.006 -0.038**
[0.019] [0.040] [0.010] [0.109] [0.034] [0.034] [0.010] [0.016] [0.011] [0.016]
LANDLOCKED -0.669***
-0.450***
-0.951*** -0.957*** -0.582*** -0.399*** -0.560*** -0.520***
[0.121]
[0.132]
[0.335] [0.333] [0.125] [0.115] [0.130] [0.118]
GOV_INV 3.028***
[0.714]
PRIV_INV 2.591***
[0.587]
LWAGE_OC
-0.860***
[0.087]
LEND_RATE
-0.018***
[0.006]
PATENTS
0.323***

[0.035]
TARIFFS
-0.014
[0.018]
TARIFFS M
-0.014
[0.017]
I_DEBT
-0.228***
[0.033]
AGE_DEP
-0.026***
[0.003]
GINI
-5.763***
[0.405]
RELIGION
-0.730***
[0.168]
Constant 1.993*** 5.864*** 0.108 2.645*** 4.288** 4.323** 1.079** 3.619*** 4.433*** 2.523***
[0.472] [0.778] [0.620] [0.757] [1.876] [1.878] [0.521] [0.628] [0.550] [0.500]
Observations 2,617 1,354 1,785 1,233 736 736 2,426 3,072 2,944 2,745

24
In Column 1, we replace the investment variable with two new variables derived from the IMF
and differentiate between public and private investment. This may be of relevance, since the
government plays a key role in providing basic infrastructures that are necessary to promote the
process of industrialization. Recent contributions emphasize the potential role public investment
can play in terms of risk-taking, fostering technological development and innovation
(Mazzucato, 2011). Existing evidence also shows that in some of the successful cases of
industrialization, such as in the Republic of Korea, public investment has been crucial for
creating pecuniary externalities without crowding-out private investments (Vos, 1982; Storm,
2017). Table 9 confirms these assumptions and shows that private investment on its own has a
positive and significant role in promoting industrialization. Still, after computing the average
marginal effect, we find that the coefficient is slightly higher in the case of public investment
compared to private investment (0.332 and 0.284, respectively).
In Column 2, we consider the cost of labour. We do this by comparing countries according to
their level of real wages per worker. Finding this information across a wide range of developing
countries and over such a long time period is difficult. We therefore rely on information
provided in related works by Lavopa (2015) and Haraguchi et al. (2017), which collects data on
the shares of manufacturing wages in total and on the total number of persons employed in
manufacturing, which we have merged to calculate an indicator of labour costs per worker.
Including this variable in our model slightly reduces the number of observations, but does not
affect the main results. Crucially, it reveals another characteristic of successful industrializers,
namely their relatively lower labour cost (due, for instance, to an abundant labour force like in
China or Bangladesh) that has given them a competitive edge in building low-value added
specializations from which to kick-start their process of industrialization.
In Column 3, we introduce the lending interest rate (in %) which represents the bank rate for
meeting the financing needs of the private sector.7 The coefficient is negative and statistically
significant. This confirms the key role monetary policy plays in the process of industrialization,
demonstrating that higher interest rates can have adverse effects on manufacturing firms by
raising the cost of borrowing and thereby reducing their investments (Stiglitz, 2017).
In Column 4, we introduce a variable reporting the number of patent applications, which is a
proxy for countries’ innovation potential. There is a wealth of literature on the link between the
innovative capacity of a country, the ability to build national innovation systems and the
sustainability of their industrialization (Nelson and Winter, 2009). In fact, our results indicate
7 More information is available at http://data.worldbank.org/indicator/FR.INR.LEND.

25
that being innovative is positively correlated with the probability of being a successful
industrializer.
In Columns 5 and 6, we include information on trade policies, namely the average rates of
applied tariffs, calculated for all goods and the manufacturing industries. Though the literature
shows that tariffs are often used as an industrial policy tool, especially to protect infant industry
(Storm, 2017), we only find weak evidence for this. The two coefficients are in fact negative,
but both are not statistically significant and the number of observations drops consistently due
to the lack of coverage of many years and countries. The result may also highlight the
heterogeneity among countries, since tariffs are used differently according to distinctive
domestic conditions and periods, i.e. tariffs are less compelling for labour-abundant than for
labour-scarce countries (the latter being those countries that are more likely to adopt import
substitution policies, see O’Rourke and Williamson, 2017).
In Column 7, we introduce a variable for the interest payments on external debt (% of GNI) as a
proxy for macroeconomic stability (I_DEBT). Although the macroeconomic environment is not
a sufficient condition to promote industrialization, it is a necessary condition to provide a better
playing field and favouring domestic and foreign investments (Rodrik, 2006). Results in Table 9
confirm these expectations, showing that countries that experienced sustained industrialization
over both periods considered were also those with a lower cost on their debt, and were therefore
more likely to free resources to foster economic growth, including through industrialization.
As industrialization is a process characterized by its potential to promote inclusiveness and
broader participation of a large number of people in new opportunities in the manufacturing
sector, it is likely that demographic variables may explain certain patterns as well. Column 8
presents the results of our main specifications, including a coefficient measuring the age
dependency ratio (% of working age population) and a proxy for the supply side (AGE_DEP).8
The coefficient that measures the age dependency ratio is negative and statistically significant;
this is consistent across periods. This adds an important point to our investigation of factors
shaping sustained industrialization, i.e. the industries in countries with ‘demographic windows’
are more likely to experience high growth. In fact, demographic effects played a key role in East
Asia’s economic “miracle” (Bloom and Williamson, 1998; Bloom et al., 2000). Another notable
example is China, whose pattern of industrialization has followed the prediction of Lewis,
exploiting the large availability of young (mostly unskilled) workers moving from the rural to
urban areas to fuel the manufacturing sector’s development (Yao, 2011).
8 Importantly, this model specification does not include the variable on education due its high correlation (-0.75) with
the age dependency ratio.

26
In Column 9, we include information on inequality. On the one hand, high disparities push
many people into low-wage jobs, hampering the development of domestic markets and the
process of industrialization (Murphy et al., 1989). On the other hand, high inequality tends to
reduce the effectiveness of policies due to the high dependence of institutions on class-based
power structures. This was the case of Latin American countries where “the state’s lack of
relative autonomy precluded certain policies from being pursued” (Jenkins, 1991: 201). Our
results seem to confirm the view that high inequality tends to be harmful for the process of
industrialization, with countries that experienced fast MVA growth being among the less
unequal in their group.
Finally, in Column 10, we introduce an index of religion fractionalization (REL) to account for
social stability.9 A large strand of literature argues that less fractionalization and more social
networks may promote civic engagement and contribute to industrialization (Putnam et al.,
1993; Knack and Keefer, 1997; Narayan and Pritchett, 1999). By contrast, a more fractionalized
society is expected to be less cohesive and hence less able to join forces, and moreover
contributes less to the development of local industries. Indeed, our results seem to confirm the
above-mentioned arguments, demonstrating that a more cohesive society is on average more
likely to undertake prolonged periods of high industrialization.
4.2 Robustness checks
This section introduces some additional analyses to control for the robustness of our results.
A first robustness test is carried out on the methodology. Our dependent variable, measuring the
successful periods of MVA growth for a relatively small group of countries (6 or 7 for each sub-
period) could, in principle, be affected by the so-called “rare events” bias. Such a bias,
commonly known as a “small sample bias”, is higher the smaller the number of cases in the less
frequent of the two events, and could affect the maximum likelihood estimation of a model such
as a standard probit or logit. An alternative method consists of estimating the model through
penalized likelihood. Penalized likelihood is a general approach to reducing a small sample bias
in a maximum likelihood estimation (Firth, 1993)10
. Table A1 in the Appendix replicates our
core estimation (as reported in Table 7) using a penalized likelihood estimator. We do not find
any major differences, thus reducing any potential concerns about the small size of our selected
sample of successful industrializers.
9 This index measures the probability that two randomly selected individuals from a given country will belong to a
different religious group. 10 We do this by means of the user-written STATA command firthlogit (Coveney, 2015)

27
Second, our selection of samples used for the analysis might be questioned. One could argue for
instance that the characteristics that seem to be peculiar to the sub-group of successful
industrializers may be common to other industrializers as well, this being particularly true for
those countries reporting high levels of MVA growth but do not have a sustained pattern of
growth (i.e. those countries reported in Table 2). To deal with this issue, we compare the
successful industrializers with the sub-group of other industrializers only (i.e. those countries
included in Table 2, but that are not selected among the successful industrializers). The results,
reported in Table A2 in the Appendix, appear consistent with the previous ones (except for the
investment variable), and seem to strengthen our findings by showing that the characteristics
discussed above appear unique to the smaller group of industrializers.
Third, the choice of variable on which we based the selection of successful industrializers may
be challenged as well. To some extent, periods of high growth of total MVA could be linked to
more general periods of sustained economic growth, which could raise the question about an
industrial take-off. One might argue that an additional condition for determining successful
industrialization is a high rate of MVA on GDP (see also Table 4), an indicator that can separate
the growth of manufacturing from a possible link to overall economic growth11
. To check the
robustness of our results, we follow a similar procedure to that described in Section 2, but use
the rate of growth of the MVA on GDP ratio. We can thereby adjust the list reported in Table 3
by excluding those countries that have not been listed among the successful industrializers
based on the new criteria. While no substantial differences were visible during the pre-1990
period, a more precise selection was made for the post-1990 period, since countries like China,
Cambodia, India and Laos were excluded, considering the high growth experienced by these
economies over the last decades. We then run our estimates on the adjusted samples. The
results, reported in Table A3 in the Appendix, confirm once again the robustness of our key
findings. Two striking differences emerge and—unsurprisingly—both relate to the post-1990
sample. First, the coefficient of political stability turns negative and significant. Such a negative
coefficient might be explained by the decrease in the number of countries with long lasting
regimes (China, Cambodia and India), whereas the sample of successful industrializers mostly
includes countries that have recently experienced political transitions, such as Bangladesh,
Myanmar and Viet Nam. Second, the coefficient of the exchange rate now turns positive and
significant. Still, the adoption of a pegged regime or the dollarization strategy might be a proper
11 For instance, Uganda’s MVA growth rate was higher than 5 per cent over the period 2004 – 2011, while in
Equatorial Guinea, it was even higher (around 15 per cent in 2007, 2008 and 2009). However, in both cases, the
MVA growth rate was lower than the GDP growth rate. As a result, the growth rate of the MVA/GDP variable
decreased, signalling a reduction in the importance of the manufacturing sector in these economies.

28
solution for small economies with less diversified exports and highly volatile terms of trade
(Cornia, 2012).
5. Conclusions and policy implications
Industrialization is one of the key elements of long-term economic growth. Due to the
manufacturing sector’s capacity to absorb workforce, enhance diversification and structural
transformation, while spurring the growth of other sectors through linkages, it remains essential
for many developing countries to promote their own industrialization. What countries can do to
initiate a sustained process of strong industrialization, especially laggard countries (such as
SSA, see Newman et al., 2016), remains a crucial question and lies at the core of national and
international policymakers’ agendas.
In this study, we explored whether it is possible to identify some factors that are common to
countries that have been able to initiate a strong and sustained process of industrialization over
the last decades. We considered two different periods, 1970-1990 and 1991-2014, which were
likely to be affected by different patterns of industrialization due to significant political,
technological and organizational changes. We then developed a simple methodology to identify
a small group of countries for each period, which have shown a pattern of industrialization that
is not only remarkable in absolute terms, but also sustained (i.e. occurring over a long-time
span). Using these selected groups of countries (mostly made up of East Asian economies), we
ran a multivariate analysis with the objective of identifying the key characteristics of their
exceptional industrialization pattern.
The results of our analysis have several important implications for countries with a
manufacturing sector that does not yet make a noteworthy contribution to value added.
First, industrialization is driven by a combination of factors, including initial economic
conditions, factor endowments, as well as country characteristics such as demographic structure
and geography. Countries that are more likely to embark on a path of sustained industrialization
are usually those with a lower level of income per capita, and are thus more likely to still be
specialized in industries with low productivity growth, a fact that is consistent with basic
theories of structural transformation. Other country-specific factors we have found to drive
industrialization are demographics and geographic conditions. The former is particularly
relevant since it shows that over time, countries that industrialized were those that benefited
from ‘demographic windows’ (as was the case in East Asian countries, see Bloom and
Williamson, 1998).
29
Factor endowments clearly play a key role, since they affect a country’s comparative advantage
and its pattern of development (Lin, 2011; Wood, 2017). Despite being constrained by data
limitations, we show that industrialization is more likely to be successful in countries with low
labour costs, and less likely in resource rich economies. This is consistent with the pattern of
redistribution of manufacturing output and employment towards some developing regions
recently described by Wood (2017), who attributes this pattern to the availability of the low-
skilled (and hence cheaper in relative terms) labour force in most East Asian countries. The
wearing apparel industry, for example, which is usually one of the major manufacturing
industries for low and lower middle income countries in terms of value added and employment,
is labour intensive in nature. The difficulty of substituting capital for labour in this industry
makes it challenging to increase labour productivity. Consequently, the main source of
competitiveness for the wearing apparel industry comes from a low wage level. This explains
why the majority of countries cannot sustain the growth of the wearing apparel industry once
their GDP per capita reaches an upper middle income level (Haraguchi, 2015). It also
underscores the importance of structural change within manufacturing or upgrading to sustain
the process of industrialization (see Figure 2). At the same time, once industrialization has
started, maintaining low wages can have a negative effect on the sustainability of the
industrialization process, thus affecting the domestic market’s growth.
Furthermore, our work reveals that governments have a number of instruments at their disposal
to promote industrialization and embark on a path of sustainable development.
Our analysis highlights that investment—both in terms of physical and human capital—is one
of the most relevant factors in explaining industrialization. Investment in physical capital is
particularly crucial in increasing local production capacity. Our analysis shows that this
relationship holds for both publicly and privately funded capital. Public investment, in
particular, could be key in providing positive externalities to the private sector and in reducing
potential bottlenecks on the supply side (Storm, 2017). In fact, in the majority of countries
included in our group of successful industrializers, public investment played a key role by
crowding-in private investments, such as in the Republic of Korea early on or in China more
recently.
Similarly, investments in the provision of a well-trained labour force are essential in ensuring
that the industrialization process is sustainable, since it allows an upgrade of local capabilities
and skills and facilitates the process of structural transformation. Countries that experienced
rapid industrialization and grew successfully over time through more advanced specializations

30
within manufacturing, such as the early Asian Tigers, have invested large amounts in human
capital formation to fuel rapid demand from the expanding industries.
Another area of major policy relevance is access to credit, a necessary factor to ease the growth
of firms and industries by increasing their investment opportunities (Rajan and Zingales, 1998).
Given that access to capital represents a major constraint to growth in many developing
countries, it is of utmost importance to develop a well-designed financial system with a
capillary network of financial institutions accessible to private actors both in rural and urban
areas, granting easier access to finance to firms and individuals (Lin, 2011).
The above mentioned conditions would have little effect in small domestic markets or in the
absence of a stable economic and institutional setting. Our study points out that high inequality
may hamper the process of industrialization since it has negative consequences, among others,
on the size of the domestic market. In turn, industrial upgrading and an increase in the
complexity of the industrial structure tend to be accompanied by decreases in income inequality
due to the coevolution of more inclusive institutions, education system and production networks
(Hartmann et al., 2017). Policies still play a central role in stimulating the redistribution of
income, which may boost domestic demand since low-income groups tend to have a higher
propensity to consume. This is consistent with recent arguments about the significance of
industrial policies, not only to adjust market failures, but also to favour higher income equality
(Stiglitz, 2017).
We also show that countries that achieved sustained industrialization were largely those that
have both macroeconomic—namely a lower degree of indebtedness—and high levels of
political and social stability. Both dimensions contribute to the creation of a sound investment
climate, which in turn needs to build on high institutional stability. These are dimensions that
have strongly characterized the rise of emerging economies in East Asia over the last decades
and in which substantial policy efforts are being undertaken in other low-income economies
(Newman et al., 2016).
Finally, our results provide important recommendations about the role of external policies.
More specifically, our analysis seems to confirm arguments about policy selectivity in trade and
capital flows can largely affect industrial development in developing countries (Lall, 1993; Lin,
2011). In this respect, our work again emphasizes the role of the exchange rate as an effective
industrial policy tool. Successful industrializers adopted a more competitive exchange rate
regime allowing the domestic sector to become more competitive internationally. At the same
time, a competitive exchange rate might be more protective for the nascent domestic

31
manufacturing sector than tariffs. This seems especially true for larger countries, such as China
and India, who have broadened their industrial sector by keeping the exchange rate competitive
(Rodrik, 2006). Still, it has to be noted also that in smaller economies with less diversified
exports and highly volatile terms of trade, a pegged regime or the dollarization strategy might
be a better strategy to reduce transaction costs, assure price stability and increase policy
credibility (Frankel, 1999).
Our study also depicts the crucial responsibility governments assume to develop policies that
are effective under different circumstances and in different periods. The openness of the capital
account, for instance, deserves special attention considering the different types of capital (e.g.
short vs. long-term), the direction of capital flows and their potential consequences in terms of
economic stability. The most recent group of rapid industrializers, such as China and India,
have followed more conservative strategies or a gradual process of capital account liberalization
to reduce the volatility of their exchange rates while leaving margins to pursue economic
adjustments.
Finally, policies tend to interact with one another. Consequently, the effect of single measures
should be considered in combination with other policy instruments since the effectiveness of the
policy mix seems to depend on the policy’s overall coherence and coordination. This, for
example, means that the adoption of a competitive exchange rate regime may require
interventions in the currency market and the introduction of capital controls as well as
countercyclical fiscal and monetary policies.
To sum up, our work shows that both factor endowments and policies may play a key role in the
process of industrialization and, consequently, for the economic development of nations. The
factors characterizing the selected group of countries analysed in our study show that there are
some common features that appear relevant to the process of industrialization of different
countries across different periods. Some of the factors discussed above may provide useful
recommendations to promote sustained industrialization in developing countries. Yet, the cases
analysed here remain largely confined to the experiences of a selected group of countries based
mostly in East Asia. There is no unique model of industrial policy or of public intervention to
promote industrialization, not even within the group of East Asian countries, with cases such as
the Republic of Korea earlier on or China and Viet Nam more recently indicating remarkable
differences. No one-size-fits-all solution exists and specific policies will therefore have to be
implemented to reflect the different sizes, economic specializations, levels of development and
countries’ institutions.

32
References
Aghion, P., Bolton, P. (1997). A trickle-down theory of growth and development with debt
overhang, Review of Economic Studies 64, 151–172.
Aghion, P., Angeletos, M., Banerjee, A., Manova, K. (2004).Volatility and growth: The role of
financial development, Mimeo. Department of Economics, Harvard University.
Aghion, P., Boulanger, J., Cohen, E. (2011). Rethinking Industrial Policy, Bruegel Policy Brief,
04/2011.
Aizenman, J., Lee, M. & Park, D. (2012). The Relationship between Structural Change and
Inequality: A Conceptual Overview with Special Reference to Developing Asia, ADBI
Working Paper Series N. 396
Alesina, A., S. Ozler, N. Roubini, P. Swagel (1992). Political Instability and Economic Growth,
NBER Working Paper N. 4173.
Amighini, A., McMillan, M. and Sanfilippo, M. (2017). FDI and Capital Formation in
Developing Economies: New Evidence from Industry-level Data, NBER WP N. 23049.
Arrow, K. J. (1962). The economic implications of learning by doing, The Review of Economic
Studies, 29(3), 155–173.
Banerjee, A., Newman, A. (1993). Occupational choice and the process of development,
Journal of Political Economy,101, 274–298
Barro, R. and J.-W. Lee (2013). A New Data Set of Educational Attainment in the World, 1950-
2010, Journal of Development Economics, 104: 184-198
Bloom, D. E., Williamson, J. G. (1998). Demographic transitions and economic miracles in
emerging Asia, World Bank Economic Review 12, 419–456.
Bloom, D. E., Canning, D., Malaney, P. (2000). Demographic change and economic growth in
Asia, Population and Development Review 26, 257–290.
Boix, C., Miller, K., Rosato, S. (2014), Boix-Miller-Rosato Dichotomous Coding of
Democracy, 1800-2010, doi:10.7910/DVN/28468, Harvard Dataverse, V1,
UNF:5:x3P4QDm6R349bpyygm/g1Q==
Cai, F. and Lu, Y. (2013) Population change and resulting slowdown in potential GDP growth
in China, China & World Economy 21(2): 1–14.
Cantore, N., Clara, M. and Soare, C. (2014) Manufacturing as an engine of growth: Which is
the best fuel? UNIDO Working Paper N 01/2014
Chenery, H., Syrquin, M. (1975). Patterns of development 1950-1970. New York, NY: Oxford
University Press.
Chari, A., Henry, P.B., & D. Sasson, D. (2012). Capital Market Integration and Wages,
American Economic Journal: Macroeconomics, 4(2), 102-32

33
Chinn, M. D., & Ito, H. (2008). A New Measure of Financial Openess, Journal of Comparative
Policy Analysis, 10 (3): 309 – 322.
Coveney, J. (2015). FIRTHLOGIT: Stata module to calculate bias reduction in logistic
regression, available at http://EconPapers.repec.org/RePEc:boc:bocode:s456948.
Cornia, G.A. (2012). The New Structuralist Macroeconomics and Income Inequality, Working
Papers Series wp 2012_25, Universita' degli Studi di Firenze, Dipartimento di Scienze
dell'Economia e Dell'Impresa.
Cornia, G. A., & Martorano, B. (2012). Development policies and income inequality: main
trends in selected developing regions, 1980-2010, UNCTAD Discussion Paper n 210.
Diao, X., McMillan, M. & Rodrik, D. (2017). The Recent Growth Boom in Developing
Economies: A Structural Change Perspective, NBER Working Paper N. 23132
Easterly, W., & Levine, R. (2003). Tropics, germs, and crops: how endowments influence
economic development, Journal of Monetary Economics, 50(1), 3-39.
Frankel, J. A. (1999). No single currency regime is right for all countries or at all times, NBER
Working Paper N. 7338.
Gallagher, K. P., Ocampo, J. A., Zhang, M., & Yu, Y. (2014). Capital account liberalization in
China: A cautionary tale, Global Economic Governance Initiative Policy Brief Issue 002,
July, Boston University, Boston.
Haraguchi, N. (2015). Patterns of structural change and manufacturing development. In J.
Weiss, & M. Tribe (Eds.), Routledge handbook of industry and development (pp. 38–64).
New York: Routledge.
Haraguchi, N. et al. (2017) The Importance of Manufacturing in Economic Development: Has
This Changed?, World Development, http://dx.doi.org/10.1016/j.worlddev.2016.12.013
Hartmann, D., Guevara, M.R., Jara-Figueroa, C., Aristarán, M. and Hidalgo, C.A. (2017).
Linking economic complexity, institutions and income inequality, World Development, 93:
75-93.
Hausmann, R., Pritchett, L. and Rodrik, D. (2005). Growth Accelerations, Journal of Economic
Growth, 10(4): 303-329.
Hausmann, R., Hwang, J. and Rodrik, D. (2007). What you Export Matters, Journal of
Economic Growth, 12 (1): 1-25.
Helleiner, G (2011). Trade, exchange rates and global poverty: policies for the poorest, Paper
presented at the conference in honour of Sir Richard Jolly, 17–19 November 2011, IDS.
Hidalgo, C.A., Klinger, B., Barabàsi, A.L. and Hausmann, R. (2007). The Product Space
Conditions the Development of Nations, Science, 317 (5837): 482-487.
Hirschman, A. (1958). The strategy of economic development. New Haven: Yale University.
Hoffmann, W. G. (1958). The Growth of Industrial Economics. London: Manchester University
Press.

34
Jankowska, A., Nagengast, A. & Perea, J. R. (2013). The Product Space and the Middle-Income Trap: Comparing Asian and Latin American Experience, OECD Development Centre Working Paper No. 311.
Jenkins, R. (1991). The Political Economy of Industrialization: A Comparison of Latin
American and East Asian Newly Industrializing Countries, Development and Change 22(2):
197–231
Knack, S., Keefer, P. (1997). Does social capital have an economic payoff? A cross-country
investigation, Quarterly Journal of Economics, 112:1251.
Lapova, A. (2015), Technology-Driven Structural Change and Inclusiveness- The role of
Manufacturing, Inclusive and Sustainable Industrial Development Working Paper Series
14/2015, UNIDO.
Levine, R. (2005). Finance and Growth: Theory and Evidence, Handbook of Economic Growth,
in: Philippe Aghion & Steven Durlauf (ed.), Handbook of Economic Growth, edition 1,
volume 1, chapter 12, pages 865-934 Elsevier.
Lewis, W. A. (1954). Economic development with unlimited supplies of labour. Manchester
School, 22(2), 139–191.
Lin, J.Y. (2012). New Structural Economics – A framework to re-thinking development and
policy, Washington, DC: the World Bank.
Martorano, B. & Sanfilippo, M. (2015). Structural change and wage inequality in the
manufacturing sector: long run evidence from East Asia, Oxford Development Studies,
43(2): 212-231.
Martorano, B., Park, D., Sanfilippo, M. (2016). Catching-up, structural transformation, and
inequality: industry-level evidence from Asia, Industrial and Corporate Change. doi:
10.1093/icc/dtw039
Mazzucato, M. (2011). The entrepreneurial state. Soundings, 49(49), 131-142.
McMillan, M., Rodrik, D. & Verduzco-Gallo, I. (2014). Globalization, Structural Change, and
Productivity Growth, with an Update on Africa, World Development, 63: 11-32.
Murphy, K. M., Shleifer, A., & Vishny, R. (1989). Income distribution, market size, and
industrialization. The Quarterly Journal of Economics, 104(3), 537-564.
Narayan, D., & Pritchett, L. (1999). Cents and Sociability: Household Income and Social
Capital in Rural Tanzania, Economic Development and Cultural Change 47:871-97.
Nelson, R.R. and Winter, S.G. (2009). An Evolutionary Theory of Economic Change, Harvard
University Press
Newman, C., Page, J., Rand, J., Shimeles, A., Soderbo, M. and Tarp. F. (Eds.) (2016)
Manufacturing Transformation Comparative Studies of Industrial Development in Africa
and Emerging Asia, Oxford: Oxford University Press.
Putnam, R. D., Leonardi, R. and Nanetti, R. (1993). Making Democracy Work: Civic Traditions
in Modern Italy. Princeton: Princeton University Press.

35
Rajan, R. G & Zingales, L. (1998). Financial Dependence and Growth, American Economic
Review, 88(3), 559-586.
Rodríguez, F., & Sachs, J. (1999). Why Do Resource-Abundant Economies Grow More
Slowly? Journal of Economic Growth, 4(3), 277-303.
Rodrik, D., Industrial Policy for the Twenty-First Century, Harvard University.
Rodrik, D. (2007). Industrial development: Some stylized facts and policy directions. Industrial
development for the 21st century: Sustainable development perspectives, 7-28.
Rodrik, D. (2013). Unconditional convergence in manufacturing, The Quarterly Journal of
Economics, 128(1), 165–204.
Rodrik, D. (2016). Premature deindustrialization, Journal of Economic Growth, 21(1), 1–33.
Romer, P. (1986). Increasing Returns and Long-Run Growth, Journal of Political Economy, 94,
5: 1002-37.
Sachs, J., Warner, A (1995). Natural resource abundance and economic growth, NBER
Working Paper N. 5398.
Sachs, J. D. & Warner, A. M. (2001). The curse of natural resources, European Economic
Review, 45(4-6), 827-838.
Stiglitz, J.E. (2017) Industrial Policy, Learning, and Development, in Page, J. and Tarp, F.
(Eds.) The Practice of Industrial Policy Government—Business Coordination in Africa and
East Asia, Oxford University Press.
Szirmai, A. (2012). Industrialisation as an engine of growth in developing countries 1950–2005,
Structural Change and Economic Dynamics 23(4), 406–420.
Szirmai, A., & Verspagen, B. (2015). Manufacturing and economic growth in developing
countries, 1950–2005, Structural Change and Economic Dynamics, 34, 46–59.
Thirlwall, A. P. (2002). The nature of economic growth: An alternative framework for
understanding the performance of nations. Cheltenham: Edward Elgar Publishing.
Timmer, M., de Vries, G. J., & de Vries, K. (2015). Patterns of structural change in developing
countries. In J. Weiss, & M. Tribe (Eds.), Routledge handbook of industry and development
(pp. 65–83). New York: Routledge.
Vos, R. (1982), External Dependence, Capital Accumulation, and the Role of the State: South
Korea 1960-77. Development and Change, 13: 91–121.
Wang, D., Cai, F. and Zhang, X. (2004). Saving and growth effects of demographic transition:
the population factor in the sustainability of China's economic growth, Population Research
28(5): 2–11.
Weiss, M. and Clara, M. (2016) Unlocking Domestic Investment for Industrial Development,
Department of Policy, Research and Statistics Working Paper 12/2016, UNIDO: Vienna.

36
Wood, A. (2017). Variation in structural change around the world, 1985–2015 - Patterns,
causes, and implications, WIDER Working Paper N. 2017/34.
Yao, Y. (2011). The Relationship between China’s Export-led Growth and Its Double
Transition of Demographic Change and Industrialization, Asian Economic Papers, 10 (2):
52–76.
Yoshino, N., Kaji, S. and Asonuma, T. (2015). Adjustments of Capital Account Restrictions
and Exchange Rate Regimes in East Asia, Journal of International Commerce, Economics
and Policy, 6(3), 1-32.
Xu, L.C. (2010). The Effects of Business Environments on Development: Surveying New Firm-
level Evidence, The World Bank Research Observer, 26 (2): 310-40

37
Appendix
Table A1. Results – Determinants of industrialization periods, controlling for the rare event bias
(1) (2) (3)
VARIABLES Whole period Pre_1990 Post_1990
lgdp_pc -0.808*** -0.234 -2.948***
[0.119] [0.163] [0.366]
gfcf_gdp 2.058*** -0.141 10.802***
[0.504] [0.855] [1.438]
credit 0.020*** 0.018** 0.043***
[0.003] [0.007] [0.007]
reer 0.000 0.000 -0.007
[0.000] [0.000] [0.008]
kaopen -0.122* 0.371*** -1.764***
[0.073] [0.083] [0.337]
bl_asy15mf_int 0.152*** 0.182** 0.190**
[0.049] [0.079] [0.080]
bmr_demdur 0.003** -0.006* 0.015***
[0.002] [0.003] [0.004]
wdi_mineralrent -0.083* -0.507** -0.019
[0.044] [0.197] [0.036]
landlocked -1.089*** -3.400** -1.417***
[0.262] [1.436] [0.360]
Constant 1.973** -1.150 10.336***
[0.918] [1.194] [2.198]
Observations 2,736 1,258 1,486
Robust standard errors in brackets *** p<0.01, ** p<0.05, * p<0.1

38
Table A2. Results – Determinants of industrialization periods: successful industrializers with the
sub-group of other industrializers
(1) (2) (3)
VARIABLES
Whole
period_1_2 pre_1_2 post_1_2
lgdp_pc -0.219*** 0.583*** -14.285***
[0.070] [0.123] [3.331]
gfcf_gdp -0.473* -1.443*** 0.613
[0.266] [0.365] [2.461]
credit 0.013*** 0.014** 0.204***
[0.003] [0.006] [0.044]
reer -0.009*** -0.012*** -0.039***
[0.001] [0.003] [0.011]
kaopen -0.047 0.760*** -1.020***
[0.053] [0.106] [0.283]
bl_asy15mf_int 0.010 0.153*** 1.997***
[0.031] [0.051] [0.532]
bmr_demdur -0.000 0.001 0.085***
[0.001] [0.003] [0.023]
wdi_mineralrent 0.119*** -0.843*** 0.496***
[0.043] [0.264] [0.098]
landlocked -0.589***
0.485
[0.147]
[0.534]
Constant 1.622*** -3.301*** 72.896***
[0.583] [1.070] [16.515]
Observations 828 365 319
Robust standard errors in brackets *** p<0.01, ** p<0.05, * p<0.1

39
Table A3. Results – Determinants of industrialization periods (MVA/GDP)
(1) (2) (3)
VARIABLES
Whole
period Pre_1990 Post_1990
LGDP_PC -0.437*** -0.177** -8.323***
[0.072] [0.088] [1.453]
GFCF_GDP -0.213 -0.343 14.199***
[0.265] [0.312] [4.311]
CREDIT 0.011*** 0.009** 0.097***
[0.002] [0.004] [0.018]
REER -0.005*** -0.005*** 0.010*
[0.001] [0.001] [0.006]
KAOPEN 0.080** 0.236*** -1.397***
[0.038] [0.045] [0.357]
HC 0.070** 0.081* 0.766***
[0.029] [0.046] [0.143]
POL -0.005*** -0.002 -0.067***
[0.002] [0.002] [0.015]
NAT_RES -0.424*** -0.325*** -0.300
[0.068] [0.061] [0.494]
Constant 2.426*** 0.472 37.307***
[0.570] [0.627] [6.671]
Observations 2,115 996 1,119
Robust standard errors in brackets *** p<0.01, ** p<0.05, * p<0.1

Vienna International Centre · P.O. Box 300 9 · 1400 Vienna · AustriaTel.: (+43-1) 26026-o · E-mail: [email protected]