unicredit, kepler cheuvreux 15th german … kepler cheuvreux 15th german corporate conference...
TRANSCRIPT

UniCredit, Kepler Cheuvreux 15th German Corporate Conference Frankfurt, Germany Dr. Michael Majerus, CFO
Investor Relations | January 2016
Page 2 Investor Relations | January 2016
Table of Contents.
Introduction to SGL Group’s Businesses Page 3
- Reporting Segment Performance Products Page 5
- Reporting Segment Graphite Specialties Page 9
- Reporting Segment Carbon Fibers & Materials Page 12
Strategic Realignment and operating Improvement Initiatives Page 17
Back up
Latest Financials 9M 2015 Page 28
Outlook Page 38
Appendix Page 44

Page 3 Investor Relations | January 2016
Introduction to SGL Group’s Businesses
Page 4 Investor Relations | January 2016
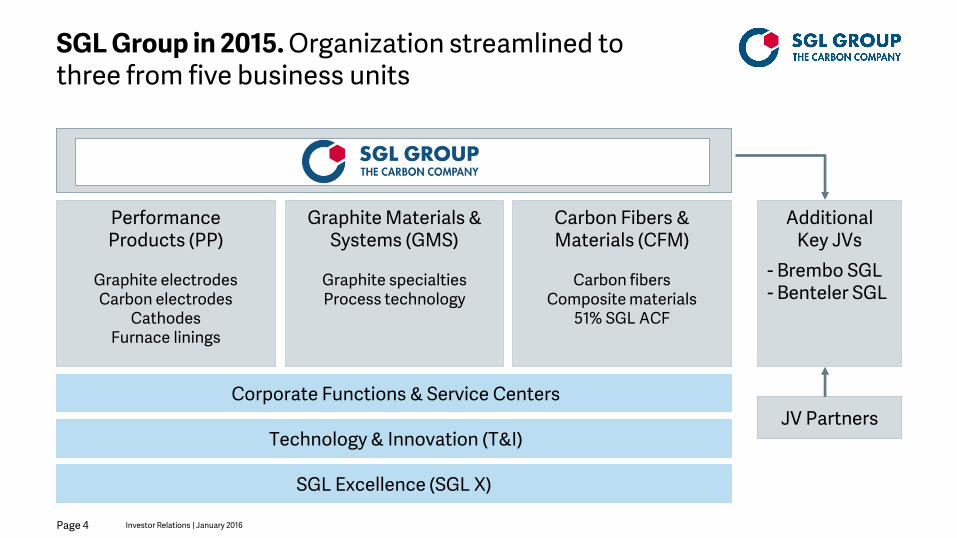
SGL Group in 2015. Organization streamlined to three from five business units
Performance Products (PP)
Graphite electrodes Carbon electrodes
Cathodes Furnace linings
Technology & Innovation (T&I)
SGL Excellence (SGL X)
Corporate Functions & Service Centers JV Partners
Additional Key JVs
- Brembo SGL - Benteler SGL
Graphite Materials & Systems (GMS)
Graphite specialties Process technology
Carbon Fibers & Materials (CFM)
Carbon fibers
Composite materials 51% SGL ACF

Page 5 Investor Relations | January 2016
Reporting Segment Performance Products

Page 6 Investor Relations | January 2016
Graphite Electrodes (GE) Cathodes Carbon Electrodes Furnace Linings
Key industries served Characteristics
Reporting Segment: Performance Products (PP).
Product groups 2014 Group sales
Steel Aluminum Ferrous and non-ferrous
metals
Supplying the metal industries Leading competitive position Historically solid ROS & ROCE Historically strong cash flow
€1.3bn PP
44%
PP sales - 2014
Graphite & Carbon
Electrodes 79%
Cathodes & Furnace Linings 21%
Strategic priorities Align infrastructure with market
development (swing capacities) Reduce unit costs by increasing
production and shipments at Malaysian plant
Increase customer value with product quality and consistency

Page 7 Investor Relations | January 2016
Graphite Electrodes. Steel production in EAFs
Growth in steel production 2000ff fuelled by infrastructure demand from emerging countries
Recently, Chinese steel exports limits EAF growth in most regions, iron ore price decline lowered production cost of blast furnace steel
Significantly higher steel consumption 2000ff will lead to higher scrap availability and lower price, favoring again EAF steel production
GE critical to EAF furnace efficiency but only ~3% of steel-making conversion cost
Worldwide steel production [in million t p.a.]
0
200
400
600
800
1000
1200
1400
1995 2000 2005 2010 2015
Source: WSD, IISI, own estimate
---- BOF produces primary (integrated) steel based on iron ore ore
---- EAF steel production based on scrap
2
24 32
41 47 78
110
24
42 48 55
62
93
125
20
40
60
80
100
120
140
2009 2010 2011 2012 2013 2014 2015 FC Net Export
Chinese steel exports [in million t p.a.]
---- Export

Page 8 Investor Relations | January 2016
10
20
30
40
50
60
70
80
2003 2005 2007 2009 2011 2013 e 2015 e 2017 e 2019 e
Cathodes. Participates in aluminum industry growth
Source: IAI, Habor, SGL Group’s own estimates, Hydro; Alcoa, CRU
Aluminum demand driven by: Population growth and urbanization Further industrialization of emerging
countries Weight/strength/cost advantages
Cathodes essential to aluminum smelters Existing smelters relining New smelter construction leading first to
project demand and long-term to higher relining demand
Comprehensive product portfolio to cope with all technology trends in the AL industry
Solid fundamentals for aluminum production growth Various new projects under construction, additional
feasibility studies for capacity increases underway
39 mio. t
36 mio. t
50 mio. t
Global aluminum production 2003 – 2020 67 mio. t
Prim
ary
Alu
min
um P
rodu
ctio
n [in
mio
. t p
.a.]

Page 9 Investor Relations | January 2016
Reporting Segment Graphite Specialties
Page 10 Investor Relations | January 2016
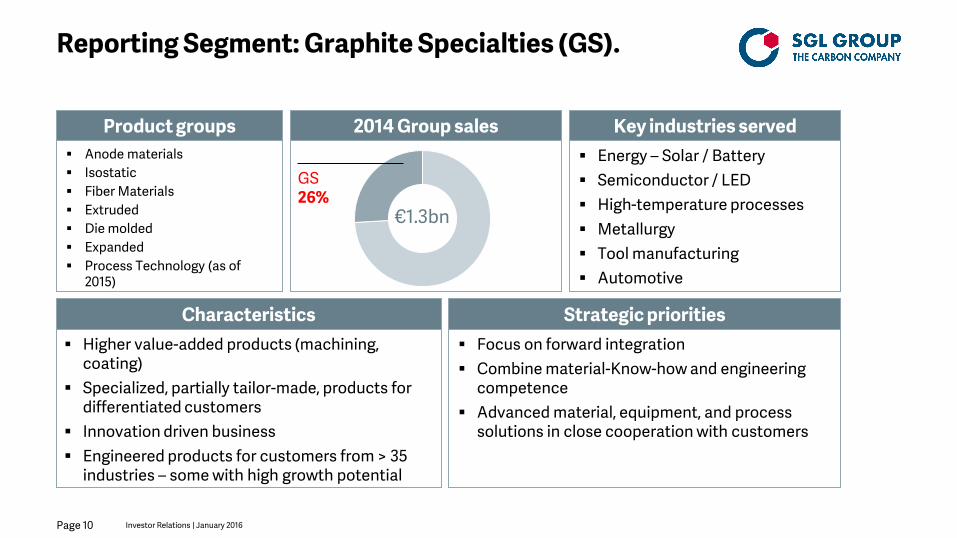
Reporting Segment: Graphite Specialties (GS).
Product groups
Anode materials Isostatic Fiber Materials Extruded Die molded Expanded Process Technology (as of
2015)
2014 Group sales Key industries served Energy – Solar / Battery Semiconductor / LED High-temperature processes Metallurgy Tool manufacturing Automotive
Higher value-added products (machining, coating)
Specialized, partially tailor-made, products for differentiated customers
Innovation driven business Engineered products for customers from > 35
industries – some with high growth potential
Characteristics
GS 26%
Focus on forward integration Combine material-Know-how and engineering
competence Advanced material, equipment, and process
solutions in close cooperation with customers
Strategic priorities
€1.3bn

Page 11 Investor Relations | January 2016
Graphite Specialties. Enabling innovation
Target approx. 1/3 of sales based on new products introduced over the last 4 years
established ... in the PV,
Semiconductor, and LED Industry
... in the Battery and Energy Storage Industry
... in the Chemical and Automotive Industry
Meander heater for CZ units
C/C carrier frame for solar wafers
SiC coated wafer carrier for LED chip
production
Anode material for lithium-ion batteries
Redox flow battery
electrode consisting of battery
felt and bipolar
plate
Reinforced graphite
sealing sheet
Flexible graphite foil
Rotor and vanes for break assistant pumps
Full integration to ensure consistent quality Most comprehensive portfolio in the industry Partnering with customers from >35 industries
new
Best solutions for our customers…

Page 12 Investor Relations | January 2016
Reporting Segment Carbon Fibers & Materials

Page 13 Investor Relations | January 2016
Product groups*
Reporting Segment: Carbon Fibers & Materials (CFM).
* Former Business Unit Aerostructures reclassified to discontinued operations as of June 30, 2014
Carbon Fibers Composite Materials 51% SGL ACF (JVs with
BMW)
2014 Group sales
Key industries served Automotive Energy Industrial Recreation Medical Technology Pressure Vessels
New applications in automotive, energy, industrial
High earnings improvement potential
Complete value chain in house The only EU based carbon fiber
company
Characteristics
CFM 22%
CFM sales – 2014
Carbon Fibers /
Composite Materials
80%
SGL ACF 20%
Develop innovative customer solutions along the value chain
Optimize carbon fiber and composite capabilities along the value chain
Convert Fisipe acrylic fiber lines into PAN precursor production
Strategic priorities
€1.3bn

Page 14 Investor Relations | January 2016
Refocused on materials & automotive / other industrial components*
SGL Group only integrated European carbon fiber producer.
* Former Business Unit Rotor Blades sold as of December 31, 2013 and former Business Unit Aerostructures reclassified to discontinued operations as of June 30, 2014
Carbon Fibers & Composite Materials Composite Components
PAN Precursor
Carbon Fiber
Composite Materials
Benteler SGL (50%) Brembo SGL Carbon Ceramic Brakes (50%)
Raw Material
Fisipe MSP: JV with
Mitsubishi Rayon (33%)
Prod. Capacity ~ 4kt in UK ~ 2kt in USA
SGL ACF: JV with BMW (51%) - up to 9kt in USA
SGL epo SGL Kümpers
(51%) SGL ACF: JV with
BMW (51%)
Carbon Fiber
Prepreg Preform
Automotive & other industrial

Page 15 Investor Relations | January 2016
Example EU. CO2 reduction targets can only be achieved with lightweight construction
OEM fleet target development (EU) in g CO2/kg
Only achievable with lightweight
135
95
75
2014 2020 2025 0
106
77
0
135
29
29
~80
2014 ICE efficiency package 3
Moderate lightweight
Reachable w/out electrification
-30%
-21%
Targets

Page 16 Investor Relations | January 2016
Market launch of BMW i3 in November 2013, the first serially produced car with a CFRP passenger cell; market launch of BMW i8 in May 2014
Global value chain: carbon fibers produced in Moses Lake (USA) and converted into composite materials (fabrics) in Wackersdorf
(Germany). fabrics are sold to BMW who manufactures carbon based
automotive parts for the BMW i3 and i8. New BMW 7 series (2015): first large scale application of innovative
carbon fiber materials in premium car segment
SGL ACF. Milestone in serial application of carbon fibers in automotive industry
Source: BMW Group
October 2009: €90 million combined investment volume for initial capacity of 3kt carbon fiber and corresponding fabric capacity; May 2014: further combined investment of approx. €145 million to expand carbon fiber capacities up to 9kt
BMW guarantees certain minimum purchasing volumes at contractually agreed conditions and provides debt financing

Page 17 Investor Relations | January 2016
Strategic realignment initiatives and operational improvement

Page 18 Investor Relations | January 2016
Stop loss makers and cash drainers by restructuring or disposing
Capex for selective growth opportunities subject to minimum hurdle rates
Return on capital is key management principle for strategic realignment and future investment
September 2014. Transformation of SGL Group guided by clearly defined targets
* Excluding disposal proceeds ** ROCE defined as EBITDA/Capital employed
Capital increase and refinancing of convertible bond created flexibility for restructuring and repositioning
Net debt/EBITDA < 2.5
Positive net result
Positive free cash flow* ROCE ≥ 15%** Gearing ~ 0.5
Equity ratio > 30%

Page 19 Investor Relations | January 2016
September 2014. Transformation process defined with cornerstones of strategic realignment
ROCE*
Capital employed
Minimum return on capital
Generate shareholder
return
Improve
performance
2
3
1
Right size
15%
*EBITDA divided by capital employed
1) Right size SGL2015 asset and portfolio restructuring
2) Improve performance SGL2015 organizational restructuring SGL Excellence savings BU streamlining Process Excellence initiatives
3) Generate shareholder return Define selective growth areas

Page 20 Investor Relations | January 2016
SGL2015 cost savings program. Target savings increased twice to €240 million
Organizational Restructuring
Simplify processes and streamline management structures
Review all workstreams and identify redundancies
Adjust organizations and Corporate and Service Functions
Reduce personnel costs and indirect spend
Asset Restructuring
Adjust asset base to changes in market demand
Optimize global production network, relocate production
Improve capacity utilization Reduce fix costs Use synergies between the
Business Units Consolidate sites
Portfolio Restructuring
Carbon fiber business: focus on materials competence
Analyze our business portfolio Concentrate portfolio on core
activities Investigate options for
businesses
Already €191 million savings by Sept. 30, 2015 – remainder to follow by mid 2016

Page 21 Investor Relations | January 2016
Analysis of business model of GMS and CFM. Many similarities
GMS/CFM Meaningful exposure to end markets growing above GDP driven by global mega trends
High share of customer-specific products, tailored applications and solutions
High potential for innovation since products typically serve as key enablers of innovation in target industries and/or provide vital products for their customers’ value chains
In depth knowledge and control of the complete graphite and carbon value chain provides opportunity for product customization
Specific application requirements allow to leverage knowledge and technology as competitive advantage
Continued process and cost optimization as well as R&D investments necessary

Page 22 Investor Relations | January 2016
Analysis of business model of PP(GE). Market requirements increasingly differ from GMS and CFM
PP(GE) Global steel markets in structural oversupply, thus EAF steel development cannot be expected
to drive GE demand in near and mid term
Therefore supply-demand imbalance remains, industry becoming increasingly commoditized with customers focusing predominantly on price
Consequently, GE in particular and PP in general have to be managed in a different way than before and also different to GMS/CFM
Optimization efforts will have to continue to lower costs, improve processes and thus further increase competitiveness
Continued overcapacities and low profitability will trigger the need for industry consolidation, in which we want to participate There is value in GE:
No substitutes for GE in EAF steel production
Reasonable long term perspectives from increasing scrap availability in China will lead to stronger demand for GE
Page 23 Investor Relations | January 2016
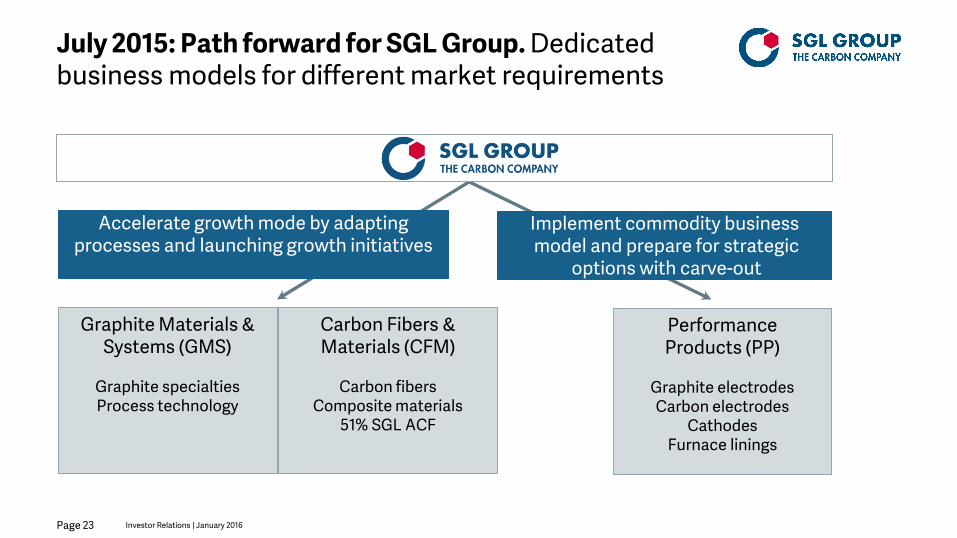
July 2015: Path forward for SGL Group. Dedicated business models for different market requirements
Graphite Materials & Systems (GMS)
Graphite specialties Process technology
Carbon Fibers & Materials (CFM)
Carbon fibers
Composite materials 51% SGL ACF
Accelerate growth mode by adapting processes and launching growth initiatives
Implement commodity business model and prepare for strategic
options with carve-out
Performance Products (PP)
Graphite electrodes Carbon electrodes
Cathodes Furnace linings
Page 24 Investor Relations | January 2016
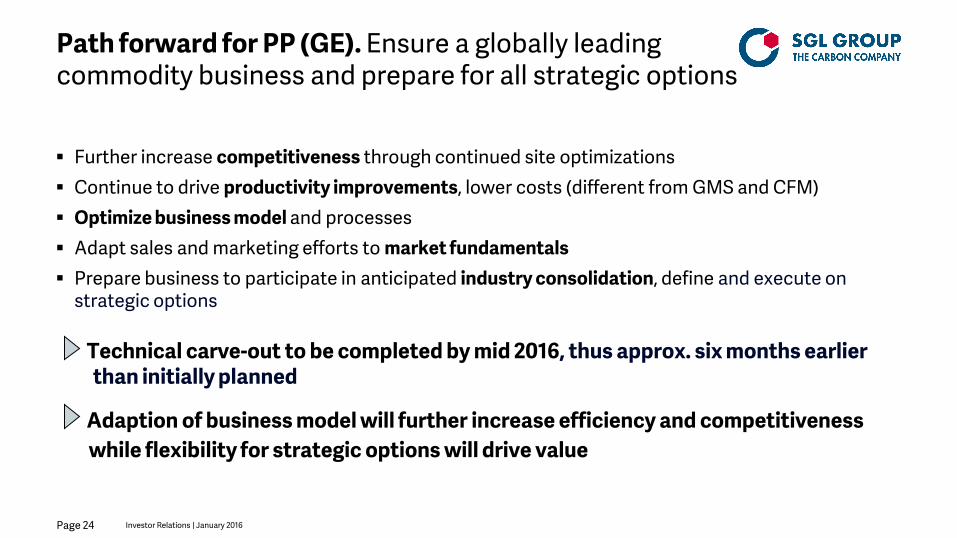
Path forward for PP (GE). Ensure a globally leading commodity business and prepare for all strategic options
Further increase competitiveness through continued site optimizations Continue to drive productivity improvements, lower costs (different from GMS and CFM) Optimize business model and processes Adapt sales and marketing efforts to market fundamentals Prepare business to participate in anticipated industry consolidation, define and execute on
strategic options Technical carve-out to be completed by mid 2016, thus approx. six months earlier
than initially planned
Adaption of business model will further increase efficiency and competitiveness while flexibility for strategic options will drive value
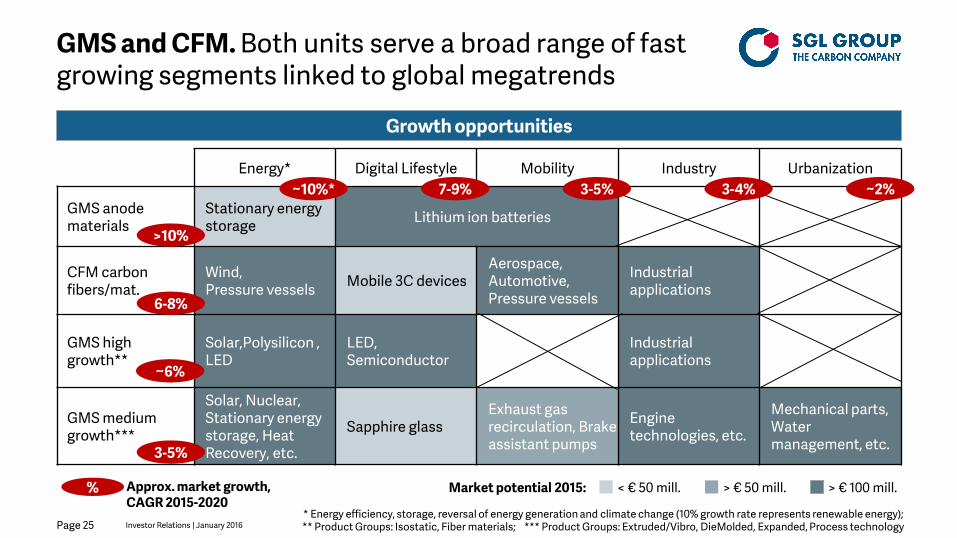
Page 25 Investor Relations | January 2016 * Energy efficiency, storage, reversal of energy generation and climate change (10% growth rate represents renewable energy); ** Product Groups: Isostatic, Fiber materials; *** Product Groups: Extruded/Vibro, DieMolded, Expanded, Process technology
GMS and CFM. Both units serve a broad range of fast growing segments linked to global megatrends
Energy* Digital Lifestyle Mobility Industry Urbanization
GMS anode materials
Stationary energy storage Lithium ion batteries
CFM carbon fibers/mat.
Wind, Pressure vessels Mobile 3C devices
Aerospace, Automotive, Pressure vessels
Industrial applications
GMS high growth**
Solar,Polysilicon , LED
LED, Semiconductor
Industrial applications
GMS medium growth***
Solar, Nuclear, Stationary energy storage, Heat Recovery, etc.
Sapphire glass Exhaust gas recirculation, Brake assistant pumps
Engine technologies, etc.
Mechanical parts, Water management, etc.
Market potential 2015: < € 50 mill. > € 50 mill. > € 100 mill.
~10%* 7-9%
>10%
6-8%
~6%
3-5%
~2%
Growth opportunities
% Approx. market growth, CAGR 2015-2020
3-4% 3-5%

Page 26 Investor Relations | January 2016
GMS and CFM are the basis of an innovation driven, high growth SGL Group.
Summary The majority of the current investors of SGL Group are more excited about the innovation and
growth businesses GMS and CFM GMS and CFM materials and solutions enable several of the fastest growing economic trends
including energy storage, digitalization, mobility and urbanization. Based on strong positions, GMS and CFM target to further improve their position in the value
chain with particular emphasis on innovation, high value-add products, services and engineered solutions.
Until 2020, GMS and CFM together aim to grow sales by 50% through profitable, organic growth – potentially augmented by selective and accretive bolt-on acquisitions.
EBITDA level is expected to increase significantly, thus exceeding the minimum EBITDA ROCE margin of 15%.
Organic growth can be financed by own operating cash flow.
© Copyright SGL CARBON SE Registered trademarks of SGL CARBON SE ®
Thank you for your attention !

Page 28 Investor Relations | January 2016
Backup Latest Financials 9M 2015

Page 29 Investor Relations | January 2016
Performance Products. Substantial EBIT improvement despite lack of recovery in graphite electrodes
* Non-recurring charges of €5.6 million in 9M/2015 and €6.5 million in 9M/2014
in € million 9M/2015 9M/2014
Sales revenue 406.3 428.8
EBITDA before non-recurring charges* 54.0 45.7
EBIT before non-recurring charges* 23.9 16.2
EBIT-Margin before non-recurring charges* (in %) 5.9 3.8
EBIT 18.3 9.7
Sales revenue down 5 %, (currency adjusted -12%) only due to lower volumes and prices in graphite electrodes. Cathodes sales increased YoY
Nevertheless, recurring EBIT increased by nearly 50% due to savings related to SGL2015 and raw materials
Mainly SGL2015 related restructuring charges amounting to €5.6 million in reporting period SGL2015 savings €17.1 million, thereof €6.3 million from SGL Excellence

Page 30 Investor Relations | January 2016
Graphite Materials & Systems. Stable sales, declining earnings resulting mainly from big ticket order in 2014
in € million 9M/2015 9M/2014
Sales revenue 340.1 338.0
EBITDA before non-recurring charges* 43.8 52.7
EBIT before non-recurring charges* 27.2 37.2
EBIT-Margin before non-recurring charges* (in %) 8.0 11.0
EBIT 26.3 36.5
* Non-recurring charges of €0.9 million in 9M/2015 and €0.7 million in 9M/2014
Sales revenue up 1% (currency adjusted down 6%) FX-adjusted sales decline mainly driven by big ticket order in 2014 Process Technology showed recovery in Q3 after weaker H1/2015 sales performance based on subdued order
intake in 2014 Continued strong demand for anode materials for Li-ion batteries
Recurring EBIT declined by approx. €10 million due to Lower capacity utilization resulting mainly from non-recurrence of last year’s big ticket order Partially compensated by one-off gains from a land sale and an insurance claim
SGL2015 savings €9.4 million, thereof €5.9 million from SGL Excellence
Page 31 Investor Relations | January 2016
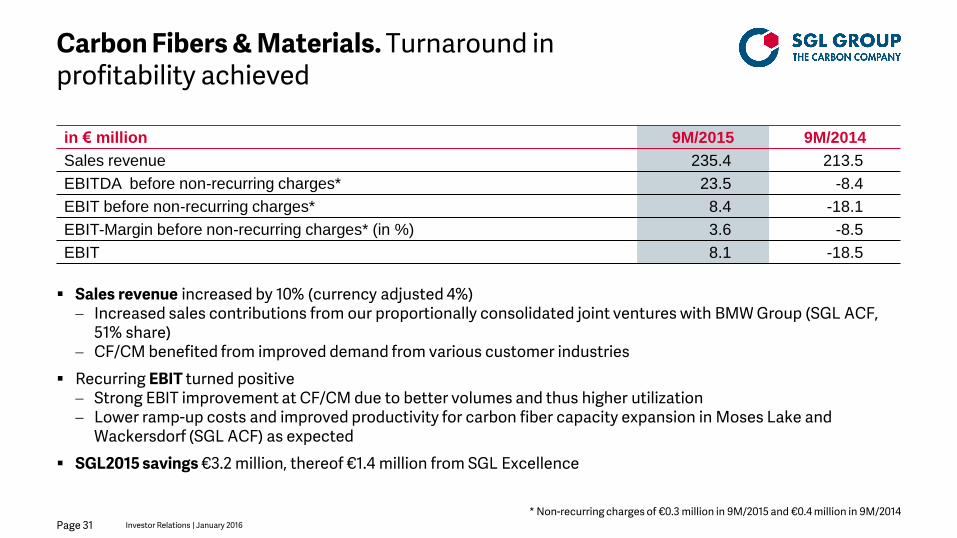
Carbon Fibers & Materials. Turnaround in profitability achieved
in € million 9M/2015 9M/2014
Sales revenue 235.4 213.5
EBITDA before non-recurring charges* 23.5 -8.4
EBIT before non-recurring charges* 8.4 -18.1
EBIT-Margin before non-recurring charges* (in %) 3.6 -8.5
EBIT 8.1 -18.5
* Non-recurring charges of €0.3 million in 9M/2015 and €0.4 million in 9M/2014
Sales revenue increased by 10% (currency adjusted 4%) Increased sales contributions from our proportionally consolidated joint ventures with BMW Group (SGL ACF,
51% share) CF/CM benefited from improved demand from various customer industries
Recurring EBIT turned positive Strong EBIT improvement at CF/CM due to better volumes and thus higher utilization Lower ramp-up costs and improved productivity for carbon fiber capacity expansion in Moses Lake and
Wackersdorf (SGL ACF) as expected
SGL2015 savings €3.2 million, thereof €1.4 million from SGL Excellence

Page 32 Investor Relations | January 2016
T&I and Corporate. SGL2015 savings partially offset by various effects
*Non-recurring charges of €1.1 million in 9M/2015 and €16.8 million in 9M/2014
in € million 9M/2015 9M/2014
Sales revenue 6.5 7.2
EBITDA before non-recurring charges* -25.4 -26.9
EBIT before non-recurring charges* -30.5 -32.3
EBIT -31.6 -49.1
Recurring EBIT slightly improved - savings from SGL2015 partially offset by higher consulting fees relating to Business Process Excellence initiative currency effects from the translation of USD based administrative expenses
SGL2015 savings €4.3 million

Page 33 Investor Relations | January 2016
Group. Improved EBIT reflects both operational improvements and lower non-recurring charges
in € million 9M/2015 9M/2014
Sales revenue 988.3 987.5
EBITDA before non-recurring charges 95.9 63.1
EBIT before non-recurring charges 29.0 3.0
Non-recurring charges -7.9 -24.4
EBIT 21.1 -21.4
Includes savings of €34 million from SGL2015 in 9M/2015, of which approx. €14 million attributable to SGL Excellence
Page 34 Investor Relations | January 2016
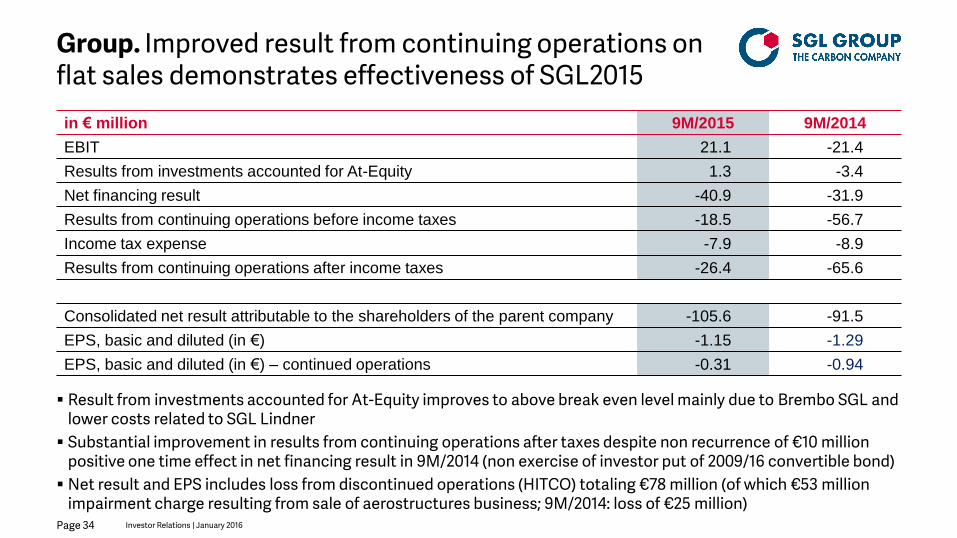
Group. Improved result from continuing operations on flat sales demonstrates effectiveness of SGL2015 in € million 9M/2015 9M/2014
EBIT 21.1 -21.4
Results from investments accounted for At-Equity 1.3 -3.4
Net financing result -40.9 -31.9
Results from continuing operations before income taxes -18.5 -56.7
Income tax expense -7.9 -8.9
Results from continuing operations after income taxes -26.4 -65.6
Consolidated net result attributable to the shareholders of the parent company -105.6 -91.5
EPS, basic and diluted (in €) -1.15 -1.29
EPS, basic and diluted (in €) – continued operations -0.31 -0.94
Result from investments accounted for At-Equity improves to above break even level mainly due to Brembo SGL and lower costs related to SGL Lindner
Substantial improvement in results from continuing operations after taxes despite non recurrence of €10 million positive one time effect in net financing result in 9M/2014 (non exercise of investor put of 2009/16 convertible bond)
Net result and EPS includes loss from discontinued operations (HITCO) totaling €78 million (of which €53 million impairment charge resulting from sale of aerostructures business; 9M/2014: loss of €25 million)

Page 35 Investor Relations | January 2016
Balance sheet. Solid despite slight deterioration
in € million 30.09.2015 31.12.2014
Total assets 2,036.1 2,170.3
Equity ratio (in %) 22.6 26.2
Total liquidity 296.2 347.5
Net financial debt 519.7 389.9
Gearing (net debt/equity) 1.13 0.69
Total assets declined by 6%
Equity ratio declined due to net loss of €106 million in the reporting period (including a loss of €78 million from discontinued operations) negative currency translation effects of €41 million due to the devaluation of the Malaysian Ringgit in Q3/2015 partially compensated by
• €19 million IFRS equity component of the new convertible bond • €16 million (after tax) gain on equity resulting from effect of increased discount factors for calculation of
pension provisions in Germany (from 2% to 2.25%) and in the US (from 4% to 4.5%)

Page 36 Investor Relations | January 2016
Free cash flow. Small positive free cash flow from continuing operations in Q3/2015 as anticipated
Continuing operations in € million 9M/2015 9M/2014
Cash flow from operating activities -47.0 -1.5
Capital expenditures in property, plant and equipment and intangible assets -48.5 -93.7
- thereof SGL ACF -10.2 -54.2
- thereof SGL Group excluding SGL ACF -38.3 -39.5
Cash flow provided by other investing activities* 8.9 -4.3
Free cash flow -86.6 -99.5
*Payments for capital contributions in investments accounted for At-Equity, proceeds from
dividend payments and sale of intangible assets and property, plant and equipment
Operating cash flow in 9M/2015 declined due to
working capital buildup (mainly relating to lower trade payables due to reduced raw material costs as well as the declining investment spend and higher inventories)
non-recurring cash out for USD hedges in Q1/2015 (relating to HITCO)
Free cash flow from continued operations improved slightly in 9M/2015 – achieved positive free cash flow from continuing operations in Q3/2015 as projected

Page 37 Investor Relations | January 2016
SGL Group successfully extended maturity profile in December 2013
€250 million Corporate Bond at 4.875% (due 2021)
€200 million credit facility, undrawn (due 2017)
Supported by previously issued Convertible Bond (April 2012)
€240 million Convertible Bond at 2.75%, adjusted conversion price of €40.9598 (due 2018)
Adequate equity and liquidity
as of September 30, 2015
Equity ratio: 23%
Gearing 1.13
Total liquidity: €296.2 million
Solidly financed. Maturity profile extended in September 2015
Maturity profile extended with new convertible bond issue in September
2015 for early repayment of Convertible Bond due June 2016
New €167 million Convertible Bond at 3.5%, conversion price of €18.6451 (due 2020) issued for early repayment of
€134.7 million (as of June 30, 2015) Convertible Bond at 3.5%, adjusted conversion price of €27.2959 (tender offer completed in September 2015)
Early redemption of remaining Convertible Bond due 2016 in October 2015

Page 38 Investor Relations | January 2016
Outlook
Page 39 Investor Relations | January 2016
Business unit outlook 2015.
Performance Products: PP sales expected slightly below prior year level only due to lower graphite electrode volumes and prices. Partially compensated by higher cathode sales. Deteriorating GE business conditions in Q4 (GE order postponements/cancellations) will lead to an FY15 EBIT slightly below last year, despite strong SGL2015 savings, raw material cost reductions and earnings improvement in 9M/2015.
Graphite Materials & Systems: GMS to report nearly stable sales, and mid to high single digit million € lower EBIT as a result of non-recurrence of big ticket order and weaker order intake in H1/2015.
Carbon Fibers & Materials: CFM to post slightly higher sales and significant improvement in EBIT. Better volumes in both CF/CM and SGL ACF, partially offset by crude oil based pricing of Fisipe acrylic fibers. EBIT improvement based on overall improved demand and lower ramp up costs at SGL ACF
Corporate: Slightly lower costs as a result of SGL2015 savings and gains from disposal of non-operating assets

Page 40 Investor Relations | January 2016
Group outlook 2015.
Full year Group sales expected stable - lower sales in PP compensated by better turnover in CFM Group recurring EBITDA and EBIT: substantial percentage increase despite expected weakness in
GE in Q4/2015 due to in line or better performance in other businesses. ROCE to improve in line Restructuring :
SGL2015: mid double digit million € savings. Mid double digit million € restructuring cash- out Total restructuring expenses will from H2/2015 onward include one-time expenses associated with
“transformation of business models” as announced on July 7, 2015 and amount to a low double digit million € amount in FY 2015 (including SGL2015 related restructuring costs)
Renewed deterioration of GE market conditions requires review of additional measures and leads to possible additional restructuring charges in mid to high double digit million € magnitude
Net result: If possible additional restructuring charges reach a high double digit million € magnitude, net result (cont. operations) would remain approx. on prior year loss level
Capex for the first time in many years to decrease below D&A level of approx. €90 million Free cash flow (cont. operations): improvement impeded due to various one-off effects – however
operational free cash flow (before tax settlement of €35 million) slightly positive again in Q4/2015
Page 41 Investor Relations | January 2016
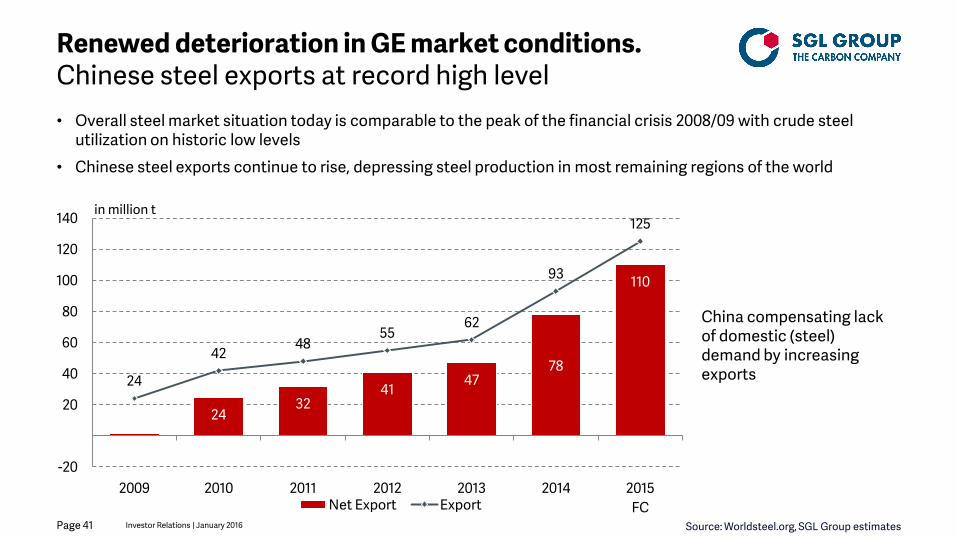
Renewed deterioration in GE market conditions. Chinese steel exports at record high level
Source: Worldsteel.org, SGL Group estimates
• Overall steel market situation today is comparable to the peak of the financial crisis 2008/09 with crude steel utilization on historic low levels
• Chinese steel exports continue to rise, depressing steel production in most remaining regions of the world
2
24 32
41 47
78
110
24
42 48
55 62
93
125
-20
20
40
60
80
100
120
140
2009 2010 2011 2012 2013 2014 2015 FC Net Export Export
China compensating lack of domestic (steel) demand by increasing exports
in million t
Page 42 Investor Relations | January 2016
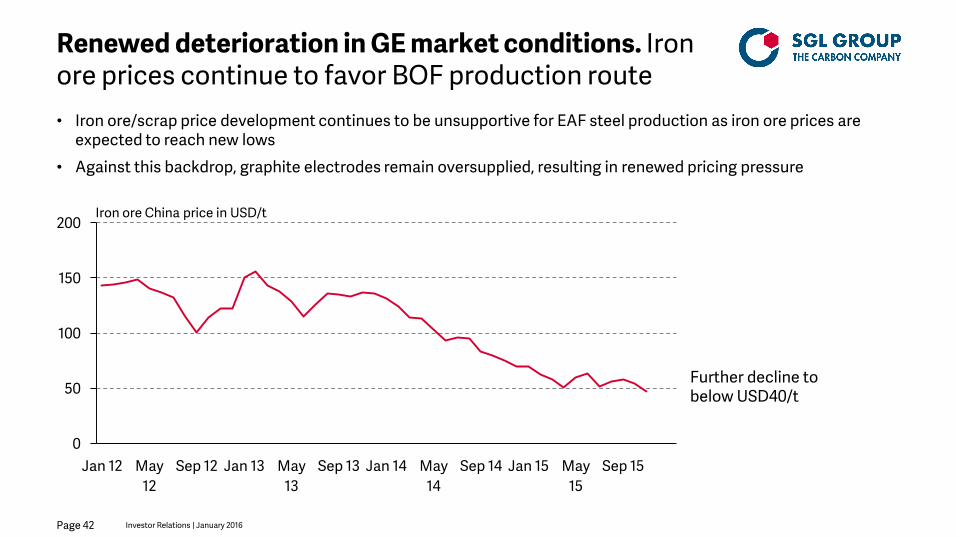
Renewed deterioration in GE market conditions. Iron ore prices continue to favor BOF production route • Iron ore/scrap price development continues to be unsupportive for EAF steel production as iron ore prices are
expected to reach new lows
• Against this backdrop, graphite electrodes remain oversupplied, resulting in renewed pricing pressure
0
50
100
150
200
Jan 12 May 12
Sep 12 Jan 13 May 13
Sep 13 Jan 14 May 14
Sep 14 Jan 15 May 15
Sep 15
Further decline to below USD40/t
Iron ore China price in USD/t

Page 43 Investor Relations | January 2016
Initial outlook on 2016 significantly impacted by renewed deterioration in GE market conditions. • From today’s point of view, Business Units GMS and CFM as well as cathodes business within
Business Unit PP to develop in line with SGL Group’s expectations • However, anticipated renewed price erosion in graphite electrodes to prevent further EBIT
improvement in the Business Unit PP. In fact, graphite electrode business anticipated to be EBIT negative in 2016, resulting in significant deterioration of the EBIT of the Business Unit PP
• Planning process for 2016 still in early stages and countermeasures yet to be finalized, implemented and their impact evaluated, thus impact of operational and structural developments on Group EBIT 2016 not yet fully clear
• From today’s point of view, a significant decline in EBIT (before non-recurring effects) is anticipated

Page 44 Investor Relations | January 2016
Appendix

Page 45 Investor Relations | January 2016
Capital Expenditure by Business Area.
* Reported capex of €129.5 million for 2010 includes €7.4 million cash inflow for services rendered by SGL Group. Therefore cash outflow for capex was €136.9 million
14 12 20 14 14 8 4
90
39 30 29 21 20
90
25
23 21 35 50 33
11
111
80 66 61 46
34
27
54 61 66 71 84 83 81
Central projects / Corporate Carbon Fibers & Materials
Graphite Materials & Systems Performance Products
2014
€133m
2008 2012 2011 2010 2009 2013
€240m
€154m €137m* €139m €132m
PP
Additional improvements in production processes at Malaysian plant
Replacement and EHSA in USA and Spain
Major investment focus in 2014
GS
Measures to achieve efficiency improvements in the production process, also in the context of SGL2015
Transfer of some productions steps from Germany to Poland
New green production in Poland
CFM
Tripling of carbon fiber capacities at SGL ACF
New polymerization facility and conversion of spinning line to PAN precursor production in Portugal
Automation at SGL Kümpers (Germany)
Capex (left hand column)
Depreciation (right hand column)
Capital expenditure and depreciation [in € million]
€95m

Page 46 Investor Relations | January 2016
Shares in issue and shareholder structure.
Furthermore, and based on the respective voting rights announcements we received, Voith GmbH, Heidenheim, currently holds more than 5% of the voting rights of SGL Carbon SE.
Basic shares
Security Identification Number 723530
ISIN Number DE0007235301
Cusip Number 784 188 203
Number of Shares (as at December 31, 2015) 91,806,502
Free float ~ 37%
Reported shareholdings according to §§ 21 f. WpHG
SKion GmbH (Oct 15, 2014) 27.46%
BMW AG (Oct 15, 2014) 18.44%
Volkswagen AG (Jul 31, 2015) 9.88%

Page 47 Investor Relations | January 2016
Debt market instruments.
Corporate bond
Coupon 4.875%
Principal Amount € 250 million
Issue Date 12 December 2013
Date of Maturity 15 January 2021
Convertible notes 2012/2018
Coupon 2.75%
Principal Amount € 240 million
Adjusted Conversion Price € 40.9598
Conversion Right (as at December 31, 2015) 5.86 million shares
Issue Date 25 April 2012
Date of Maturity 25 January 2018
Convertible notes 2015/2020
Coupon 3.5%
Principal Amount € 167 million
Conversion Price € 18.6451
Conversion Right (as at December 31, 2015) 8.96 million shares
Issue Date 14 September 2015
Date of Maturity 30 September 2020

Page 48 Investor Relations | January 2016
Financial calendar / contact details.
Financial calendar 2016
March 23, 2016 Annual Report 2015
May 12, 2016 Report on the first quarter 2016
May 18, 2016 Annual General Meeting
August 11, 2016 Report on the first half year 2016
November 10, 2016 Report on the first nine months 2016
Contact
SGL CARBON SE Soehnleinstrasse 8 65201 Wiesbaden Germany Phone +49 (0) 611 - 6029 - 103 Fax +49 (0) 611 - 6029 - 101 [email protected] www.sglgroup.com
Page 49 Investor Relations | January 2016
Important note.
This presentation contains forward looking statements based on the information currently available to us and on our current projections and assumptions. By nature, forward looking statements are associated with known and unknown risks and uncertainties, as a consequence of which actual developments and results can deviate significantly from the assessment published in this presentation. Forward looking statements are not to be understood as guarantees. Rather, future developments and results depend on a number of factors; they entail various risks and unanticipated circumstances and are based on assumptions which may prove to be inaccurate. These risks and uncertainties include, for example, unforeseeable changes in political, economic, legal and business conditions, particularly relating to our main customer industries, such as electric steel production, to the competitive environment, to interest rate and exchange rate fluctuations, to technological developments, and to other risks and unanticipated circumstances. Other risks that may arise in our opinion include price developments, unexpected developments associated with acquisitions and subsidiaries, and unforeseen risks associated with ongoing cost savings programs. SGL Group assumes no responsibility in this regard and does not intend to adjust or otherwise update these forward looking statements.